Embed Size (px)
Citation preview
Gene Expression
Dhaka: Variational Autoencoder for UnmaskingTumor Heterogeneity from Single Cell GenomicDataSabrina Rashid,1 Sohrab Shah2,3, Ziv Bar-Joseph5, Ravi Pandya6∗
1 Computational Biology Dept., Carnegie Mellon University, Pittsburgh, USA2 Dept. of Computer Science and Dept. of Pathology and Laboratory Medicine, University of British Columbia, Vancouver, Canada3 Dept. of Molecular Oncology, BC Cancer Agency, Vancouver, Canada5 Machine Learning Dept. and Computational Biology Dept., Carnegie Mellon University, Pittsburgh, USA6 Microsoft Research, Redmond, USA
∗To whom correspondence should be addressed.
Associate Editor: XXXXXXX
Received on XXXXX; revised on XXXXX; accepted on XXXXX
Abstract
Motivation: Intra-tumor heterogeneity is one of the key confounding factors in deciphering tumor evolu-tion. Malignant cells exhibit variations in their gene expression, copy numbers, and mutation even whenoriginating from a single progenitor cell. Single cell sequencing of tumor cells has recently emerged as aviable option for unmasking the underlying tumor heterogeneity. However, extracting features from singlecell genomic data in order to infer their evolutionary trajectory remains computationally challenging due tothe extremely noisy and sparse nature of the data.Results: Here we describe ‘Dhaka’, a variational autoencoder method which transforms single cell geno-mic data to a reduced dimension feature space that is more efficient in differentiating between (hidden)tumor subpopulations. Our method is general and can be applied to several different types of genomic dataincluding copy number variation from scDNA-Seq and gene expression from scRNA-Seq experiments. Wetested the method on synthetic and 6 single cell cancer datasets where the number of cells ranges from250 to 6000 for each sample. Analysis of the resulting feature space revealed subpopulations of cells andtheir marker genes. The features are also able to infer the lineage and/or differentiation trajectory betweencells greatly improving upon prior methods suggested for feature extraction and dimensionality reductionof such data.Availability and Implementation: All the datasets used in the paper are publicly available and developedsoftware package and supporting info is available on Github https://github.com/MicrosoftGenomics/Dhaka.
IntroductionTumor cells are often very heterogeneous. Typical cancer progression con-sists of a prolonged clinically latent period during which several newmutations arise leading to changes in gene expression and DNA copynumber for several genes de Bruin et al. [2014], Andor et al. [2016], Minet al. [2015]. As a result of such genomic variability, we often see multiplesubpopulations of cells within a single tumor.
The goal of effective cancer treatment is to treat all malignant cellswithout harming the originating host tissue. Clinical approaches should
thus take into account the underlying evolutionary structure in order toidentify treatments that can specifically target malignant cells while notaffecting their normal cell of origin. It is also important to determine ifthe ancestral tumor clones eventually disappear (chain like evolution) orif several genotypically different clones of cells evolved in parallel (bra-nched evolution) de Bruin et al. [2014]. Tumors resulting from these twoevolutionary trajectories respond differently and ignoring the evolutionaryprocess when determining treatment can lead to therapy resistance andpossible cancer recurrence. Thus, characterization of the hidden subpopu-lations and their underlying evolutionary structure is an important issue forboth the biological understanding and clinical treatment of cancer. Prior
1© The Author(s) (2019). Published by Oxford University Press. All rights reserved. For Permissions, please email: [email protected]
Dow
nloaded from https://academ
ic.oup.com/bioinform
atics/advance-article-abstract/doi/10.1093/bioinformatics/btz095/5320558 by M
emorial Sloan Kettering Library user on 26 February 2019
2 Rashid et al.
studies have mainly relied on bulk sequencing to investigate tumor evolu-tion Navin and Hicks [2010], Russnes et al. [2011]. In such experimentsthousands of cells are sequenced together, which averages out the geno-mic characteristics of the individual cells making it hard to infer thesesub-populations. More recently, single cell sequencing has emerged as auseful tool to study such cellular heterogeneity Venteicher et al. [2017],Tirosh et al. [2016b], Zahn et al. [2017], Giustacchini et al. [2017].
While single cell data is clearly much more appropriate for addressingtumor heterogeneity and evolution, it also raises new computational andexperimental challenges. Due to technical challenges (for example, the lowquantity of genetic material and the coverage for each of the cells seque-nced) the resulting data is often very noisy and sparse with many dropoutevents Gawad et al. [2016],Zong et al. [2012]. These issues affect bothscRNA-Seq and scDNA-Seq experiments which are used for copy num-ber and mutation estimation. Given these issues, it remains challengingto identify meaningful features that can accurately characterize the singlecells in terms of their clonal identity and differentiation state. To addressthis, several methods have been proposed to transform the observed geneexpression or copy number profiles in order to generate features that aremore robust for downstream analysis. However, as we show below, manyof the feature transformation techniques that are usually applied to genomicdata fail to identify the sub populations and their trajectories. For exam-ple, while t-SNE Maaten and Hinton [2008] and diffusion maps Roweisand Saul [2000] are very successful in segregating cells between differenttumor samples, they are less successful when trying to characterize theevolutional trajectories of a single tumor. Recently, several unsupervisedfeature transformation techniques were proposed for analysis of single-cell RNA-seq data Pierson and Yau [2015], Wang et al. [2017], Li et al.[2017], DeTomaso and Yosef [2016],van Dijk et al. [2017]. Among thesetools, ZIFA Pierson and Yau [2015] explicitly models the drop out event insingle cell RNA seq data to improve the reduced dimension representationwhereas SIMLR Wang et al. [2017] developed a new similarity learningframework that can be used in conjunction with t-SNE to reduce dimensionof the data. MAGIC van Dijk et al. [2017] is another dimensionality redu-ction method that uses data diffusion to denoise the cell count matrix andfill in missing transcripts. In addition to dimensionality reduction methods,several single cell clustering algorithms have been proposed as well Xuand Su [2015],Fan et al. [2016]. SNN-cliq Xu and Su [2015] constructsa shared k-nearest neighbor graph across all cells and then finds maximalcliques and PAGODA relies on prior set of annotated genes to find tran-scriptomal heterogeneity. All these methods can successfully distinguishbetween different groups of cells in a dataset. However, such methods arenot designed for determining the relationship between the detected clusterswhich is the focus of tumor evolutionary analysis. In addition, most currentsingle cell clustering methods are focused on only one type of genomicdata (for example scRNA-Seq) and do not work well for multiple types ofsuch data.
Another direction that has been investigated for reducing the dimensi-onality of scRNA-Seq data is the use of neural networks (NN) Lin et al.[2017], Gupta et al. [2015]. In Lin et al. Lin et al. [2017], the authors usedprior biological knowledge including protein-protein and protein-DNAinteraction to learn the architecture of a NN and to subsequently projectthe data to a lower dimensional feature space. Unlike these prior approa-ches, which were supervised, we are using neural networks in a completelyunsupervised manner and so do not require labeled data as prior methodshave. Specifically, in our software ‘Dhaka’ we have used a variationalautoencoder based approach that combines Bayesian inference with unsu-pervised deep learning, to learn a probabilistic encoding of the input data.Another variational autoencoder based single cell method was also propo-sed very recently for RNA-seq data, scVI Lopez et al. [2017]. The methoduses explicit modeling of technical effects in RNA-seq data generation(batch effect, technical drop outs) and then uses t-SNE for visualization
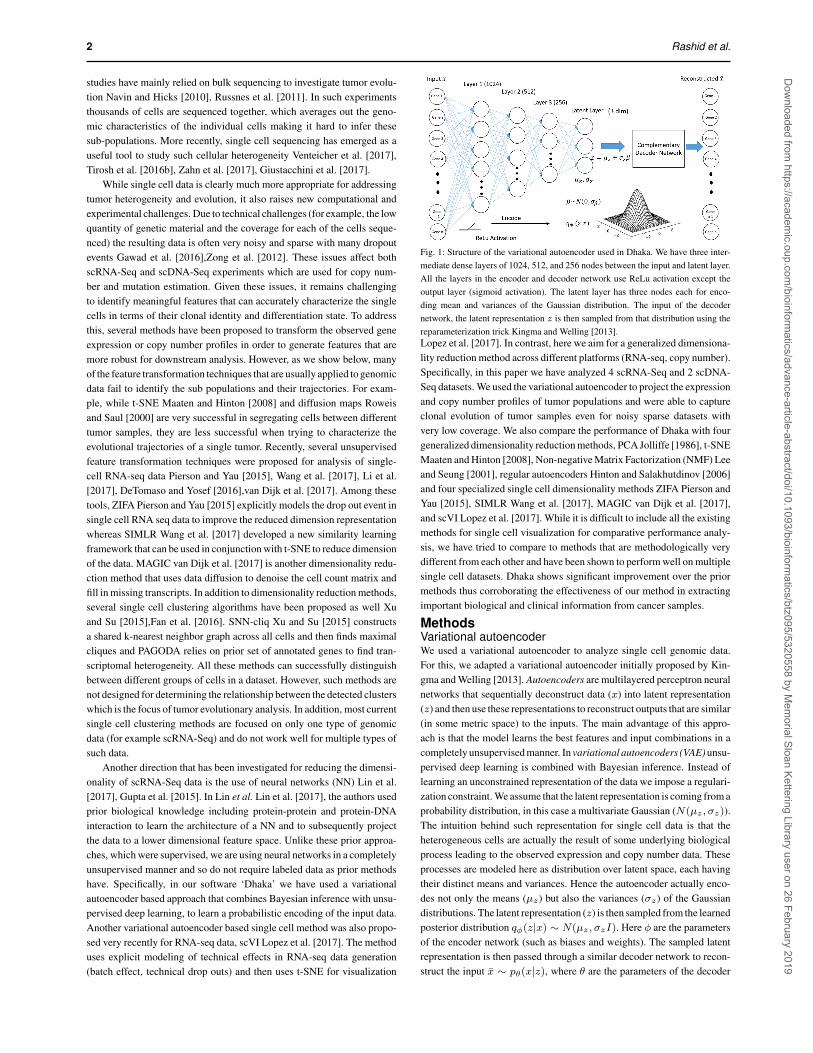
Fig. 1: Structure of the variational autoencoder used in Dhaka. We have three inter-mediate dense layers of 1024, 512, and 256 nodes between the input and latent layer.All the layers in the encoder and decoder network use ReLu activation except theoutput layer (sigmoid activation). The latent layer has three nodes each for enco-ding mean and variances of the Gaussian distribution. The input of the decodernetwork, the latent representation z is then sampled from that distribution using thereparameterization trick Kingma and Welling [2013].Lopez et al. [2017]. In contrast, here we aim for a generalized dimensiona-lity reduction method across different platforms (RNA-seq, copy number).Specifically, in this paper we have analyzed 4 scRNA-Seq and 2 scDNA-Seq datasets. We used the variational autoencoder to project the expressionand copy number profiles of tumor populations and were able to captureclonal evolution of tumor samples even for noisy sparse datasets withvery low coverage. We also compare the performance of Dhaka with fourgeneralized dimensionality reduction methods, PCA Jolliffe [1986], t-SNEMaaten and Hinton [2008], Non-negative Matrix Factorization (NMF) Leeand Seung [2001], regular autoencoders Hinton and Salakhutdinov [2006]and four specialized single cell dimensionality methods ZIFA Pierson andYau [2015], SIMLR Wang et al. [2017], MAGIC van Dijk et al. [2017],and scVI Lopez et al. [2017]. While it is difficult to include all the existingmethods for single cell visualization for comparative performance analy-sis, we have tried to compare to methods that are methodologically verydifferent from each other and have been shown to perform well on multiplesingle cell datasets. Dhaka shows significant improvement over the priormethods thus corroborating the effectiveness of our method in extractingimportant biological and clinical information from cancer samples.
MethodsVariational autoencoderWe used a variational autoencoder to analyze single cell genomic data.For this, we adapted a variational autoencoder initially proposed by Kin-gma and Welling [2013]. Autoencoders are multilayered perceptron neuralnetworks that sequentially deconstruct data (x) into latent representation(z) and then use these representations to reconstruct outputs that are similar(in some metric space) to the inputs. The main advantage of this appro-ach is that the model learns the best features and input combinations in acompletely unsupervised manner. In variational autoencoders (VAE) unsu-pervised deep learning is combined with Bayesian inference. Instead oflearning an unconstrained representation of the data we impose a regulari-zation constraint. We assume that the latent representation is coming from aprobability distribution, in this case a multivariate Gaussian (N(µz , σz)).The intuition behind such representation for single cell data is that theheterogeneous cells are actually the result of some underlying biologicalprocess leading to the observed expression and copy number data. Theseprocesses are modeled here as distribution over latent space, each havingtheir distinct means and variances. Hence the autoencoder actually enco-des not only the means (µz) but also the variances (σz) of the Gaussiandistributions. The latent representation (z) is then sampled from the learnedposterior distribution qφ(z|x) ∼ N(µz , σzI). Here φ are the parametersof the encoder network (such as biases and weights). The sampled latentrepresentation is then passed through a similar decoder network to recon-struct the input x ∼ pθ(x|z), where θ are the parameters of the decoder
Dow
nloaded from https://academ
ic.oup.com/bioinform
atics/advance-article-abstract/doi/10.1093/bioinformatics/btz095/5320558 by M
emorial Sloan Kettering Library user on 26 February 2019
Dhaka 3
Fig. 2: Comparison of the Dhaka method with t-SNE, PCA, ZIFA, and SIMLR onsimulated dataset with 2500 completely noisy genes (83% of total genes) withoutany cluster specific expression. a) Dhaka, b) PCA, c) t-SNE, d) ZIFA, e) SIMLR.The colors correspond to the ground truth cluster ids. f) Plot of BIC calculated fromfitting Gaussian Mixture Model to the 3D projection of the data to estimate numberof clusters. The number with lowest BIC is considered as the estimated number ofclusters.network. Although the model is trained to minimize the error between theinputs and the reconstructed outputs, we are actually interested in the latentrepresentation z of the data since it represents the key information neededto accurately reconstruct the inputs.Model structure:Fig. 1 presents the structure of the autoencoder used in this paper. Theinput layer consists of nodes equal to the number of genes we are analyzingfor each cell. The input to the Dhaka package is log2 transformed TPMcounts. We have used Rectified Linear unit(ReLu) activation function inall the layers except the final layer of getting the reconstructed output. Weused sigmoid activation function in the final layer 1. We have used threeintermediate layers with 1024, 512, and 256 nodes and a 3-dimensionallatent layer. The latent layer has three nodes for mean (µz) and three nodesfor variance (σz), which generate the 3 dimensional latent variable z. Thesize of the latent dimension (i.e. the representation we extract from themodel) is a parameter of the model. As we show in Results, for the dataanalyzed in this paper three latent variables are enough to obtain accurateseparation of cell states for both the expression and copy number datasets.Increasing this number did not improve the results and so all figures andsubsequent analysis are based on this number. However, the method isgeneral and if needed can use more or less nodes in the latent layer.
All datasets we analyzed had more than 5K genes and the reportedstructure with at least 1024 nodes in the first intermediate layer (Fig. 1)was sufficient for them. We used three intermediate layers to graduallycompress the encoding to a 3 dimensional feature space. We have alsocompared three different structures of autoencoders: i) the proposed threeintermediate layers, ii) one intermediate layer, and iii) five intermediatelayers in the Results section.
1 We have option of using ReLU activation in the final layer as well.Performance with ReLU activation function can be found in the Appendix
Learning:To learn the parameters of the autoencoder, φ and θ, we need to maximizelog(p(x|φ, θ)), the log likelihood of the data points x, given the modelparameters. The marginal likelihood log(p(x)) is the sum of a variationallower bound Kingma and Welling [2013] and the Kullback-Leibler (KL)Joyce [2011] divergence between the approximate and true posteriors.
log(p(x)) = L(φ, θ;x) +DKL(qφ(z|x)||pθ(z|x))
The likelihood L can be decomposed as following:L(φ, θ;x) = Ez∼qφ(z|x)[log(pθ(x|z))]−DKL(qφ(z|x)||pθ(z))
The first term can be viewed as the typical reconstruction loss intrinsicto all autoencoders, the second term can be viewed as the penalty for forcingthe encoded representation to follow the Gaussian prior (the regulariza-tion part). We then use ‘RMSprop’, which relies on a variant of stochasticminibatch gradient descent, to minimize−L. In ‘RMSprop’, the learningrate weight is divided by the running average of the magnitudes of recentgradients for that weight leading to better convergence Tieleman and Hin-ton [2012]. Detailed derivation of the loss computation can be found inKingma and Welling [2013]. To demonstrate the robustness of the training,we have shown the loss function plot from 50 independent trials on theOligodendroglioma dataset (Supporting Fig. S2). The low standard errorin the plot corroborates the robustness of training in Dhaka.
An issue in learning VAE with standard gradient descent is that gradi-ent descent requires the model to be differentiable, however the presenceof stochastic sampling layer in VAE makes the model undifferentiable. Toenable the use of gradient descent in our model, we use the reparameteri-zation trick introduced in Kingma and Welling [2013]. We introduce a newrandom variable β. Instead of sampling z directly from the N(µz , σzI),we set z = µz + σz ∗ β
Where β is the Gaussian noise, β ∼ N(0, σβ). Using β we do notneed to sample from the latent layer and so the model is differentiableand gradient descent can be used to learn model parameters LeCun et al.[2015]. σβ is the standard deviation of the Gaussian noise and is an inputparameter of the model.
ResultsSimulated datasetWe first performed simulation analysis to compare the Dhaka method withprior dimensionality reduction methods that have been extensively used forscRNA-Seq data: t-SNE Maaten and Hinton [2008], PCA Jolliffe [1986],ZIFA Pierson and Yau [2015], SIMLR Wang et al. [2017], NMF Leeand Seung [2001], regular autoencoder Hinton and Salakhutdinov [2006],MAGIC van Dijk et al. [2017], and scVI Lopez et al. [2017]. Due tospace constraint, we present the comparison with the first four methodshere and the last four in the Appendix (Fig. S5).We generated a simulateddataset with 3K genes and 500 cells. In the simulated dataset, cells aregenerated from five different clusters with 100 cells each. There is a totalof 3000 genes in the dataset. All the 3000 genes contains variable amountof noise, among which 500 genes have cluster specific expression to someextent and the remaining 2500 genes does not have any cluster specificexpression, i.e., completely noisy. Detailed description of the simulateddata generation can be found in Appendix 1.2.
We have used a Gaussian Mixture Model to cluster the reduced dimen-sion data obtained from Dhaka and other competing methods and BayesianInformation criterion (BIC) to select the number of clusters. We next com-pute the Adjusted Rand Index (ARI) metric to determine the quality ofresulting clustering for each dimensionality reduction method. Fig 2 showsthe result of Dhaka, PCA, t-SNE, ZIFA, and SIMLR projection for thesimulated data. As can be seen, the Dhaka autoencoder has the highestARI score of 0.73. The closest is SIMLR (ARI: 0.70) and the ZIFA (ARI:0.58). Although the Dhaka autoencoder identifies 4 clusters compared toSIMLR identifying 5, the cluster labels are better preserved in Dhaka lea-ding to the higher ARI score. Among the comparing methods presented in
Dow
nloaded from https://academ
ic.oup.com/bioinform
atics/advance-article-abstract/doi/10.1093/bioinformatics/btz095/5320558 by M
emorial Sloan Kettering Library user on 26 February 2019
4 Rashid et al.
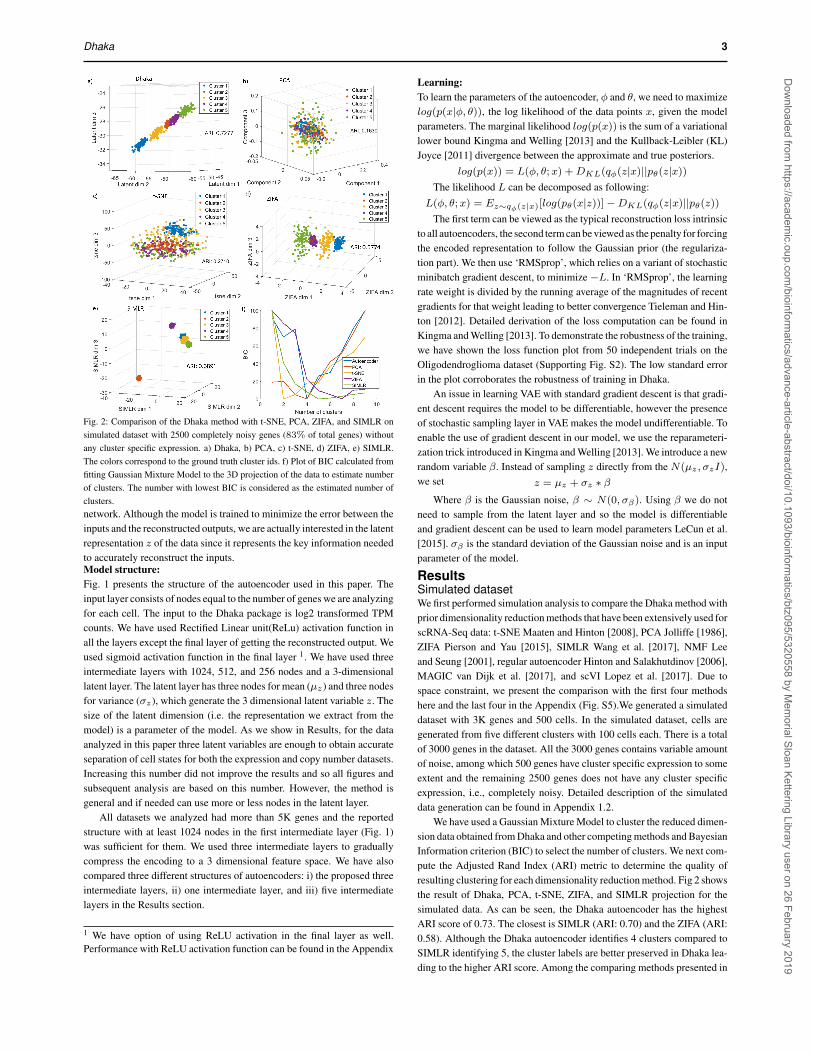
Fig. 3: Oligodendroglioma dataset.a) Dhaka projection separating malignant cells from non-malignant microglia/macrophage cells. b)-c) Dhaka output from relative expressionprofile of malignant cells using 265 signatures genes. b) Each cell is colored by their assigned lineage score which differentiates the oligo-like and astro-like subpopulations.c) Each cell is colored by their assigned differentiation score, which shows that most stem like cells are indeed placed near the bifurcation point.the Appendix (Fig. S5) only the regular Autoencoder has a high ARI score0.72, with four identified clusters. The other methods (NMF, MAGIC, andscVI) have score below 0.2. Implementation details of the competing meth-ods can be found in Appendix 1.6. The variational autoencoder in Dhakais optimized with no guaranteed global convergence. Hence we will seeslightly different outputs with each run of the algorithm. We analyzed therobustness of the method to random initializations on the simulated data-set. With 10 random initializations we observed mean ARI of 0.73 withstandard error of 0.01. This relatively low standard error corroborates therobustness of the proposed method.
Table 1: Comparison between autoencoder structures.Python 3.5, 32GB RAM, 3.4GHz Windows
Structure 1 Structure 2 Structure 3ARI 0.73 0.5 0.71
Runtime (s) 3.43 2.13 9.21
We have alsocompared three dif-ferent structures ofthe autoencoder (stru-cture 1: Input →1024 nodes → 512 nodes → 256 nodes → 3 latent dims,structure 2: Input → 1024 nodes → 3 latent dims, and stru-cture 2: Input → 1024 nodes → 512 nodes → 256 nodes →128 nodes → 64 nodes → 3 latent dims in terms of ARI andruntime (Table 1) on the simulated data. The VAE structure 1 (Fig. 1) givesthe best ARI score. When we reduce the number of intermediate layers to1, we see that the runtime decreases slightly but the ARI also decreasesfrom 0.73 to 0.5. We have also tested the effect of increasing the number ofintermediate layers to 5. We see that increasing the number of layers incre-ases the runtime significantly without improving the ARI score. Hence, weused the proposed structure 1 in all of our analysis. We have also comparedthe runtime with other competing methods, PCA, t-SNE, ZIFA, SIMLR,NMF, MAGIC, scVI, and Autoencoder (See Appendix 1.2, Table S2). Wesee that, PCA, NMF, and MAGIC are faster than the proposed method buthas very poor ARI score (below 0.20) compared to Dhaka (0.73).
Gene expression dataWe have next tested the method on four single cell RNA-seq tumor data-sets: i) Oligodendroglioma Tirosh et al. [2016b], ii) Glioblastoma Patelet al. [2014], iii) Melanoma Tirosh et al. [2016a], and iv) AstrocytomaVenteicher et al. [2017]. We discuss the first three below and the fourth inthe appendix. We have compared the performance of Dhaka with 8 com-peting methods. Due to space constraints, results from PCA, t-SNE, ZIFA,and SIMLR are presented here and results from MAGIC, NMF, regularautoencoder, and scVI are moved to the Appendix.
Analysis of Oligodendroglioma dataOligodendrogliomas are a type of glioma that originate from the oligo-dendrocytes of the brain or from a glial precursor cell. In the Oligoden-droglioma dataset the authors profiled six untreated Oligodendrogliomatumors resulting in 4347 cells and 23K genes. The dataset is comprised ofboth malignant and non-malignant cells. Copy number variations (CNV)were estimated from the log2 transformed transcript per million RNA-seqexpression data. The authors then computed two metrics, lineage score anddifferentiation score by comparing pre-selected 265 signature genes’ CNVprofile for each cell with that of a control gene set. Based on these metrics,
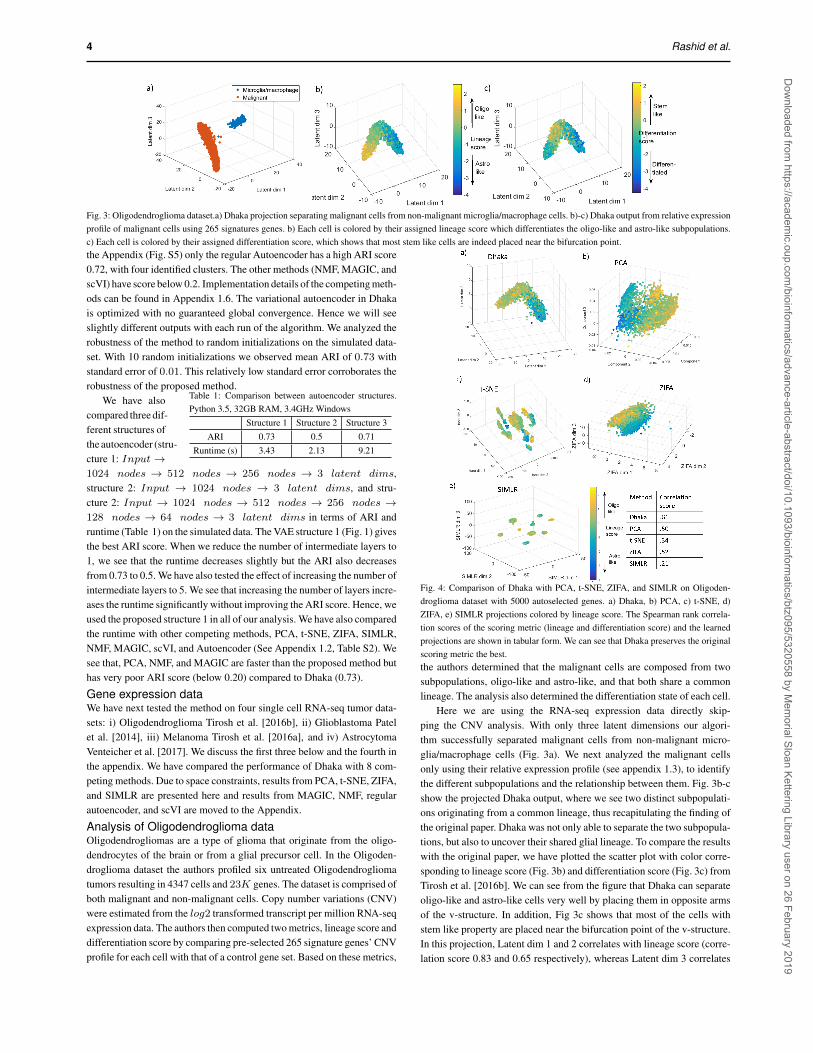
Fig. 4: Comparison of Dhaka with PCA, t-SNE, ZIFA, and SIMLR on Oligoden-droglioma dataset with 5000 autoselected genes. a) Dhaka, b) PCA, c) t-SNE, d)ZIFA, e) SIMLR projections colored by lineage score. The Spearman rank correla-tion scores of the scoring metric (lineage and differentiation score) and the learnedprojections are shown in tabular form. We can see that Dhaka preserves the originalscoring metric the best.the authors determined that the malignant cells are composed from twosubpopulations, oligo-like and astro-like, and that both share a commonlineage. The analysis also determined the differentiation state of each cell.
Here we are using the RNA-seq expression data directly skip-ping the CNV analysis. With only three latent dimensions our algori-thm successfully separated malignant cells from non-malignant micro-glia/macrophage cells (Fig. 3a). We next analyzed the malignant cellsonly using their relative expression profile (see appendix 1.3), to identifythe different subpopulations and the relationship between them. Fig. 3b-cshow the projected Dhaka output, where we see two distinct subpopulati-ons originating from a common lineage, thus recapitulating the finding ofthe original paper. Dhaka was not only able to separate the two subpopula-tions, but also to uncover their shared glial lineage. To compare the resultswith the original paper, we have plotted the scatter plot with color corre-sponding to lineage score (Fig. 3b) and differentiation score (Fig. 3c) fromTirosh et al. [2016b]. We can see from the figure that Dhaka can separateoligo-like and astro-like cells very well by placing them in opposite armsof the v-structure. In addition, Fig 3c shows that most of the cells withstem like property are placed near the bifurcation point of the v-structure.In this projection, Latent dim 1 and 2 correlates with lineage score (corre-lation score 0.83 and 0.65 respectively), whereas Latent dim 3 correlates
Dow
nloaded from https://academ
ic.oup.com/bioinform
atics/advance-article-abstract/doi/10.1093/bioinformatics/btz095/5320558 by M
emorial Sloan Kettering Library user on 26 February 2019
Dhaka 5
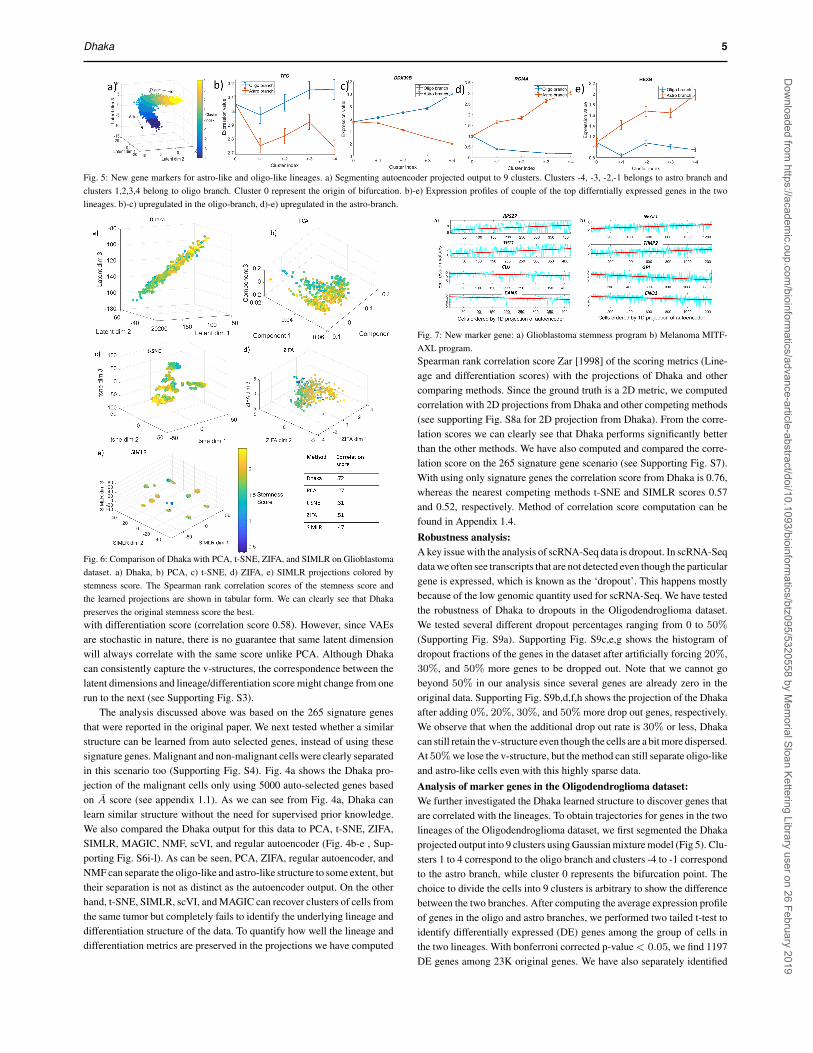
Fig. 5: New gene markers for astro-like and oligo-like lineages. a) Segmenting autoencoder projected output to 9 clusters. Clusters -4, -3, -2,-1 belongs to astro branch andclusters 1,2,3,4 belong to oligo branch. Cluster 0 represent the origin of bifurcation. b)-e) Expression profiles of couple of the top differntially expressed genes in the twolineages. b)-c) upregulated in the oligo-branch, d)-e) upregulated in the astro-branch.
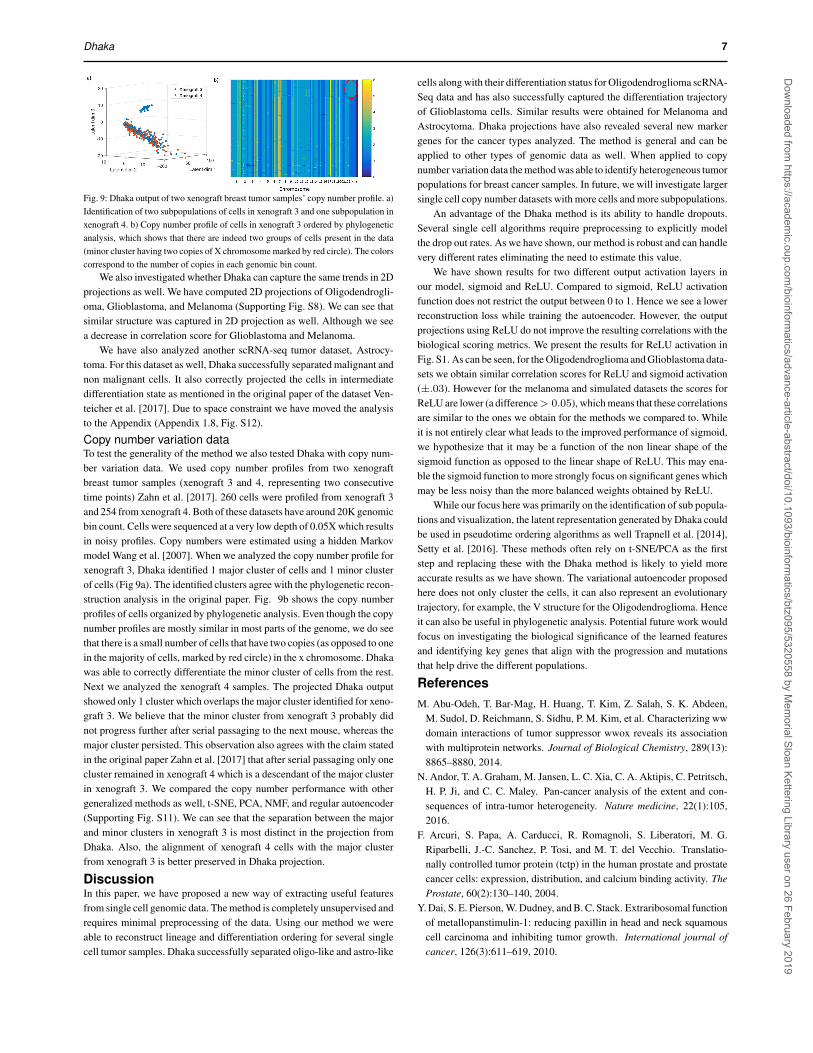
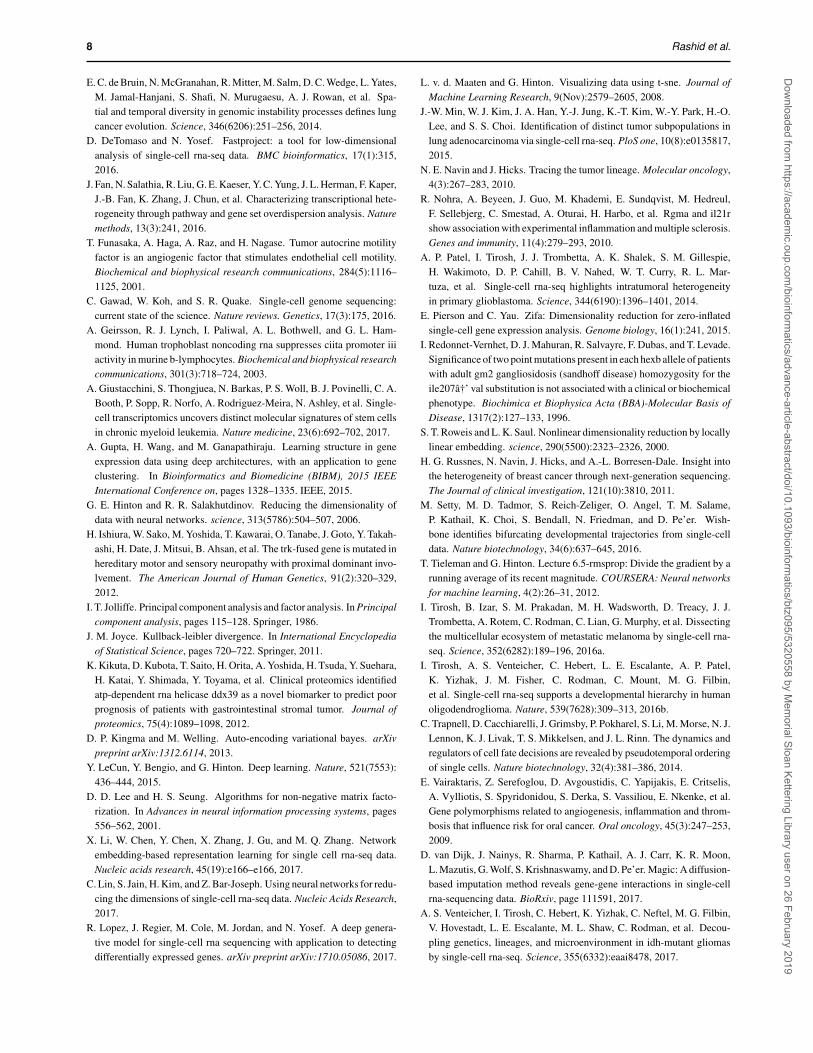
Fig. 6: Comparison of Dhaka with PCA, t-SNE, ZIFA, and SIMLR on Glioblastomadataset. a) Dhaka, b) PCA, c) t-SNE, d) ZIFA, e) SIMLR projections colored bystemness score. The Spearman rank correlation scores of the stemness score andthe learned projections are shown in tabular form. We can clearly see that Dhakapreserves the original stemness score the best.with differentiation score (correlation score 0.58). However, since VAEsare stochastic in nature, there is no guarantee that same latent dimensionwill always correlate with the same score unlike PCA. Although Dhakacan consistently capture the v-structures, the correspondence between thelatent dimensions and lineage/differentiation score might change from onerun to the next (see Supporting Fig. S3).
The analysis discussed above was based on the 265 signature genesthat were reported in the original paper. We next tested whether a similarstructure can be learned from auto selected genes, instead of using thesesignature genes. Malignant and non-malignant cells were clearly separatedin this scenario too (Supporting Fig. S4). Fig. 4a shows the Dhaka pro-jection of the malignant cells only using 5000 auto-selected genes basedon A score (see appendix 1.1). As we can see from Fig. 4a, Dhaka canlearn similar structure without the need for supervised prior knowledge.We also compared the Dhaka output for this data to PCA, t-SNE, ZIFA,SIMLR, MAGIC, NMF, scVI, and regular autoencoder (Fig. 4b-e , Sup-porting Fig. S6i-l). As can be seen, PCA, ZIFA, regular autoencoder, andNMF can separate the oligo-like and astro-like structure to some extent, buttheir separation is not as distinct as the autoencoder output. On the otherhand, t-SNE, SIMLR, scVI, and MAGIC can recover clusters of cells fromthe same tumor but completely fails to identify the underlying lineage anddifferentiation structure of the data. To quantify how well the lineage anddifferentiation metrics are preserved in the projections we have computed
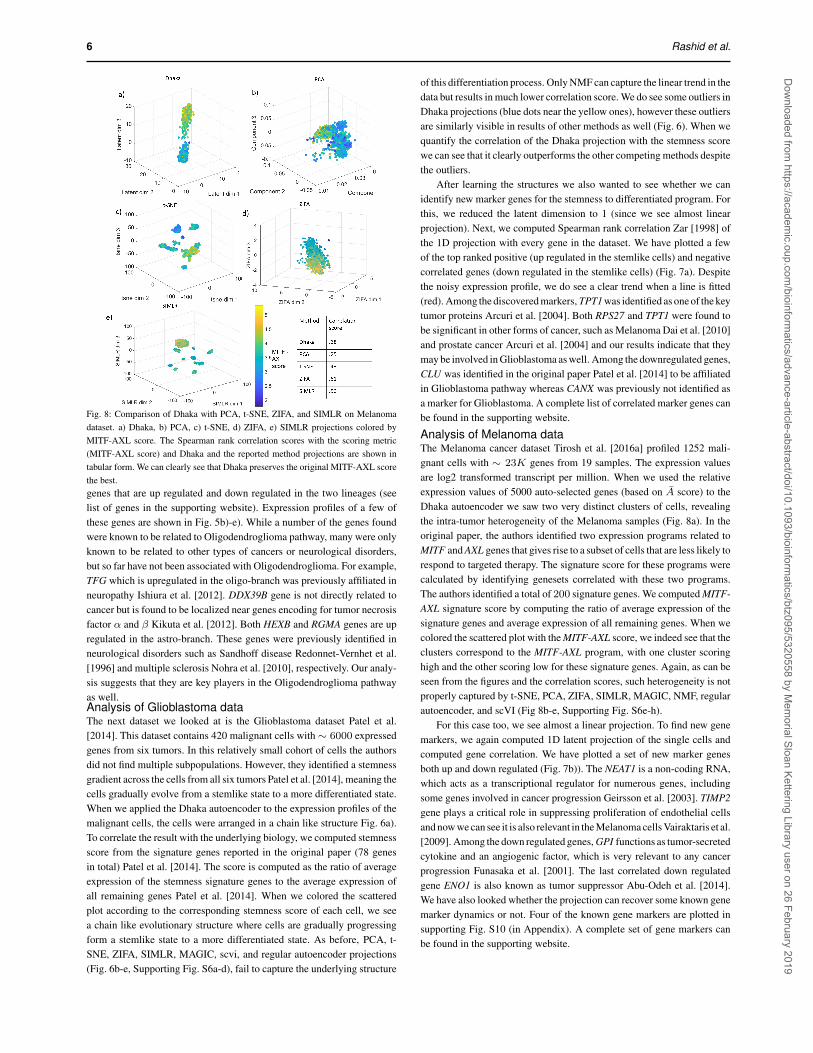
Fig. 7: New marker gene: a) Glioblastoma stemness program b) Melanoma MITF-AXL program.Spearman rank correlation score Zar [1998] of the scoring metrics (Line-age and differentiation scores) with the projections of Dhaka and othercomparing methods. Since the ground truth is a 2D metric, we computedcorrelation with 2D projections from Dhaka and other competing methods(see supporting Fig. S8a for 2D projection from Dhaka). From the corre-lation scores we can clearly see that Dhaka performs significantly betterthan the other methods. We have also computed and compared the corre-lation score on the 265 signature gene scenario (see Supporting Fig. S7).With using only signature genes the correlation score from Dhaka is 0.76,whereas the nearest competing methods t-SNE and SIMLR scores 0.57and 0.52, respectively. Method of correlation score computation can befound in Appendix 1.4.Robustness analysis:A key issue with the analysis of scRNA-Seq data is dropout. In scRNA-Seqdata we often see transcripts that are not detected even though the particulargene is expressed, which is known as the ‘dropout’. This happens mostlybecause of the low genomic quantity used for scRNA-Seq. We have testedthe robustness of Dhaka to dropouts in the Oligodendroglioma dataset.We tested several different dropout percentages ranging from 0 to 50%
(Supporting Fig. S9a). Supporting Fig. S9c,e,g shows the histogram ofdropout fractions of the genes in the dataset after artificially forcing 20%,30%, and 50% more genes to be dropped out. Note that we cannot gobeyond 50% in our analysis since several genes are already zero in theoriginal data. Supporting Fig. S9b,d,f,h shows the projection of the Dhakaafter adding 0%, 20%, 30%, and 50% more drop out genes, respectively.We observe that when the additional drop out rate is 30% or less, Dhakacan still retain the v-structure even though the cells are a bit more dispersed.At 50% we lose the v-structure, but the method can still separate oligo-likeand astro-like cells even with this highly sparse data.Analysis of marker genes in the Oligodendroglioma dataset:We further investigated the Dhaka learned structure to discover genes thatare correlated with the lineages. To obtain trajectories for genes in the twolineages of the Oligodendroglioma dataset, we first segmented the Dhakaprojected output into 9 clusters using Gaussian mixture model (Fig 5). Clu-sters 1 to 4 correspond to the oligo branch and clusters -4 to -1 correspondto the astro branch, while cluster 0 represents the bifurcation point. Thechoice to divide the cells into 9 clusters is arbitrary to show the differencebetween the two branches. After computing the average expression profileof genes in the oligo and astro branches, we performed two tailed t-test toidentify differentially expressed (DE) genes among the group of cells inthe two lineages. With bonferroni corrected p-value< 0.05, we find 1197DE genes among 23K original genes. We have also separately identified
Dow
nloaded from https://academ
ic.oup.com/bioinform
atics/advance-article-abstract/doi/10.1093/bioinformatics/btz095/5320558 by M
emorial Sloan Kettering Library user on 26 February 2019
6 Rashid et al.
Fig. 8: Comparison of Dhaka with PCA, t-SNE, ZIFA, and SIMLR on Melanomadataset. a) Dhaka, b) PCA, c) t-SNE, d) ZIFA, e) SIMLR projections colored byMITF-AXL score. The Spearman rank correlation scores with the scoring metric(MITF-AXL score) and Dhaka and the reported method projections are shown intabular form. We can clearly see that Dhaka preserves the original MITF-AXL scorethe best.genes that are up regulated and down regulated in the two lineages (seelist of genes in the supporting website). Expression profiles of a few ofthese genes are shown in Fig. 5b)-e). While a number of the genes foundwere known to be related to Oligodendroglioma pathway, many were onlyknown to be related to other types of cancers or neurological disorders,but so far have not been associated with Oligodendroglioma. For example,TFG which is upregulated in the oligo-branch was previously affiliated inneuropathy Ishiura et al. [2012]. DDX39B gene is not directly related tocancer but is found to be localized near genes encoding for tumor necrosisfactor α and β Kikuta et al. [2012]. Both HEXB and RGMA genes are upregulated in the astro-branch. These genes were previously identified inneurological disorders such as Sandhoff disease Redonnet-Vernhet et al.[1996] and multiple sclerosis Nohra et al. [2010], respectively. Our analy-sis suggests that they are key players in the Oligodendroglioma pathwayas well.Analysis of Glioblastoma dataThe next dataset we looked at is the Glioblastoma dataset Patel et al.[2014]. This dataset contains 420 malignant cells with∼ 6000 expressedgenes from six tumors. In this relatively small cohort of cells the authorsdid not find multiple subpopulations. However, they identified a stemnessgradient across the cells from all six tumors Patel et al. [2014], meaning thecells gradually evolve from a stemlike state to a more differentiated state.When we applied the Dhaka autoencoder to the expression profiles of themalignant cells, the cells were arranged in a chain like structure Fig. 6a).To correlate the result with the underlying biology, we computed stemnessscore from the signature genes reported in the original paper (78 genesin total) Patel et al. [2014]. The score is computed as the ratio of averageexpression of the stemness signature genes to the average expression ofall remaining genes Patel et al. [2014]. When we colored the scatteredplot according to the corresponding stemness score of each cell, we seea chain like evolutionary structure where cells are gradually progressingform a stemlike state to a more differentiated state. As before, PCA, t-SNE, ZIFA, SIMLR, MAGIC, scvi, and regular autoencoder projections(Fig. 6b-e, Supporting Fig. S6a-d), fail to capture the underlying structure
of this differentiation process. Only NMF can capture the linear trend in thedata but results in much lower correlation score. We do see some outliers inDhaka projections (blue dots near the yellow ones), however these outliersare similarly visible in results of other methods as well (Fig. 6). When wequantify the correlation of the Dhaka projection with the stemness scorewe can see that it clearly outperforms the other competing methods despitethe outliers.
After learning the structures we also wanted to see whether we canidentify new marker genes for the stemness to differentiated program. Forthis, we reduced the latent dimension to 1 (since we see almost linearprojection). Next, we computed Spearman rank correlation Zar [1998] ofthe 1D projection with every gene in the dataset. We have plotted a fewof the top ranked positive (up regulated in the stemlike cells) and negativecorrelated genes (down regulated in the stemlike cells) (Fig. 7a). Despitethe noisy expression profile, we do see a clear trend when a line is fitted(red). Among the discovered markers, TPT1 was identified as one of the keytumor proteins Arcuri et al. [2004]. Both RPS27 and TPT1 were found tobe significant in other forms of cancer, such as Melanoma Dai et al. [2010]and prostate cancer Arcuri et al. [2004] and our results indicate that theymay be involved in Glioblastoma as well. Among the downregulated genes,CLU was identified in the original paper Patel et al. [2014] to be affiliatedin Glioblastoma pathway whereas CANX was previously not identified asa marker for Glioblastoma. A complete list of correlated marker genes canbe found in the supporting website.
Analysis of Melanoma dataThe Melanoma cancer dataset Tirosh et al. [2016a] profiled 1252 mali-gnant cells with ∼ 23K genes from 19 samples. The expression valuesare log2 transformed transcript per million. When we used the relativeexpression values of 5000 auto-selected genes (based on A score) to theDhaka autoencoder we saw two very distinct clusters of cells, revealingthe intra-tumor heterogeneity of the Melanoma samples (Fig. 8a). In theoriginal paper, the authors identified two expression programs related toMITF and AXL genes that gives rise to a subset of cells that are less likely torespond to targeted therapy. The signature score for these programs werecalculated by identifying genesets correlated with these two programs.The authors identified a total of 200 signature genes. We computed MITF-AXL signature score by computing the ratio of average expression of thesignature genes and average expression of all remaining genes. When wecolored the scattered plot with the MITF-AXL score, we indeed see that theclusters correspond to the MITF-AXL program, with one cluster scoringhigh and the other scoring low for these signature genes. Again, as can beseen from the figures and the correlation scores, such heterogeneity is notproperly captured by t-SNE, PCA, ZIFA, SIMLR, MAGIC, NMF, regularautoencoder, and scVI (Fig 8b-e, Supporting Fig. S6e-h).
For this case too, we see almost a linear projection. To find new genemarkers, we again computed 1D latent projection of the single cells andcomputed gene correlation. We have plotted a set of new marker genesboth up and down regulated (Fig. 7b)). The NEAT1 is a non-coding RNA,which acts as a transcriptional regulator for numerous genes, includingsome genes involved in cancer progression Geirsson et al. [2003]. TIMP2gene plays a critical role in suppressing proliferation of endothelial cellsand now we can see it is also relevant in the Melanoma cells Vairaktaris et al.[2009]. Among the down regulated genes, GPI functions as tumor-secretedcytokine and an angiogenic factor, which is very relevant to any cancerprogression Funasaka et al. [2001]. The last correlated down regulatedgene ENO1 is also known as tumor suppressor Abu-Odeh et al. [2014].We have also looked whether the projection can recover some known genemarker dynamics or not. Four of the known gene markers are plotted insupporting Fig. S10 (in Appendix). A complete set of gene markers canbe found in the supporting website.
Dow
nloaded from https://academ
ic.oup.com/bioinform
atics/advance-article-abstract/doi/10.1093/bioinformatics/btz095/5320558 by M
emorial Sloan Kettering Library user on 26 February 2019
Dhaka 7
Fig. 9: Dhaka output of two xenograft breast tumor samples’ copy number profile. a)Identification of two subpopulations of cells in xenograft 3 and one subpopulation inxenograft 4. b) Copy number profile of cells in xenograft 3 ordered by phylogeneticanalysis, which shows that there are indeed two groups of cells present in the data(minor cluster having two copies of X chromosome marked by red circle). The colorscorrespond to the number of copies in each genomic bin count.
We also investigated whether Dhaka can capture the same trends in 2Dprojections as well. We have computed 2D projections of Oligodendrogli-oma, Glioblastoma, and Melanoma (Supporting Fig. S8). We can see thatsimilar structure was captured in 2D projection as well. Although we seea decrease in correlation score for Glioblastoma and Melanoma.
We have also analyzed another scRNA-seq tumor dataset, Astrocy-toma. For this dataset as well, Dhaka successfully separated malignant andnon malignant cells. It also correctly projected the cells in intermediatedifferentiation state as mentioned in the original paper of the dataset Ven-teicher et al. [2017]. Due to space constraint we have moved the analysisto the Appendix (Appendix 1.8, Fig. S12).
Copy number variation dataTo test the generality of the method we also tested Dhaka with copy num-ber variation data. We used copy number profiles from two xenograftbreast tumor samples (xenograft 3 and 4, representing two consecutivetime points) Zahn et al. [2017]. 260 cells were profiled from xenograft 3and 254 from xenograft 4. Both of these datasets have around 20K genomicbin count. Cells were sequenced at a very low depth of 0.05X which resultsin noisy profiles. Copy numbers were estimated using a hidden Markovmodel Wang et al. [2007]. When we analyzed the copy number profile forxenograft 3, Dhaka identified 1 major cluster of cells and 1 minor clusterof cells (Fig 9a). The identified clusters agree with the phylogenetic recon-struction analysis in the original paper. Fig. 9b shows the copy numberprofiles of cells organized by phylogenetic analysis. Even though the copynumber profiles are mostly similar in most parts of the genome, we do seethat there is a small number of cells that have two copies (as opposed to onein the majority of cells, marked by red circle) in the x chromosome. Dhakawas able to correctly differentiate the minor cluster of cells from the rest.Next we analyzed the xenograft 4 samples. The projected Dhaka outputshowed only 1 cluster which overlaps the major cluster identified for xeno-graft 3. We believe that the minor cluster from xenograft 3 probably didnot progress further after serial passaging to the next mouse, whereas themajor cluster persisted. This observation also agrees with the claim statedin the original paper Zahn et al. [2017] that after serial passaging only onecluster remained in xenograft 4 which is a descendant of the major clusterin xenograft 3. We compared the copy number performance with othergeneralized methods as well, t-SNE, PCA, NMF, and regular autoencoder(Supporting Fig. S11). We can see that the separation between the majorand minor clusters in xenograft 3 is most distinct in the projection fromDhaka. Also, the alignment of xenograft 4 cells with the major clusterfrom xenograft 3 is better preserved in Dhaka projection.
DiscussionIn this paper, we have proposed a new way of extracting useful featuresfrom single cell genomic data. The method is completely unsupervised andrequires minimal preprocessing of the data. Using our method we wereable to reconstruct lineage and differentiation ordering for several singlecell tumor samples. Dhaka successfully separated oligo-like and astro-like
cells along with their differentiation status for Oligodendroglioma scRNA-Seq data and has also successfully captured the differentiation trajectoryof Glioblastoma cells. Similar results were obtained for Melanoma andAstrocytoma. Dhaka projections have also revealed several new markergenes for the cancer types analyzed. The method is general and can beapplied to other types of genomic data as well. When applied to copynumber variation data the method was able to identify heterogeneous tumorpopulations for breast cancer samples. In future, we will investigate largersingle cell copy number datasets with more cells and more subpopulations.
An advantage of the Dhaka method is its ability to handle dropouts.Several single cell algorithms require preprocessing to explicitly modelthe drop out rates. As we have shown, our method is robust and can handlevery different rates eliminating the need to estimate this value.
We have shown results for two different output activation layers inour model, sigmoid and ReLU. Compared to sigmoid, ReLU activationfunction does not restrict the output between 0 to 1. Hence we see a lowerreconstruction loss while training the autoencoder. However, the outputprojections using ReLU do not improve the resulting correlations with thebiological scoring metrics. We present the results for ReLU activation inFig. S1. As can be seen, for the Oligodendroglioma and Glioblastoma data-sets we obtain similar correlation scores for ReLU and sigmoid activation(±.03). However for the melanoma and simulated datasets the scores forReLU are lower (a difference> 0.05), which means that these correlationsare similar to the ones we obtain for the methods we compared to. Whileit is not entirely clear what leads to the improved performance of sigmoid,we hypothesize that it may be a function of the non linear shape of thesigmoid function as opposed to the linear shape of ReLU. This may ena-ble the sigmoid function to more strongly focus on significant genes whichmay be less noisy than the more balanced weights obtained by ReLU.
While our focus here was primarily on the identification of sub popula-tions and visualization, the latent representation generated by Dhaka couldbe used in pseudotime ordering algorithms as well Trapnell et al. [2014],Setty et al. [2016]. These methods often rely on t-SNE/PCA as the firststep and replacing these with the Dhaka method is likely to yield moreaccurate results as we have shown. The variational autoencoder proposedhere does not only cluster the cells, it can also represent an evolutionarytrajectory, for example, the V structure for the Oligodendroglioma. Henceit can also be useful in phylogenetic analysis. Potential future work wouldfocus on investigating the biological significance of the learned featuresand identifying key genes that align with the progression and mutationsthat help drive the different populations.
ReferencesM. Abu-Odeh, T. Bar-Mag, H. Huang, T. Kim, Z. Salah, S. K. Abdeen,
M. Sudol, D. Reichmann, S. Sidhu, P. M. Kim, et al. Characterizing wwdomain interactions of tumor suppressor wwox reveals its associationwith multiprotein networks. Journal of Biological Chemistry, 289(13):8865–8880, 2014.
N. Andor, T. A. Graham, M. Jansen, L. C. Xia, C. A. Aktipis, C. Petritsch,H. P. Ji, and C. C. Maley. Pan-cancer analysis of the extent and con-sequences of intra-tumor heterogeneity. Nature medicine, 22(1):105,2016.
F. Arcuri, S. Papa, A. Carducci, R. Romagnoli, S. Liberatori, M. G.Riparbelli, J.-C. Sanchez, P. Tosi, and M. T. del Vecchio. Translatio-nally controlled tumor protein (tctp) in the human prostate and prostatecancer cells: expression, distribution, and calcium binding activity. TheProstate, 60(2):130–140, 2004.
Y. Dai, S. E. Pierson, W. Dudney, and B. C. Stack. Extraribosomal functionof metallopanstimulin-1: reducing paxillin in head and neck squamouscell carcinoma and inhibiting tumor growth. International journal ofcancer, 126(3):611–619, 2010.
Dow
nloaded from https://academ
ic.oup.com/bioinform
atics/advance-article-abstract/doi/10.1093/bioinformatics/btz095/5320558 by M
emorial Sloan Kettering Library user on 26 February 2019
8 Rashid et al.
E. C. de Bruin, N. McGranahan, R. Mitter, M. Salm, D. C. Wedge, L. Yates,M. Jamal-Hanjani, S. Shafi, N. Murugaesu, A. J. Rowan, et al. Spa-tial and temporal diversity in genomic instability processes defines lungcancer evolution. Science, 346(6206):251–256, 2014.
D. DeTomaso and N. Yosef. Fastproject: a tool for low-dimensionalanalysis of single-cell rna-seq data. BMC bioinformatics, 17(1):315,2016.
J. Fan, N. Salathia, R. Liu, G. E. Kaeser, Y. C. Yung, J. L. Herman, F. Kaper,J.-B. Fan, K. Zhang, J. Chun, et al. Characterizing transcriptional hete-rogeneity through pathway and gene set overdispersion analysis. Naturemethods, 13(3):241, 2016.
T. Funasaka, A. Haga, A. Raz, and H. Nagase. Tumor autocrine motilityfactor is an angiogenic factor that stimulates endothelial cell motility.Biochemical and biophysical research communications, 284(5):1116–1125, 2001.
C. Gawad, W. Koh, and S. R. Quake. Single-cell genome sequencing:current state of the science. Nature reviews. Genetics, 17(3):175, 2016.
A. Geirsson, R. J. Lynch, I. Paliwal, A. L. Bothwell, and G. L. Ham-mond. Human trophoblast noncoding rna suppresses ciita promoter iiiactivity in murine b-lymphocytes. Biochemical and biophysical researchcommunications, 301(3):718–724, 2003.
A. Giustacchini, S. Thongjuea, N. Barkas, P. S. Woll, B. J. Povinelli, C. A.Booth, P. Sopp, R. Norfo, A. Rodriguez-Meira, N. Ashley, et al. Single-cell transcriptomics uncovers distinct molecular signatures of stem cellsin chronic myeloid leukemia. Nature medicine, 23(6):692–702, 2017.
A. Gupta, H. Wang, and M. Ganapathiraju. Learning structure in geneexpression data using deep architectures, with an application to geneclustering. In Bioinformatics and Biomedicine (BIBM), 2015 IEEEInternational Conference on, pages 1328–1335. IEEE, 2015.
G. E. Hinton and R. R. Salakhutdinov. Reducing the dimensionality ofdata with neural networks. science, 313(5786):504–507, 2006.
H. Ishiura, W. Sako, M. Yoshida, T. Kawarai, O. Tanabe, J. Goto, Y. Takah-ashi, H. Date, J. Mitsui, B. Ahsan, et al. The trk-fused gene is mutated inhereditary motor and sensory neuropathy with proximal dominant invo-lvement. The American Journal of Human Genetics, 91(2):320–329,2012.
I. T. Jolliffe. Principal component analysis and factor analysis. In Principalcomponent analysis, pages 115–128. Springer, 1986.
J. M. Joyce. Kullback-leibler divergence. In International Encyclopediaof Statistical Science, pages 720–722. Springer, 2011.
K. Kikuta, D. Kubota, T. Saito, H. Orita, A. Yoshida, H. Tsuda, Y. Suehara,H. Katai, Y. Shimada, Y. Toyama, et al. Clinical proteomics identifiedatp-dependent rna helicase ddx39 as a novel biomarker to predict poorprognosis of patients with gastrointestinal stromal tumor. Journal ofproteomics, 75(4):1089–1098, 2012.
D. P. Kingma and M. Welling. Auto-encoding variational bayes. arXivpreprint arXiv:1312.6114, 2013.
Y. LeCun, Y. Bengio, and G. Hinton. Deep learning. Nature, 521(7553):436–444, 2015.
D. D. Lee and H. S. Seung. Algorithms for non-negative matrix facto-rization. In Advances in neural information processing systems, pages556–562, 2001.
X. Li, W. Chen, Y. Chen, X. Zhang, J. Gu, and M. Q. Zhang. Networkembedding-based representation learning for single cell rna-seq data.Nucleic acids research, 45(19):e166–e166, 2017.
C. Lin, S. Jain, H. Kim, and Z. Bar-Joseph. Using neural networks for redu-cing the dimensions of single-cell rna-seq data. Nucleic Acids Research,2017.
R. Lopez, J. Regier, M. Cole, M. Jordan, and N. Yosef. A deep genera-tive model for single-cell rna sequencing with application to detectingdifferentially expressed genes. arXiv preprint arXiv:1710.05086, 2017.
L. v. d. Maaten and G. Hinton. Visualizing data using t-sne. Journal ofMachine Learning Research, 9(Nov):2579–2605, 2008.
J.-W. Min, W. J. Kim, J. A. Han, Y.-J. Jung, K.-T. Kim, W.-Y. Park, H.-O.Lee, and S. S. Choi. Identification of distinct tumor subpopulations inlung adenocarcinoma via single-cell rna-seq. PloS one, 10(8):e0135817,2015.
N. E. Navin and J. Hicks. Tracing the tumor lineage. Molecular oncology,4(3):267–283, 2010.
R. Nohra, A. Beyeen, J. Guo, M. Khademi, E. Sundqvist, M. Hedreul,F. Sellebjerg, C. Smestad, A. Oturai, H. Harbo, et al. Rgma and il21rshow association with experimental inflammation and multiple sclerosis.Genes and immunity, 11(4):279–293, 2010.
A. P. Patel, I. Tirosh, J. J. Trombetta, A. K. Shalek, S. M. Gillespie,H. Wakimoto, D. P. Cahill, B. V. Nahed, W. T. Curry, R. L. Mar-tuza, et al. Single-cell rna-seq highlights intratumoral heterogeneityin primary glioblastoma. Science, 344(6190):1396–1401, 2014.
E. Pierson and C. Yau. Zifa: Dimensionality reduction for zero-inflatedsingle-cell gene expression analysis. Genome biology, 16(1):241, 2015.
I. Redonnet-Vernhet, D. J. Mahuran, R. Salvayre, F. Dubas, and T. Levade.Significance of two point mutations present in each hexb allele of patientswith adult gm2 gangliosidosis (sandhoff disease) homozygosity for theile207→ val substitution is not associated with a clinical or biochemicalphenotype. Biochimica et Biophysica Acta (BBA)-Molecular Basis ofDisease, 1317(2):127–133, 1996.
S. T. Roweis and L. K. Saul. Nonlinear dimensionality reduction by locallylinear embedding. science, 290(5500):2323–2326, 2000.
H. G. Russnes, N. Navin, J. Hicks, and A.-L. Borresen-Dale. Insight intothe heterogeneity of breast cancer through next-generation sequencing.The Journal of clinical investigation, 121(10):3810, 2011.
M. Setty, M. D. Tadmor, S. Reich-Zeliger, O. Angel, T. M. Salame,P. Kathail, K. Choi, S. Bendall, N. Friedman, and D. Pe’er. Wish-bone identifies bifurcating developmental trajectories from single-celldata. Nature biotechnology, 34(6):637–645, 2016.
T. Tieleman and G. Hinton. Lecture 6.5-rmsprop: Divide the gradient by arunning average of its recent magnitude. COURSERA: Neural networksfor machine learning, 4(2):26–31, 2012.
I. Tirosh, B. Izar, S. M. Prakadan, M. H. Wadsworth, D. Treacy, J. J.Trombetta, A. Rotem, C. Rodman, C. Lian, G. Murphy, et al. Dissectingthe multicellular ecosystem of metastatic melanoma by single-cell rna-seq. Science, 352(6282):189–196, 2016a.
I. Tirosh, A. S. Venteicher, C. Hebert, L. E. Escalante, A. P. Patel,K. Yizhak, J. M. Fisher, C. Rodman, C. Mount, M. G. Filbin,et al. Single-cell rna-seq supports a developmental hierarchy in humanoligodendroglioma. Nature, 539(7628):309–313, 2016b.
C. Trapnell, D. Cacchiarelli, J. Grimsby, P. Pokharel, S. Li, M. Morse, N. J.Lennon, K. J. Livak, T. S. Mikkelsen, and J. L. Rinn. The dynamics andregulators of cell fate decisions are revealed by pseudotemporal orderingof single cells. Nature biotechnology, 32(4):381–386, 2014.
E. Vairaktaris, Z. Serefoglou, D. Avgoustidis, C. Yapijakis, E. Critselis,A. Vylliotis, S. Spyridonidou, S. Derka, S. Vassiliou, E. Nkenke, et al.Gene polymorphisms related to angiogenesis, inflammation and throm-bosis that influence risk for oral cancer. Oral oncology, 45(3):247–253,2009.
D. van Dijk, J. Nainys, R. Sharma, P. Kathail, A. J. Carr, K. R. Moon,L. Mazutis, G. Wolf, S. Krishnaswamy, and D. Pe’er. Magic: A diffusion-based imputation method reveals gene-gene interactions in single-cellrna-sequencing data. BioRxiv, page 111591, 2017.
A. S. Venteicher, I. Tirosh, C. Hebert, K. Yizhak, C. Neftel, M. G. Filbin,V. Hovestadt, L. E. Escalante, M. L. Shaw, C. Rodman, et al. Decou-pling genetics, lineages, and microenvironment in idh-mutant gliomasby single-cell rna-seq. Science, 355(6332):eaai8478, 2017.
Dow
nloaded from https://academ
ic.oup.com/bioinform
atics/advance-article-abstract/doi/10.1093/bioinformatics/btz095/5320558 by M
emorial Sloan Kettering Library user on 26 February 2019

Dhaka 9
B. Wang, J. Zhu, E. Pierson, D. Ramazzotti, and S. Batzoglou. Visualiza-tion and analysis of single-cell rna-seq data by kernel-based similaritylearning. Nature Methods, 14(4):414–416, 2017.
K. Wang, M. Li, D. Hadley, R. Liu, J. Glessner, S. F. Grant, H. Hakonarson,and M. Bucan. Penncnv: an integrated hidden markov model designedfor high-resolution copy number variation detection in whole-genomesnp genotyping data. Genome research, 17(11):1665–1674, 2007.
C. Xu and Z. Su. Identification of cell types from single-cell transcriptomesusing a novel clustering method. Bioinformatics, 31(12):1974–1980,2015.
H. Zahn, A. Steif, E. Laks, P. Eirew, M. VanInsberghe, S. P. Shah, S. Apa-ricio, and C. L. Hansen. Scalable whole-genome single-cell librarypreparation without preamplification. Nature methods, 14(2):167–173,2017.
J. H. Zar. Spearman rank correlation. Encyclopedia of Biostatistics, 1998.C. Zong, S. Lu, A. R. Chapman, and X. S. Xie. Genome-wide detection
of single-nucleotide and copy-number variations of a single human cell.Science, 338(6114):1622–1626, 2012.
Dow
nloaded from https://academ
ic.oup.com/bioinform
atics/advance-article-abstract/doi/10.1093/bioinformatics/btz095/5320558 by M
emorial Sloan Kettering Library user on 26 February 2019


![Monaural Audio Source Separation using Variational ...2. Variational Autoencoder The variational autoencoder [15] is a generative model which assumes that an observed variable xis](https://img.pdfslide.net/doc/110x75/5ed3f4271188145a1e02697a/monaural-audio-source-separation-using-variational-2-variational-autoencoder.jpg)


![[DL輪読会]TREE-STRUCTURED VARIATIONAL AUTOENCODER](https://img.pdfslide.net/doc/110x75/587148651a28ab55588b5ee3/dltree-structured-variational-autoencoder.jpg)