Embed Size (px)
Citation preview
DHS ANALYTICAL STUDIES 49
Men and ContraCeption: trends in attitudes and use
september 2015
This publication was produced for review by the United States Agency for International Development. It was prepared by Kerry L.D. MacQuarrie, Jeffrey Edmeades, Mara Steinhaus, and Sara K. Head of ICF International.

DHS Analytical Studies No. 49
Men and Contraception: Trends in Attitudes and Use
Kerry L.D. MacQuarrie1
Jeffrey Edmeades2
Mara Steinhaus2
Sara K. Head3
ICF International
Rockville, Maryland, USA
September 2015
1 The DHS Program, Avenir Health 2 International Center for Research on Women 3 The DHS Program, ICF International
Corresponding author: Kerry L.D. MacQuarrie, International Health and Development, ICF International, 530 Gaither Road, Suite 500, Rockville, MD 20850, USA; phone: +1 301-572-0282; fax: +1 301-407-6501; email: [email protected]
Acknowledgments: The authors would like to thank Natalie La Roche and Shireen Assaf for their preparation of charts, Kristin Bietsch for assistance with data and charts on contraceptive attitudes, and Akinrinola Bankole for a thoughtful review of an earlier draft. Editor: Sidney Moore Document Production: Natalie La Roche This study was carried out with support provided by the United States Agency for International Development (USAID) through The DHS Program (#AID-OAA-C-13-00095). The views expressed are those of the authors and do not necessarily reflect the views of USAID or the United States Government. The DHS Program assists countries worldwide in the collection and use of data to monitor and evaluate population, health, and nutrition programs. For additional information about The DHS Program, contact The DHS Program, ICF International, 530 Gaither Road, Suite 500, Rockville, MD 20850, USA; phone: 301-407-6500; fax: 301-407-6501; email: [email protected]; Internet: www.dhsprogram.com. Recommended citation: MacQuarrie, Kerry L.D., Jeffrey Edmeades, Mara Steinhaus, and Sara K. Head. 2015. Men and Contraception: Trends in Attitudes and Use. DHS Analytical Studies No. 49. Rockville, Maryland, USA: ICF International.
iii
Contents
Tables ......................................................................................................................................................... v
Figures ......................................................................................................................................................... v
Preface ........................................................................................................................................................ ix
Abstract ........................................................................................................................................................ xi
Executive Summary ................................................................................................................................... xiii
1. Background ...................................................................................................................................... 1
2. Methods and Data ............................................................................................................................ 3 2.1. Measures ............................................................................................................................. 6
3. Men’s Knowledge of Contraception .............................................................................................. 11 3.1. Mean Number of Contraceptive Methods Known ............................................................ 11
4. Men’s Fertility Preferences ............................................................................................................ 15 4.1 Mean Ideal Number of Children ....................................................................................... 15 4.2. Sex preference for children ............................................................................................... 19 4.3. Ideal Sex Composition of Children ................................................................................... 20
5. Men’s Fertility ............................................................................................................................... 23 5.1. Mean Number of Children Ever Born and Living ............................................................ 23
6. Men’s Attitudes toward Contraception .......................................................................................... 27 6.1. Women’s Use of Contraception and Promiscuity ............................................................. 27 6.2. Contraception as Women’s Business ................................................................................ 29 6.3. Use of Contraception to Avoid Pregnancy ....................................................................... 32 6.4. Index of Men’s Contraceptive Attitudes ........................................................................... 33
7. Men’s Gender Attitudes ................................................................................................................. 39 7.1. Men’s Attitudes toward Wife Beating .............................................................................. 39 7.2. Men’s Attitudes toward Wives’ Agency in Negotiating Safer Sex .................................. 52
8. Men’s Use of Contraception .......................................................................................................... 61 8.1. Men’s Use of Contraception at Last Sex .......................................................................... 61 8.2. Men’s Use of Modern vs. Traditional Contraception at Last Sex .................................... 72 8.3. Men’s Use of Male-Controlled and Cooperative Contraception versus
Female-Controlled Contraception at Last Sex .................................................................. 74
9. Gender Attitudes and Men’s Use of Contraception ....................................................................... 79 9.1. Attitudes toward Wife Beating and Men’s Use of Contraception at Last Sex .................. 79 9.2. Attitudes toward Wives’ Agency in Negotiating Safer Sex and Men’s Use of
Contraception at Last Sex ................................................................................................. 80
iv
10. Methods of Contraception Used by Men ....................................................................................... 83 10.1. Contraceptive Method Mix ............................................................................................... 83 10.2. Methods of Contraception among Men and Relationship Factors .................................... 87 10.3. Methods of Contraception among Men and Life Course Factors ..................................... 93 10.4. Methods of Contraception and Socioeconomic Characteristics........................................ 96
11. Discussion and Conclusions ........................................................................................................ 101 11.1. Contraceptive Knowledge ............................................................................................... 101 11.2. Fertility and Fertility Preferences ................................................................................... 101 11.3. Attitudes toward Contraception ...................................................................................... 102 11.4. Gender Attitudes ............................................................................................................. 102 11.5. Use of Contraception at Last Sex .................................................................................... 103 11.6. Method of Contraception ................................................................................................ 104
References ................................................................................................................................................. 105
Appendix A ............................................................................................................................................... 107
Appendix B ............................................................................................................................................... 113
v
Tables
Table 2.1. Survey characteristics for countries included in the analysis ............................................. 3 Table 2.2. Fertility profile of countries included in the analysis ......................................................... 4
Figures
Figure 3.1. Mean number of contraceptive methods men know ......................................................... 11 Figure 3.2. Trends in the mean number of contraceptive methods men know.................................... 12 Figure 3.3. Mean number of contraceptive methods men know by level of education,
most recent DHS survey ................................................................................................... 13 Figure 3.4. Mean number of contraceptive methods men know by current number of children,
most recent DHS survey ................................................................................................... 13 Figure 3.5. Control of contraceptive methods men know ................................................................... 14 Figure 4.1. Men’s mean ideal number of children, most recent DHS survey ..................................... 15 Figure 4.2. Men’s mean ideal number of children by education level, most recent DHS survey ....... 17 Figure 4.3. Men’s mean ideal number of children by wealth quintile, most recent DHS survey ....... 18 Figure 4.4. Men’s mean ideal number of children by residence, most recent DHS survey ................ 19 Figure 4.5. Ideal sex composition among men with complete sex preferences, most recent DHS
survey ................................................................................................................................ 21 Figure 5.1. Mean number of children ever born and living, most recent DHS survey ....................... 24 Figure 5.2. Trends in mean total number of children ever born by survey year, most recent DHS
survey ................................................................................................................................ 25 Figure 6.1. Percentage of men who disagree that women who use contraception may become
promiscuous, most recent DHS survey ............................................................................. 28 Figure 6.2. Trends in the percentage of men who disagree that women who use contraception may
become promiscuous ......................................................................................................... 29 Figure 6.3. Percentage of men who disagree that contraception is a woman’s business and a man
should not have to worry about it, most recent DHS survey ............................................ 30 Figure 6.4. Trends in the percentage of men who disagree that contraception is a woman’s
business and a man should not have to worry about it ...................................................... 31 Figure 6.5. Percentage of men who approve of couples using contraception to avoid getting
pregnant ............................................................................................................................ 32 Figure 6.6. Trends in the percentage of men who approve of couples using a method to avoid
getting pregnant ................................................................................................................ 33 Figure 6.7. Contraceptive attitudes index score by 5-year age group, most recent DHS survey ........ 34 Figure 6.8. Contraceptive attitudes index score by number of children, most recent DHS survey ..... 35 Figure 6.9. Contraceptive attitudes index score by education, most recent DHS survey .................... 36 Figure 6.10. Contraceptive attitudes index score by household wealth quintile, most recent DHS
survey ................................................................................................................................ 37 Figure 6.11. Contraceptive attitudes index score by residence, most recent DHS survey .................... 38 Figure 7.1. Percentage of men agreeing that wife beating is justified in at least one scenario,
most recent DHS survey ................................................................................................... 40 Figure 7.2. Mean number of scenarios in which men report wife beating is justified, most recent
DHS survey ....................................................................................................................... 41
vi
Figure 7.3. Trends in the percentage of men agreeing that wife beating is justified in at least one scenario ............................................................................................................................. 42
Figure 7.4. Trends in the number of scenarios in which beating is justified ....................................... 43 Figure 7.5. Percentage of men agreeing that wife beating is justified in at least one scenario
by five-year age group, most recent DHS survey ............................................................. 44 Figure 7.6. Percentage of men agreeing that wife beating is justified in at least one scenario by
marital status, most recent DHS survey ............................................................................ 45 Figure 7.7. Percentage of men agreeing that wife beating is justified in at least one scenario by
number of children, most recent DHS survey ................................................................... 46 Figure 7.8. Percentage of men agreeing that wife beating is justified in at least one scenario
by level of education, most recent DHS survey ................................................................ 48 Figure 7.9. Percentage of men agreeing that wife beating is justified in at least one scenario by
household wealth quintile, most recent DHS survey ........................................................ 49 Figure 7.10. Proportion tolerating wife beating in at least one scenario by residence, most recent
DHS survey ....................................................................................................................... 51 Figure 7.11. Percentage of men who say that a wife is justified in asking they use a condom if
her husband has an STI, most recent DHS survey ............................................................ 52 Figure 7.12. Trends in the percentage of men who say that wives are justified to ask to use a
condom if her husband has an STI, most recent DHS survey ........................................... 53 Figure 7.13. Percentage of men agreeing that wives are justified in asking they use a condom
if her husband has an STI by 5 year age group, most recent DHS surveys for selected study countries .................................................................................................................. 54
Figure 7.14. Percentage of men agreeing that wives are justified in asking they use a condom if her husband has an STI by number of children, most recent DHS surveys for selected countries ............................................................................................................................ 55
Figure 7.15. Percentage of men agreeing that wives are justified in asking that they use a condom if her husband has an STI by marital status, most recent DHS surveys for selected countries ............................................................................................................................ 56
Figure 7.16. Men’s agreement that wives are justified in asking that a condom be used if her husband has an STI by education, most recent DHS survey ............................................ 58
Figure 7.17. Percentage of men agreeing that wives are justified in asking that a condom be used if her husband has an STI by household wealth quintile, most recent DHS survey ......... 59
Figure 7.18. Percentage of men agreeing that wives are justified in asking that a condom be used if her husband has an STI by residence, most recent DHS survey ................................... 60
Figure 8.1. Percentage of men using contraception at last sex, most recent DHS survey ................... 61 Figure 8.2. Trends in the percentage of men using contraception at last sex ...................................... 63 Figure 8.3. Percentage of men using contraception at last sex by marital status, most recent DHS
survey ................................................................................................................................ 65 Figure 8.4. Percentage of men’s contraceptive use at last sex by type of partner at last sex, most
recent DHS survey ............................................................................................................ 66 Figure 8.5. Trends in men’s contraceptive use at last sex by marital status ........................................ 68 Figure 8.6. Trends in men’s contraceptive use at last sex by type of partner at last sex ..................... 70 Figure 8.7. Distribution of men’s contraceptive use at last sex by method type, most recent DHS
survey ................................................................................................................................ 72 Figure 8.8. Trends in the distribution of men’s contraceptive use at last sex by method type ............ 73
vii
Figure 8.9. Distribution of men’s contraceptive use at last sex by whether the method of contraception is a male-controlled/cooperative method or a female-controlled method, most recent DHS survey ..................................................................................... 75
Figure 8.10. Trends in the distribution of men’s contraceptive use at last sex by whether the method of contraception is a male-controlled/cooperative method or a female-controlled method ................................................................................................. 76
Figure 9.1. Contraceptive use at last sex by attitudes toward wife beating, most recent DHS survey ....................................................................................................................... 80
Figure 9.2. Contraceptive use at last sex by attitudes toward wives asking to use a condom if her husband has an STI, most recent DHS survey .................................................................. 81
Figure 10.1. Method mix of men’s contraceptive use at last sex, most recent DHS survey ................. 84 Figure 10.2. Trends in the method mix of men’s contraceptive use at last sex ..................................... 86 Figure 10.3. Prevalence of specific methods1 of contraception at last sex by marital status,
most recent DHS survey ................................................................................................... 88 Figure 10.4. Prevalence of specific methods1 of contraception at last sex by men’s type of
partner at last sex, most recent DHS survey ..................................................................... 91 Figure 10.5. Prevalence of specific methods of contraception at last sex by five year age group,
most recent DHS survey ................................................................................................... 94 Figure 10.6. Prevalence of specific methods of contraception at last sex by men’s number
of children ......................................................................................................................... 95 Figure 10.7. Prevalence of specific methods of contraception at last sex by men’s education,
most recent DHS survey ................................................................................................... 96 Figure 10.8. Prevalence of specific methods of contraception at last sex by household
wealth quintile ................................................................................................................... 98 Figure 10.9. Prevalence of the three most commonly used methods of contraception at last sex
in each country by residence, most recent DHS survey .................................................. 100 Figure A.1. Mean number of contraceptive methods men know by age cohort ................................ 109 Figure A.2. Mean number of contraceptive methods men know by marital status ............................ 110 Figure A.3. Mean number of contraceptive methods men know by union type ................................ 111 Figure B.1. Men’s mean ideal number of children by 5 year age group ............................................ 115 Figure B.2. Men’s mean ideal number of children by current number of children ........................... 116 Figure B.3. Men’s mean ideal number of children by marital status ................................................. 117 Figure B.4. Men’s mean ideal number of children by union type ..................................................... 118

viii
ix
Preface
The Demographic and Health Surveys (DHS) Program is one of the principal sources of international data on fertility, family planning, maternal and child health, nutrition, mortality, environmental health, HIV/AIDS, malaria, and provision of health services.
One of the objectives of The DHS Program is to analyze DHS data and provide findings that will be useful to policymakers and program managers in low- and middle-income countries. DHS Analytical Studies serve this objective by providing in-depth research on a wide range of topics, typically including several countries and applying multivariate statistical tools and models. These reports are also intended to illustrate research methods and applications of DHS data that may build the capacity of other researchers.
The topics in the DHS Analytical Studies series are selected by The DHS Program in consultation with the U.S. Agency for International Development.
It is hoped that the DHS Analytical Studies will be useful to researchers, policymakers, and survey specialists, particularly those engaged in work in low- and middle-income countries.
Sunita Kishor Director, The DHS Program

xi
Abstract
Using DHS data from 58 men’s surveys in 18 countries in Africa, Asia, and Latin America and the Caribbean, this analytical study describes current patterns and trends over time in multiple themes around men and contraception. Specifically, the study presents findings related to men’s contraceptive knowledge; fertility and fertility preferences; desired sex composition of children; attitudes toward contraception; gender attitudes; and use of contraception at last sex. In addition to analyzing the type of contraception used—modern or traditional—and the method mix, this study explores another aspect of men’s contraceptive behavior: use of male-controlled or cooperative methods (male condom, male sterilization, periodic abstinence, and withdrawal) versus female-controlled methods (the pill, IUD, injectables, implants, and female sterilization). Along with current patterns and trends, this study analyzes knowledge, attitudes, and behavior by relationship factors, life course factors, and socioeconomic characteristics.

xiii
Executive Summary
This study examines themes around men and contraception using DHS data from 18 countries in Africa, Asia, and Latin America and the Caribbean. The analysis uses data from 58 men’s surveys, rather than women’s reports about their partners or matched-couples data. It presents findings related to men’s contraceptive knowledge; fertility and fertility preferences; sex preference of desired children; attitudes toward contraception; gender attitudes; and use of contraception. We present data on current patterns in study countries, trends over time, and associations with relationship and life course factors and socioeconomic characteristics.
Contraceptive knowledge
Of the 12 contraceptive methods listed in DHS surveys, the average number of methods men know ranges from 4.5 (Democratic Republic of the Congo) to 8.8 (Rwanda). There is no clear regional pattern but contraceptive knowledge has largely increased over time.
Contraceptive knowledge varies significantly with both life course and some socioeconomic factors. Contraceptive knowledge is generally lowest among men with no children, though differences among men with few or many children are small. Contraceptive knowledge is usually lower among never married men and highest among those aged 35-45, reflecting their relative stage in the life course. Contraceptive knowledge is positively and significantly associated with men’s level of education in 13 of 16 countries. There is little variation in contraceptive knowledge by urban-rural residence or by household wealth quintile.
Men’s fertility and fertility preferences
Men’s mean ideal number of children is above replacement level in all 18 countries, ranging from 2.3 to 8.0 children, and is highest in West and Central Africa. It varies significantly and negatively by level of education, household wealth quintile, urban residence, and monogamous unions and it varies positively by age, current number of children, among currently married men, and among men in polygamous unions in a majority of countries. Of the 17 countries with trend data, eight show fluctuations in mean ideal number of children over time, eight exclusively decrease over time, and one increases over time.
Both the number of children a man has ever had and the number still living varies across countries. The Democratic Republic of the Congo has the highest mean number of children ever born and living as reported by men, 3.5 and 2.9, respectively. Namibia has the lowest mean number of children ever born and living, 1.4 and 1.2 respectively. A consistent trend with men reporting declining average numbers of children ever born is evident in most countries included in the study, increasing only in the Democratic Republic of the Congo and Cameroon.
Attitudes toward contraception
There is broad acceptance of using contraception to avoid pregnancy among men in study countries. In all countries, over 50% disagree with the statement that “contraception is a woman’s business and a man should not have to worry about it,” ranging from 53% in Indonesia to 86% in Nigeria. In contrast, contraceptive use by women remains associated with promiscuity in some countries, with only four countries (Tanzania, Ghana, Nepal, and Namibia) having over 50% of men disagreeing with the statement “women who use contraception may become promiscuous.” While no clear pattern of change is evident
xiv
for the former statement, there is a general trend over time toward increasing disagreement with the notion that contraception is linked to promiscuous behavior.
Attitudes toward contraception are strongly associated with both life course factors and socioeconomic factors. Positive attitudes are highest among men who have any children (8 of 11 countries) and among men in the middle age groups and lowest among men in the youngest and oldest age groups (9 of 11 countries). Men who are more educated (all 11 countries), live in wealthier households (all 11 countries), or live in urban areas (10 of 11 countries) are more likely to have positive attitudes toward contraception.
Gender attitudes
The degree to which men consider wife beating acceptable varies widely across the countries studied, with no regional pattern evident. Fifteen percent of men in Haiti report that wife beating is justified in at least one scenario, compared with 62% of men in the Democratic Republic of Congo. The acceptability of wife beating has declined substantially over time, on average, a 20 percentage point decrease each decade. Men’s attitudes about women’s ability to negotiate condom use if her husband has a sexually transmitted infection are consistently supportive. Life course (age and number of children) and socioeconomic factors (education and wealth) are significantly and positively associated with both gender attitudes.
Contraceptive use at last sex
There is wide variation in the proportion of men who report that they or their partner used contraception at last sex, ranging from 17% in the Democratic Republic of Congo to 63% in Indonesia. Six of 14 countries saw a significant increase in use of contraception over time. The trend in the remaining countries is not as strong but nonetheless generally suggestive of increasing use over time.
Both current marital status and type of partner are significantly associated with contraceptive use. In seven countries, contraceptive use is significantly higher among currently married men compared with never-married men (and sometimes formerly married men); but in five other countries it is significantly lower than among never-married men. The pattern is clearer when examining the partner with whom last sex occurred. In all 14 countries for which data are available, a lower proportion of men report use of a method of contraception at last sex when the partner was their spouse or cohabiting partner and highest when sex was with a commercial sex worker/casual acquaintance, or with a girlfriend/fiancée.
In every country, men who used contraception at last sex are more likely to have used a modern method than a traditional method. The prevalence of modern method use increased significantly over time in six of 14 countries with trend data; increases elsewhere are not significant. The percentage of men using male-controlled and cooperative methods of contraception at last sex is higher than the percentage using female-controlled methods in most countries (11 of 17 countries), with countries outside of Asia having higher prevalence of men using male controlled or cooperative methods.
Method of contraception
The contraceptive method mix as reported by men is concentrated in just a few contraceptive methods in each of the study countries. Three or fewer methods account for the vast majority of all contraceptive use at last sex. In 10 of 16 countries, a single dominant method accounts for more than 50% of all contraceptive use at last sex. Of these, the most common method used is condom. Relationship and life course factors feature prominently in condom use.
1
1. Background
Since 1984, The Demographic and Health Surveys (DHS) Program has collected nationally representative data from households and women to provide decision-makers and program managers with the information necessary to plan, monitor, and evaluate population, health, and nutrition programs. The DHS Program fielded its first survey among men almost a decade later in Senegal in 1992-93. Since then it has conducted 163 DHS surveys with men in 68 countries.
Alongside the growth in the collection of men’s data within and outside of The DHS Program, there has been increasing research attention on men’s involvement in reproductive health, including men’s attitudes and fertility aspirations (Bankole and Singh 1998; Johnson and Gu 2009; Snow, Winter, and Harlow 2013); concordance or discordance within couples of fertility desires and motivation to use contraception (Bankole and Singh 1998; Mason and Smith 2000; DeRose, Dodoo, and Patil 2002; Gebreselassie 2008; Diro and Afework 2013); the influence of male partners on women’s contraceptive behavior (Dodoo 1998; Casterline, Sathar, and Haque 2001; Ijadunola et al. 2010; Mosha, Ruben, and Kakoko 2013) and on abortion behavior (MacQuarrie and Edmeades 2015); and male participation in maternal care seeking (Barua and Kurz 2001; Carter 2002; Barua et al. 2004) and in other reproductive health care (Onyango, Owoko, and Oguttu 2010; MacDonald et al. 2013).
In spite of this rich body of research, core fertility and reproductive health indicators continue to be calculated using women’s data. Fertility rates, contraceptive prevalence rates, and unmet need for family planning, for example, all use women as their base. Implicit, too, in much of the work on men and reproductive health is the acknowledged importance of men in outcomes affecting women. An example is research showing the impact of men’s opposition to contraception or discordant fertility aspirations on unmet need among women. In contrast to these broader currents, a few researchers have suggested exploring unmet need from the perspective of men (Bankole and Ezeh 1999; Becker 1999; Pearson and Becker 2014). Nonetheless, a focus on men’s perspectives as the outcome in their own right is less frequently found in the research on men and reproductive health.
This study examines themes around men and contraception using DHS data from 18 countries in Africa, Asia, and Latin America and the Caribbean. The study updates selected findings from an earlier report on men’s reproductive health (Johnson and Gu 2009) while presenting new data on additional areas of interest. The study uses data from men’s surveys, rather than women’s reports about their partners or matched-couples data. It presents findings related to men’s contraceptive knowledge; fertility and fertility preferences; sex preference of desired children; attitudes toward contraception; gender attitudes; and use of contraception. A particular focus is control of the method of contraception, i.e., whether men report use of a male-controlled/cooperative method or a female-controlled method. Throughout the study, we present data on current patterns in study countries, trends over time, and associations with relationship and life course factors and socioeconomic characteristics.

3
2. Methods and Data
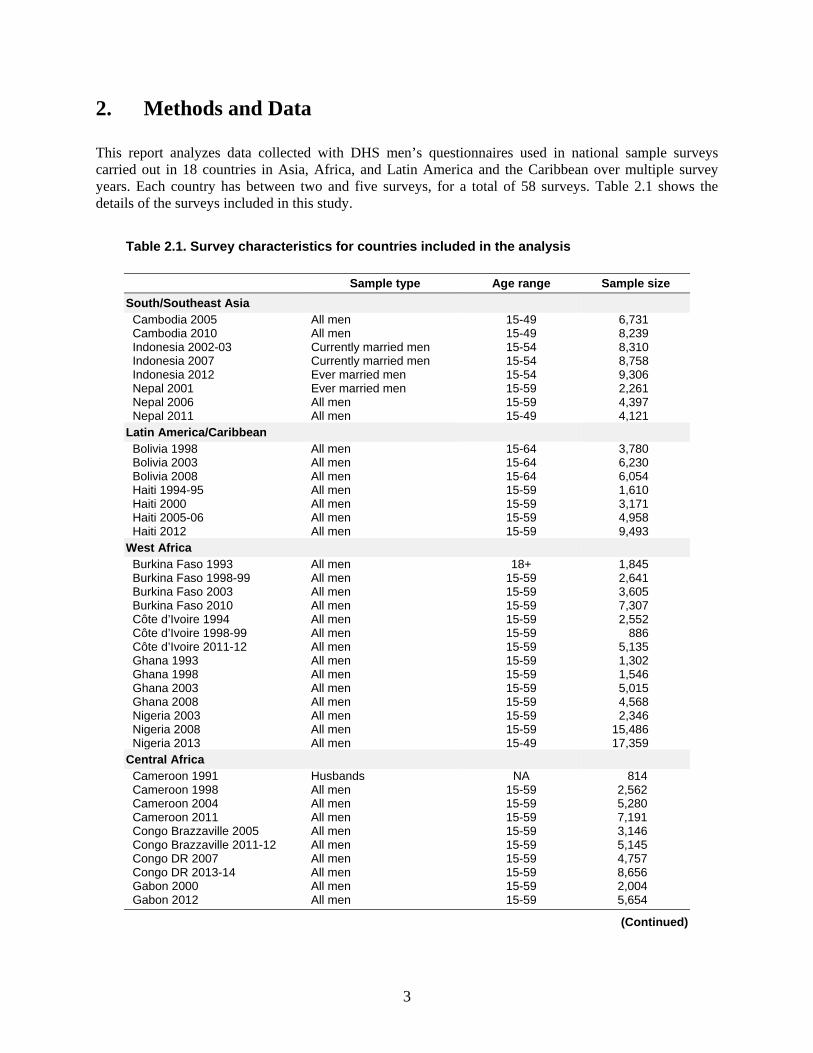
This report analyzes data collected with DHS men’s questionnaires used in national sample surveys carried out in 18 countries in Asia, Africa, and Latin America and the Caribbean over multiple survey years. Each country has between two and five surveys, for a total of 58 surveys. Table 2.1 shows the details of the surveys included in this study.
Table 2.1. Survey characteristics for countries included in the analysis
Sample type Age range Sample size
South/Southeast Asia Cambodia 2005 All men 15-49 6,731 Cambodia 2010 All men 15-49 8,239 Indonesia 2002-03 Currently married men 15-54 8,310 Indonesia 2007 Currently married men 15-54 8,758 Indonesia 2012 Ever married men 15-54 9,306 Nepal 2001 Ever married men 15-59 2,261 Nepal 2006 All men 15-59 4,397 Nepal 2011 All men 15-49 4,121
Latin America/Caribbean Bolivia 1998 All men 15-64 3,780 Bolivia 2003 All men 15-64 6,230 Bolivia 2008 All men 15-64 6,054 Haiti 1994-95 All men 15-59 1,610 Haiti 2000 All men 15-59 3,171 Haiti 2005-06 All men 15-59 4,958 Haiti 2012 All men 15-59 9,493
West Africa Burkina Faso 1993 All men 18+ 1,845 Burkina Faso 1998-99 All men 15-59 2,641 Burkina Faso 2003 All men 15-59 3,605 Burkina Faso 2010 All men 15-59 7,307 Côte d’Ivoire 1994 All men 15-59 2,552 Côte d’Ivoire 1998-99 All men 15-59 886 Côte d’Ivoire 2011-12 All men 15-59 5,135 Ghana 1993 All men 15-59 1,302 Ghana 1998 All men 15-59 1,546 Ghana 2003 All men 15-59 5,015 Ghana 2008 All men 15-59 4,568 Nigeria 2003 All men 15-59 2,346 Nigeria 2008 All men 15-59 15,486 Nigeria 2013 All men 15-49 17,359
Central Africa Cameroon 1991 Husbands NA 814 Cameroon 1998 All men 15-59 2,562 Cameroon 2004 All men 15-59 5,280 Cameroon 2011 All men 15-59 7,191 Congo Brazzaville 2005 All men 15-59 3,146 Congo Brazzaville 2011-12 All men 15-59 5,145 Congo DR 2007 All men 15-59 4,757 Congo DR 2013-14 All men 15-59 8,656 Gabon 2000 All men 15-59 2,004 Gabon 2012 All men 15-59 5,654
(Continued)
4
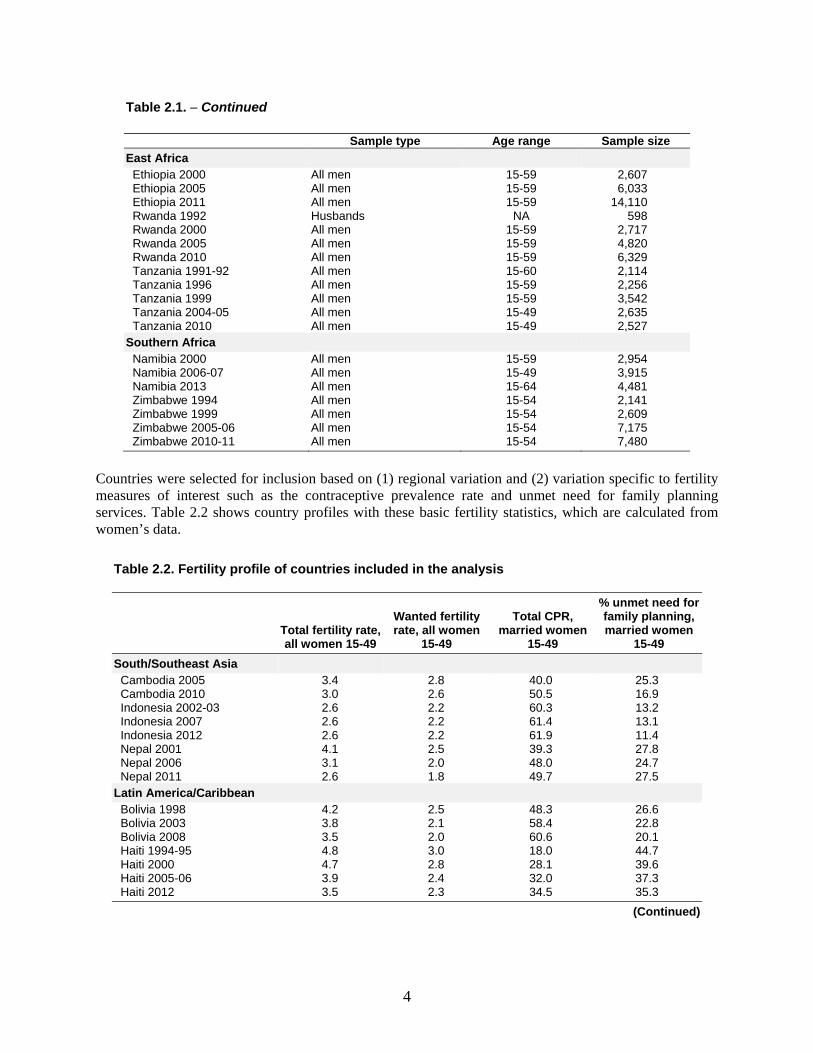
Table 2.1. − Continued
Sample type Age range Sample size
East Africa Ethiopia 2000 All men 15-59 2,607 Ethiopia 2005 All men 15-59 6,033 Ethiopia 2011 All men 15-59 14,110 Rwanda 1992 Husbands NA 598 Rwanda 2000 All men 15-59 2,717 Rwanda 2005 All men 15-59 4,820 Rwanda 2010 All men 15-59 6,329 Tanzania 1991-92 All men 15-60 2,114 Tanzania 1996 All men 15-59 2,256 Tanzania 1999 All men 15-59 3,542 Tanzania 2004-05 All men 15-49 2,635 Tanzania 2010 All men 15-49 2,527
Southern Africa Namibia 2000 All men 15-59 2,954 Namibia 2006-07 All men 15-49 3,915 Namibia 2013 All men 15-64 4,481 Zimbabwe 1994 All men 15-54 2,141 Zimbabwe 1999 All men 15-54 2,609 Zimbabwe 2005-06 All men 15-54 7,175 Zimbabwe 2010-11 All men 15-54 7,480
Countries were selected for inclusion based on (1) regional variation and (2) variation specific to fertility measures of interest such as the contraceptive prevalence rate and unmet need for family planning services. Table 2.2 shows country profiles with these basic fertility statistics, which are calculated from women’s data.
Table 2.2. Fertility profile of countries included in the analysis
Total fertility rate, all women 15-49
Wanted fertility rate, all women
15-49
Total CPR, married women
15-49
% unmet need for family planning, married women
15-49
South/Southeast Asia Cambodia 2005 3.4 2.8 40.0 25.3 Cambodia 2010 3.0 2.6 50.5 16.9 Indonesia 2002-03 2.6 2.2 60.3 13.2 Indonesia 2007 2.6 2.2 61.4 13.1 Indonesia 2012 2.6 2.2 61.9 11.4 Nepal 2001 4.1 2.5 39.3 27.8 Nepal 2006 3.1 2.0 48.0 24.7 Nepal 2011 2.6 1.8 49.7 27.5
Latin America/Caribbean Bolivia 1998 4.2 2.5 48.3 26.6 Bolivia 2003 3.8 2.1 58.4 22.8 Bolivia 2008 3.5 2.0 60.6 20.1 Haiti 1994-95 4.8 3.0 18.0 44.7 Haiti 2000 4.7 2.8 28.1 39.6 Haiti 2005-06 3.9 2.4 32.0 37.3 Haiti 2012 3.5 2.3 34.5 35.3
(Continued)
5
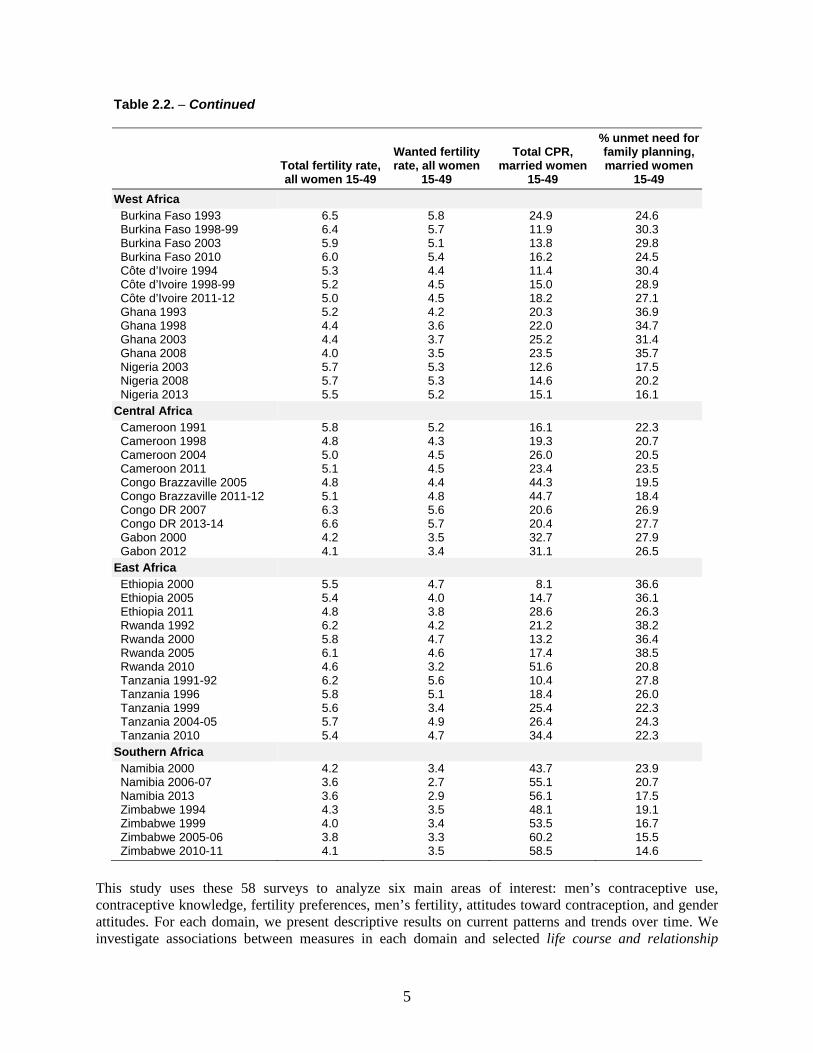
Table 2.2. − Continued
Total fertility rate, all women 15-49
Wanted fertility rate, all women
15-49
Total CPR, married women
15-49
% unmet need for family planning, married women
15-49
West Africa Burkina Faso 1993 6.5 5.8 24.9 24.6 Burkina Faso 1998-99 6.4 5.7 11.9 30.3 Burkina Faso 2003 5.9 5.1 13.8 29.8 Burkina Faso 2010 6.0 5.4 16.2 24.5 Côte d’Ivoire 1994 5.3 4.4 11.4 30.4 Côte d’Ivoire 1998-99 5.2 4.5 15.0 28.9 Côte d’Ivoire 2011-12 5.0 4.5 18.2 27.1 Ghana 1993 5.2 4.2 20.3 36.9 Ghana 1998 4.4 3.6 22.0 34.7 Ghana 2003 4.4 3.7 25.2 31.4 Ghana 2008 4.0 3.5 23.5 35.7 Nigeria 2003 5.7 5.3 12.6 17.5 Nigeria 2008 5.7 5.3 14.6 20.2 Nigeria 2013 5.5 5.2 15.1 16.1
Central Africa Cameroon 1991 5.8 5.2 16.1 22.3 Cameroon 1998 4.8 4.3 19.3 20.7 Cameroon 2004 5.0 4.5 26.0 20.5 Cameroon 2011 5.1 4.5 23.4 23.5 Congo Brazzaville 2005 4.8 4.4 44.3 19.5 Congo Brazzaville 2011-12 5.1 4.8 44.7 18.4 Congo DR 2007 6.3 5.6 20.6 26.9 Congo DR 2013-14 6.6 5.7 20.4 27.7 Gabon 2000 4.2 3.5 32.7 27.9 Gabon 2012 4.1 3.4 31.1 26.5
East Africa Ethiopia 2000 5.5 4.7 8.1 36.6 Ethiopia 2005 5.4 4.0 14.7 36.1 Ethiopia 2011 4.8 3.8 28.6 26.3 Rwanda 1992 6.2 4.2 21.2 38.2 Rwanda 2000 5.8 4.7 13.2 36.4 Rwanda 2005 6.1 4.6 17.4 38.5 Rwanda 2010 4.6 3.2 51.6 20.8 Tanzania 1991-92 6.2 5.6 10.4 27.8 Tanzania 1996 5.8 5.1 18.4 26.0 Tanzania 1999 5.6 3.4 25.4 22.3 Tanzania 2004-05 5.7 4.9 26.4 24.3 Tanzania 2010 5.4 4.7 34.4 22.3
Southern Africa Namibia 2000 4.2 3.4 43.7 23.9 Namibia 2006-07 3.6 2.7 55.1 20.7 Namibia 2013 3.6 2.9 56.1 17.5 Zimbabwe 1994 4.3 3.5 48.1 19.1 Zimbabwe 1999 4.0 3.4 53.5 16.7 Zimbabwe 2005-06 3.8 3.3 60.2 15.5 Zimbabwe 2010-11 4.1 3.5 58.5 14.6
This study uses these 58 surveys to analyze six main areas of interest: men’s contraceptive use, contraceptive knowledge, fertility preferences, men’s fertility, attitudes toward contraception, and gender attitudes. For each domain, we present descriptive results on current patterns and trends over time. We investigate associations between measures in each domain and selected life course and relationship
6
factors and socioeconomic characteristics. The strength of these associations is assessed using χ2 tests. The purpose of this report is to describe factors related to men’s contraceptive behavior primarily using univariate and bivariate statistics; no causal relationships are investigated nor inferred. Additionally, any statistical association detected in bivariate analyses may no longer hold if one or several other measures were to be taken into account.
DHS surveys are household-based, cross-sectional surveys of eligible individuals. Eligible respondents in the men’s survey are typically all men age 15-59. Common variations in these eligibility criteria are (1) a restriction of the sample to currently married or ever-married men and (2) an expansion or contraction of the eligible age range. The survey type and sample size are presented in Table 2.1 for all surveys used in our analyses.
Surveys are representative at the national level, for urban and rural areas, and typically at one or more subnational regional levels. Samples are not drawn through a simple, random sample but rather through a clustered area sampling technique. In the first sampling stage, primary sampling units (enumeration areas) are randomly selected usually from a recent census. In the second stage, approximately 30 households in each primary sampling unit are selected at random and interviews are attempted with each eligible respondent in selected households. In some countries, the men’s survey is a sub-sample in which eligible men are interviewed only in every second or third selected household. Some geographic areas may be oversampled to ensure sufficient cases to calculate key indicators. In this study, we apply weights to correct for such under- or oversampling and account for clustering of cases in primary sampling units by calculating robust standard errors as the basis for 95% confidence intervals reported in the following sections.
2.1. Measures
DHS surveys apply standard core questionnaires for household, women’s, and men’s interviews (ICF International 2011). The analyses in this report use data collected only with the men’s questionnaire and draw primarily from section 2 on Contraception, section 3 on Marriage and Sexual Activity, section 5 on Fertility Preferences, and section 6 on Employment and Gender Roles. Although the men’s questionnaire is standardized, there are country-specific variations and omissions in some surveys. Therefore, selected surveys are occasionally excluded from one or more analyses in this study. The measures we use are described below.
2.1.1. Contraceptive use
Men were asked whether, at the time of their last sexual intercourse, (1) they used a condom1, and (2) they or their partner used something to prevent a pregnancy. These questions are used to construct a measure of contraceptive use at last sex. Specifically, from responses to both questions, the most effective of the reported methods is captured as the contraceptive method used at last sex, with the order of effectiveness ranked as female sterilization, male sterilization, intrauterine device (IUD), injectables, implants, pill, male condom, female condom, diaphragm, foam/jelly, standard days method, lactational amenorrhea method, periodic abstinence (rhythm method), withdrawal, other modern method, and other traditional method (Trussell 2011; WHO/RHR and JHU/CCP 2011; ICF International 2015).
1 Data on condom use at last sex may be underestimated because men who had sex more than 12 months before the survey were not explicitly asked about condom use at last sex. Additionally, among men whose last sex was more than a year ago, those who reported having used a condom were recorded as having used an “other modern method”.
7
In eight surveys, the standard questions on contraceptive use at last sex were replaced with questions asking men whether they or their partner are currently using a contraceptive method. In these surveys men’s responses to the questions on current use are used as a proxy for the contraceptive use at last sex measure. The surveys are: Indonesia 2012, 2007, 2002-03; Burkina Faso 2003; Ghana 1993; Tanzania 1991-92; Rwanda 1992; and Haiti 1994-95.
We report on any contraceptive use at last sex and use of a modern versus a traditional method of contraception at last sex. We also report on contraceptive use at last sex on the basis of the level of control each partner has over its use. Each of the contraceptive methods is categorized as either a male-controlled or cooperative method or a female-controlled method. Male-controlled and cooperative methods include: male condom (usually referred to simply as “condom”), male sterilization, periodic abstinence, and withdrawal; female-controlled methods include: the pill, IUD, injectables, diaphragm, female sterilization, implants, lactational amenorrhea, female condom, foam and jelly, and other methods that did not fall under any other category. When reporting use of individual contraceptive methods, we present data on the use of condom (male), pill, injectables, implants, IUD, female sterilization, male sterilization, periodic abstinence, withdrawal, and an “other” category that combines all other methods of contraception.
2.1.2. Contraceptive knowledge
Men’s knowledge of contraceptive methods is based on their response to the question, “Now I would like to talk to you about family planning – the various ways or methods that a couple can use to delay or avoid a pregnancy. Have you heard of (METHOD)?” Knowledge of each of 13 methods was collected in this fashion from men in 16 of the 18 countries. These questions were not asked in the most recent surveys conducted in Cambodia and Haiti. To capture broad contraceptive knowledge, all relevant contraceptive methods listed in the survey are included, including modern and traditional methods, and whether they had heard of any folkloric or local methods2.
Two measures of knowledge are developed based on these data:
1. Mean number of contraceptive methods known: Responses to this question are recoded to calculate the total number of methods known and averaged over all respondents in a given country to obtain a country average.
2. Knowledge of male- and female-controlled contraceptive methods: For each country, the proportion of male respondents who report knowing only a male-controlled or cooperatively controlled method, knowing only a female-controlled method, knowing both male- and female-controlled methods, and not knowing any method are calculated.
2.1.3. Fertility preferences
Men’s fertility preferences are quantified, first as mean ideal number of children, based on their responses to the question, “If you could go back to the time you did not have any children and could choose exactly the number of children to have in your whole life, how many would that be?” (if they already had
2 The modern contraceptive methods included in the standard DHS questionnaire are female and male sterilization, IUD, implants, injectables, contraceptive pill, male condom, female condom, emergency contraception. Traditional methods are rhythm, withdrawal, and other local methods that the man may be familiar with (including periodic abstinence and local methods).
8
children) or “If you could choose exactly the number of children to have in your whole life, how many would that be?” (if they had not yet had any children).
Men who answered that they wanted at least one child are then categorized into two groups based on their responses to a subsequent question on sex preference, “How many of these children would you like to be boys, how many would you like to be girls, and for how many would it not matter if it’s a boy or a girl?” The first group consists of men who have a specific desired sex for all of their desired children (“complete sex preference”); the second group consists of men who state that the sex of at least one of their desired children does not matter (“no or some sex preference”). This categorization is selected based on the high proportion of men who fall into the two extremes—no or complete sex preference—and the desire to isolate men with the most specific, gendered fertility desires.
Men who exhibit complete sex preference for their ideal number of children are then divided into five categories of gendered fertility preferences—men who want only boys, mainly boys, equal numbers of boys and girls, mainly girls, or only girls.
2.1.4. Attitudes toward contraception
Three measures are used to assess men’s attitudes toward contraception across those study countries where these data are available. Men were asked if they agreed or disagreed with each of three attitudinal statements. In each case, responses are coded such that higher percentages reflect positive attitudes toward contraceptive use. Those with positive attitudes are assigned a value of one and those with negative attitudes are assigned a value of zero. The measures include the percentage of men who:
1. disagree that women who use contraception may become promiscuous
2. disagree that contraception is a woman’s business and a man should not have to worry about it
3. approve of couples using contraception to avoid getting pregnant
The third measure was predominantly used in DHS surveys administered between 1991 and 2003, while the first and second measures were used from 2001 onward. While the earlier statement is a gender-blind measure reflecting general attitudes toward contraceptive use, the later statements incorporate gender attitudes related to contraception.
In addition to reporting on patterns and trends for each of these three measures separately, we also create a contraceptive attitudes score. This is an additive score that, like the individual measures, has a positive valence. Therefore, it measures disagreement with the two statements commonly used in current surveys: (1) women who use contraception may become promiscuous and (2) contraception is a woman’s business and a man should not have to worry about it. The score ranges from 0 to 2, with 0 representing men who agree with both statements and 2 indicating men who disagree with both statements.
2.1.5. Gender attitudes
Men’s questionnaires in DHS surveys typically collect data on at least three dimensions of gender: attitudes toward wife beating; attitudes toward women negotiating safer sex; and women’s decision-making. Women’s decision-making is based on a series of items inquiring about decisions ranging from household purchases, what food to cook, visiting friends or relatives, or seeking health care. In most
9
recent surveys, these items inquired about actual decision-making behavior and were asked only of currently married men3, for example, “Who usually makes decisions about making major household purchases: you, your (wife/partner), you and your (wife/partner) jointly, or someone else?” In some earlier surveys, these items were attitudinal questions asked of all men, for example, “In a couple, who do you think should have the greater say about making major household purchases?” The number of decision-making items and which decision-making items were included also vary from survey to survey. The high variability in the wording of questions and the sample to whom questions were administered make the decision-making dimension unsuitable for comparison across countries or over time.
Instead, we examine two other dimensions of men’s gender attitudes: (1) accepting attitudes toward wife beating; and (2) accepting attitudes toward women’s ability to negotiate safer sex, an element of women’s sexual agency—i.e. the capability of women to make and enact decisions, about one’s sexuality and sex life according to one’s will and free from coercion, in ways that accomplishes one’s goals or produces desired results.
Attitudes toward wife beating
All interviewed men, regardless of marital status, are asked4:
“In your opinion, is a husband justified in hitting or beating his wife in the following situations:
If she goes out without telling him?
If she neglects the children?
If she argues with him?
If she refuses to have sex with him?
If she burns the food?”
We construct two measures of attitudes toward wife beating in these five scenarios. First, we create a dichotomous measure which distinguishes men who find wife beating to be acceptable in at least one of the described scenarios from those who find wife beating to be unacceptable in any of the listed scenarios. Secondly, we report on the number of scenarios in which men find wife beating to be acceptable.
Sexual agency attitudes
Men’s attitudes toward women’s sexual agency, specifically toward women’s ability to negotiate safer sex, are assessed with a single item based on the question:
3 In this report, married men include both those who have had a formal marriage and those living in union as if married. 4 In the Nepal 2011 DHS, a filter question was applied before asking if wife beating was justified in this list of five scenarios. Respondents were first asked a general question, “In your opinion, should a husband hit or beat his wife for any reason at all?” Only men who answered, “yes,” to this question were then asked about the five listed scenarios. Men who answered, “no,” are considered to disagree that wife beating is justified in any of the five scenarios. For this reason, this measure in Nepal is not comparable with that in the other study countries or in earlier Nepal DHS surveys.

10
“If a wife knows her husband has a disease that she can get during sexual intercourse, is she justified in asking that they use a condom when they have sex?”
When included, this item was asked with consistent wording over multiple surveys within and across countries. We report on the current prevalence of agreement with this item, trends over time, and associations with various background characteristics.
11
3. Men’s Knowledge of Contraception
Men’s knowledge of contraception is a key driver of whether men will use contraception and what method they choose. It may also influence overall contraceptive prevalence rates, particularly in contexts where women have limited autonomy over their health care and reproductive behavior. Both men’s overall knowledge of contraceptive methods and the variety of methods they are familiar with may be important, particularly in terms of the level of control they are able to exert over use of the method.
3.1. Mean Number of Contraceptive Methods Known
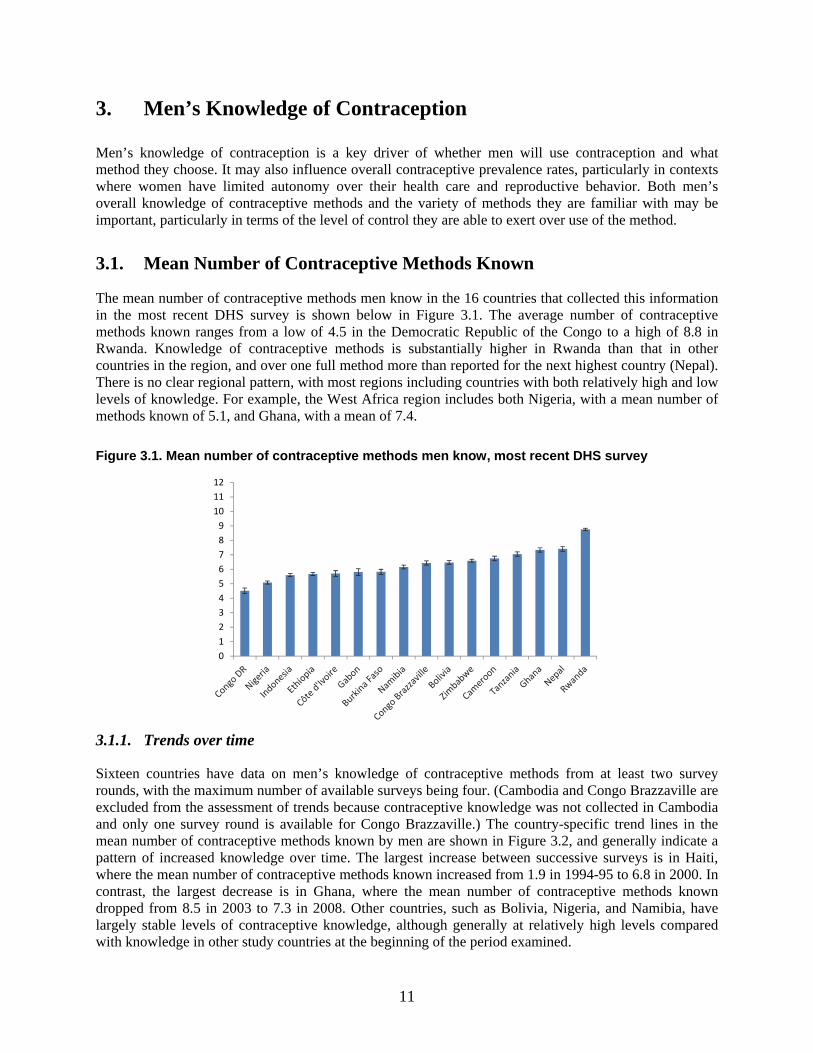
The mean number of contraceptive methods men know in the 16 countries that collected this information in the most recent DHS survey is shown below in Figure 3.1. The average number of contraceptive methods known ranges from a low of 4.5 in the Democratic Republic of the Congo to a high of 8.8 in Rwanda. Knowledge of contraceptive methods is substantially higher in Rwanda than that in other countries in the region, and over one full method more than reported for the next highest country (Nepal). There is no clear regional pattern, with most regions including countries with both relatively high and low levels of knowledge. For example, the West Africa region includes both Nigeria, with a mean number of methods known of 5.1, and Ghana, with a mean of 7.4.
Figure 3.1. Mean number of contraceptive methods men know, most recent DHS survey
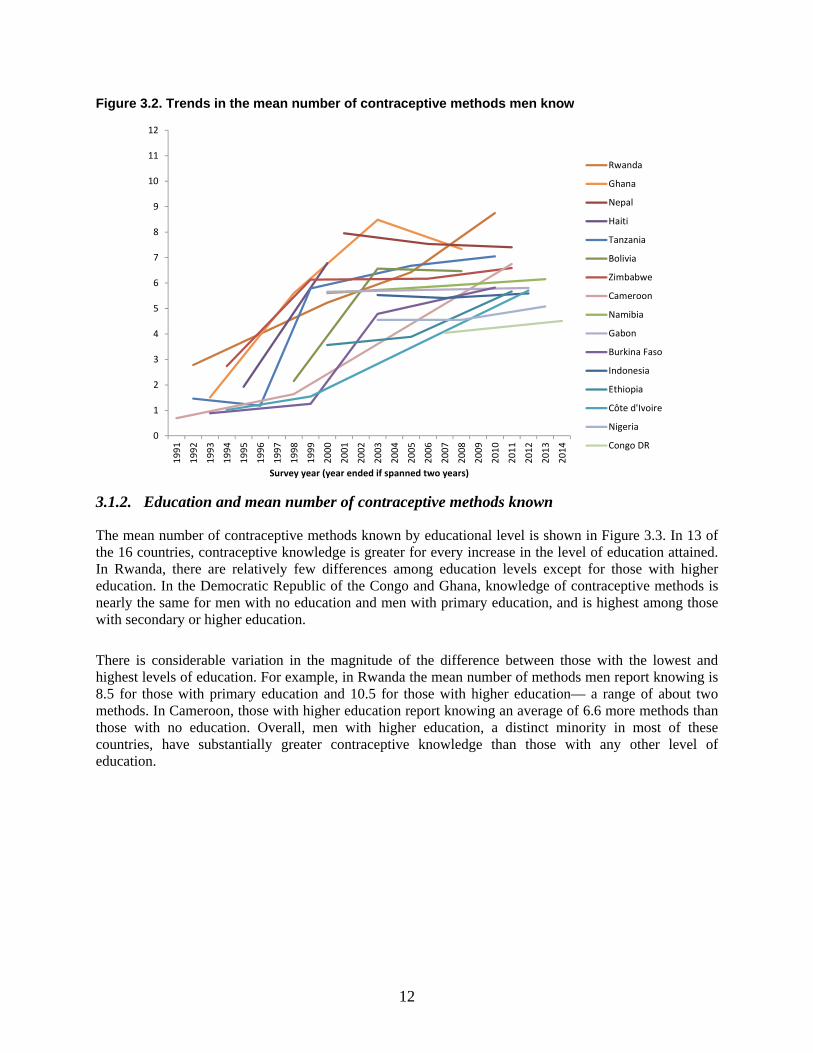
3.1.1. Trends over time
Sixteen countries have data on men’s knowledge of contraceptive methods from at least two survey rounds, with the maximum number of available surveys being four. (Cambodia and Congo Brazzaville are excluded from the assessment of trends because contraceptive knowledge was not collected in Cambodia and only one survey round is available for Congo Brazzaville.) The country-specific trend lines in the mean number of contraceptive methods known by men are shown in Figure 3.2, and generally indicate a pattern of increased knowledge over time. The largest increase between successive surveys is in Haiti, where the mean number of contraceptive methods known increased from 1.9 in 1994-95 to 6.8 in 2000. In contrast, the largest decrease is in Ghana, where the mean number of contraceptive methods known dropped from 8.5 in 2003 to 7.3 in 2008. Other countries, such as Bolivia, Nigeria, and Namibia, have largely stable levels of contraceptive knowledge, although generally at relatively high levels compared with knowledge in other study countries at the beginning of the period examined.
0123456789
101112
12
Figure 3.2. Trends in the mean number of contraceptive methods men know
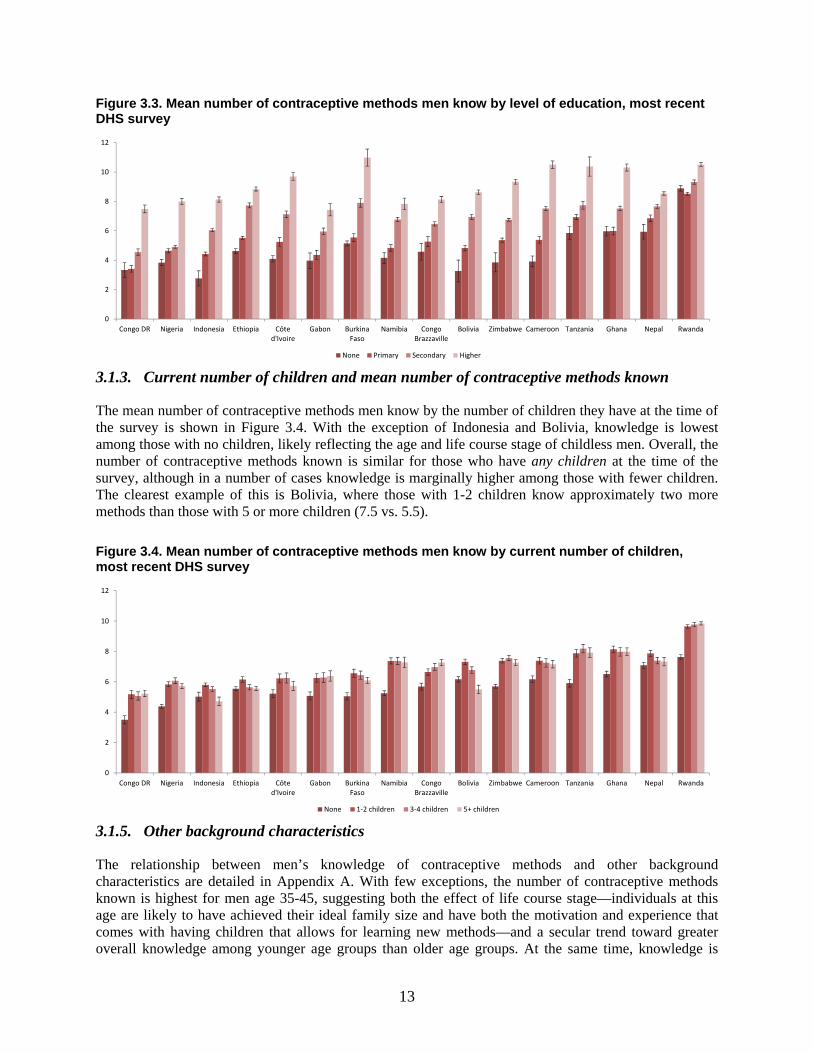
3.1.2. Education and mean number of contraceptive methods known
The mean number of contraceptive methods known by educational level is shown in Figure 3.3. In 13 of the 16 countries, contraceptive knowledge is greater for every increase in the level of education attained. In Rwanda, there are relatively few differences among education levels except for those with higher education. In the Democratic Republic of the Congo and Ghana, knowledge of contraceptive methods is nearly the same for men with no education and men with primary education, and is highest among those with secondary or higher education.
There is considerable variation in the magnitude of the difference between those with the lowest and highest levels of education. For example, in Rwanda the mean number of methods men report knowing is 8.5 for those with primary education and 10.5 for those with higher education— a range of about two methods. In Cameroon, those with higher education report knowing an average of 6.6 more methods than those with no education. Overall, men with higher education, a distinct minority in most of these countries, have substantially greater contraceptive knowledge than those with any other level of education.
0
1
2
3
4
5
6
7
8
9
10
11
12
1991
1992
1993
1994
1995
1996
1997
1998
1999
2000
2001
2002
2003
2004
2005
2006
2007
2008
2009
2010
2011
2012
2013
2014
Survey year (year ended if spanned two years)
Rwanda
Ghana
Nepal
Haiti
Tanzania
Bolivia
Zimbabwe
Cameroon
Namibia
Gabon
Burkina Faso
Indonesia
Ethiopia
Côte d'Ivoire
Nigeria
Congo DR
13
Figure 3.3. Mean number of contraceptive methods men know by level of education, most recent DHS survey
3.1.3. Current number of children and mean number of contraceptive methods known
The mean number of contraceptive methods men know by the number of children they have at the time of the survey is shown in Figure 3.4. With the exception of Indonesia and Bolivia, knowledge is lowest among those with no children, likely reflecting the age and life course stage of childless men. Overall, the number of contraceptive methods known is similar for those who have any children at the time of the survey, although in a number of cases knowledge is marginally higher among those with fewer children. The clearest example of this is Bolivia, where those with 1-2 children know approximately two more methods than those with 5 or more children (7.5 vs. 5.5).
Figure 3.4. Mean number of contraceptive methods men know by current number of children, most recent DHS survey
3.1.5. Other background characteristics
The relationship between men’s knowledge of contraceptive methods and other background characteristics are detailed in Appendix A. With few exceptions, the number of contraceptive methods known is highest for men age 35-45, suggesting both the effect of life course stage—individuals at this age are likely to have achieved their ideal family size and have both the motivation and experience that comes with having children that allows for learning new methods—and a secular trend toward greater overall knowledge among younger age groups than older age groups. At the same time, knowledge is
0
2
4
6
8
10
12
Congo DR Nigeria Indonesia Ethiopia Côted'Ivoire
Gabon BurkinaFaso
Namibia CongoBrazzaville
Bolivia Zimbabwe Cameroon Tanzania Ghana Nepal Rwanda
None Primary Secondary Higher
0
2
4
6
8
10
12
Congo DR Nigeria Indonesia Ethiopia Côted'Ivoire
Gabon BurkinaFaso
Namibia CongoBrazzaville
Bolivia Zimbabwe Cameroon Tanzania Ghana Nepal Rwanda
None 1-2 children 3-4 children 5+ children
14
lowest among those who have never been married, although in most countries there is little difference between those who are currently married and those who are formerly married, again likely reflecting life course stage and accumulated life experience. Knowledge of contraceptive methods among men in monogamous and polygamous marriages is similar, although knowledge is slightly higher for those in monogamous relationships in all countries.
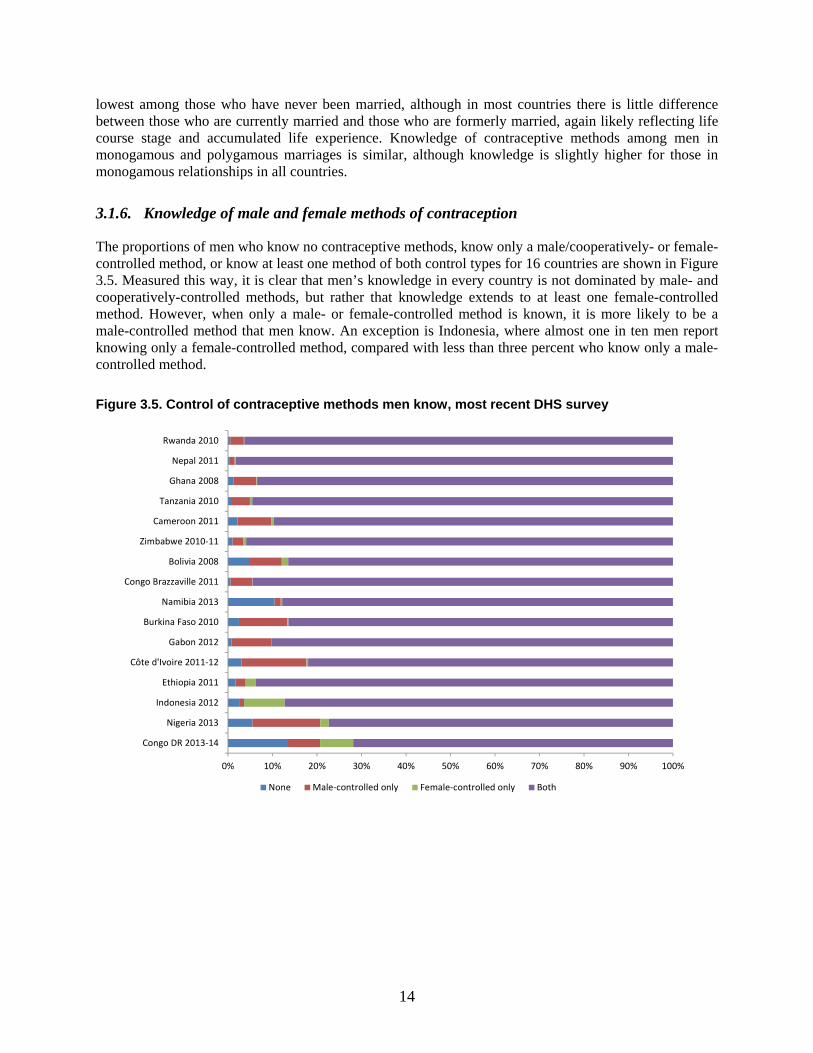
3.1.6. Knowledge of male and female methods of contraception
The proportions of men who know no contraceptive methods, know only a male/cooperatively- or female-controlled method, or know at least one method of both control types for 16 countries are shown in Figure 3.5. Measured this way, it is clear that men’s knowledge in every country is not dominated by male- and cooperatively-controlled methods, but rather that knowledge extends to at least one female-controlled method. However, when only a male- or female-controlled method is known, it is more likely to be a male-controlled method that men know. An exception is Indonesia, where almost one in ten men report knowing only a female-controlled method, compared with less than three percent who know only a male-controlled method.
Figure 3.5. Control of contraceptive methods men know, most recent DHS survey
0% 10% 20% 30% 40% 50% 60% 70% 80% 90% 100%
Congo DR 2013-14
Nigeria 2013
Indonesia 2012
Ethiopia 2011
Côte d'Ivoire 2011-12
Gabon 2012
Burkina Faso 2010
Namibia 2013
Congo Brazzaville 2011
Bolivia 2008
Zimbabwe 2010-11
Cameroon 2011
Tanzania 2010
Ghana 2008
Nepal 2011
Rwanda 2010
None Male-controlled only Female-controlled only Both
15
4. Men’s Fertility Preferences
We examine three dimensions of men’s fertility preferences: (1) mean ideal number of children, (2) among men who wanted at least one child, the proportion who express a preference for the sex of all of their desired children (what we term “complete” sex preference), and (3) among men with complete sex preference for their desired children, the sex breakdown of that preference.
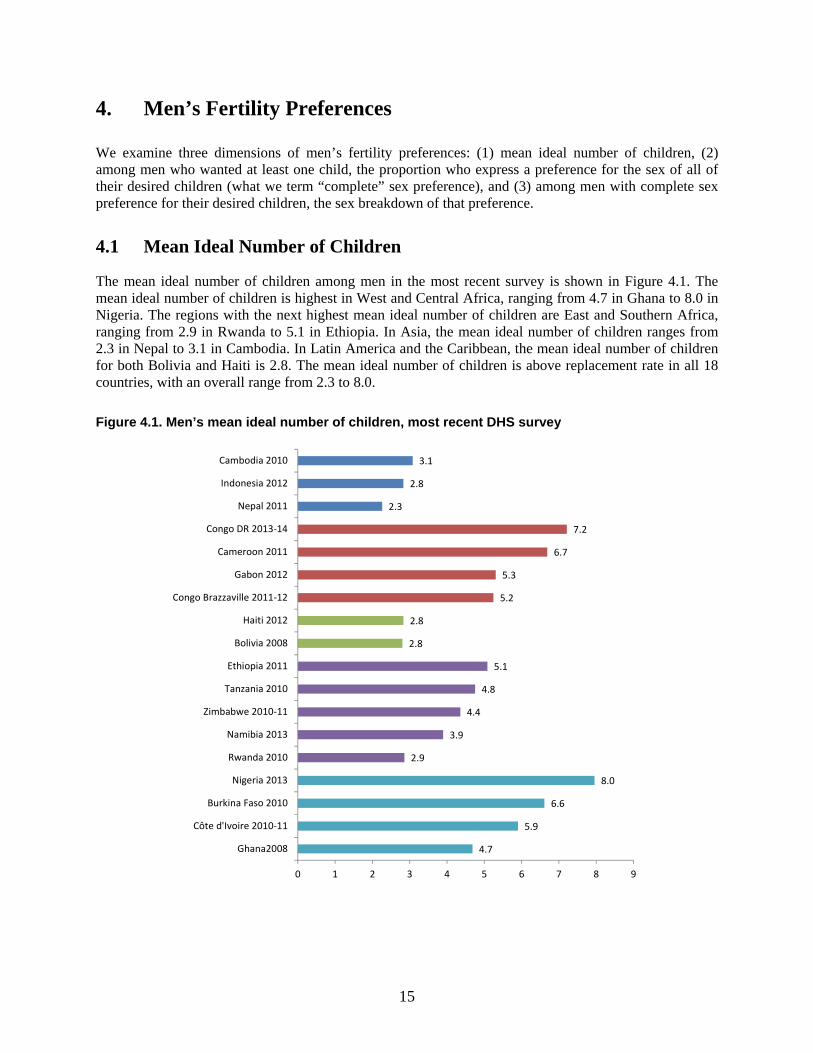
4.1 Mean Ideal Number of Children
The mean ideal number of children among men in the most recent survey is shown in Figure 4.1. The mean ideal number of children is highest in West and Central Africa, ranging from 4.7 in Ghana to 8.0 in Nigeria. The regions with the next highest mean ideal number of children are East and Southern Africa, ranging from 2.9 in Rwanda to 5.1 in Ethiopia. In Asia, the mean ideal number of children ranges from 2.3 in Nepal to 3.1 in Cambodia. In Latin America and the Caribbean, the mean ideal number of children for both Bolivia and Haiti is 2.8. The mean ideal number of children is above replacement rate in all 18 countries, with an overall range from 2.3 to 8.0.
Figure 4.1. Men’s mean ideal number of children, most recent DHS survey
4.7
5.9
6.6
8.0
2.9
3.9
4.4
4.8
5.1
2.8
2.8
5.2
5.3
6.7
7.2
2.3
2.8
3.1
0 1 2 3 4 5 6 7 8 9
Ghana2008
Côte d'Ivoire 2010-11
Burkina Faso 2010
Nigeria 2013
Rwanda 2010
Namibia 2013
Zimbabwe 2010-11
Tanzania 2010
Ethiopia 2011
Bolivia 2008
Haiti 2012
Congo Brazzaville 2011-12
Gabon 2012
Cameroon 2011
Congo DR 2013-14
Nepal 2011
Indonesia 2012
Cambodia 2010
16
4.1.1. Trends in mean ideal number of children
Seventeen countries have data on the ideal number of children from at least two surveys (Cambodia is the exception) and up to five surveys in one country (Tanzania). Of these countries, eight show fluctuations with both increases and decreases in the mean ideal number of children over time. Eight countries (Bolivia, Cameroon, Congo Brazzaville5, Ethiopia, Gabon, Haiti, Nepal, and Tanzania) have decreases exclusively. One country (Democratic Republic of the Congo) suggests a slight increase (from 7.1 in 2007 to 7.2 in 2013-14, an annualized rate of change of 0.01), although this change is not significant. By far the greatest change is in Cameroon, where the mean ideal number of children dropped from 11.2 in 1991 to 6.2 in 2011. This represents an annualized rate of change of -0.23 children per year, which is nearly double the decrease in Ethiopia, the country with the next steepest decline. Here, the mean ideal number of children among men fell at an annualized rate of change of -0.12 from 6.4 in 2000 to 5.1 in 2011.
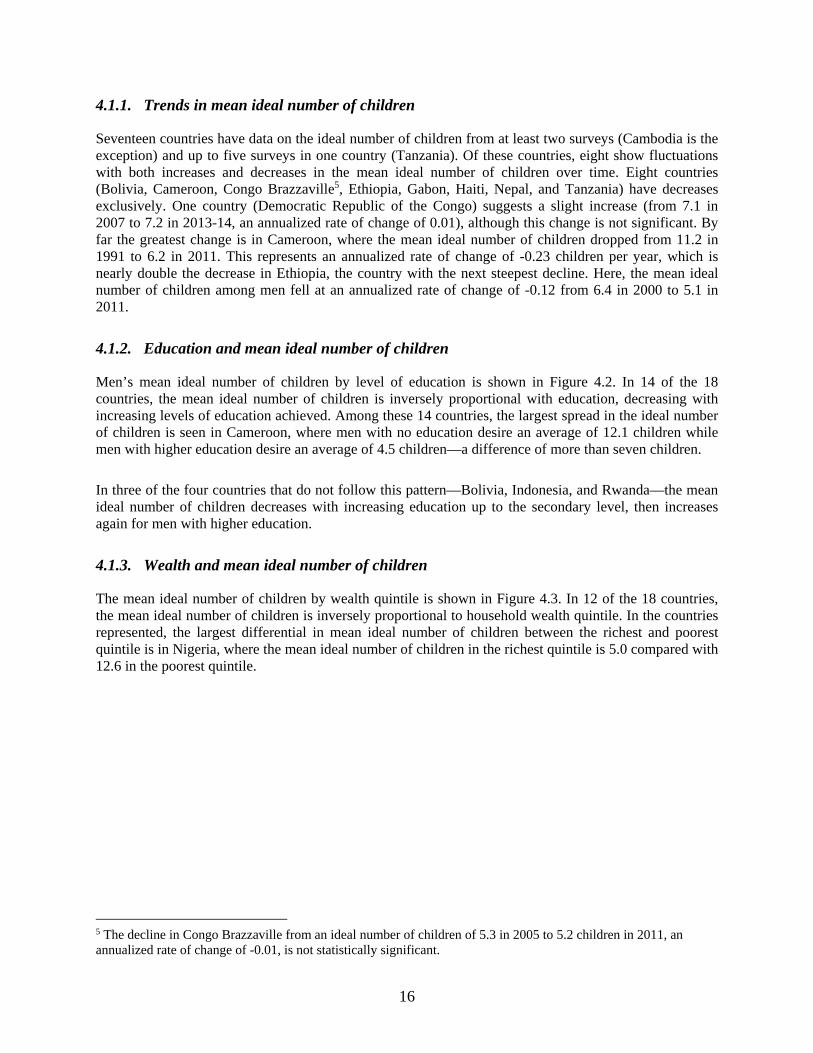
4.1.2. Education and mean ideal number of children
Men’s mean ideal number of children by level of education is shown in Figure 4.2. In 14 of the 18 countries, the mean ideal number of children is inversely proportional with education, decreasing with increasing levels of education achieved. Among these 14 countries, the largest spread in the ideal number of children is seen in Cameroon, where men with no education desire an average of 12.1 children while men with higher education desire an average of 4.5 children—a difference of more than seven children.
In three of the four countries that do not follow this pattern—Bolivia, Indonesia, and Rwanda—the mean ideal number of children decreases with increasing education up to the secondary level, then increases again for men with higher education.
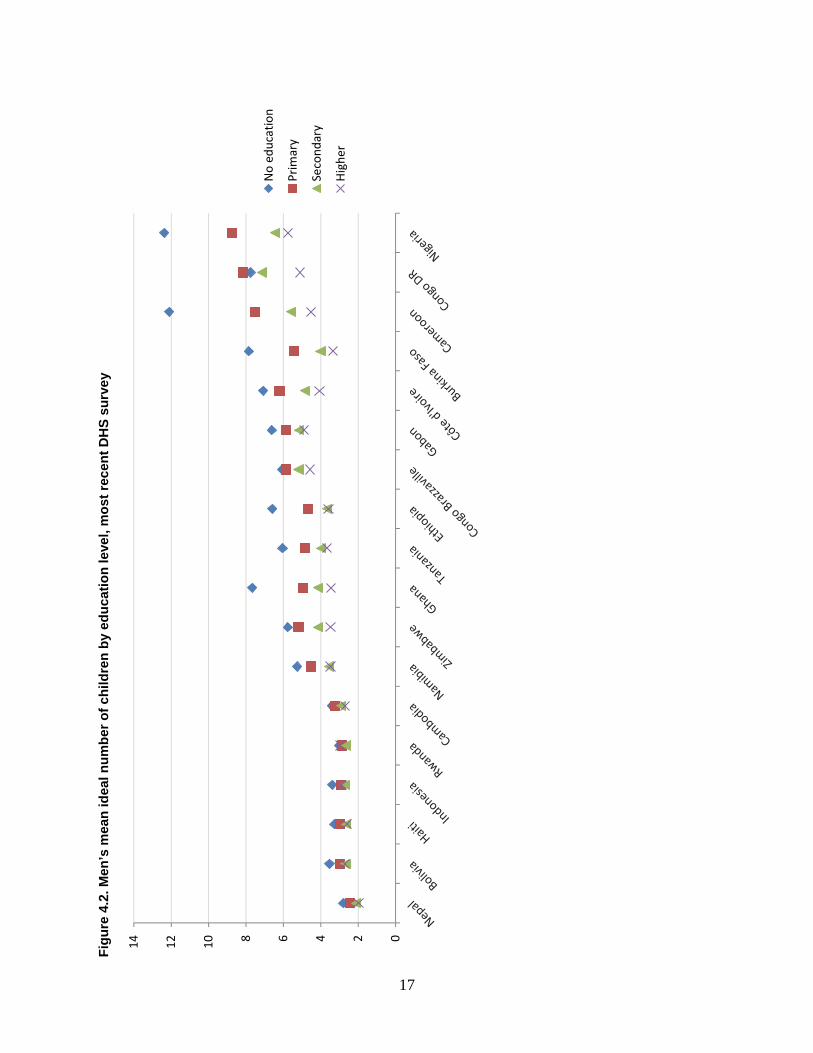
4.1.3. Wealth and mean ideal number of children
The mean ideal number of children by wealth quintile is shown in Figure 4.3. In 12 of the 18 countries, the mean ideal number of children is inversely proportional to household wealth quintile. In the countries represented, the largest differential in mean ideal number of children between the richest and poorest quintile is in Nigeria, where the mean ideal number of children in the richest quintile is 5.0 compared with 12.6 in the poorest quintile.
5 The decline in Congo Brazzaville from an ideal number of children of 5.3 in 2005 to 5.2 children in 2011, an annualized rate of change of -0.01, is not statistically significant.
17
Fig
ure
4.2
. Men
’s m
ean
idea
l nu
mb
er o
f ch
ildre
n b
y ed
uca
tio
n le
vel,
mo
st r
ecen
t D
HS
su
rve
y
02468101214
No
educ
atio
n
Prim
ary
Seco
ndar
y
Hig
her
18
Fig
ure
4.3
. Men
’s m
ean
idea
l nu
mb
er o
f ch
ildre
n b
y w
ealt
h q
uin
tile
, mo
st r
ecen
t D
HS
su
rve
y
02468101214
Poor
est
Poor
er
Mid
dle
Rich
er
Rich
est
19
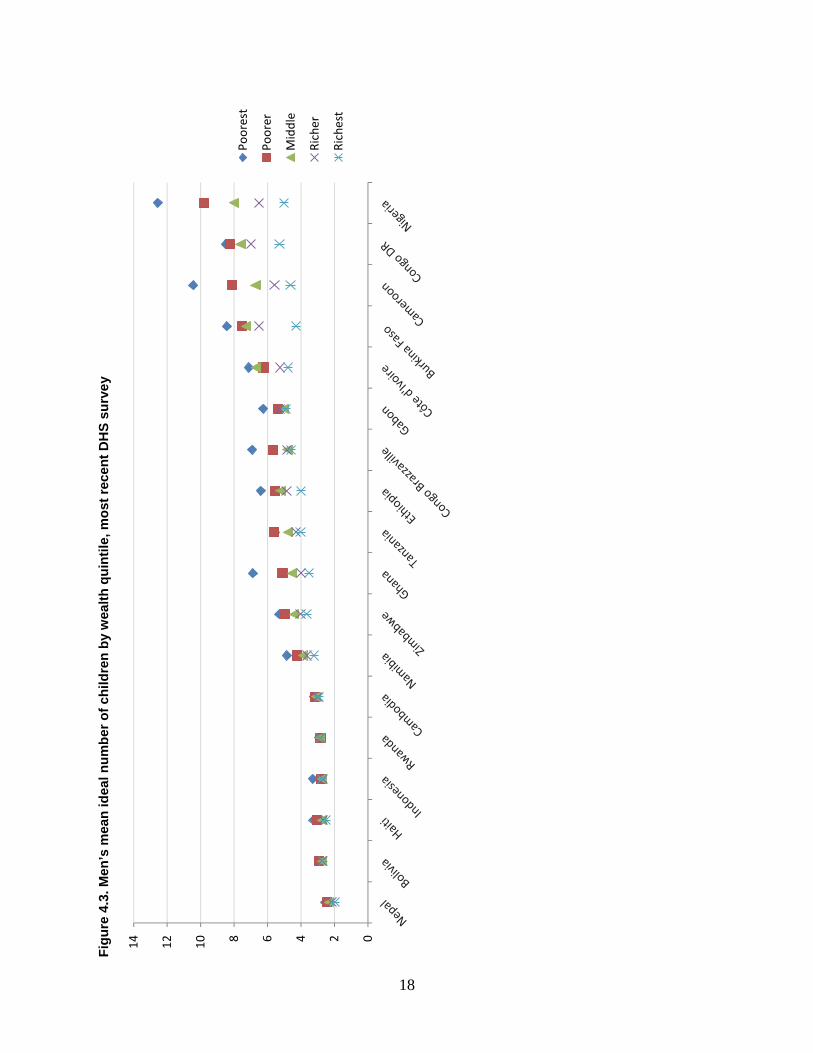
4.1.4. Urban versus rural mean ideal number of children
For the five countries in Asia and Latin America and the Caribbean, Figure 4.4. shows that men’s mean ideal number of children is relatively low and is only slightly higher in rural areas compared with urban areas. In contrast, in all eight countries from West and Central Africa, the mean ideal number of children differs significantly and substantially between urban and rural areas, with men in rural areas desiring one to three more children than men in urban areas, on average. Patterns in East and Southern Africa are mixed. In four of the five countries, men in rural areas desire an average of about one additional child, compared with men in urban areas. In Rwanda, however, there is no significant difference in mean ideal number of children between men in urban and rural areas.
Figure 4.4. Men’s mean ideal number of children by residence, most recent DHS survey
4.1.5. Other background characteristics
We also examine mean ideal number of children by a range of other characteristics; details can be found in Appendix B. There are statistically significant variations by age, current number of children, marital status, and type of union in a majority of study countries. With few exceptions, the mean ideal number of children is higher as age and current number of children increases and lower among monogamous men than polygamous men. The mean ideal number of children is generally higher among currently married men than among never-married men and is higher among formerly married men compared with never-married men in about half of the countries studied.
4.2. Sex Preference for Children
Among men who wanted at least one child, the proportion who desire a specific sex for all children (complete sex preference) ranges from 74% in Tanzania to 96% in Cambodia. There is no apparent association between the mean ideal number of children and complete sex preference. For example, Nigeria, which has the highest mean number of children desired (8.0), and Nepal, which has the lowest (2.3), both have 76% of men expressing complete sex preference for their desired number of children.
0
1
2
3
4
5
6
7
8
9
10
Urban Rural
20
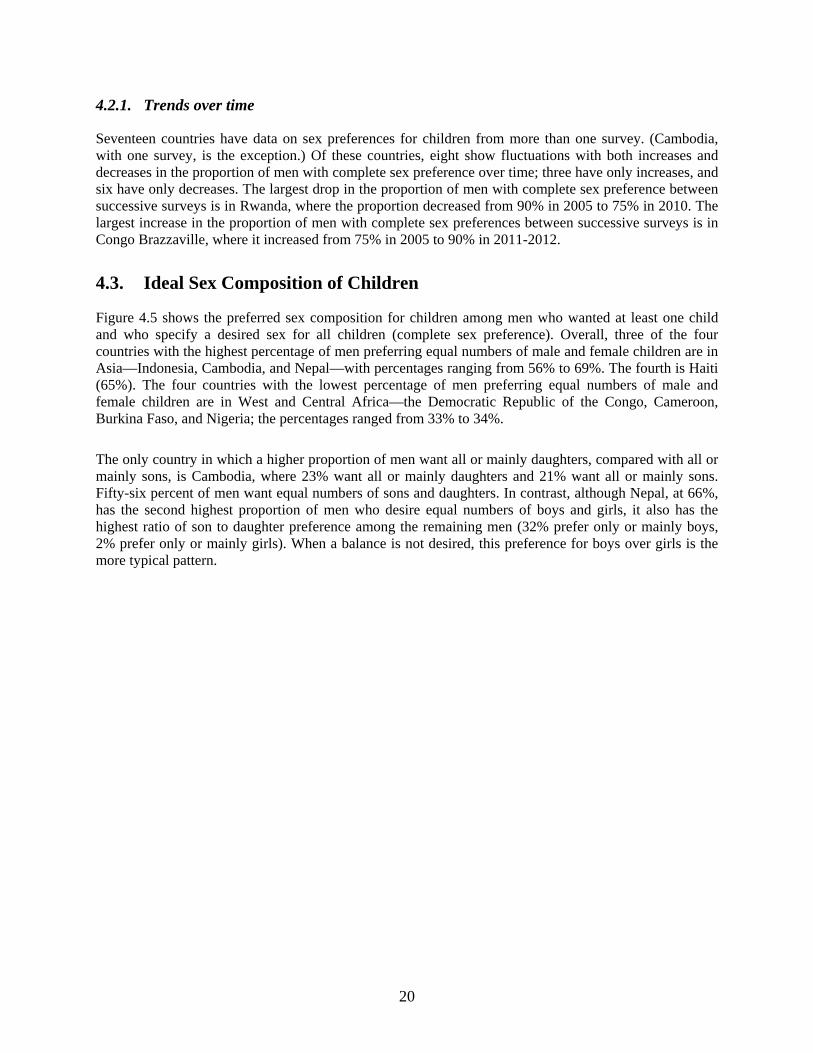
4.2.1. Trends over time
Seventeen countries have data on sex preferences for children from more than one survey. (Cambodia, with one survey, is the exception.) Of these countries, eight show fluctuations with both increases and decreases in the proportion of men with complete sex preference over time; three have only increases, and six have only decreases. The largest drop in the proportion of men with complete sex preference between successive surveys is in Rwanda, where the proportion decreased from 90% in 2005 to 75% in 2010. The largest increase in the proportion of men with complete sex preferences between successive surveys is in Congo Brazzaville, where it increased from 75% in 2005 to 90% in 2011-2012.
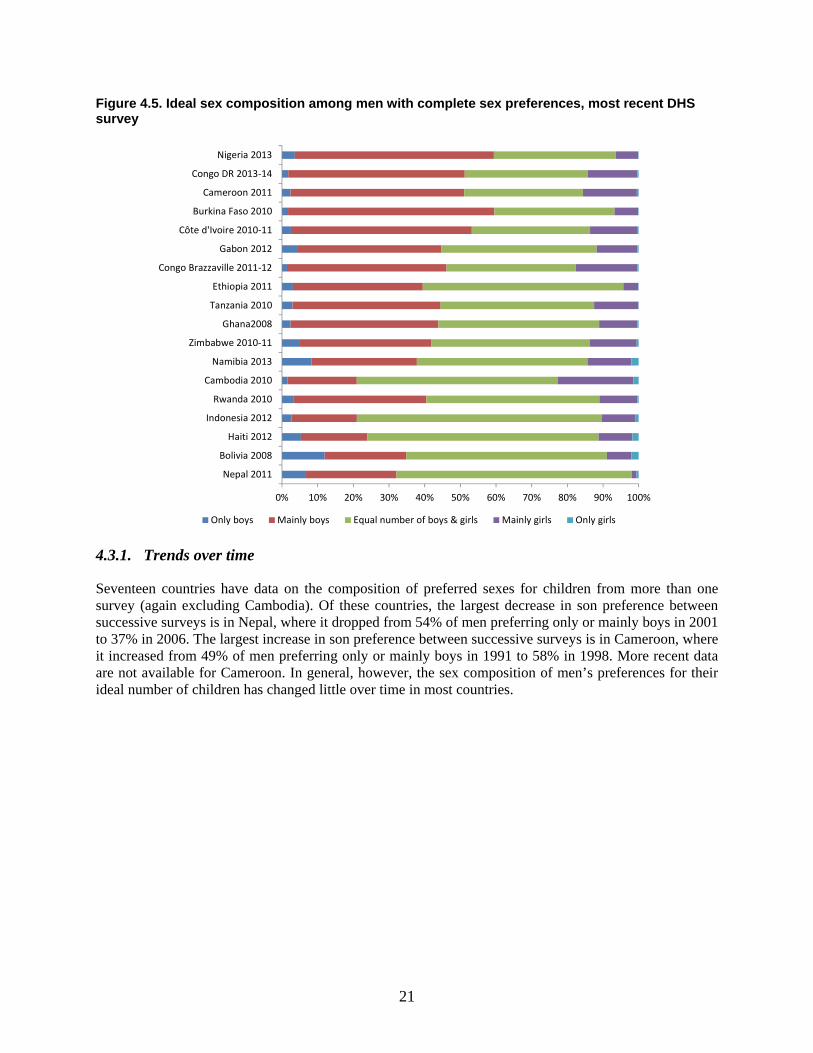
4.3. Ideal Sex Composition of Children
Figure 4.5 shows the preferred sex composition for children among men who wanted at least one child and who specify a desired sex for all children (complete sex preference). Overall, three of the four countries with the highest percentage of men preferring equal numbers of male and female children are in Asia—Indonesia, Cambodia, and Nepal—with percentages ranging from 56% to 69%. The fourth is Haiti (65%). The four countries with the lowest percentage of men preferring equal numbers of male and female children are in West and Central Africa—the Democratic Republic of the Congo, Cameroon, Burkina Faso, and Nigeria; the percentages ranged from 33% to 34%.
The only country in which a higher proportion of men want all or mainly daughters, compared with all or mainly sons, is Cambodia, where 23% want all or mainly daughters and 21% want all or mainly sons. Fifty-six percent of men want equal numbers of sons and daughters. In contrast, although Nepal, at 66%, has the second highest proportion of men who desire equal numbers of boys and girls, it also has the highest ratio of son to daughter preference among the remaining men (32% prefer only or mainly boys, 2% prefer only or mainly girls). When a balance is not desired, this preference for boys over girls is the more typical pattern.
21
Figure 4.5. Ideal sex composition among men with complete sex preferences, most recent DHS survey
4.3.1. Trends over time
Seventeen countries have data on the composition of preferred sexes for children from more than one survey (again excluding Cambodia). Of these countries, the largest decrease in son preference between successive surveys is in Nepal, where it dropped from 54% of men preferring only or mainly boys in 2001 to 37% in 2006. The largest increase in son preference between successive surveys is in Cameroon, where it increased from 49% of men preferring only or mainly boys in 1991 to 58% in 1998. More recent data are not available for Cameroon. In general, however, the sex composition of men’s preferences for their ideal number of children has changed little over time in most countries.
0% 10% 20% 30% 40% 50% 60% 70% 80% 90% 100%
Nepal 2011
Bolivia 2008
Haiti 2012
Indonesia 2012
Rwanda 2010
Cambodia 2010
Namibia 2013
Zimbabwe 2010-11
Ghana2008
Tanzania 2010
Ethiopia 2011
Congo Brazzaville 2011-12
Gabon 2012
Côte d'Ivoire 2010-11
Burkina Faso 2010
Cameroon 2011
Congo DR 2013-14
Nigeria 2013
Only boys Mainly boys Equal number of boys & girls Mainly girls Only girls

23
5. Men’s Fertility
The number of children men have, as well as the number of those children who survive, are both potentially powerful drivers of contraceptive use and useful indicators of men’s interest and ability to control their reproductive behavior, particularly when compared to their stated fertility desires.
In this study, we report the mean number of children ever born and living for all men, and not exclusively for the oldest age group who are most likely to have completed fertility, nor do we calculate age-specific fertility rates for men. It is important to note that this approach may both obscure changes in reproductive behavior between older and younger men and the change in age structures and marital behaviors that may influence men’s fertility behavior.
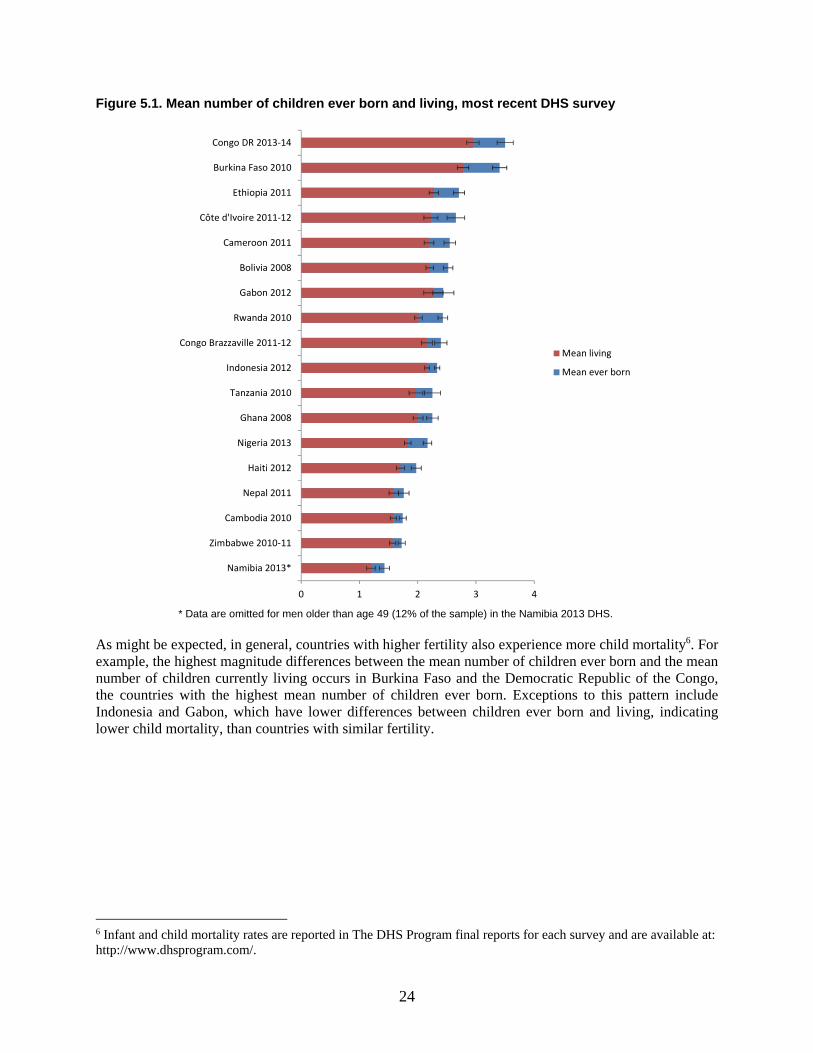
5.1. Mean Number of Children Ever Born and Living
The mean number of children ever born and living at the most recent survey is shown for all 18 countries in Figure 5.1. The Democratic Republic of the Congo has the highest mean number of children ever born and living at most recent survey, 3.5 and 2.9, respectively. Namibia has the lowest mean number of children ever born and living at most recent survey, 1.4 and 1.2 respectively (though this may in part reflect the fact that data was only collected from men up to age 49). The two countries in this study with the lowest mean number of children ever born and living are both from Southern Africa, despite both countries being in the middle range of number of desired children.
24
Figure 5.1. Mean number of children ever born and living, most recent DHS survey
* Data are omitted for men older than age 49 (12% of the sample) in the Namibia 2013 DHS.
As might be expected, in general, countries with higher fertility also experience more child mortality6. For example, the highest magnitude differences between the mean number of children ever born and the mean number of children currently living occurs in Burkina Faso and the Democratic Republic of the Congo, the countries with the highest mean number of children ever born. Exceptions to this pattern include Indonesia and Gabon, which have lower differences between children ever born and living, indicating lower child mortality, than countries with similar fertility.
6 Infant and child mortality rates are reported in The DHS Program final reports for each survey and are available at: http://www.dhsprogram.com/.
0 1 2 3 4
Namibia 2013*
Zimbabwe 2010-11
Cambodia 2010
Nepal 2011
Haiti 2012
Nigeria 2013
Ghana 2008
Tanzania 2010
Indonesia 2012
Congo Brazzaville 2011-12
Rwanda 2010
Gabon 2012
Bolivia 2008
Cameroon 2011
Côte d'Ivoire 2011-12
Ethiopia 2011
Burkina Faso 2010
Congo DR 2013-14
Mean living
Mean ever born
25
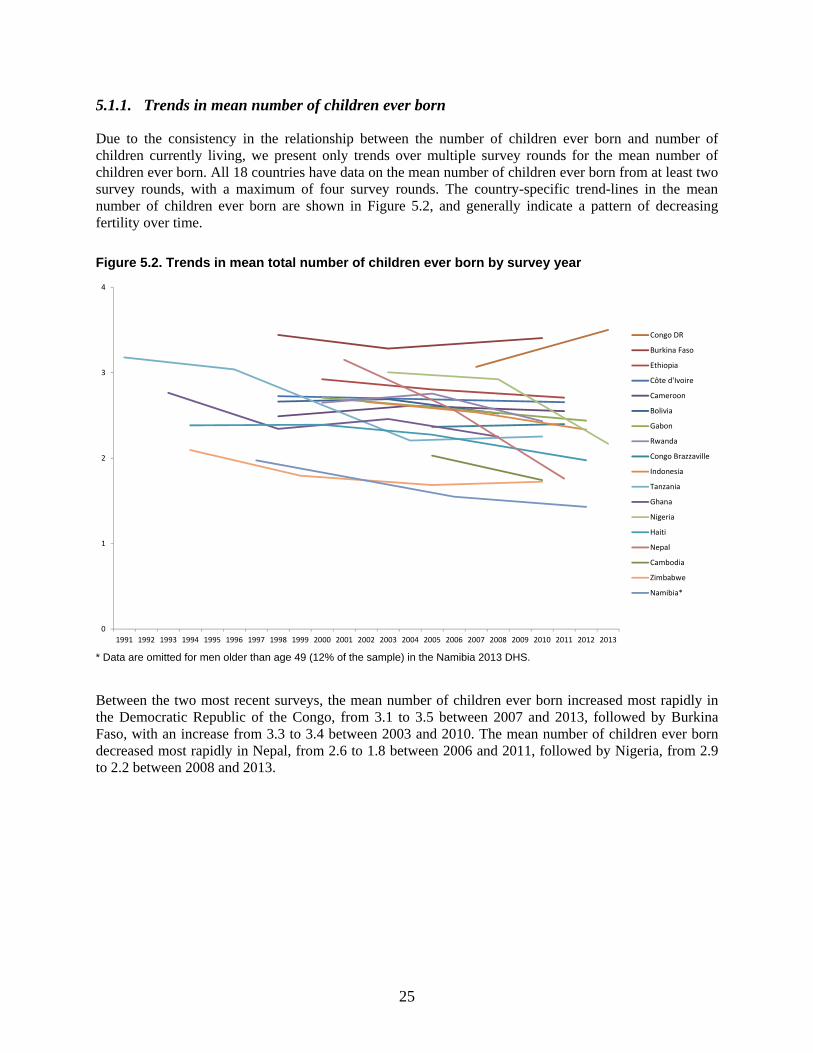
5.1.1. Trends in mean number of children ever born
Due to the consistency in the relationship between the number of children ever born and number of children currently living, we present only trends over multiple survey rounds for the mean number of children ever born. All 18 countries have data on the mean number of children ever born from at least two survey rounds, with a maximum of four survey rounds. The country-specific trend-lines in the mean number of children ever born are shown in Figure 5.2, and generally indicate a pattern of decreasing fertility over time.
Figure 5.2. Trends in mean total number of children ever born by survey year
* Data are omitted for men older than age 49 (12% of the sample) in the Namibia 2013 DHS.
Between the two most recent surveys, the mean number of children ever born increased most rapidly in the Democratic Republic of the Congo, from 3.1 to 3.5 between 2007 and 2013, followed by Burkina Faso, with an increase from 3.3 to 3.4 between 2003 and 2010. The mean number of children ever born decreased most rapidly in Nepal, from 2.6 to 1.8 between 2006 and 2011, followed by Nigeria, from 2.9 to 2.2 between 2008 and 2013.
0
1
2
3
4
1991 1992 1993 1994 1995 1996 1997 1998 1999 2000 2001 2002 2003 2004 2005 2006 2007 2008 2009 2010 2011 2012 2013
Congo DR
Burkina Faso
Ethiopia
Côte d'Ivoire
Cameroon
Bolivia
Gabon
Rwanda
Congo Brazzaville
Indonesia
Tanzania
Ghana
Nigeria
Haiti
Nepal
Cambodia
Zimbabwe
Namibia*

27
6. Men’s Attitudes toward Contraception
It is important to understand men’s basic attitudes toward contraception, since such attitudes are strong precursors and predictors of contraceptive behavior. We use three measures to assess men’s attitudes toward contraception. For each measure, a higher percentage reflects positive attitudes toward contraceptive use. The first measure is the percentage of men who disagree with the statement that “women who use contraception may become promiscuous.” The second measure is the percentage of men who disagree with the statement that “contraception is a woman’s business and a man should not have to worry about it.” The third measure is the percentage of men who approve of couples using contraception to avoid getting pregnant.
The third measure was predominantly used in DHS surveys administered between 1991 and 2003, while the first and second measures are used in DHS surveys conducted from 2001 onward. While the earlier measure assesses attitudes toward contraception from a gender-blind perspective, the two current measures incorporates a gender component into the attitudinal statements.
In this chapter, we examine these measures in two ways. First, we explore the patterns and trends associated with each separate measure. Then the first two measures—which are used in the most recent surveys—are combined into a single additive index. The resulting score on this additive index has a value that ranges from zero (indicating agreement with both statements) to two (indicating disagreement with both statements).
6.1. Women’s Use of Contraception and Promiscuity
The results of the first measure of contraceptive attitudes—the percentage of men in the most recent survey who disagree with the statement, “women who use contraception may become promiscuous”—are shown in Figure 6.1. As noted above, disagreement with this statement is interpreted as reflecting more positive attitudes toward contraception. The highest level of disagreement is in Rwanda (84%), while the lowest level of disagreement is in Namibia (34%). In four countries (Tanzania, Ghana, Nepal, and Namibia), less than 50% of men disagree with the statement. There is no clear regional pattern in the proportions who disagree with the statement, with considerable variation within regions. For example, the East and Southern Africa region includes countries with both the highest (Rwanda) and lowest (Namibia) levels of disagreement with the statement. It is notable that levels of disagreement do not correspond well to higher or lower knowledge or use of contraception—Nepal, for example, combines both general agreement with the idea that contraception may lead to promiscuous behavior by women and high levels of knowledge about contraceptive methods.
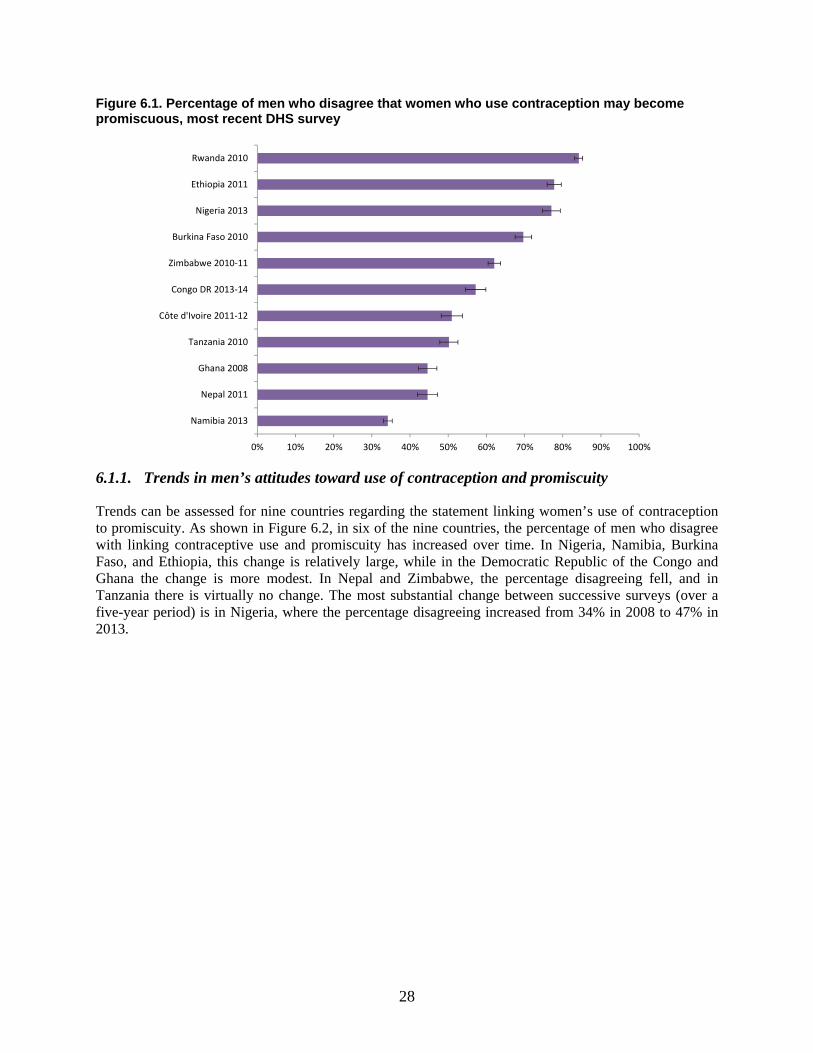
28
Figure 6.1. Percentage of men who disagree that women who use contraception may become promiscuous, most recent DHS survey
6.1.1. Trends in men’s attitudes toward use of contraception and promiscuity
Trends can be assessed for nine countries regarding the statement linking women’s use of contraception to promiscuity. As shown in Figure 6.2, in six of the nine countries, the percentage of men who disagree with linking contraceptive use and promiscuity has increased over time. In Nigeria, Namibia, Burkina Faso, and Ethiopia, this change is relatively large, while in the Democratic Republic of the Congo and Ghana the change is more modest. In Nepal and Zimbabwe, the percentage disagreeing fell, and in Tanzania there is virtually no change. The most substantial change between successive surveys (over a five-year period) is in Nigeria, where the percentage disagreeing increased from 34% in 2008 to 47% in 2013.
0% 10% 20% 30% 40% 50% 60% 70% 80% 90% 100%
Namibia 2013
Nepal 2011
Ghana 2008
Tanzania 2010
Côte d'Ivoire 2011-12
Congo DR 2013-14
Zimbabwe 2010-11
Burkina Faso 2010
Nigeria 2013
Ethiopia 2011
Rwanda 2010
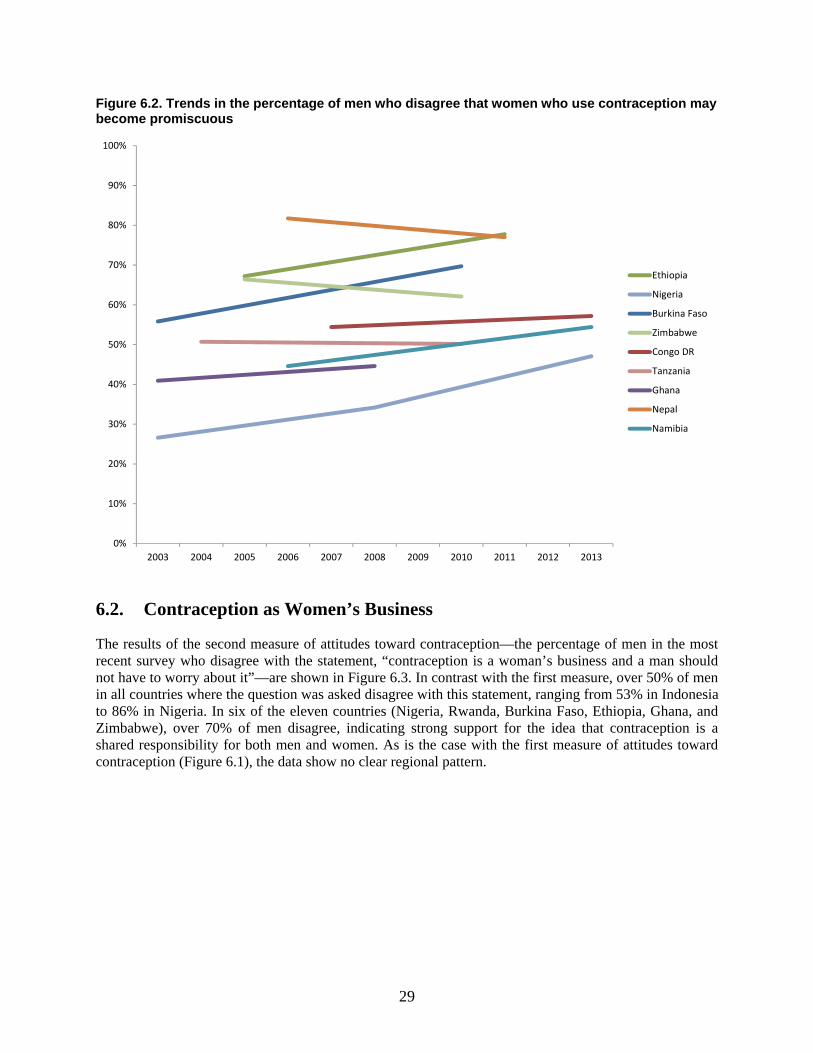
29
Figure 6.2. Trends in the percentage of men who disagree that women who use contraception may become promiscuous
6.2. Contraception as Women’s Business
The results of the second measure of attitudes toward contraception—the percentage of men in the most recent survey who disagree with the statement, “contraception is a woman’s business and a man should not have to worry about it”—are shown in Figure 6.3. In contrast with the first measure, over 50% of men in all countries where the question was asked disagree with this statement, ranging from 53% in Indonesia to 86% in Nigeria. In six of the eleven countries (Nigeria, Rwanda, Burkina Faso, Ethiopia, Ghana, and Zimbabwe), over 70% of men disagree, indicating strong support for the idea that contraception is a shared responsibility for both men and women. As is the case with the first measure of attitudes toward contraception (Figure 6.1), the data show no clear regional pattern.
0%
10%
20%
30%
40%
50%
60%
70%
80%
90%
100%
2003 2004 2005 2006 2007 2008 2009 2010 2011 2012 2013
Ethiopia
Nigeria
Burkina Faso
Zimbabwe
Congo DR
Tanzania
Ghana
Nepal
Namibia
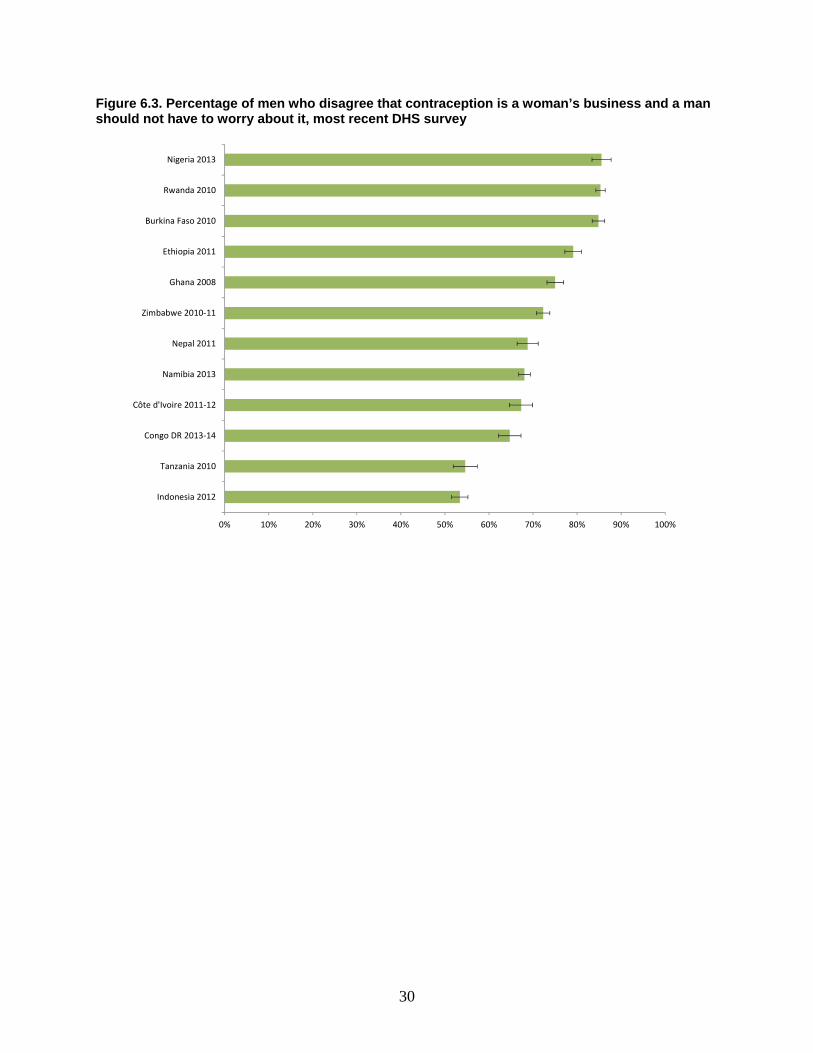
30
Figure 6.3. Percentage of men who disagree that contraception is a woman’s business and a man should not have to worry about it, most recent DHS survey
0% 10% 20% 30% 40% 50% 60% 70% 80% 90% 100%
Indonesia 2012
Tanzania 2010
Congo DR 2013-14
Côte d'Ivoire 2011-12
Namibia 2013
Nepal 2011
Zimbabwe 2010-11
Ghana 2008
Ethiopia 2011
Burkina Faso 2010
Rwanda 2010
Nigeria 2013
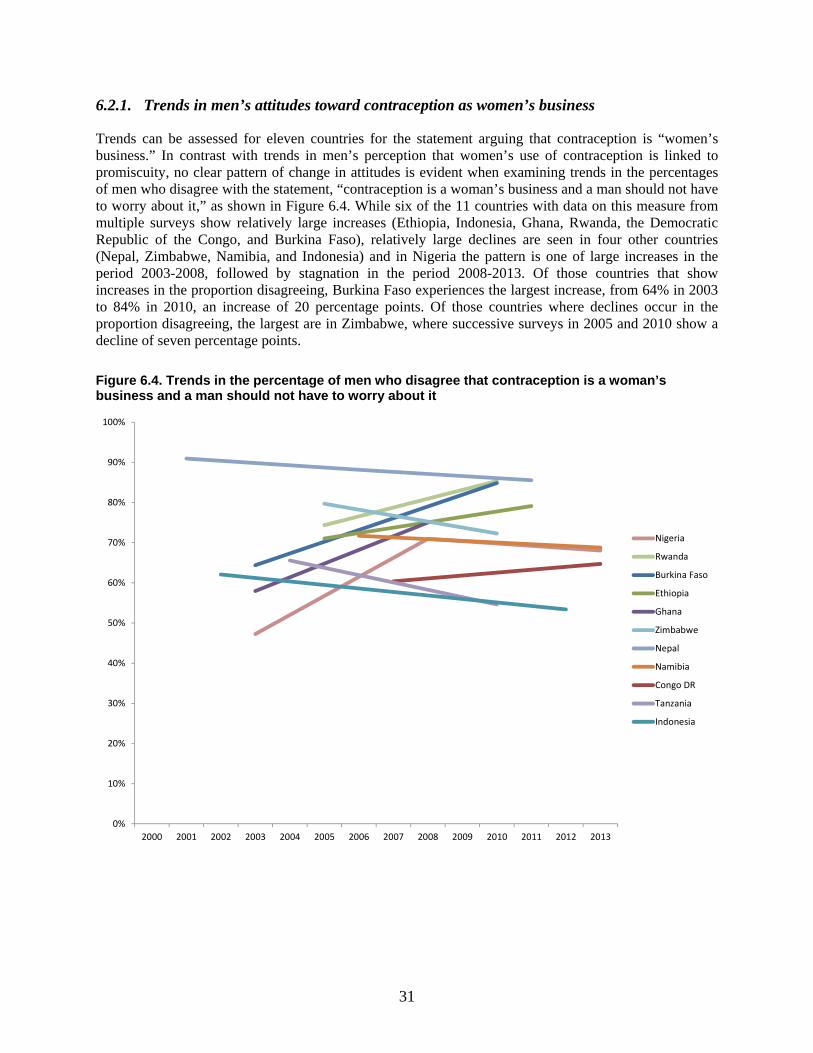
31
6.2.1. Trends in men’s attitudes toward contraception as women’s business
Trends can be assessed for eleven countries for the statement arguing that contraception is “women’s business.” In contrast with trends in men’s perception that women’s use of contraception is linked to promiscuity, no clear pattern of change in attitudes is evident when examining trends in the percentages of men who disagree with the statement, “contraception is a woman’s business and a man should not have to worry about it,” as shown in Figure 6.4. While six of the 11 countries with data on this measure from multiple surveys show relatively large increases (Ethiopia, Indonesia, Ghana, Rwanda, the Democratic Republic of the Congo, and Burkina Faso), relatively large declines are seen in four other countries (Nepal, Zimbabwe, Namibia, and Indonesia) and in Nigeria the pattern is one of large increases in the period 2003-2008, followed by stagnation in the period 2008-2013. Of those countries that show increases in the proportion disagreeing, Burkina Faso experiences the largest increase, from 64% in 2003 to 84% in 2010, an increase of 20 percentage points. Of those countries where declines occur in the proportion disagreeing, the largest are in Zimbabwe, where successive surveys in 2005 and 2010 show a decline of seven percentage points.
Figure 6.4. Trends in the percentage of men who disagree that contraception is a woman’s business and a man should not have to worry about it
0%
10%
20%
30%
40%
50%
60%
70%
80%
90%
100%
2000 2001 2002 2003 2004 2005 2006 2007 2008 2009 2010 2011 2012 2013
Nigeria
Rwanda
Burkina Faso
Ethiopia
Ghana
Zimbabwe
Nepal
Namibia
Congo DR
Tanzania
Indonesia
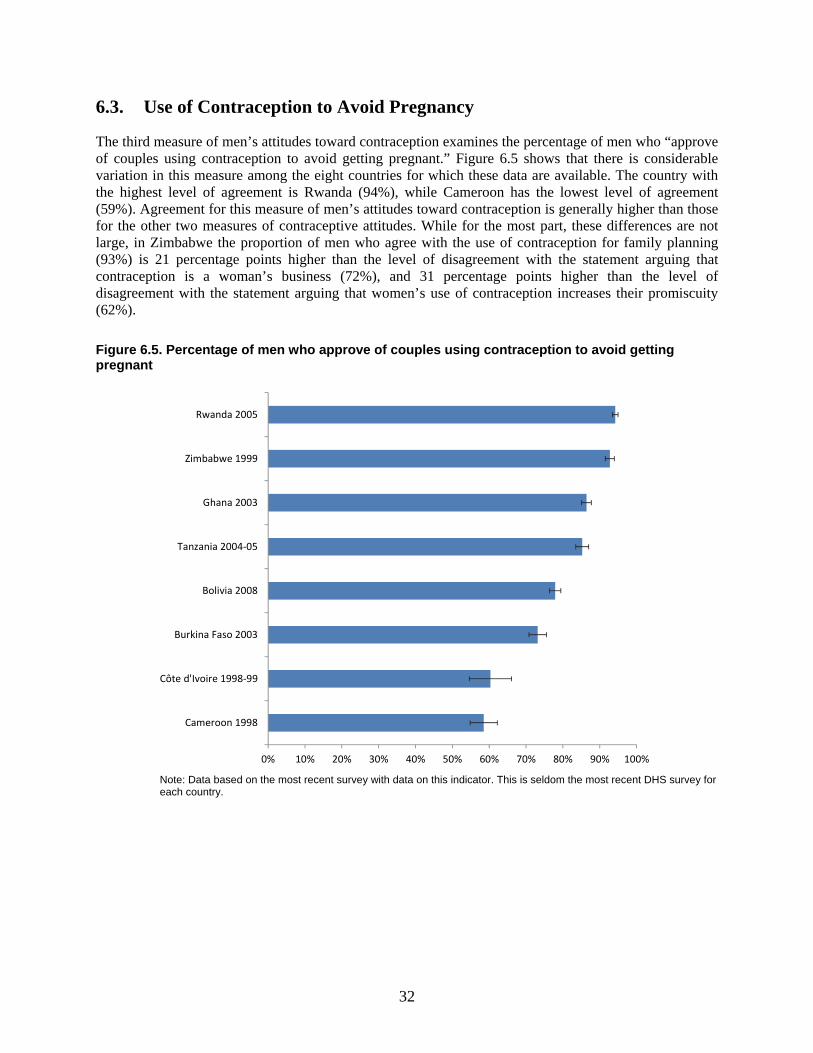
32
6.3. Use of Contraception to Avoid Pregnancy
The third measure of men’s attitudes toward contraception examines the percentage of men who “approve of couples using contraception to avoid getting pregnant.” Figure 6.5 shows that there is considerable variation in this measure among the eight countries for which these data are available. The country with the highest level of agreement is Rwanda (94%), while Cameroon has the lowest level of agreement (59%). Agreement for this measure of men’s attitudes toward contraception is generally higher than those for the other two measures of contraceptive attitudes. While for the most part, these differences are not large, in Zimbabwe the proportion of men who agree with the use of contraception for family planning (93%) is 21 percentage points higher than the level of disagreement with the statement arguing that contraception is a woman’s business (72%), and 31 percentage points higher than the level of disagreement with the statement arguing that women’s use of contraception increases their promiscuity (62%).
Figure 6.5. Percentage of men who approve of couples using contraception to avoid getting pregnant
Note: Data based on the most recent survey with data on this indicator. This is seldom the most recent DHS survey for each country.
0% 10% 20% 30% 40% 50% 60% 70% 80% 90% 100%
Cameroon 1998
Côte d'Ivoire 1998-99
Burkina Faso 2003
Bolivia 2008
Tanzania 2004-05
Ghana 2003
Zimbabwe 1999
Rwanda 2005
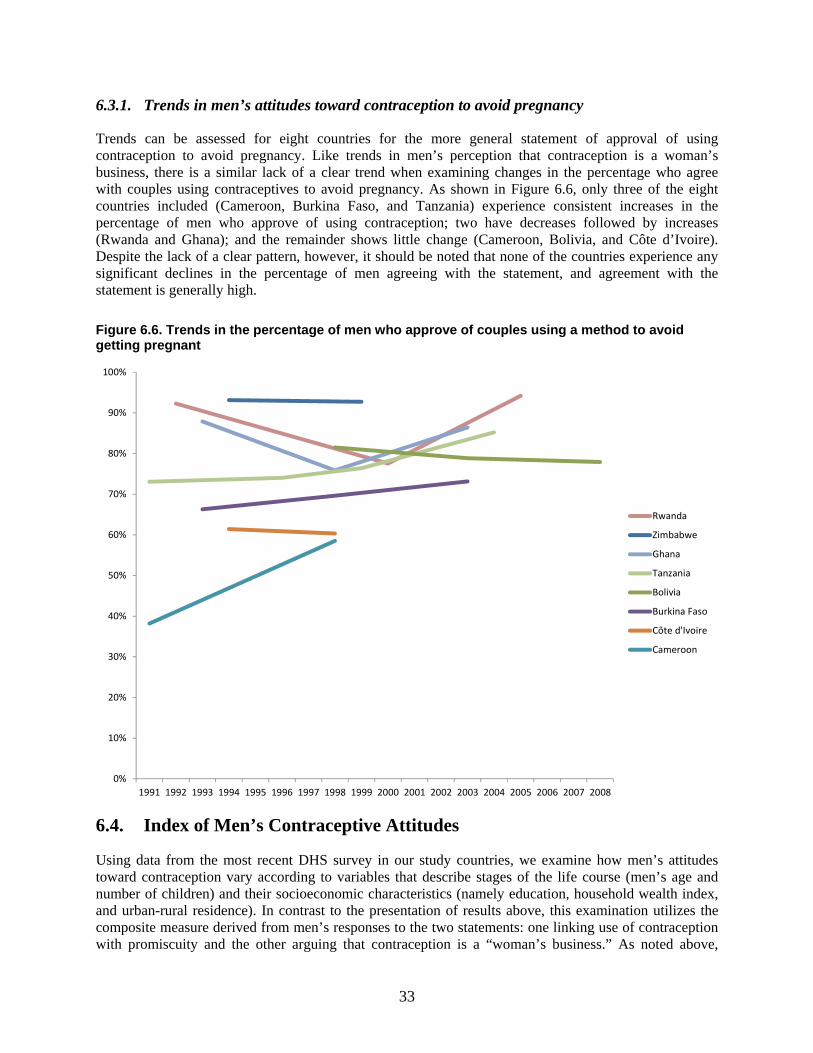
33
6.3.1. Trends in men’s attitudes toward contraception to avoid pregnancy
Trends can be assessed for eight countries for the more general statement of approval of using contraception to avoid pregnancy. Like trends in men’s perception that contraception is a woman’s business, there is a similar lack of a clear trend when examining changes in the percentage who agree with couples using contraceptives to avoid pregnancy. As shown in Figure 6.6, only three of the eight countries included (Cameroon, Burkina Faso, and Tanzania) experience consistent increases in the percentage of men who approve of using contraception; two have decreases followed by increases (Rwanda and Ghana); and the remainder shows little change (Cameroon, Bolivia, and Côte d’Ivoire). Despite the lack of a clear pattern, however, it should be noted that none of the countries experience any significant declines in the percentage of men agreeing with the statement, and agreement with the statement is generally high.
Figure 6.6. Trends in the percentage of men who approve of couples using a method to avoid getting pregnant
6.4. Index of Men’s Contraceptive Attitudes
Using data from the most recent DHS survey in our study countries, we examine how men’s attitudes toward contraception vary according to variables that describe stages of the life course (men’s age and number of children) and their socioeconomic characteristics (namely education, household wealth index, and urban-rural residence). In contrast to the presentation of results above, this examination utilizes the composite measure derived from men’s responses to the two statements: one linking use of contraception with promiscuity and the other arguing that contraception is a “woman’s business.” As noted above,
0%
10%
20%
30%
40%
50%
60%
70%
80%
90%
100%
1991 1992 1993 1994 1995 1996 1997 1998 1999 2000 2001 2002 2003 2004 2005 2006 2007 2008
Rwanda
Zimbabwe
Ghana
Tanzania
Bolivia
Burkina Faso
Côte d'Ivoire
Cameroon
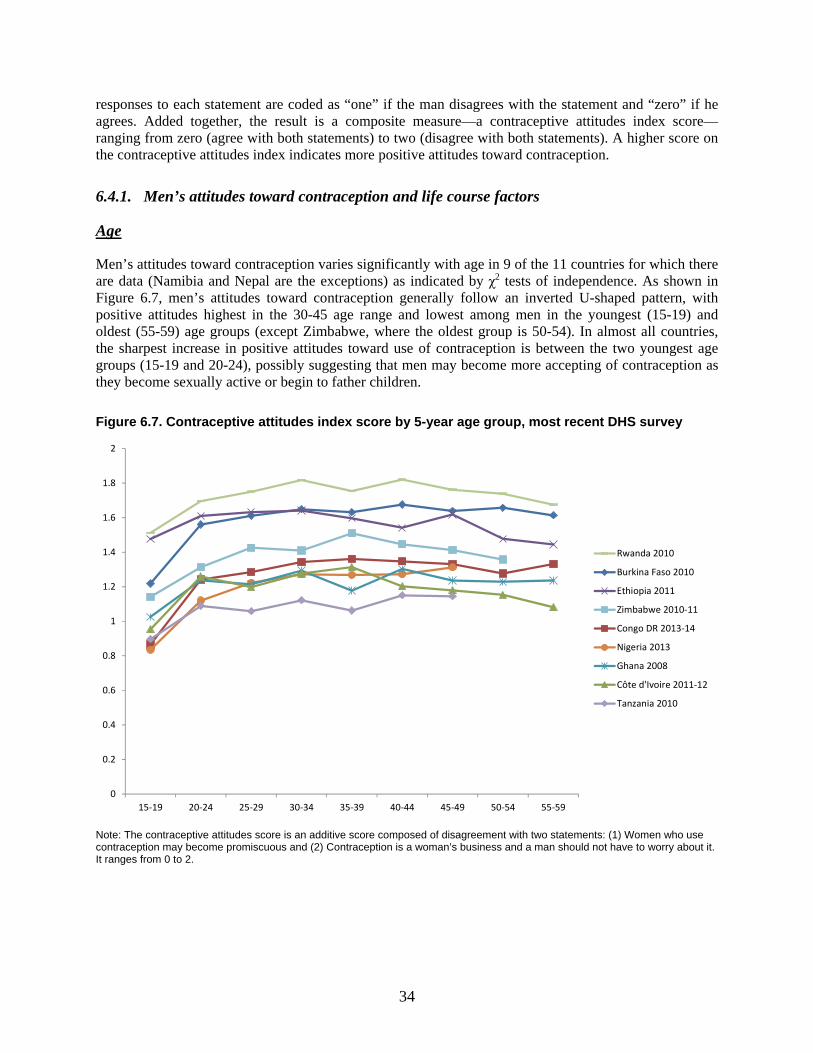
34
responses to each statement are coded as “one” if the man disagrees with the statement and “zero” if he agrees. Added together, the result is a composite measure—a contraceptive attitudes index score—ranging from zero (agree with both statements) to two (disagree with both statements). A higher score on the contraceptive attitudes index indicates more positive attitudes toward contraception.
6.4.1. Men’s attitudes toward contraception and life course factors
Age
Men’s attitudes toward contraception varies significantly with age in 9 of the 11 countries for which there are data (Namibia and Nepal are the exceptions) as indicated by χ2 tests of independence. As shown in Figure 6.7, men’s attitudes toward contraception generally follow an inverted U-shaped pattern, with positive attitudes highest in the 30-45 age range and lowest among men in the youngest (15-19) and oldest (55-59) age groups (except Zimbabwe, where the oldest group is 50-54). In almost all countries, the sharpest increase in positive attitudes toward use of contraception is between the two youngest age groups (15-19 and 20-24), possibly suggesting that men may become more accepting of contraception as they become sexually active or begin to father children.
Figure 6.7. Contraceptive attitudes index score by 5-year age group, most recent DHS survey
Note: The contraceptive attitudes score is an additive score composed of disagreement with two statements: (1) Women who use contraception may become promiscuous and (2) Contraception is a woman’s business and a man should not have to worry about it. It ranges from 0 to 2.
0
0.2
0.4
0.6
0.8
1
1.2
1.4
1.6
1.8
2
15-19 20-24 25-29 30-34 35-39 40-44 45-49 50-54 55-59
Rwanda 2010
Burkina Faso 2010
Ethiopia 2011
Zimbabwe 2010-11
Congo DR 2013-14
Nigeria 2013
Ghana 2008
Côte d'Ivoire 2011-12
Tanzania 2010
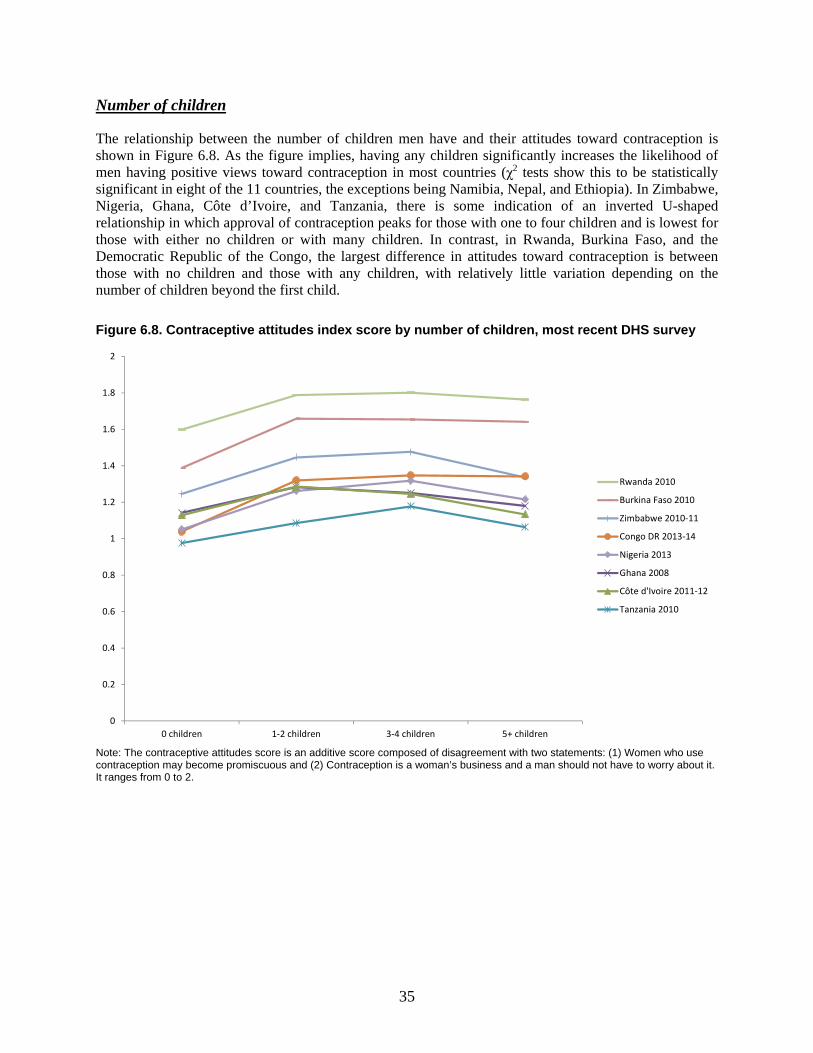
35
Number of children
The relationship between the number of children men have and their attitudes toward contraception is shown in Figure 6.8. As the figure implies, having any children significantly increases the likelihood of men having positive views toward contraception in most countries (χ2 tests show this to be statistically significant in eight of the 11 countries, the exceptions being Namibia, Nepal, and Ethiopia). In Zimbabwe, Nigeria, Ghana, Côte d’Ivoire, and Tanzania, there is some indication of an inverted U-shaped relationship in which approval of contraception peaks for those with one to four children and is lowest for those with either no children or with many children. In contrast, in Rwanda, Burkina Faso, and the Democratic Republic of the Congo, the largest difference in attitudes toward contraception is between those with no children and those with any children, with relatively little variation depending on the number of children beyond the first child.
Figure 6.8. Contraceptive attitudes index score by number of children, most recent DHS survey
Note: The contraceptive attitudes score is an additive score composed of disagreement with two statements: (1) Women who use contraception may become promiscuous and (2) Contraception is a woman’s business and a man should not have to worry about it. It ranges from 0 to 2.
0
0.2
0.4
0.6
0.8
1
1.2
1.4
1.6
1.8
2
0 children 1-2 children 3-4 children 5+ children
Rwanda 2010
Burkina Faso 2010
Zimbabwe 2010-11
Congo DR 2013-14
Nigeria 2013
Ghana 2008
Côte d'Ivoire 2011-12
Tanzania 2010
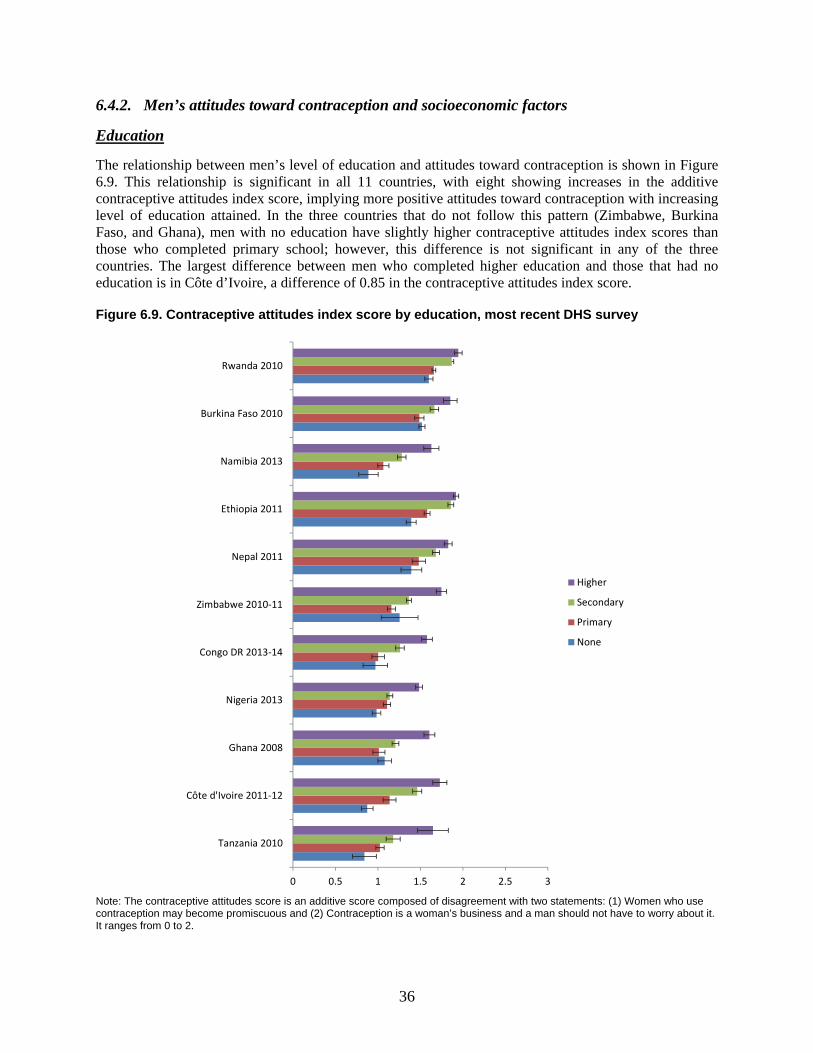
36
6.4.2. Men’s attitudes toward contraception and socioeconomic factors
Education
The relationship between men’s level of education and attitudes toward contraception is shown in Figure 6.9. This relationship is significant in all 11 countries, with eight showing increases in the additive contraceptive attitudes index score, implying more positive attitudes toward contraception with increasing level of education attained. In the three countries that do not follow this pattern (Zimbabwe, Burkina Faso, and Ghana), men with no education have slightly higher contraceptive attitudes index scores than those who completed primary school; however, this difference is not significant in any of the three countries. The largest difference between men who completed higher education and those that had no education is in Côte d’Ivoire, a difference of 0.85 in the contraceptive attitudes index score.
Figure 6.9. Contraceptive attitudes index score by education, most recent DHS survey
Note: The contraceptive attitudes score is an additive score composed of disagreement with two statements: (1) Women who use contraception may become promiscuous and (2) Contraception is a woman’s business and a man should not have to worry about it. It ranges from 0 to 2.
0 0.5 1 1.5 2 2.5 3
Tanzania 2010
Côte d'Ivoire 2011-12
Ghana 2008
Nigeria 2013
Congo DR 2013-14
Zimbabwe 2010-11
Nepal 2011
Ethiopia 2011
Namibia 2013
Burkina Faso 2010
Rwanda 2010
Higher
Secondary
Primary
None
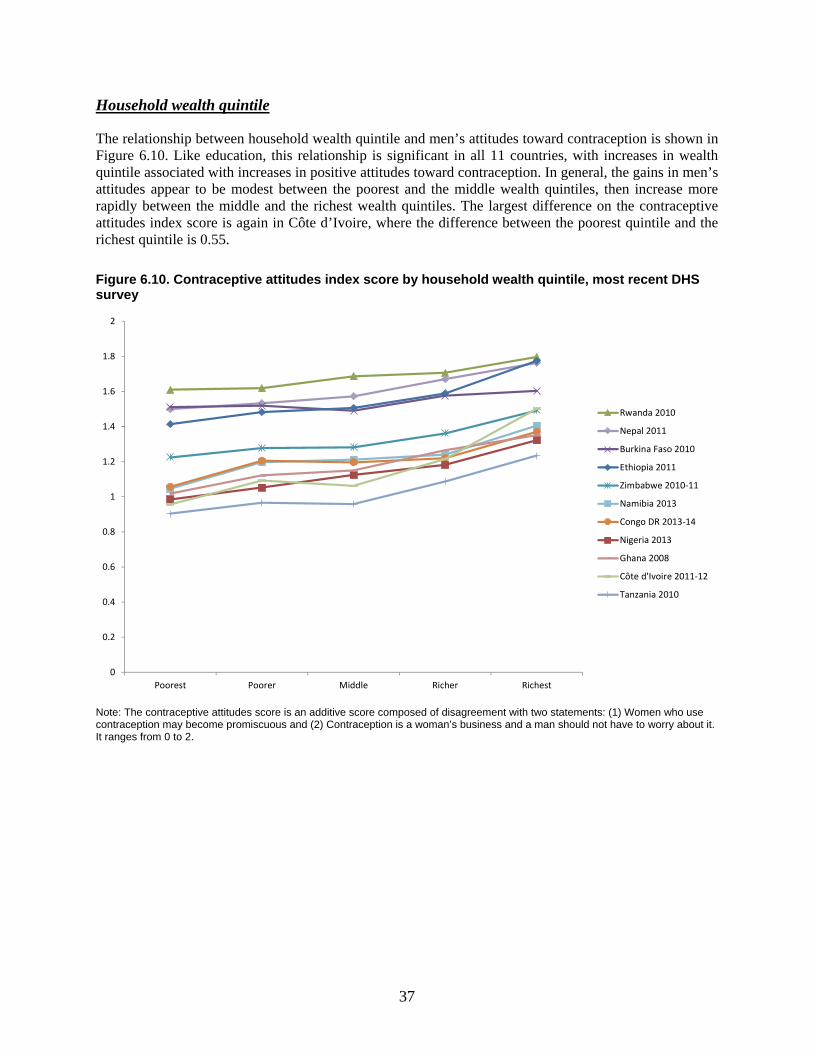
37
Household wealth quintile
The relationship between household wealth quintile and men’s attitudes toward contraception is shown in Figure 6.10. Like education, this relationship is significant in all 11 countries, with increases in wealth quintile associated with increases in positive attitudes toward contraception. In general, the gains in men’s attitudes appear to be modest between the poorest and the middle wealth quintiles, then increase more rapidly between the middle and the richest wealth quintiles. The largest difference on the contraceptive attitudes index score is again in Côte d’Ivoire, where the difference between the poorest quintile and the richest quintile is 0.55.
Figure 6.10. Contraceptive attitudes index score by household wealth quintile, most recent DHS survey
Note: The contraceptive attitudes score is an additive score composed of disagreement with two statements: (1) Women who use contraception may become promiscuous and (2) Contraception is a woman’s business and a man should not have to worry about it. It ranges from 0 to 2.
0
0.2
0.4
0.6
0.8
1
1.2
1.4
1.6
1.8
2
Poorest Poorer Middle Richer Richest
Rwanda 2010
Nepal 2011
Burkina Faso 2010
Ethiopia 2011
Zimbabwe 2010-11
Namibia 2013
Congo DR 2013-14
Nigeria 2013
Ghana 2008
Côte d'Ivoire 2011-12
Tanzania 2010
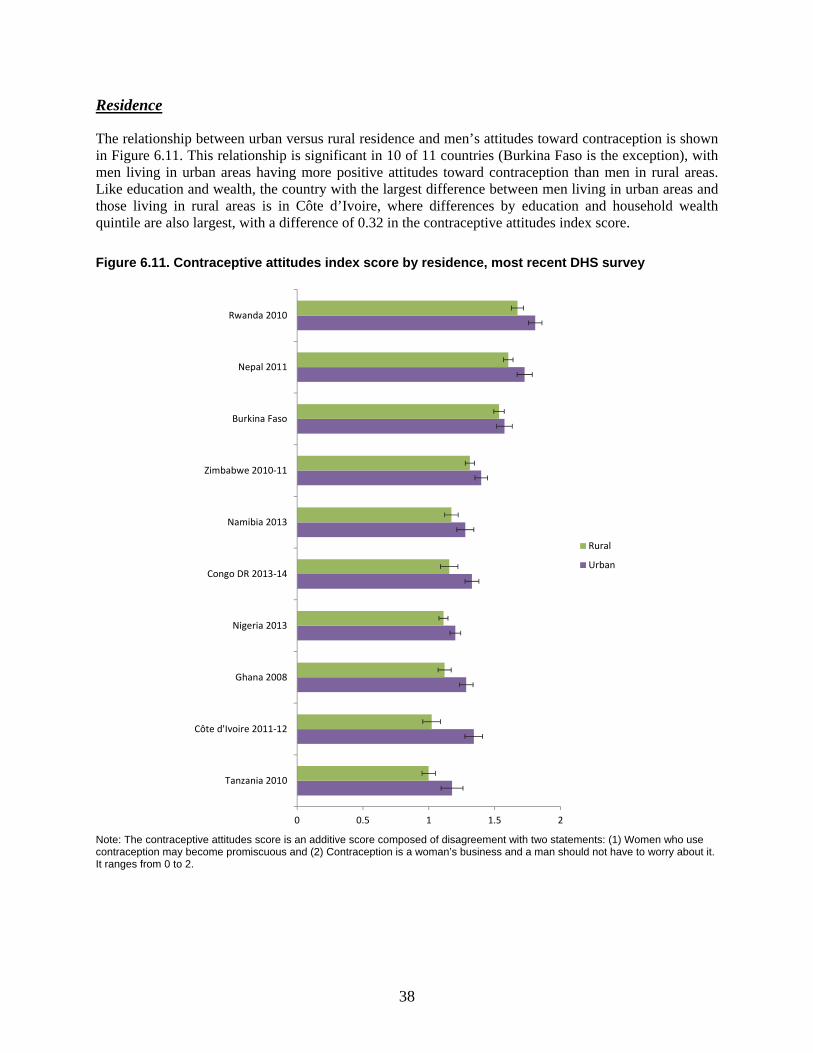
38
Residence
The relationship between urban versus rural residence and men’s attitudes toward contraception is shown in Figure 6.11. This relationship is significant in 10 of 11 countries (Burkina Faso is the exception), with men living in urban areas having more positive attitudes toward contraception than men in rural areas. Like education and wealth, the country with the largest difference between men living in urban areas and those living in rural areas is in Côte d’Ivoire, where differences by education and household wealth quintile are also largest, with a difference of 0.32 in the contraceptive attitudes index score.
Figure 6.11. Contraceptive attitudes index score by residence, most recent DHS survey
Note: The contraceptive attitudes score is an additive score composed of disagreement with two statements: (1) Women who use contraception may become promiscuous and (2) Contraception is a woman’s business and a man should not have to worry about it. It ranges from 0 to 2.
0 0.5 1 1.5 2
Tanzania 2010
Côte d'Ivoire 2011-12
Ghana 2008
Nigeria 2013
Congo DR 2013-14
Namibia 2013
Zimbabwe 2010-11
Burkina Faso
Nepal 2011
Rwanda 2010
Rural
Urban
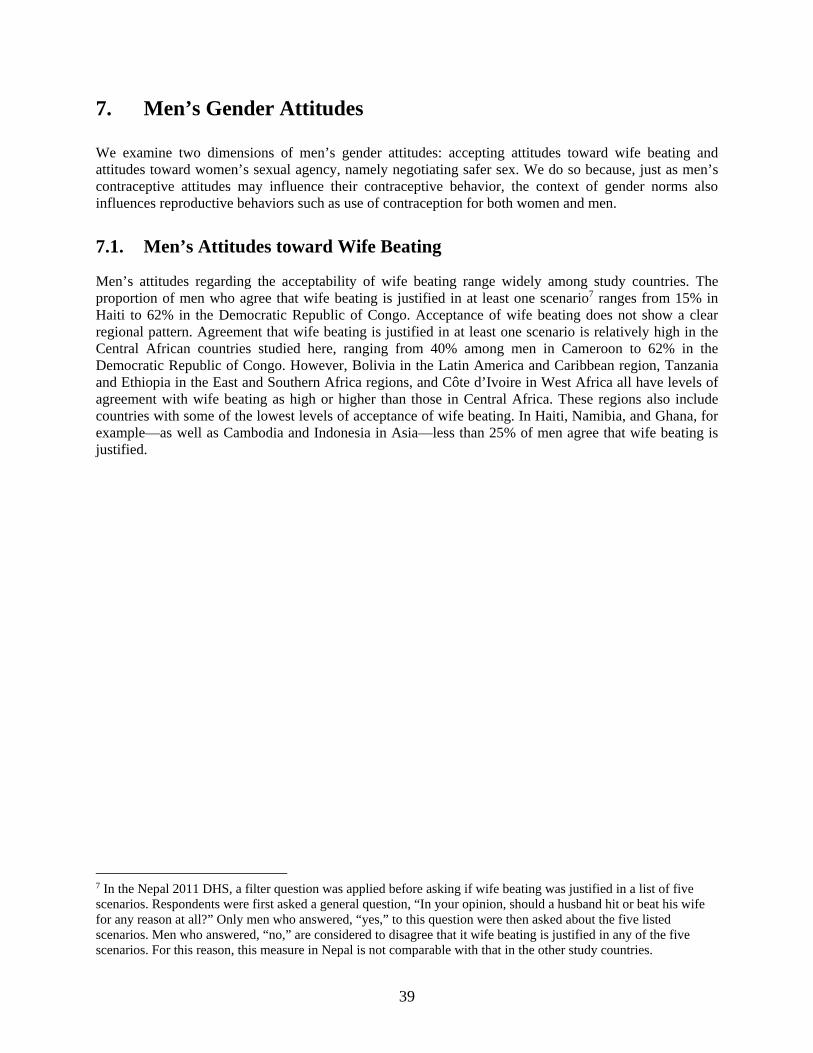
39
7. Men’s Gender Attitudes
We examine two dimensions of men’s gender attitudes: accepting attitudes toward wife beating and attitudes toward women’s sexual agency, namely negotiating safer sex. We do so because, just as men’s contraceptive attitudes may influence their contraceptive behavior, the context of gender norms also influences reproductive behaviors such as use of contraception for both women and men.
7.1. Men’s Attitudes toward Wife Beating
Men’s attitudes regarding the acceptability of wife beating range widely among study countries. The proportion of men who agree that wife beating is justified in at least one scenario7 ranges from 15% in Haiti to 62% in the Democratic Republic of Congo. Acceptance of wife beating does not show a clear regional pattern. Agreement that wife beating is justified in at least one scenario is relatively high in the Central African countries studied here, ranging from 40% among men in Cameroon to 62% in the Democratic Republic of Congo. However, Bolivia in the Latin America and Caribbean region, Tanzania and Ethiopia in the East and Southern Africa regions, and Côte d’Ivoire in West Africa all have levels of agreement with wife beating as high or higher than those in Central Africa. These regions also include countries with some of the lowest levels of acceptance of wife beating. In Haiti, Namibia, and Ghana, for example—as well as Cambodia and Indonesia in Asia—less than 25% of men agree that wife beating is justified.
7 In the Nepal 2011 DHS, a filter question was applied before asking if wife beating was justified in a list of five scenarios. Respondents were first asked a general question, “In your opinion, should a husband hit or beat his wife for any reason at all?” Only men who answered, “yes,” to this question were then asked about the five listed scenarios. Men who answered, “no,” are considered to disagree that it wife beating is justified in any of the five scenarios. For this reason, this measure in Nepal is not comparable with that in the other study countries.
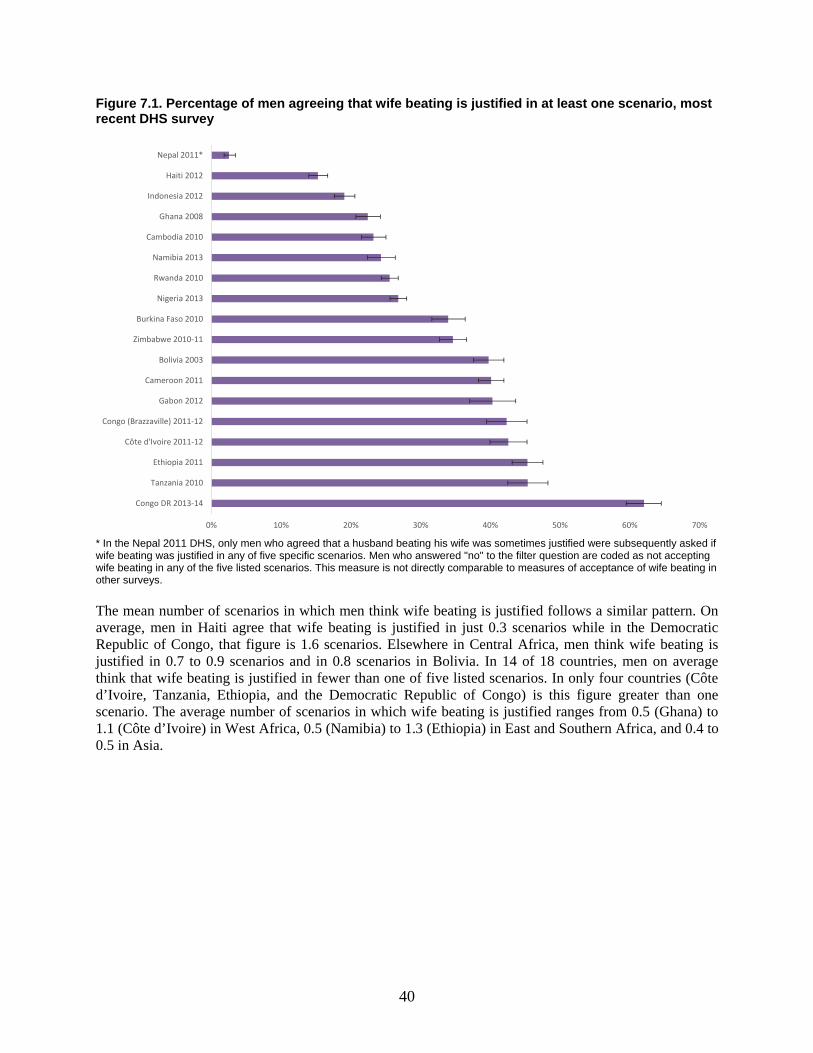
40
Figure 7.1. Percentage of men agreeing that wife beating is justified in at least one scenario, most recent DHS survey
* In the Nepal 2011 DHS, only men who agreed that a husband beating his wife was sometimes justified were subsequently asked if wife beating was justified in any of five specific scenarios. Men who answered "no" to the filter question are coded as not accepting wife beating in any of the five listed scenarios. This measure is not directly comparable to measures of acceptance of wife beating in other surveys.
The mean number of scenarios in which men think wife beating is justified follows a similar pattern. On average, men in Haiti agree that wife beating is justified in just 0.3 scenarios while in the Democratic Republic of Congo, that figure is 1.6 scenarios. Elsewhere in Central Africa, men think wife beating is justified in 0.7 to 0.9 scenarios and in 0.8 scenarios in Bolivia. In 14 of 18 countries, men on average think that wife beating is justified in fewer than one of five listed scenarios. In only four countries (Côte d’Ivoire, Tanzania, Ethiopia, and the Democratic Republic of Congo) is this figure greater than one scenario. The average number of scenarios in which wife beating is justified ranges from 0.5 (Ghana) to 1.1 (Côte d’Ivoire) in West Africa, 0.5 (Namibia) to 1.3 (Ethiopia) in East and Southern Africa, and 0.4 to 0.5 in Asia.
0% 10% 20% 30% 40% 50% 60% 70%
Congo DR 2013-14
Tanzania 2010
Ethiopia 2011
Côte d'Ivoire 2011-12
Congo (Brazzaville) 2011-12
Gabon 2012
Cameroon 2011
Bolivia 2003
Zimbabwe 2010-11
Burkina Faso 2010
Nigeria 2013
Rwanda 2010
Namibia 2013
Cambodia 2010
Ghana 2008
Indonesia 2012
Haiti 2012
Nepal 2011*
41
Figure 7.2. Mean number of scenarios in which men report wife beating is justified, most recent DHS survey
* In the Nepal 2011 DHS, only men who agreed that a husband beating his wife was sometimes justified were subsequently asked if wife beating was justified in any of five specific scenarios. Men who answered "no" to the filter question are coded as not accepting wife beating in any of the five listed scenarios. This measure is not directly comparable to measures of acceptance of wife beating in other surveys.
7.1.1. Trends in men’s attitudes toward wife beating
Eleven countries in this study have multiple surveys with data on men’s attitudes toward wife beating. Figure 7.3 shows that over time in virtually all of these countries there is a broad decline in men’s agreement that wife beating is justified. Only in Indonesia does there appear to be a slight increase in the acceptance of wife beating. The pace of the decline has been notably consistent, with attitudes of agreement declining an average of about 20 percentage points over approximately a decade. The largest decreases are in Rwanda and Ethiopia, where accepting attitudes toward wife beating in the most recent survey are 30 percentage points lower than those reported in the 2000 survey. The declines in Tanzania and Zimbabwe are more modest, approximately 6 percentage points over a period of about 5 years. Namibia’s decline in accepting attitudes toward wife beating is concentrated primarily between the 2006-07 and 2013 surveys.
Figure 7.4 depicts trends in the mean number of scenarios for which men report wife beating is justified; the broad declines over time are similar to those seen in Figure 7.3. While the mean number of scenarios justifying wife beating remains highest in Ethiopia, it has fallen precipitously in that country from 2.5 scenarios, on average, in 2000 to 1.3 scenarios, on average, in 2011.
0 0.5 1 1.5 2 2.5 3
Nepal 2011*
Indonesia 2012
Cambodia 2010
Haiti 2012
Bolivia 2003
Namibia 2013
Rwanda 2010
Zimbabwe 2010-11
Tanzania 2010
Ethiopia 2011
Ghana 2008
Nigeria 2013
Burkina Faso 2010
Côte d'Ivoire 2011-12
Congo (Brazzaville) 2011-12
Gabon 2012
Cameroon 2011
Congo DR 2013-14
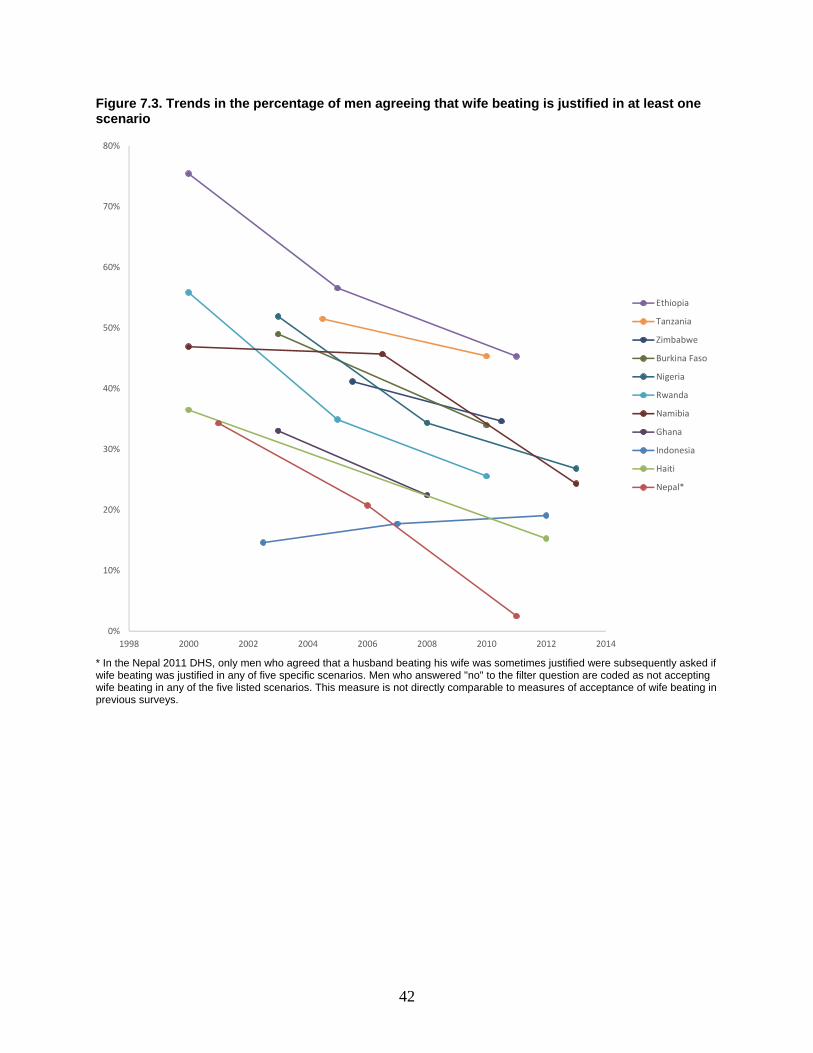
42
Figure 7.3. Trends in the percentage of men agreeing that wife beating is justified in at least one scenario
* In the Nepal 2011 DHS, only men who agreed that a husband beating his wife was sometimes justified were subsequently asked if wife beating was justified in any of five specific scenarios. Men who answered "no" to the filter question are coded as not accepting wife beating in any of the five listed scenarios. This measure is not directly comparable to measures of acceptance of wife beating in previous surveys.
0%
10%
20%
30%
40%
50%
60%
70%
80%
1998 2000 2002 2004 2006 2008 2010 2012 2014
Ethiopia
Tanzania
Zimbabwe
Burkina Faso
Nigeria
Rwanda
Namibia
Ghana
Indonesia
Haiti
Nepal*
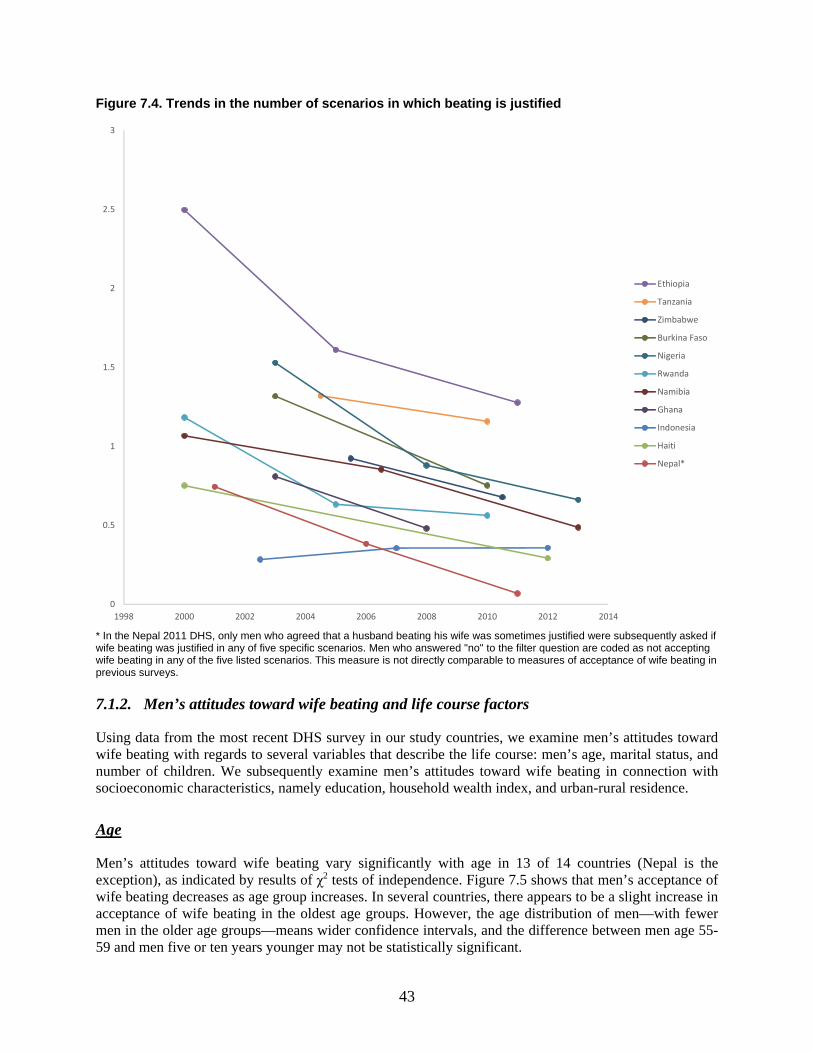
43
Figure 7.4. Trends in the number of scenarios in which beating is justified
* In the Nepal 2011 DHS, only men who agreed that a husband beating his wife was sometimes justified were subsequently asked if wife beating was justified in any of five specific scenarios. Men who answered "no" to the filter question are coded as not accepting wife beating in any of the five listed scenarios. This measure is not directly comparable to measures of acceptance of wife beating in previous surveys.
7.1.2. Men’s attitudes toward wife beating and life course factors
Using data from the most recent DHS survey in our study countries, we examine men’s attitudes toward wife beating with regards to several variables that describe the life course: men’s age, marital status, and number of children. We subsequently examine men’s attitudes toward wife beating in connection with socioeconomic characteristics, namely education, household wealth index, and urban-rural residence.
Age
Men’s attitudes toward wife beating vary significantly with age in 13 of 14 countries (Nepal is the exception), as indicated by results of χ2 tests of independence. Figure 7.5 shows that men’s acceptance of wife beating decreases as age group increases. In several countries, there appears to be a slight increase in acceptance of wife beating in the oldest age groups. However, the age distribution of men—with fewer men in the older age groups—means wider confidence intervals, and the difference between men age 55-59 and men five or ten years younger may not be statistically significant.
0
0.5
1
1.5
2
2.5
3
1998 2000 2002 2004 2006 2008 2010 2012 2014
Ethiopia
Tanzania
Zimbabwe
Burkina Faso
Nigeria
Rwanda
Namibia
Ghana
Indonesia
Haiti
Nepal*
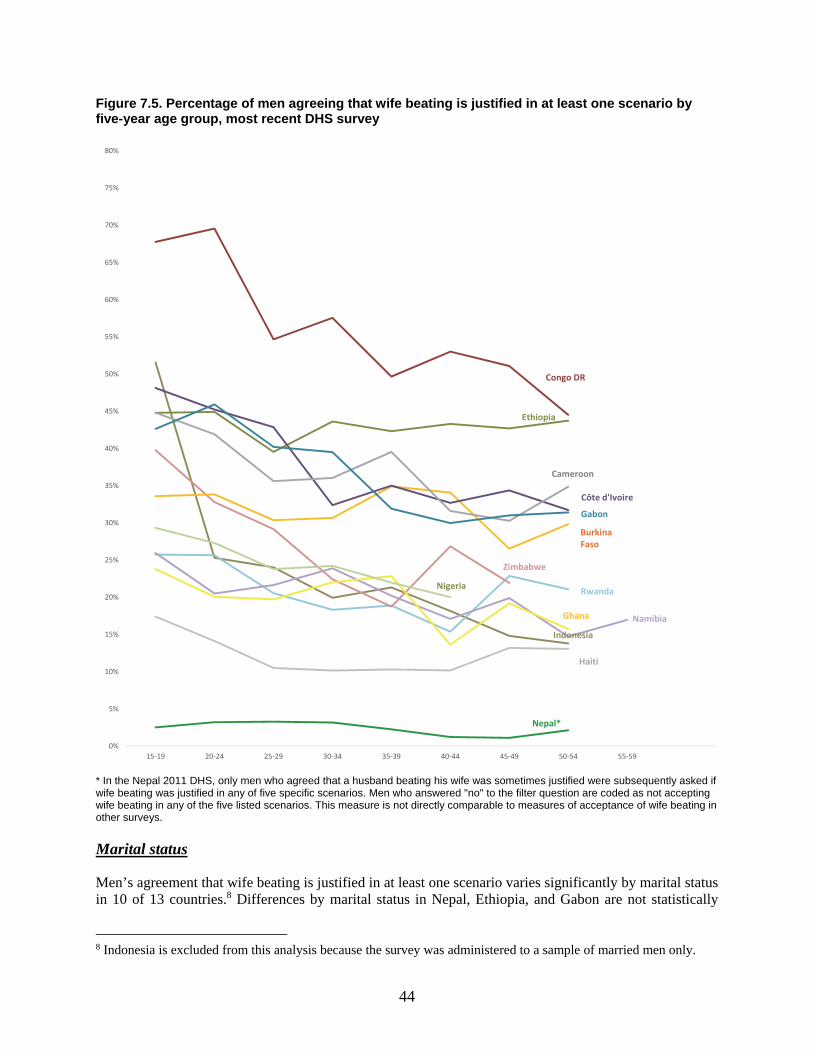
44
Figure 7.5. Percentage of men agreeing that wife beating is justified in at least one scenario by five-year age group, most recent DHS survey
* In the Nepal 2011 DHS, only men who agreed that a husband beating his wife was sometimes justified were subsequently asked if wife beating was justified in any of five specific scenarios. Men who answered "no" to the filter question are coded as not accepting wife beating in any of the five listed scenarios. This measure is not directly comparable to measures of acceptance of wife beating in other surveys.
Marital status
Men’s agreement that wife beating is justified in at least one scenario varies significantly by marital status in 10 of 13 countries.8 Differences by marital status in Nepal, Ethiopia, and Gabon are not statistically
8 Indonesia is excluded from this analysis because the survey was administered to a sample of married men only.
0%
5%
10%
15%
20%
25%
30%
35%
40%
45%
50%
55%
60%
65%
70%
75%
80%
15-19 20-24 25-29 30-34 35-39 40-44 45-49 50-54 55-59
Ethiopia
Cameroon
Gabon
Côte d'Ivoire
Burkina Faso
Zimbabwe
RwandaNigeria
NamibiaGhana
Haiti
Nepal*
Indonesia
Congo DR
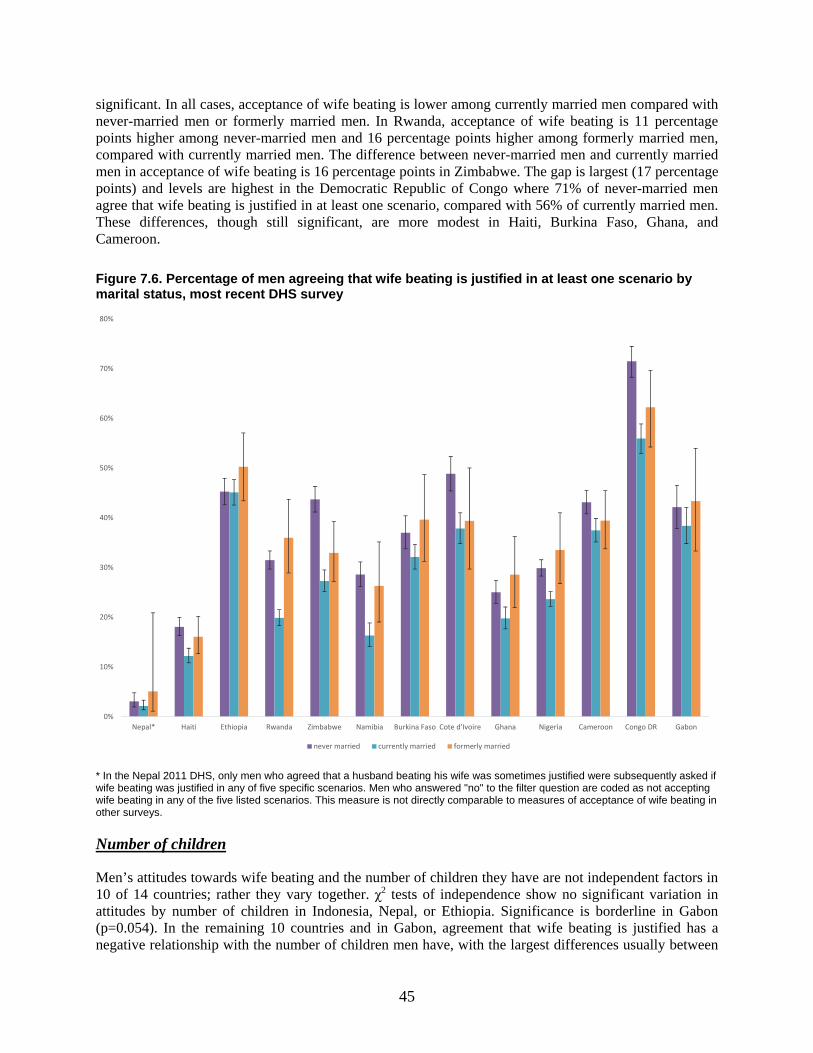
45
significant. In all cases, acceptance of wife beating is lower among currently married men compared with never-married men or formerly married men. In Rwanda, acceptance of wife beating is 11 percentage points higher among never-married men and 16 percentage points higher among formerly married men, compared with currently married men. The difference between never-married men and currently married men in acceptance of wife beating is 16 percentage points in Zimbabwe. The gap is largest (17 percentage points) and levels are highest in the Democratic Republic of Congo where 71% of never-married men agree that wife beating is justified in at least one scenario, compared with 56% of currently married men. These differences, though still significant, are more modest in Haiti, Burkina Faso, Ghana, and Cameroon.
Figure 7.6. Percentage of men agreeing that wife beating is justified in at least one scenario by marital status, most recent DHS survey
* In the Nepal 2011 DHS, only men who agreed that a husband beating his wife was sometimes justified were subsequently asked if wife beating was justified in any of five specific scenarios. Men who answered "no" to the filter question are coded as not accepting wife beating in any of the five listed scenarios. This measure is not directly comparable to measures of acceptance of wife beating in other surveys.
Number of children
Men’s attitudes towards wife beating and the number of children they have are not independent factors in 10 of 14 countries; rather they vary together. χ2 tests of independence show no significant variation in attitudes by number of children in Indonesia, Nepal, or Ethiopia. Significance is borderline in Gabon (p=0.054). In the remaining 10 countries and in Gabon, agreement that wife beating is justified has a negative relationship with the number of children men have, with the largest differences usually between
0%
10%
20%
30%
40%
50%
60%
70%
80%
Nepal* Haiti Ethiopia Rwanda Zimbabwe Namibia Burkina Faso Cote d'Ivoire Ghana Nigeria Cameroon Congo DR Gabon
never married currently married formerly married
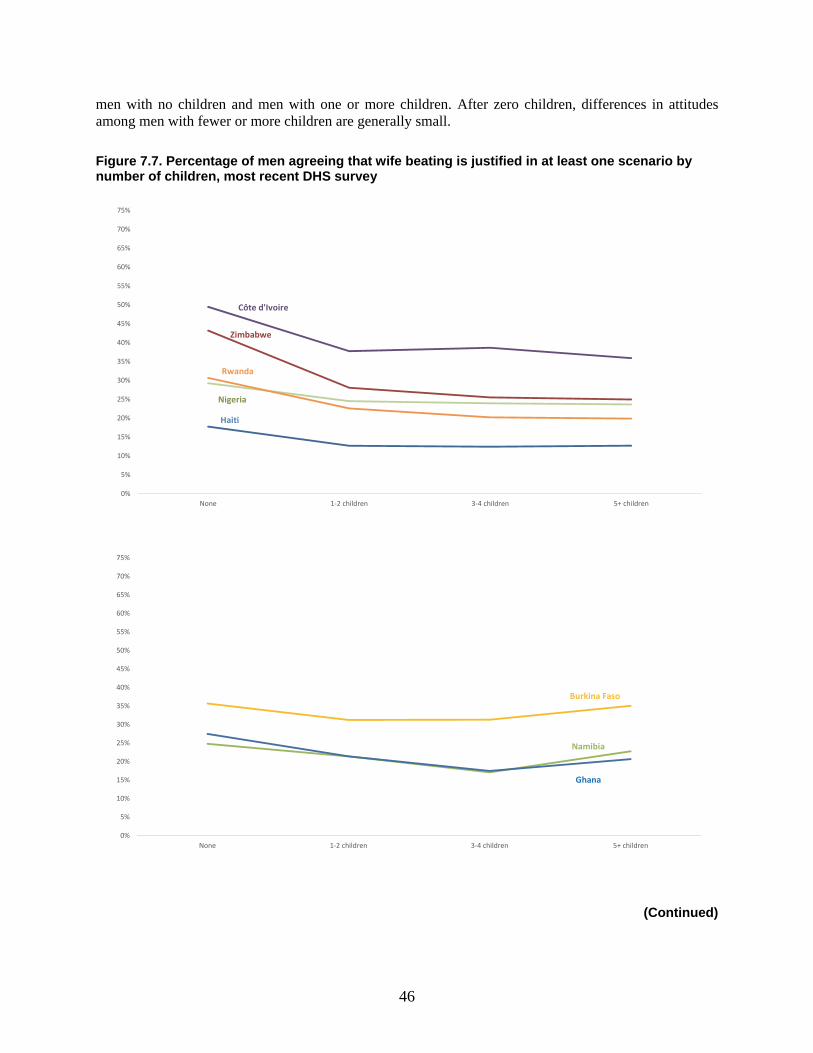
46
men with no children and men with one or more children. After zero children, differences in attitudes among men with fewer or more children are generally small.
Figure 7.7. Percentage of men agreeing that wife beating is justified in at least one scenario by number of children, most recent DHS survey
(Continued)
0%
5%
10%
15%
20%
25%
30%
35%
40%
45%
50%
55%
60%
65%
70%
75%
None 1-2 children 3-4 children 5+ children
Namibia
Burkina Faso
Ghana
0%
5%
10%
15%
20%
25%
30%
35%
40%
45%
50%
55%
60%
65%
70%
75%
None 1-2 children 3-4 children 5+ children
Côte d'Ivoire
Nigeria
Zimbabwe
Rwanda
Haiti
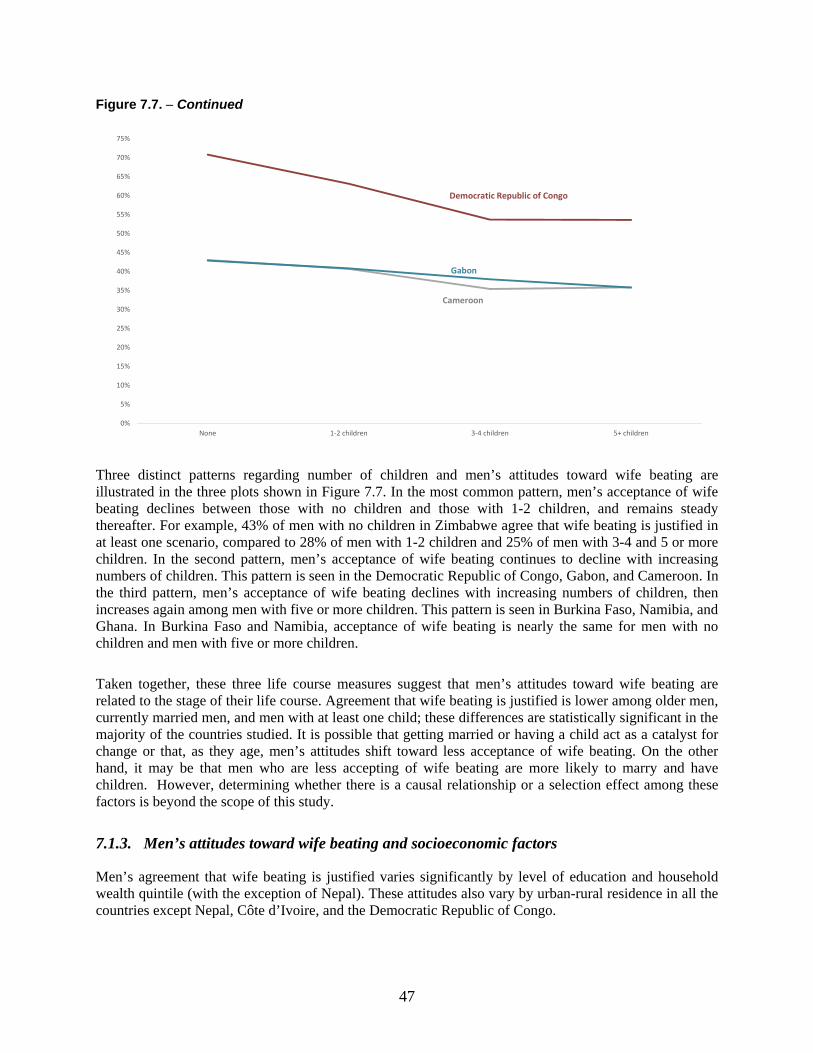
47
Figure 7.7. − Continued
Three distinct patterns regarding number of children and men’s attitudes toward wife beating are illustrated in the three plots shown in Figure 7.7. In the most common pattern, men’s acceptance of wife beating declines between those with no children and those with 1-2 children, and remains steady thereafter. For example, 43% of men with no children in Zimbabwe agree that wife beating is justified in at least one scenario, compared to 28% of men with 1-2 children and 25% of men with 3-4 and 5 or more children. In the second pattern, men’s acceptance of wife beating continues to decline with increasing numbers of children. This pattern is seen in the Democratic Republic of Congo, Gabon, and Cameroon. In the third pattern, men’s acceptance of wife beating declines with increasing numbers of children, then increases again among men with five or more children. This pattern is seen in Burkina Faso, Namibia, and Ghana. In Burkina Faso and Namibia, acceptance of wife beating is nearly the same for men with no children and men with five or more children.
Taken together, these three life course measures suggest that men’s attitudes toward wife beating are related to the stage of their life course. Agreement that wife beating is justified is lower among older men, currently married men, and men with at least one child; these differences are statistically significant in the majority of the countries studied. It is possible that getting married or having a child act as a catalyst for change or that, as they age, men’s attitudes shift toward less acceptance of wife beating. On the other hand, it may be that men who are less accepting of wife beating are more likely to marry and have children. However, determining whether there is a causal relationship or a selection effect among these factors is beyond the scope of this study.
7.1.3. Men’s attitudes toward wife beating and socioeconomic factors
Men’s agreement that wife beating is justified varies significantly by level of education and household wealth quintile (with the exception of Nepal). These attitudes also vary by urban-rural residence in all the countries except Nepal, Côte d’Ivoire, and the Democratic Republic of Congo.
0%
5%
10%
15%
20%
25%
30%
35%
40%
45%
50%
55%
60%
65%
70%
75%
None 1-2 children 3-4 children 5+ children
Gabon
Cameroon
Democratic Republic of Congo
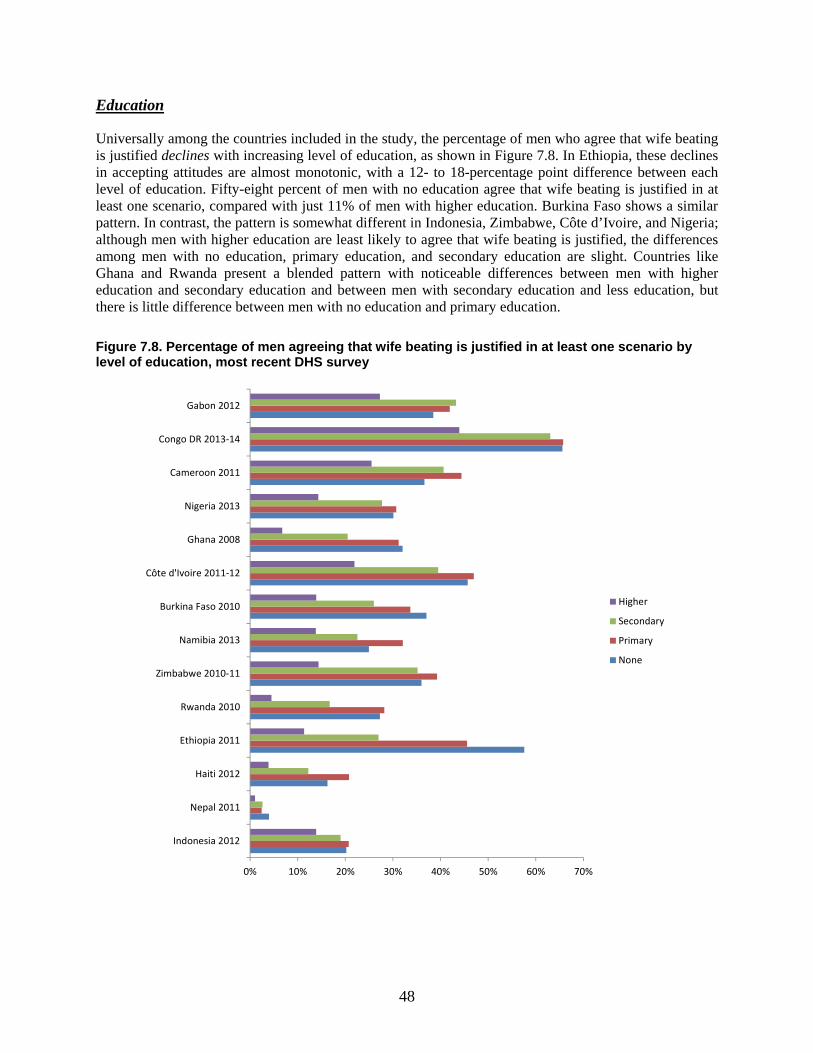
48
Education
Universally among the countries included in the study, the percentage of men who agree that wife beating is justified declines with increasing level of education, as shown in Figure 7.8. In Ethiopia, these declines in accepting attitudes are almost monotonic, with a 12- to 18-percentage point difference between each level of education. Fifty-eight percent of men with no education agree that wife beating is justified in at least one scenario, compared with just 11% of men with higher education. Burkina Faso shows a similar pattern. In contrast, the pattern is somewhat different in Indonesia, Zimbabwe, Côte d’Ivoire, and Nigeria; although men with higher education are least likely to agree that wife beating is justified, the differences among men with no education, primary education, and secondary education are slight. Countries like Ghana and Rwanda present a blended pattern with noticeable differences between men with higher education and secondary education and between men with secondary education and less education, but there is little difference between men with no education and primary education.
Figure 7.8. Percentage of men agreeing that wife beating is justified in at least one scenario by level of education, most recent DHS survey
0% 10% 20% 30% 40% 50% 60% 70%
Indonesia 2012
Nepal 2011
Haiti 2012
Ethiopia 2011
Rwanda 2010
Zimbabwe 2010-11
Namibia 2013
Burkina Faso 2010
Côte d'Ivoire 2011-12
Ghana 2008
Nigeria 2013
Cameroon 2011
Congo DR 2013-14
Gabon 2012
Higher
Secondary
Primary
None
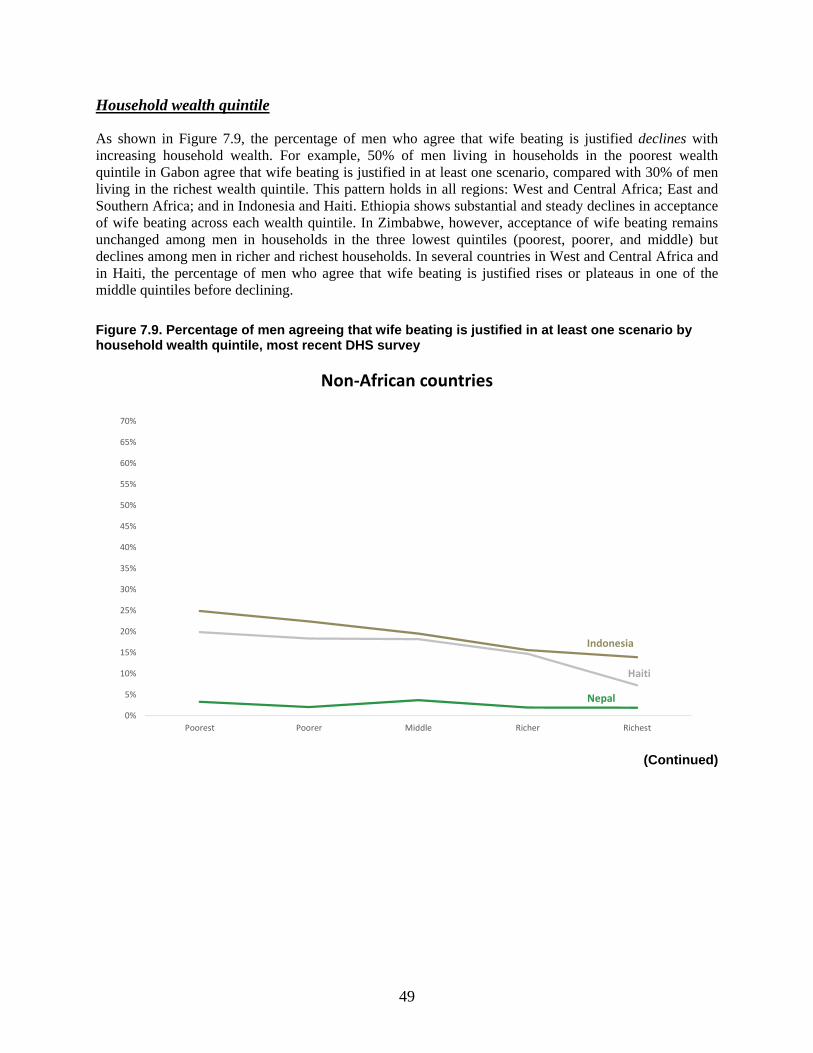
49
Household wealth quintile
As shown in Figure 7.9, the percentage of men who agree that wife beating is justified declines with increasing household wealth. For example, 50% of men living in households in the poorest wealth quintile in Gabon agree that wife beating is justified in at least one scenario, compared with 30% of men living in the richest wealth quintile. This pattern holds in all regions: West and Central Africa; East and Southern Africa; and in Indonesia and Haiti. Ethiopia shows substantial and steady declines in acceptance of wife beating across each wealth quintile. In Zimbabwe, however, acceptance of wife beating remains unchanged among men in households in the three lowest quintiles (poorest, poorer, and middle) but declines among men in richer and richest households. In several countries in West and Central Africa and in Haiti, the percentage of men who agree that wife beating is justified rises or plateaus in one of the middle quintiles before declining.
Figure 7.9. Percentage of men agreeing that wife beating is justified in at least one scenario by household wealth quintile, most recent DHS survey
(Continued)
0%
5%
10%
15%
20%
25%
30%
35%
40%
45%
50%
55%
60%
65%
70%
Poorest Poorer Middle Richer Richest
Non-African countries
Nepal
Indonesia
Haiti
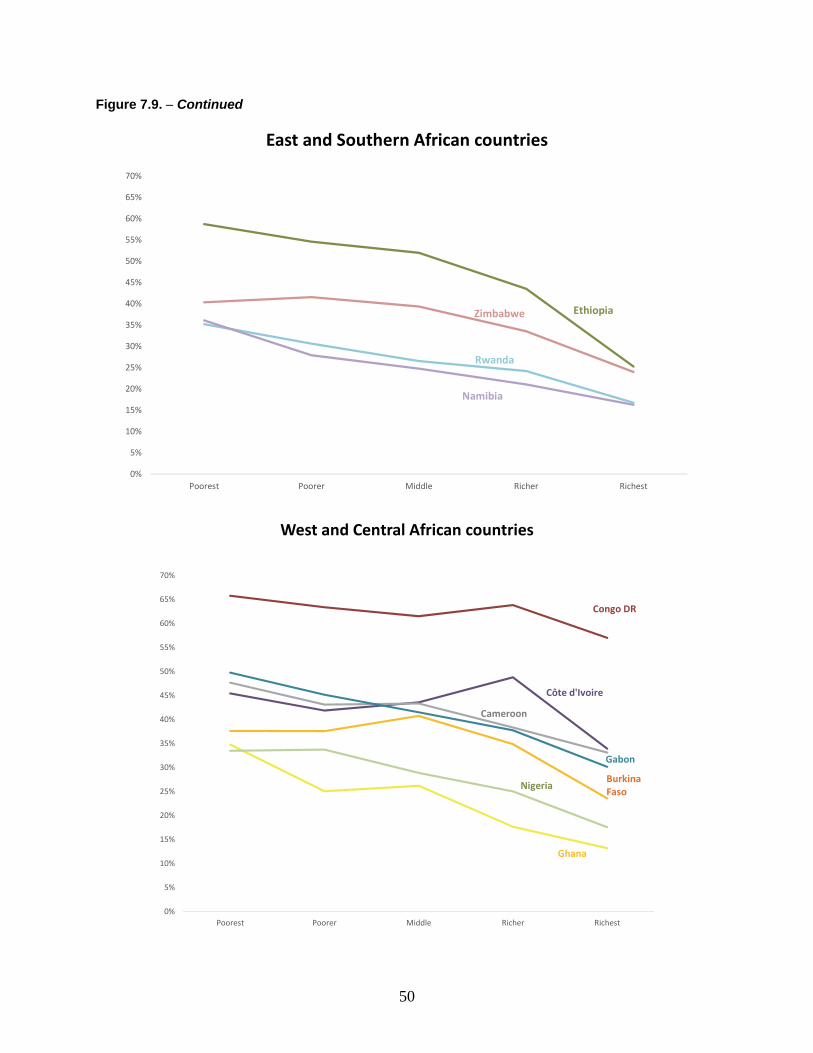
50
Figure 7.9. − Continued
0%
5%
10%
15%
20%
25%
30%
35%
40%
45%
50%
55%
60%
65%
70%
Poorest Poorer Middle Richer Richest
East and Southern African countries
EthiopiaZimbabwe
Rwanda
Namibia
0%
5%
10%
15%
20%
25%
30%
35%
40%
45%
50%
55%
60%
65%
70%
Poorest Poorer Middle Richer Richest
West and Central African countries
Côte d'Ivoire
Cameroon
Gabon
Burkina Faso
Nigeria
Ghana
Congo DR
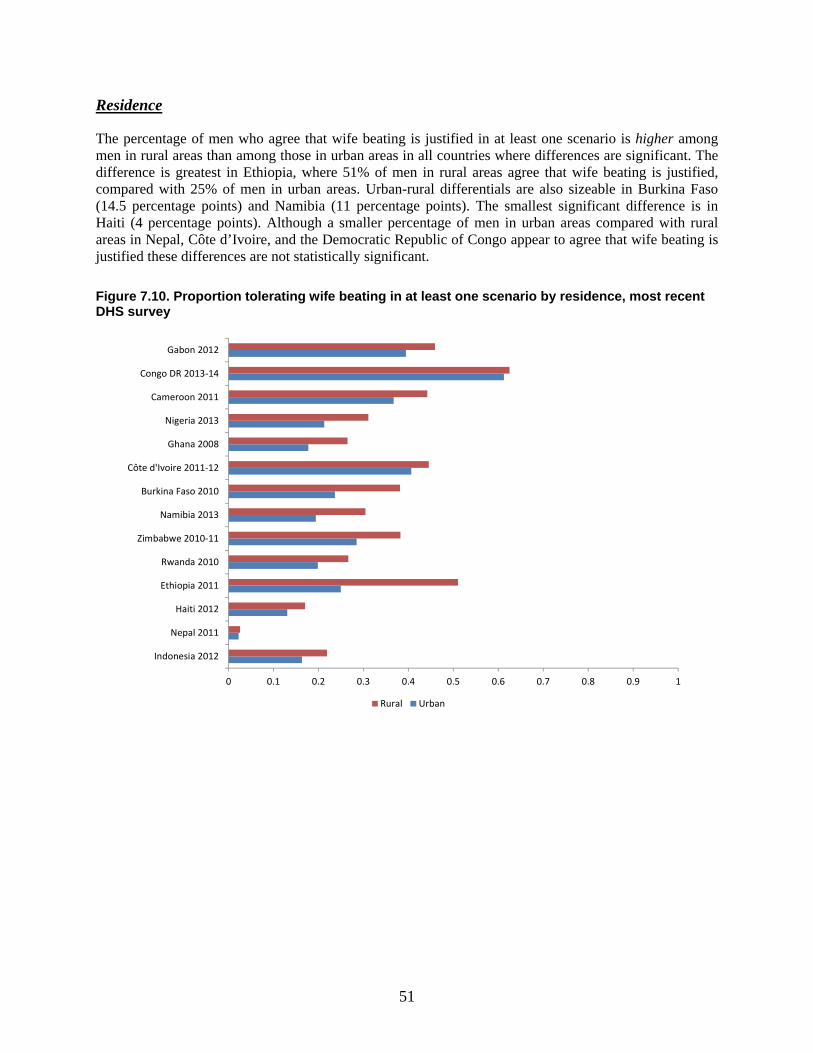
51
Residence
The percentage of men who agree that wife beating is justified in at least one scenario is higher among men in rural areas than among those in urban areas in all countries where differences are significant. The difference is greatest in Ethiopia, where 51% of men in rural areas agree that wife beating is justified, compared with 25% of men in urban areas. Urban-rural differentials are also sizeable in Burkina Faso (14.5 percentage points) and Namibia (11 percentage points). The smallest significant difference is in Haiti (4 percentage points). Although a smaller percentage of men in urban areas compared with rural areas in Nepal, Côte d’Ivoire, and the Democratic Republic of Congo appear to agree that wife beating is justified these differences are not statistically significant.
Figure 7.10. Proportion tolerating wife beating in at least one scenario by residence, most recent DHS survey
0 0.1 0.2 0.3 0.4 0.5 0.6 0.7 0.8 0.9 1
Indonesia 2012
Nepal 2011
Haiti 2012
Ethiopia 2011
Rwanda 2010
Zimbabwe 2010-11
Namibia 2013
Burkina Faso 2010
Côte d'Ivoire 2011-12
Ghana 2008
Nigeria 2013
Cameroon 2011
Congo DR 2013-14
Gabon 2012
Rural Urban
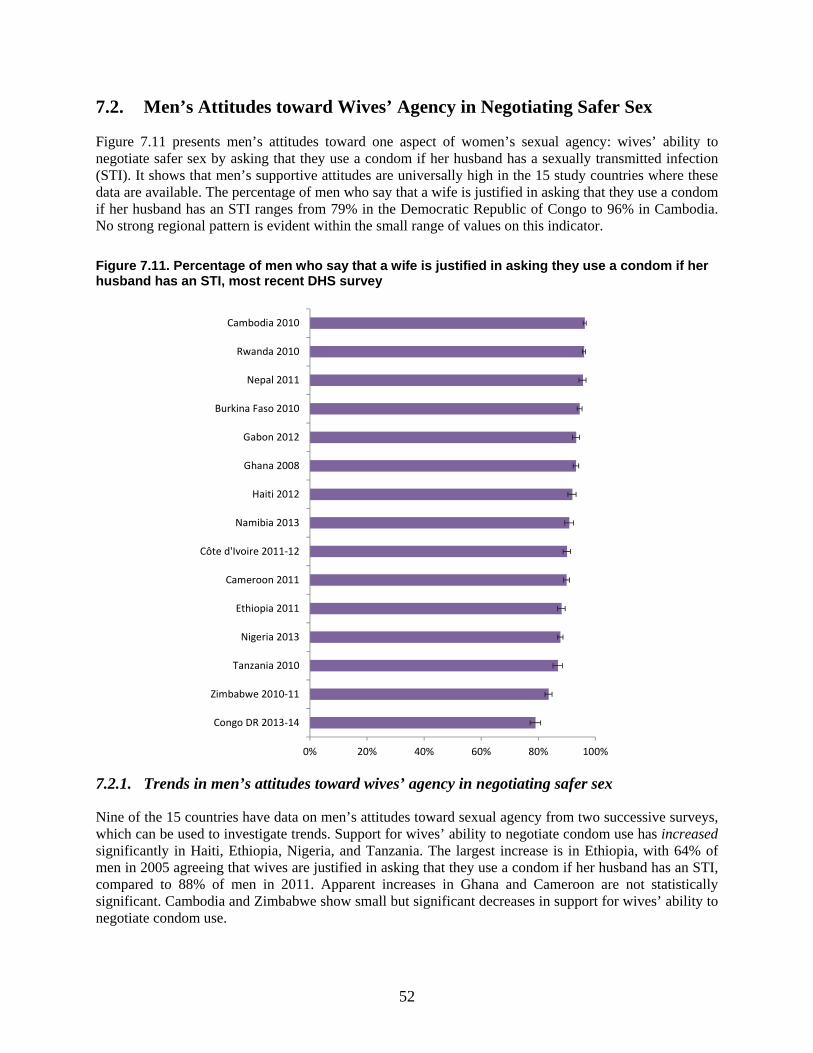
52
7.2. Men’s Attitudes toward Wives’ Agency in Negotiating Safer Sex
Figure 7.11 presents men’s attitudes toward one aspect of women’s sexual agency: wives’ ability to negotiate safer sex by asking that they use a condom if her husband has a sexually transmitted infection (STI). It shows that men’s supportive attitudes are universally high in the 15 study countries where these data are available. The percentage of men who say that a wife is justified in asking that they use a condom if her husband has an STI ranges from 79% in the Democratic Republic of Congo to 96% in Cambodia. No strong regional pattern is evident within the small range of values on this indicator.
Figure 7.11. Percentage of men who say that a wife is justified in asking they use a condom if her husband has an STI, most recent DHS survey
7.2.1. Trends in men’s attitudes toward wives’ agency in negotiating safer sex
Nine of the 15 countries have data on men’s attitudes toward sexual agency from two successive surveys, which can be used to investigate trends. Support for wives’ ability to negotiate condom use has increased significantly in Haiti, Ethiopia, Nigeria, and Tanzania. The largest increase is in Ethiopia, with 64% of men in 2005 agreeing that wives are justified in asking that they use a condom if her husband has an STI, compared to 88% of men in 2011. Apparent increases in Ghana and Cameroon are not statistically significant. Cambodia and Zimbabwe show small but significant decreases in support for wives’ ability to negotiate condom use.
0% 20% 40% 60% 80% 100%
Congo DR 2013-14
Zimbabwe 2010-11
Tanzania 2010
Nigeria 2013
Ethiopia 2011
Cameroon 2011
Côte d'Ivoire 2011-12
Namibia 2013
Haiti 2012
Ghana 2008
Gabon 2012
Burkina Faso 2010
Nepal 2011
Rwanda 2010
Cambodia 2010
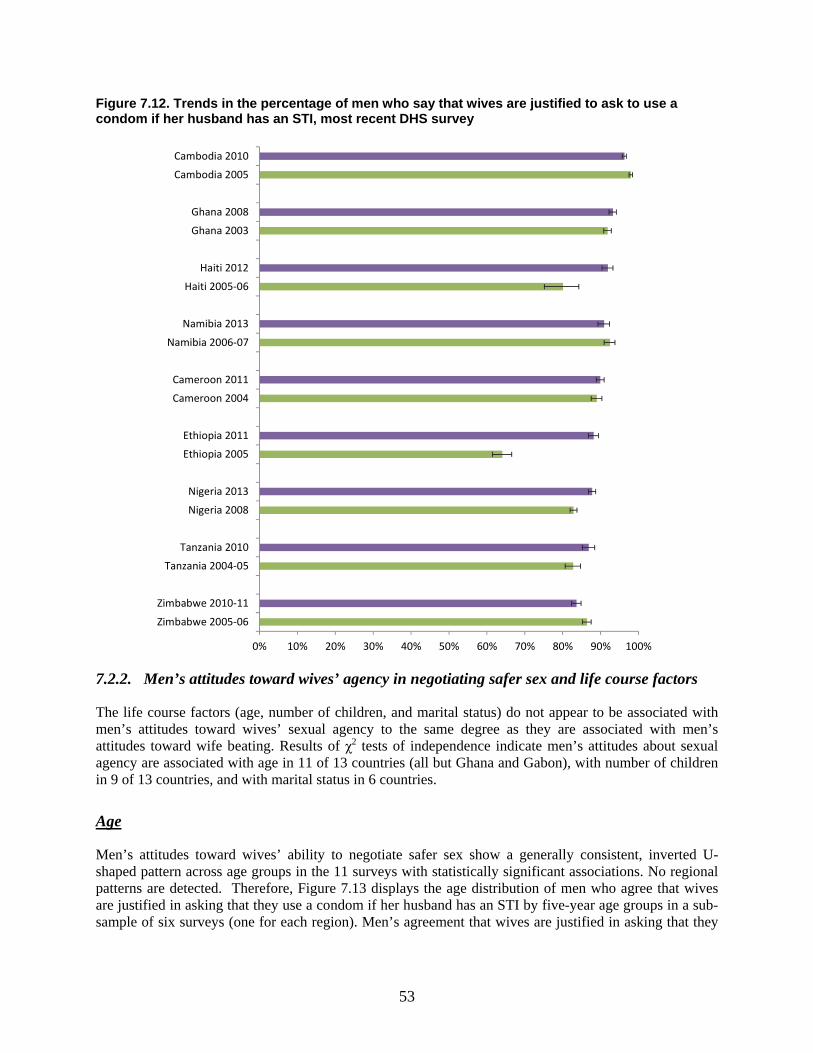
53
Figure 7.12. Trends in the percentage of men who say that wives are justified to ask to use a condom if her husband has an STI, most recent DHS survey
7.2.2. Men’s attitudes toward wives’ agency in negotiating safer sex and life course factors
The life course factors (age, number of children, and marital status) do not appear to be associated with men’s attitudes toward wives’ sexual agency to the same degree as they are associated with men’s attitudes toward wife beating. Results of χ2 tests of independence indicate men’s attitudes about sexual agency are associated with age in 11 of 13 countries (all but Ghana and Gabon), with number of children in 9 of 13 countries, and with marital status in 6 countries.
Age
Men’s attitudes toward wives’ ability to negotiate safer sex show a generally consistent, inverted U-shaped pattern across age groups in the 11 surveys with statistically significant associations. No regional patterns are detected. Therefore, Figure 7.13 displays the age distribution of men who agree that wives are justified in asking that they use a condom if her husband has an STI by five-year age groups in a sub-sample of six surveys (one for each region). Men’s agreement that wives are justified in asking that they
0% 10% 20% 30% 40% 50% 60% 70% 80% 90% 100%
Zimbabwe 2005-06
Zimbabwe 2010-11
Tanzania 2004-05
Tanzania 2010
Nigeria 2008
Nigeria 2013
Ethiopia 2005
Ethiopia 2011
Cameroon 2004
Cameroon 2011
Namibia 2006-07
Namibia 2013
Haiti 2005-06
Haiti 2012
Ghana 2003
Ghana 2008
Cambodia 2005
Cambodia 2010
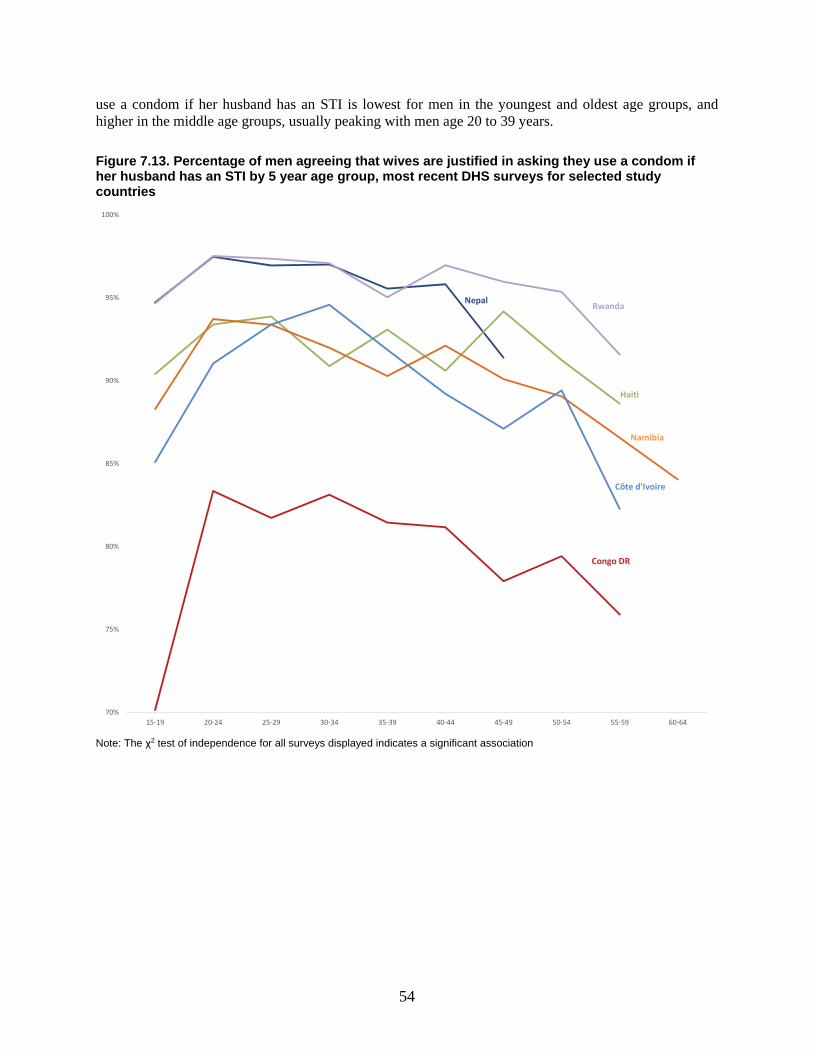
54
use a condom if her husband has an STI is lowest for men in the youngest and oldest age groups, and higher in the middle age groups, usually peaking with men age 20 to 39 years.
Figure 7.13. Percentage of men agreeing that wives are justified in asking they use a condom if her husband has an STI by 5 year age group, most recent DHS surveys for selected study countries
Note: The χ2 test of independence for all surveys displayed indicates a significant association
70%
75%
80%
85%
90%
95%
100%
15-19 20-24 25-29 30-34 35-39 40-44 45-49 50-54 55-59 60-64
Haiti
RwandaNepal
Namibia
Côte d'Ivoire
Congo DR
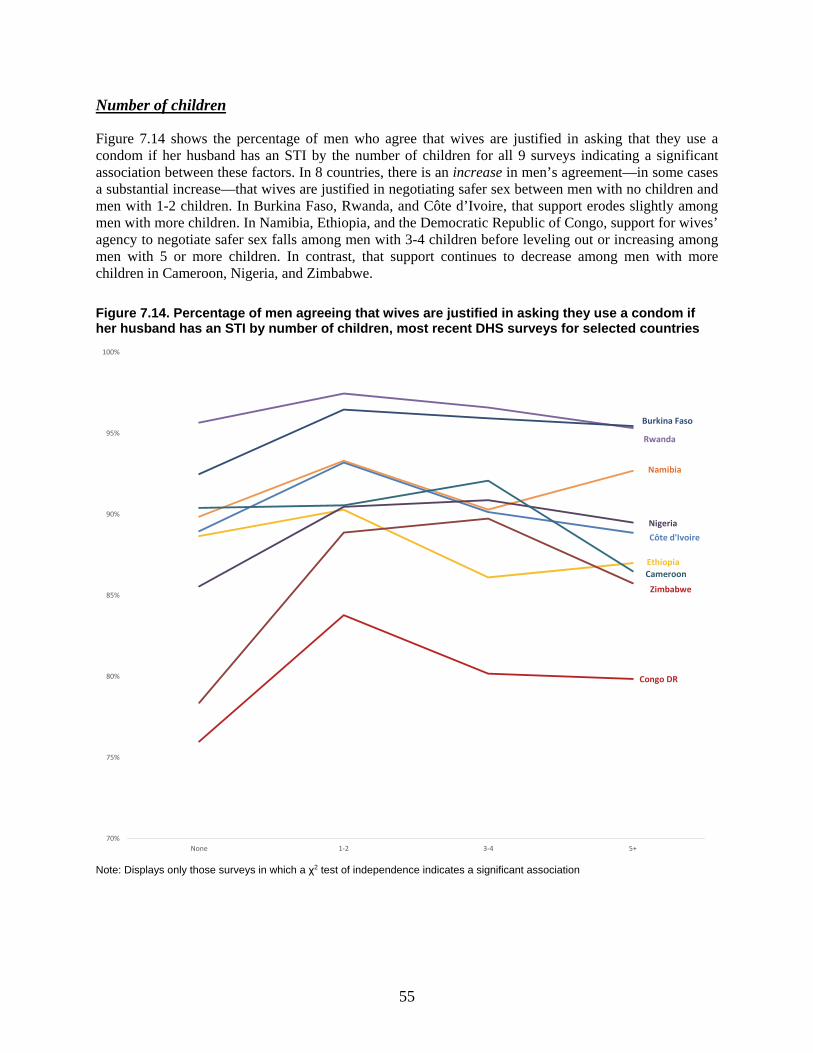
55
Number of children
Figure 7.14 shows the percentage of men who agree that wives are justified in asking that they use a condom if her husband has an STI by the number of children for all 9 surveys indicating a significant association between these factors. In 8 countries, there is an increase in men’s agreement—in some cases a substantial increase—that wives are justified in negotiating safer sex between men with no children and men with 1-2 children. In Burkina Faso, Rwanda, and Côte d’Ivoire, that support erodes slightly among men with more children. In Namibia, Ethiopia, and the Democratic Republic of Congo, support for wives’ agency to negotiate safer sex falls among men with 3-4 children before leveling out or increasing among men with 5 or more children. In contrast, that support continues to decrease among men with more children in Cameroon, Nigeria, and Zimbabwe.
Figure 7.14. Percentage of men agreeing that wives are justified in asking they use a condom if her husband has an STI by number of children, most recent DHS surveys for selected countries
Note: Displays only those surveys in which a χ2 test of independence indicates a significant association
70%
75%
80%
85%
90%
95%
100%
None 1-2 3-4 5+
Cameroon
Namibia
Nigeria
Rwanda
Côte d'Ivoire
Ethiopia
Zimbabwe
Congo DR
Burkina Faso
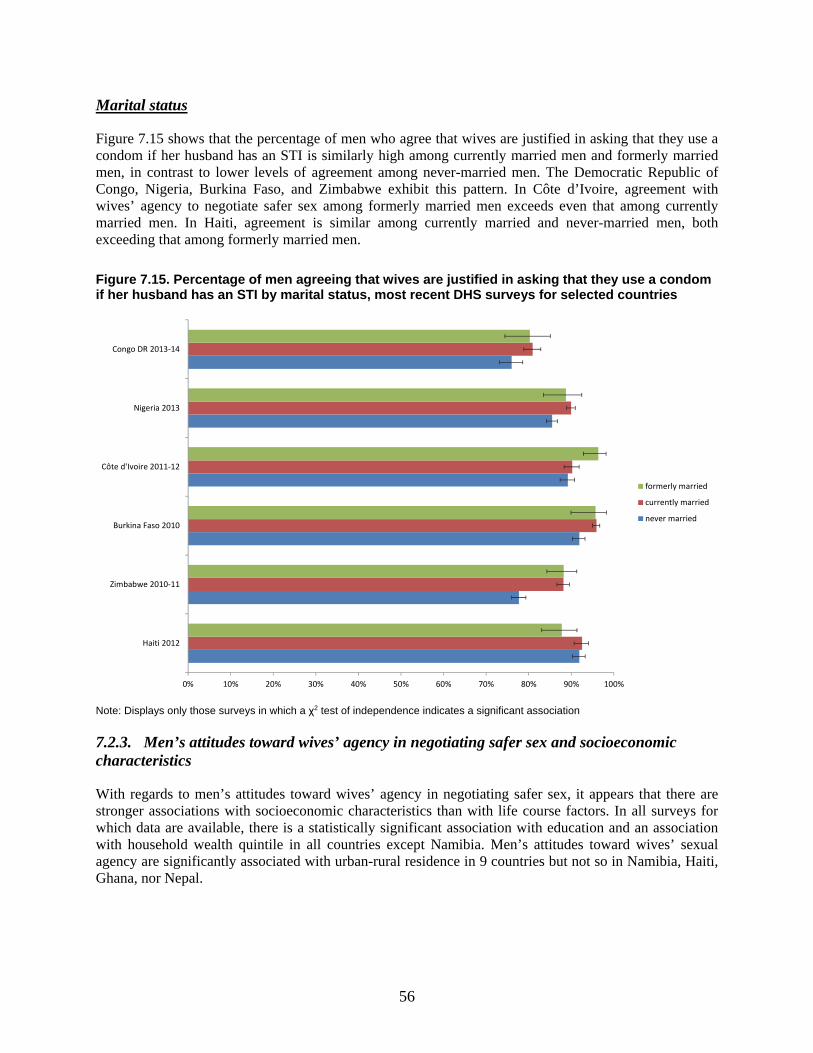
56
Marital status
Figure 7.15 shows that the percentage of men who agree that wives are justified in asking that they use a condom if her husband has an STI is similarly high among currently married men and formerly married men, in contrast to lower levels of agreement among never-married men. The Democratic Republic of Congo, Nigeria, Burkina Faso, and Zimbabwe exhibit this pattern. In Côte d’Ivoire, agreement with wives’ agency to negotiate safer sex among formerly married men exceeds even that among currently married men. In Haiti, agreement is similar among currently married and never-married men, both exceeding that among formerly married men.
Figure 7.15. Percentage of men agreeing that wives are justified in asking that they use a condom if her husband has an STI by marital status, most recent DHS surveys for selected countries
Note: Displays only those surveys in which a χ2 test of independence indicates a significant association
7.2.3. Men’s attitudes toward wives’ agency in negotiating safer sex and socioeconomic characteristics
With regards to men’s attitudes toward wives’ agency in negotiating safer sex, it appears that there are stronger associations with socioeconomic characteristics than with life course factors. In all surveys for which data are available, there is a statistically significant association with education and an association with household wealth quintile in all countries except Namibia. Men’s attitudes toward wives’ sexual agency are significantly associated with urban-rural residence in 9 countries but not so in Namibia, Haiti, Ghana, nor Nepal.
0% 10% 20% 30% 40% 50% 60% 70% 80% 90% 100%
Haiti 2012
Zimbabwe 2010-11
Burkina Faso 2010
Côte d'Ivoire 2011-12
Nigeria 2013
Congo DR 2013-14
formerly married
currently married
never married
57
Education
Men’s agreement that wives are justified in asking that they use a condom if her husband has an STI increases with increasing level of education in all study countries, as shown in Figure 7.16. There are significant increases in agreement between each successive level of education in Nigeria, the Democratic Republic of Congo, and Zimbabwe, where these differences are particularly pronounced. Just 53% of men with no education in Zimbabwe agree that wives are justified in asking that a condom be used if her husband has an STI, compared with 75% of men with primary education, 86% of men with secondary education, and 95% of men with higher education. In other countries, such as Burkina Faso, men’s agreement with wives’ sexual agency is bifurcated, being significantly higher among men with secondary or higher education on the one hand and lower among men with no education or primary education on the other, but differences between categories in the tails of the education distribution are slight. Nevertheless, men’s agreement with wives’ agency to negotiate safer sex is consistently lowest among men with no education. For example, in Haiti, 85% of men with no education agree with wives’ sexual agency compared with 96% of men with higher education.
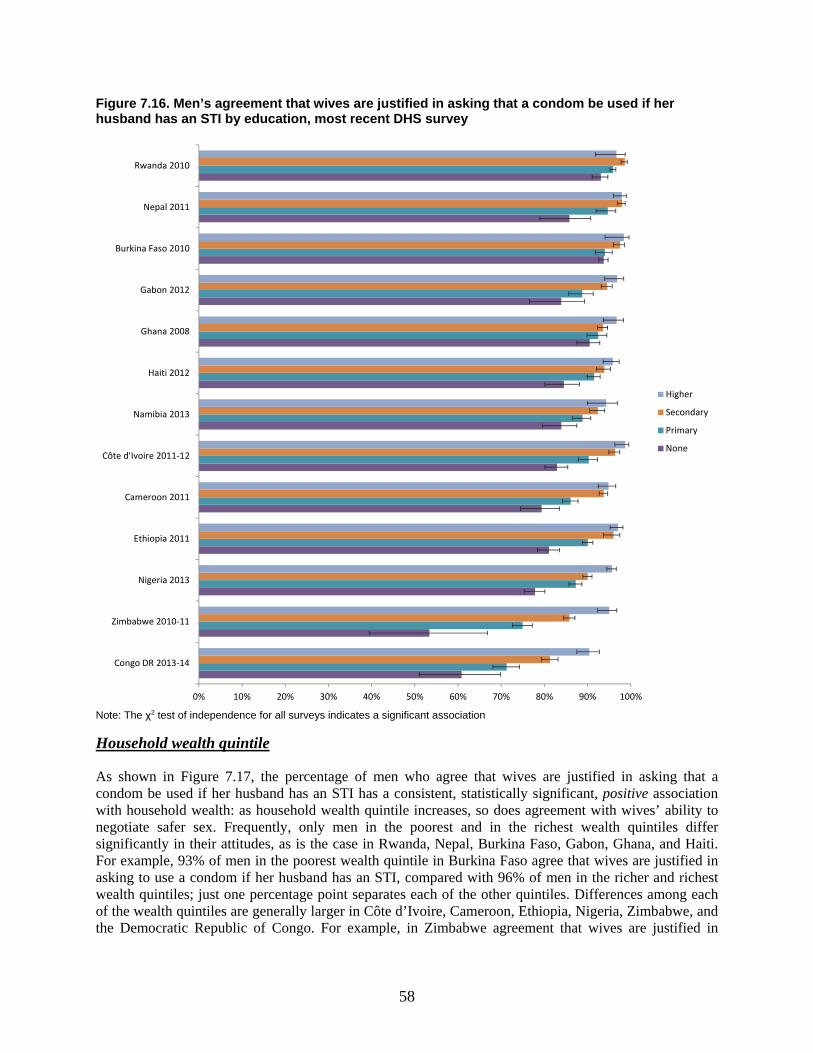
58
Figure 7.16. Men’s agreement that wives are justified in asking that a condom be used if her husband has an STI by education, most recent DHS survey
Note: The χ2 test of independence for all surveys indicates a significant association Household wealth quintile
As shown in Figure 7.17, the percentage of men who agree that wives are justified in asking that a condom be used if her husband has an STI has a consistent, statistically significant, positive association with household wealth: as household wealth quintile increases, so does agreement with wives’ ability to negotiate safer sex. Frequently, only men in the poorest and in the richest wealth quintiles differ significantly in their attitudes, as is the case in Rwanda, Nepal, Burkina Faso, Gabon, Ghana, and Haiti. For example, 93% of men in the poorest wealth quintile in Burkina Faso agree that wives are justified in asking to use a condom if her husband has an STI, compared with 96% of men in the richer and richest wealth quintiles; just one percentage point separates each of the other quintiles. Differences among each of the wealth quintiles are generally larger in Côte d’Ivoire, Cameroon, Ethiopia, Nigeria, Zimbabwe, and the Democratic Republic of Congo. For example, in Zimbabwe agreement that wives are justified in
0% 10% 20% 30% 40% 50% 60% 70% 80% 90% 100%
Congo DR 2013-14
Zimbabwe 2010-11
Nigeria 2013
Ethiopia 2011
Cameroon 2011
Côte d'Ivoire 2011-12
Namibia 2013
Haiti 2012
Ghana 2008
Gabon 2012
Burkina Faso 2010
Nepal 2011
Rwanda 2010
Higher
Secondary
Primary
None
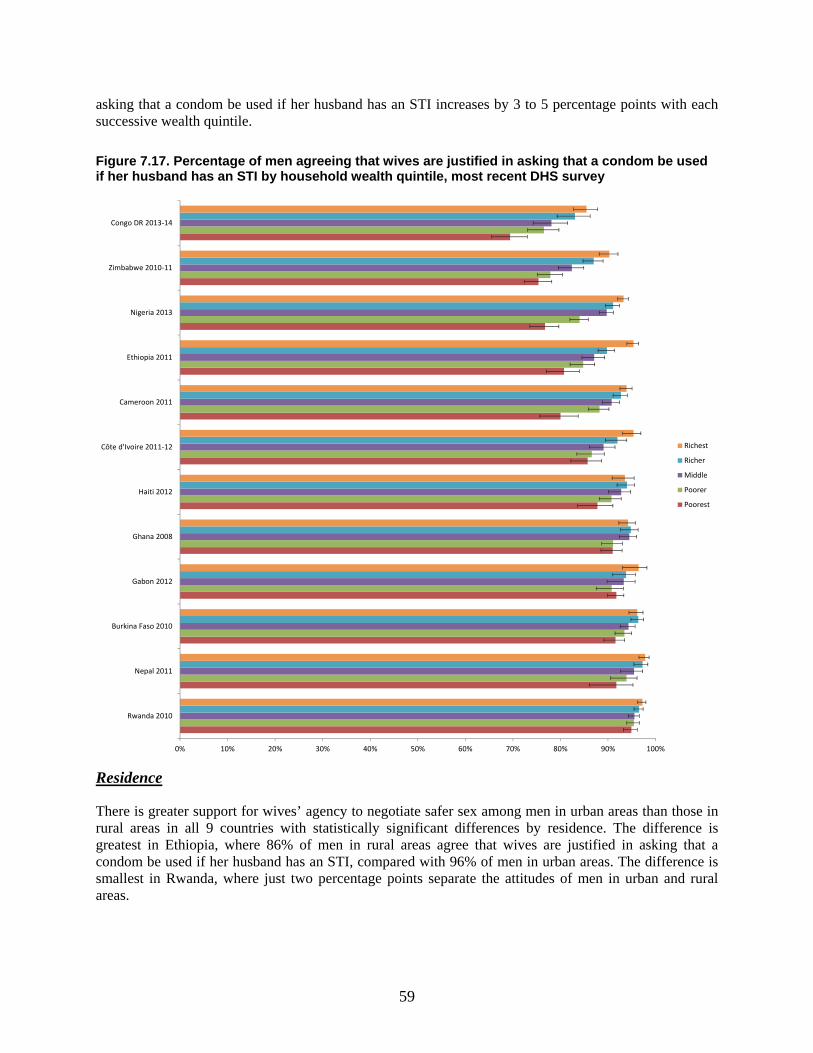
59
asking that a condom be used if her husband has an STI increases by 3 to 5 percentage points with each successive wealth quintile.
Figure 7.17. Percentage of men agreeing that wives are justified in asking that a condom be used if her husband has an STI by household wealth quintile, most recent DHS survey
Residence
There is greater support for wives’ agency to negotiate safer sex among men in urban areas than those in rural areas in all 9 countries with statistically significant differences by residence. The difference is greatest in Ethiopia, where 86% of men in rural areas agree that wives are justified in asking that a condom be used if her husband has an STI, compared with 96% of men in urban areas. The difference is smallest in Rwanda, where just two percentage points separate the attitudes of men in urban and rural areas.
0% 10% 20% 30% 40% 50% 60% 70% 80% 90% 100%
Rwanda 2010
Nepal 2011
Burkina Faso 2010
Gabon 2012
Ghana 2008
Haiti 2012
Côte d'Ivoire 2011-12
Cameroon 2011
Ethiopia 2011
Nigeria 2013
Zimbabwe 2010-11
Congo DR 2013-14
Richest
Richer
Middle
Poorer
Poorest
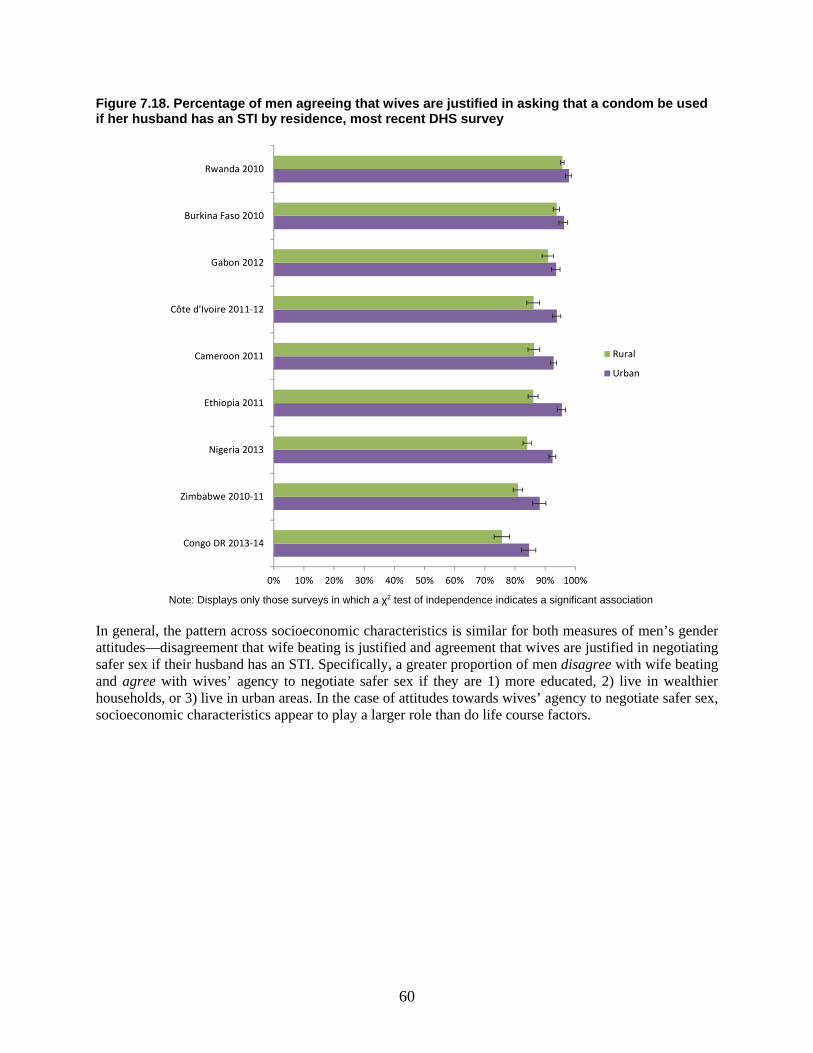
60
Figure 7.18. Percentage of men agreeing that wives are justified in asking that a condom be used if her husband has an STI by residence, most recent DHS survey
Note: Displays only those surveys in which a χ2 test of independence indicates a significant association
In general, the pattern across socioeconomic characteristics is similar for both measures of men’s gender attitudes—disagreement that wife beating is justified and agreement that wives are justified in negotiating safer sex if their husband has an STI. Specifically, a greater proportion of men disagree with wife beating and agree with wives’ agency to negotiate safer sex if they are 1) more educated, 2) live in wealthier households, or 3) live in urban areas. In the case of attitudes towards wives’ agency to negotiate safer sex, socioeconomic characteristics appear to play a larger role than do life course factors.
0% 10% 20% 30% 40% 50% 60% 70% 80% 90% 100%
Congo DR 2013-14
Zimbabwe 2010-11
Nigeria 2013
Ethiopia 2011
Cameroon 2011
Côte d'Ivoire 2011-12
Gabon 2012
Burkina Faso 2010
Rwanda 2010
Rural
Urban
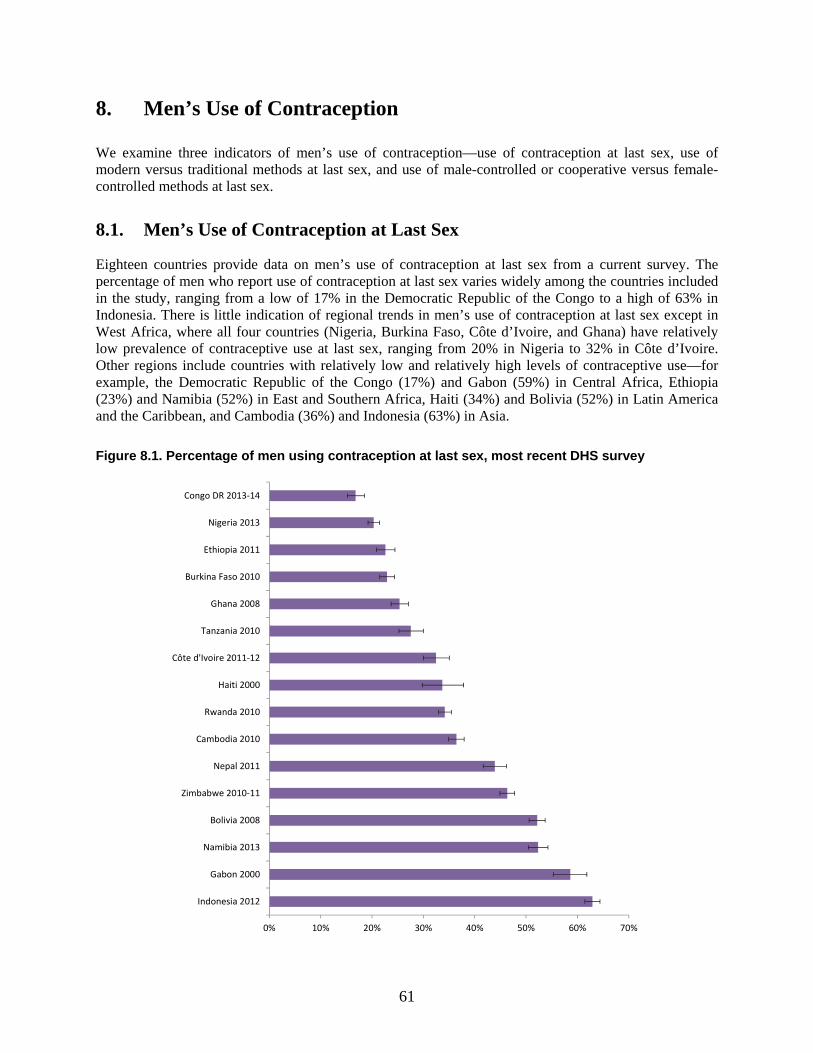
61
8. Men’s Use of Contraception
We examine three indicators of men’s use of contraception—use of contraception at last sex, use of modern versus traditional methods at last sex, and use of male-controlled or cooperative versus female-controlled methods at last sex.
8.1. Men’s Use of Contraception at Last Sex
Eighteen countries provide data on men’s use of contraception at last sex from a current survey. The percentage of men who report use of contraception at last sex varies widely among the countries included in the study, ranging from a low of 17% in the Democratic Republic of the Congo to a high of 63% in Indonesia. There is little indication of regional trends in men’s use of contraception at last sex except in West Africa, where all four countries (Nigeria, Burkina Faso, Côte d’Ivoire, and Ghana) have relatively low prevalence of contraceptive use at last sex, ranging from 20% in Nigeria to 32% in Côte d’Ivoire. Other regions include countries with relatively low and relatively high levels of contraceptive use—for example, the Democratic Republic of the Congo (17%) and Gabon (59%) in Central Africa, Ethiopia (23%) and Namibia (52%) in East and Southern Africa, Haiti (34%) and Bolivia (52%) in Latin America and the Caribbean, and Cambodia (36%) and Indonesia (63%) in Asia.
Figure 8.1. Percentage of men using contraception at last sex, most recent DHS survey
0% 10% 20% 30% 40% 50% 60% 70%
Indonesia 2012
Gabon 2000
Namibia 2013
Bolivia 2008
Zimbabwe 2010-11
Nepal 2011
Cambodia 2010
Rwanda 2010
Haiti 2000
Côte d'Ivoire 2011-12
Tanzania 2010
Ghana 2008
Burkina Faso 2010
Ethiopia 2011
Nigeria 2013
Congo DR 2013-14
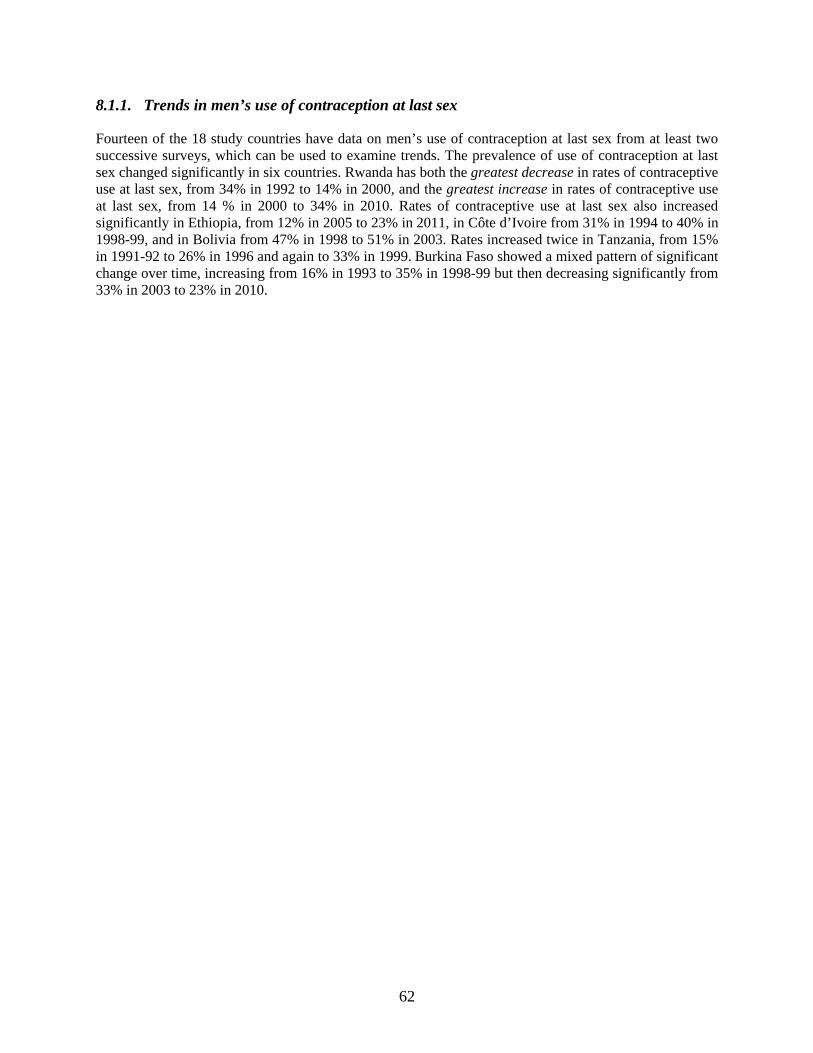
62
8.1.1. Trends in men’s use of contraception at last sex
Fourteen of the 18 study countries have data on men’s use of contraception at last sex from at least two successive surveys, which can be used to examine trends. The prevalence of use of contraception at last sex changed significantly in six countries. Rwanda has both the greatest decrease in rates of contraceptive use at last sex, from 34% in 1992 to 14% in 2000, and the greatest increase in rates of contraceptive use at last sex, from 14 % in 2000 to 34% in 2010. Rates of contraceptive use at last sex also increased significantly in Ethiopia, from 12% in 2005 to 23% in 2011, in Côte d’Ivoire from 31% in 1994 to 40% in 1998-99, and in Bolivia from 47% in 1998 to 51% in 2003. Rates increased twice in Tanzania, from 15% in 1991-92 to 26% in 1996 and again to 33% in 1999. Burkina Faso showed a mixed pattern of significant change over time, increasing from 16% in 1993 to 35% in 1998-99 but then decreasing significantly from 33% in 2003 to 23% in 2010.
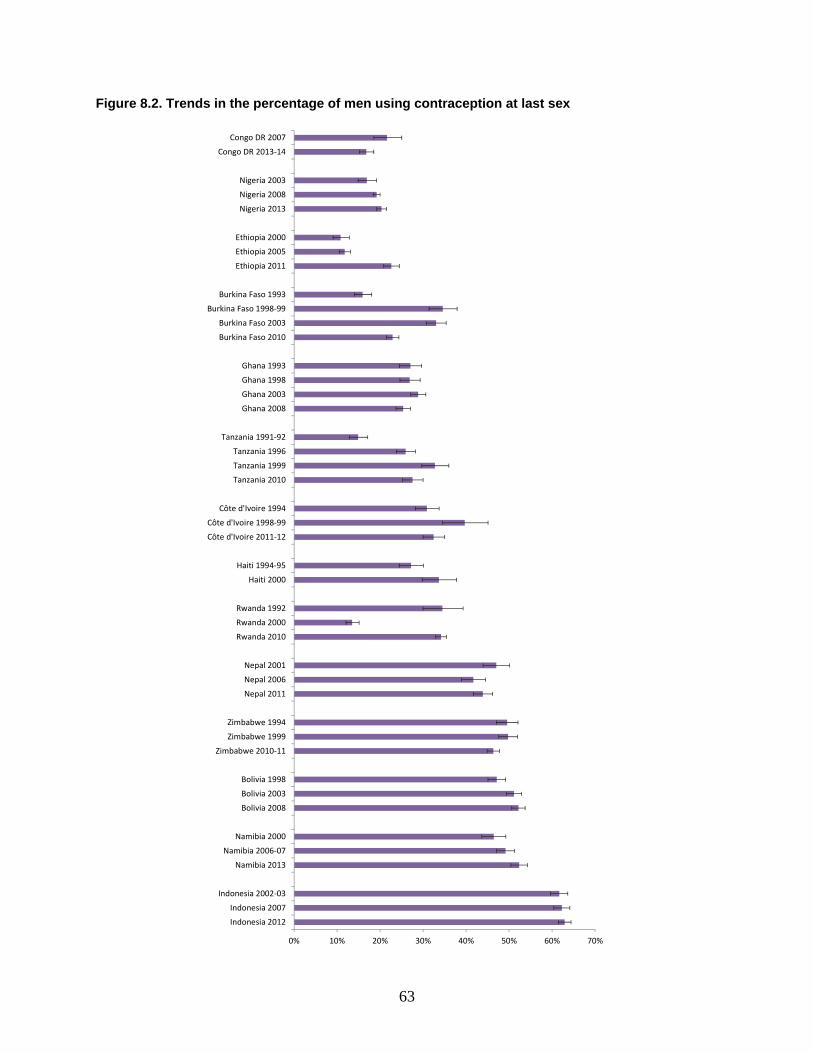
63
Figure 8.2. Trends in the percentage of men using contraception at last sex
0% 10% 20% 30% 40% 50% 60% 70%
Indonesia 2012
Indonesia 2007
Indonesia 2002-03
Namibia 2013
Namibia 2006-07
Namibia 2000
Bolivia 2008
Bolivia 2003
Bolivia 1998
Zimbabwe 2010-11
Zimbabwe 1999
Zimbabwe 1994
Nepal 2011
Nepal 2006
Nepal 2001
Rwanda 2010
Rwanda 2000
Rwanda 1992
Haiti 2000
Haiti 1994-95
Côte d'Ivoire 2011-12
Côte d'Ivoire 1998-99
Côte d'Ivoire 1994
Tanzania 2010
Tanzania 1999
Tanzania 1996
Tanzania 1991-92
Ghana 2008
Ghana 2003
Ghana 1998
Ghana 1993
Burkina Faso 2010
Burkina Faso 2003
Burkina Faso 1998-99
Burkina Faso 1993
Ethiopia 2011
Ethiopia 2005
Ethiopia 2000
Nigeria 2013
Nigeria 2008
Nigeria 2003
Congo DR 2013-14
Congo DR 2007
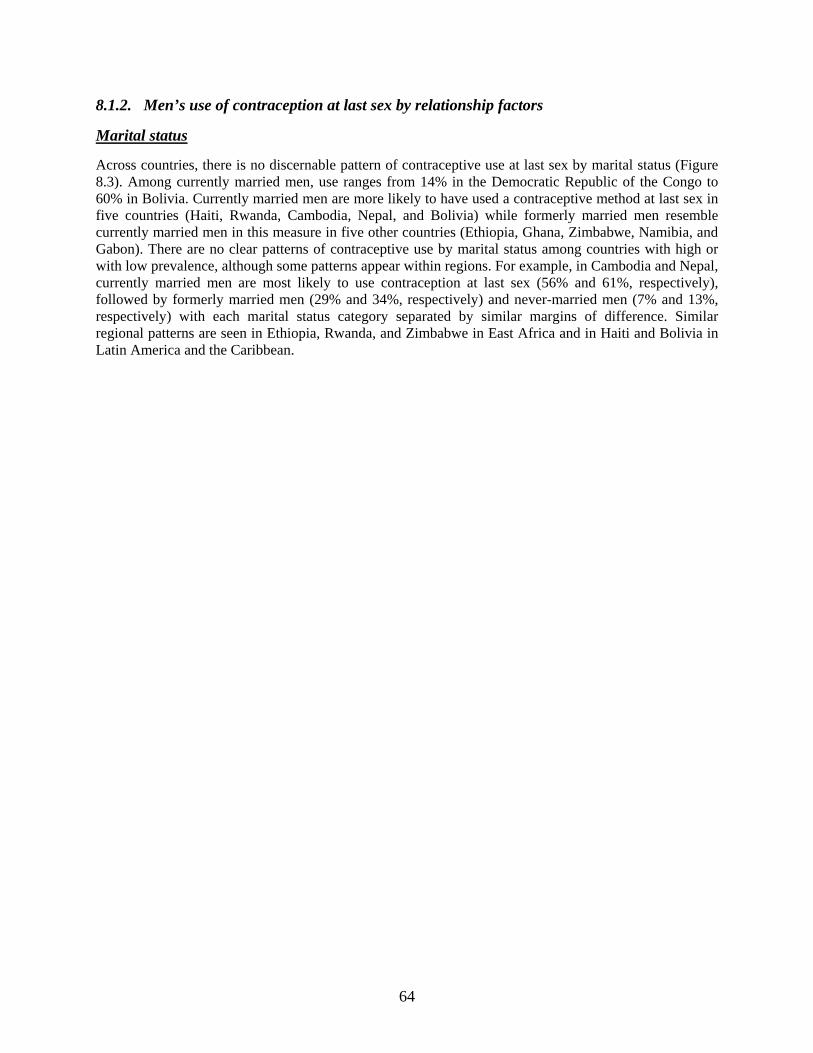
64
8.1.2. Men’s use of contraception at last sex by relationship factors
Marital status
Across countries, there is no discernable pattern of contraceptive use at last sex by marital status (Figure 8.3). Among currently married men, use ranges from 14% in the Democratic Republic of the Congo to 60% in Bolivia. Currently married men are more likely to have used a contraceptive method at last sex in five countries (Haiti, Rwanda, Cambodia, Nepal, and Bolivia) while formerly married men resemble currently married men in this measure in five other countries (Ethiopia, Ghana, Zimbabwe, Namibia, and Gabon). There are no clear patterns of contraceptive use by marital status among countries with high or with low prevalence, although some patterns appear within regions. For example, in Cambodia and Nepal, currently married men are most likely to use contraception at last sex (56% and 61%, respectively), followed by formerly married men (29% and 34%, respectively) and never-married men (7% and 13%, respectively) with each marital status category separated by similar margins of difference. Similar regional patterns are seen in Ethiopia, Rwanda, and Zimbabwe in East Africa and in Haiti and Bolivia in Latin America and the Caribbean.
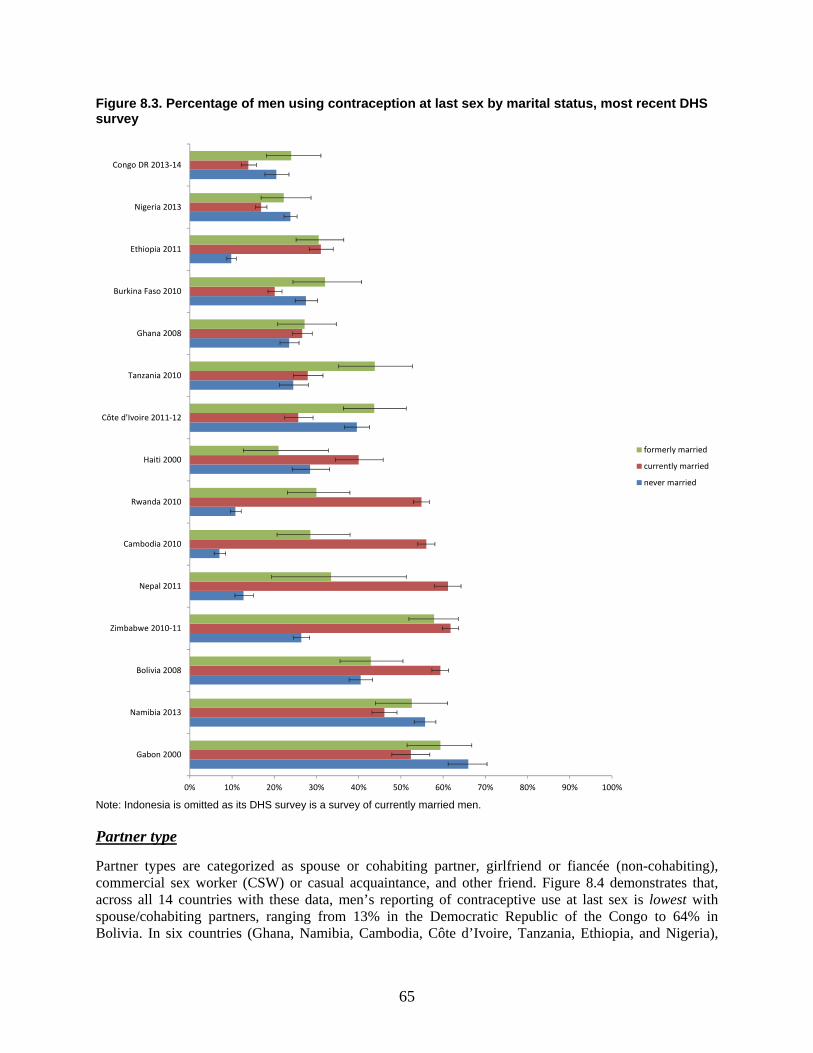
65
Figure 8.3. Percentage of men using contraception at last sex by marital status, most recent DHS survey
Note: Indonesia is omitted as its DHS survey is a survey of currently married men.
Partner type
Partner types are categorized as spouse or cohabiting partner, girlfriend or fiancée (non-cohabiting), commercial sex worker (CSW) or casual acquaintance, and other friend. Figure 8.4 demonstrates that, across all 14 countries with these data, men’s reporting of contraceptive use at last sex is lowest with spouse/cohabiting partners, ranging from 13% in the Democratic Republic of the Congo to 64% in Bolivia. In six countries (Ghana, Namibia, Cambodia, Côte d’Ivoire, Tanzania, Ethiopia, and Nigeria),
0% 10% 20% 30% 40% 50% 60% 70% 80% 90% 100%
Gabon 2000
Namibia 2013
Bolivia 2008
Zimbabwe 2010-11
Nepal 2011
Cambodia 2010
Rwanda 2010
Haiti 2000
Côte d'Ivoire 2011-12
Tanzania 2010
Ghana 2008
Burkina Faso 2010
Ethiopia 2011
Nigeria 2013
Congo DR 2013-14
formerly married
currently married
never married
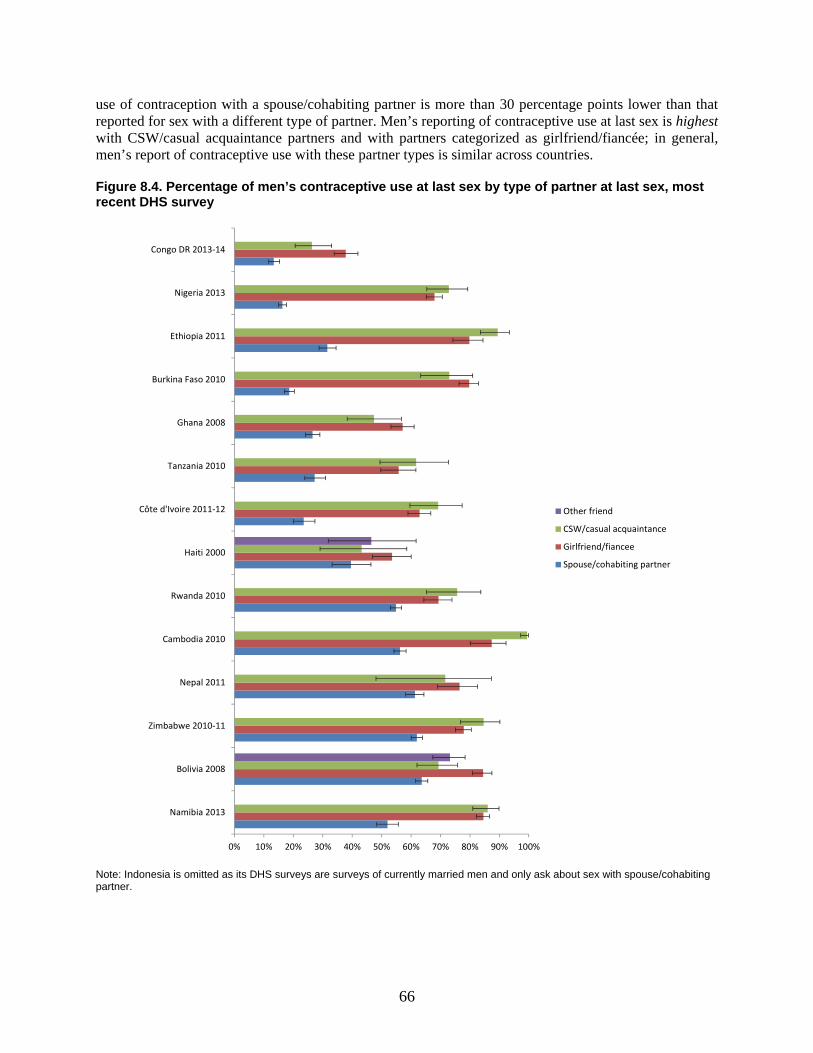
66
use of contraception with a spouse/cohabiting partner is more than 30 percentage points lower than that reported for sex with a different type of partner. Men’s reporting of contraceptive use at last sex is highest with CSW/casual acquaintance partners and with partners categorized as girlfriend/fiancée; in general, men’s report of contraceptive use with these partner types is similar across countries.
Figure 8.4. Percentage of men’s contraceptive use at last sex by type of partner at last sex, most recent DHS survey
Note: Indonesia is omitted as its DHS surveys are surveys of currently married men and only ask about sex with spouse/cohabiting partner.
0% 10% 20% 30% 40% 50% 60% 70% 80% 90% 100%
Namibia 2013
Bolivia 2008
Zimbabwe 2010-11
Nepal 2011
Cambodia 2010
Rwanda 2010
Haiti 2000
Côte d'Ivoire 2011-12
Tanzania 2010
Ghana 2008
Burkina Faso 2010
Ethiopia 2011
Nigeria 2013
Congo DR 2013-14
Other friend
CSW/casual acquaintance
Girlfriend/fiancee
Spouse/cohabiting partner
67
8.1.3. Trends in men’s use of contraception at last sex by relationship factors
Marital status
Thirteen countries have trend data on contraceptive use at last sex by marital status and are shown in Figure 8.5. Marital status may be a factor in the significant changes in contraceptive use that some countries have experienced over time. For example, in Burkina Faso and Ghana, significant changes in use of contraception at last sex occurred among currently married men while there are no significant changes among formerly or never-married men. Specifically, in Burkina Faso, condom use at last sex among currently married men increased substantially from 13% in 1993 to 39% in 1998-99, but decreased to 20% in 2010. In Ghana, use of contraception at last sex among currently married men decreased significantly from 35% in 2003 to 27% in 2008. In Rwanda, significant change occurred over time among both currently married and formerly married men. Finally, in Ethiopia, contraceptive use at last sex increased significantly among all men, regardless of marital status.
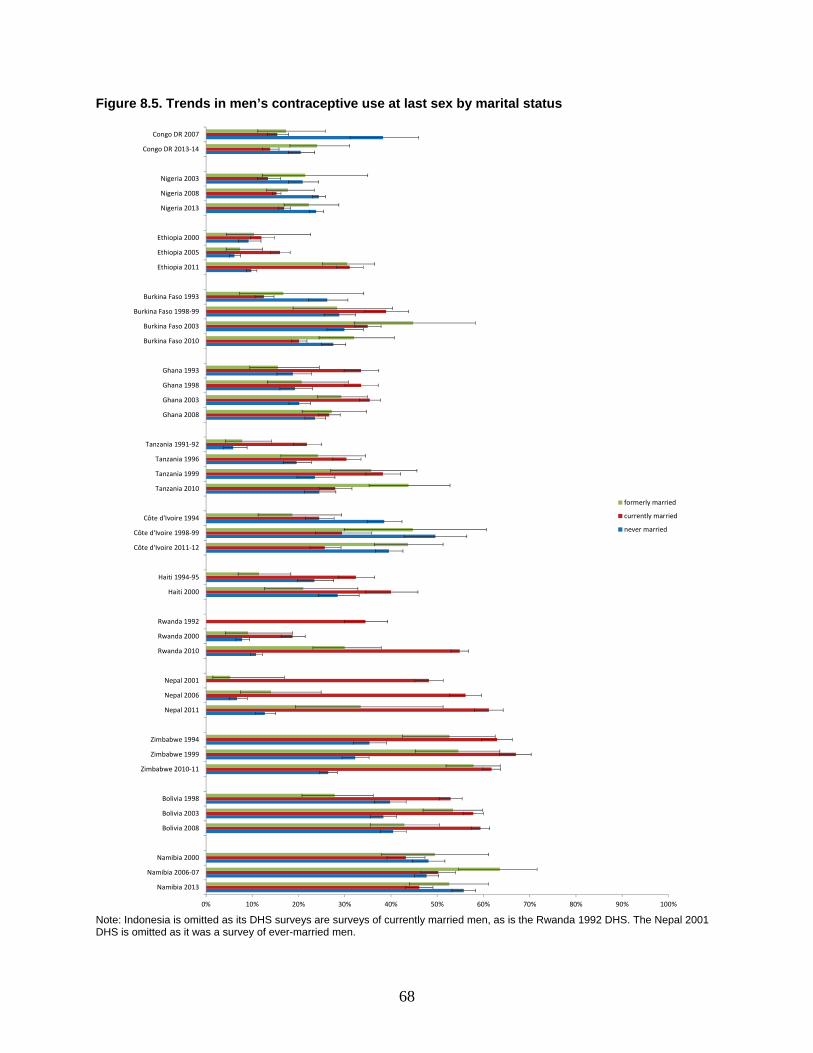
68
Figure 8.5. Trends in men’s contraceptive use at last sex by marital status
Note: Indonesia is omitted as its DHS surveys are surveys of currently married men, as is the Rwanda 1992 DHS. The Nepal 2001 DHS is omitted as it was a survey of ever-married men.
0% 10% 20% 30% 40% 50% 60% 70% 80% 90% 100%
Namibia 2013
Namibia 2006-07
Namibia 2000
Bolivia 2008
Bolivia 2003
Bolivia 1998
Zimbabwe 2010-11
Zimbabwe 1999
Zimbabwe 1994
Nepal 2011
Nepal 2006
Nepal 2001
Rwanda 2010
Rwanda 2000
Rwanda 1992
Haiti 2000
Haiti 1994-95
Côte d'Ivoire 2011-12
Côte d'Ivoire 1998-99
Côte d'Ivoire 1994
Tanzania 2010
Tanzania 1999
Tanzania 1996
Tanzania 1991-92
Ghana 2008
Ghana 2003
Ghana 1998
Ghana 1993
Burkina Faso 2010
Burkina Faso 2003
Burkina Faso 1998-99
Burkina Faso 1993
Ethiopia 2011
Ethiopia 2005
Ethiopia 2000
Nigeria 2013
Nigeria 2008
Nigeria 2003
Congo DR 2013-14
Congo DR 2007
formerly married
currently married
never married
69
Partner type
Ten countries have trend data on contraceptive use at last sex by partner type. Significant changes in contraceptive use at last sex occurred for partner types in five countries. Use at last sex with a spouse/cohabiting partner increased in Ethiopia and Rwanda and decreased in Burkina Faso and Ghana. Use at last sex with a CSW/casual acquaintance also increased in Ethiopia and Rwanda. Finally, use at last sex with a girlfriend/fiancée decreased in Ghana and increased in Nigeria. Only one country, Bolivia, reports trend data on men’s use of contraception at last sex with “other friend” and there is no significant change over time.
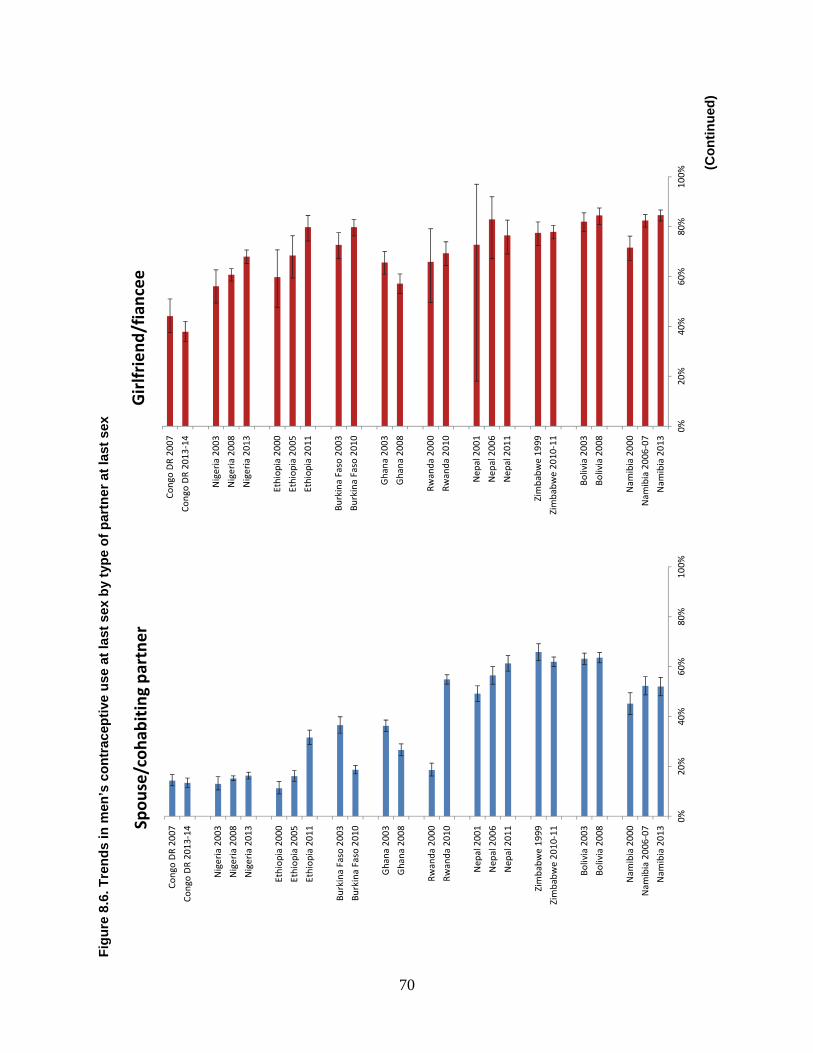
70
Fig
ure
8.6
. Tre
nd
s in
men
’s c
on
trac
epti
ve u
se a
t la
st s
ex b
y ty
pe
of
par
tner
at
last
sex
(Co
nti
nu
ed)
0%20
%40
%60
%80
%10
0%
Nam
ibia
201
3
Nam
ibia
200
6-07
Nam
ibia
200
0
Boliv
ia 2
008
Boliv
ia 2
003
Zim
babw
e 20
10-1
1
Zim
babw
e 19
99
Nep
al 2
011
Nep
al 2
006
Nep
al 2
001
Rwan
da 2
010
Rwan
da 2
000
Gha
na 2
008
Gha
na 2
003
Burk
ina
Faso
201
0
Burk
ina
Faso
200
3
Ethi
opia
201
1
Ethi
opia
200
5
Ethi
opia
200
0
Nig
eria
201
3
Nig
eria
200
8
Nig
eria
200
3
Cong
o D
R 20
13-1
4
Cong
o D
R 20
07
Spou
se/c
ohab
itin
g pa
rtne
r
0%20
%40
%60
%80
%10
0%
Nam
ibia
201
3
Nam
ibia
200
6-07
Nam
ibia
200
0
Boliv
ia 2
008
Boliv
ia 2
003
Zim
babw
e 20
10-1
1
Zim
babw
e 19
99
Nep
al 2
011
Nep
al 2
006
Nep
al 2
001
Rwan
da 2
010
Rwan
da 2
000
Gha
na 2
008
Gha
na 2
003
Burk
ina
Faso
201
0
Burk
ina
Faso
200
3
Ethi
opia
201
1
Ethi
opia
200
5
Ethi
opia
200
0
Nig
eria
201
3
Nig
eria
200
8
Nig
eria
200
3
Cong
o D
R 20
13-1
4
Cong
o D
R 20
07
Gir
lfrie
nd/f
ianc
ee
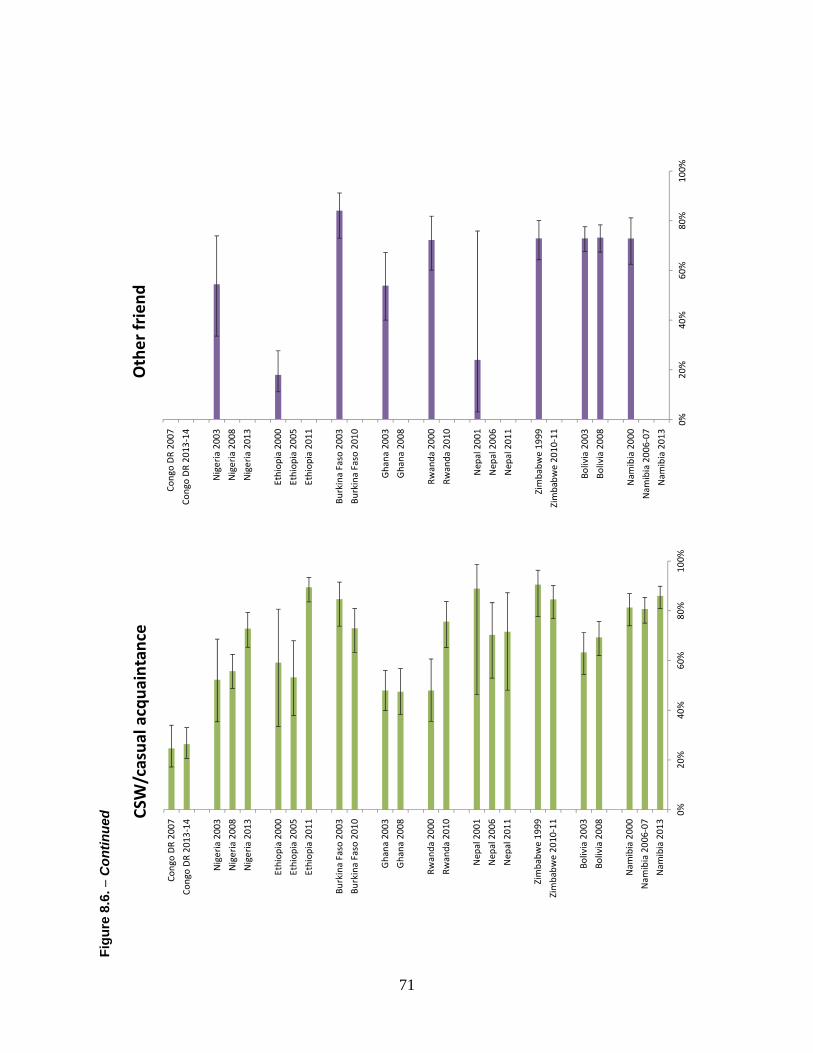
71
Fig
ure
8.6
. − C
ontin
ued
0%
20%
40%
60%
80%
100%
Nam
ibia
201
3
Nam
ibia
200
6-07
Nam
ibia
200
0
Boliv
ia 2
008
Boliv
ia 2
003
Zim
babw
e 20
10-1
1
Zim
babw
e 19
99
Nep
al 2
011
Nep
al 2
006
Nep
al 2
001
Rwan
da 2
010
Rwan
da 2
000
Gha
na 2
008
Gha
na 2
003
Burk
ina
Faso
201
0
Burk
ina
Faso
200
3
Ethi
opia
201
1
Ethi
opia
200
5
Ethi
opia
200
0
Nig
eria
201
3
Nig
eria
200
8
Nig
eria
200
3
Cong
o D
R 20
13-1
4
Cong
o D
R 20
07
CSW
/cas
ual a
cqua
inta
nce
0%20
%40
%60
%80
%10
0%
Nam
ibia
201
3
Nam
ibia
200
6-07
Nam
ibia
200
0
Boliv
ia 2
008
Boliv
ia 2
003
Zim
babw
e 20
10-1
1
Zim
babw
e 19
99
Nep
al 2
011
Nep
al 2
006
Nep
al 2
001
Rwan
da 2
010
Rwan
da 2
000
Gha
na 2
008
Gha
na 2
003
Burk
ina
Faso
201
0
Burk
ina
Faso
200
3
Ethi
opia
201
1
Ethi
opia
200
5
Ethi
opia
200
0
Nig
eria
201
3
Nig
eria
200
8
Nig
eria
200
3
Cong
o D
R 20
13-1
4
Cong
o D
R 20
07
Oth
er fr
iend
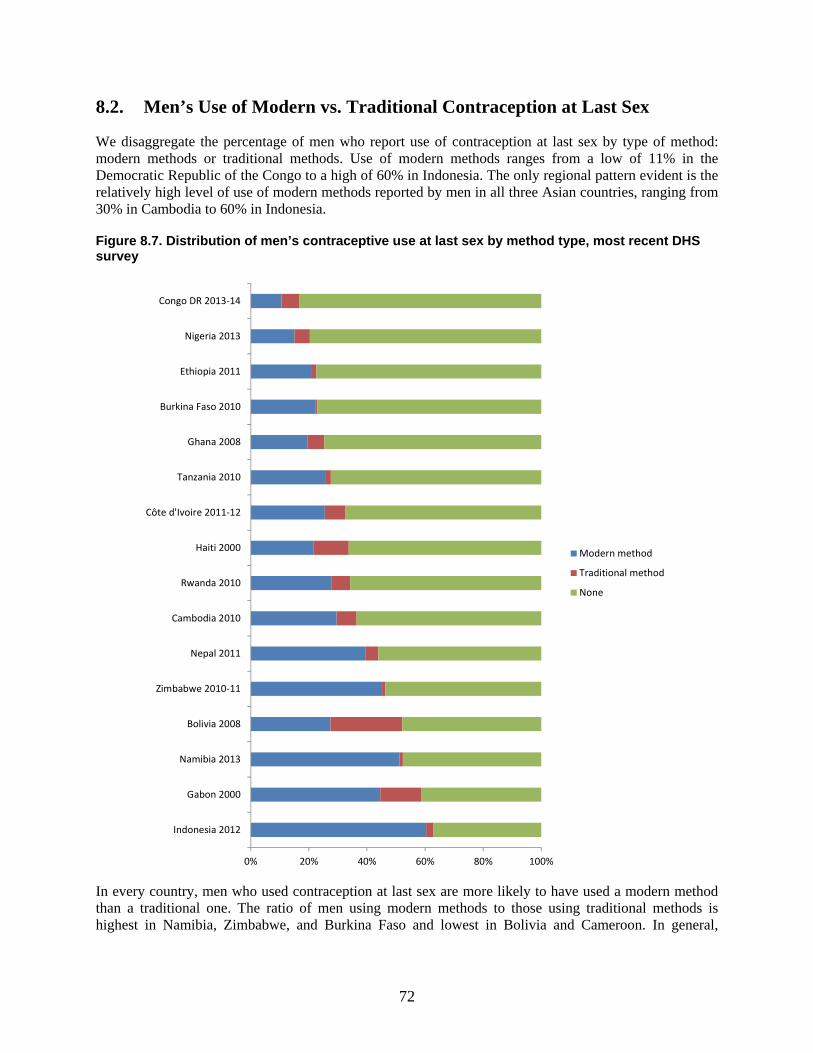
72
8.2. Men’s Use of Modern vs. Traditional Contraception at Last Sex
We disaggregate the percentage of men who report use of contraception at last sex by type of method: modern methods or traditional methods. Use of modern methods ranges from a low of 11% in the Democratic Republic of the Congo to a high of 60% in Indonesia. The only regional pattern evident is the relatively high level of use of modern methods reported by men in all three Asian countries, ranging from 30% in Cambodia to 60% in Indonesia.
Figure 8.7. Distribution of men’s contraceptive use at last sex by method type, most recent DHS survey
In every country, men who used contraception at last sex are more likely to have used a modern method than a traditional one. The ratio of men using modern methods to those using traditional methods is highest in Namibia, Zimbabwe, and Burkina Faso and lowest in Bolivia and Cameroon. In general,
0% 20% 40% 60% 80% 100%
Indonesia 2012
Gabon 2000
Namibia 2013
Bolivia 2008
Zimbabwe 2010-11
Nepal 2011
Cambodia 2010
Rwanda 2010
Haiti 2000
Côte d'Ivoire 2011-12
Tanzania 2010
Ghana 2008
Burkina Faso 2010
Ethiopia 2011
Nigeria 2013
Congo DR 2013-14
Modern method
Traditional method
None
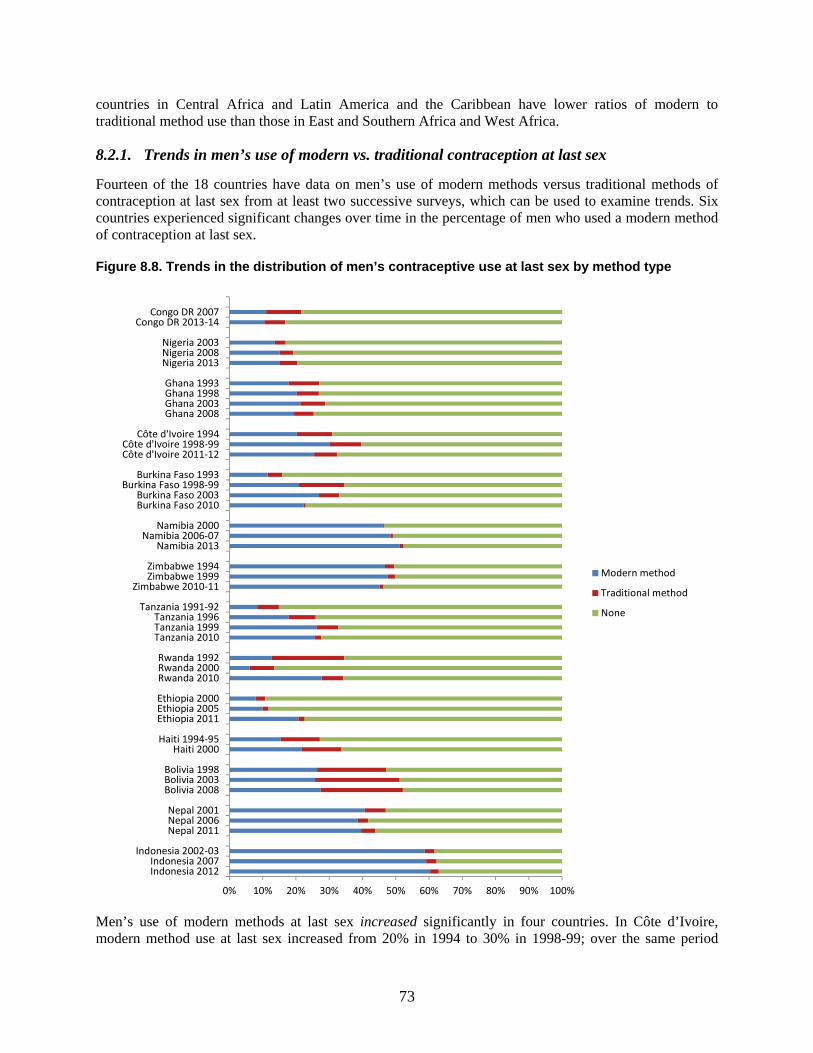
73
countries in Central Africa and Latin America and the Caribbean have lower ratios of modern to traditional method use than those in East and Southern Africa and West Africa.
8.2.1. Trends in men’s use of modern vs. traditional contraception at last sex
Fourteen of the 18 countries have data on men’s use of modern methods versus traditional methods of contraception at last sex from at least two successive surveys, which can be used to examine trends. Six countries experienced significant changes over time in the percentage of men who used a modern method of contraception at last sex.
Figure 8.8. Trends in the distribution of men’s contraceptive use at last sex by method type
Men’s use of modern methods at last sex increased significantly in four countries. In Côte d’Ivoire, modern method use at last sex increased from 20% in 1994 to 30% in 1998-99; over the same period
0% 10% 20% 30% 40% 50% 60% 70% 80% 90% 100%
Indonesia 2012Indonesia 2007
Indonesia 2002-03
Nepal 2011Nepal 2006Nepal 2001
Bolivia 2008Bolivia 2003Bolivia 1998
Haiti 2000Haiti 1994-95
Ethiopia 2011Ethiopia 2005Ethiopia 2000
Rwanda 2010Rwanda 2000Rwanda 1992
Tanzania 2010Tanzania 1999Tanzania 1996
Tanzania 1991-92
Zimbabwe 2010-11Zimbabwe 1999Zimbabwe 1994
Namibia 2013Namibia 2006-07
Namibia 2000
Burkina Faso 2010Burkina Faso 2003
Burkina Faso 1998-99Burkina Faso 1993
Côte d'Ivoire 2011-12Côte d'Ivoire 1998-99
Côte d'Ivoire 1994
Ghana 2008Ghana 2003Ghana 1998Ghana 1993
Nigeria 2013Nigeria 2008Nigeria 2003
Congo DR 2013-14Congo DR 2007
Modern method
Traditional method
None
74
men’s use of no method at last sex decreased significantly from 69% to 60%. Similarly, in Tanzania, modern method use at last sex increased from 8% in 1991-92 to 18% in 1996 and again to 26% in 1999; over the same period men’s use of no method at last sex decreased significantly from 85% to 74% and to 67%. Ethiopia experienced the same significant changes between 2005 and 2011, with use of modern methods increasing from 10% to 21% and use of no method decreasing from 88% to 77%. Finally, use of modern methods at last sex increased in Haiti from 15% in 1994-95 to 22% in 2000; however, this change is not accompanied by a significant decrease in the percentage of men using no method at last sex.
More complex patterns of significant changes in men’s use of modern and traditional methods of contraception occur in Burkina Faso and Rwanda. In Burkina Faso, use of modern methods at last sex increased twice, first from 11% in 1994 to 21% in 1998-99 and then to 27% in 2003, before significantly decreasing from 27% to 22% between 2003 and 2010. In Rwanda, use of modern methods at last sex significantly decreased from 13% to 6% between 1992 and 2000, before increasing significantly to 28% in 2010.
8.3. Men’s Use of Male-Controlled and Cooperative Contraception versus Female-Controlled Contraception at Last Sex
We further disaggregate the percentage of men reporting use of contraception at last sex into male-controlled and cooperative methods versus female-controlled methods in Figure 8.9. The percentages of men who used male-controlled or cooperatively-controlled methods at last sex ranges from a low of 5% in Indonesia to a high of 53% in Gabon. The percentage of men who used female-controlled methods ranges from 1% in the Democratic Republic of the Congo to 58% in Indonesia. Overall, in 11 of the 17 countries, higher percentages of men used male-controlled and cooperative methods of contraception at last sex; in the remaining six countries, higher percentages of men used female-controlled methods of contraception at last sex. The most extreme cases were the Democratic Republic of the Congo, where men who used contraception at last sex are 12 times more likely to use a male-controlled or cooperative method of contraception, and Indonesia, where men who used contraception at last sex are almost 12 times more likely to use a female-controlled method of contraception.
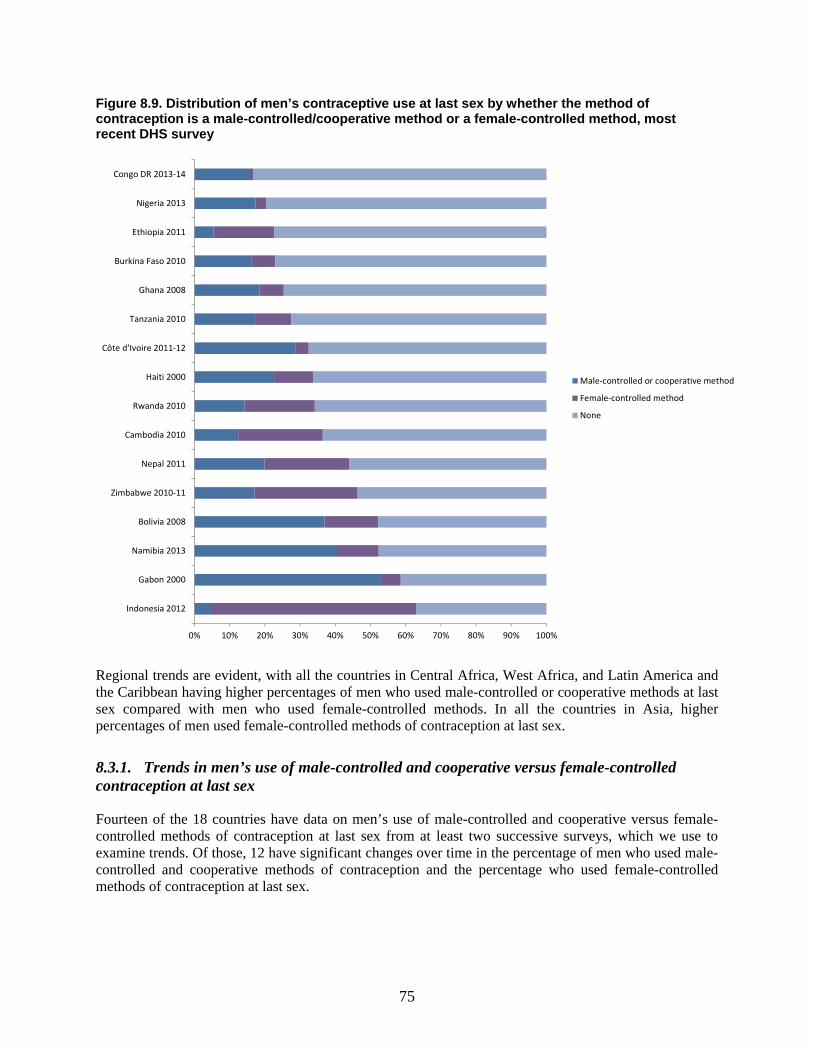
75
Figure 8.9. Distribution of men’s contraceptive use at last sex by whether the method of contraception is a male-controlled/cooperative method or a female-controlled method, most recent DHS survey
Regional trends are evident, with all the countries in Central Africa, West Africa, and Latin America and the Caribbean having higher percentages of men who used male-controlled or cooperative methods at last sex compared with men who used female-controlled methods. In all the countries in Asia, higher percentages of men used female-controlled methods of contraception at last sex.
8.3.1. Trends in men’s use of male-controlled and cooperative versus female-controlled contraception at last sex
Fourteen of the 18 countries have data on men’s use of male-controlled and cooperative versus female-controlled methods of contraception at last sex from at least two successive surveys, which we use to examine trends. Of those, 12 have significant changes over time in the percentage of men who used male-controlled and cooperative methods of contraception and the percentage who used female-controlled methods of contraception at last sex.
0% 10% 20% 30% 40% 50% 60% 70% 80% 90% 100%
Indonesia 2012
Gabon 2000
Namibia 2013
Bolivia 2008
Zimbabwe 2010-11
Nepal 2011
Cambodia 2010
Rwanda 2010
Haiti 2000
Côte d'Ivoire 2011-12
Tanzania 2010
Ghana 2008
Burkina Faso 2010
Ethiopia 2011
Nigeria 2013
Congo DR 2013-14
Male-controlled or cooperative method
Female-controlled method
None
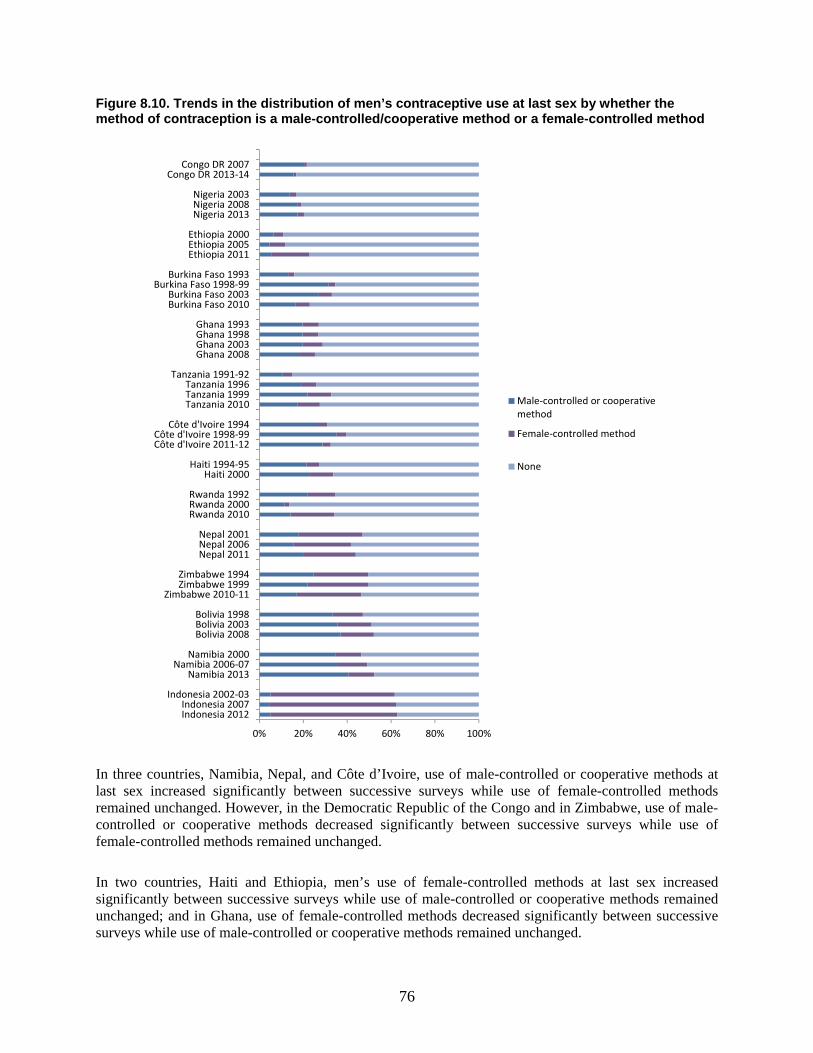
76
Figure 8.10. Trends in the distribution of men’s contraceptive use at last sex by whether the method of contraception is a male-controlled/cooperative method or a female-controlled method
In three countries, Namibia, Nepal, and Côte d’Ivoire, use of male-controlled or cooperative methods at last sex increased significantly between successive surveys while use of female-controlled methods remained unchanged. However, in the Democratic Republic of the Congo and in Zimbabwe, use of male-controlled or cooperative methods decreased significantly between successive surveys while use of female-controlled methods remained unchanged.
In two countries, Haiti and Ethiopia, men’s use of female-controlled methods at last sex increased significantly between successive surveys while use of male-controlled or cooperative methods remained unchanged; and in Ghana, use of female-controlled methods decreased significantly between successive surveys while use of male-controlled or cooperative methods remained unchanged.
0% 20% 40% 60% 80% 100%
Indonesia 2012Indonesia 2007
Indonesia 2002-03
Namibia 2013Namibia 2006-07
Namibia 2000
Bolivia 2008Bolivia 2003Bolivia 1998
Zimbabwe 2010-11Zimbabwe 1999Zimbabwe 1994
Nepal 2011Nepal 2006Nepal 2001
Rwanda 2010Rwanda 2000Rwanda 1992
Haiti 2000Haiti 1994-95
Côte d'Ivoire 2011-12Côte d'Ivoire 1998-99
Côte d'Ivoire 1994
Tanzania 2010Tanzania 1999Tanzania 1996
Tanzania 1991-92
Ghana 2008Ghana 2003Ghana 1998Ghana 1993
Burkina Faso 2010Burkina Faso 2003
Burkina Faso 1998-99Burkina Faso 1993
Ethiopia 2011Ethiopia 2005Ethiopia 2000
Nigeria 2013Nigeria 2008Nigeria 2003
Congo DR 2013-14Congo DR 2007
Male-controlled or cooperativemethod
Female-controlled method
None
77
Trends in men’s use of male and female-controlled methods of contraception at last sex are more complex in the remaining four countries—Nigeria, Burkina Faso, Tanzania, and Rwanda. In Nigeria, men’s use of male-controlled methods at last sex increased significantly from 14% in 2003 to 17% in 2007 while use of female-controlled methods decreased significantly from 3% to 2%; then, in 2013, use of female-controlled methods increased significantly to 3%. In Burkina Faso, men’s use of male-controlled methods increased significantly from 13% in 1993 to 32% in 1998-99; then use of female-controlled methods increased significantly from 3% in 1998-99 to 6% in 2003; then use of male-controlled methods decreased significantly from 27% in 2003 to 16% in 2008. In Tanzania, both male- and female-controlled methods increased significantly between 1991-92 and 1996; then use of female-controlled methods continued to increase from 7% in 1996 to 11% in 1999; and use of male-controlled methods decreased significantly from 22% in 1999 to 17% in 2010. In Rwanda, use of both male- and female-controlled methods decreased significantly between 1992 and 2000 before increasing significantly between 2000 and 2010.

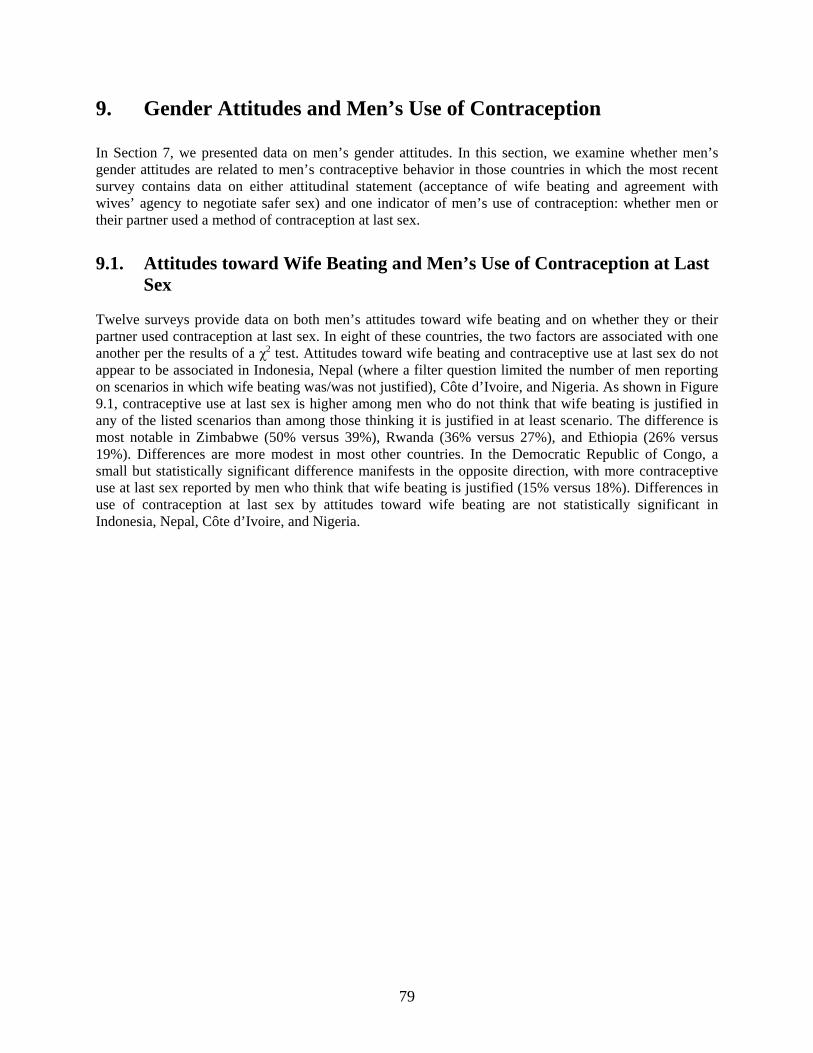
79
9. Gender Attitudes and Men’s Use of Contraception
In Section 7, we presented data on men’s gender attitudes. In this section, we examine whether men’s gender attitudes are related to men’s contraceptive behavior in those countries in which the most recent survey contains data on either attitudinal statement (acceptance of wife beating and agreement with wives’ agency to negotiate safer sex) and one indicator of men’s use of contraception: whether men or their partner used a method of contraception at last sex.
9.1. Attitudes toward Wife Beating and Men’s Use of Contraception at Last Sex
Twelve surveys provide data on both men’s attitudes toward wife beating and on whether they or their partner used contraception at last sex. In eight of these countries, the two factors are associated with one another per the results of a χ2 test. Attitudes toward wife beating and contraceptive use at last sex do not appear to be associated in Indonesia, Nepal (where a filter question limited the number of men reporting on scenarios in which wife beating was/was not justified), Côte d’Ivoire, and Nigeria. As shown in Figure 9.1, contraceptive use at last sex is higher among men who do not think that wife beating is justified in any of the listed scenarios than among those thinking it is justified in at least scenario. The difference is most notable in Zimbabwe (50% versus 39%), Rwanda (36% versus 27%), and Ethiopia (26% versus 19%). Differences are more modest in most other countries. In the Democratic Republic of Congo, a small but statistically significant difference manifests in the opposite direction, with more contraceptive use at last sex reported by men who think that wife beating is justified (15% versus 18%). Differences in use of contraception at last sex by attitudes toward wife beating are not statistically significant in Indonesia, Nepal, Côte d’Ivoire, and Nigeria.
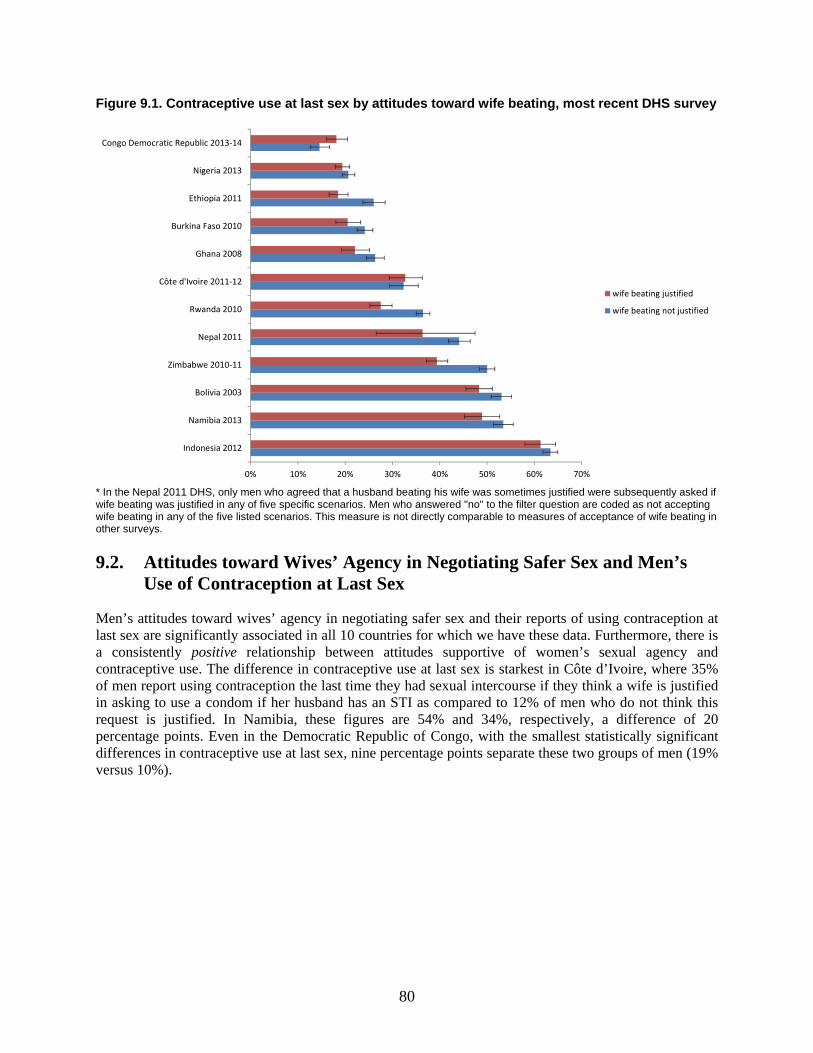
80
Figure 9.1. Contraceptive use at last sex by attitudes toward wife beating, most recent DHS survey
* In the Nepal 2011 DHS, only men who agreed that a husband beating his wife was sometimes justified were subsequently asked if wife beating was justified in any of five specific scenarios. Men who answered "no" to the filter question are coded as not accepting wife beating in any of the five listed scenarios. This measure is not directly comparable to measures of acceptance of wife beating in other surveys.
9.2. Attitudes toward Wives’ Agency in Negotiating Safer Sex and Men’s Use of Contraception at Last Sex
Men’s attitudes toward wives’ agency in negotiating safer sex and their reports of using contraception at last sex are significantly associated in all 10 countries for which we have these data. Furthermore, there is a consistently positive relationship between attitudes supportive of women’s sexual agency and contraceptive use. The difference in contraceptive use at last sex is starkest in Côte d’Ivoire, where 35% of men report using contraception the last time they had sexual intercourse if they think a wife is justified in asking to use a condom if her husband has an STI as compared to 12% of men who do not think this request is justified. In Namibia, these figures are 54% and 34%, respectively, a difference of 20 percentage points. Even in the Democratic Republic of Congo, with the smallest statistically significant differences in contraceptive use at last sex, nine percentage points separate these two groups of men (19% versus 10%).
0% 10% 20% 30% 40% 50% 60% 70%
Indonesia 2012
Namibia 2013
Bolivia 2003
Zimbabwe 2010-11
Nepal 2011
Rwanda 2010
Côte d'Ivoire 2011-12
Ghana 2008
Burkina Faso 2010
Ethiopia 2011
Nigeria 2013
Congo Democratic Republic 2013-14
wife beating justified
wife beating not justified
81
Figure 9.2. Contraceptive use at last sex by attitudes toward wives asking to use a condom if her husband has an STI, most recent DHS survey
* In the Nepal 2011 DHS, only men who agreed that a husband beating his wife was sometimes justified were subsequently asked if wife beating was justified in any of five specific scenarios. Men who answered "no" to the filter question are coded as not accepting wife beating in any of the five listed scenarios. This measure is not directly comparable to measures of acceptance of wife beating in other surveys.
0% 10% 20% 30% 40% 50% 60% 70%
Namibia 2013
Zimbabwe 2010-11
Nepal 2011
Rwanda 2010
Côte d'Ivoire 2011-12
Ghana 2008
Burkina Faso 2010
Ethiopia 2011
Nigeria 2013
Congo Democratic Republic 2013-14
justified in asking to use condom
not justified in asking to use condom

83
10. Methods of Contraception Used by Men
In this section, we use two measures to describe the methods of contraception that men report using at last sex. First, we examine the contraceptive method mix, a relative measure that has contraceptive users as the denominator. It can be interpreted as the contribution of one method, condoms for example, to overall contraceptive use. This measure is used 1) to examine the diversity or concentration of contraceptive methods and 2) to identify which method(s) dominates the contraceptive scene. We report on the current situation and changes in the method mix over time. It is useful to note that two populations with similar levels of use of specific methods, such as condoms, may have substantially different contributions of condoms to the method mix; conversely, two populations with similar contributions of condoms to the method mix may have different underlying rates of condom use, depending on the overall contraceptive prevalence rate and the use of other methods of contraception.
The second measure we report is the absolute prevalence of specific methods of contraception, which has all men surveyed as the denominator. We use this measure to analyze differentials in levels of use of various methods among men across relationship types, life course factors, and socioeconomic characteristics.
10.1. Contraceptive Method Mix
10.1.1. Current method mix
While nearly all contraceptive methods are used by some men, the method mix is concentrated in just a few contraceptive methods in each of the countries studied (Figure 10.1). Three (or fewer) contraceptive methods—pill, condom, and injectables—account for the vast majority of all contraceptive use as reported by men. A few other methods contribute negligible amounts to overall contraceptive prevalence. In 10 of the 16 countries studied here, a single method (male condom) accounts for more than 50% of all contraceptive use at last sex, a phenomenon known as method dominance. In contrast to this general picture, Cambodia, Bolivia, and Haiti stand out as having relative balance in the contraceptive method mix.
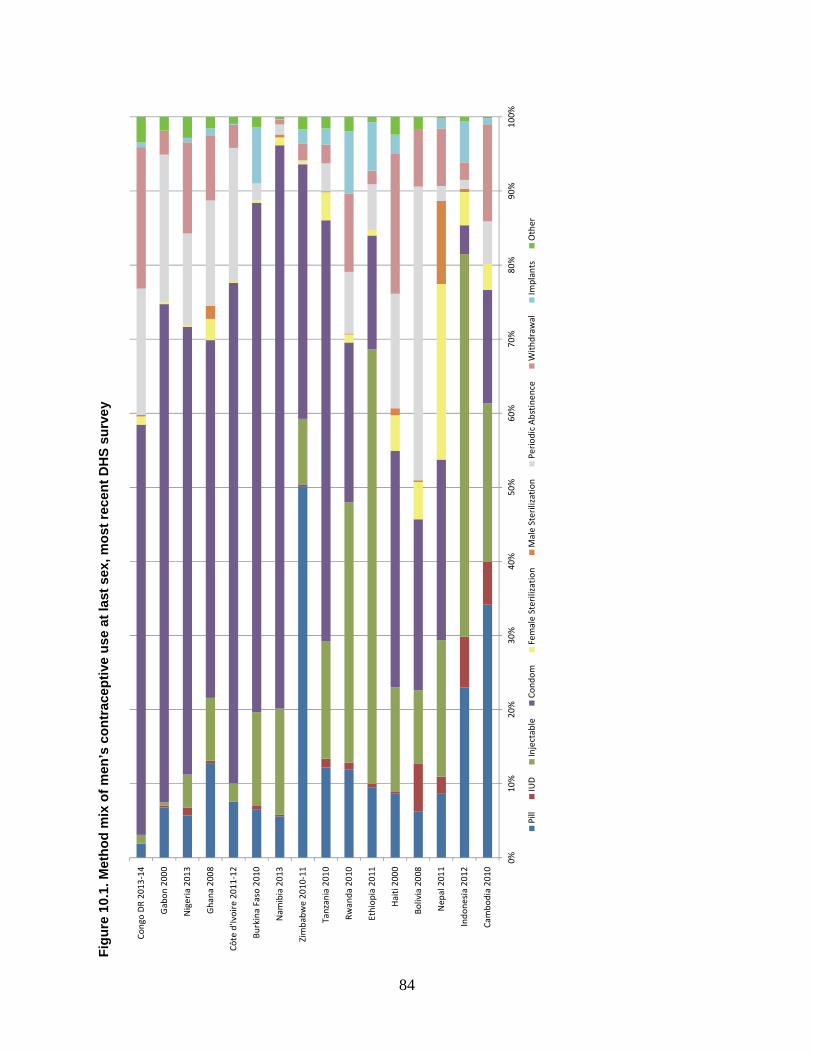
84
Fig
ure
10.
1. M
eth
od
mix
of
men
’s c
on
trac
epti
ve u
se a
t la
st s
ex, m
ost
rec
ent
DH
S s
urv
ey
0%10
%20
%30
%40
%50
%60
%70
%80
%90
%10
0%
Cam
bodi
a 20
10
Indo
nesi
a 20
12
Nep
al 2
011
Boliv
ia 2
008
Hai
ti 20
00
Ethi
opia
201
1
Rwan
da 2
010
Tanz
ania
201
0
Zim
babw
e 20
10-1
1
Nam
ibia
201
3
Burk
ina
Faso
201
0
Côte
d'Iv
oire
201
1-12
Gha
na 2
008
Nig
eria
201
3
Gab
on 2
000
Cong
o D
R 20
13-1
4
Pill
IUD
Inje
ctab
leCo
ndom
Fem
ale
Ster
iliza
tion
Mal
e St
erili
zatio
nPe
riod
ic A
bstin
ence
With
draw
alIm
plan
tsO
ther
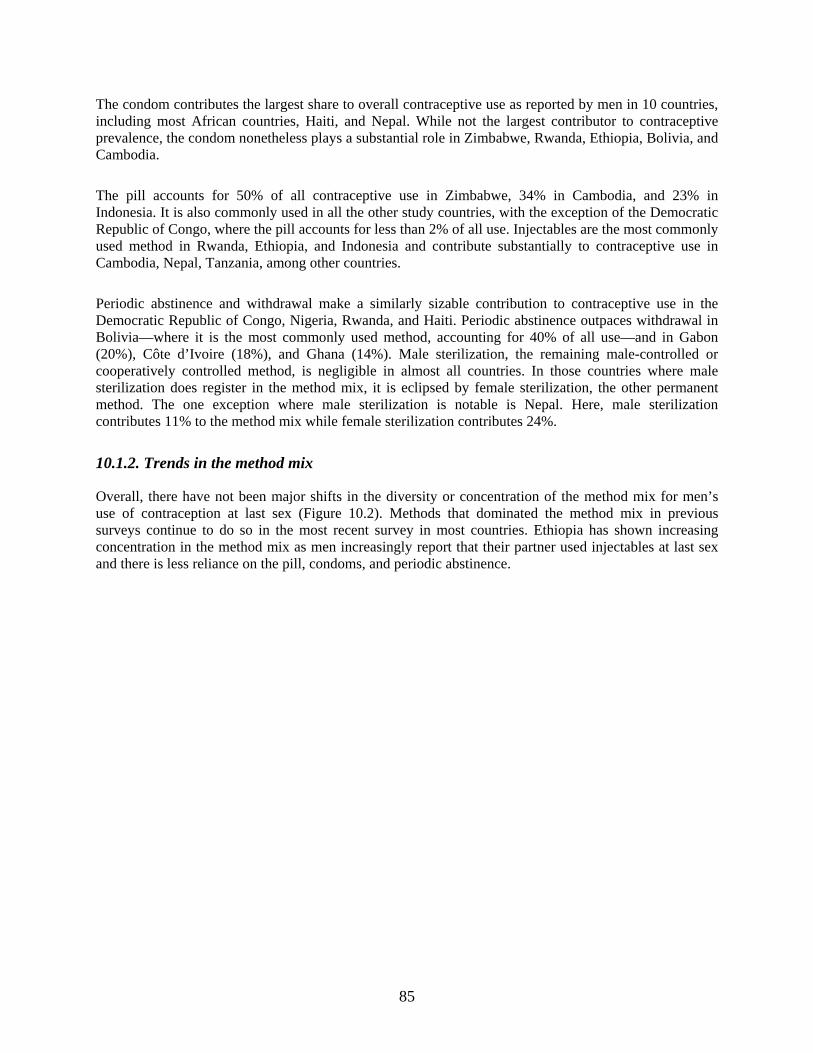
85
The condom contributes the largest share to overall contraceptive use as reported by men in 10 countries, including most African countries, Haiti, and Nepal. While not the largest contributor to contraceptive prevalence, the condom nonetheless plays a substantial role in Zimbabwe, Rwanda, Ethiopia, Bolivia, and Cambodia.
The pill accounts for 50% of all contraceptive use in Zimbabwe, 34% in Cambodia, and 23% in Indonesia. It is also commonly used in all the other study countries, with the exception of the Democratic Republic of Congo, where the pill accounts for less than 2% of all use. Injectables are the most commonly used method in Rwanda, Ethiopia, and Indonesia and contribute substantially to contraceptive use in Cambodia, Nepal, Tanzania, among other countries.
Periodic abstinence and withdrawal make a similarly sizable contribution to contraceptive use in the Democratic Republic of Congo, Nigeria, Rwanda, and Haiti. Periodic abstinence outpaces withdrawal in Bolivia—where it is the most commonly used method, accounting for 40% of all use—and in Gabon (20%), Côte d’Ivoire (18%), and Ghana (14%). Male sterilization, the remaining male-controlled or cooperatively controlled method, is negligible in almost all countries. In those countries where male sterilization does register in the method mix, it is eclipsed by female sterilization, the other permanent method. The one exception where male sterilization is notable is Nepal. Here, male sterilization contributes 11% to the method mix while female sterilization contributes 24%.
10.1.2. Trends in the method mix
Overall, there have not been major shifts in the diversity or concentration of the method mix for men’s use of contraception at last sex (Figure 10.2). Methods that dominated the method mix in previous surveys continue to do so in the most recent survey in most countries. Ethiopia has shown increasing concentration in the method mix as men increasingly report that their partner used injectables at last sex and there is less reliance on the pill, condoms, and periodic abstinence.
86
Fig
ure
10.
2. T
ren
ds
in t
he
met
ho
d m
ix o
f m
en’s
co
ntr
acep
tive
use
at
last
sex
0%10
%20
%30
%40
%50
%60
%70
%80
%90
%10
0%
Indo
nesi
a 20
12In
done
sia
2007
Indo
nesi
a 20
02-0
3
Nep
al 2
011
Nep
al 2
006
Nep
al 2
001
Boliv
ia 2
008
Boliv
ia 2
003
Boliv
ia 1
998
Hai
ti 20
00H
aiti
1994
-95
Ethi
opia
201
1Et
hiop
ia 2
005
Ethi
opia
200
0
Rwan
da 2
010
Rwan
da 2
000
Rwan
da 1
992
Tanz
ania
201
0Ta
nzan
ia 1
999
Tanz
ania
199
6Ta
nzan
ia 1
991-
92
Zim
babw
e 20
10-1
1Zi
mba
bwe
1999
Zim
babw
e 19
94
Nam
ibia
201
3N
amib
ia 2
006-
07N
amib
ia 2
000
Burk
ina
Faso
201
0Bu
rkin
a Fa
so 2
003
Burk
ina
Faso
199
8-99
Burk
ina
Faso
199
3
Côte
d'Iv
oire
201
1-12
Côte
d'Iv
oire
199
8-99
Côte
d'Iv
oire
199
4
Gha
na 2
008
Gha
na 2
003
Gha
na 1
998
Gha
na 1
993
Nig
eria
201
3N
iger
ia 2
008
Nig
eria
200
3
Cong
o D
R 20
13-1
4Co
ngo
DR
2007
Pill
IUD
Inje
ctab
leCo
ndom
Fem
ale
Ster
iliza
tion
Mal
e St
erili
zatio
nPe
riod
ic A
bstin
ence
With
draw
alIm
plan
tsO
ther
87
Nevertheless, there have been some notable shifts in the relative prevalence of certain methods. There has been a marked increase in condom use in most countries. In Tanzania, condoms accounted for 31% of all contraceptive use in 1991-92, which increased to 57% in 2010. In Nepal, condom use doubled as a share of all contraceptive use over a 10-year period. However, condom use as a portion of all contraception used declined over time in Zimbabwe and Ethiopia; in these countries, condom use was supplanted by increasing use of injectables. Use of injectables, relative to other methods, also increased in Ghana, Burkina Faso, Tanzania, Haiti, and Indonesia. Implants increased their share of contraceptive use in Burkina Faso, Rwanda, and Ethiopia, although they remain a less commonly used method.
The pill has increased its share of contraceptive use in Zimbabwe, although trends elsewhere are less clear. Periodic abstinence and withdrawal account for a smaller portion of contraceptive use in the Democratic Republic of Congo (where these methods continue to contribute substantially to overall use), Côte d’Ivoire, Burkina Faso, Rwanda, and Haiti. There has been little change in Bolivia.
10.2. Methods of Contraception among Men and Relationship Factors
10.2.1. Marital status
Up to this point in the study we have considered marital status to be one of several life course factors. While it is that, here we consider marital status as a relationship factor. The method of contraception used at last sex and marital status are not independent in any of the countries studied, according the results of χ2 tests. Figure 8.3 shows the prevalence of specific methods of contraception—condom, pill, injectable, periodic abstinence, and withdrawal—according to men’s current marital status. To be displayed, the method must be one of the three most commonly used methods in at least one marital status category and be used by a minimum of 1% of men and their partner at last sex.
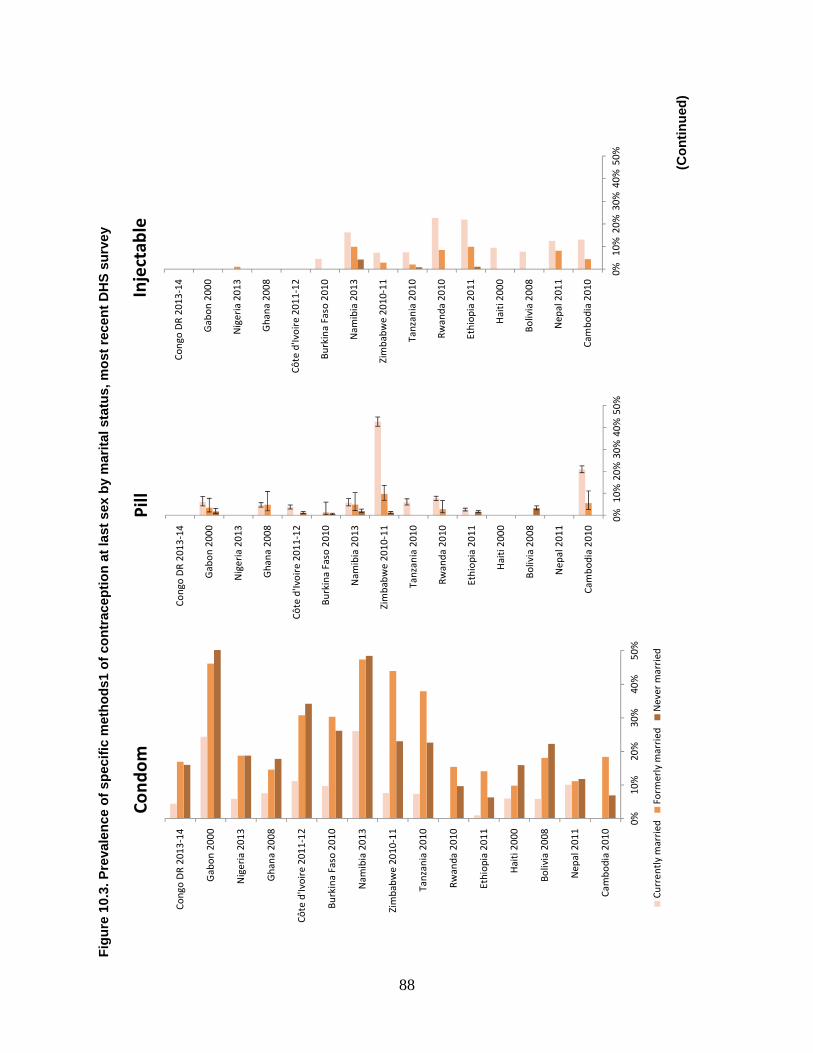
88
Fig
ure
10.
3. P
reva
len
ce o
f sp
ecif
ic m
eth
od
s1 o
f co
ntr
acep
tio
n a
t la
st s
ex b
y m
arit
al s
tatu
s, m
ost
rec
ent
DH
S s
urv
ey
(C
on
tin
ued
)
0%10
%20
%30
%40
%50
%
Cam
bodi
a 20
10
Nep
al 2
011
Boliv
ia 2
008
Hai
ti 20
00
Ethi
opia
201
1
Rwan
da 2
010
Tanz
ania
201
0
Zim
babw
e 20
10-1
1
Nam
ibia
201
3
Burk
ina
Faso
201
0
Côte
d'Iv
oire
201
1-12
Gha
na 2
008
Nig
eria
201
3
Gab
on 2
000
Cong
o D
R 20
13-1
4
Pill
0%10
%20
%30
%40
%50
%
Cam
bodi
a 20
10
Nep
al 2
011
Boliv
ia 2
008
Hai
ti 20
00
Ethi
opia
201
1
Rwan
da 2
010
Tanz
ania
201
0
Zim
babw
e 20
10-1
1
Nam
ibia
201
3
Burk
ina
Faso
201
0
Côte
d'Iv
oire
201
1-12
Gha
na 2
008
Nig
eria
201
3
Gab
on 2
000
Cong
o D
R 20
13-1
4
Inje
ctab
le
0%10
%20
%30
%40
%50
%
Cam
bodi
a 20
10
Nep
al 2
011
Boliv
ia 2
008
Hai
ti 20
00
Ethi
opia
201
1
Rwan
da 2
010
Tanz
ania
201
0
Zim
babw
e 20
10-1
1
Nam
ibia
201
3
Burk
ina
Faso
201
0
Côte
d'Iv
oire
201
1-12
Gha
na 2
008
Nig
eria
201
3
Gab
on 2
000
Cong
o D
R 20
13-1
4
Cond
om
Curr
ently
mar
ried
Form
erly
mar
ried
Nev
er m
arri
ed
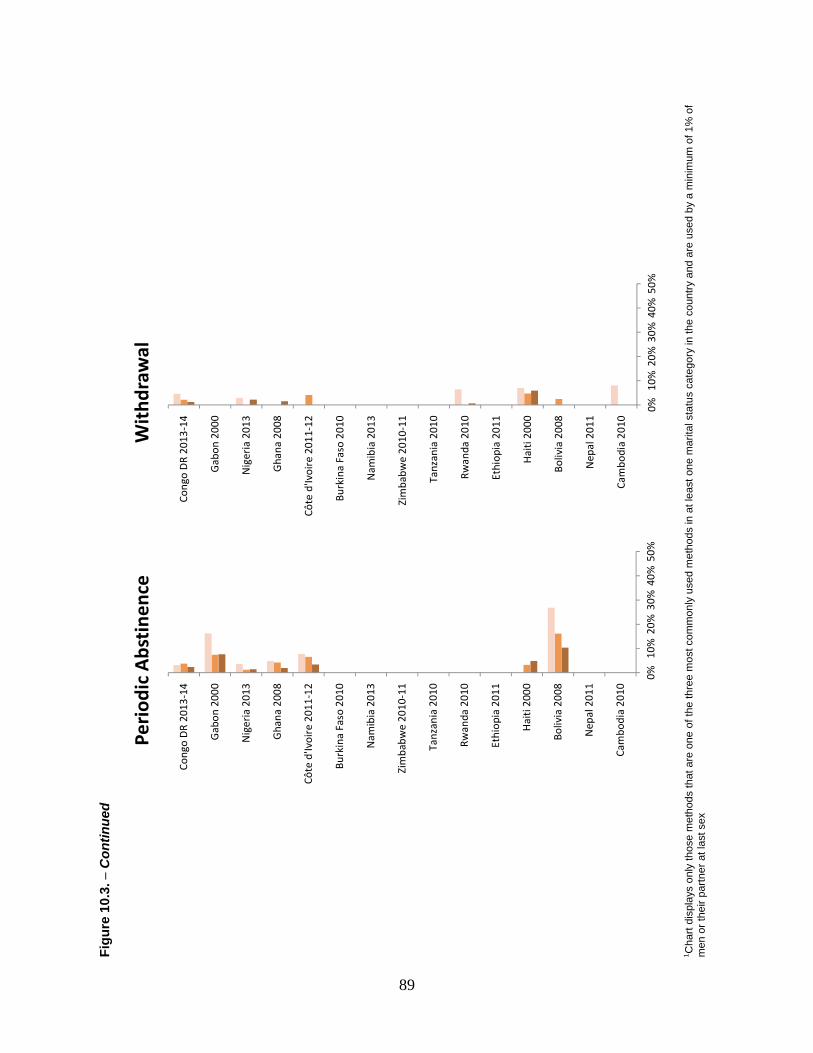
89
Fig
ure
10.
3. −
Con
tinue
d
1 Cha
rt di
spla
ys o
nly
thos
e m
etho
ds th
at a
re o
ne o
f the
thre
e m
ost c
omm
only
use
d m
etho
ds in
at l
east
one
mar
ital s
tatu
s ca
tego
ry in
the
coun
try a
nd a
re u
sed
by a
min
imum
of 1
% o
f m
en o
r the
ir pa
rtner
at l
ast s
ex
0%10
%20
%30
%40
%50
%
Cam
bodi
a 20
10
Nep
al 2
011
Boliv
ia 2
008
Hai
ti 2
000
Ethi
opia
201
1
Rwan
da 2
010
Tanz
ania
201
0
Zim
babw
e 20
10-1
1
Nam
ibia
201
3
Burk
ina
Faso
201
0
Côte
d'Iv
oire
201
1-12
Gha
na 2
008
Nig
eria
201
3
Gab
on 2
000
Cong
o D
R 20
13-1
4
Peri
odic
Abs
tine
nce
0%10
%20
%30
%40
%50
%
Cam
bodi
a 20
10
Nep
al 2
011
Boliv
ia 2
008
Hai
ti 20
00
Ethi
opia
201
1
Rwan
da 2
010
Tanz
ania
201
0
Zim
babw
e 20
10-1
1
Nam
ibia
201
3
Burk
ina
Faso
201
0
Côte
d'Iv
oire
201
1-12
Gha
na 2
008
Nig
eria
201
3
Gab
on 2
000
Cong
o D
R 20
13-1
4
Wit
hdra
wal
90
The condom is one of the three contraceptive methods most commonly used by men in all 15 countries9. Condom use is lowest among currently married men. In comparison, higher proportions of formerly married men and never-married men report use of a condom at last sex, although differences between these groups are seldom statistically significant. Condom use is significantly higher among formerly married men than among never-married men in Zimbabwe, Tanzania, Rwanda, and Cambodia. Differences across marital categories in Nepal are slight but statistically significant; here, condom use is highest among never-married men.
In contrast to condom use, use of the pill, injectables, periodic abstinence, and withdrawal are each higher among currently married men than among formerly married or never-married men; this pattern is consistent across the countries displayed. Differences in pill use are most striking in Zimbabwe where 43% of currently married men report that their partner used the pill at last sex, compared with 10% of formerly married men and 1% of never-married men. In most countries, use of the pill and injectables by formerly married men falls between that of currently married and never-married men. Meanwhile, the pattern with regard to the use of periodic abstinence and withdrawal is mixed. Periodic abstinence is higher among formerly married men than never-married men in Bolivia, whereas differences are negligible in Gabon and the Democratic Republic of Congo.
10.2.2. Partner type
Differences in contraceptive method used at last sex according to type of partner are even more striking. Men rarely use condoms when sexual intercourse is with a spouse or cohabiting partner. Even in Namibia, where condom use with spouses is highest (26%), condom use is three times higher when sexual intercourse is with a girlfriend or fiancée or with a commercial sex worker or casual acquaintance. Condom use is highest when sex occurs with a commercial sex worker or casual acquaintance, although differences among other partner types are not always significant.
9 Indonesia is necessarily excluded from this section on relationship factors because the 2012 survey asks about contraceptive use only among currently married men with their spouse.
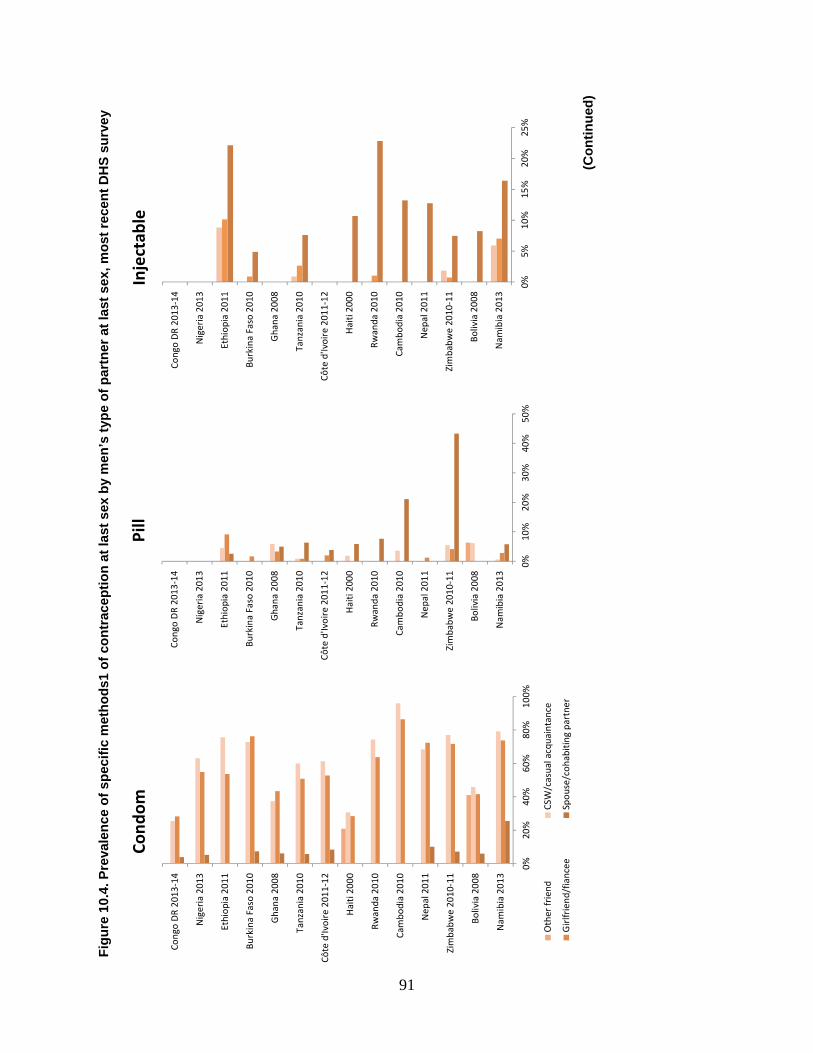
91
Fig
ure
10.
4. P
reva
len
ce o
f sp
ecif
ic m
eth
od
s1 o
f co
ntr
acep
tio
n a
t la
st s
ex b
y m
en’s
typ
e o
f p
artn
er a
t la
st s
ex, m
ost
rec
ent
DH
S s
urv
ey
(C
on
tin
ued
)
0%20
%40
%60
%80
%10
0%
Nam
ibia
201
3
Boliv
ia 2
008
Zim
babw
e 20
10-1
1
Nep
al 2
011
Cam
bodi
a 20
10
Rwan
da 2
010
Hai
ti 20
00
Côte
d'Iv
oire
201
1-12
Tanz
ania
201
0
Gha
na 2
008
Burk
ina
Faso
201
0
Ethi
opia
201
1
Nig
eria
201
3
Cong
o D
R 20
13-1
4
Cond
om
Oth
er fr
iend
CSW
/cas
ual a
cqua
inta
nce
Gir
lfrie
nd/f
ianc
eeSp
ouse
/coh
abiti
ng p
artn
er
0%10
%20
%30
%40
%50
%
Nam
ibia
201
3
Boliv
ia 2
008
Zim
babw
e 20
10-1
1
Nep
al 2
011
Cam
bodi
a 20
10
Rwan
da 2
010
Hai
ti 20
00
Côte
d'Iv
oire
201
1-12
Tanz
ania
201
0
Gha
na 2
008
Burk
ina
Faso
201
0
Ethi
opia
201
1
Nig
eria
201
3
Cong
o D
R 20
13-1
4
Pill
0%5%
10%
15%
20%
25%
Nam
ibia
201
3
Boliv
ia 2
008
Zim
babw
e 20
10-1
1
Nep
al 2
011
Cam
bodi
a 20
10
Rwan
da 2
010
Hai
ti 20
00
Côte
d'Iv
oire
201
1-12
Tanz
ania
201
0
Gha
na 2
008
Burk
ina
Faso
201
0
Ethi
opia
201
1
Nig
eria
201
3
Cong
o D
R 20
13-1
4
Inje
ctab
le
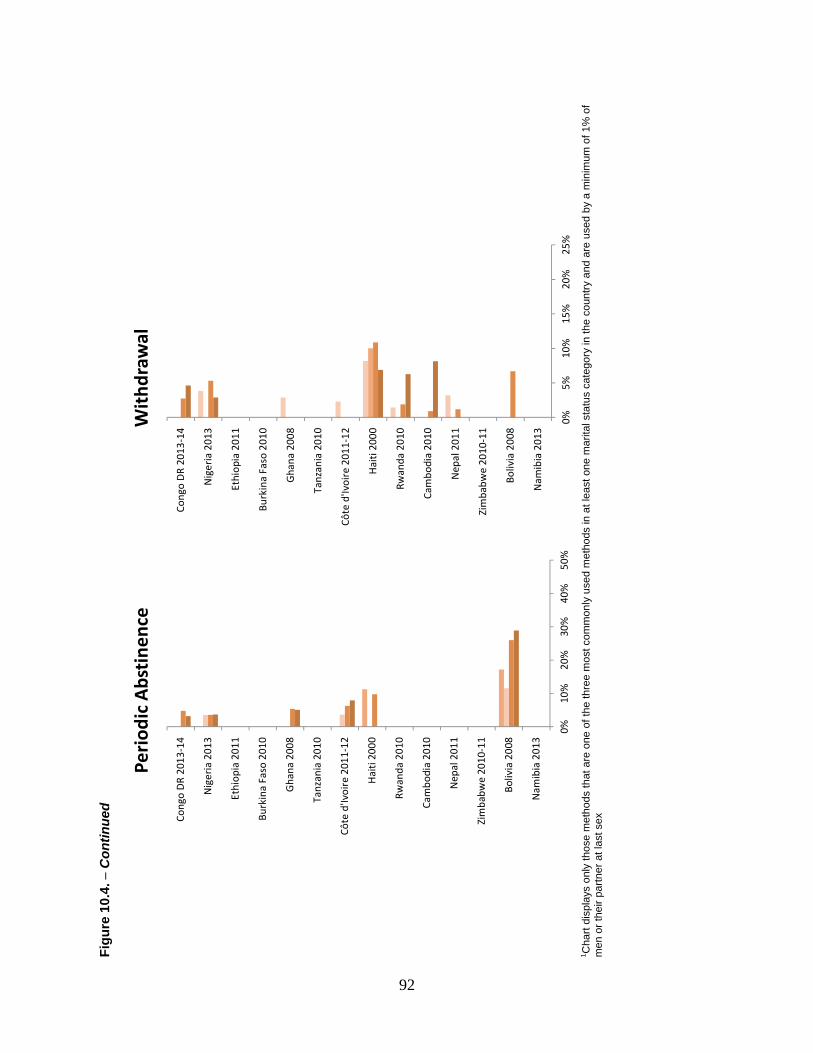
92
Fig
ure
10.
4. −
Con
tinue
d
1 C
hart
disp
lays
onl
y th
ose
met
hods
that
are
one
of t
he th
ree
mos
t com
mon
ly u
sed
met
hods
in a
t lea
st o
ne m
arita
l sta
tus
cate
gory
in th
e co
untry
and
are
use
d by
a m
inim
um o
f 1%
of
men
or t
heir
partn
er a
t las
t sex
0%10
%20
%30
%40
%50
%
Nam
ibia
201
3
Boliv
ia 2
008
Zim
babw
e 20
10-1
1
Nep
al 2
011
Cam
bodi
a 20
10
Rwan
da 2
010
Hai
ti 20
00
Côte
d'Iv
oire
201
1-12
Tanz
ania
201
0
Gha
na 2
008
Burk
ina
Faso
201
0
Ethi
opia
201
1
Nig
eria
201
3
Cong
o D
R 20
13-1
4
Peri
odic
Abs
tine
nce
0%5%
10%
15%
20%
25%
Nam
ibia
201
3
Boliv
ia 2
008
Zim
babw
e 20
10-1
1
Nep
al 2
011
Cam
bodi
a 20
10
Rwan
da 2
010
Hai
ti 20
00
Côte
d'Iv
oire
201
1-12
Tanz
ania
201
0
Gha
na 2
008
Burk
ina
Faso
201
0
Ethi
opia
201
1
Nig
eria
201
3
Cong
o D
R 20
13-1
4
Wit
hdra
wal
93
Use of injectables is consistently and substantially higher among men who have sex with their spouse than other types of partners, as is pill use in Zimbabwe, Cambodia, Rwanda, and to a lesser extent in Haiti, Tanzania, and Namibia. Pill use is higher among men having sex with their girlfriend or fiancée in Ethiopia.
10.3. Methods of Contraception among Men and Life Course Factors
10.3.1. Age
Method of contraceptive use shows a significant association with life course factors—age and number of children—in all countries, as it did with relationship factors. As seen in Figure 8.5, condom use increases between age groups 15-19 and 20-24 (age group 25-29 in Burkina Faso and Nepal) and declines with age thereafter in the nine countries where prevalence exceeds 10%. This pattern could represent either a cohort effect, if younger men use condoms to a greater extent at all points of their lives than did the older cohorts that preceded them, or reflect a life course effect if level of condom use evolves as young men age.
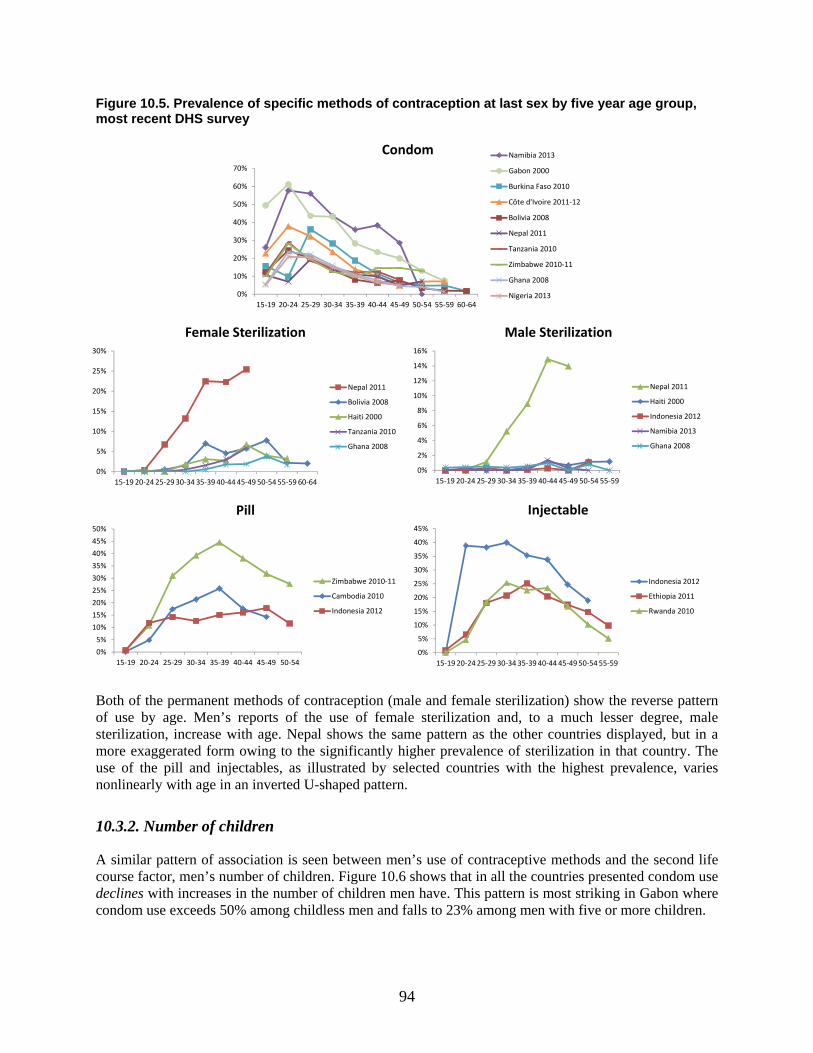
94
Figure 10.5. Prevalence of specific methods of contraception at last sex by five year age group, most recent DHS survey
Both of the permanent methods of contraception (male and female sterilization) show the reverse pattern of use by age. Men’s reports of the use of female sterilization and, to a much lesser degree, male sterilization, increase with age. Nepal shows the same pattern as the other countries displayed, but in a more exaggerated form owing to the significantly higher prevalence of sterilization in that country. The use of the pill and injectables, as illustrated by selected countries with the highest prevalence, varies nonlinearly with age in an inverted U-shaped pattern.
10.3.2. Number of children
A similar pattern of association is seen between men’s use of contraceptive methods and the second life course factor, men’s number of children. Figure 10.6 shows that in all the countries presented condom use declines with increases in the number of children men have. This pattern is most striking in Gabon where condom use exceeds 50% among childless men and falls to 23% among men with five or more children.
0%
10%
20%
30%
40%
50%
60%
70%
15-19 20-24 25-29 30-34 35-39 40-44 45-49 50-54 55-59 60-64
Condom Namibia 2013
Gabon 2000
Burkina Faso 2010
Côte d'Ivoire 2011-12
Bolivia 2008
Nepal 2011
Tanzania 2010
Zimbabwe 2010-11
Ghana 2008
Nigeria 2013
0%
5%
10%
15%
20%
25%
30%
15-19 20-24 25-29 30-34 35-39 40-44 45-49 50-54 55-59 60-64
Female Sterilization
Nepal 2011
Bolivia 2008
Haiti 2000
Tanzania 2010
Ghana 2008
0%
2%
4%
6%
8%
10%
12%
14%
16%
15-19 20-24 25-29 30-34 35-39 40-44 45-49 50-54 55-59
Male Sterilization
Nepal 2011
Haiti 2000
Indonesia 2012
Namibia 2013
Ghana 2008
0%
5%
10%
15%
20%
25%
30%
35%
40%
45%
50%
15-19 20-24 25-29 30-34 35-39 40-44 45-49 50-54
Pill
Zimbabwe 2010-11
Cambodia 2010
Indonesia 2012
0%
5%
10%
15%
20%
25%
30%
35%
40%
45%
15-19 20-24 25-29 30-34 35-39 40-44 45-49 50-54 55-59
Injectable
Indonesia 2012
Ethiopia 2011
Rwanda 2010
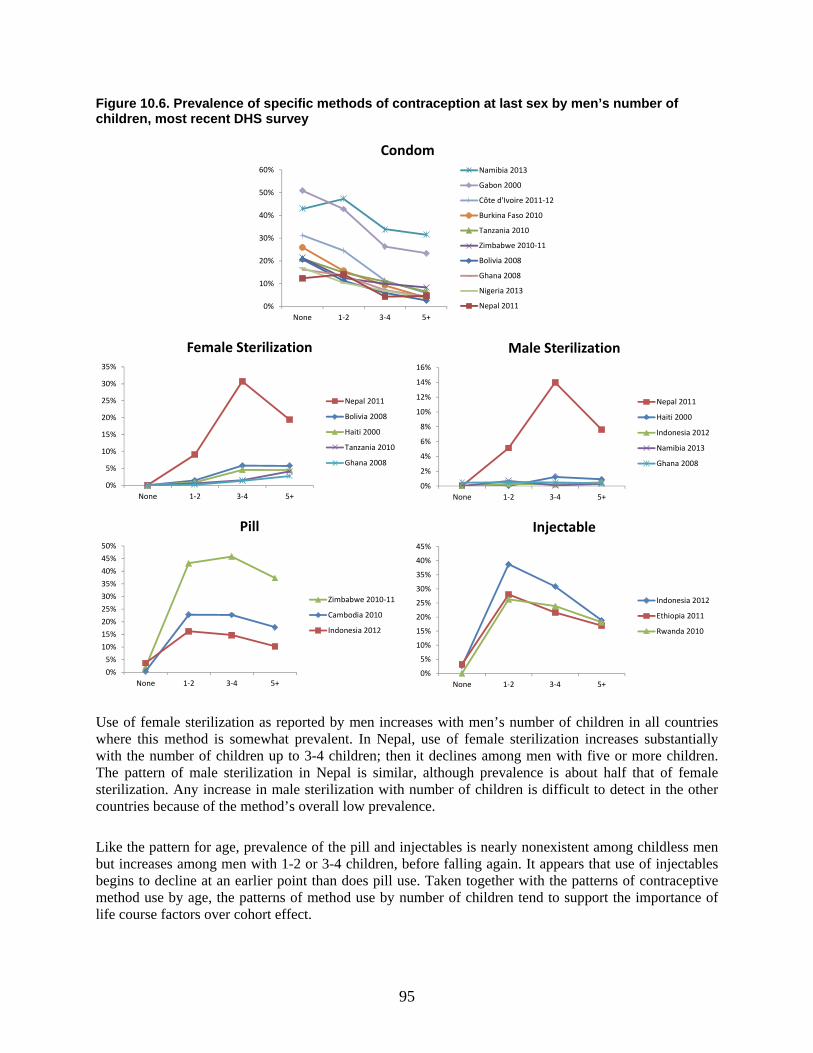
95
Figure 10.6. Prevalence of specific methods of contraception at last sex by men’s number of children, most recent DHS survey
Use of female sterilization as reported by men increases with men’s number of children in all countries where this method is somewhat prevalent. In Nepal, use of female sterilization increases substantially with the number of children up to 3-4 children; then it declines among men with five or more children. The pattern of male sterilization in Nepal is similar, although prevalence is about half that of female sterilization. Any increase in male sterilization with number of children is difficult to detect in the other countries because of the method’s overall low prevalence.
Like the pattern for age, prevalence of the pill and injectables is nearly nonexistent among childless men but increases among men with 1-2 or 3-4 children, before falling again. It appears that use of injectables begins to decline at an earlier point than does pill use. Taken together with the patterns of contraceptive method use by age, the patterns of method use by number of children tend to support the importance of life course factors over cohort effect.
0%
10%
20%
30%
40%
50%
60%
None 1-2 3-4 5+
CondomNamibia 2013
Gabon 2000
Côte d'Ivoire 2011-12
Burkina Faso 2010
Tanzania 2010
Zimbabwe 2010-11
Bolivia 2008
Ghana 2008
Nigeria 2013
Nepal 2011
0%
5%
10%
15%
20%
25%
30%
35%
None 1-2 3-4 5+
Female Sterilization
Nepal 2011
Bolivia 2008
Haiti 2000
Tanzania 2010
Ghana 2008
0%
2%
4%
6%
8%
10%
12%
14%
16%
None 1-2 3-4 5+
Male Sterilization
Nepal 2011
Haiti 2000
Indonesia 2012
Namibia 2013
Ghana 2008
0%
5%
10%
15%
20%
25%
30%
35%
40%
45%
50%
None 1-2 3-4 5+
Pill
Zimbabwe 2010-11
Cambodia 2010
Indonesia 2012
0%
5%
10%
15%
20%
25%
30%
35%
40%
45%
None 1-2 3-4 5+
Injectable
Indonesia 2012
Ethiopia 2011
Rwanda 2010
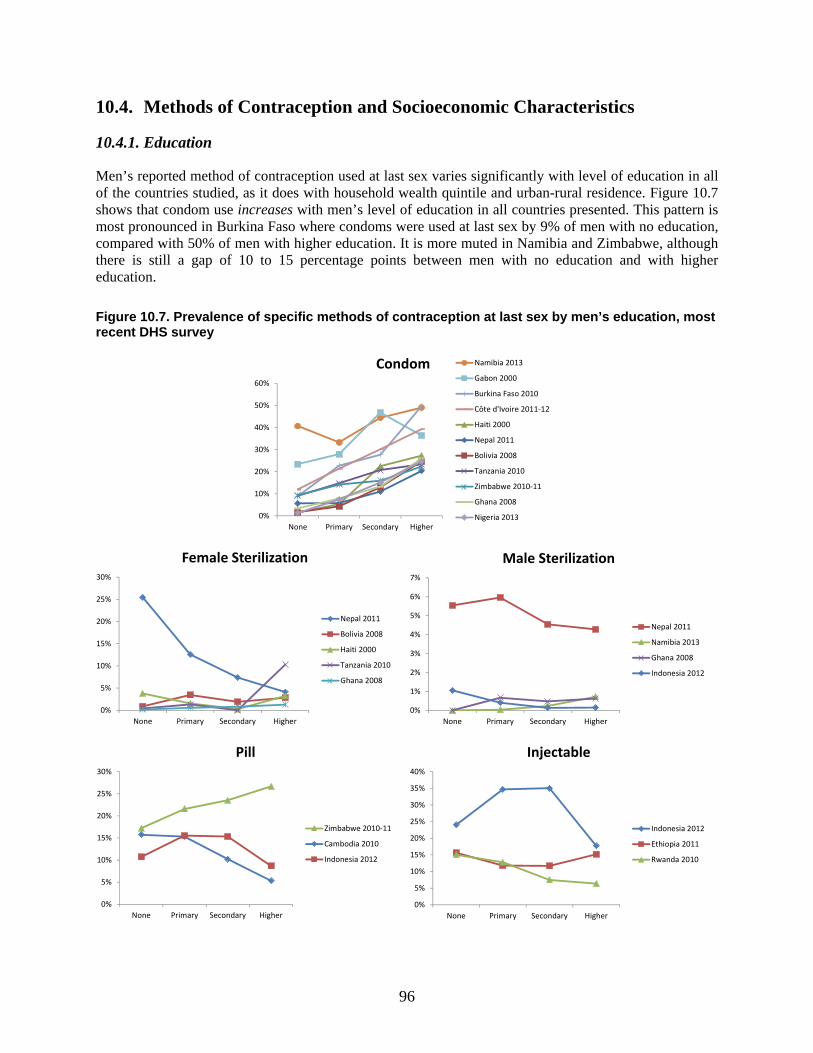
96
10.4. Methods of Contraception and Socioeconomic Characteristics
10.4.1. Education
Men’s reported method of contraception used at last sex varies significantly with level of education in all of the countries studied, as it does with household wealth quintile and urban-rural residence. Figure 10.7 shows that condom use increases with men’s level of education in all countries presented. This pattern is most pronounced in Burkina Faso where condoms were used at last sex by 9% of men with no education, compared with 50% of men with higher education. It is more muted in Namibia and Zimbabwe, although there is still a gap of 10 to 15 percentage points between men with no education and with higher education.
Figure 10.7. Prevalence of specific methods of contraception at last sex by men’s education, most recent DHS survey
0%
10%
20%
30%
40%
50%
60%
None Primary Secondary Higher
Condom Namibia 2013
Gabon 2000
Burkina Faso 2010
Côte d'Ivoire 2011-12
Haiti 2000
Nepal 2011
Bolivia 2008
Tanzania 2010
Zimbabwe 2010-11
Ghana 2008
Nigeria 2013
0%
5%
10%
15%
20%
25%
30%
None Primary Secondary Higher
Female Sterilization
Nepal 2011
Bolivia 2008
Haiti 2000
Tanzania 2010
Ghana 2008
0%
1%
2%
3%
4%
5%
6%
7%
None Primary Secondary Higher
Male Sterilization
Nepal 2011
Namibia 2013
Ghana 2008
Indonesia 2012
0%
5%
10%
15%
20%
25%
30%
None Primary Secondary Higher
Pill
Zimbabwe 2010-11
Cambodia 2010
Indonesia 2012
0%
5%
10%
15%
20%
25%
30%
35%
40%
None Primary Secondary Higher
Injectable
Indonesia 2012
Ethiopia 2011
Rwanda 2010
97
Use of female sterilization declines steadily as men’s level of education increases in Nepal, whereas in Tanzania, female sterilization increases noticeably among the partners of men with higher education. Male sterilization is significantly higher among men with no education or primary education, compared with men with secondary or higher education in Nepal. Patterns of pill and injectable use vary by country. Pill use decreases with increasing men’s education in Cambodia and Indonesia, whereas it increases with education in Zimbabwe. Use of injectables declines with increasing level of education in Rwanda. In Ethiopia, use of injectables at last sex is lowest among partners of men with primary or secondary education, but it is highest among these groups in Indonesia.
10.4.2. Household wealth quintile
Figure 10.8 shows that condom use increases with men’s household wealth quintile. In Namibia, the prevalence of condom use initially increases and then plateaus among men in wealthier households. In Burkina Faso and Côte d’Ivoire, the increases are largest among men in the richest wealth quintiles.
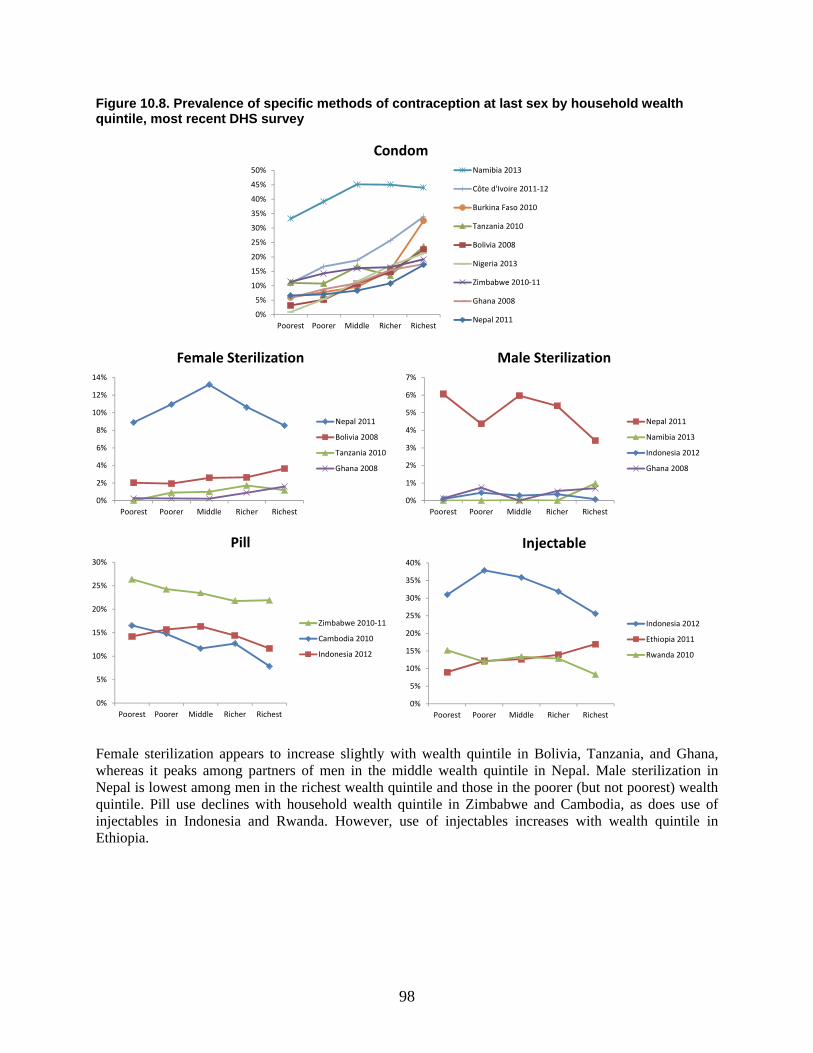
98
Figure 10.8. Prevalence of specific methods of contraception at last sex by household wealth quintile, most recent DHS survey
Female sterilization appears to increase slightly with wealth quintile in Bolivia, Tanzania, and Ghana, whereas it peaks among partners of men in the middle wealth quintile in Nepal. Male sterilization in Nepal is lowest among men in the richest wealth quintile and those in the poorer (but not poorest) wealth quintile. Pill use declines with household wealth quintile in Zimbabwe and Cambodia, as does use of injectables in Indonesia and Rwanda. However, use of injectables increases with wealth quintile in Ethiopia.
0%
5%
10%
15%
20%
25%
30%
35%
40%
45%
50%
Poorest Poorer Middle Richer Richest
CondomNamibia 2013
Côte d'Ivoire 2011-12
Burkina Faso 2010
Tanzania 2010
Bolivia 2008
Nigeria 2013
Zimbabwe 2010-11
Ghana 2008
Nepal 2011
0%
2%
4%
6%
8%
10%
12%
14%
Poorest Poorer Middle Richer Richest
Female Sterilization
Nepal 2011
Bolivia 2008
Tanzania 2010
Ghana 2008
0%
1%
2%
3%
4%
5%
6%
7%
Poorest Poorer Middle Richer Richest
Male Sterilization
Nepal 2011
Namibia 2013
Indonesia 2012
Ghana 2008
0%
5%
10%
15%
20%
25%
30%
Poorest Poorer Middle Richer Richest
Pill
Zimbabwe 2010-11
Cambodia 2010
Indonesia 2012
0%
5%
10%
15%
20%
25%
30%
35%
40%
Poorest Poorer Middle Richer Richest
Injectable
Indonesia 2012
Ethiopia 2011
Rwanda 2010
99
10.4.3. Residence
Figure 10.9 shows the prevalence of the three most commonly used methods in each country disaggregated by residence. Condom use is significantly higher among men in urban areas than among those in rural areas. This pattern is seen both where condom prevalence is high, such as in Namibia, and where it is relatively low, such as in Ethiopia and the Democratic Republic of Congo.
Pill use is higher in rural areas than in urban areas among men in Zimbabwe and Cambodia, but lower in rural areas in Gabon, Namibia, Burkina Faso, and Ethiopia. Use of injectables is typically higher in rural areas, as seen in Indonesia, Bolivia, Cambodia, Rwanda, and Haiti. IUD use is only found in urban areas in Indonesia and Bolivia. Periodic abstinence is higher in urban areas in four countries, but lower in urban areas in two countries, and equivalent in urban and rural areas in Gabon.
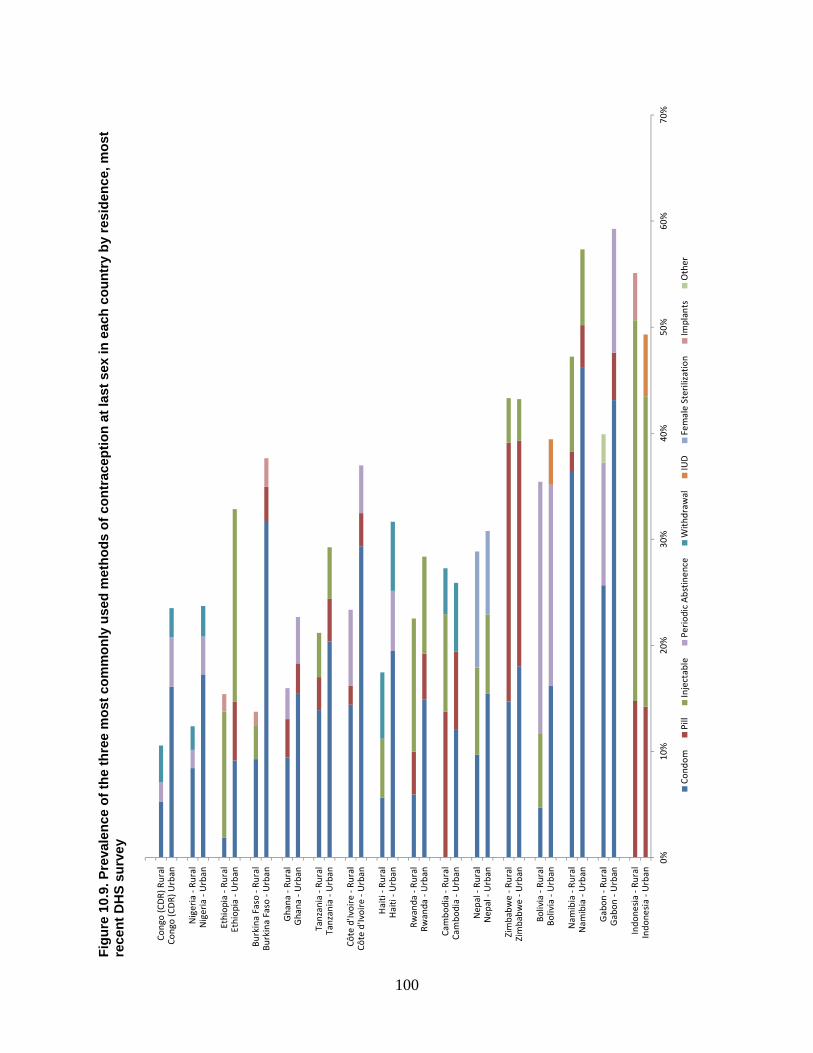
100
Fig
ure
10.
9. P
reva
len
ce o
f th
e th
ree
mo
st c
om
mo
nly
use
d m
eth
od
s o
f co
ntr
acep
tio
n a
t la
st s
ex in
eac
h c
ou
ntr
y b
y re
sid
ence
, mo
st
rece
nt
DH
S s
urv
ey
0%10
%20
%30
%40
%50
%60
%70
%
Indo
nesi
a - U
rban
Indo
nesi
a - R
ural
Gab
on -
Urb
anG
abon
- Ru
ral
Nam
ibia
- U
rban
Nam
ibia
- Ru
ral
Boliv
ia -
Urb
anBo
livia
- Ru
ral
Zim
babw
e - U
rban
Zim
babw
e - R
ural
Nep
al -
Urb
anN
epal
- Ru
ral
Cam
bodi
a - U
rban
Cam
bodi
a - R
ural
Rwan
da -
Urb
anRw
anda
- Ru
ral
Hai
ti - U
rban
Hai
ti - R
ural
Côte
d'Iv
oire
- U
rban
Côte
d'Iv
oire
- Ru
ral
Tanz
ania
- U
rban
Tanz
ania
- Ru
ral
Gha
na -
Urb
anG
hana
- Ru
ral
Burk
ina
Faso
- U
rban
Burk
ina
Faso
- Ru
ral
Ethi
opia
- U
rban
Ethi
opia
- Ru
ral
Nig
eria
- U
rban
Nig
eria
- Ru
ral
Cong
o (C
DR)
Urb
anCo
ngo
(CD
R) R
ural
Cond
omPi
llIn
ject
able
Peri
odic
Abs
tinen
ceW
ithdr
awal
IUD
Fem
ale
Ster
iliza
tion
Impl
ants
Oth
er
101
11. Discussion and Conclusions
11.1. Contraceptive Knowledge
Of the 12 contraceptive methods listed in DHS surveys, the average number of methods men know ranges from 4.5 (Democratic Republic of the Congo) to 8.8 (Rwanda). There are no clear regional patterns and contraceptive knowledge has typically increased over time.
When broken out by type of method known, knowledge is not dominated solely by male-controlled methods. Rather, knowledge generally extends to at least one female-controlled method as well. However, when only a male- or female-controlled method is known, it is most likely to be a male-controlled method.
Contraceptive knowledge is generally lowest among men with no children. It is higher among men with children, although differences between men with few or many children are small. This pattern likely reflects the age and life course stage of childless men, a conclusion supported by the findings that contraceptive knowledge is usually lower among never-married men and highest among those aged 35-45. These are markers of a stage of the life course when men this age are likely to have achieved their ideal family size and have both the motivation and experience with having children that allows for learning new methods of contraception.
Contraceptive knowledge is also positively and significantly associated with men’s level of education in 13 of 16 countries; there is little variation in contraceptive knowledge by urban-rural residence or by household wealth quintile.
11.2. Fertility and Fertility Preferences
Mean ideal number of children among men is above replacement level in all 18 countries, with an overall range from 2.3 to 8.0, and is highest in West and Central Africa. Ideal number of children varies significantly and negatively by level of education, household wealth quintile, urban residence, and monogamous union; ideal number of children varies positively by age, current number of children, currently married, and polygamous union in a majority of countries. Of the 17 countries with trend data, eight show fluctuations comprising both increases and decreases in mean ideal number of children over time, eight exclusively decreased over time, and one increased over time.
Men’s preference for a specific sex composition for their children is strong: Among men who wanted at least one child, the proportion of those men who have a specific desired sex for all of their desired children—complete sex preference—ranges from 74% in Tanzania to 96% in Cambodia.
We assessed the preferred sex composition of children among men who wanted at least one child and who have complete sex preference. Overall, three of the four countries with the highest percentages of men who prefer a balanced sex composition—equal numbers of male and female children—are the Asian countries included in the study. The four countries with the least preference for balance and the most preference for a skewed sex composition are in West and Central Africa (the Democratic Republic of the Congo, Cameroon, Burkina Faso, and Nigeria) and this preference favors sons. The only country where a higher proportion of men wanted all or mainly daughters (compared with all or mainly sons) is Cambodia.
102
Both the number of children a man has ever had and the number still living varies across countries. The Democratic Republic of the Congo has the highest mean number of children ever born and living as reported by men, 3.5 and 2.9, respectively. Namibia has the lowest mean number of children ever born and living, 1.4 and 1.2 respectively. A consistent trend with men reporting declining average numbers of children ever born is evident in most countries included in the study, increasing only in the Democratic Republic of the Congo and Cameroon.
11.3. Attitudes toward Contraception
Men’s disagreement with the statement, “women who use contraception may become promiscuous,” ranges from 34% in Namibia to 84% in Rwanda. In four countries (Tanzania, Ghana, Nepal, and Namibia), less than 50% of men disagreed with the statement. There is no clear regional pattern in terms of the proportions disagreeing with the statement. In two-thirds of countries with trend data, disagreement with the statement increased over time.
In contrast, over 50% of men in all countries disagrees with the statement, “contraception is a woman’s business and a man should not have to worry about it,” ranging from 53% in Indonesia to 86% in Nigeria. Of 11 countries with trend data, no clear pattern of change is evident in the percentage disagreeing with the statement.
Socioeconomic factors are significantly associated with contraceptive attitudes: men who are more educated or live in wealthier households (all 11 countries), or live in urban areas (10 of 11 countries) are more likely to have positive attitudes toward contraception. Life course factors are related to men’s contraceptive attitudes only slightly less frequently: positive attitudes are highest among men who have children (8 of 11 countries) and among men in the middle age groups; positive attitudes are lowest among men in the youngest and oldest age groups (9 of 11 countries).
11.4. Gender Attitudes
The degree to which men consider wife beating acceptable varies widely across the countries studied, with no regional pattern evident. Fifteen percent of men in Haiti report that wife beating is justified in at least one scenario, compared with 62% of men in the Democratic Republic of Congo. The acceptability of wife beating has declined substantially over time—on average, a 20-percentage point decrease each decade. The most sizable decreases in the acceptability of wife beating (closer to 30 percentage points) are observed in Rwanda and Ethiopia, where the number of scenarios in which men report wife beating as justified fell from a mean of 2.5 in 2000 to 1.6 in 2011.
Men’s acceptance of wife beating declines significantly with age (13 of 14 countries) and number of children (10 of 14 countries) and is lower among currently married men (10 of 13 countries10). It also declines with increasing level of education and increasing household wealth quintile; and it is lower among men living in urban areas (all 14 countries).
In contrast to the wide variation in men’s attitudes toward wife beating, attitudes about wives’ ability to negotiate safer sex are consistently positive. Between 79% and 96% of men in the countries studied think a wife is justified in asking that they use a condom if her husband has an STI. However, significant
10 Indonesia is excluded from the analysis by marital status because the survey was administered to a sample of currently married men only.
103
increases in this indicator of women’s sexual agency over time have occurred in only four countries: Haiti, Ethiopia, Nigeria, and Tanzania.
Men’s attitudes about women’s sexual agency are associated with age in 11 of 13 countries (all but Ghana and Gabon). Agreement that wives are justified in asking that they use a condom if her husband has an STI is lowest among men in the youngest and oldest age groups, and highest in the middle age groups. Attitudes supportive of wives’ ability to negotiate safer sex are positively associated with number of children in 9 of 13 countries, and with being currently or formerly married in just 6 countries.
Men are more likely to agree with wives’ agency to negotiate safer sex if they are more educated (15 countries), live in wealthier households (15 countries), and reside in urban areas (9 of 15 countries), a pattern similar to that seen regarding men’s attitudes toward wife beating. In the case of attitudes towards wives’ agency to negotiate safer sex, socioeconomic characteristics appear to play a larger role than do life course factors.
11.5. Use of Contraception at Last Sex
The proportion of men who report that they (or their partner) used contraception at last sex ranges widely in the countries studied, from 17% in the Democratic Republic of Congo to 63% in Indonesia. Six of 14 countries saw a significant increase in use of contraception over time. In Rwanda, use of contraception fell between 1992 and 2000, but rebounded in 2010.
While use of contraception at last sex is significantly associated with men’s marital status in all but one country in the study, there is no discernible pattern to that association. In seven countries, contraceptive use is significantly higher among currently married men compared with never-married men (and sometimes formerly married men); but in five other countries it is significantly lower than among never-married men. Finally, in Tanzania, use of contraception at last sex is higher among formerly married men than among either currently married or never-married men.
Men’s use of contraception varies significantly by type of partner. In all 14 countries for which data are available, a lower proportion of men report use of a method of contraception at last sex when the partner was their spouse or cohabiting partner. Use of contraception is highest when men had sex with a commercial sex worker/casual acquaintance, or with a girlfriend/fiancée. Men’s contraceptive use with these partner types is similar across countries.
Men’s use of contraception at last sex is positively associated with positive gender attitudes. Use of contraception is significantly higher among men who disagree that wife beating is acceptable in 7 of 12 study countries and significantly higher among men who agree with wives’ agency to negotiate safer sex in all 10 study countries.
In every country, men who used contraception at last sex are more likely to have used a modern method than a traditional method. The prevalence of modern method use increased significantly over time in six of 14 countries with trend data; observed increases elsewhere are not significant.
The percentage of men using male-controlled and cooperative methods of contraception at last sex is higher than the percentage using female-controlled methods in 11 of 17 countries. At the same time, use of female-controlled methods is higher in six countries. The most extreme cases are the Democratic
104
Republic of the Congo, where men who used contraception at last sex are 12 times more likely to have used a male-controlled or cooperative method, and Indonesia, where men are almost 12 times more likely to use a female-controlled contraceptive method. Regional trends are evident, with all countries in Central Africa, West Africa, and Latin America and the Caribbean having higher percentages of men using male-controlled or cooperative methods compared with female-controlled methods, and all countries in Asia having higher percentages of men using female-controlled methods.
11.6. Method of Contraception
The contraceptive method mix as reported by men is concentrated in just a few contraceptive methods in each of the study countries. Three or fewer methods account for the vast majority of all contraceptive use at last sex. In 10 of 16 countries, a single dominant method (condom) accounts for more than 50% of all contraceptive use at last sex.
The condom contributes the largest share to overall contraceptive use in 10 countries, including most African countries, Haiti, and Nepal, and plays a substantial role in five more countries. The pill accounts for 50% of all contraceptive use in Zimbabwe, 34% in Cambodia, and 23% in Indonesia. Periodic abstinence and withdrawal make a sizable contribution to contraceptive use in the Democratic Republic of Congo, Nigeria, Rwanda, and Haiti. Male sterilization is negligible in almost all countries.
There has been a marked increase in condom use over time in most countries. Injectables, which contribute substantially to the method mix in Rwanda, Ethiopia, and Indonesia, and implants, which seldom contribute measurably to overall contraceptive use, have both increased over time in many countries.
Relationship factors and life course factors figure prominently in the method of contraception used at last sex. Condom use, which is rare among married men, is significantly higher among never-married and formerly married men. In contrast, use of the pill, injectables, periodic abstinence, and withdrawal are each higher among currently married men than among never-married or formerly married men, and this pattern is consistent across the countries in the study.
Similarly, condoms are rarely used by men when sexual intercourse is with a spouse or cohabiting partner. Condom use is highest when sex occurs with a commercial sex worker/casual acquaintance. Use of injectables at last sex is consistently and dramatically higher among men who have sex with their spouse than among men who have sex with other types of partners, as is pill use in Zimbabwe, Cambodia, and Rwanda.
Use of condoms at last sex is higher among young men and among childless men. This pattern is most striking in Gabon where condom use exceeds 50% among childless men and falls to 23% among men with five or more children. The use of permanent methods of contraception such as female sterilization or male sterilization shows the converse pattern; prevalence of these methods is near zero among young men and among childless men but increases with age and number of children. Prevalence of the pill and injectables is nearly nonexistent among childless men but increases among men with 1-2 or 3-4 children. Taken together, the patterns of use of contraceptive methods by age and number of children tend to support the importance of life course factors alongside relationship factors.
105
References
Bankole, A., and A. Ezeh. 1999. "Unmet need for couples: An analytical framework and evaluation with DHS data." Population Research and Policy Review 18 (6):579-605. Bankole, A., and S. Singh. 1998. "Couples' fertility and contraceptive decision-making in developing countries: hearing the man's voice." International Family Planning Perspectives:15-24. Barua, A., and K. Kurz. 2001. "Reproductive health-seeking by married adolescent girls in Maharashtra, India." Reproductive health matters 9 (17):53-62. Barua, A., R.P. Pande, K. MacQuarrie, and S. Walia. 2004. "Caring men? Husbands' involvement in maternal care of young wives." Economic and Political Weekly:5661-5668. Becker, S. 1999. "Measuring Unmet Need: Wives, Husbands or Couples?" International Family Planning Perspectives 25 (4):172-180. Carter, M.W. 2002. "'Because he loves me': husbands' involvement in maternal health in Guatemala." Culture, health & sexuality 4 (3):259-279. Casterline, J.B., Z.A. Sathar, and M. Haque. 2001. "Obstacles to contraceptive use in Pakistan: A study in Punjab." Studies in family planning 32 (2):95-110. DeRose, L.F., F.N.-A. Dodoo, and V. Patil. 2002. "Fertility desires and perceptions of power in reproductive conflict in Ghana." Gender & Society 16 (1):53-73. Diro, C.W., and M.F. Afework. 2013. "Agreement and concordance between married couples regarding family planning utilization and fertility intention in Dukem, Ethiopia." BMC Public Health 13 (1):903. Dodoo, F.N.-A. 1998. "Men matter: additive and interactive gendered preferences and reproductive behavior in Kenya." Demography 35 (2):229-242. Gebreselassie, T. 2008. Spousal agreement on reproductive preferences in sub-Saharan Africa. DHS Analytical Studies No. 10. Calverton, Maryland, USA: Macro International. Available at http://dhsprogram.com/pubs/pdf/AS10/AS10.pdf. ICF International. 2011. Demographic and Health Surveys Methodology - Questionnaires: Household, Woman's, and Man's. Calverton, MD: MEASURE DHS Phase III. ICF International. 2015. Demographic and Health Survey Interviewer's Manual. Rockville, MD: ICF International. Ijadunola, M.Y., T.C. Abiona, K.T. Ijadunola, O.T. Afolabi, O.A. Esimai, and F.M. OlaOlorun. 2010. "Male involvement in family planning decision making in Ile-Ife, Osun State, Nigeria." African Journal of Reproductive Health 14 (4). Johnson, K., and Y. Gu. 2009. Men's Reproductive Health: Findings from the Demographic and Health Surveys, 1995-2004, DHS Comparative Reports No. 17. Calverton, MD: ICF Macro.
106
MacDonald, L., L. Jones, P. Thomas, L. Thi Thu, S. FitzGerald, and D. Efroymson. 2013. "Promoting male involvement in family planning in Vietnam and India: HealthBridge experience." Gender & Development 21 (1):31-45. MacQuarrie, K.L., and J. Edmeades. 2015. "Whose Fertility Preferences Matter? Women, Husbands, In-laws, and Abortion in Madhya Pradesh, India." Population Research and Policy Review 34 (4):615-639. Mason, K.O., and H.L. Smith. 2000. "Husbands' versus Wives' Fertility Goals and Use of Contraception: the Influence of Gender Context in Five Asian Countries." Demography 37 (3):299-311. Mosha, I., R. Ruben, and D. Kakoko. 2013. "Family planning decisions, perceptions and gender dynamics among couples in Mwanza, Tanzania: a qualitative study." BMC public health 13 (1):523. Onyango, M.A., S. Owoko, and M. Oguttu. 2010. "Factors that influence male involvement in sexual and reproductive health in Western Kenya: a qualitative study: original research article." African Journal of Reproductive Health 14 (4):33-43. Pearson, E., and S. Becker. 2014. "Couples' Unmet Need for Family Planning in Three West African Countries." Studies in Family Planning 45 (3):339-359. Snow, R.C., R.A. Winter, and S.D. Harlow. 2013. "Gender Attitudes and Fertility Aspirations among Young Men in Five High Fertility East African Countries." Studies in Family Planning 44 (1):1-24. Trussell, J. 2011. "Contraceptive Efficacy." In Contraceptive Technology, edited by Robert A Hatcher, James Trussell, Anita L Nelson, Willard Cates, Deborah Kowal and Michael S Policar. New York, NY: Ardent Media. World Health Organization Reproductive Health and Research (WHO/RHR), and Johns Hopkins Bloomberg School of Public Health Center for Communitation Programs (JHU/CCP). 2011. Family Planning: A Global Handbook for Providers: Evidence-based Guidance Developed Through Worldwide Collaboration. 2011 update ed. Baltimore, MD and Geneva: CCP and WHO.

107
Appendix A

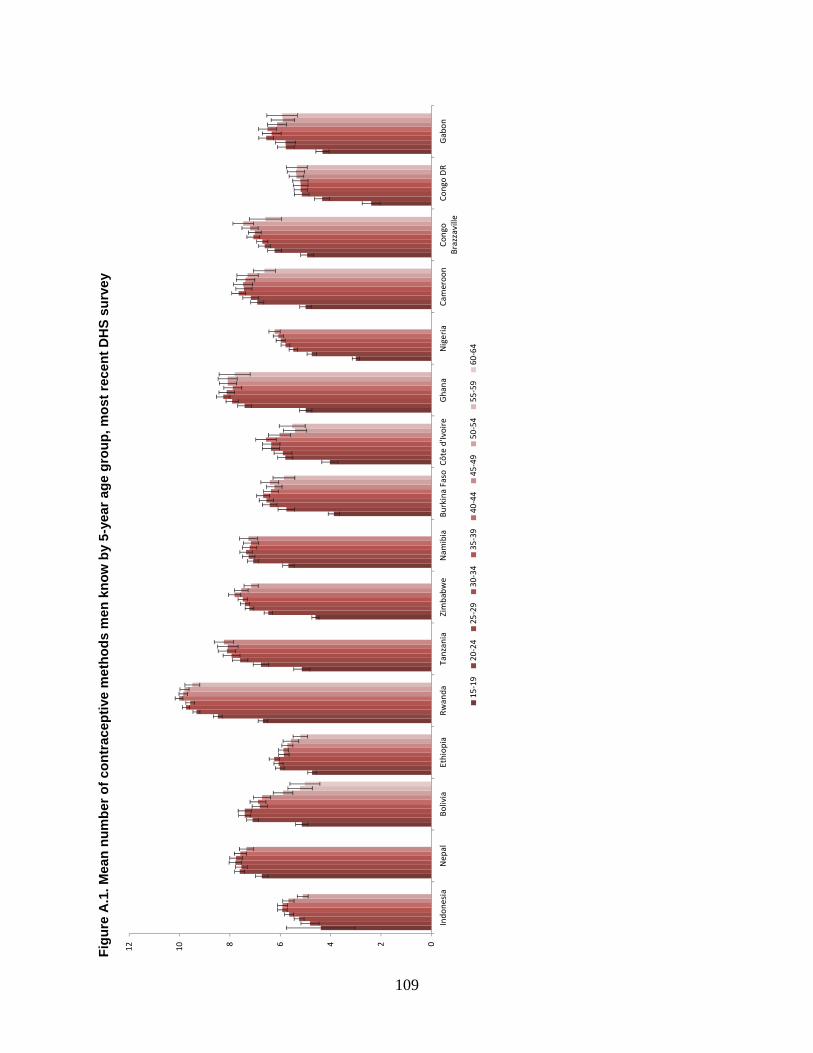
109
Fig
ure
A.1
. Mea
n n
um
ber
of
con
trac
epti
ve m
eth
od
s m
en k
no
w b
y 5-
year
ag
e g
rou
p, m
ost
rec
ent
DH
S s
urv
ey
024681012
Indo
nesi
aN
epal
Boliv
iaEt
hiop
iaRw
anda
Tanz
ania
Zim
babw
eN
amib
iaBu
rkin
a Fa
soCô
te d
'Ivoi
reG
hana
Nig
eria
Cam
eroo
nCo
ngo
Braz
zavi
lleCo
ngo
DR
Gab
on
15-1
920
-24
25-2
930
-34
35-3
940
-44
45-4
950
-54
55-5
960
-64
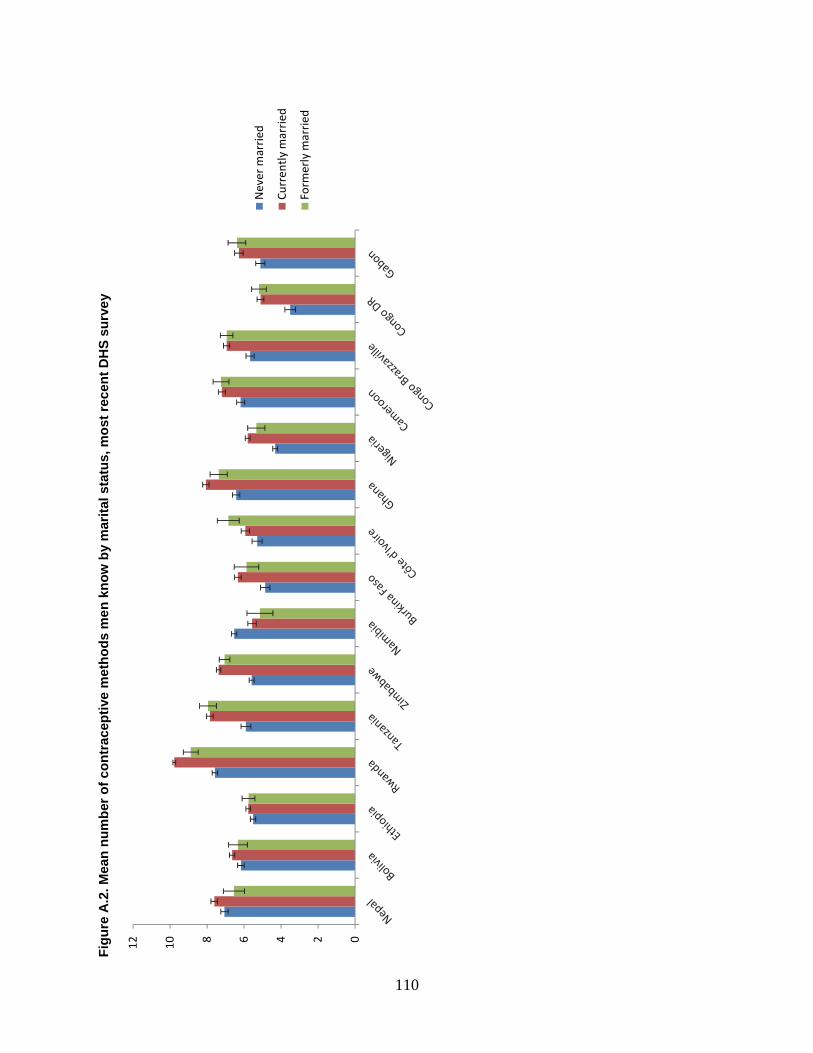
110
Fig
ure
A.2
. Mea
n n
um
ber
of
con
trac
epti
ve m
eth
od
s m
en
kn
ow
by
mar
ital
sta
tus,
mo
st r
ecen
t D
HS
su
rve
y
024681012
Nev
er m
arri
ed
Curr
ently
mar
ried
Form
erly
mar
ried
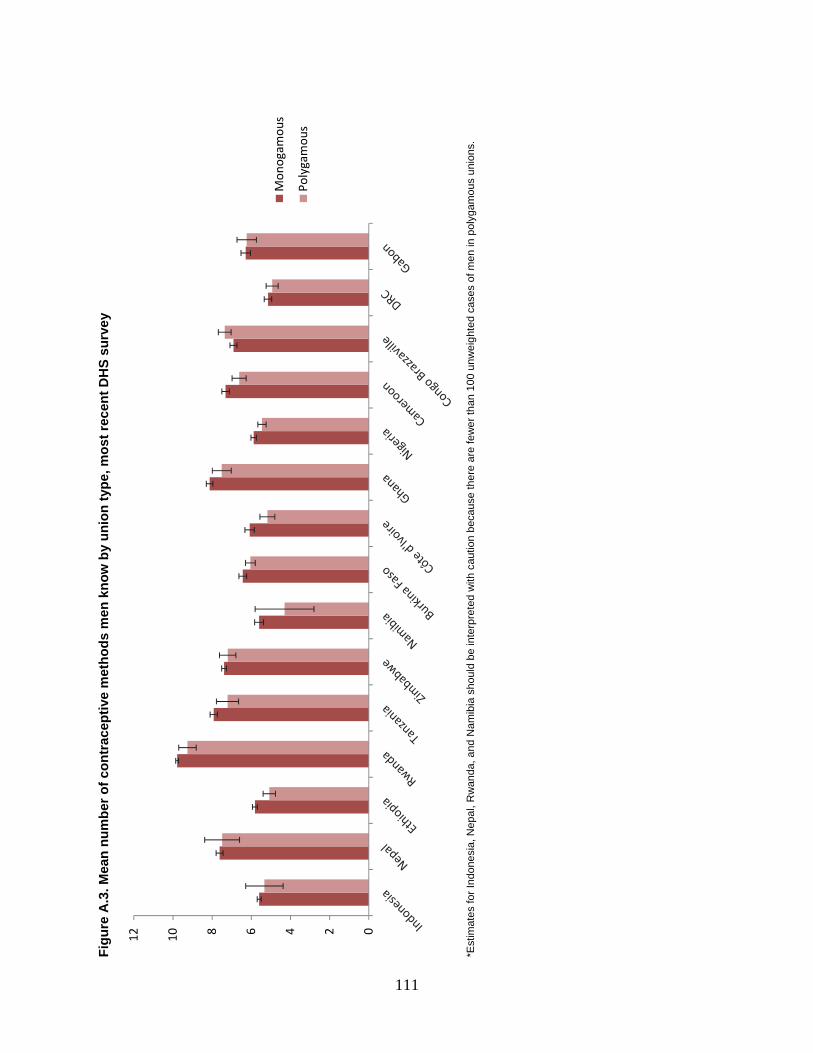
111
Fig
ure
A.3
. Mea
n n
um
ber
of
con
trac
epti
ve m
eth
od
s m
en k
no
w b
y u
nio
n t
ype,
mo
st r
ecen
t D
HS
su
rve
y
*E
stim
ates
for I
ndon
esia
, Nep
al, R
wan
da, a
nd N
amib
ia s
houl
d be
inte
rpre
ted
with
cau
tion
beca
use
ther
e ar
e fe
wer
than
100
unw
eigh
ted
case
s of
men
in p
olyg
amou
s un
ions
.
024681012
Mon
ogam
ous
Poly
gam
ous


113
Appendix B

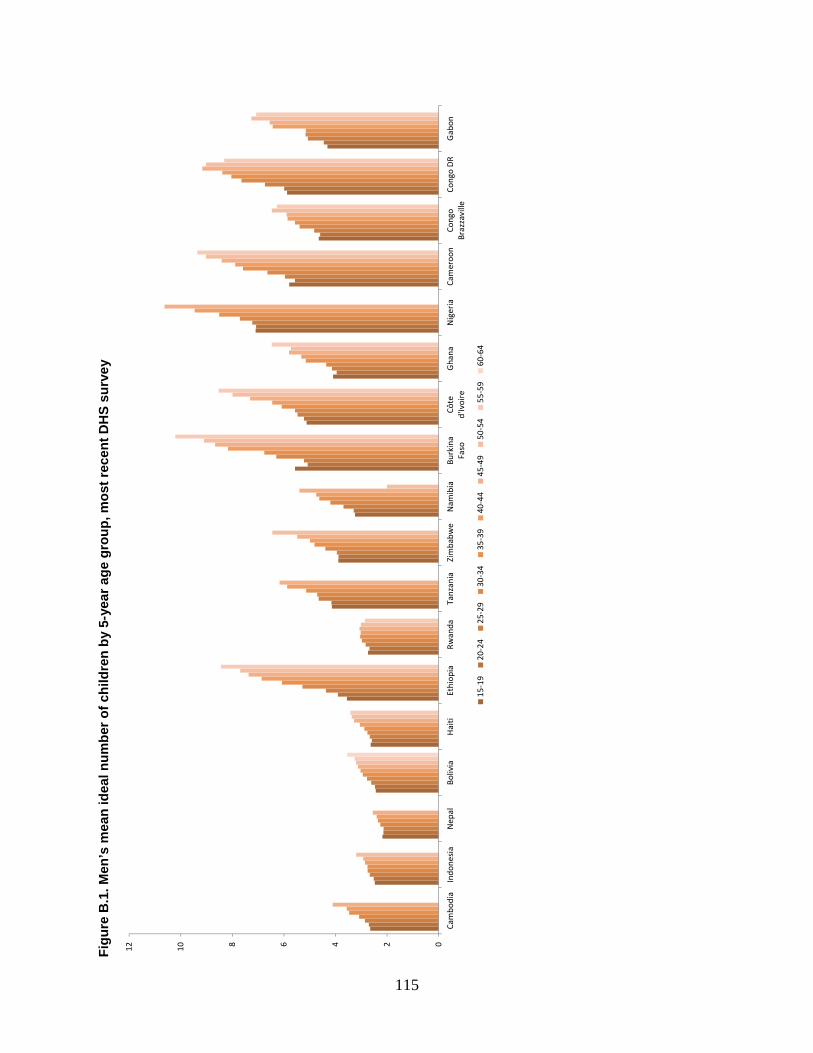
115
Fig
ure
B.1
. Men
’s m
ean
idea
l nu
mb
er o
f ch
ildre
n b
y 5-
year
ag
e g
rou
p, m
ost
rec
ent
DH
S s
urv
ey
024681012
Cam
bodi
aIn
done
sia
Nep
alBo
livia
Hai
tiEt
hiop
iaRw
anda
Tanz
ania
Zim
babw
eN
amib
iaBu
rkin
aFa
soCô
ted'
Ivoi
reG
hana
Nig
eria
Cam
eroo
nCo
ngo
Braz
zavi
lleCo
ngo
DR
Gab
on
15-1
920
-24
25-2
930
-34
35-3
940
-44
45-4
950
-54
55-5
960
-64
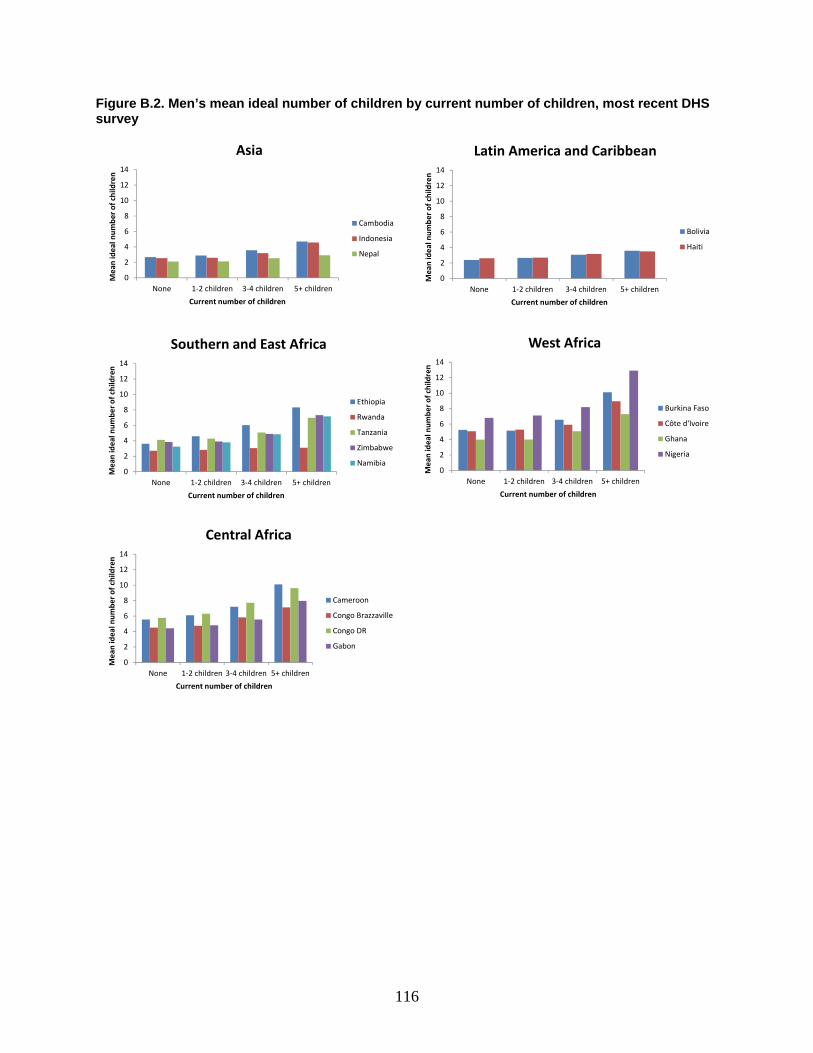
116
Figure B.2. Men’s mean ideal number of children by current number of children, most recent DHS survey
0
2
4
6
8
10
12
14
None 1-2 children 3-4 children 5+ children
Mea
n id
eal n
umbe
r of c
hild
ren
Current number of children
Asia
Cambodia
Indonesia
Nepal
0
2
4
6
8
10
12
14
None 1-2 children 3-4 children 5+ children
Mea
n id
eal n
umbe
r of c
hild
ren
Current number of children
Latin America and Caribbean
Bolivia
Haiti
0
2
4
6
8
10
12
14
None 1-2 children 3-4 children 5+ children
Mea
n id
eal n
umbe
r of c
hild
ren
Current number of children
Southern and East Africa
Ethiopia
Rwanda
Tanzania
Zimbabwe
Namibia0
2
4
6
8
10
12
14
None 1-2 children 3-4 children 5+ children
Mea
n id
eal n
umbe
r of c
hild
ren
Current number of children
West Africa
Burkina Faso
Côte d'Ivoire
Ghana
Nigeria
0
2
4
6
8
10
12
14
None 1-2 children 3-4 children 5+ children
Mea
n id
eal n
umbe
r of c
hild
ren
Current number of children
Central Africa
Cameroon
Congo Brazzaville
Congo DR
Gabon
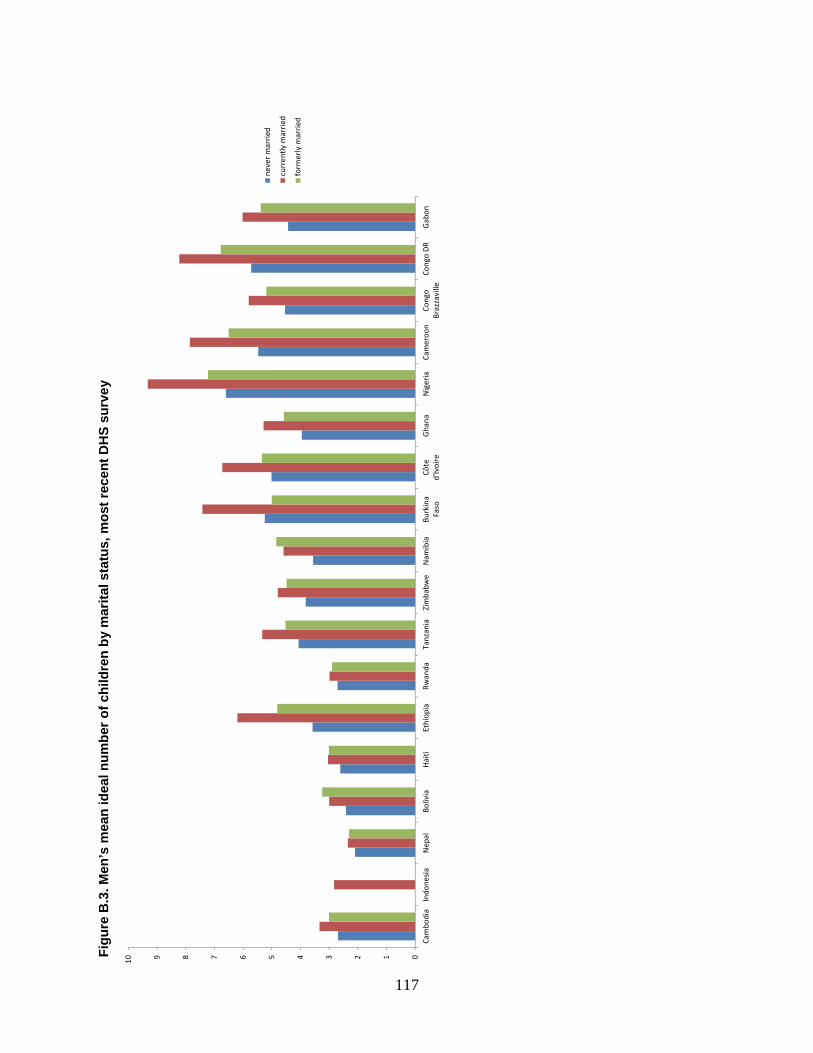
117
Fig
ure
B.3
. Men
’s m
ean
idea
l nu
mb
er o
f ch
ildre
n b
y m
arit
al s
tatu
s, m
ost
rec
ent
DH
S s
urv
ey
012345678910
Cam
bodi
aIn
done
sia
Nep
alBo
livia
Hai
tiEt
hiop
iaRw
anda
Tanz
ania
Zim
babw
eN
amib
iaBu
rkin
aFa
soCô
ted'
Ivoi
reG
hana
Nig
eria
Cam
eroo
nCo
ngo
Braz
zavi
lleCo
ngo
DR
Gab
on
neve
r mar
ried
curr
ently
mar
ried
form
erly
mar
ried
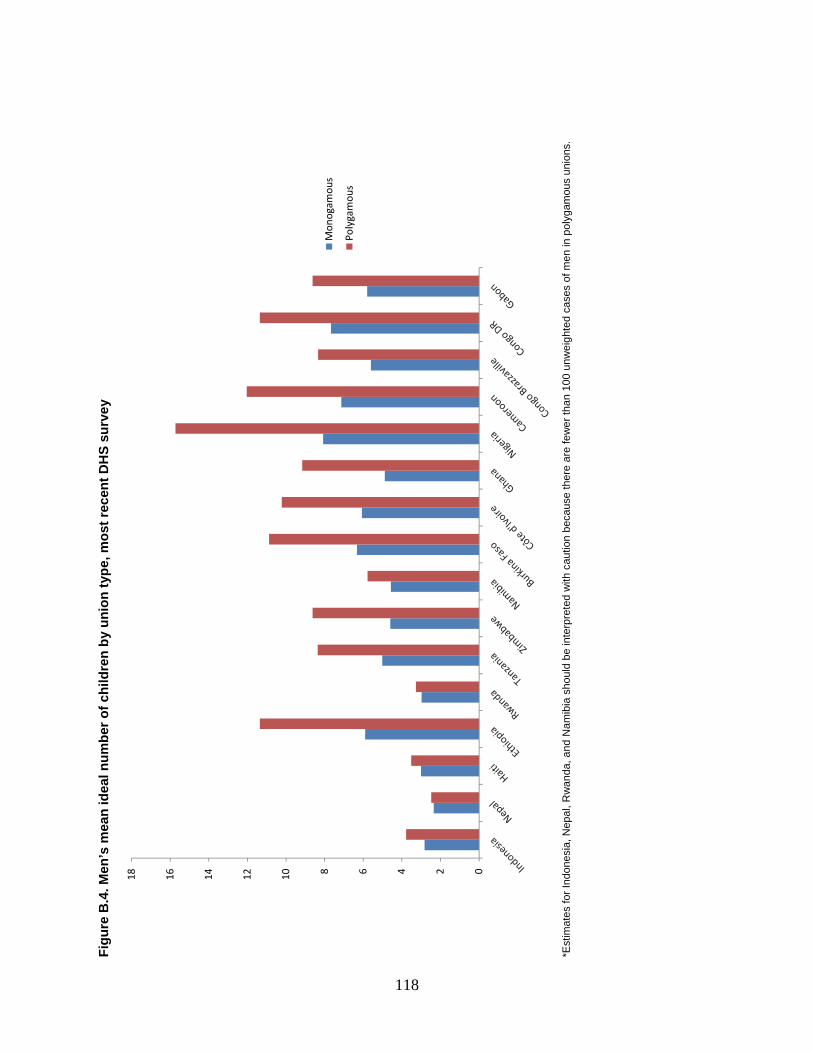
118
Fig
ure
B.4
. Men
’s m
ean
idea
l nu
mb
er o
f ch
ildre
n b
y u
nio
n t
ype,
mo
st r
ecen
t D
HS
su
rve
y
*E
stim
ates
for I
ndon
esia
, Nep
al, R
wan
da, a
nd N
amib
ia s
houl
d be
inte
rpre
ted
with
cau
tion
beca
use
ther
e ar
e fe
wer
than
100
unw
eigh
ted
case
s of
men
in p
olyg
amou
s un
ions
.
024681012141618
Mon
ogam
ous
Poly
gam
ous