Embed Size (px)
Citation preview

Diagnosing and Segmenting Brain Tumors and Phenotypes using MRI Scans
CS229 Final Project, Autumn 2014
Samuel Teicher
Alexander Martinez
I. Introduction Due to significant physiological differences in
both brains and their pathologies (tumors, edema, hemorrhaging, etc.), leveraging information contained in brain MRIs remains a challenging task in medical image analysis. To address this problem, the Medical Image Computing and Computer Assisted Intervention Society (MICCAI) facilitates two challenges: The Machine Learning Challenge (MLC) and the Multimodal Brain Segmentation Challenge (BraTS). In our project, we implemented and examined learning algorithms that address both challenges. These two challenges respectively address two very important problems in MRI diagnosis:
The first problem is the binary classification of brains into a clinically relevant “phenotype” (The brain is normal, has a tumor, brain hemorrhage, etc.) In this case, the data set is prepared such as to divorce the data from the clinical context.
In the second, multi-modal imaging data is used for image segmentation, or categorizing pixels into labeled classes. Here the goal is to segment the gross tumor from normal tissue, and further differentiate between necrotic core, edema, and active cells in the tumor.
Aside from sparing technicians from the labor-intensive process of identifying tumors and brain phenotypes by eye, automating these processes has the potential to identify smaller, disguised pathologies that would otherwise go unnoticed.
Figure 1 T1 MRI Scan of healthy brain
II. Data The Machine Learning Challenge (MLC 2014) provides the first dataset. For each of 150 patients, we have both a 3d voxel intensity map of the brain, which can be seen in figure (a), as well as a set of 180 features obtained using volumetric and intensity analysis. We utilized the latter dataset to develop our classification models.
The second data set, provided by MICCAI-BRATS 2014, includes 240!×155 voxel representations of 150 patients generated using 5 MRI modalities: T1, T1-contrast enhanced, T2, and T2 FLAIR. We denote patient MRI intensity data as 𝐼 = 𝐼!!! , 𝐼!!, 𝐼!!, 𝐼!!!"#$% .
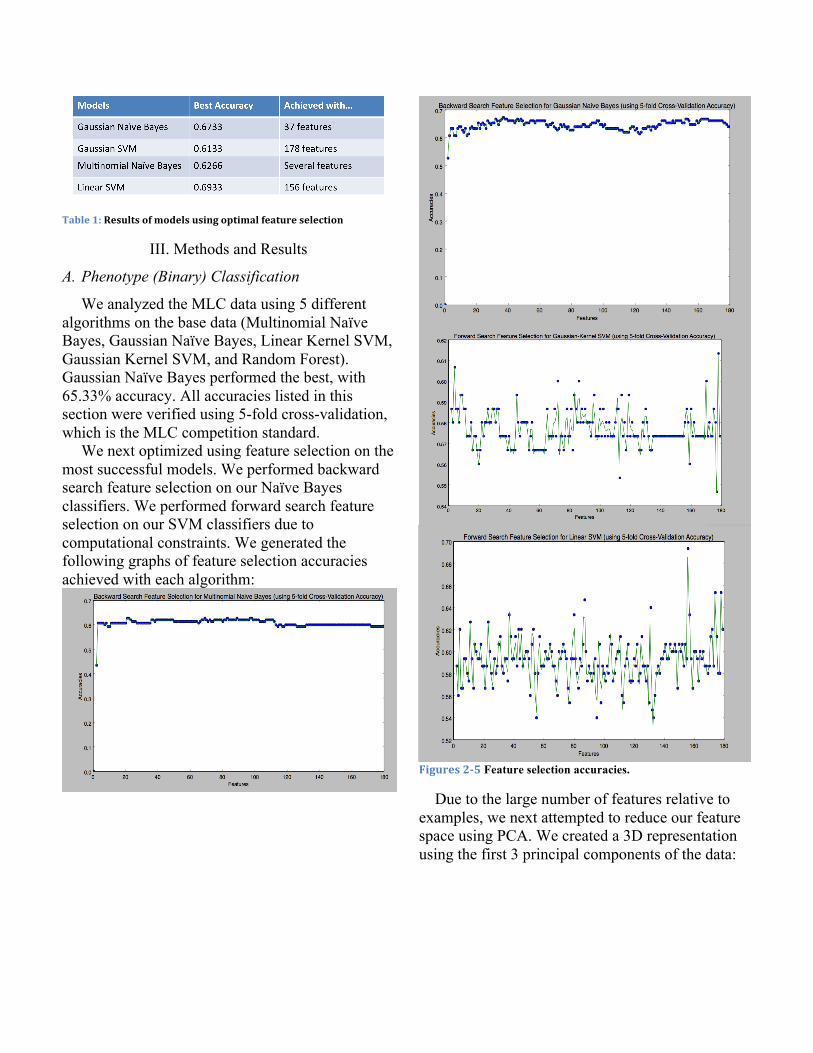
Table 1: Results of models using optimal feature selection
III. Methods and Results
A. Phenotype (Binary) Classification
We analyzed the MLC data using 5 different algorithms on the base data (Multinomial Naïve Bayes, Gaussian Naïve Bayes, Linear Kernel SVM, Gaussian Kernel SVM, and Random Forest). Gaussian Naïve Bayes performed the best, with 65.33% accuracy. All accuracies listed in this section were verified using 5-fold cross-validation, which is the MLC competition standard.
We next optimized using feature selection on the most successful models. We performed backward search feature selection on our Naïve Bayes classifiers. We performed forward search feature selection on our SVM classifiers due to computational constraints. We generated the following graphs of feature selection accuracies achieved with each algorithm:
Figures 2-‐5 Feature selection accuracies.
Due to the large number of features relative to examples, we next attempted to reduce our feature space using PCA. We created a 3D representation using the first 3 principal components of the data:
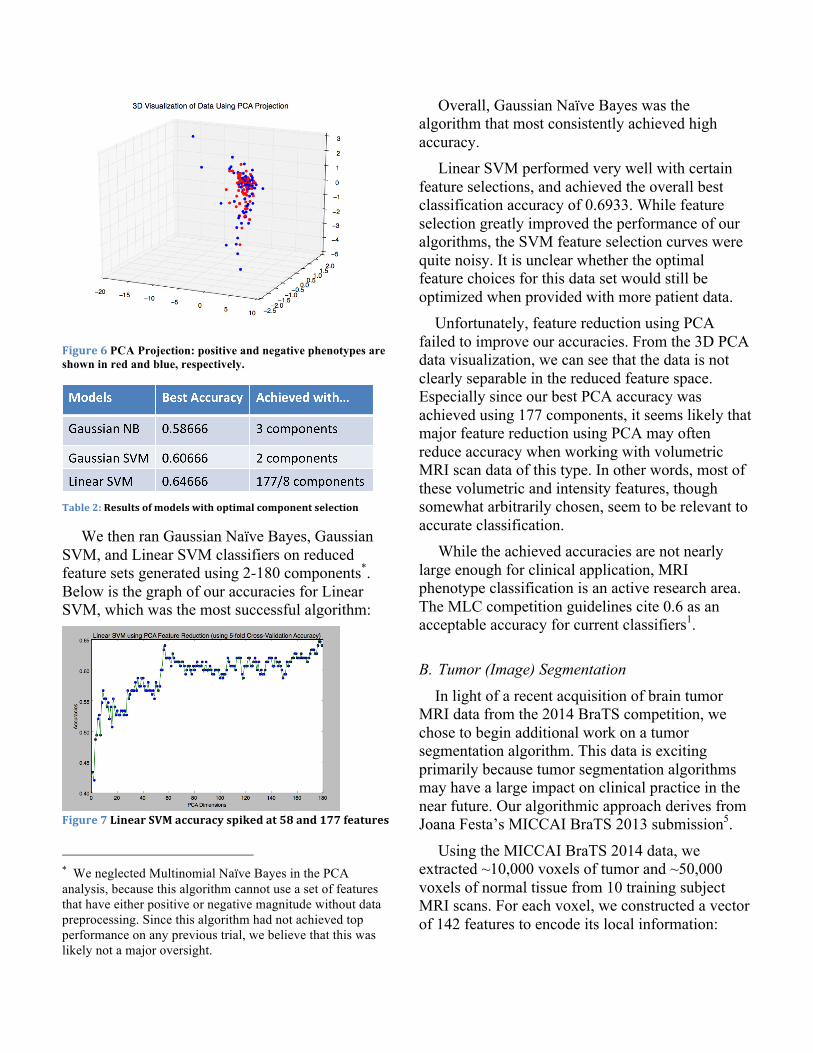
Figure 6 PCA Projection: positive and negative phenotypes are shown in red and blue, respectively.
Table 2: Results of models with optimal component selection
We then ran Gaussian Naïve Bayes, Gaussian SVM, and Linear SVM classifiers on reduced feature sets generated using 2-180 components*. Below is the graph of our accuracies for Linear SVM, which was the most successful algorithm:
Figure 7 Linear SVM accuracy spiked at 58 and 177 features
* We neglected Multinomial Naïve Bayes in the PCA analysis, because this algorithm cannot use a set of features that have either positive or negative magnitude without data preprocessing. Since this algorithm had not achieved top performance on any previous trial, we believe that this was likely not a major oversight.
Overall, Gaussian Naïve Bayes was the algorithm that most consistently achieved high accuracy.
Linear SVM performed very well with certain feature selections, and achieved the overall best classification accuracy of 0.6933. While feature selection greatly improved the performance of our algorithms, the SVM feature selection curves were quite noisy. It is unclear whether the optimal feature choices for this data set would still be optimized when provided with more patient data. Unfortunately, feature reduction using PCA failed to improve our accuracies. From the 3D PCA data visualization, we can see that the data is not clearly separable in the reduced feature space. Especially since our best PCA accuracy was achieved using 177 components, it seems likely that major feature reduction using PCA may often reduce accuracy when working with volumetric MRI scan data of this type. In other words, most of these volumetric and intensity features, though somewhat arbitrarily chosen, seem to be relevant to accurate classification.
While the achieved accuracies are not nearly large enough for clinical application, MRI phenotype classification is an active research area. The MLC competition guidelines cite 0.6 as an acceptable accuracy for current classifiers1.
B. Tumor (Image) Segmentation
In light of a recent acquisition of brain tumor MRI data from the 2014 BraTS competition, we chose to begin additional work on a tumor segmentation algorithm. This data is exciting primarily because tumor segmentation algorithms may have a large impact on clinical practice in the near future. Our algorithmic approach derives from Joana Festa’s MICCAI BraTS 2013 submission5.
Using the MICCAI BraTS 2014 data, we extracted ~10,000 voxels of tumor and ~50,000 voxels of normal tissue from 10 training subject MRI scans. For each voxel, we constructed a vector of 142 features to encode its local information:

We used voxel intensities from each of the 4 imaging modalities and the differences between each for a total of 10 features.
We included the cubic mean of a voxel: For these features, we found cubes of edge lengths 3,9,15, and 19 voxels surrounding the current voxel and stored the mean for each mode. We also used the differences between each mode, for a total of 40 additional features.
We next included contextual information: For these features we calculated for each mode the difference between the selected voxel intensity and the mean of a 3x3x3 cube whose center was 3 voxels away from the selected voxel. Since 6 cubes are considered in each mode, this yielded 24 additional features.
We then included the intensity range: Working with neighborhood cubes of edge lengths 3,9,15, and 19 voxels, we developed 17 lines across the space. We then calculated the difference between the largest and smallest elements along the line to determine the range, yielding 68 additional features.
We then trained a supervised Random Decision Forest using our ~60,000 feature vector examples for both tumor and healthy tissue.
This algorithm yields a preliminary segmented image by classifying each voxel in an MRI brain scan based on input intensity data from our 5-mode input, 𝐼!!! , 𝐼!!, 𝐼!!, 𝐼!!!"#$% .
The algorithmic advantage of using the Random Forest Classifier is its capability to handle many, possibly redundant features, and its improved generalization of unseen data given the randomness inherent in each of its unique trees. Practically speaking, the Random Forest can also offer relatively short training time relative to number of features, which is of particular necessity given the large set of local features required for accurate voxel classification and the large number of voxels in a brain MRI. In particular, the Random Forest offers the advantage that the training of its decision trees is an entirely parallelizable process5. In addition, Random Forest Classifiers offer the
ability to utilize relatively customized local features of the current patient’s scan as input features without incurring a large testing time penalty that would be intractable given the time constraints inherent to clinical usage of MRI.
Using this implementation, we generated the following brain segmentation image, which can be compared with the actual tumor location shown below:
Figure 8 An image slice generated using our simple segmentation algorithm (above) can be compared favorably to the original scan (bottom right) and the marked location of the actual tumor (bottom left).
The results of our algorithm visually compare very favorably with the truth image. These results can be quantified in the following confusion matrix: Predicted class
Tumor Normal Actual class
Tumor 1747 0 Normal 556 10736
We achieved segmentation accuracy of 95.74% in classifying the voxels in this image. This was far better than we hoped, especially since we trained our algorithm on one slice each of only 10 subject MRI data sets.

Recalling the proceedings from the last three BraTS challenges, the algorithm that we have presented is representative of a recurring technique: representing each input voxel with a complex feature vector including local voxel information and implementing a Random Forest Classifier for segmentation. There’s significant variance in preprocessing: at times a Gaussian Mixture Model is used to facilitate multiclass segmentation, and feature selection is often context specific. That being said, all these further optimizations contribute to a longer runtime.
III. Conclusion Overall, our initial results confirm that MRI image analysis has great potential for clinical diagnosis of brain cancer and other phenotypes. By utilizing existing image segmentation software to collect volumetric and intensity data, one can create a feature set on which simple classifiers perform with consistent, if not yet high, accuracy without any contextual information about the patient or phenotype classified.
Incorporating such contextual information in clinical practice will likely improve phenotype classification algorithms greatly. One particular—and very intentional—difficulty of the Machine Learning Challenge is that neither the information concerning the phenotype nor additional patient data are provided. By incorporating commonly collected patient data such as age and weight into the feature set and employing knowledge about the medical definition of the phenotype, more sophisticated feature sets and algorithms can be developed for tumor diagnosis and classification.
Novel tumor segmentation algorithms that utilize Random Forests and similar voxel analysis techniques have great potential for eventual adoption into MRI installations. These algorithms can quickly identify regions of concern on a scan and mark them for usage in diagnosis. Due to computational constraints, we could only train on a small example set of 2d slices (though our feature vector utilizes a 3d space) from our subject MRIs.
Given the cluster computing access that is available to many members of the scientific and medical imaging communities, possibilities for implementing a more accurate 3D segmentation algorithm are very promising.
References [1] E. Konukoglu. “MICCAI 2014 Machine Learning
Challenge” MGH/HST Martinos Center for Biomedical Imaging. Proc. of MICCAI 2014 Machine Learning Challenge | MGH/HST Martinos Center for Biomedical Imaging, Boston. N.p., n.d. [Online]. 05 Nov. 2014. Available: https://www.nmr.mgh.harvard.edu/lab/laboratory-computational-imaging-biomarkers/miccai-2014-machine-learning-challenge
[2] B. Menze, A. Jakab, S. Bauer, J. Kalpathy-Cramer, K. Farahani, et al. “The Multimodal Brain Tumor Image Segmentation Benchmark (BRATS)” in IEEE Transactions on Medical Imaging, Institute of Electrical and Electronics Engineers (IEEE), 2014, pp.33
[3] D. Zikic, B. Glocker, E. Konukoglu, J. Shotton, A. Criminisi, D. H. Ye, C. Demiralp, O. M. Thomas, T. Das, R. Jena, S. J. “Price Context-sensitive Classification Forests for Segmentation of Brain Tumor Tissues.” Proc MICCAI-BRATS 2012 [Online]. Available: http://research.microsoft.com/apps/pubs/default.aspx?id=172241
[4] D. Zikic et al. "Decision forests for tissue-specific segmentation of high-grade gliomas in multi-channel MR” in Medical Image Computing and Computer-Assisted Intervention–MICCAI 2012. Springer Berlin Heidelberg, Berlin, 2012, pp. 369-376.
[5] J. Festa et al. “Automatic Brain Tumor Segmentation of Multi-sequence MR images using Random Decision Forests” in Proc MICCAI-BRATS 2013 [online]. Available: http://martinos.org/qtim/miccai2013/proc_brats_2013.pdf
Acknowledgements
Thanks to MICCAI for providing two collections of MRI data. Permissions information for the scans that we used is available at the websites of the MICCAI MLC and BraTS challenges, listed above.
Special thanks to Michael Kistler for granting us access to the MICCAI-BraTS Competition data.