Embed Size (px)
Citation preview
Bone xxx (2011) xxx–xxx
BON-09483; No. of pages: 11; 4C:
Contents lists available at SciVerse ScienceDirect
Bone
j ourna l homepage: www.e lsev ie r .com/ locate /bone
Original Full Length Article
Diagnosis of osteoarthritis: Imaging
Hillary J. Braun a,c, Garry E. Gold a,b,c,⁎a Department of Radiology, Stanford University, USAb Department of Bioengineering, Stanford University, USAc Department of Orthopaedic Surgery, Stanford University, USA
⁎ Corresponding author at: Department of RadioloWelch Road P271, Stanford, CA 94305, USA. Fax: +1 65
E-mail address: [email protected] (G.E. Gold).
8756-3282/$ – see front matter © 2011 Elsevier Inc. Alldoi:10.1016/j.bone.2011.11.019
Please cite this article as: Braun HJ, Gold GE
a b s t r a c t
a r t i c l e i n f oArticle history:Received 5 October 2011Accepted 23 November 2011Available online xxxx
Keywords:OsteoarthritisImagingDiagnosisKneeCartilage
Osteoarthritis (OA) is a chronic, debilitating joint disease characterized by degenerative changes to the bones,cartilage, menisci, ligaments, and synovial tissue. Imaging modalities such as radiography, magnetic reso-nance imaging (MRI), optical coherence tomography (OCT), and ultrasound (US) permit visualization ofthese structures and can evaluate disease onset and progression. Radiography is primarily useful for the as-sessment of bony structures, while OCT is used for evaluation of articular cartilage and US for ligamentsand the synovium. MRI permits visualization of all intraarticular structures and pathologies, though US orOCT may be preferential in some circumstances. As OA is a disease of the whole joint, a combination of im-aging techniques may be necessary in order to gain the most comprehensive picture of the disease state.This article is part of a Special Issue entitled Osteoarthritis.
© 2011 Elsevier Inc. All rights reserved.
OA diagnosis: imaging
Characterized by degenerative changes in the bones, cartilage, me-nisci, ligaments, and synovial tissue, osteoarthritis (OA) has evolvedto be considered a disease of the whole joint. Using imaging, OA hastraditionally been diagnosed with radiographs that demonstratejoint space width (JSW) and osteophytes. Recently, additional modal-ities such as magnetic resonance imaging (MRI), ultrasound (US), andoptical coherence tomography (OCT), have enhanced OA diagnosisand management through improvements in soft tissue depiction.
Early identification of OA is crucial to improving clinical decision-making and advancing the understanding of disease progression andtreatment options. This article will review the various modalitiesavailable for OA imaging and assessment, focusing on their utility astissue-specific diagnostic tools for OA of the knee.
Modality overview
Radiography
Despite the development of newer imaging techniques, the radio-graph remains the most accessible tool in the evaluation of the OAjoint. The knee joint is typically evaluated using the extended-kneeradiograph, which is a bilateral anteroposterior image acquiredwhile the patient is weight-bearing, with both knees in full extension.
gy, Stanford University, 12010 725 7296.
rights reserved.
, Diagnosis of osteoarthritis:
More recently, flexed-knee radiographs with varying degrees of flex-ion and X-ray beam angles have been employed to improve intra-articular visualization. Radiographs are used to evaluate osteophyteformation and joint space narrowing (JSN); grading schemes suchas the Kellgren-Lawrence grading scheme [1] and the OsteoarthritisResearch Society International classification score establish guidelinesfor the diagnosis of OA progression [2].
MRI
MRI manipulates image contrast to highlight different tissuetypes. Common contrast methods include 2D or multi-slice T1-weighted, proton density (PD), and T2-weighted imaging [3]. Spinecho (SE) and Fast-spin echo (FSE) imaging techniques are useful inevaluating focal cartilage defects. Recent improvements in hardware,software, gradients, and radiofrequency (RF) coils have led to the useof fast or turbo-spin echo imaging, fat saturation and water excitation[3] to improve tissue contrast. Several semiquantitative, morphologicMRI scoring systems have been developed for evaluation of the kneejoint in OA. Modified forms of the Outerbridge scale are routinelyused for assessment of cartilage lesions, specifically with regard to de-fect depth. Whole-organ assessment, however, has proven increas-ingly useful, as it allows thorough evaluation of articular features.Furthermore, whole organ assessment has shown reliability, specific-ity, and sensitivity, and an ability to identify lesion progression [4–7].The Whole-Organ Magnetic Resonance Imaging Score [7], the KneeOsteoarthritis Scoring System [6], and the Boston Leeds OsteoarthritisKnee Score [5] are the three published systems available for evaluationof the whole knee joint.
Imaging, Bone (2011), doi:10.1016/j.bone.2011.11.019
2 H.J. Braun, G.E. Gold / Bone xxx (2011) xxx–xxx
OCT
Optical coherence tomography (OCT) captures cross-sectionalechographs of infrared light and acquires near-real time images of ar-ticular cartilage [8]. This method requires placement of the endoscopeimmediately on the cartilage, so is done at the time of arthroscopy.OCT is incorporated into arthroscopes and generates cross-sectionalimages of articular cartilage at resolutions comparable to low-powerhistology [9–11]. Consequently, OCT can provide quantitative infor-mation about the disease state of articular cartilage [12]. OCT hasbeen shown to be sensitive to collagen structural changes resultingfrom acute trauma and degeneration [9,13,14] and OA-associatedchanges in cartilage birefringence [13].
US
Current US technology offersmany advantages, includingmultiplanarimage acquisition, the ability to image dynamic structures in real-time,lack of ionizing radiation [15], and utility in interventional procedures[16,17]. Furthermore, US is cost-effective and can be used without con-trast enhancement (CE) to visualize various tissues involved in OA [18].
Tissue-specific imaging
Subchondral bone
RadiographyBony changes in OA have traditionally been assessed using radio-
graphs. In the early stages of disease onset, developments such as osteo-phytes, subchondral sclerosis, or subchondral cysts are well visualizedwith this modality. As OA progresses, radiography is used to assessJSW,which provides an indirectmeasure of the integrity of both hyalineand fibrocartilage. OA severity is often classified by subsequent JSN andthe simultaneous appearance of subchondral bone abnormalities suchas cysts or sclerosis [1,19,20].
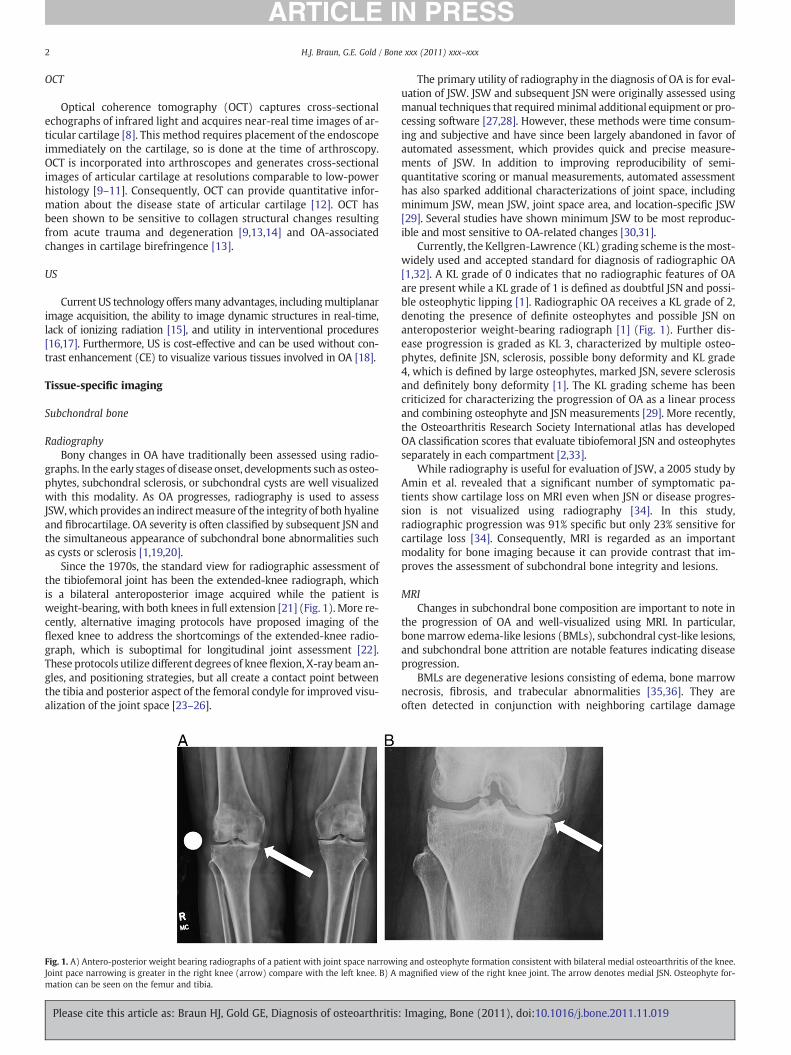
Since the 1970s, the standard view for radiographic assessment ofthe tibiofemoral joint has been the extended-knee radiograph, whichis a bilateral anteroposterior image acquired while the patient isweight-bearing, with both knees in full extension [21] (Fig. 1). More re-cently, alternative imaging protocols have proposed imaging of theflexed knee to address the shortcomings of the extended-knee radio-graph, which is suboptimal for longitudinal joint assessment [22].These protocols utilize different degrees of knee flexion, X-ray beam an-gles, and positioning strategies, but all create a contact point betweenthe tibia and posterior aspect of the femoral condyle for improved visu-alization of the joint space [23–26].
Fig. 1. A) Antero-posterior weight bearing radiographs of a patient with joint space narrowiJoint pace narrowing is greater in the right knee (arrow) compare with the left knee. B) Amation can be seen on the femur and tibia.
Please cite this article as: Braun HJ, Gold GE, Diagnosis of osteoarthritis
The primary utility of radiography in the diagnosis of OA is for eval-uation of JSW. JSW and subsequent JSN were originally assessed usingmanual techniques that requiredminimal additional equipment or pro-cessing software [27,28]. However, these methods were time consum-ing and subjective and have since been largely abandoned in favor ofautomated assessment, which provides quick and precise measure-ments of JSW. In addition to improving reproducibility of semi-quantitative scoring or manual measurements, automated assessmenthas also sparked additional characterizations of joint space, includingminimum JSW, mean JSW, joint space area, and location-specific JSW[29]. Several studies have shown minimum JSW to be most reproduc-ible and most sensitive to OA-related changes [30,31].
Currently, the Kellgren-Lawrence (KL) grading scheme is themost-widely used and accepted standard for diagnosis of radiographic OA[1,32]. A KL grade of 0 indicates that no radiographic features of OAare present while a KL grade of 1 is defined as doubtful JSN and possi-ble osteophytic lipping [1]. Radiographic OA receives a KL grade of 2,denoting the presence of definite osteophytes and possible JSN onanteroposterior weight-bearing radiograph [1] (Fig. 1). Further dis-ease progression is graded as KL 3, characterized by multiple osteo-phytes, definite JSN, sclerosis, possible bony deformity and KL grade4, which is defined by large osteophytes, marked JSN, severe sclerosisand definitely bony deformity [1]. The KL grading scheme has beencriticized for characterizing the progression of OA as a linear processand combining osteophyte and JSN measurements [29]. More recently,the Osteoarthritis Research Society International atlas has developedOA classification scores that evaluate tibiofemoral JSN and osteophytesseparately in each compartment [2,33].
While radiography is useful for evaluation of JSW, a 2005 study byAmin et al. revealed that a significant number of symptomatic pa-tients show cartilage loss on MRI even when JSN or disease progres-sion is not visualized using radiography [34]. In this study,radiographic progression was 91% specific but only 23% sensitive forcartilage loss [34]. Consequently, MRI is regarded as an importantmodality for bone imaging because it can provide contrast that im-proves the assessment of subchondral bone integrity and lesions.
MRIChanges in subchondral bone composition are important to note in
the progression of OA and well-visualized using MRI. In particular,bonemarrow edema-like lesions (BMLs), subchondral cyst-like lesions,and subchondral bone attrition are notable features indicating diseaseprogression.
BMLs are degenerative lesions consisting of edema, bone marrownecrosis, fibrosis, and trabecular abnormalities [35,36]. They areoften detected in conjunction with neighboring cartilage damage
ng and osteophyte formation consistent with bilateral medial osteoarthritis of the knee.magnified view of the right knee joint. The arrow denotes medial JSN. Osteophyte for-
: Imaging, Bone (2011), doi:10.1016/j.bone.2011.11.019
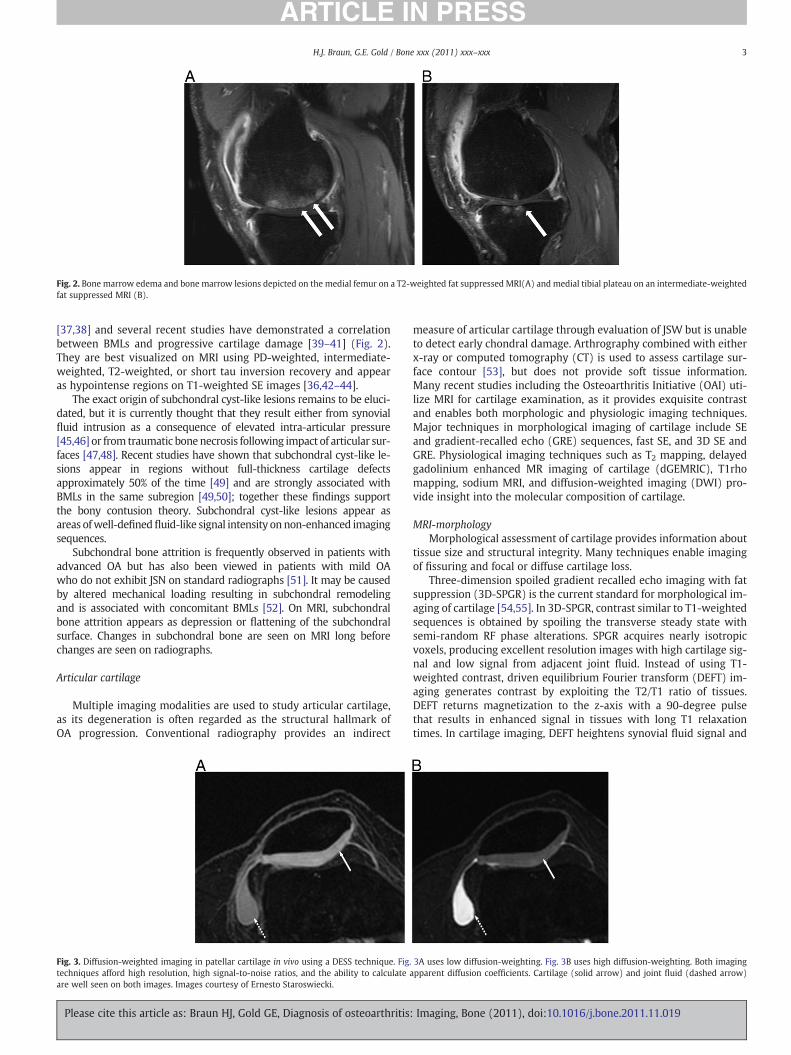
Fig. 2. Bone marrow edema and bone marrow lesions depicted on the medial femur on a T2-weighted fat suppressed MRI(A) and medial tibial plateau on an intermediate-weightedfat suppressed MRI (B).
3H.J. Braun, G.E. Gold / Bone xxx (2011) xxx–xxx
[37,38] and several recent studies have demonstrated a correlationbetween BMLs and progressive cartilage damage [39–41] (Fig. 2).They are best visualized on MRI using PD-weighted, intermediate-weighted, T2-weighted, or short tau inversion recovery and appearas hypointense regions on T1-weighted SE images [36,42–44].
The exact origin of subchondral cyst-like lesions remains to be eluci-dated, but it is currently thought that they result either from synovialfluid intrusion as a consequence of elevated intra-articular pressure[45,46] or from traumatic bonenecrosis following impact of articular sur-faces [47,48]. Recent studies have shown that subchondral cyst-like le-sions appear in regions without full-thickness cartilage defectsapproximately 50% of the time [49] and are strongly associated withBMLs in the same subregion [49,50]; together these findings supportthe bony contusion theory. Subchondral cyst-like lesions appear asareas ofwell-definedfluid-like signal intensity onnon-enhanced imagingsequences.
Subchondral bone attrition is frequently observed in patients withadvanced OA but has also been viewed in patients with mild OAwho do not exhibit JSN on standard radiographs [51]. It may be causedby altered mechanical loading resulting in subchondral remodelingand is associated with concomitant BMLs [52]. On MRI, subchondralbone attrition appears as depression or flattening of the subchondralsurface. Changes in subchondral bone are seen on MRI long beforechanges are seen on radiographs.
Articular cartilage
Multiple imaging modalities are used to study articular cartilage,as its degeneration is often regarded as the structural hallmark ofOA progression. Conventional radiography provides an indirect
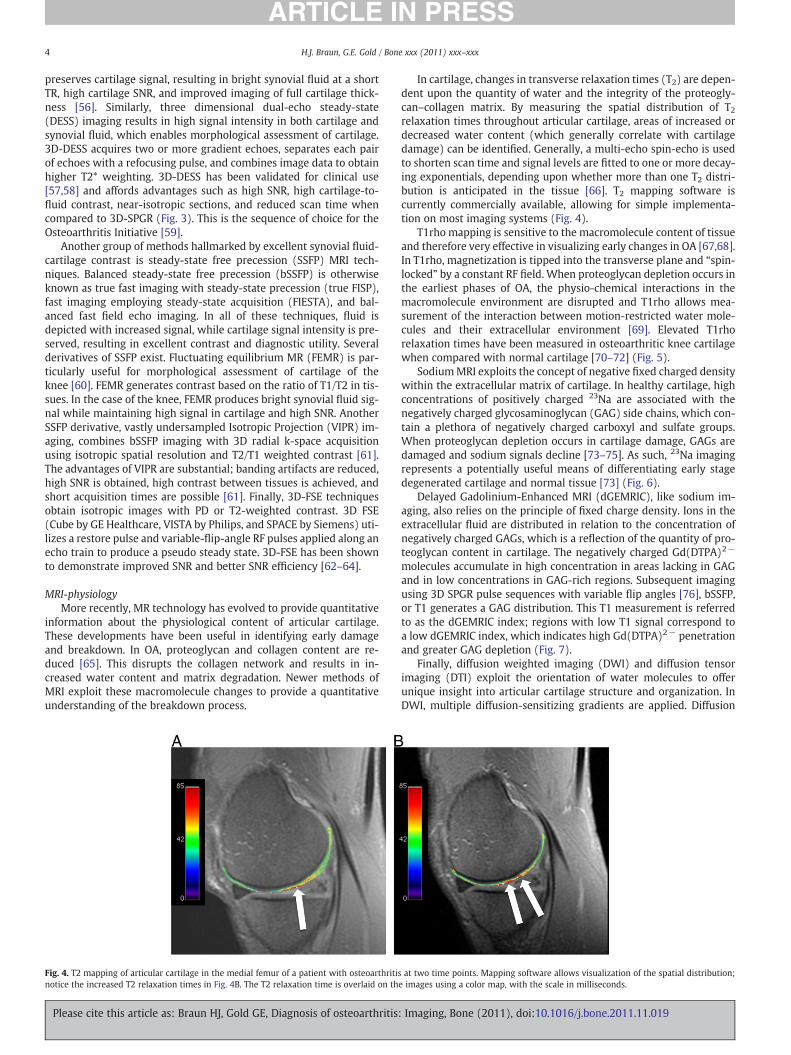
Fig. 3. Diffusion-weighted imaging in patellar cartilage in vivo using a DESS technique. Fig.techniques afford high resolution, high signal-to-noise ratios, and the ability to calculate aare well seen on both images. Images courtesy of Ernesto Staroswiecki.
Please cite this article as: Braun HJ, Gold GE, Diagnosis of osteoarthritis:
measure of articular cartilage through evaluation of JSW but is unableto detect early chondral damage. Arthrography combined with eitherx-ray or computed tomography (CT) is used to assess cartilage sur-face contour [53], but does not provide soft tissue information.Many recent studies including the Osteoarthritis Initiative (OAI) uti-lize MRI for cartilage examination, as it provides exquisite contrastand enables both morphologic and physiologic imaging techniques.Major techniques in morphological imaging of cartilage include SEand gradient-recalled echo (GRE) sequences, fast SE, and 3D SE andGRE. Physiological imaging techniques such as T2 mapping, delayedgadolinium enhanced MR imaging of cartilage (dGEMRIC), T1rhomapping, sodium MRI, and diffusion-weighted imaging (DWI) pro-vide insight into the molecular composition of cartilage.
MRI-morphologyMorphological assessment of cartilage provides information about
tissue size and structural integrity. Many techniques enable imagingof fissuring and focal or diffuse cartilage loss.
Three-dimension spoiled gradient recalled echo imaging with fatsuppression (3D-SPGR) is the current standard for morphological im-aging of cartilage [54,55]. In 3D-SPGR, contrast similar to T1-weightedsequences is obtained by spoiling the transverse steady state withsemi-random RF phase alterations. SPGR acquires nearly isotropicvoxels, producing excellent resolution images with high cartilage sig-nal and low signal from adjacent joint fluid. Instead of using T1-weighted contrast, driven equilibrium Fourier transform (DEFT) im-aging generates contrast by exploiting the T2/T1 ratio of tissues.DEFT returns magnetization to the z-axis with a 90-degree pulsethat results in enhanced signal in tissues with long T1 relaxationtimes. In cartilage imaging, DEFT heightens synovial fluid signal and
3A uses low diffusion-weighting. Fig. 3B uses high diffusion-weighting. Both imagingpparent diffusion coefficients. Cartilage (solid arrow) and joint fluid (dashed arrow)
Imaging, Bone (2011), doi:10.1016/j.bone.2011.11.019
4 H.J. Braun, G.E. Gold / Bone xxx (2011) xxx–xxx
preserves cartilage signal, resulting in bright synovial fluid at a shortTR, high cartilage SNR, and improved imaging of full cartilage thick-ness [56]. Similarly, three dimensional dual-echo steady-state(DESS) imaging results in high signal intensity in both cartilage andsynovial fluid, which enables morphological assessment of cartilage.3D-DESS acquires two or more gradient echoes, separates each pairof echoes with a refocusing pulse, and combines image data to obtainhigher T2* weighting. 3D-DESS has been validated for clinical use[57,58] and affords advantages such as high SNR, high cartilage-to-fluid contrast, near-isotropic sections, and reduced scan time whencompared to 3D-SPGR (Fig. 3). This is the sequence of choice for theOsteoarthritis Initiative [59].
Another group of methods hallmarked by excellent synovial fluid-cartilage contrast is steady-state free precession (SSFP) MRI tech-niques. Balanced steady-state free precession (bSSFP) is otherwiseknown as true fast imaging with steady-state precession (true FISP),fast imaging employing steady-state acquisition (FIESTA), and bal-anced fast field echo imaging. In all of these techniques, fluid isdepicted with increased signal, while cartilage signal intensity is pre-served, resulting in excellent contrast and diagnostic utility. Severalderivatives of SSFP exist. Fluctuating equilibrium MR (FEMR) is par-ticularly useful for morphological assessment of cartilage of theknee [60]. FEMR generates contrast based on the ratio of T1/T2 in tis-sues. In the case of the knee, FEMR produces bright synovial fluid sig-nal while maintaining high signal in cartilage and high SNR. AnotherSSFP derivative, vastly undersampled Isotropic Projection (VIPR) im-aging, combines bSSFP imaging with 3D radial k-space acquisitionusing isotropic spatial resolution and T2/T1 weighted contrast [61].The advantages of VIPR are substantial; banding artifacts are reduced,high SNR is obtained, high contrast between tissues is achieved, andshort acquisition times are possible [61]. Finally, 3D-FSE techniquesobtain isotropic images with PD or T2-weighted contrast. 3D FSE(Cube by GE Healthcare, VISTA by Philips, and SPACE by Siemens) uti-lizes a restore pulse and variable-flip-angle RF pulses applied along anecho train to produce a pseudo steady state. 3D-FSE has been shownto demonstrate improved SNR and better SNR efficiency [62–64].
MRI-physiologyMore recently, MR technology has evolved to provide quantitative
information about the physiological content of articular cartilage.These developments have been useful in identifying early damageand breakdown. In OA, proteoglycan and collagen content are re-duced [65]. This disrupts the collagen network and results in in-creased water content and matrix degradation. Newer methods ofMRI exploit these macromolecule changes to provide a quantitativeunderstanding of the breakdown process.
Fig. 4. T2 mapping of articular cartilage in the medial femur of a patient with osteoarthritisnotice the increased T2 relaxation times in Fig. 4B. The T2 relaxation time is overlaid on th
Please cite this article as: Braun HJ, Gold GE, Diagnosis of osteoarthritis
In cartilage, changes in transverse relaxation times (T2) are depen-dent upon the quantity of water and the integrity of the proteogly-can–collagen matrix. By measuring the spatial distribution of T2relaxation times throughout articular cartilage, areas of increased ordecreased water content (which generally correlate with cartilagedamage) can be identified. Generally, a multi-echo spin-echo is usedto shorten scan time and signal levels are fitted to one or more decay-ing exponentials, depending upon whether more than one T2 distri-bution is anticipated in the tissue [66]. T2 mapping software iscurrently commercially available, allowing for simple implementa-tion on most imaging systems (Fig. 4).
T1rho mapping is sensitive to the macromolecule content of tissueand therefore very effective in visualizing early changes in OA [67,68].In T1rho, magnetization is tipped into the transverse plane and “spin-locked” by a constant RF field. When proteoglycan depletion occurs inthe earliest phases of OA, the physio-chemical interactions in themacromolecule environment are disrupted and T1rho allows mea-surement of the interaction between motion-restricted water mole-cules and their extracellular environment [69]. Elevated T1rhorelaxation times have been measured in osteoarthritic knee cartilagewhen compared with normal cartilage [70–72] (Fig. 5).
SodiumMRI exploits the concept of negative fixed charged densitywithin the extracellular matrix of cartilage. In healthy cartilage, highconcentrations of positively charged 23Na are associated with thenegatively charged glycosaminoglycan (GAG) side chains, which con-tain a plethora of negatively charged carboxyl and sulfate groups.When proteoglycan depletion occurs in cartilage damage, GAGs aredamaged and sodium signals decline [73–75]. As such, 23Na imagingrepresents a potentially useful means of differentiating early stagedegenerated cartilage and normal tissue [73] (Fig. 6).
Delayed Gadolinium-Enhanced MRI (dGEMRIC), like sodium im-aging, also relies on the principle of fixed charge density. Ions in theextracellular fluid are distributed in relation to the concentration ofnegatively charged GAGs, which is a reflection of the quantity of pro-teoglycan content in cartilage. The negatively charged Gd(DTPA)2−
molecules accumulate in high concentration in areas lacking in GAGand in low concentrations in GAG-rich regions. Subsequent imagingusing 3D SPGR pulse sequences with variable flip angles [76], bSSFP,or T1 generates a GAG distribution. This T1 measurement is referredto as the dGEMRIC index; regions with low T1 signal correspond toa low dGEMRIC index, which indicates high Gd(DTPA)2− penetrationand greater GAG depletion (Fig. 7).
Finally, diffusion weighted imaging (DWI) and diffusion tensorimaging (DTI) exploit the orientation of water molecules to offerunique insight into articular cartilage structure and organization. InDWI, multiple diffusion-sensitizing gradients are applied. Diffusion
at two time points. Mapping software allows visualization of the spatial distribution;e images using a color map, with the scale in milliseconds.
: Imaging, Bone (2011), doi:10.1016/j.bone.2011.11.019
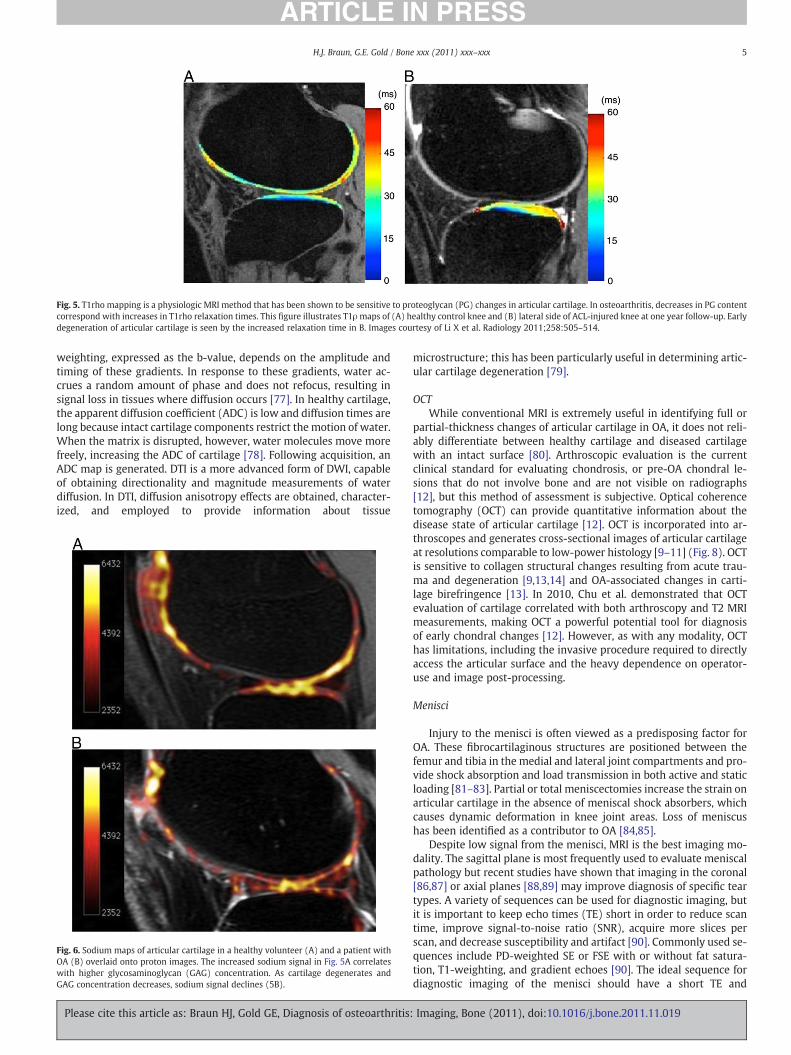
Fig. 5. T1rho mapping is a physiologic MRI method that has been shown to be sensitive to proteoglycan (PG) changes in articular cartilage. In osteoarthritis, decreases in PG contentcorrespond with increases in T1rho relaxation times. This figure illustrates T1ρmaps of (A) healthy control knee and (B) lateral side of ACL-injured knee at one year follow-up. Earlydegeneration of articular cartilage is seen by the increased relaxation time in B. Images courtesy of Li X et al. Radiology 2011;258:505–514.
5H.J. Braun, G.E. Gold / Bone xxx (2011) xxx–xxx
weighting, expressed as the b-value, depends on the amplitude andtiming of these gradients. In response to these gradients, water ac-crues a random amount of phase and does not refocus, resulting insignal loss in tissues where diffusion occurs [77]. In healthy cartilage,the apparent diffusion coefficient (ADC) is low and diffusion times arelong because intact cartilage components restrict the motion of water.When the matrix is disrupted, however, water molecules move morefreely, increasing the ADC of cartilage [78]. Following acquisition, anADC map is generated. DTI is a more advanced form of DWI, capableof obtaining directionality and magnitude measurements of waterdiffusion. In DTI, diffusion anisotropy effects are obtained, character-ized, and employed to provide information about tissue
Fig. 6. Sodium maps of articular cartilage in a healthy volunteer (A) and a patient withOA (B) overlaid onto proton images. The increased sodium signal in Fig. 5A correlateswith higher glycosaminoglycan (GAG) concentration. As cartilage degenerates andGAG concentration decreases, sodium signal declines (5B).
Please cite this article as: Braun HJ, Gold GE, Diagnosis of osteoarthritis:
microstructure; this has been particularly useful in determining artic-ular cartilage degeneration [79].
OCTWhile conventional MRI is extremely useful in identifying full or
partial-thickness changes of articular cartilage in OA, it does not reli-ably differentiate between healthy cartilage and diseased cartilagewith an intact surface [80]. Arthroscopic evaluation is the currentclinical standard for evaluating chondrosis, or pre-OA chondral le-sions that do not involve bone and are not visible on radiographs[12], but this method of assessment is subjective. Optical coherencetomography (OCT) can provide quantitative information about thedisease state of articular cartilage [12]. OCT is incorporated into ar-throscopes and generates cross-sectional images of articular cartilageat resolutions comparable to low-power histology [9–11] (Fig. 8). OCTis sensitive to collagen structural changes resulting from acute trau-ma and degeneration [9,13,14] and OA-associated changes in carti-lage birefringence [13]. In 2010, Chu et al. demonstrated that OCTevaluation of cartilage correlated with both arthroscopy and T2 MRImeasurements, making OCT a powerful potential tool for diagnosisof early chondral changes [12]. However, as with any modality, OCThas limitations, including the invasive procedure required to directlyaccess the articular surface and the heavy dependence on operator-use and image post-processing.
Menisci
Injury to the menisci is often viewed as a predisposing factor forOA. These fibrocartilaginous structures are positioned between thefemur and tibia in the medial and lateral joint compartments and pro-vide shock absorption and load transmission in both active and staticloading [81–83]. Partial or total meniscectomies increase the strain onarticular cartilage in the absence of meniscal shock absorbers, whichcauses dynamic deformation in knee joint areas. Loss of meniscushas been identified as a contributor to OA [84,85].
Despite low signal from the menisci, MRI is the best imaging mo-dality. The sagittal plane is most frequently used to evaluate meniscalpathology but recent studies have shown that imaging in the coronal[86,87] or axial planes [88,89] may improve diagnosis of specific teartypes. A variety of sequences can be used for diagnostic imaging, butit is important to keep echo times (TE) short in order to reduce scantime, improve signal-to-noise ratio (SNR), acquire more slices perscan, and decrease susceptibility and artifact [90]. Commonly used se-quences include PD-weighted SE or FSE with or without fat satura-tion, T1-weighting, and gradient echoes [90]. The ideal sequence fordiagnostic imaging of the menisci should have a short TE and
Imaging, Bone (2011), doi:10.1016/j.bone.2011.11.019
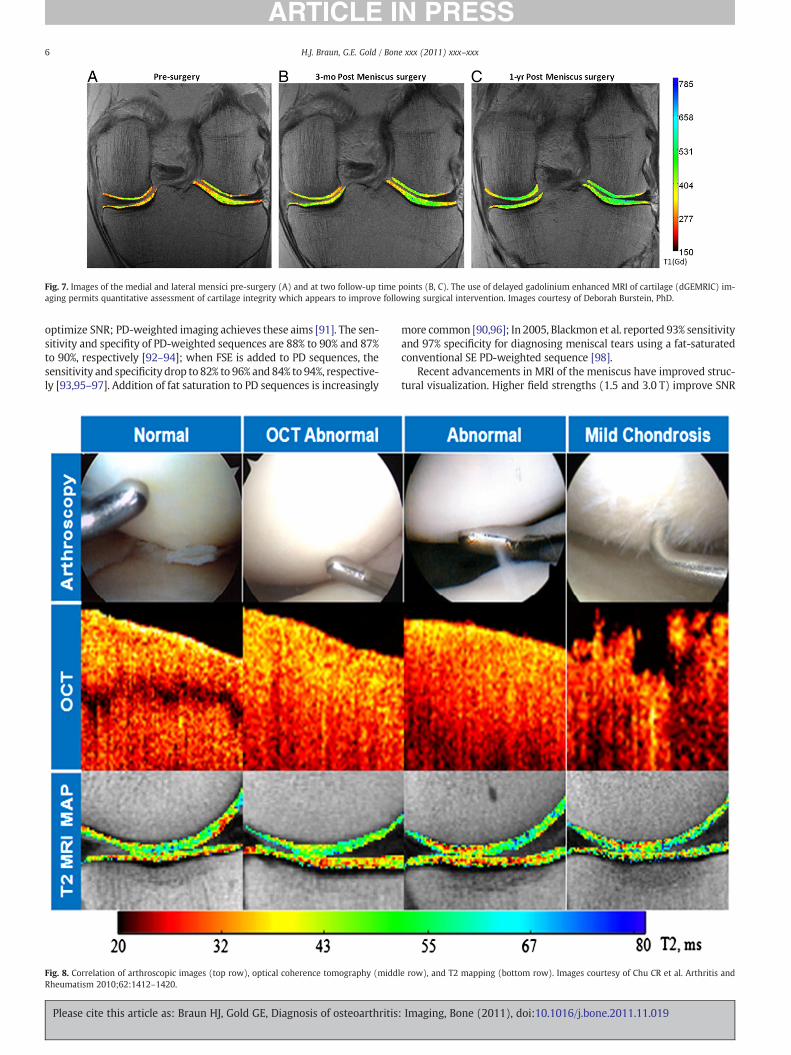
Fig. 7. Images of the medial and lateral mensici pre-surgery (A) and at two follow-up time points (B, C). The use of delayed gadolinium enhanced MRI of cartilage (dGEMRIC) im-aging permits quantitative assessment of cartilage integrity which appears to improve following surgical intervention. Images courtesy of Deborah Burstein, PhD.
6 H.J. Braun, G.E. Gold / Bone xxx (2011) xxx–xxx
optimize SNR; PD-weighted imaging achieves these aims [91]. The sen-sitivity and specifity of PD-weighted sequences are 88% to 90% and 87%to 90%, respectively [92–94]; when FSE is added to PD sequences, thesensitivity and specificity drop to 82% to 96% and 84% to 94%, respective-ly [93,95–97]. Addition of fat saturation to PD sequences is increasingly
Fig. 8. Correlation of arthroscopic images (top row), optical coherence tomography (middRheumatism 2010;62:1412–1420.
Please cite this article as: Braun HJ, Gold GE, Diagnosis of osteoarthritis
more common [90,96]; In 2005, Blackmon et al. reported 93% sensitivityand 97% specificity for diagnosing meniscal tears using a fat-saturatedconventional SE PD-weighted sequence [98].
Recent advancements in MRI of the meniscus have improved struc-tural visualization. Higher field strengths (1.5 and 3.0 T) improve SNR
le row), and T2 mapping (bottom row). Images courtesy of Chu CR et al. Arthritis and
: Imaging, Bone (2011), doi:10.1016/j.bone.2011.11.019
7H.J. Braun, G.E. Gold / Bone xxx (2011) xxx–xxx
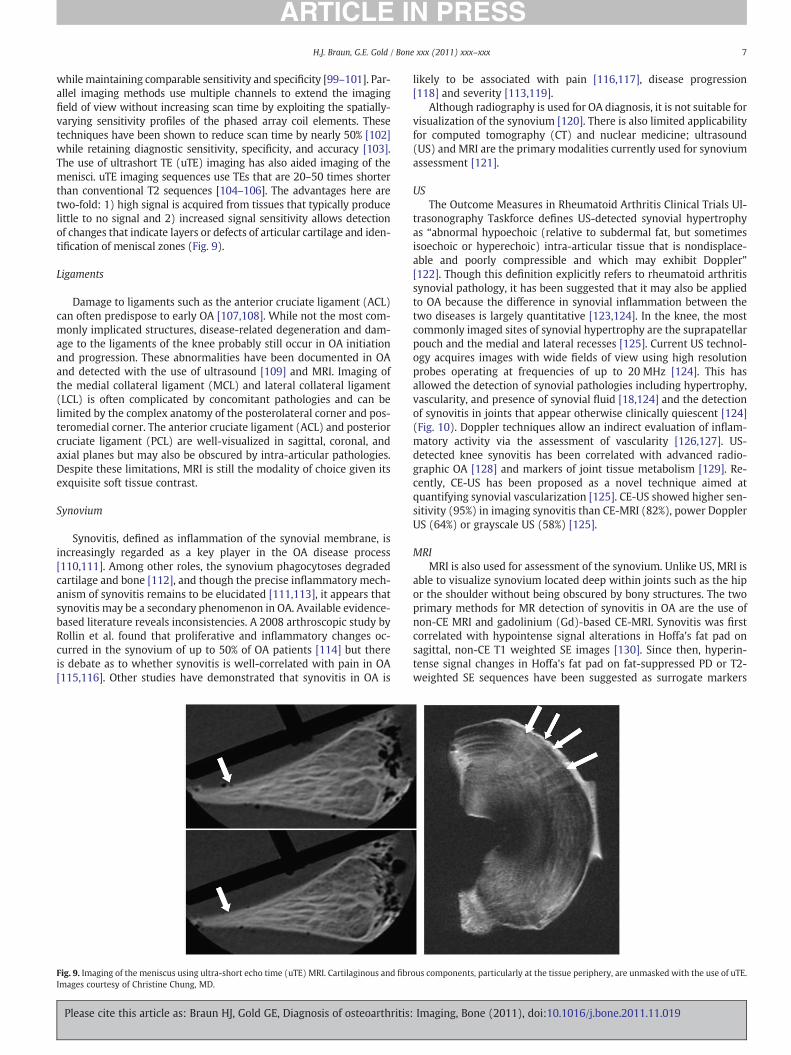
while maintaining comparable sensitivity and specificity [99–101]. Par-allel imaging methods use multiple channels to extend the imagingfield of view without increasing scan time by exploiting the spatially-varying sensitivity profiles of the phased array coil elements. Thesetechniques have been shown to reduce scan time by nearly 50% [102]while retaining diagnostic sensitivity, specificity, and accuracy [103].The use of ultrashort TE (uTE) imaging has also aided imaging of themenisci. uTE imaging sequences use TEs that are 20–50 times shorterthan conventional T2 sequences [104–106]. The advantages here aretwo-fold: 1) high signal is acquired from tissues that typically producelittle to no signal and 2) increased signal sensitivity allows detectionof changes that indicate layers or defects of articular cartilage and iden-tification of meniscal zones (Fig. 9).
Ligaments
Damage to ligaments such as the anterior cruciate ligament (ACL)can often predispose to early OA [107,108]. While not the most com-monly implicated structures, disease-related degeneration and dam-age to the ligaments of the knee probably still occur in OA initiationand progression. These abnormalities have been documented in OAand detected with the use of ultrasound [109] and MRI. Imaging ofthe medial collateral ligament (MCL) and lateral collateral ligament(LCL) is often complicated by concomitant pathologies and can belimited by the complex anatomy of the posterolateral corner and pos-teromedial corner. The anterior cruciate ligament (ACL) and posteriorcruciate ligament (PCL) are well-visualized in sagittal, coronal, andaxial planes but may also be obscured by intra-articular pathologies.Despite these limitations, MRI is still the modality of choice given itsexquisite soft tissue contrast.
Synovium
Synovitis, defined as inflammation of the synovial membrane, isincreasingly regarded as a key player in the OA disease process[110,111]. Among other roles, the synovium phagocytoses degradedcartilage and bone [112], and though the precise inflammatory mech-anism of synovitis remains to be elucidated [111,113], it appears thatsynovitis may be a secondary phenomenon in OA. Available evidence-based literature reveals inconsistencies. A 2008 arthroscopic study byRollin et al. found that proliferative and inflammatory changes oc-curred in the synovium of up to 50% of OA patients [114] but thereis debate as to whether synovitis is well-correlated with pain in OA[115,116]. Other studies have demonstrated that synovitis in OA is
Fig. 9. Imaging of the meniscus using ultra-short echo time (uTE) MRI. Cartilaginous and fibrImages courtesy of Christine Chung, MD.
Please cite this article as: Braun HJ, Gold GE, Diagnosis of osteoarthritis:
likely to be associated with pain [116,117], disease progression[118] and severity [113,119].
Although radiography is used for OA diagnosis, it is not suitable forvisualization of the synovium [120]. There is also limited applicabilityfor computed tomography (CT) and nuclear medicine; ultrasound(US) and MRI are the primary modalities currently used for synoviumassessment [121].
USThe Outcome Measures in Rheumatoid Arthritis Clinical Trials Ul-
trasonography Taskforce defines US-detected synovial hypertrophyas “abnormal hypoechoic (relative to subdermal fat, but sometimesisoechoic or hyperechoic) intra-articular tissue that is nondisplace-able and poorly compressible and which may exhibit Doppler”[122]. Though this definition explicitly refers to rheumatoid arthritissynovial pathology, it has been suggested that it may also be appliedto OA because the difference in synovial inflammation between thetwo diseases is largely quantitative [123,124]. In the knee, the mostcommonly imaged sites of synovial hypertrophy are the suprapatellarpouch and the medial and lateral recesses [125]. Current US technol-ogy acquires images with wide fields of view using high resolutionprobes operating at frequencies of up to 20 MHz [124]. This hasallowed the detection of synovial pathologies including hypertrophy,vascularity, and presence of synovial fluid [18,124] and the detectionof synovitis in joints that appear otherwise clinically quiescent [124](Fig. 10). Doppler techniques allow an indirect evaluation of inflam-matory activity via the assessment of vascularity [126,127]. US-detected knee synovitis has been correlated with advanced radio-graphic OA [128] and markers of joint tissue metabolism [129]. Re-cently, CE-US has been proposed as a novel technique aimed atquantifying synovial vascularization [125]. CE-US showed higher sen-sitivity (95%) in imaging synovitis than CE-MRI (82%), power DopplerUS (64%) or grayscale US (58%) [125].
MRIMRI is also used for assessment of the synovium. Unlike US, MRI is
able to visualize synovium located deep within joints such as the hipor the shoulder without being obscured by bony structures. The twoprimary methods for MR detection of synovitis in OA are the use ofnon-CE MRI and gadolinium (Gd)-based CE-MRI. Synovitis was firstcorrelated with hypointense signal alterations in Hoffa's fat pad onsagittal, non-CE T1 weighted SE images [130]. Since then, hyperin-tense signal changes in Hoffa's fat pad on fat-suppressed PD or T2-weighted SE sequences have been suggested as surrogate markers
ous components, particularly at the tissue periphery, are unmasked with the use of uTE.
Imaging, Bone (2011), doi:10.1016/j.bone.2011.11.019
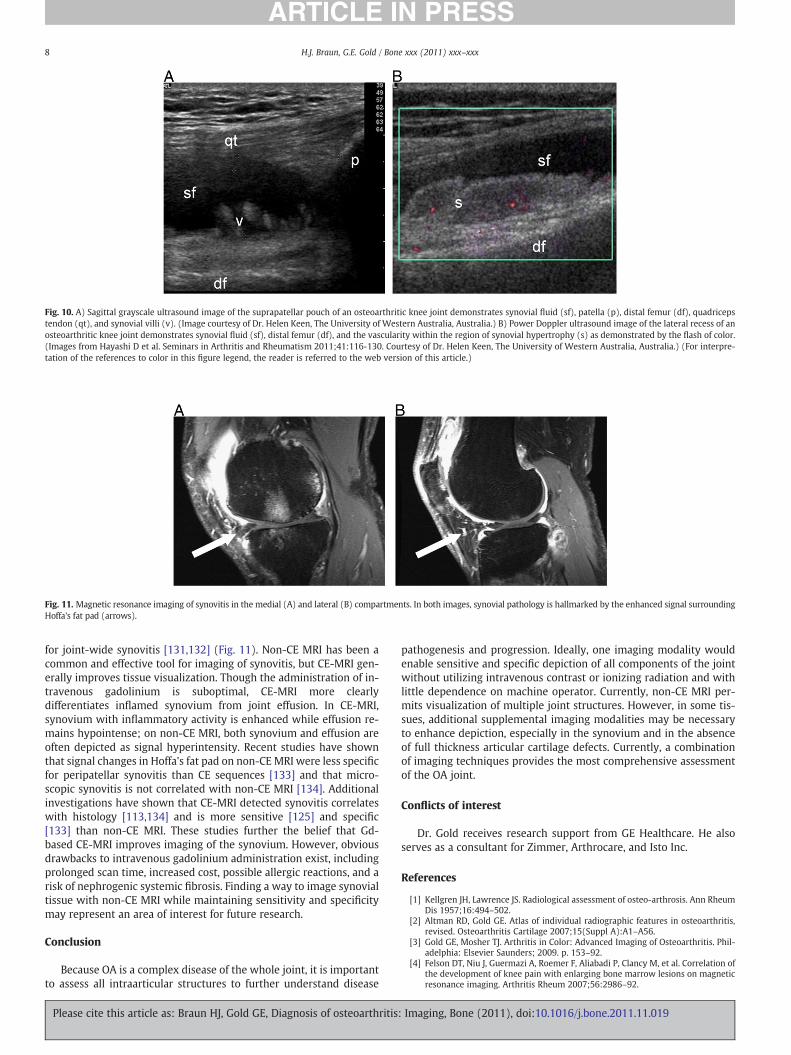
Fig. 10. A) Sagittal grayscale ultrasound image of the suprapatellar pouch of an osteoarthritic knee joint demonstrates synovial fluid (sf), patella (p), distal femur (df), quadricepstendon (qt), and synovial villi (v). (Image courtesy of Dr. Helen Keen, The University of Western Australia, Australia.) B) Power Doppler ultrasound image of the lateral recess of anosteoarthritic knee joint demonstrates synovial fluid (sf), distal femur (df), and the vascularity within the region of synovial hypertrophy (s) as demonstrated by the flash of color.(Images from Hayashi D et al. Seminars in Arthritis and Rheumatism 2011;41:116-130. Courtesy of Dr. Helen Keen, The University of Western Australia, Australia.) (For interpre-tation of the references to color in this figure legend, the reader is referred to the web version of this article.)
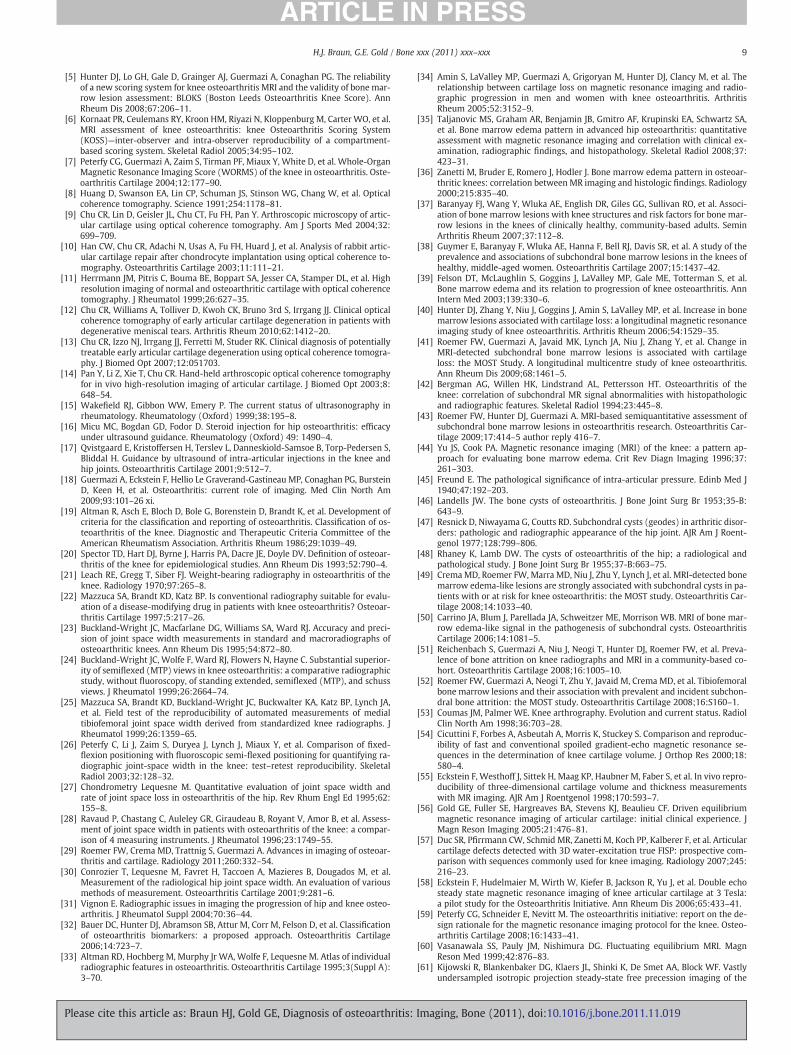
Fig. 11. Magnetic resonance imaging of synovitis in the medial (A) and lateral (B) compartments. In both images, synovial pathology is hallmarked by the enhanced signal surroundingHoffa's fat pad (arrows).
8 H.J. Braun, G.E. Gold / Bone xxx (2011) xxx–xxx
for joint-wide synovitis [131,132] (Fig. 11). Non-CE MRI has been acommon and effective tool for imaging of synovitis, but CE-MRI gen-erally improves tissue visualization. Though the administration of in-travenous gadolinium is suboptimal, CE-MRI more clearlydifferentiates inflamed synovium from joint effusion. In CE-MRI,synovium with inflammatory activity is enhanced while effusion re-mains hypointense; on non-CE MRI, both synovium and effusion areoften depicted as signal hyperintensity. Recent studies have shownthat signal changes in Hoffa's fat pad on non-CE MRI were less specificfor peripatellar synovitis than CE sequences [133] and that micro-scopic synovitis is not correlated with non-CE MRI [134]. Additionalinvestigations have shown that CE-MRI detected synovitis correlateswith histology [113,134] and is more sensitive [125] and specific[133] than non-CE MRI. These studies further the belief that Gd-based CE-MRI improves imaging of the synovium. However, obviousdrawbacks to intravenous gadolinium administration exist, includingprolonged scan time, increased cost, possible allergic reactions, and arisk of nephrogenic systemic fibrosis. Finding a way to image synovialtissue with non-CE MRI while maintaining sensitivity and specificitymay represent an area of interest for future research.
Conclusion
Because OA is a complex disease of the whole joint, it is importantto assess all intraarticular structures to further understand disease
Please cite this article as: Braun HJ, Gold GE, Diagnosis of osteoarthritis
pathogenesis and progression. Ideally, one imaging modality wouldenable sensitive and specific depiction of all components of the jointwithout utilizing intravenous contrast or ionizing radiation and withlittle dependence on machine operator. Currently, non-CE MRI per-mits visualization of multiple joint structures. However, in some tis-sues, additional supplemental imaging modalities may be necessaryto enhance depiction, especially in the synovium and in the absenceof full thickness articular cartilage defects. Currently, a combinationof imaging techniques provides the most comprehensive assessmentof the OA joint.
Conflicts of interest
Dr. Gold receives research support from GE Healthcare. He alsoserves as a consultant for Zimmer, Arthrocare, and Isto Inc.
References
[1] Kellgren JH, Lawrence JS. Radiological assessment of osteo-arthrosis. Ann RheumDis 1957;16:494–502.
[2] Altman RD, Gold GE. Atlas of individual radiographic features in osteoarthritis,revised. Osteoarthritis Cartilage 2007;15(Suppl A):A1–A56.
[3] Gold GE, Mosher TJ. Arthritis in Color: Advanced Imaging of Osteoarthritis. Phil-adelphia: Elsevier Saunders; 2009. p. 153–92.
[4] Felson DT, Niu J, Guermazi A, Roemer F, Aliabadi P, Clancy M, et al. Correlation ofthe development of knee pain with enlarging bone marrow lesions on magneticresonance imaging. Arthritis Rheum 2007;56:2986–92.
: Imaging, Bone (2011), doi:10.1016/j.bone.2011.11.019
9H.J. Braun, G.E. Gold / Bone xxx (2011) xxx–xxx
[5] Hunter DJ, Lo GH, Gale D, Grainger AJ, Guermazi A, Conaghan PG. The reliabilityof a new scoring system for knee osteoarthritis MRI and the validity of bone mar-row lesion assessment: BLOKS (Boston Leeds Osteoarthritis Knee Score). AnnRheum Dis 2008;67:206–11.
[6] Kornaat PR, Ceulemans RY, Kroon HM, Riyazi N, Kloppenburg M, Carter WO, et al.MRI assessment of knee osteoarthritis: knee Osteoarthritis Scoring System(KOSS)—inter-observer and intra-observer reproducibility of a compartment-based scoring system. Skeletal Radiol 2005;34:95–102.
[7] Peterfy CG, Guermazi A, Zaim S, Tirman PF, Miaux Y, White D, et al. Whole-OrganMagnetic Resonance Imaging Score (WORMS) of the knee in osteoarthritis. Oste-oarthritis Cartilage 2004;12:177–90.
[8] Huang D, Swanson EA, Lin CP, Schuman JS, Stinson WG, Chang W, et al. Opticalcoherence tomography. Science 1991;254:1178–81.
[9] Chu CR, Lin D, Geisler JL, Chu CT, Fu FH, Pan Y. Arthroscopic microscopy of artic-ular cartilage using optical coherence tomography. Am J Sports Med 2004;32:699–709.
[10] Han CW, Chu CR, Adachi N, Usas A, Fu FH, Huard J, et al. Analysis of rabbit artic-ular cartilage repair after chondrocyte implantation using optical coherence to-mography. Osteoarthritis Cartilage 2003;11:111–21.
[11] Herrmann JM, Pitris C, Bouma BE, Boppart SA, Jesser CA, Stamper DL, et al. Highresolution imaging of normal and osteoarthritic cartilage with optical coherencetomography. J Rheumatol 1999;26:627–35.
[12] Chu CR, Williams A, Tolliver D, Kwoh CK, Bruno 3rd S, Irrgang JJ. Clinical opticalcoherence tomography of early articular cartilage degeneration in patients withdegenerative meniscal tears. Arthritis Rheum 2010;62:1412–20.
[13] Chu CR, Izzo NJ, Irrgang JJ, Ferretti M, Studer RK. Clinical diagnosis of potentiallytreatable early articular cartilage degeneration using optical coherence tomogra-phy. J Biomed Opt 2007;12:051703.
[14] Pan Y, Li Z, Xie T, Chu CR. Hand-held arthroscopic optical coherence tomographyfor in vivo high-resolution imaging of articular cartilage. J Biomed Opt 2003;8:648–54.
[15] Wakefield RJ, Gibbon WW, Emery P. The current status of ultrasonography inrheumatology. Rheumatology (Oxford) 1999;38:195–8.
[16] Micu MC, Bogdan GD, Fodor D. Steroid injection for hip osteoarthritis: efficacyunder ultrasound guidance. Rheumatology (Oxford) 49: 1490–4.
[17] Qvistgaard E, Kristoffersen H, Terslev L, Danneskiold-Samsoe B, Torp-Pedersen S,Bliddal H. Guidance by ultrasound of intra-articular injections in the knee andhip joints. Osteoarthritis Cartilage 2001;9:512–7.
[18] Guermazi A, Eckstein F, Hellio Le Graverand-Gastineau MP, Conaghan PG, BursteinD, Keen H, et al. Osteoarthritis: current role of imaging. Med Clin North Am2009;93:101–26 xi.
[19] Altman R, Asch E, Bloch D, Bole G, Borenstein D, Brandt K, et al. Development ofcriteria for the classification and reporting of osteoarthritis. Classification of os-teoarthritis of the knee. Diagnostic and Therapeutic Criteria Committee of theAmerican Rheumatism Association. Arthritis Rheum 1986;29:1039–49.
[20] Spector TD, Hart DJ, Byrne J, Harris PA, Dacre JE, Doyle DV. Definition of osteoar-thritis of the knee for epidemiological studies. Ann Rheum Dis 1993;52:790–4.
[21] Leach RE, Gregg T, Siber FJ. Weight-bearing radiography in osteoarthritis of theknee. Radiology 1970;97:265–8.
[22] Mazzuca SA, Brandt KD, Katz BP. Is conventional radiography suitable for evalu-ation of a disease-modifying drug in patients with knee osteoarthritis? Osteoar-thritis Cartilage 1997;5:217–26.
[23] Buckland-Wright JC, Macfarlane DG, Williams SA, Ward RJ. Accuracy and preci-sion of joint space width measurements in standard and macroradiographs ofosteoarthritic knees. Ann Rheum Dis 1995;54:872–80.
[24] Buckland-Wright JC, Wolfe F, Ward RJ, Flowers N, Hayne C. Substantial superior-ity of semiflexed (MTP) views in knee osteoarthritis: a comparative radiographicstudy, without fluoroscopy, of standing extended, semiflexed (MTP), and schussviews. J Rheumatol 1999;26:2664–74.
[25] Mazzuca SA, Brandt KD, Buckland-Wright JC, Buckwalter KA, Katz BP, Lynch JA,et al. Field test of the reproducibility of automated measurements of medialtibiofemoral joint space width derived from standardized knee radiographs. JRheumatol 1999;26:1359–65.
[26] Peterfy C, Li J, Zaim S, Duryea J, Lynch J, Miaux Y, et al. Comparison of fixed-flexion positioning with fluoroscopic semi-flexed positioning for quantifying ra-diographic joint-space width in the knee: test–retest reproducibility. SkeletalRadiol 2003;32:128–32.
[27] Chondrometry Lequesne M. Quantitative evaluation of joint space width andrate of joint space loss in osteoarthritis of the hip. Rev Rhum Engl Ed 1995;62:155–8.
[28] Ravaud P, Chastang C, Auleley GR, Giraudeau B, Royant V, Amor B, et al. Assess-ment of joint space width in patients with osteoarthritis of the knee: a compar-ison of 4 measuring instruments. J Rheumatol 1996;23:1749–55.
[29] Roemer FW, Crema MD, Trattnig S, Guermazi A. Advances in imaging of osteoar-thritis and cartilage. Radiology 2011;260:332–54.
[30] Conrozier T, Lequesne M, Favret H, Taccoen A, Mazieres B, Dougados M, et al.Measurement of the radiological hip joint space width. An evaluation of variousmethods of measurement. Osteoarthritis Cartilage 2001;9:281–6.
[31] Vignon E. Radiographic issues in imaging the progression of hip and knee osteo-arthritis. J Rheumatol Suppl 2004;70:36–44.
[32] Bauer DC, Hunter DJ, Abramson SB, Attur M, Corr M, Felson D, et al. Classificationof osteoarthritis biomarkers: a proposed approach. Osteoarthritis Cartilage2006;14:723–7.
[33] Altman RD, Hochberg M, Murphy Jr WA, Wolfe F, Lequesne M. Atlas of individualradiographic features in osteoarthritis. Osteoarthritis Cartilage 1995;3(Suppl A):3–70.
Please cite this article as: Braun HJ, Gold GE, Diagnosis of osteoarthritis:
[34] Amin S, LaValley MP, Guermazi A, Grigoryan M, Hunter DJ, Clancy M, et al. Therelationship between cartilage loss on magnetic resonance imaging and radio-graphic progression in men and women with knee osteoarthritis. ArthritisRheum 2005;52:3152–9.
[35] Taljanovic MS, Graham AR, Benjamin JB, Gmitro AF, Krupinski EA, Schwartz SA,et al. Bone marrow edema pattern in advanced hip osteoarthritis: quantitativeassessment with magnetic resonance imaging and correlation with clinical ex-amination, radiographic findings, and histopathology. Skeletal Radiol 2008;37:423–31.
[36] Zanetti M, Bruder E, Romero J, Hodler J. Bone marrow edema pattern in osteoar-thritic knees: correlation between MR imaging and histologic findings. Radiology2000;215:835–40.
[37] Baranyay FJ, Wang Y, Wluka AE, English DR, Giles GG, Sullivan RO, et al. Associ-ation of bone marrow lesions with knee structures and risk factors for bone mar-row lesions in the knees of clinically healthy, community-based adults. SeminArthritis Rheum 2007;37:112–8.
[38] Guymer E, Baranyay F, Wluka AE, Hanna F, Bell RJ, Davis SR, et al. A study of theprevalence and associations of subchondral bone marrow lesions in the knees ofhealthy, middle-aged women. Osteoarthritis Cartilage 2007;15:1437–42.
[39] Felson DT, McLaughlin S, Goggins J, LaValley MP, Gale ME, Totterman S, et al.Bone marrow edema and its relation to progression of knee osteoarthritis. AnnIntern Med 2003;139:330–6.
[40] Hunter DJ, Zhang Y, Niu J, Goggins J, Amin S, LaValley MP, et al. Increase in bonemarrow lesions associated with cartilage loss: a longitudinal magnetic resonanceimaging study of knee osteoarthritis. Arthritis Rheum 2006;54:1529–35.
[41] Roemer FW, Guermazi A, Javaid MK, Lynch JA, Niu J, Zhang Y, et al. Change inMRI-detected subchondral bone marrow lesions is associated with cartilageloss: the MOST Study. A longitudinal multicentre study of knee osteoarthritis.Ann Rheum Dis 2009;68:1461–5.
[42] Bergman AG, Willen HK, Lindstrand AL, Pettersson HT. Osteoarthritis of theknee: correlation of subchondral MR signal abnormalities with histopathologicand radiographic features. Skeletal Radiol 1994;23:445–8.
[43] Roemer FW, Hunter DJ, Guermazi A. MRI-based semiquantitative assessment ofsubchondral bone marrow lesions in osteoarthritis research. Osteoarthritis Car-tilage 2009;17:414–5 author reply 416–7.
[44] Yu JS, Cook PA. Magnetic resonance imaging (MRI) of the knee: a pattern ap-proach for evaluating bone marrow edema. Crit Rev Diagn Imaging 1996;37:261–303.
[45] Freund E. The pathological significance of intra-articular pressure. Edinb Med J1940;47:192–203.
[46] Landells JW. The bone cysts of osteoarthritis. J Bone Joint Surg Br 1953;35-B:643–9.
[47] Resnick D, Niwayama G, Coutts RD. Subchondral cysts (geodes) in arthritic disor-ders: pathologic and radiographic appearance of the hip joint. AJR Am J Roent-genol 1977;128:799–806.
[48] Rhaney K, Lamb DW. The cysts of osteoarthritis of the hip; a radiological andpathological study. J Bone Joint Surg Br 1955;37-B:663–75.
[49] CremaMD, Roemer FW, Marra MD, Niu J, Zhu Y, Lynch J, et al. MRI-detected bonemarrow edema-like lesions are strongly associated with subchondral cysts in pa-tients with or at risk for knee osteoarthritis: the MOST study. Osteoarthritis Car-tilage 2008;14:1033–40.
[50] Carrino JA, Blum J, Parellada JA, Schweitzer ME, Morrison WB. MRI of bone mar-row edema-like signal in the pathogenesis of subchondral cysts. OsteoarthritisCartilage 2006;14:1081–5.
[51] Reichenbach S, Guermazi A, Niu J, Neogi T, Hunter DJ, Roemer FW, et al. Preva-lence of bone attrition on knee radiographs and MRI in a community-based co-hort. Osteoarthritis Cartilage 2008;16:1005–10.
[52] Roemer FW, Guermazi A, Neogi T, Zhu Y, Javaid M, Crema MD, et al. Tibiofemoralbone marrow lesions and their association with prevalent and incident subchon-dral bone attrition: the MOST study. Osteoarthritis Cartilage 2008;16:S160–1.
[53] Coumas JM, Palmer WE. Knee arthrography. Evolution and current status. RadiolClin North Am 1998;36:703–28.
[54] Cicuttini F, Forbes A, Asbeutah A, Morris K, Stuckey S. Comparison and reproduc-ibility of fast and conventional spoiled gradient-echo magnetic resonance se-quences in the determination of knee cartilage volume. J Orthop Res 2000;18:580–4.
[55] Eckstein F, Westhoff J, Sittek H, Maag KP, Haubner M, Faber S, et al. In vivo repro-ducibility of three-dimensional cartilage volume and thickness measurementswith MR imaging. AJR Am J Roentgenol 1998;170:593–7.
[56] Gold GE, Fuller SE, Hargreaves BA, Stevens KJ, Beaulieu CF. Driven equilibriummagnetic resonance imaging of articular cartilage: initial clinical experience. JMagn Reson Imaging 2005;21:476–81.
[57] Duc SR, Pfirrmann CW, Schmid MR, Zanetti M, Koch PP, Kalberer F, et al. Articularcartilage defects detected with 3D water-excitation true FISP: prospective com-parison with sequences commonly used for knee imaging. Radiology 2007;245:216–23.
[58] Eckstein F, Hudelmaier M, Wirth W, Kiefer B, Jackson R, Yu J, et al. Double echosteady state magnetic resonance imaging of knee articular cartilage at 3 Tesla:a pilot study for the Osteoarthritis Initiative. Ann Rheum Dis 2006;65:433–41.
[59] Peterfy CG, Schneider E, Nevitt M. The osteoarthritis initiative: report on the de-sign rationale for the magnetic resonance imaging protocol for the knee. Osteo-arthritis Cartilage 2008;16:1433–41.
[60] Vasanawala SS, Pauly JM, Nishimura DG. Fluctuating equilibrium MRI. MagnReson Med 1999;42:876–83.
[61] Kijowski R, Blankenbaker DG, Klaers JL, Shinki K, De Smet AA, Block WF. Vastlyundersampled isotropic projection steady-state free precession imaging of the
Imaging, Bone (2011), doi:10.1016/j.bone.2011.11.019
10 H.J. Braun, G.E. Gold / Bone xxx (2011) xxx–xxx
knee: diagnostic performance compared with conventional MR. Radiology2009;251:185–94.
[62] Friedrich KM, Reiter G, Kaiser B, Mayerhofer M, Deimling M, Jellus V, Horger W,Trattnig S, Schweitzer M, Salomonowitz E. High-resolution cartilage imaging ofthe knee at 3T: basic evaluation of modern isotropic 3D MR-sequences. Eur JRadiol 2011;78:398–405.
[63] Stevens KJ, Busse RF, Han E, Brau AC, Beatty PJ, Beaulieu CF, et al. Ankle: isotropicMR imaging with 3D-FSE-cube—initial experience in healthy volunteers. Radiol-ogy 2008;249:1026–33.
[64] Stevens KJ, Wallace CG, Chen W, Rosenberg JK, Gold GE. Imaging of the wrist at1.5 Tesla using isotropic three-dimensional fast spin echo cube. J Magn ResonImaging 2011;33:908–15.
[65] Dijkgraaf LC, de Bont LG, Boering G, Liem RS. The structure, biochemistry, andmetabolism of osteoarthritic cartilage: a review of the literature. J Oral Maxillo-fac Surg 1995;53:1182–92.
[66] Smith HE, Mosher TJ, Dardzinski BJ, Collins BG, Collins CM, Yang QX, et al. Spatialvariation in cartilage T2 of the knee. J Magn Reson Imaging 2001;14:50–5.
[67] Mosher TJ, Zhang Z, Reddy R, Boudhar S, Milestone BN, Morrison WB, Kwoh CK,Eckstein F, Witschey WR, Borthakur A. Knee articular cartilage damage in osteo-arthritis: analysis of MR image biomarker reproducibility in ACRIN-PA 4001multicenter trial. Radiology 2011;258:832–42.
[68] Wheaton AJ, Casey FL, Gougoutas AJ, Dodge GR, Borthakur A, Lonner JH, et al.Correlation of T1rho with fixed charge density in cartilage. J Magn Reson Imag-ing 2004;20:519–25.
[69] Blumenkrantz G, Majumdar S. Quantitative magnetic resonance imaging of artic-ular cartilage in osteoarthritis. Eur Cell Mater 2007;13:76–86.
[70] Li XHE, Crane JC. Development of in vivo multi-slice spiral T1 rho mapping incartilage at 3T and its application to osteoarthritis. Annual Meeting InternationalSociety of Magnetic Resonance in Medicine; 2005. Miami, FL.
[71] Regatte RR, Akella SV,WheatonAJ, LechG, Borthakur A,Kneeland JB, et al. 3D-T1rho-relaxation mapping of articular cartilage: in vivo assessment of early degenerativechanges in symptomatic osteoarthritic subjects. Acad Radiol 2004;11:741–9.
[72] Stahl R, Luke A, Li X, Carballido-Gamio J, Ma CB, Majumdar S, et al. T1rho, T2 andfocal knee cartilage abnormalities in physically active and sedentary healthysubjects versus early OA patients—a 3.0-Tesla MRI study. Eur Radiol 2009;19:132–43.
[73] Borthakur A, Shapiro EM, Beers J, Kudchodkar S, Kneeland JB, Reddy R. Sensitiv-ity of MRI to proteoglycan depletion in cartilage: comparison of sodium and pro-ton MRI. Osteoarthritis Cartilage 2000;8:288–93.
[74] Wang L, Wu Y, Chang G, Oesingmann N, Schweitzer ME, Jerschow A, et al. Rapidisotropic 3D-sodium MRI of the knee joint in vivo at 7T. J Magn Reson Imaging2009;30:606–14.
[75] Wheaton AJ, Borthakur A, Shapiro EM, Regatte RR, Akella SV, Kneeland JB, et al.Proteoglycan loss in human knee cartilage: quantitation with sodium MR imag-ing—feasibility study. Radiology 2004;231:900–5.
[76] McKenzie CA, Williams A, Prasad PV, Burstein D. Three-dimensional delayedgadolinium-enhanced MRI of cartilage (dGEMRIC) at 1.5T and 3.0T. J MagnReson Imaging 2006;24:928–33.
[77] Gold GE, Burstein D, Dardzinski B, Lang P, Boada F, Mosher T. MRI of articular car-tilage in OA: novel pulse sequences and compositional/functional markers. Oste-oarthritis Cartilage 2006;14(Suppl A):A76–86.
[78] Burstein D, Gray ML, Hartman AL, Gipe R, Foy BD. Diffusion of small solutes incartilage as measured by nuclear magnetic resonance (NMR) spectroscopy andimaging. J Orthop Res 1993;11:465–78.
[79] Filidoro L, Dietrich O, Weber J, Rauch E, Oerther T, Wick M, et al. High-resolutiondiffusion tensor imaging of human patellar cartilage: feasibility and preliminaryfindings. Magn Reson Med 2005;53:993–8.
[80] Potter HG, Linklater JM, Allen AA, Hannafin JA, Haas SB. Magnetic resonance im-aging of articular cartilage in the knee. An evaluation with use of fast-spin-echoimaging. J Bone Joint Surg Am 1998;80:1276–84.
[81] Kurosawa H, Fukubayashi T, Nakajima H. Load-bearing mode of the knee joint:physical behavior of the knee joint with or without menisci. Clin Orthop RelatRes 1980:283–90.
[82] Seedhom BB, Hargreaves DJ. Transmission of the load in the knee joint with spe-cial reference to the role of the meniscus (part I + II). Eng Med 1979;4:207–28.
[83] Walker PS, Erkman MJ. The role of the menisci in force transmission across theknee. Clin Orthop Relat Res 1975:184–92.
[84] Song Y, Greve JM, Carter DR, Giori NJ. Meniscectomy alters the dynamic defor-mational behavior and cumulative strain of tibial articular cartilage in kneejoints subjected to cyclic loads. Osteoarthritis Cartilage 2008;16:1545–54.
[85] Song Y, Greve JM, Carter DR, Koo S, Giori NJ. Articular cartilage MR imaging andthickness mapping of a loaded knee joint before and after meniscectomy. Oste-oarthritis Cartilage 2006;14:728–37.
[86] Magee T, Williams D. Detection of meniscal tears and marrow lesions using cor-onal MRI. AJR Am J Roentgenol 2004;183:1469–73.
[87] Magee TH, Hinson GW. MRI of meniscal bucket-handle tears. Skeletal Radiol1998;27:495–9.
[88] Lee JH, Singh TT, Bolton G. Axial fat-saturated FSE imaging of knee: appearanceof meniscal tears. Skeletal Radiol 2002;31:384–95.
[89] Tarhan NC, Chung CB, Mohana-Borges AV, Hughes T, Resnick D. Meniscal tears:role of axial MRI alone and in combination with other imaging planes. AJR AmJ Roentgenol 2004;183:9–15.
[90] Helms CA. The meniscus: recent advances in MR imaging of the knee. AJR Am JRoentgenol 2002;179:1115–22.
[91] Fox MG. MR imaging of the meniscus: review, current trends, and clinical impli-cations. Radiol Clin North Am 2007;45:1033–53 vii.
Please cite this article as: Braun HJ, Gold GE, Diagnosis of osteoarthritis
[92] Chang CY, Wu HT, Huang TF, Ma HL, Hung SC. Imaging evaluation of meniscal in-jury of the knee joint: a comparative MR imaging and arthroscopic study. ClinImaging 2004;28:372–6.
[93] Escobedo EM, Hunter JC, Zink-Brody GC, Wilson AJ, Harrison SD, Fisher DJ. Use-fulness of turbo spin-echo MR imaging in the evaluation of meniscal tears: com-parison with a conventional spin-echo sequence. AJR Am J Roentgenol 1996;167:1223–7.
[94] Guckel C, Jundt G, Schnabel K, Gachter A. Spin-echo and 3D gradient-echo imag-ing of the knee joint: a clinical and histopathological comparison. Eur J Radiol1995;21:25–33.
[95] Cheung LP, Li KC, Hollett MD, Bergman AG, Herfkens RJ. Meniscal tears of theknee: accuracy of detection with fast spin-echo MR imaging and arthroscopiccorrelation in 293 patients. Radiology 1997;203:508–12.
[96] De Smet AA, Tuite MJ. Use of the “two-slice-touch” rule for the MRI diagnosis ofmeniscal tears. AJR Am J Roentgenol 2006;187:911–4.
[97] Vande Berg BC, Malghem J, Poilvache P, Maldague B, Lecouvet FE. Meniscal tearswith fragments displaced in notch and recesses of knee: MR imaging with ar-throscopic comparison. Radiology 2005;234:842–50.
[98] Blackmon GB, Major NM, Helms CA. Comparison of fast spin-echo versus con-ventional spin-echo MRI for evaluating meniscal tears. AJR Am J Roentgenol2005;184:1740–3.
[99] Craig JG, Go L, Blechinger J, Hearshen D, Bouffard JA, Diamond M, et al. Three-tesla imaging of the knee: initial experience. Skeletal Radiol 2005;34:453–61.
[100] Magee T, Williams D. 3.0-T MRI of meniscal tears. AJR Am J Roentgenol2006;187:371–5.
[101] Ramnath RR, Magee T, Wasudev N, Murrah R. Accuracy of 3-T MRI using fastspin-echo technique to detect meniscal tears of the knee. AJR Am J Roentgenol2006;187:221–5.
[102] Kreitner KF, Romaneehsen B, Krummenauer F, Oberholzer K, Muller LP, Duber C.Fast magnetic resonance imaging of the knee using a parallel acquisition tech-nique (mSENSE): a prospective performance evaluation. Eur Radiol 2006;16:1659–66.
[103] Niitsu M, Ikeda K. Routine MR examination of the knee using parallel imaging.Clin Radiol 2003;58:801–7.
[104] Gatehouse PD, He T, Puri BK, Thomas RD, Resnick D, BydderGM. Contrast-enhancedMRI of the menisci of the knee using ultrashort echo time (UTE) pulse sequences:imaging of the red and white zones. Br J Radiol 2004;77:641–7.
[105] Gold GE, Bergman AG, Pauly JM, Lang P, Butts RK, Beaulieu CF, et al. Magnetic reso-nance imaging of knee cartilage repair. Top Magn Reson Imaging 1998;9:377–92.
[106] Robson MD, Gatehouse PD, Bydder M, Bydder GM. Magnetic resonance: an intro-duction to ultrashort TE (UTE) imaging. J Comput Assist Tomogr 2003;27:825–46.
[107] Lohmander LS, Englund PM, Dahl LL, Roos EM. The long-term consequence of an-terior cruciate ligament and meniscus injuries: osteoarthritis. Am J Sports Med2007;35:1756–69.
[108] Lohmander LS, Ostenberg A, Englund M, Roos H. High prevalence of knee osteo-arthritis, pain, and functional limitations in female soccer players twelve yearsafter anterior cruciate ligament injury. Arthritis Rheum 2004;50:3145–52.
[109] Naredo E, Cabero F, Palop MJ, Collado P, Cruz A, Crespo M. Ultrasonographic find-ings in knee osteoarthritis: a comparative study with clinical and radiographicassessment. Osteoarthritis Cartilage 2005;13:568–74.
[110] Hayashi D, Roemer FW, Katur A, Felson DT, Yang SO, Alomran F, Guermazi A. Im-aging of Synovitis in Osteoarthritis: Current Status and Outlook. Semin ArthritisRheum.
[111] Pelletier JP, Martel-Pelletier J, Abramson SB. Osteoarthritis, an inflammatory dis-ease: potential implication for the selection of new therapeutic targets. ArthritisRheum 2001;44:1237–47.
[112] Myers SL, Flusser D, Brandt KD, Heck DA. Prevalence of cartilage shards in syno-vium and their association with synovitis in patients with early and endstage os-teoarthritis. J Rheumatol 1992;19:1247–51.
[113] Loeuille D, Chary-Valckenaere I, Champigneulle J, Rat AC, Toussaint F, Pinzano-Watrin A, et al. Macroscopic and microscopic features of synovial membrane in-flammation in the osteoarthritic knee: correlating magnetic resonance imagingfindings with disease severity. Arthritis Rheum 2005;52:3492–501.
[114] Rollin R, Marco F, Jover JA, Garcia-Asenjo JA, Rodriguez L, Lopez-Duran L, et al.Early lymphocyte activation in the synovial microenvironment in patients withosteoarthritis: comparison with rheumatoid arthritis patients and healthy con-trols. Rheumatol Int 2008;28:757–64.
[115] Brandt KD, Dieppe P, Radin E. Etiopathogenesis of osteoarthritis. Med Clin NorthAm 2009;93:1–24 xv.
[116] Myers SL, Brandt KD, Ehlich JW, Braunstein EM, Shelbourne KD, Heck DA, et al.Synovial inflammation in patients with early osteoarthritis of the knee. J Rheu-matol 1990;17:1662–9.
[117] Kortekaas MC, Kwok WY, Reijnierse M, Watt I, Huizinga TW, Kloppenburg M.Pain in hand osteoarthritis is associated with inflammation: the value of ultra-sound. Ann Rheum Dis 69: 1367–9.
[118] Ledingham J, Regan M, Jones A, Doherty M. Factors affecting radiographic pro-gression of knee osteoarthritis. Ann Rheum Dis 1995;54:53–8.
[119] Smith MD, Triantafillou S, Parker A, Youssef PP, Coleman M. Synovial membraneinflammation and cytokine production in patients with early osteoarthritis. JRheumatol 1997;24:365–71.
[120] Keen HI, Wakefield RJ, Grainger AJ, Hensor EM, Emery P, Conaghan PG. An ultra-sonographic study of osteoarthritis of the hand: synovitis and its relationship tostructural pathology and symptoms. Arthritis Rheum 2008;59:1756–63.
[121] Guermazi A, Burstein D, Conaghan P, Eckstein F, Hellio Le Graverand-GastineauMP, Keen H, et al. Imaging in osteoarthritis. Rheum Dis Clin North Am2008;34:645–87.
: Imaging, Bone (2011), doi:10.1016/j.bone.2011.11.019
11H.J. Braun, G.E. Gold / Bone xxx (2011) xxx–xxx
[122] Wakefield RJ, Balint PV, Szkudlarek M, Filippucci E, Backhaus M, D'Agostino MA,et al. Musculoskeletal ultrasound including definitions for ultrasonographic pa-thology. J Rheumatol 2005;32:2485–7.
[123] Haraoui B, Pelletier JP, Cloutier JM, Faure MP, Martel-Pelletier J. Synovial mem-brane histology and immunopathology in rheumatoid arthritis and osteoarthri-tis. In vivo effects of antirheumatic drugs. Arthritis Rheum 1991;34:153–63.
[124] Keen HI, Conaghan PG. Ultrasonography in osteoarthritis. Radiol Clin North Am2009;47:581–94.
[125] Song IH, Althoff CE, Hermann KG, Scheel AK, Knetsch T, Schoenharting M, et al.Knee osteoarthritis. Efficacy of a newmethod of contrast-enhanced musculoskele-tal ultrasonography in detection of synovitis in patients with knee osteoarthritis incomparison with magnetic resonance imaging. Ann Rheum Dis 2008;67:19–25.
[126] Walther M, Harms H, Krenn V, Radke S, Faehndrich TP, Gohlke F. Correlation ofpower Doppler sonography with vascularity of the synovial tissue of the kneejoint in patients with osteoarthritis and rheumatoid arthritis. Arthritis Rheum2001;44:331–8.
[127] Walther M, Harms H, Krenn V, Radke S, Kirschner S, Gohlke F. Synovial tissue ofthe hip at power Doppler US: correlation between vascularity and power Dopp-ler US signal. Radiology 2002;225:225–31.
[128] D'Agostino MA, Conaghan P, Le Bars M, Baron G, Grassi W, Martin-Mola E, et al.EULAR report on the use of ultrasonography in painful knee osteoarthritis. Part
Please cite this article as: Braun HJ, Gold GE, Diagnosis of osteoarthritis:
1: prevalence of inflammation in osteoarthritis. Ann Rheum Dis 2005;64:1703–9.
[129] Kumm J, Tamm A, Lintrop M. Association between ultrasonographic findings andbone/cartilage biomarkers in patients with early-stage knee osteoarthritis. CalcifTissue Int 2009;85:514–22.
[130] Fernandez-Madrid F, Karvonen RL, Teitge RA, Miller PR, An T, Negendank WG.Synovial thickening detected by MR imaging in osteoarthritis of the knee con-firmed by biopsy as synovitis. Magn Reson Imaging 1995;13:177–83.
[131] Hill CL, Gale DG, Chaisson CE, Skinner K, Kazis L, Gale ME, et al. Knee effusions,popliteal cysts, and synovial thickening: association with knee pain in osteoar-thritis. J Rheumatol 2001;28:1330–7.
[132] Hill CL, Hunter DJ, Niu J, Clancy M, Guermazi A, Genant H, et al. Synovitisdetected on magnetic resonance imaging and its relation to pain and cartilageloss in knee osteoarthritis. Ann Rheum Dis 2007;66:1599–603.
[133] Roemer FW, Guermazi A, Zhang Y, Yang M, Hunter DJ, Crema MD, et al. Hoffa'sfat pad: evaluation on unenhanced MR images as a measure of patellofemoralsynovitis in osteoarthritis. AJR Am J Roentgenol 2009;192:1696–700.
[134] Loeuille D, Rat AC, Goebel JC, Champigneulle J, Blum A, Netter P, et al. Magneticresonance imaging in osteoarthritis: which method best reflects synovial mem-brane inflammation? Correlations with clinical, macroscopic and microscopicfeatures. Osteoarthritis Cartilage 2009;17:1186–92.
Imaging, Bone (2011), doi:10.1016/j.bone.2011.11.019