Embed Size (px)
Citation preview
Diagnostic Accuracy of Post-traumatic Stress Disorder Checklist - Civilian
Version and Modified Versions of Center for Epidemiologic Studies
Depression Scale among 1988 Spitak Earthquake Survivors
(A cross-sectional study)
Master of Public Health Integrating Experience Project
Professional Publication Framework
by
Ani Movsisyan, MPH Candidate
Advising team:
Demirchyan, A., MD, MPH
Armenian, H., MD, DrPH
Diener-West, M., PhD
Khachadourian, V., MD, MPH
School of Public Health
American University of Armenia
Yerevan, 2013
i
TABLE OF CONTENTS
ABBREVIATION LIST ............................................................................................................. IV
ACKNOWLEDGMENTS ........................................................................................................... V
ABSTRACT ................................................................................................................................. VI
LITERATURE REVIEW ............................................................................................................ 1
Introduction .................................................................................................................................... 1
Post-Traumatic Stress Disorder (PTSD) and Depression ............................................................ 1
PTSD Checklist (PCL) and its Validation ..................................................................................... 3
Center for Epidemiologic Studies Depression Scale (CES-D) ..................................................... 6
Armenian Experience .................................................................................................................... 8
STUDY AIM AND OBJECTIVES .............................................................................................. 9
METHODOLOGY ..................................................................................................................... 10
Study Design, Setting and Population ......................................................................................... 10
Sample Size ................................................................................................................................... 11
Sampling Frame and Sampling Strategy .................................................................................... 12
Study Procedure ........................................................................................................................... 13
Study Instruments ........................................................................................................................ 14
Statistical Analysis ....................................................................................................................... 15
ETHICAL CONSIDERATIONS ............................................................................................... 16
RESULTS .................................................................................................................................... 17

ii
Sample Characteristics ................................................................................................................ 17
Performance of PCL-C ................................................................................................................ 18
Scale Characteristics of CES-D (20) with Negatively Restated Positive Affect Items............... 19
Performance of CES-D (16) and CES-D (20) with Negatively Restated Positive Affect Items 20
AUC Comparisons by Gender and Age ....................................................................................... 21
DISCUSSION .............................................................................................................................. 22
STUDY STRENGHTS AND LIMITATIONS ......................................................................... 24
CONCLUSIONS AND RECOMMENDATIONS .................................................................... 25
REFERENCES ............................................................................................................................ 27
TABLES ....................................................................................................................................... 36
FIGURES ..................................................................................................................................... 43
APPENDIX 1 ............................................................................................................................... 46
APPENDIX 2 ............................................................................................................................... 47
APPENDIX 3 ............................................................................................................................... 48
APPENDIX 4 ............................................................................................................................... 50
APPENDIX 5 ............................................................................................................................... 59
iv
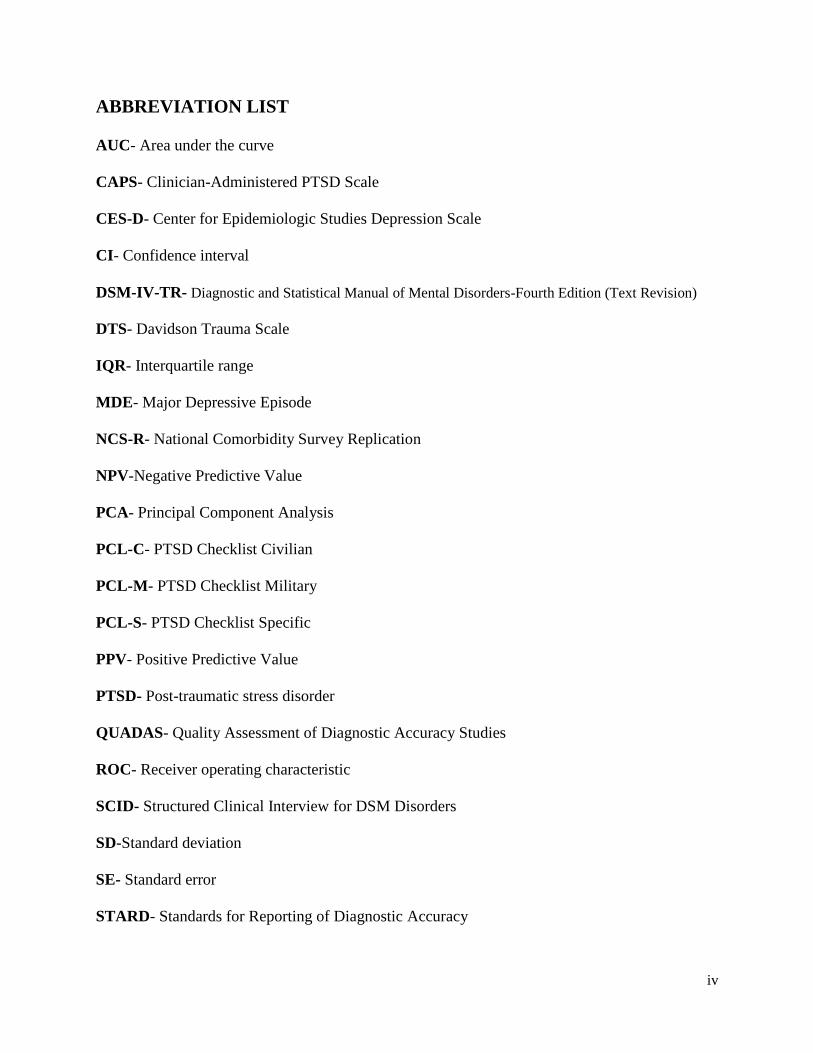
ABBREVIATION LIST
AUC- Area under the curve
CAPS- Clinician-Administered PTSD Scale
CES-D- Center for Epidemiologic Studies Depression Scale
CI- Confidence interval
DSM-IV-TR- Diagnostic and Statistical Manual of Mental Disorders-Fourth Edition (Text Revision)
DTS- Davidson Trauma Scale
IQR- Interquartile range
MDE- Major Depressive Episode
NCS-R- National Comorbidity Survey Replication
NPV-Negative Predictive Value
PCA- Principal Component Analysis
PCL-C- PTSD Checklist Civilian
PCL-M- PTSD Checklist Military
PCL-S- PTSD Checklist Specific
PPV- Positive Predictive Value
PTSD- Post-traumatic stress disorder
QUADAS- Quality Assessment of Diagnostic Accuracy Studies
ROC- Receiver operating characteristic
SCID- Structured Clinical Interview for DSM Disorders
SD-Standard deviation
SE- Standard error
STARD- Standards for Reporting of Diagnostic Accuracy
v
ACKNOWLEDGMENTS
I would like to express my deepest gratitude to my advisers Dr. Anahit Demirchyan, Dr. Vahe
Khachadourian, Dr. Haroutune Armenian and my reader Dr. Marie Diener-West for their
support, valuable insight, patience and contribution to this project.
I do appreciate the MPH Program Faculty at the American University of Armenia and Center for
Health Services Research and Development for their support, cooperation and assistance.
I would like to specially thank Dr. Byron Crape for his kind attitude, support and willingness to
help in every way.
I would like to acknowledge and express my gratefulness to the Martirosyan Family and Roza
Muradyan for their support and provision of shelter in Gyumri.
I am very grateful to all the participants of the study who agreed to spend their time and once
again recall and reflect on the sensitive topics of their lives to make this project possible.
I am very thankful to my family and friends for their understanding, support and patience.

vi
ABSTRACT
Background: Post-traumatic stress disorder (PTSD) is one of the most commonly studied and
central psychopathologies in the aftermath of disasters. Depression in its turn is another
significant contributor to the global burden of disease and is estimated to affect 350 million
people worldwide. Considering short- and long-term adverse affects of depression and anxiety
disorders, routine screenings of their symptoms become more and more important. The growing
awareness of the issue favors the focus of scientific studies on the generation of
“psychometrically sound” instruments and accurate detection of those conditions in
epidemiological research, in particular assessing performance of corresponding screening tests
among various samples.
Significance: Notwithstanding the number of instruments that have been employed in the
investigations to measure PTSD and depressive disorders among survivors of 1988 Spitak
earthquake, no criterion validity studies of PTSD Checklist Civilian (PCL-C) or Center for
Epidemiologic Studies Depression Scale (CES-D) modified scale yielding clinically validated
measures have been conducted in Armenia. Aim: Investigate diagnostic accuracy of the Armenian versions of PCL-C and CES-D modified
(16 item scale vs. 20 item scale with negatively restated Positive Affect items) among 1988
Spitak earthquake survivors.
Methods: The study was a cross-sectional quantitative analysis. People aged 39 and older who
were in Gyumri during the1988 earthquake comprised the study population. Sample size was
calculated to be 126, and study participants were recruited based on a two-stage cluster sampling
strategy. Study used two screening tests: PCL-C and CES-D modified version with negatively
restated Positive Affect items. Structured Clinical Interview for DSM Disorders (SCID) was
chosen as the reference standard for the screening instruments.
Results: The majority of the sample was female (75.6%), married (66.9%), with university
(33.9%) or professional/technical (30.7%) education. The mean age of the participants was 55.7
years; 26.2% of the participants met the criteria for current PTSD diagnosis and 28.4%- for
current major depressive episode based on SCID. PCL-C performed well in the study population
(Cronbach’s α=0.861), resulting in an AUC of 0.903 and an optimal cutoff score of 50. Both
versions of CES-D demonstrated acceptable internal consistency for the total scores (Cronbach’s
α=0.879 for CES-D (16) and 0.911 for CES-D (20). Items 4 (restated item “not as good as
other”), 15 (“unfriendly people”) and 19 (“people disliked”) demonstrated relatively low
corrected item-total correlations. Principal component analysis showed that negatively restated
Positive Affect items, did not construct the factor of (lack of) Positive Affect. The AUCs for
CES-D (16) and CES-D (20) were 0.895 and 0.902, while the optimal cutoffs 19 and 21,
respectively. CES-D (16) and CES-D (20) did not differ significantly in their overall diagnostic
performance. CES-D (16) performed better among males than among females.
Conclusions: The Armenian version of PCL-C is an accurate screening tool for identifying
PTSD symptomatology among Armenians with a trauma history with the most optimal and
efficient cutoff score of 50 among 1988 Spitak earthquake survivors. Armenian versions of
CES-D (16) and CES-D (20) with negatively restated positive affect items are valid tools to
measure major depression symptomatology in Armenian population with optimal cutoff scores
of 19 and 21, respectively. Given the failure of the negatively restated items to construct a
separate factor of (lack of) Positive Affect, CES-D (16) is a more practical alternative for
measuring depressive symptomatology in the Armenian population.

1
LITERATURE REVIEW
Introduction
According to the World Mental Health (WMH) Survey conducted in 17 countries, mental
disorders are quite common in the countries studied (with the interquartile range (IQR) of 18.1–
36.1% for lifetime prevalence estimates of any DSM-IV disorder (Diagnostic and Statistical
Manual of Mental Disorders)1. Moreover, consistent with a number of literature reviews
2-4,
anxiety disorders are found to be the most prevalent class of mental disorders (with lifetime
prevalence estimates averaging to ~16%), while mood disorders are found to be the second most
prevalent set of mental disorders (with the approximate lifetime prevalence estimates of 12%) in
epidemiological surveys1,5
. In addition, according to the National Comorbidity Survey
Replication (NCS-R), approximately half of the US residents can be diagnosed with a DSM-IV
disorder during their life with lifetime prevalence estimates of anxiety disorders constituting
28.8% and mood disorders – 20.8 % 5.
Post-Traumatic Stress Disorder (PTSD) and Depression
Post-traumatic stress disorder (PTSD) is an anxiety disorder with characteristic symptoms
resulting from experiencing or witnessing a traumatic event such as combat, natural disaster,
terrorist attack, accident, death and other physical, sexual or emotional abuse 6,7
.
Exposure to a traumatic stressor is very common in the general population; studies conducted on
the US population have demonstrated that approximately two thirds (~60%) of the general
population report experiencing a traumatic event during their lifespan8,9
. Meanwhile, NCS-R has
estimated the US general population lifetime prevalence of PTSD to be 6.8% 5. As shown by a
number of systematic reviews10-12
, PTSD is one of the most commonly studied and central
2
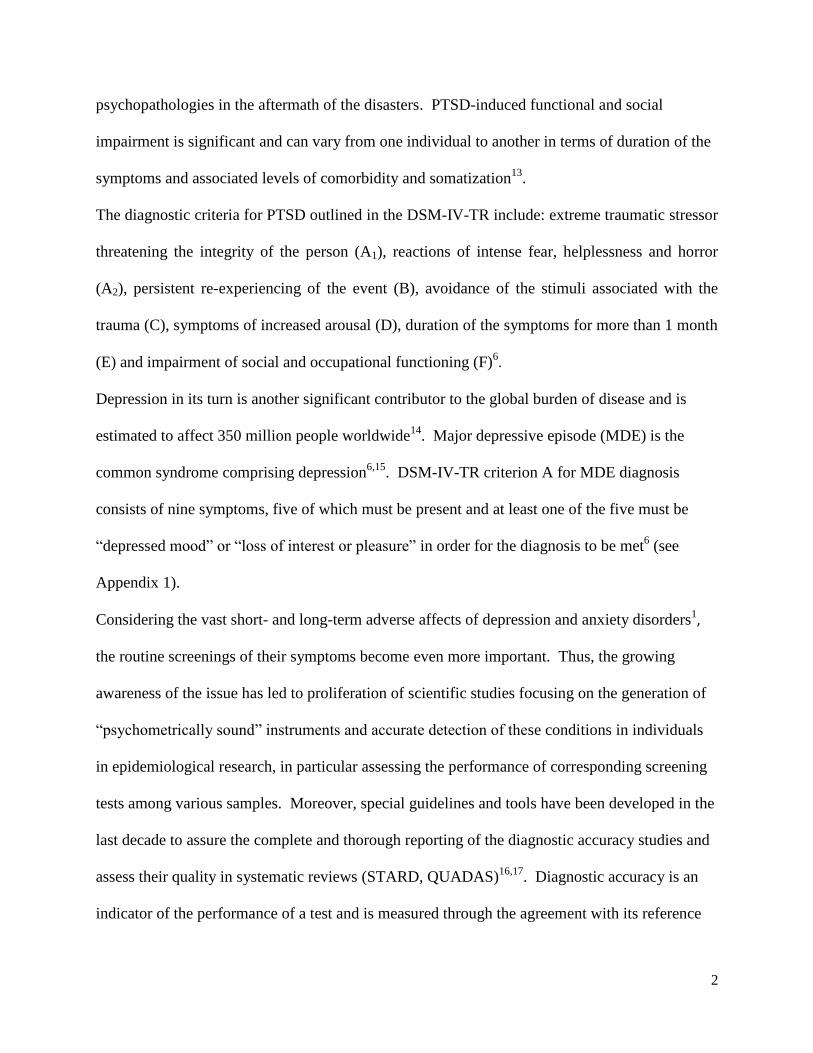
psychopathologies in the aftermath of the disasters. PTSD-induced functional and social
impairment is significant and can vary from one individual to another in terms of duration of the
symptoms and associated levels of comorbidity and somatization13
.
The diagnostic criteria for PTSD outlined in the DSM-IV-TR include: extreme traumatic stressor
threatening the integrity of the person (A1), reactions of intense fear, helplessness and horror
(A2), persistent re-experiencing of the event (B), avoidance of the stimuli associated with the
trauma (C), symptoms of increased arousal (D), duration of the symptoms for more than 1 month
(E) and impairment of social and occupational functioning (F)6.
Depression in its turn is another significant contributor to the global burden of disease and is
estimated to affect 350 million people worldwide14
. Major depressive episode (MDE) is the
common syndrome comprising depression6,15
. DSM-IV-TR criterion A for MDE diagnosis
consists of nine symptoms, five of which must be present and at least one of the five must be
“depressed mood” or “loss of interest or pleasure” in order for the diagnosis to be met6 (see
Appendix 1).
Considering the vast short- and long-term adverse affects of depression and anxiety disorders1,
the routine screenings of their symptoms become even more important. Thus, the growing
awareness of the issue has led to proliferation of scientific studies focusing on the generation of
“psychometrically sound” instruments and accurate detection of these conditions in individuals
in epidemiological research, in particular assessing the performance of corresponding screening
tests among various samples. Moreover, special guidelines and tools have been developed in the
last decade to assure the complete and thorough reporting of the diagnostic accuracy studies and
assess their quality in systematic reviews (STARD, QUADAS)16,17
. Diagnostic accuracy is an
indicator of the performance of a test and is measured through the agreement with its reference
3
or the “gold” standard16,18
. Another term, widely applied in the literature along diagnostic
accuracy, is the criterion validity defined as “the degree to which a measure covaries with
previously validated or “gold-standard” measures of the same constructs” 19
.
PTSD Checklist (PCL) and its Validation
One of the most frequently used self-report screening tests of PTSD symptoms is the 17-item
PTSD Checklist (PCL)18
. The Checklist has been developed by Weathers and his colleagues in
1993 and since has been widely applied in clinical and research settings20
. The 17 items
correspond to the symptoms of PTSD in the DSM-IV-TR. Respondents identify the extent to
which they have experienced each symptom in the past month using a five-point Likert scale
(ranging from “Not at all” to “Extremely”). Different scoring mechanisms can be applied to
yield either a continuous measure of PTSD symptom severity (17-85) or a dichotomous indicator
of diagnostic status21,22
. The latter can include either an overall cutoff score or a symptom
cluster scoring approach (Criteria B, C, D symptoms). The checklist does not assess the
traumatic event in detail or the feelings of fear/helplessness or horror, which correspond to the
Criteria A1 and A2.18,22,23
.
There are 3 types of PCL: a “specific” version for assessing a particular event (PCL-S), a
“military” version for assessing the events’ impact during military services (PCL-M) and a
“civilian” version designed for the assessment of any stressful event (PCL-C) 21
.
Since its introduction, PCL has undergone a number of validation studies and psychometric
analyses on various population groups and subgroups which have demonstrated considerable
variability across different settings in terms of optimal cutoff scores20,22-31
.
A cutoff score of 50, originally recommended by the authors of PCL yielded a sensitivity and a
specificity of 0.82 and 0.83 respectively on a sample of male veterans 20
. However, a replication

4
study on a similar subgroup conducted later by Keen et al. (2008) 22
yielded an optimal cutoff
score of 60 with a sensitivity of 0.56 and a specificity of 0.92. Using the original cutoff score of
50 on the sample of women with breast cancer authors calculated a sensitivity of 0.60 and a
specificity of 0.99 24
. In another study including victims of vehicle accidents and sexual assaults
the cutoff score of 50 yielded a sensitivity of 0.78 and a specificity of 0.86, while moving the
cutoff score down to the 44 improved the overall diagnostic efficiency to 0.90 with a sensitivity
of 0.94 and a specificity of 0.8625
. As PCL validation studies accumulated, a pattern has
emerged showing that a cutoff score around 30 was more efficient when used in primary care
settings 26,31,32
as opposed to much higher scores (≥50) among high-risk, treatment seeking
individuals 20,24,26,33
.
Yet in 1996, Blanchard and colleagues made a perceptive recommendation highlighting the need
to understand the PCL cutoff score in the context of trauma type and gender differences25
. A
more recent critical review of diagnostic accuracy studies of PCL conducted by McDonald and
colleagues provides a rigorous examination of various factors for understanding the variation
patterns of PCL operating characteristics18
, emphasizing the need for expanding the diagnostic
accuracy studies of PCL. The major argument the authors make is that sensitivity and specificity
of the PCL are not fixed across settings and populations and might be amenable to various
spectrum characteristics (such as demographics, disease severity, comorbidity and other sample
characteristics)18,34,35
. Moreover, based on the findings from a validation study using the
Davidson Trauma Scale (DTS), McDonald and colleagues recommend considering the
peculiarities of the comparison group used in the validation study, since the latter in its turn
might significantly alter the operating characteristics of the instrument36
. As shown by
McDonald et al36
, the ability of the DTS to discriminate between the veterans with PTSD and

5
veterans with no other Axis I diagnosis was quite different in comparison with its ability to
discriminate between the veterans with PTSD and veterans without PTSD but with a current
diagnosis of another Axis I disorder.
Major biases specific to diagnostic accuracy studies (such as work-up, test-review, incorporation
bias, etc.) can also affect operating characteristics being measured 16,18,34,37,38
. As described by
Ransohoff et al.34
, bias can occur in diagnostic accuracy studies when the test results are not
independent from the diagnoses; the prior knowledge of negative or positive test results might
affect the further diagnostic decisions thus resulting in so called work-up bias18
. When the
diagnosis may affect the test results, test-review bias becomes an issue37
. Finally, when using a
screening test in the diagnostic process, incorporation bias34
becomes the threat .
Apart from the concerns of various spectrum effects and biases, the ability of a screening test to
accurately estimate the prevalence of a condition in a give population is strongly affected by the
true prevalence (base rate) of the condition in that population39
– when the true prevalence is
low, the screening test will have a tendency to overestimate it (with the recommended cutoff)
and conversely -underestimate it when the true prevalence is high. Hereby, the choice of
different cutoff scores for the settings with different base rates becomes the issue when the
estimation of the prevalence of the condition is of interest. As shown by Terhakopian and
colleagues, lower cutoff scores are most optimal in populations with high base rates, while
higher cutoff scores- in populations with low base rates to yield close-to-the-real prevalence
estimates40
.
Thus, the conclusion to draw from the above presented discussion is that the mere reliance on
“conventional” cutoff scores might lead to misapplication of a screening test creating additional
6
challenges when trying to make predictions about the efficiency of the cutoff score for a specific
subgroup without the investigation of the performance of the latter in the given setting.
Center for Epidemiologic Studies Depression Scale (CES-D)
CES-D is a 20-item self-report depression scale developed to identify depression in the general
population41
. It is one of the most widely applied instruments for depression symptoms’
screening in various demographic and health subgroups. CES-D has been translated and
validated in many languages and across different population subgroups42-46
. A wide range of
studies have demonstrated good psychometric properties of the instrument in various settings
with corresponding modifications suggested43,45,47
.
CES-D covers the major symptoms of depression (Criteria A symptoms) identified in the
literature with a highlight of affective components: depressed mood, feelings of guilt and
worthlessness, feelings of helplessness and hopelessness, psychomotor retardation, loss of
appetite, and sleep disturbances48
. The original version of CES-D consists of four dimensions as
described by Radloff41
: Depressed Affect, (lack of) Positive Affect/Anhedonia, Somatic-
Retarded Activity and Interpersonal Relations, which collectively construct a depression score
(summative score of 4 factors). However, studies conducted among different cultural/ethnic
populations have demonstrated that the original four factor model might not be applicable47,49
in
a given setting, suggesting a different latent structure of the scale in some population groups and
ensuing modifications to the original scale.
The Conventional optimal cutoff score of 16 originally suggested by the author 41
is subject to
variance across different demographic and cultural groups (as is the case with most of the
screening tests applied in different ethnic/cultural settings). A number of validation studies of
7
CES-D have determined different optimal cutoff scores specific for a given setting and
population subgroup42,43,46,50,51
.
The Armenian version of CES-D has been used in several household health surveys to measure
the prevalence of depressive symptoms in the general population aged 18 and over52
. However,
lacking data of the psychometric property analyses and validation studies of the instrument on
the Armenian population, conventional cutoffs from general literature were applied, which
yielded exaggerated prevalence of depressive symptoms in the population52
. In order to address
these concerns with measurement properties of the instrument, data from a countrywide health
survey of the general population aged 18 and over were used by Demirchyan and colleagues, to
assess the psychometric properties of the translated instrument. The authors found a three-factor
structure of the scale (combined Depressed/Somatic, (lack of) Positive Affect/Anhedonia and
Interpersonal) with the latter factor weakly correlated with the other two factors, thereby
reducing the overall internal consistency of the whole scale. Further analysis of the construct
yielded a possible explanation that the positively worded Positive Affect/Anhedonia items
measured lifestyle- or attitude-related characteristics rather than depressive symptomatology of
the Armenians. Accordingly, it was concluded that the positively stated Positive Affect items of
CES-D may not appropriately represent depression symptoms for Armenian population. Hence,
it was suggested that either the modified version of CES-D using the score of the 16-item
negatively formulated subscale only or a restatement of the four positively worded questions
with negative wording, could both be considered as more valid options for the Armenian
population. However, the prior study did not estimate the criterion validity of the Armenian
CES-D, thereby leaving the question regarding the optimal cutoff score applicable for the
Armenian population unanswered. Meanwhile, no previous studies have been conducted in

8
Armenia to assess the properties of the negatively restated Positive Affect questions in
measuring the dimension of the (lack of) Positive Affect/Anhedonia defined as a failure to
perceive pleasure53
.
“Reference” Standard
The two most commonly employed standardized interviews for PTSD diagnosis are the
Clinician-Administered PTSD Scale (CAPS)54
and the Structured Clinical Interview for DSM IV
(SCID)55
.
CAPS has been widely applied as a “gold” standard for PTSD assessment along with SCID
demonstrating good psychometric properties18,56
. It provides more detailed information about
PTSD, including overall PTSD severity and frequency of the symptoms54
. Validation studies
and psychometric property analyses have been reported concerning CAPS’s performance in
various population groups57,58
.
SCID is another criterion standard for PTSD as well as depressive disorder diagnoses44,59
. SCID
is a semi-structured interview for making the major DSM-IV diagnoses55
and has been widely
used in validation studies18,23,26,36
. SCID-I represents one version that is designed for all DSM-
IV Axis I diagnoses, consisting of corresponding modules. It is designed to be administered by
appropriately trained health professionals60
. In comparison with CAPS, it is less structured, thus
its administration requires a thorough prior training by a specialist in the field.
Armenian Experience
The 1988 Spitak Earthquake (registering 6.9 on the Richter scale) that struck Northern part of
Armenia caused 25 000 deaths and left 700 000 people homeless. In Gyumri, the city with the
highest magnitude of losses, 7% of the entire population died, while 50% of the city was
9
destroyed61,62
. Since the earthquake, a number of epidemiological studies including a cohort
study with a number of follow-ups have been conducted among the survivors61-68
. However,
notwithstanding the number of instruments that have been employed in the investigations to
measure PTSD and depressive disorders among the survivors, only one of the studies has
diagnostic accuracy data for PTSD Reaction Index scale in this population69
. No criterion
validity studies of PTSD Checklist or CES-D scale yielding clinically validated measures have
been conducted in Armenia so far, regardless of their application in the most recent follow-up
study of the cohort (“personal communication with V. Khachadourian and A. Demirchyan”,
American University of Armenia, Center for Health Services Research and Development).
Meanwhile, as discussed above, without population-specific data it becomes a challenge to make
inferences about the accuracy and operating characteristics of a screening test applicable in a
given setting.
STUDY AIM AND OBJECTIVES
Based on the literature review provided above, which indicates variations of optimal cutoff
scores and diagnostic characteristics of the screening tests within and between population
groups, this study was conducted with the aim to investigate the diagnostic accuracy of the
Armenian versions of PCL-C and CES-D modified versions (16 item scale vs. 20 item scale with
negatively restated Positive Affect items) among 1988 Spitak earthquake survivors.
The specific objectives of the study were:
1.1 Assess diagnostic characteristics of Armenian translated PCL-C in relation to SCID-I PTSD
module (Criteria A, B, C, D, E )
Evaluate the area under the receiver operating characteristic (ROC) curve
10
Assess the sensitivity, specificity, positive and negative predictive values, likelihood
ratios and diagnostic efficiency of PCL-C at different cutoff scores
Assess the level of agreement between PCL-C and SCID
Compare PCL-C with SCID for symptom clusters (Criteria B, C, D)
1.2 Recommend an optimal cutoff score for PCL-C for the target population
1.3 Compare the diagnostic efficiency of the PCL-C in relation to the SCID based on two
different scoring procedures (dichotomized sum score vs. symptom cluster scoring).
2.1 Assess diagnostic characteristics of Armenian modified versions of CES-D (16 and 20 item
scales with negatively restated positive affect items) in relation to SCID-I Major Depressive
Episode module (Criterion A)
Evaluate the areas under the ROC curves
Assess the sensitivity, specificity, positive and negative predictive values, likelihood
ratios and diagnostic efficiency of CES-D (16) and CES-D (20) at different cutoff scores
Assess the level of agreement between both versions of CES-D and SCID
2.2 Recommend optimal cutoff scores for CES-D (16) and CES-D (20) for the target population
2.3 Compare the diagnostic accuracies of the CES-D (16) vs. CES-D (20)
METHODOLOGY
Study Design, Setting and Population
The study was a cross-sectional quantitative analysis conducted in the city of Gyumri among
1988 Spitak earthquake survivors. People aged 39 and older who were living in Gyumri during
1988 earthquake witnessing the disaster comprised the study population. Eligible participants
were chosen according to the following inclusion criteria:
11
People aged 39 and older; this age choice ensured that the participants were at least 14
years old in 1988, thus, they were expected to remember the traumatic event and be able
to provide appropriate reflections for PTSD diagnosis; meanwhile this age category was
selected in prior studies of the earthquake region, which in its turn ensured the
comparability of the data with those studies61-68
(“personal communication with V.
Khachadourian and A. Demirchyan”, American University of Armenia, Center for Health
Services Research and Development).
People who lived in Gyumri during 1988 earthquake and witnessed the disaster.
Those who could not freely communicate nor read Armenian were excluded from the study.
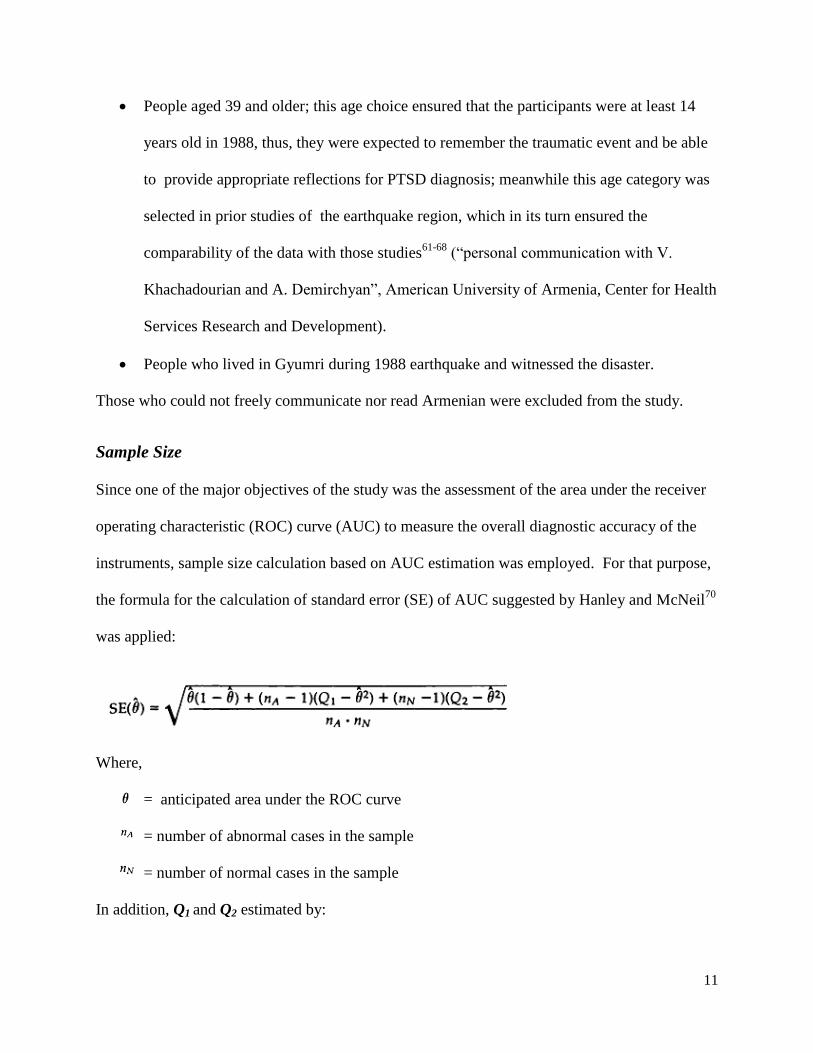
Sample Size
Since one of the major objectives of the study was the assessment of the area under the receiver
operating characteristic (ROC) curve (AUC) to measure the overall diagnostic accuracy of the
instruments, sample size calculation based on AUC estimation was employed. For that purpose,
the formula for the calculation of standard error (SE) of AUC suggested by Hanley and McNeil70
was applied:
Where,
= anticipated area under the ROC curve
= number of abnormal cases in the sample
= number of normal cases in the sample
In addition, Q1 and Q2 estimated by:

12
Previous studies conducted on the same target population in the region and a bulk of validation
studies of the instruments conducted on various population subgroups provided all of the
assumed information needed for the sample size calculation. Based on the last follow-up data
(“personal communication with V. Khachadourian and A. Demirchyan”, American University of
Armenia, Center for Health Services Research and Development), the proportion of individuals
in the cohort with depression was estimated to be around 0.25, while PTSD ranged from 0.15 to
0.25 depending on the cutoff score used. In addition, a twenty-year follow-up study conducted
by Najarian and colleagues71
revealed a probable rate of PTSD among 1988 Earthquake
survivors of 0.21. Literature suggests various estimates for area under ROC curve for PCL-C
ranging from 0.84-0.9822,26,31
and CES-D- from 0.88 to 0.9472,73
. Table 1 displays different
assumed standard error scenarios with the application of different estimates of AUC, prevalence
and sample size. The sample size calculation with the smallest standard error is most preferable.
In this regard, AUC for Armenian population was anticipated to be 0.84 and above. For sample
size calculation, an AUC estimate of 0.88 (a balance between literature and feasibility issues)
was applied. Based on all of the above, a sample size of 105 (with nA=26, nN=79 derived from
an anticipated 25% prevalence of the conditions) and AUC estimate of 0.88 yielded a standard
error of 0.046 (see Table 1). After adjusting for homogeneity effect (1.2) due to cluster sampling
design, the final sample size was calculated as 126.
Sampling Frame and Sampling Strategy
For the recruitment of the study participants in Gyumri, a two-stage cluster sampling strategy
(probability proportional to size) was applied based on considerations of feasibility and rigor. At

13
the first stage, clusters were randomly chosen from 81 districts (electoral districts) of Gyumri
with probability proportional to size. Subsequently, starting points for each of the clusters were
randomly chosen within the districts using election lists of the Republic of Armenia. With the
sample size of 126, and the chosen feasible cluster size of 9, 14 clusters were included in the
study.
Study Procedure
For each cluster (electoral district), the interviewers found the randomly chosen starting address,
building and apartment number. The main direction for finding the appropriate respondent was
always moving right/up. When no more eligible respondent could be found in the building, the
interviewers moved right to find the next building. If the interviewers reached the end of the
street, they continued looking for the respondent in the street adjacent to the one that was
assigned. The first attempt of the survey/interview was the starting address. Interviewers
completed “Journal forms” (see Appendix 2) for each cluster to assess the response rate.
Introduction to the household and selection of the respondent from a household was conducted in
accordance with the screening form protocol (see Appendix 3). Subsequent selection of
households to complete 9 required interviews per cluster depended on whether a completed
survey/interview was obtained from the previous household or not:
If the visit to the prior household resulted in a completed survey/interview, the
interviewers passed by the next four households moving always to the right/up from the
prior household and attempted the fifth household.
If the attempt in the prior household was not successful (refusal, no eligible respondent,
incomplete survey/interview, etc.), the interviewers attempted the next household on the
right/up to the prior without skipping any households.

14
If four consecutive interviews were completed with females in the cluster, interviewers
chose a male respondent, if there was an option in the next household. However, the
female respondent was approached if there was no eligible male in the next household.
If positive feedback was received after the introduction of the study to the household, the 2
interviewers conducting the survey/interview entered the household. The eligible participant was
then introduced to the research purposes and consented to participate. Data collection was
organized in two sessions: first, the interviewer gave instructions and kept track of the self-
administration of the PCL-C and CES-D instruments. Next, the interviewer (a psychologist with
specific training in SCID PTSD and Mood Episode modules’ administration) who stayed
completely blind to the procedure and the instrument completion results, rated the participant
using SCID diagnostic interview (after he/she completed the two self-administered scales). The
mean duration of SCID Modules’ administration was 22 minutes, ranging from 5 minutes to 1
hour depending on the case severity.
Study Instruments
The following instruments were used in the study (see Appendix 4):
Armenian version of PTSD Checklist - Civilian (PCL-C)20
Armenian modified version of Center for Epidemiologic Studies Depression (CES-D)
scale41
(with negatively restated questions)
Structured Clinical Interview for DSM Axis I Disorders Research version Non-patient
edition (SCID-I/NP): PTSD and Mood Disorders Modules
SCID-I Research Version Non-Patient edition was used as the “reference standard” for PTSD
and Major Depressive Episode assessments. A 2nd
year public health graduate student with a
background in psychology was trained in accordance with the training package offered by the

15
Biometrics Research Department of the Columbia University Medical Center74
in both PTSD
and MDE modules’ administration prior to data collection.
Statistical Analysis
Data were analyzed using Stata version 10 and MedCalc statistical software packages.
Diagnostic characteristics of the instruments including sensitivity (proportion of those with the
disorder correctly identified by the test), specificity (proportion of those without the disorder
correctly identified by the test), positive predictive value (proportion of those having the disorder
of those testing positive), negative predictive value (proportion of those not having the disease
from those testing negative), likelihood ratios (how much a test result changes the odds of having
the disease), diagnostic efficiency (proportion of those correctly identified by the test), calculated
using the base rate (true prevalence rate measured via the reference standard), and the Youden
index J (estimated as [Sensitivity +Specificity-1] at any observed score) were calculated for the
instruments in comparison with SCID modules. The optimal cutoff scores were chosen based on
the point corresponding to the maximum value of the Youden index. Bias-corrected and
accelerated bootstrapping (BCa, with 10000 iterations) was used to calculate 95% confidence
intervals for Youden indices75
. Weighted kappa coefficients (Κ (0.5)) were calculated to
measure the level of agreement of the instruments with SCID providing equal values to
sensitivity and specificity (Κ (0.5)). Values for kappa were summarized according to the Landis
and Koch magnitude categorization76
.
Internal consistency of the scales was calculated based on Cronbach’s α statistic. Two-sided
confidence intervals for Cronbach’s α coefficient were calculated according to the formula
suggested by Feldt and collegues77,78
. Item level analysis (corrected item-total correlations and
16
Cronbach’s α if item deleted) was conducted to test the CES-D (20) item fit with negatively
restated Positive Affect items.
Agreement between PCL-C and SCID was investigated (Cohen’s kappa statistic) for each of the
three symptom clusters in DSM-IV (at least 1 B item, 3 C items and at least 2 D items).
Symptoms rated as “Moderately” or above (responses 3 through 5 in PCL-C) were counted as
present21
.
Nonparametric receiver operating characteristic (ROC) curve analysis was conducted to
determine the areas under the ROC curves (AUC). The nonparametric choice was justified by
skewed test values79
for CES-D (16) in non-diseased group (skewness=0.87, kurtosis=3.35) and
for PCL-C in diseased (skewness=0.58, kurtosis=2.45). AUC is a single global metrics that
assesses the discriminative performance of the test. Standard errors for AUCs were calculated in
accordance with Hanley and McNeil’s approach70
. In addition, separate ROC curves were
generated for gender and age groups. Age was dichotomized at the mean of the sample (<56
years old and ≥56 years old). Differences in test performance between the demographic groups
were statistically compared using the method suggested by Delong80
.
Principal component analysis (PCA) with Quartimax rotation was conducted to explore the
factor structure of CES-D 20 with negatively restated Positive Affect items, in particular – to
check whether these four items still measure a single construct – (lack of) Positive
Affect/Anhedonia (what they are originally intended for).
ETHICAL CONSIDERATIONS
The study project was reviewed and approved by the Institutional Review Board #1 Committee
on Human Research at the American University of Armenia.

17
All study participants were willing to participate and gave oral informed consent. Since the
study involved diagnostic interviews, participants with threshold or sub-threshold diagnoses of
PTSD or Major Depressive Episode were provided with a list of free of charge treatment options
and referrals in Gyumri. For the latter, prior arrangements with the Gyumri Mental Health
Center were made.
RESULTS
Sample Characteristics
Overall, it took 708 attempts to complete 126 interviews (see Figure 1). Of those, 277 resulted in
either no one at home or an unoccupied house. Out of the remaining 431 attempts, 75 refused
without providing information about the number of eligible participants in the household, and 60
were ineligible. Overall, 296 eligible participants were found and asked to participate. Of those,
126 completed the interviews (43%), 75 (25%) refused to participate due to various reasons (e.g.
busy at home/with the children, not in the mood, etc.); 42 (14%) were unable to participate due
to poor health conditions, 52 (18%) selected eligible participants were not at home and one
interview was left incomplete with the available data only for CES-D scale and SCID MDE
module.
The total sample of 127 participants (including 1 incomplete interview) consisted of ethnic
Armenians only. The majority of the sample was female (75.6%), married (66.9%) with
University (33.9%) or professional/technical (30.7%) education. The mean age of the
participants was 55.7 years. The demographic information as a function of gender is displayed
in Table 2. Males were more likely to be married than females (83.9% vs. 61.4%, χ2(1) = 5.32,
p=0.02), less likely to be widowed than females (9.7% vs. 32.3%, χ2(1) = 6.11, p=0.01) and more

18
likely to be employed than females (45.2% vs. 17.7%, χ2(1) = 9.57, p=0.002). There was no
statistically significant difference between genders in age and education level. Females had
statistically significantly higher PCL-C mean score compared to males (t=2.21, p=0.03). No
statistically significant difference was observed between genders in CES-D (16) or CES-D (20)
mean scores.
Results of the SCID revealed that 33 participants out of 126 screened (26.2%) met criteria for
current PTSD diagnosis (Criteria A, B, C, D, E). Females were more likely to have PTSD
diagnosis than males (32.6% vs. 6.5%, χ2(1) = 8.29, p = 0.004).
On the other hand 36 participants out of 127 screened (28.4%) met criteria for current major
depressive episode (Criteria A). There was no statistically significant difference between
genders in current MDE status. Comorbidity of current PTSD and current MDE was present
among 24 participants (19%). Of those diagnosed with current PTSD, the most commonly
reported trauma was 1988 Spitak earthquake- related trauma (n=21; 63.6%), followed by the loss
of a close person that was not related to the earthquake (n = 9; 27.3%).
Performance of PCL-C
Internal consistency of the PCL-C total scale was good with Cronbach’s α=0.861 (95%
CI=0.825-0.894). Internal consistency for PCL-C clusters B, C, D were acceptable (α=0.807,
95% CI=0.749-0.850; α=0.724, 95% CI=0.644-0.790; α=0.737, 95% CI =0.658-0.803,
respectively). The mean score on the PCL-C for the entire sample was 44.4 (SD=12.8).
Participants with current PTSD had a mean score on PCL-C of 57.1 (SD=6.6), which was
statistically significantly (t=10.4; p=0.000) higher than the mean score of 39.9 (SD=11.4) of
participants with no PTSD diagnosis. Figure 2 depicts the ROC curve for the PCL-C compared
with the diagnosis of current PTSD based on SCID (Criteria A, B, C, D, E). PCL-C performed

19
well in the study population, resulting in an AUC of 0.903 (SE = 0.026; asymptotic 95% CI =
0.852- 0.953, z=15.58, p<0.0001). Table 4 presents operating characteristics for PCL-C.
Findings indicated that PCL-C cutoff score of 50 resulted in the highest diagnostic efficiency
(0.84) with 0.94 sensitivity (95% CI=0.80-0.99) and 0.81 (95% CI=0.71-0.88) specificity at the
given base rate of 26.2%. At the same time, the cutoff score of 50 corresponded to the point of
highest Youden index (J= 0.75, 95% CI=0.63-0.83) and the highest agreement after adjusting for
chance agreement (Κ (0.5) = 0.65, 95% CI= 0.51 - 0.78). Repeating the analysis excluding
participants with current MDE from non-PTSD group did not affect the optimal cutoff score of
50 or its diagnostic characteristics. Using the cutoff score of 50, the estimated PTSD prevalence
was 38.9%. The latter overestimated the SCID defined prevalence by 12.7%. Moving the cutoff
score to 54, prevalence estimate became equivalent to the base rate (26.2%).
The agreement with SCID was calculated to be moderate for the avoidance cluster (K(0.5) (95%
CI) = 0.42 (0.27-0.57), sensitivity=0.88, specificity=0.60, PPV=0.55, NPV=0.90; diagnostic
efficiency=0.70), slight for the re-experiencing (K(0.5) (95% CI) = 0.31 (0.08-0.53),
sensitivity=0.96, specificity=0.29, PPV=0.82, NPV=0.60, diagnostic efficiency=0.84) and the
hyper arousal clusters (K(0.5) (95% CI) = 0.37 (0.22-0.53), sensitivity=0.87, specificity=0.51,
PPV=0.62, NPV=0.82; diagnostic efficiency=0.68).
Scale Characteristics of CES-D (20) with Negatively Restated Positive Affect Items
Table 3 presents means, standard deviations, corrected item-total correlations and Cronbach’s α
for items on the CES-D (20) with negatively restated positive affect items. Internal consistency
of the CES-D (20) total scale was slightly higher (Cronbach’s α=0.911, 95% CI= 0.887-0.932)
than the internal consistency of CES-D (16) (Cronbach’s α=0.879, 95% CI=0.846-0.908). Three
of the four negatively restated items in CES-D (20) had high corrected correlations with the total
20
scale and their deletion would result in a lower Cronbach’s α value for the total scale. However,
negatively restated item 4, “not as good as others” was a relatively poor fit to the scale
demonstrating lower mean score than other items, low corrected correlation with the whole scale
and its deletion would not impact the internal consistency of the total scale at all. On the other
hand, items of inter-personal relations (items 15 and 19) also demonstrated relatively poor fit to
the total scale with low corrected item-total correlations; meanwhile deletion of item 15 resulted
in higher internal consistency of the total scale, while deletion of item 19 did not affect the
internal consistency of the total scale at all.
Notwithstanding sample size limitations, PCA with Quartimax rotation demonstrated that items
4, 8, 12 and 16 (negatively restated Positive Affect items) did not construct a separate factor of
the (lack of) Positive Affect: rather, items 8, 12 and 16 showed high loadings on the combined
depressed affect/somatic factor (factor loadings > 0.50) as suggested by Demirchyan and
colleagues81
. Item 4 did not load high on any of the factors identified for CES-D Armenian.
Performance of CES-D (16) and CES-D (20) with Negatively Restated Positive Affect
Items
CES-D (16) mean score among individuals with current Major Depressive Episode (mean score
25.4, SD=7.1) was statistically significantly higher (t=8.83, p=0.000) compared to the ones with
no current MDE (mean score 11.4, SD=8.4). CES-D (20) mean score among individuals with
current Major Depressive Episode (mean score 31.6, SD=8.8) was statistically significantly
higher (t=9.05; p=0.000) compared to the ones with no current MDE (mean score 14.0,
SD=10.3). Figures 3 and 4 show ROC curves for the CES-D (16) and CES-D (20) compared to
the reference standard (SCID, Criteria A). Both CES-D (16) and CES-D (20) performed well,
with AUCs of 0.895 (SE=0.027, asymptotic 95% CI 0.842 - 0.948, z=14.57, p<0.0001) and

21
0.902 (SE=0.026, asymptotic 95% CI= 0.851 - 0.953, z=15.48, p<0.0001), respectively. Tables
5 and 6 present diagnostic characteristics for CES-D (16) and CES-D (20). The optimal cutoff
score corresponding to the highest Youden index was 19 for CES-D (16) (J=0.67, 95% CI=0.54-
0.75) with sensitivity of 0.86 (95% CI=0.71-0.95) and specificity of 0.81 (95% CI=0.72-0.89).
The optimal cutoff score for CES-D (20) with the highest Youden index (J=0.70, 95% CI=0.57-
0.77) was 21 with sensitivity of 0.92 (95% CI=0.78-0.98) and specificity of 0.78 (95% CI=0.68-
0.86). In both cases, the diagnostic efficiencies for the cutoffs were high (0.83 for CES-D (16)
and 0.82 for CES-D (20)) given the base rate of 28.4%. The Cohen’s weighted kappa for the
cutoff scores was 0.61 (95% CI 0.47-0.76) for both versions of CES-D. The cutoff score of 19
for CES-D (16) yielded 37.8% estimated prevalence of MDE, which overestimated the SCID
defined base rate by 9.4%. The cutoff score of 21 for CES-D (20) yielded 41.7% estimated
prevalence of MDE which overestimated the SCID defined base rate by 13.3%.
In order to be close to the SCID defined prevalence estimates, cutoffs need to be shifted from 19
to 21 for CES-D (16) and from 21 to 26 for CES-D (20) (prevalence estimates become 29.9%
and 29.1 % for CES-D (16) and CES-D (20), respectively).
In addition, cutoffs corresponding to the highest diagnostic efficiency criterion were 20 and 26
for CES (16) and CES-D (20), respectively, given the base rate of 28.4%.
ROC analysis used to compare the performance of CES-D (16) vs. CES-D (20) with negatively
restated positive affect items did not detect any significant difference between the AUCs (χ2(1) =
0.83, p=0.36).
AUC Comparisons by Gender and Age
ROC analyses were also performed to examine differences in the performance of the instruments
by sex and age (see Table 7). No significant differences in the performance of PCL-C, CES-D

22
(16) or CES-D (20) were found as a function of age. AUCs for the PCL-C and CES-D (20) as a
function of gender did not demonstrate statistically significant difference. However, there was a
significant difference in the performance of CES-D (16) between males and females. The AUC
of 0.967 (SE=0.03, asymptotic 95% CI 0.907-1.000, z=14.89, p<0.0001) for males was
significantly higher compared to the AUC of 0.865 (SE=0.04, asymptotic 95% CI 0.795-0.935,
z=10.18, p<0.0001) for females (see Figure 5).
DISCUSSION
The findings in this study support the use of the Armenian version of PCL-C as an accurate self-
report measure for PTSD symptom identification among Armenians with known trauma history.
Based on the data, the initially recommended cutoff score of 5020
that was subsequently proven
to be optimal on various populations 24,27
was optimal and most efficient in the population of
1988 Spitak earthquake survivors corresponding to a sensitivity of 0.94 and a specificity of 0.81
with the base rate of 26.2% and equal values placed on the false negatives and false positives.
However, the chosen cutoff overestimated the SCID defined prevalence rate by 12.7%. This
finding is consistent with the notion discussed by Terhakopian and colleagues40
that, in the case
of low prevalence rates, higher cutoffs will need to be applied to obtain prevalence estimates
closest to the truth. As in our findings, shifting the cutoff to 54 yielded the closest estimate to
the SCID defined prevalence of 26.2%.
Hereby, the cutoff score that a researcher will choose to apply in a given setting will depend
upon the importance and costs associated with false positives and false negatives, as well as upon
the study aims and interests. Since the base rate in the population highly affects the estimated
prevalence and the diagnostic efficiency of the instrument18
, researchers might want to choose

23
cutoff scores other than 50 in order to minimize the misclassifications and have closer estimates
to the true prevalence in settings with a base rate other than 26.2%.
As suggested by McDonald and colleagues36
an attempt was made to see whether the exclusion
of participants with co-morbid conditions in the comparison group (i.e. non-PTSD cases, who
had MDE in the study) would affect the discriminative performance of PCL-C. In accordance
with the findings from Hudson and colleagues28
the exclusion of those observations did not
affect the optimal cutoff score or the diagnostic characteristics of PCL-C. Consistent with a
number of international studies the agreement between self-administered PCL-C and SCID was
substantial18,23,25,56
. However, in comparison with a dichotomized sum score of 50, the
instrument performed poorer and demonstrated lower agreements when using symptom cluster
scoring technique (moderate for avoidance and slight for re-experiencing and hyper arousal
clusters).
Both CES-D (16) and CES-D (20) with negatively restated positive affect items demonstrated
acceptable internal consistency for the total score (Cronbach’s α=0.911 and 0.879, respectively).
As displayed in the Result section, the four restated items did not construct a separate factor of
the (lack of) Positive Affect/Anhedonia, while 3 of them (items 8, 12 and 16) loaded high on the
depressive/somatic affect factor and item 4 did not load high on any of the factors as identified
by Demirchyan and colleagues81
. In addition, items 4 (restated item “not as good as other”), 15
(“unfriendly people”) and 19 (“people disliked”) demonstrated relatively low corrected item-total
correlations. Items 15 and 19 had low corrected item-total correlations in the study by
Demirchyan and colleagues81
as well. This finding is consistent with recent discussions in the
field suggesting that “socially-focused” items (i.e. items 15 and 19) in the CES-D should be
omitted from the scale82-84
.

24
The results demonstrated that both of the Armenian versions of CES-D (20) with negatively
restated positive affect items and CES-D (16) are valid screening tools for major depressive
symptomatology identification in the population of 1988 Spitak earthquake survivors. The most
optimal cutoff score for CES-D (16) was 19 with sensitivity of 0.86 and specificity of 0.81, while
the most optimal cutoff for CES-D (20) was 21 with sensitivity of 0.92 and specificity of 0.78
with equal weights for false positives and false negatives. Thus, in both cases the optimal cutoffs
well exceeded the conventional CES-D cutoff score of 16 originally suggested by Radloff 41
.
These findings are consistent with a number of publications demonstrating optimal cutoff scores
higher than 16 for various cultural and demographic groups46,50,51,59,85
. As in case of PCL-C with
a base rate other than 28.2%, the choice of the cutoff in a given situation, however, might differ
to meet the highest diagnostic efficiency criteria and/or the need for estimates closer to the true
prevalence.
Both versions of CES-D had substantial agreement with SCID at their optimal cutoff scores. The
comparison of AUCs for CES-D (16) and CES-D (20) were not significantly different, thus not
depicting any difference in their diagnostic performance.
The AUC comparisons conducted by demographic groups revealed a statistically significant
difference in CES-D (16) performance between males and females. CES-D (16) performed
better in the group of males compared to females. Comparison with other studies concerning the
performance of CES-D in males vs. females cannot be made, since other studies did not examine
CES-D performance by gender.
STUDY STRENGHTS AND LIMITATIONS
This study was designed and conducted in accordance with the Standards for Reporting of
Diagnostic Accuracy (STARD) requirements addressing all the topics and items highlighted in

25
STARD checklist16
. The study sample size was calculated based on the AUC estimation.
However, the study had several limitations:
The participation rate of 52% among the eligible participants contacted might pose challenges
for the generalizability of findings interfering with a variety of spectrum affects. On the other
hand, the findings might not be generalizable to other demographic groups in Armenia, since
changes in the spectrum characteristics will alter diagnostic characteristics of the instruments.
Another limitation of the study was that the sample size of 127 did not allow the derivation of
precise internal validity measures for the scales nor the development of an accurate factor
structure for the CES-D (20) with negatively restated Positive Affect items. Moreover, the
sample size of 127 with 96 females and 31 males might not be sufficient to make definite
conclusions about the difference of diagnostic performance of CES-D (16) between genders.
However, the last two points were not among the main objectives when designing the study.
CONCLUSIONS AND RECOMMENDATIONS
Based on the study results several conclusions can be made:
Armenian version of PCL-C is an accurate tool for identifying PTSD symptomatology
among Armenians with a trauma history
The most optimal and most efficient cutoff score for PCL-C among 1988 earthquake
survivors is 50 with equal values placed on sensitivity and specificity and a base rate of
26.2%
The scoring procedure of PCL-C using a dichotomized sum score is more efficient for the
Armenian population compared to symptom cluster scoring technique
26
The Armenian versions of CES-D (16) and CES-D (20) with negatively restated Positive
Affect items are valid tools to measure major depression symptomatology in Armenian
population
The most optimal cutoff score for Armenian CES-D (16) is 19 and 21 for CES-D (20)
among 1988 Spitak earthquake survivors with equal values placed on sensitivity and
specificity
CES-D (16) and CES-D (20) do not differ significantly in their diagnostic performance
Negatively restated Positive Affect items do not construct a separate factor of the (lack
of) Positive Affect/Anhedonia and thus might not have practical application
CES-D (16) performs better among males in the Armenian population than among
females
Taking into consideration the study limitations, the study recommends conducting larger scale
diagnostic accuracy studies of the instruments for different demographic groups and subgroups
within the Armenian population to have “psychometrically sound” instruments applicable for
various settings. In addition, it will be preferable to investigate AUC differences of CES-D (16)
between genders on a larger sample in order to see whether gender needs to be factored into
cutoff score selection when using the instrument in the Armenian population.
27
REFERENCES
1. Kessler RC, Aguilar-Gaxiola S, Alonso J, et al. The global burden of mental disorders: an
update from the WHO World Mental Health (WMH) surveys. Epidemiol Psichiatr Soc.
Jan-Mar 2009;18(1):23-33.
2. Somers JM, Goldner EM, Waraich P, Hsu L. Prevalence and incidence studies of anxiety
disorders: a systematic review of the literature. Can J Psychiatry. Feb 2006;51(2):100-
113.
3. Waraich P, Goldner EM, Somers JM, Hsu L. Prevalence and incidence studies of mood
disorders: a systematic review of the literature. Can J Psychiatry. Feb 2004;49(2):124-
138.
4. Wittchen HU, Jacobi F. Size and burden of mental disorders in Europe--a critical review
and appraisal of 27 studies. Eur Neuropsychopharmacol. Aug 2005;15(4):357-376.
5. Kessler R, C, Berglund P, Demler O, et al. Lifetime Prevalence and Age-of-Onset
Distributions of DSM-IVDisorders in the National Comorbidity Survey Replication. Arch
Gen Psychiatry. 2005;62:593-602.
6. Diagnostic and statistical manual of mental disorders, Text Revision. 4th ed. Washington
DC: American Psychiatric Association 2000.
7. Smith TC, Wingard DL, Ryan MA, Kritz-Silverstein D, Slymen DJ, Sallis JF. PTSD
prevalence, associated exposures, and functional health outcomes in a large, population-
based military cohort. Public Health Rep. Jan-Feb 2009;124(1):90-102.
8. Kessler RC, Sonnega A, Bromet E, Hughes M, Nelson CB. Posttraumatic stress disorder
in the National Comorbidity Survey. Arch Gen Psychiatry. Dec 1995;52(12):1048-1060.
9. Resnick HS, Kilpatrick DG, Dansky BS, Saunders BE, Best CL. Prevalence of civilian
trauma and posttraumatic stress disorder in a representative national sample of women. J
Consult Clin Psychol. Dec 1993;61(6):984-991.
10. Breslau N, Chase GA, Anthony JC. The uniqueness of the DSM definition of post-
traumatic stress disorder: implications for research. Psychol Med. May 2002;32(4):573-
576.

28
11. Neria Y, Nandi A, Galea S. Post-traumatic stress disorder following disasters: a
systematic review. Psychol Med. 2008;38:467-480.
12. Norris FH, Friedman MJ, Watson PJ, Byrne CM, Diaz E, Kaniasty K. 60,000 disaster
victims speak: Part I. An empirical review of the empirical literature, 1981-2001.
Psychiatry. Fall 2002;65(3):207-239.
13. Breslau N. Outcomes of Posttraumatic Stress Disorder. J Clin Psychiatry.
2001;62(17):55-59.
14. Marcus M, Yasamy M, T, van Ommeren M, Chisholm D, Saxena S. Depresion: Global
Public Health Concern: WHO, Department of Mental Health and Substance Abuse;2012.
15. Andrews G, Brugha T, Thase ME, Duffy FF, Rucci P, Slade T. Dimensionality and the
category of major depressive episode. Int J Methods Psychiatr Res. 2007;16 Suppl 1:S41-
51.
16. Bossuyt PM, Reitsma JB, Bruns DE, et al. Towards complete and accurate reporting of
studies of diagnostic accuracy: the STARD initiative. Fam Pract. Feb 2004;21(1):4-10.
17. Whiting P, Rutjes AW, Reitsma JB, Bossuyt PM, Kleijnen J. The development of
QUADAS: a tool for the quality assessment of studies of diagnostic accuracy included in
systematic reviews. BMC Med Res Methodol. Nov 10 2003;3:25.
18. McDonald SD, Calhoun PS. The diagnostic accuracy of the PTSD checklist: a critical
review. Clin Psychol Rev. Dec 2010;30(8):976-987.
19. Haynes S, N, , Richard D, C, S, Kubany E, S. Content validity in psychological
assessment: A functional approach to concepts and methods. Psychol Assess. Sep
1995;7(3):238-247.
20. Weathers F, W , Litz B, T, Herman D, S, Huska JA, Keane T, M. The PTSD Checklist
(PCL): Reliability, validity, and diagnostic utility. . Paper presented at: 9th Annual
Conference of the ISTSS1993; San Antonio, TX.
21. Using the PTSD Checklist (PCL). National Center for PTSD 2012;
http://www.ptsd.va.gov/professional/pages/assessments/ptsd-checklist.asp Accessed
December 20, 2013.

29
22. Keen SM, Kutter CJ, Niles BL, Krinsley KE. Psychometric properties of PTSD Checklist
in sample of male veterans. J Rehabil Res Dev. 2008;45(3):465-474.
23. Hem C, Hussain A, Wentzel-Larsen T, Heir T. The Norwegian version of the PTSD
Checklist (PCL): Construct validity in a community sample of 2004 tsunami survivors.
Nord J Psychiatry. Oct 2012;66(5):355-359.
24. Andrykowski MA, Cordova MJ, Studts JL, Miller TW. Posttraumatic stress disorder after
treatment for breast cancer: prevalence of diagnosis and use of the PTSD Checklist-
Civilian Version (PCL-C) as a screening instrument. J Consult Clin Psychol. Jun
1998;66(3):586-590.
25. Blanchard EB, Jones-Alexander J, Buckley TC, Forneris CA. Psychometric properties of
the PTSD Checklist (PCL). Behav Res Ther. Aug 1996;34(8):669-673.
26. Bliese PD, Wright KM, Adler AB, Cabrera O, Castro CA, Hoge CW. Validating the
primary care posttraumatic stress disorder screen and the posttraumatic stress disorder
checklist with soldiers returning from combat. J Consult Clin Psychol. Apr
2008;76(2):272-281.
27. Grubaugh AL, Elhai JD, Cusack KJ, Wells C, Frueh BC. Screening for PTSD in public-
sector mental health settings: the diagnostic utility of the PTSD checklist. Depress
Anxiety. 2007;24(2):124-129.
28. Hudson SA, Beckford LA, Jackson SD, Philpot MP. Validation of a screening instrument
for post-traumatic stress disorder in a clinical sample of older adults. Aging Ment Health.
Sep 2008;12(5):670-673.
29. Manne SL, Du Hamel K, Gallelli K, Sorgen K, Redd WH. Posttraumatic stress disorder
among mothers of pediatric cancer survivors: diagnosis, comorbidity, and utility of the
PTSD checklist as a screening instrument. J Pediatr Psychol. Dec 1998;23(6):357-366.
30. Walker EA, Newman E, Dobie DJ, Ciechanowski P, Katon W. Validation of the PTSD
checklist in an HMO sample of women. Gen Hosp Psychiatry. Nov-Dec 2002;24(6):375-
380.
31. Yeager DE, Magruder KM, Knapp RG, Nicholas JS, Frueh BC. Performance
characteristics of the posttraumatic stress disorder checklist and SPAN in Veterans
Affairs primary care settings. Gen Hosp Psychiatry. Jul-Aug 2007;29(4):294-301.

30
32. Cook JM, Elhai JD, Arean PA. Psychometric properties of the PTSD Checklist with older
primary care patients. J Trauma Stress. Aug 2005;18(4):371-376.
33. Forbes D, Creamer M, Biddle D. The validity of the PTSD checklist as a measure of
symptomatic change in combat-related PTSD. Behav Res Ther. Aug 2001;39(8):977-986.
34. Ransohoff DF, Feinstein AR. Problems of spectrum and bias in evaluating the efficacy of
diagnostic tests. N Engl J Med. Oct 26 1978;299(17):926-930.
35. Willis BH. Spectrum bias--why clinicians need to be cautious when applying diagnostic
test studies. Fam Pract. Oct 2008;25(5):390-396.
36. McDonald SD, Beckham JC, Morey RA, Calhoun PS. The validity and diagnostic
efficiency of the Davidson Trauma Scale in military veterans who have served since
September 11th, 2001. J Anxiety Disord. Mar 2009;23(2):247-255.
37. Furukawa TA, Guyatt GH. Sources of bias in diagnostic accuracy studies and the
diagnostic process. CMAJ. Feb 14 2006;174(4):481-482.
38. Whiting P, Rutjes AW, Reitsma JB, Glas AS, Bossuyt PM, Kleijnen J. Sources of
variation and bias in studies of diagnostic accuracy: a systematic review. Ann Intern Med.
Feb 3 2004;140(3):189-202.
39. Meehl P, E, Rosen A. Antecedent probability and the efficiency of psychometrric signs,
patterns or cutting scores Psychol Bull. 1955;52(3):194-216.
40. Terhakopian A, Sinaii N, Engel CC, Schnurr PP, Hoge CW. Estimating population
prevalence of posttraumatic stress disorder: an example using the PTSD checklist. J
Trauma Stress. Jun 2008;21(3):290-300.
41. Radloff L, S The CES-D scale: a self-report depression scale for research in the general
population. Appl. Psych. Meas. 1977;1:385 – 401.
42. Dozeman E, van Schaik DJ, van Marwijk HW, Stek ML, van der Horst HE, Beekman
AT. The center for epidemiological studies depression scale (CES-D) is an adequate
screening instrument for depressive and anxiety disorders in a very old population living
in residential homes. Int J Geriatr Psychiatry. Mar 2011;26(3):239-246.
31
43. Li Z, Hicks MH. The CES-D in Chinese American women: construct validity, diagnostic
validity for major depression, and cultural response bias. Psychiatry Res. Feb 28
2010;175(3):227-232.
44. Lowe B, Spitzer RL, Grafe K, et al. Comparative validity of three screening
questionnaires for DSM-IV depressive disorders and physicians' diagnoses. J Affect
Disord. Feb 2004;78(2):131-140.
45. Reuland DS, Cherrington A, Watkins GS, Bradford DW, Blanco RA, Gaynes BN.
Diagnostic accuracy of Spanish language depression-screening instruments. Ann Fam
Med. Sep-Oct 2009;7(5):455-462.
46. Wada K, Tanaka K, Theriault G, et al. Validity of the Center for Epidemiologic Studies
Depression Scale as a screening instrument of major depressive disorder among Japanese
workers. Am J Ind Med. Jan 2007;50(1):8-12.
47. Torres E. Psychometric Properties of the Center for Epidemiologic Studies Depression
Scale in African American and Black Caribbean US Adults. Issues Ment Health Nurs.
Oct 2012;33(10):687-696.
48. McDowell I. Measuring health: A guide to rating scales and questionnaires. 3rd ed:
Oxford University Press; 2006.
49. Dick R W, Beals J, Keane E M, Manson S M. Factorial structure of the CES-D among
American Indian adolescents. J Adolescence. 1994;17(1):73-79.
50. Cheng ST, Chan AC. The Center for Epidemiologic Studies Depression Scale in older
Chinese: thresholds for long and short forms. Int J Geriatr Psychiatry. May
2005;20(5):465-470.
51. Haringsma R, Engels GI, Beekman AT, Spinhoven P. The criterion validity of the Center
for Epidemiological Studies Depression Scale (CES-D) in a sample of self-referred elders
with depressive symptomatology. Int J Geriatr Psychiatry. Jun 2004;19(6):558-563.
52. Demirchyan A, Harutyunyan T, Petrosyan V, Thompson M, E Household Health Survey,
Baseline Evaluation Yerevan: American University of Armenia, Center for Health
Services Research and Development &USAID/Primary Health Care Reform
Project;2008.

32
53. Watson C, G, Klett W, G, Lorei T, W Toward an Operational Definition of Anhedonia
Psychol Rep. 1970;26:371-376.
54. Blake DD, Weathers FW, Nagy LM, et al. The development of a Clinician-Administered
PTSD Scale. J Trauma Stress. Jan 1995;8(1):75-90.
55. Spitzer RL, Williams JB, Gibbon M, First MB. The Structured Clinical Interview for
DSM-III-R (SCID). I: History, rationale, and description. Arch Gen Psychiatry. Aug
1992;49(8):624-629.
56. Weathers F, W, Ruscio A, M , Keane T, M. Psychometric properties of nine scoring rules
for the Clinician-Administered Posttraumatic Stress Disorder Scale Psychol Assesst.
1999;11:124-133.
57. Charney ME, Keane TM. Psychometric analyses of the Clinician-Administered PTSD
Scale (CAPS)--Bosnian translation. Cultur Divers Ethnic Minor Psychol. Apr
2007;13(2):161-168.
58. Schnyder U, Moergeli H. German version of Clinician-Administered PTSD Scale. J
Trauma Stress. Dec 2002;15(6):487-492.
59. Campo-Arias A, Díaz-Martínez L, A, Rueda-Jaimes G, E, del Pilar Cadena-Afanador L,
Hernández N, L. Psychometric properties of the CES-D scale among Colombian adults
from the general population. Rev. Colomb. Psiquiat. 2007;36(4):664-674.
60. Structured Clinical Interview for DSM Disorders (SCID). Biometrics Research
Department, Columbia University at NYSPI http://www.scid4.org/index.html. Accessed
March 2, 2013.
61. Armenian H, K, Morikawa M, Melkonian A, K, et al. Loss as a determinant of PTSD in a
cohort of adult survivors of the 1988 earthquake in Armenia: implications for policy.
Acta Psychiatr Scand. 2000;102:58-64.
62. Goenjian AK, Walling D, Steinberg AM, Roussos A, Goenjian HA, Pynoos RS.
Depression and PTSD symptoms among bereaved adolescents 6(1/2) years after the 1988
Spitak earthquake. J Affect Disord. Jan 2009;112(1-3):81-84.

33
63. Armenian HK, Morikawa M, Melkonian AK, Hovanesian A, Akiskal K, Akiskal HS.
Risk factors for depression in the survivors of the 1988 earthquake in Armenia. J Urban
Health. Sep 2002;79(3):373-382.
64. Goenjian AK, Noble EP, Walling DP, et al. Heritabilities of symptoms of posttraumatic
stress disorder, anxiety, and depression in earthquake exposed Armenian families.
Psychiatr Genet. Dec 2008;18(6):261-266.
65. Goenjian AK, Pynoos RS, Steinberg AM, et al. Psychiatric comorbidity in children after
the 1988 earthquake in Armenia. J Am Acad Child Adolesc Psychiatry. Sep
1995;34(9):1174-1184.
66. Goenjian AK, Steinberg AM, Najarian LM, Fairbanks LA, Tashjian M, Pynoos RS.
Prospective study of posttraumatic stress, anxiety, and depressive reactions after
earthquake and political violence. Am J Psychiatry. Jun 2000;157(6):911-916.
67. Armenian HK, Melkonian A, Noji EK, Hovanesian AP. Deaths and injuries due to the
earthquake in Armenia: a cohort approach. Int J Epidemiol. Aug 1997;26(4):806-813.
68. Khachadourian V. Risk Factors and Outcomes of Post-Traumatic Stress Disorder and
Comorbid Mental Disorders among 1988 Spitak Earthquake Survivors Yerevan: College
of Health Sciences, American University of Armenia; 2011.
69. Goenjian A K, Najarian L M, Pynoos R S, et al. Posttraumatic stress disorder in elderly
and younger adults after the 1988 earthquake in Armenia. Am J Psychiatry.
1994;151(6):895-901.
70. Hanley JA, McNeil BJ. The meaning and use of the area under a receiver operating
characteristic (ROC) curve. Radiology. Apr 1982;143(1):29-36.
71. Najarian LM, Sunday S, Labruna V, Barry I. Twenty-year follow-up of adults
traumatized during childhood in Armenia. J Affect Disord. Dec 2011;135(1-3):51-55.
72. Vazquez FL, Blanco V, Lopez M. An adaptation of the Center for Epidemiologic Studies
Depression Scale for use in non-psychiatric Spanish populations. Psychiatry Res. Jan 15
2007;149(1-3):247-252.
34
73. Yang HJ, Soong WT, Kuo PH, Chang HL, Chen WJ. Using the CES-D in a two-phase
survey for depressive disorders among nonreferred adolescents in Taipei: a stratum-
specific likelihood ratio analysis. J Affect Disord. Nov 1 2004;82(3):419-430.
74. Biometrics Research Department. Columbia Universiry Medical Center
http://scid.trainingcampus.net/UAS/Modules/TREES/windex.aspx. Accessed February
13, 2013.
75. Schisterman E, F, Perkins N. Confidence interval for Youden index and corresponding
optimal cut-point. Commun Stat-Simul C. 2007;36:549-563.
76. Landis JR, Koch GG. The measurement of observer agreement for categorical data.
Biometrics.1977;33(1):159-174.
77. Feldt L, S, Woodruff D, J, Salih F, A. Statistical inference for coefficient alpha. Appl
Psychol Meas. 1987;11:93-103.
78. Fan X, Thompson B. Confidence Intervals for Effect Sizes:Confidence Intervals about
Score Reliability Coefficients, Please: An EPM Guidelines Editorial. Educ Psychol Meas.
2001;61(4):517-531.
79. Kumar R, Indrayan A. Receiver Operating Characteristic (ROC) Curve for Medical
Researchers. Indian Pediatrics 2011;48:277-287.
80. DeLong ER, DeLong DM, Clarke-Pearson DL. Comparing the areas under two or more
correlated receiver operating characteristic curves: a nonparametric approach. Biometrics.
Sep 1988;44(3):837-845.
81. Demirchyan A, Petrosyan V, Thompson ME. Psychometric value of the Center for
Epidemiologic Studies Depression (CES-D) scale for screening of depressive symptoms
in Armenian population. J Affect Disord. Oct 2011;133(3):489-498.
82. Carleton R, N, Thibodeau M, A, Teale M, J, N, et al. The Center for Epidemiologic
Studies Depression Scale: A Review with a Theoretical and Empirical Examination of
Item Content and Factor Structure PLOS ONE. March 2013;8(3):e58067.
83. Stansbury JP, Ried LD, Velozo CA. Unidimensionality and bandwidth in the Center for
Epidemiologic Studies Depression (CES-D) Scale. J Pers Assess. Feb 2006;86(1):10-22.

35
84. Shafer A, B. Meta-analysis of the factor structures of four depression questionnaires:
Beck, CES-D, Hamilton, and Zung. J Clin Psychol. January 2006;62(1):126-146.
85. Cho M, J, Kim K, H. Use of the Center for Epidemiologic Studies Depression (CES-D)
Scale in Korea. J Nerv Ment Dis 1998;186(5):304-310
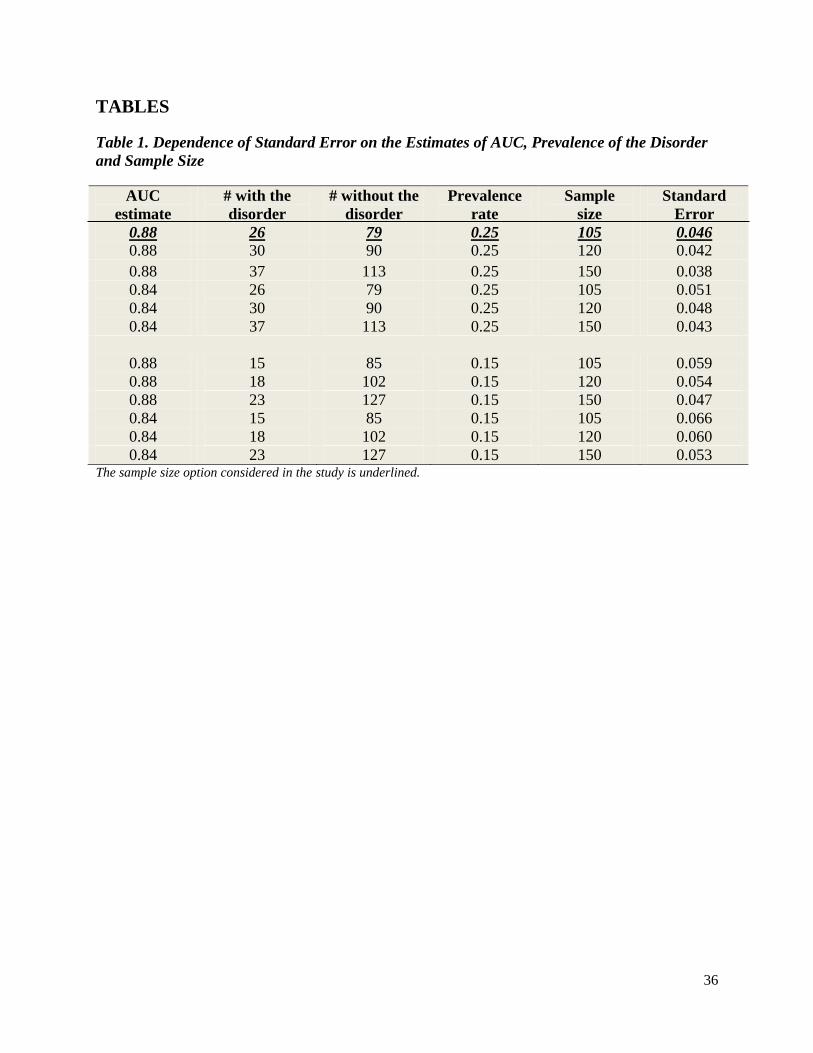
36
TABLES
Table 1. Dependence of Standard Error on the Estimates of AUC, Prevalence of the Disorder
and Sample Size
AUC
estimate
# with the
disorder
# without the
disorder
Prevalence
rate
Sample
size
Standard
Error
0.88 26 79 0.25 105 0.046
0.88 30 90 0.25 120 0.042
0.88 37 113 0.25 150 0.038
0.84
0.84
26
30
79
90
0.25
0.25
105
120
0.051
0.048
0.84 37 113 0.25 150 0.043
0.88
0.88
15
18
85
102
0.15
0.15
105
120
0.059
0.054
0.88 23 127 0.15 150 0.047
0.84
0.84
15
18
85
102
0.15
0.15
105
120
0.066
0.060
0.84 23 127 0.15 150 0.053 The sample size option considered in the study is underlined.

37
Table 2. Current PTSD and Current MDE Prevalence Rates and Demographic Characteristics
of the Analytical Sample by Gender
Female
sample
(n=96)
Male
sample
(n=31)
Total
sample
(n=127)
Current PTSD (SCID A, B, C, D, E Criteria; %)* 31 (32.6
1) 2 (6.5) 33 (26.2
2)
Current MDE (SCID A Criterion; %) 28 (29.2)
8 (25.8) 36 (28.4)
Current PTSD and Current MDE (SCID; %)* 22 (23.21) 2 (6.5) 24 (19.0
2)
Age
Mean (SD)
Range
55.7 (10.8)
39 - 80
55.5 (9.7)
41 - 76
55.7 (10.5)
39 - 80
Level of Education (%)
Less than 10 years of school
10 years of school
Professional/technical
University
Postgraduate
8 (8.3) 1 (3.2) 9 (7.1)
25 (26.0) 10 (32.3) 35 (27.5)
32 (33.3) 7 (22.6) 39 (30.7)
30 (31.3) 13 (41.9) 43 (33.9)
1 (1.0) - 1 (0.8)
Marital Status (%)
Single
Married *
Divorced
Widow *
4 (4.2) 2 (6.4) 6 (4.7)
59 (61.4) 26 (83.9) 85 (66.9)
2 (2.1) - 2 (1.6)
31 (32.3) 3 (9.7) 34 (26.8)
Employment status (%)
Employed*
Unemployed*
Working at home
Retired
17 (17.7) 14 (45.2) 31 (24.4)
46 (47.9) 7 (22.6) 53 (41.7)
3 (3.1) 1 (3.2) 4 (3.2)
30 (31.3) 9 (29.0) 39 (30.7)
Family’s general standard of living (self-reported; %)
Substantially below average
A little below average
Average
A little above average
Substantially above average*
31 (32.3) 13 (41.9) 44 (34.6)
19 (19.8) 3 (9.7) 22 (17.3)
38 (39.6) 11 (35.5) 49 (38.6)
7 (7.3) 1 (3.2) 8 (6.3)
1 (1.0) 3 (9.7) 4 (3.2)
Visited a mental health specialist (%)
Ever 7 (7.3) - 7 (5.5)
Never 89 (92.7) 31 (100) 120 (94.5)
PCL-C Score
Mean (SD)*
45.81 (12.2)
40.1(13.8)
44.42 (12.8)
CES-D(16) Score
Mean (SD)
16.3 (9.9)
12.6 (10.7)
15.4 (10.2)
CES-D(20) Score
Mean (SD)
20.2 (12.4)
15.2 (13.0)
19.0 (12.7)
Notes: MDE=major depressive episode 1 Calculated from a sample of 95 female respondents (one case was missing) 2 Calculated from a total sample of 126 respondents (one case was missing)
*Significant difference between genders, p<0.05 (based on χ² analysis for proportions and t-test analysis for means)
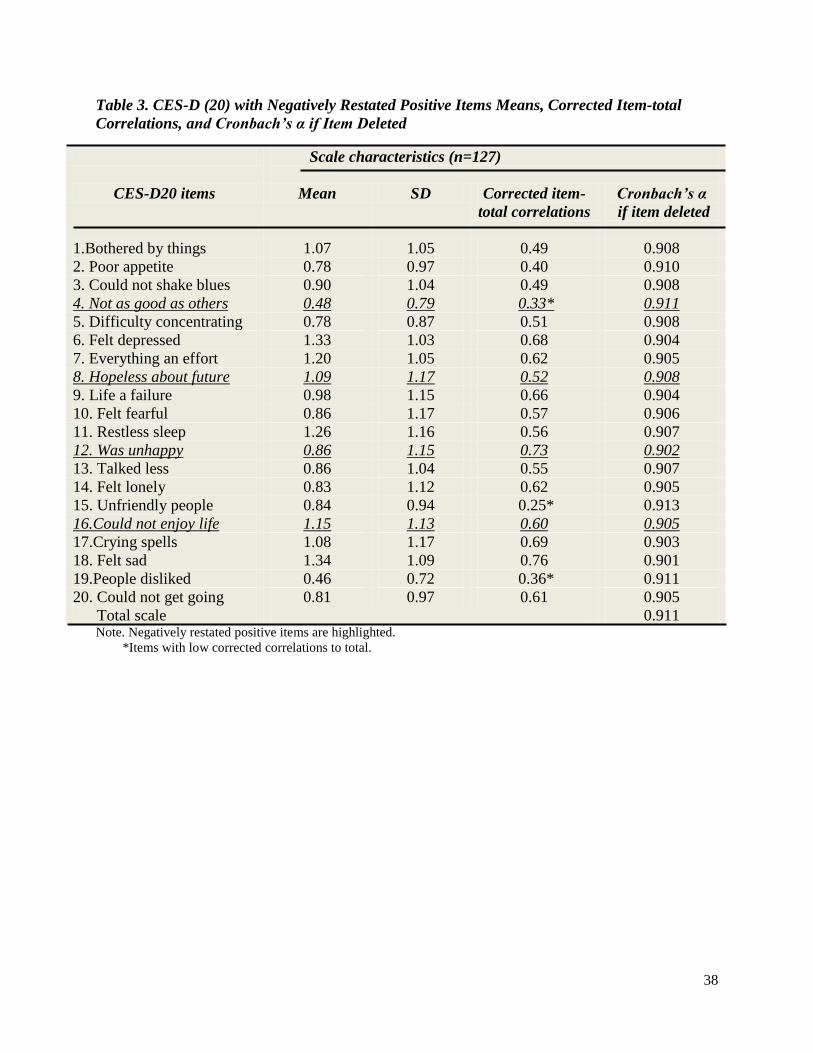
38
Table 3. CES-D (20) with Negatively Restated Positive Items Means, Corrected Item-total
Correlations, and Cronbach’s α if Item Deleted
Scale characteristics (n=127)
CES-D20 items Mean SD Corrected item-
total correlations
Cronbach’s α
if item deleted
1.Bothered by things 1.07 1.05 0.49 0.908
2. Poor appetite 0.78 0.97 0.40 0.910
3. Could not shake blues 0.90 1.04 0.49 0.908
4. Not as good as others 0.48 0.79 0.33* 0.911
5. Difficulty concentrating 0.78 0.87 0.51 0.908
6. Felt depressed 1.33 1.03 0.68 0.904
7. Everything an effort 1.20 1.05 0.62 0.905
8. Hopeless about future 1.09 1.17 0.52 0.908
9. Life a failure 0.98 1.15 0.66 0.904
10. Felt fearful 0.86 1.17 0.57 0.906
11. Restless sleep 1.26 1.16 0.56 0.907
12. Was unhappy 0.86 1.15 0.73 0.902
13. Talked less 0.86 1.04 0.55 0.907
14. Felt lonely 0.83 1.12 0.62 0.905
15. Unfriendly people 0.84 0.94 0.25* 0.913
16.Could not enjoy life 1.15 1.13 0.60 0.905
17.Crying spells 1.08 1.17 0.69 0.903
18. Felt sad 1.34 1.09 0.76 0.901
19.People disliked 0.46 0.72 0.36* 0.911
20. Could not get going 0.81 0.97 0.61 0.905
Total scale 0.911 Note. Negatively restated positive items are highlighted.
*Items with low corrected correlations to total.

39
Table 4. Diagnostic Characteristics of PCL-C by Cutoff Score
Cutoff Sensitivity Specificity Predictive Likelihood Efficiency Youden K
Score Value Ratio J (0.5)
+ - + -
17 1.00 0.00 0.26 - 1.00 - 0.26 0.00 0.00
18 1.00 0.01 0.26 1.00 1.01 0.00 0.27 0.01 0.01
20 1.00 0.02 0.27 1.00 1.02 0.00 0.28 0.02 0.01
21 1.00 0.03 0.27 1.00 1.03 0.00 0.29 0.03 0.02
23 1.00 0.07 0.28 1.00 1.07 0.00 0.31 0.07 0.04
24 1.00 0.09 0.28 1.00 1.09 0.00 0.33 0.09 0.05
25 1.00 0.11 0.28 1.00 1.12 0.00 0.34 0.11 0.06
26 1.00 0.12 0.29 1.00 1.13 0.00 0.35 0.12 0.07
27 1.00 0.15 0.30 1.00 1.18 0.00 0.37 0.15 0.09
28 1.00 0.19 0.31 1.00 1.24 0.00 0.41 0.19 0.11
29 1.00 0.22 0.31 1.00 1.27 0.00 0.42 0.22 0.13
30 1.00 0.23 0.31 1.00 1.29 0.00 0.43 0.23 0.13
32 1.00 0.24 0.32 1.00 1.31 0.00 0.44 0.24 0.14
34 1.00 0.32 0.34 1.00 1.48 0.00 0.50 0.32 0.20
35 1.00 0.34 0.35 1.00 1.53 0.00 0.52 0.34 0.22
36 1.00 0.36 0.36 1.00 1.55 0.00 0.52 0.36 0.22
37 1.00 0.40 0.37 1.00 1.66 0.00 0.56 0.40 0.26
38 1.00 0.43 0.38 1.00 1.76 0.00 0.58 0.43 0.28
40 1.00 0.44 0.39 1.00 1.79 0.00 0.59 0.44 0.29
41 1.00 0.47 0.40 1.00 1.90 0.00 0.61 0.47 0.32
42 1.00 0.51 0.42 1.00 2.02 0.00 0.64 0.51 0.35
43 1.00 0.56 0.45 1.00 2.27 0.00 0.68 0.56 0.40
44 1.00 0.59 0.47 1.00 2.45 0.00 0.70 0.59 0.43
45 1.00 0.63 0.49 1.00 2.74 0.00 0.73 0.63 0.48
46 1.00 0.67 0.52 1.00 3.00 0.00 0.75 0.67 0.51
47 1.00 0.71 0.55 1.00 3.44 0.00 0.79 0.71 0.56
48 0.97 0.72 0.55 0.99 3.47 0.04 0.79 0.69 0.56
49 0.94 0.80 0.62 0.97 4.60 0.08 0.83 0.74 0.63
50 0.94 0.81 0.63 0.97 4.85 0.08 0.84 0.75 0.65
51 0.85 0.82 0.62 0.94 4.64 0.19 0.83 0.67 0.60
52 0.79 0.83 0.62 0.92 4.58 0.26 0.82 0.62 0.57
53 0.67 0.86 0.63 0.88 4.77 0.39 0.81 0.53 0.52
54 0.64 0.87 0.64 0.87 4.93 0.42 0.81 0.51 0.51
55 0.58 0.88 0.63 0.85 4.87 0.48 0.80 0.46 0.47
56 0.52 0.90 0.65 0.84 5.32 0.54 0.80 0.42 0.45
57 0.46 0.90 0.63 0.82 4.70 0.60 0.79 0.36 0.39
58 0.42 0.94 0.70 0.82 6.58 0.62 0.80 0.36 0.41
59 0.36 0.95 0.71 0.81 6.76 0.67 0.79 0.31 0.37
60 0.30 0.97 0.77 0.80 9.39 0.72 0.79 0.27 0.34
62 0.27 0.97 0.75 0.79 8.46 0.75 0.79 0.24 0.30
63 0.27 0.99 0.90 0.79 25.36 0.74 0.80 0.26 0.34
64 0.18 0.99 0.86 0.77 16.91 0.83 0.78 0.17 0.23
66 0.15 1.00 1.00 0.77 0.00 0.85 0.78 0.15 0.21
67 0.12 1.00 1.00 0.76 0.00 0.88 0.77 0.12 0.17
68 0.06 1.00 1.00 0.75 0.00 0.94 0.75 0.06 0.09
73 0.03 1.00 1.00 0.74 0.00 0.97 0.75 0.03 0.04
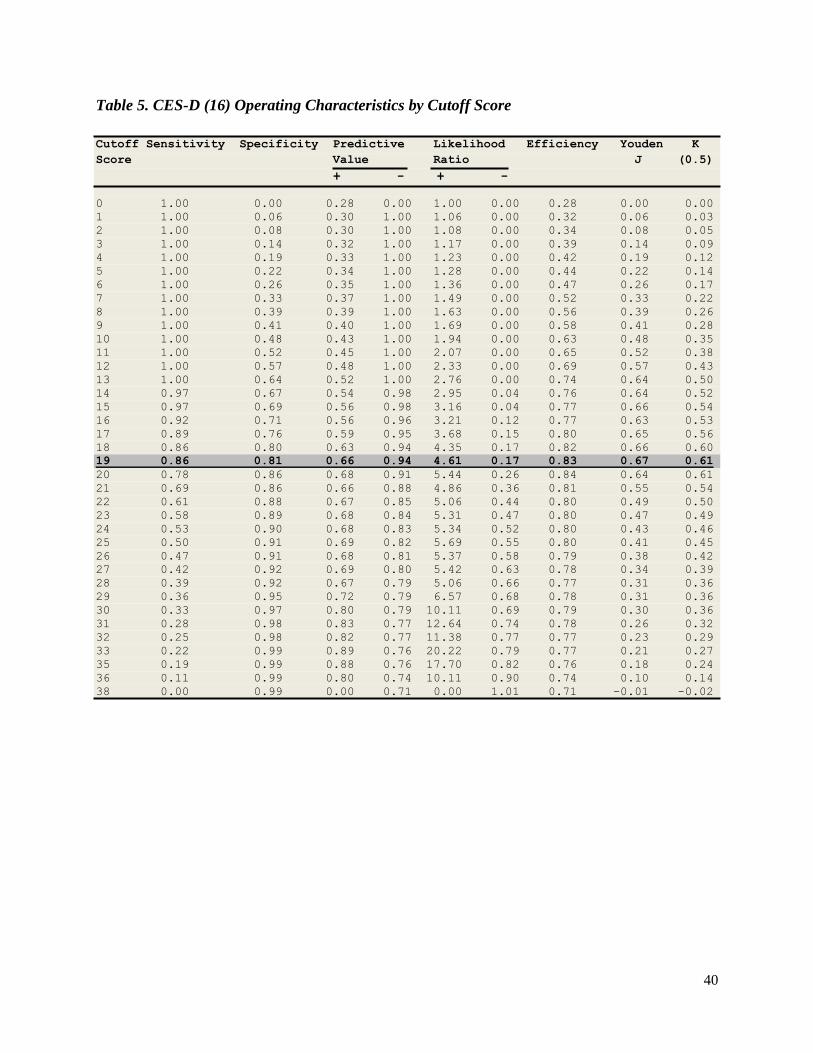
40
Table 5. CES-D (16) Operating Characteristics by Cutoff Score
Cutoff Sensitivity Specificity Predictive Likelihood Efficiency Youden K
Score Value Ratio J (0.5)
+ - + -
0 1.00 0.00 0.28 0.00 1.00 0.00 0.28 0.00 0.00
1 1.00 0.06 0.30 1.00 1.06 0.00 0.32 0.06 0.03
2 1.00 0.08 0.30 1.00 1.08 0.00 0.34 0.08 0.05
3 1.00 0.14 0.32 1.00 1.17 0.00 0.39 0.14 0.09
4 1.00 0.19 0.33 1.00 1.23 0.00 0.42 0.19 0.12
5 1.00 0.22 0.34 1.00 1.28 0.00 0.44 0.22 0.14
6 1.00 0.26 0.35 1.00 1.36 0.00 0.47 0.26 0.17
7 1.00 0.33 0.37 1.00 1.49 0.00 0.52 0.33 0.22
8 1.00 0.39 0.39 1.00 1.63 0.00 0.56 0.39 0.26
9 1.00 0.41 0.40 1.00 1.69 0.00 0.58 0.41 0.28
10 1.00 0.48 0.43 1.00 1.94 0.00 0.63 0.48 0.35
11 1.00 0.52 0.45 1.00 2.07 0.00 0.65 0.52 0.38
12 1.00 0.57 0.48 1.00 2.33 0.00 0.69 0.57 0.43
13 1.00 0.64 0.52 1.00 2.76 0.00 0.74 0.64 0.50
14 0.97 0.67 0.54 0.98 2.95 0.04 0.76 0.64 0.52
15 0.97 0.69 0.56 0.98 3.16 0.04 0.77 0.66 0.54
16 0.92 0.71 0.56 0.96 3.21 0.12 0.77 0.63 0.53
17 0.89 0.76 0.59 0.95 3.68 0.15 0.80 0.65 0.56
18 0.86 0.80 0.63 0.94 4.35 0.17 0.82 0.66 0.60
19 0.86 0.81 0.66 0.94 4.61 0.17 0.83 0.67 0.61
20 0.78 0.86 0.68 0.91 5.44 0.26 0.84 0.64 0.61
21 0.69 0.86 0.66 0.88 4.86 0.36 0.81 0.55 0.54
22 0.61 0.88 0.67 0.85 5.06 0.44 0.80 0.49 0.50
23 0.58 0.89 0.68 0.84 5.31 0.47 0.80 0.47 0.49
24 0.53 0.90 0.68 0.83 5.34 0.52 0.80 0.43 0.46
25 0.50 0.91 0.69 0.82 5.69 0.55 0.80 0.41 0.45
26 0.47 0.91 0.68 0.81 5.37 0.58 0.79 0.38 0.42
27 0.42 0.92 0.69 0.80 5.42 0.63 0.78 0.34 0.39
28 0.39 0.92 0.67 0.79 5.06 0.66 0.77 0.31 0.36
29 0.36 0.95 0.72 0.79 6.57 0.68 0.78 0.31 0.36
30 0.33 0.97 0.80 0.79 10.11 0.69 0.79 0.30 0.36
31 0.28 0.98 0.83 0.77 12.64 0.74 0.78 0.26 0.32
32 0.25 0.98 0.82 0.77 11.38 0.77 0.77 0.23 0.29
33 0.22 0.99 0.89 0.76 20.22 0.79 0.77 0.21 0.27
35 0.19 0.99 0.88 0.76 17.70 0.82 0.76 0.18 0.24
36 0.11 0.99 0.80 0.74 10.11 0.90 0.74 0.10 0.14
38 0.00 0.99 0.00 0.71 0.00 1.01 0.71 -0.01 -0.02
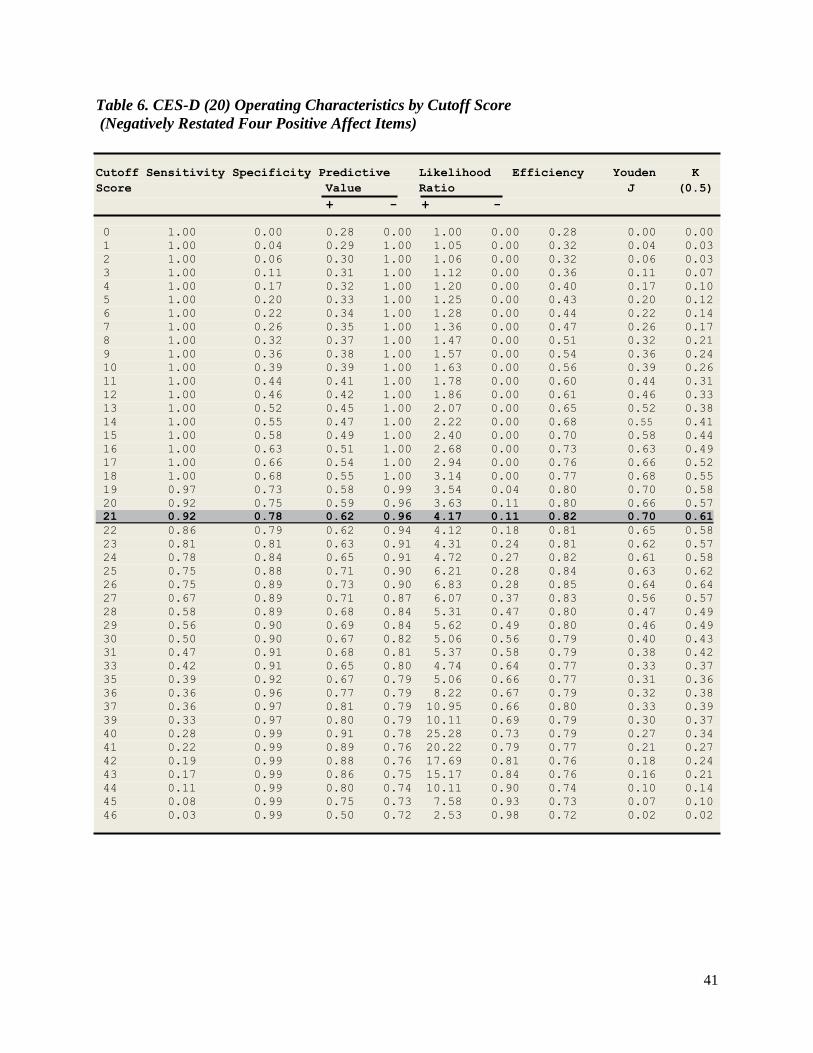
41
Table 6. CES-D (20) Operating Characteristics by Cutoff Score
(Negatively Restated Four Positive Affect Items)
Cutoff Sensitivity Specificity Predictive Likelihood Efficiency Youden K
Score Value Ratio J (0.5)
+ - + -
0 1.00 0.00 0.28 0.00 1.00 0.00 0.28 0.00 0.00
1 1.00 0.04 0.29 1.00 1.05 0.00 0.32 0.04 0.03
2 1.00 0.06 0.30 1.00 1.06 0.00 0.32 0.06 0.03
3 1.00 0.11 0.31 1.00 1.12 0.00 0.36 0.11 0.07
4 1.00 0.17 0.32 1.00 1.20 0.00 0.40 0.17 0.10
5 1.00 0.20 0.33 1.00 1.25 0.00 0.43 0.20 0.12
6 1.00 0.22 0.34 1.00 1.28 0.00 0.44 0.22 0.14
7 1.00 0.26 0.35 1.00 1.36 0.00 0.47 0.26 0.17
8 1.00 0.32 0.37 1.00 1.47 0.00 0.51 0.32 0.21
9 1.00 0.36 0.38 1.00 1.57 0.00 0.54 0.36 0.24
10 1.00 0.39 0.39 1.00 1.63 0.00 0.56 0.39 0.26
11 1.00 0.44 0.41 1.00 1.78 0.00 0.60 0.44 0.31
12 1.00 0.46 0.42 1.00 1.86 0.00 0.61 0.46 0.33
13 1.00 0.52 0.45 1.00 2.07 0.00 0.65 0.52 0.38
14 1.00 0.55 0.47 1.00 2.22 0.00 0.68 0.55 0.41
15 1.00 0.58 0.49 1.00 2.40 0.00 0.70 0.58 0.44
16 1.00 0.63 0.51 1.00 2.68 0.00 0.73 0.63 0.49
17 1.00 0.66 0.54 1.00 2.94 0.00 0.76 0.66 0.52
18 1.00 0.68 0.55 1.00 3.14 0.00 0.77 0.68 0.55
19 0.97 0.73 0.58 0.99 3.54 0.04 0.80 0.70 0.58
20 0.92 0.75 0.59 0.96 3.63 0.11 0.80 0.66 0.57
21 0.92 0.78 0.62 0.96 4.17 0.11 0.82 0.70 0.61
22 0.86 0.79 0.62 0.94 4.12 0.18 0.81 0.65 0.58
23 0.81 0.81 0.63 0.91 4.31 0.24 0.81 0.62 0.57
24 0.78 0.84 0.65 0.91 4.72 0.27 0.82 0.61 0.58
25 0.75 0.88 0.71 0.90 6.21 0.28 0.84 0.63 0.62
26 0.75 0.89 0.73 0.90 6.83 0.28 0.85 0.64 0.64
27 0.67 0.89 0.71 0.87 6.07 0.37 0.83 0.56 0.57
28 0.58 0.89 0.68 0.84 5.31 0.47 0.80 0.47 0.49
29 0.56 0.90 0.69 0.84 5.62 0.49 0.80 0.46 0.49
30 0.50 0.90 0.67 0.82 5.06 0.56 0.79 0.40 0.43
31 0.47 0.91 0.68 0.81 5.37 0.58 0.79 0.38 0.42
33 0.42 0.91 0.65 0.80 4.74 0.64 0.77 0.33 0.37
35 0.39 0.92 0.67 0.79 5.06 0.66 0.77 0.31 0.36
36 0.36 0.96 0.77 0.79 8.22 0.67 0.79 0.32 0.38
37 0.36 0.97 0.81 0.79 10.95 0.66 0.80 0.33 0.39
39 0.33 0.97 0.80 0.79 10.11 0.69 0.79 0.30 0.37
40 0.28 0.99 0.91 0.78 25.28 0.73 0.79 0.27 0.34
41 0.22 0.99 0.89 0.76 20.22 0.79 0.77 0.21 0.27
42 0.19 0.99 0.88 0.76 17.69 0.81 0.76 0.18 0.24
43 0.17 0.99 0.86 0.75 15.17 0.84 0.76 0.16 0.21
44 0.11 0.99 0.80 0.74 10.11 0.90 0.74 0.10 0.14
45 0.08 0.99 0.75 0.73 7.58 0.93 0.73 0.07 0.10
46 0.03 0.99 0.50 0.72 2.53 0.98 0.72 0.02 0.02
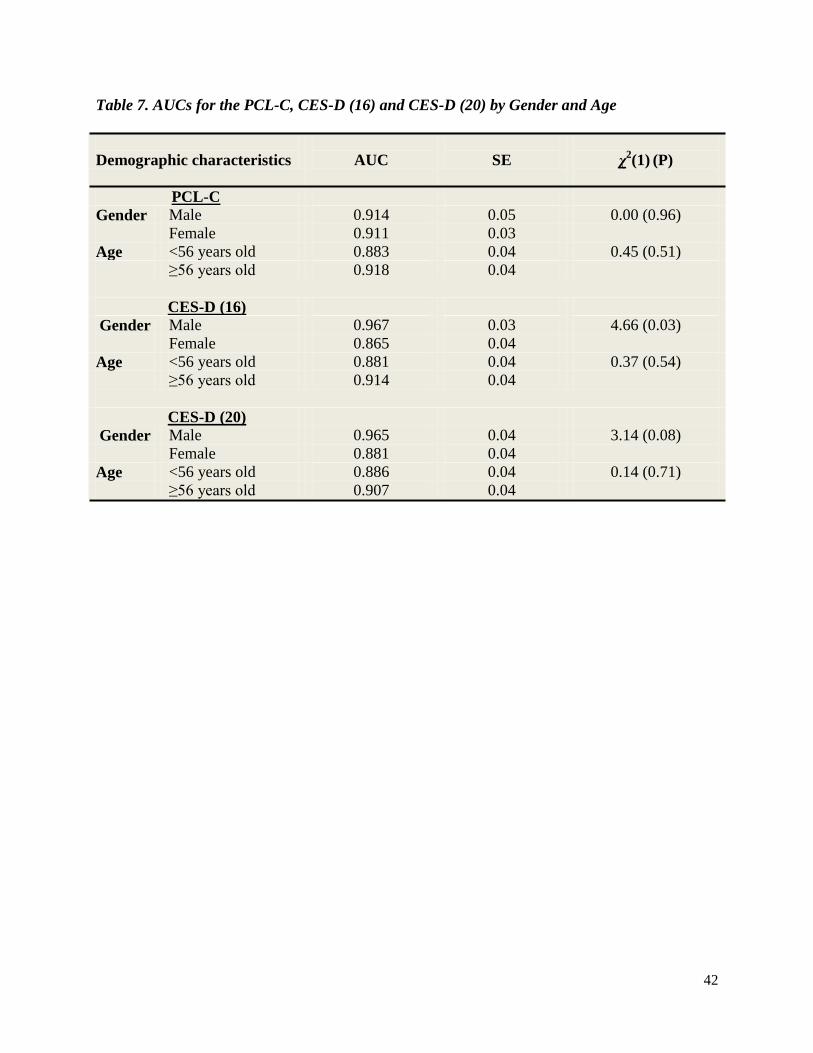
42
Table 7. AUCs for the PCL-C, CES-D (16) and CES-D (20) by Gender and Age
Demographic characteristics
AUC
SE
χ2(1)
(P)
PCL-C
Gender Male 0.914 0.05 0.00 (0.96)
Female 0.911 0.03
Age <56 years old 0.883 0.04 0.45 (0.51)
≥56 years old 0.918 0.04
CES-D (16)
Gender Male 0.967 0.03 4.66 (0.03)
Female 0.865 0.04
Age <56 years old 0.881 0.04 0.37 (0.54)
≥56 years old 0.914 0.04
CES-D (20)
Gender Male 0.965 0.04 3.14 (0.08)
Female 0.881 0.04
Age <56 years old 0.886 0.04 0.14 (0.71)
≥56 years old 0.907 0.04

43
FIGURES
Figure. 1 Flowchart of Finding Eligible Participants
Nobody was home
204
Not eligible
60
Refused without info
75
Unoccupied house
73
Contacted
431
Eligible
296
Selected not at home
52
Incomplete interview
1
Refused to participate
75
Completed interviews
126
Attempts
708
Unable to participate
42

44
Figure 2. ROC Curve for PCL-C
Figure 3. ROC Curve for CES-D (16)
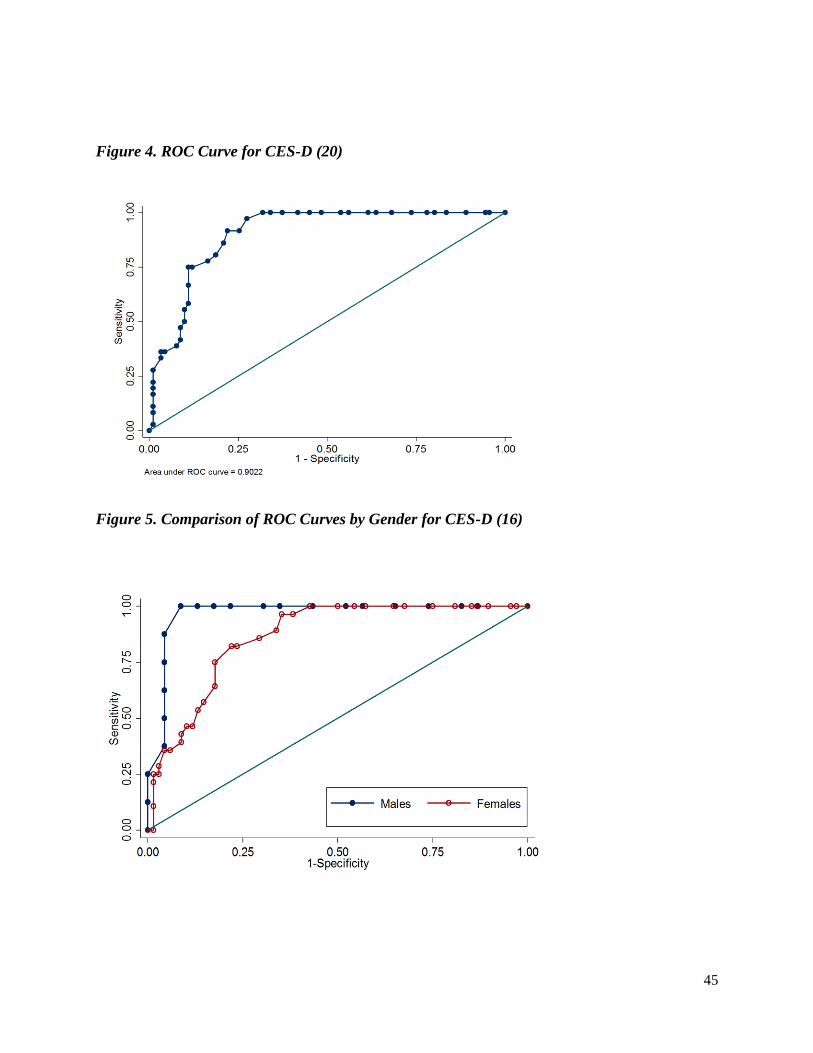
45
Figure 4. ROC Curve for CES-D (20)
Figure 5. Comparison of ROC Curves by Gender for CES-D (16)

46
APPENDIX 1
Criterion A for Major Depressive Episode (DSM-IV-TR)
Five (or more) of the following symptoms have been present during the same 2-week
period and represent a change from previous functioning; at least one of the symptoms is
either (l) depressed mood or (2) loss of interest or pleasure.
( 1) Depressed mood most of the day, nearly every day, as indicated by either subjective
report (e.g., feels sad or empty) or observation made by others (e.g., appears tearful)
(2) Markedly diminished interest or pleasure in all, or almost all, activities most of the day,
nearly every day
(3) Significant weight loss when not dieting or weight gain (e.g., a change of more than 5% of
body weight in a month), or decrease or increase in appetite nearly every day.
(4) Insomnia or hypersomnia nearly every day
(5) Psychomotor agitation or retardation nearly every day
(6) Fatigue or loss of energy nearly every day
(7) Feelings of worthlessness or excessive or inappropriate guilt (which may be delusional)
nearly every day (not merely self - reproach or guilt about being sick)
(8) Diminished ability to think or concentrate, or indecisiveness, nearly every day
(9) Recurrent thoughts of death (not just fear of dying), recurrent suicidal ideation without a
specific plan, or a suicide attempt or a specific plan for committing suicide.

47
APPENDIX 2
Journal Form
(One form per cluster)
Date ______________
Cluster number: _____
Starting address: ____________________________________________________
Visit/attempt
number
001 002 003 004 005 006 007 008 009 010 011 012 013 014 015
# of eligible
respondents
Result
Visit/attempt
number
016 017 018 019 020 021 022 023 024 025 026 027 028 029 030
# of eligible
respondents
Result
Visit/attempt
number
031 032 033 034 035 036 037 038 039 040 041 042 043 044 045
# of eligible
respondents
Result
Visit/attempt
number
046 047 048 049 050 051 052 053 054 055 056 057 058 059 060
# of eligible
respondents
Result
Result codes:
1. Completed interview
2. Incomplete interview
3. No eligible participant
4. Nobody at home
5. Selected respondent is not at home
6. Refusal
7. Unoccupied house
9. Other______________
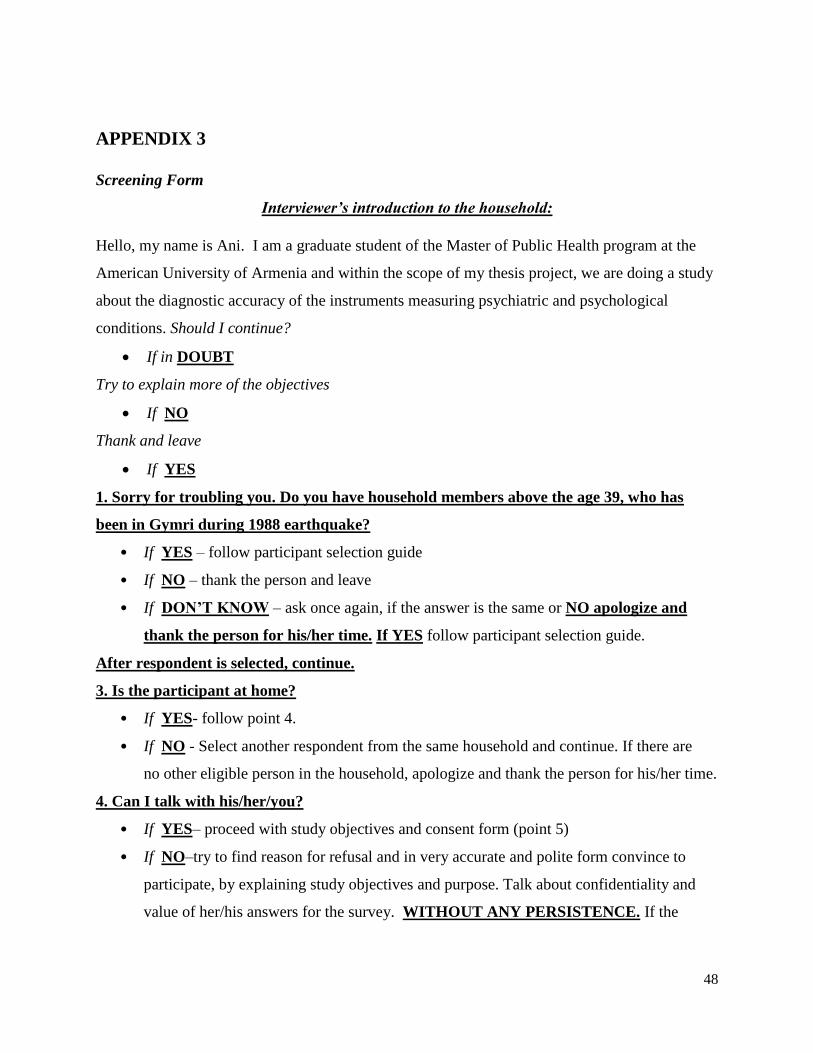
48
APPENDIX 3
Screening Form
Interviewer’s introduction to the household:
Hello, my name is Ani. I am a graduate student of the Master of Public Health program at the
American University of Armenia and within the scope of my thesis project, we are doing a study
about the diagnostic accuracy of the instruments measuring psychiatric and psychological
conditions. Should I continue?
If in DOUBT
Try to explain more of the objectives
If NO
Thank and leave
If YES
1. Sorry for troubling you. Do you have household members above the age 39, who has
been in Gymri during 1988 earthquake?
• If YES – follow participant selection guide
• If NO – thank the person and leave
• If DON’T KNOW – ask once again, if the answer is the same or NO apologize and
thank the person for his/her time. If YES follow participant selection guide.
After respondent is selected, continue.
3. Is the participant at home?
• If YES- follow point 4.
• If NO - Select another respondent from the same household and continue. If there are
no other eligible person in the household, apologize and thank the person for his/her time.
4. Can I talk with his/her/you?
• If YES– proceed with study objectives and consent form (point 5)
• If NO–try to find reason for refusal and in very accurate and polite form convince to
participate, by explaining study objectives and purpose. Talk about confidentiality and
value of her/his answers for the survey. WITHOUT ANY PERSISTENCE. If the

49
person still refuses and there is no other eligible person apologize and thank the person
for his/her time.
5. Present introductory statement and read consent and proceed with the survey/interview.
6. After the interview thank participant for the time provided and leave the household
Selection of the Participant
Ask how many elderly 39 years old and above live in the apartment/house and have been in
Gyumri at the time of earthquake. If more than one, choose the elder whose birthday is closest to
the date of the survey/interview.

50
APPENDIX 4
Study Instruments (English and Armenian)
Instructions for Completing the Questionnaire
Please fill out the two questionnaires Yourself.
First questionnaire measures Your psychological state related to the most shocking event that has ever
happened to you. Those kind of events include; earthquake or other kind of natural disaster, sudden
death of a loved one, situations threatening one’s life, physical assault or a rape towards oneself or
towards a close person. Please, focus on this kind of situations when answering to the questions, if those
have ever happened to you.
Please follow the instructions in Italics. Afterwards, read carefully the questions and the
response options.
Carefully read each question and the response options. Choose the option that best represents your
response and check ( ) the box next to the option number.
Some questions may look like others, but each one is different. Please, take time to answer all of them.
Some questions may look like others, but each one is different. Please, take time to answer all of them. If
something is not clear, do not hesitate to ask for an explanation from the interviewer and be sure that
your answers will be kept absolutely confidential.
Examples
The following examples show how to answer to different types of questions.
How much did the following symptoms bother you during the last 30 days.
Not at all A little Moderately Much Extreme
ly
Headache
� 0
� 1
� 2
� 3
� 4
Nostalgia
� 0
� 1
� 2
� 3
� 4
√
√
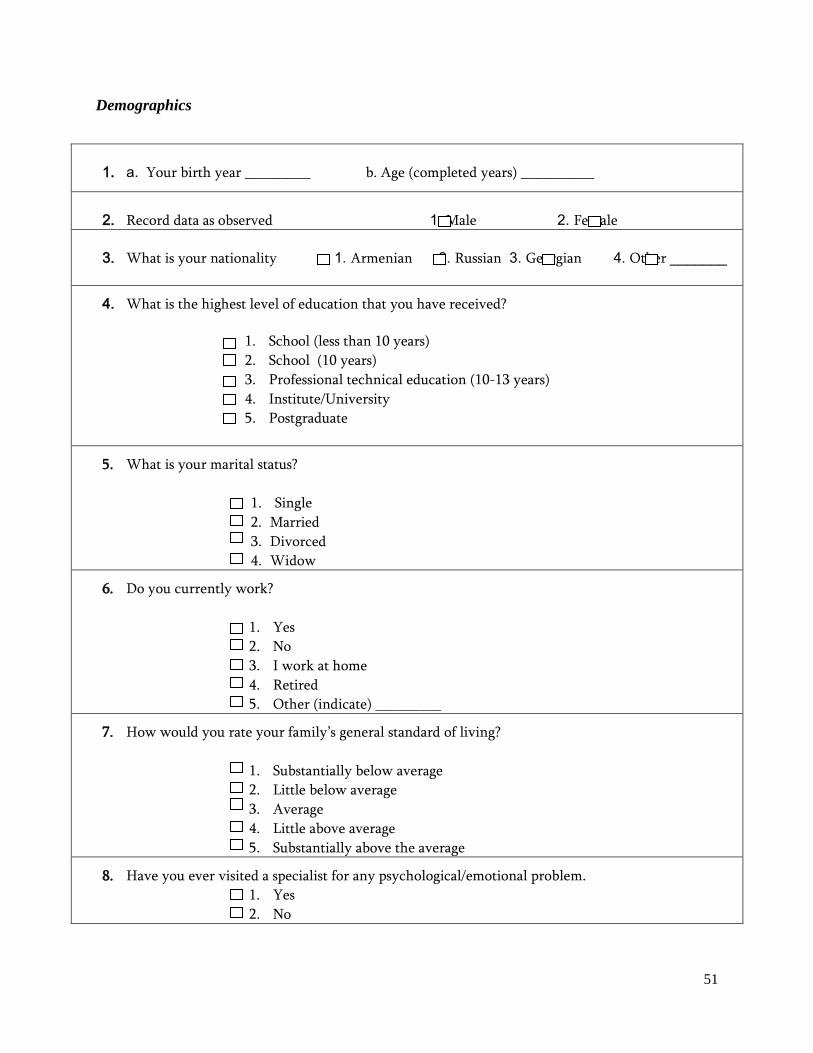
51
Demographics
1. a. Your birth year _________ b. Age (completed years) __________
2. Record data as observed 1. Male 2. Female
3. What is your nationality 1. Armenian 2. Russian 3. Georgian 4. Other _______
4. What is the highest level of education that you have received?
1. School (less than 10 years)
2. School (10 years)
3. Professional technical education (10-13 years)
4. Institute/University
5. Postgraduate
5. What is your marital status?
1. Single
2. Married
3. Divorced
4. Widow
6. Do you currently work?
1. Yes
2. No
3. I work at home
4. Retired
5. Other (indicate) _________
7. How would you rate your family’s general standard of living?
1. Substantially below average
2. Little below average
3. Average
4. Little above average
5. Substantially above the average
8. Have you ever visited a specialist for any psychological/emotional problem.
1. Yes
2. No

52
PTSD-Checklist Civilian (with a Question Added on Trauma Type Specification)
1. Below is a list of problems and complaints that people sometimes have in response to stressful life events or
experiences. Please, concentrate on the worst event that has happened to you and indicate how much you
have been bothered during the past 30 days by each of the following problems that occurred or became
worse after that event/experience.
# Response: Not
at all
A
little
bit
Mode
rately
Quite
a bit
Extre
mely
1 Repeated, disturbing memories, thoughts, or images of a
stressful experience from the past � 1 � 2 � 3 � 4 � 5
2 Repeated, disturbing dreams of a stressful experience from the
past � 1 � 2 � 3 � 4 � 5
3 Suddenly acting or feeling as if a stressful experience were
happening again (as if you were reliving it) � 1 � 2 � 3 � 4 � 5
4 Feeling very upset when something reminded you of a
stressful experience from the past � 1 � 2 � 3 � 4 � 5
5 Having physical reactions (e.g., heart pounding, trouble
breathing, or sweating) when something reminded you of a
stressful experience from the past
� 1 � 2 � 3 � 4 � 5
6 Avoid thinking about or talking about a stressful experience
from the past or avoid having feelings related to it � 1 � 2 � 3 � 4 � 5
7 Avoid activities or situations because they remind you of a
stressful experience from the past � 1 � 2 � 3 � 4 � 5
8 Trouble remembering important parts of a stressful experience
from the past � 1 � 2 � 3 � 4 � 5
9 Loss of interest in things that you used to enjoy � 1 � 2 � 3 � 4 � 5
10 Feeling distant or cut off from other people � 1 � 2 � 3 � 4 � 5
11 Feeling emotionally numb or being unable to have loving
feelings for those close to you � 1 � 2 � 3 � 4 � 5
12 Feeling as if your future will somehow be cut short � 1 � 2 � 3 � 4 � 5
13 Trouble falling or staying asleep � 1 � 2 � 3 � 4 � 5
14 Feeling irritable or having angry outbursts � 1 � 2 � 3 � 4 � 5
15 Having difficulty concentrating � 1 � 2 � 3 � 4 � 5
16 Being “super alert” or watchful on guard � 1 � 2 � 3 � 4 � 5
17 Feeling jumpy or easily startled � 1 � 2 � 3 � 4 � 5
Please mention which traumatic event you were considering while answering to above questions.
1. The 1988 earthquake
2. Death of a close one
3.Other (specify) ____________________________________

53
Center for Epidemiologic Studies Depression Scale (CES-D) (with Negatively Restated
Positive Affect Items)
Below is a list of the ways you might have felt or behaved. Please mark how often you have felt this way
during the past month.
During the past week
Questions
Rarely or none
of the time (less
than 1 day)
Some or a little
of the time (1-2
days)
Occasionally or a
moderate amount
of time (3-4
days)
Most or all of the
time
(5-7 days)
1.I was bothered by things
that usually don’t bother me
2. I did not feel like eating;
my appetite was poor
3. I felt that I could not
shake off the blues even
with help from my family or
friends
4. I felt I was not as good as
other people
5. I had trouble keeping my
mind on what I was doing
6. I felt depressed
7. I felt that everything I did
was an effort
8.I felt hopeless about the
future
9. I thought my life had
been a failure
10. I felt fearful
11. My sleep was restless
12. I was unhappy
13. I talked less than usual
14. I felt lonely
15. People were unfriendly
16. I could not enjoy life
17. I had crying spells
18. I felt sad
19. I felt that people dislike
me
20. I could not “get going”
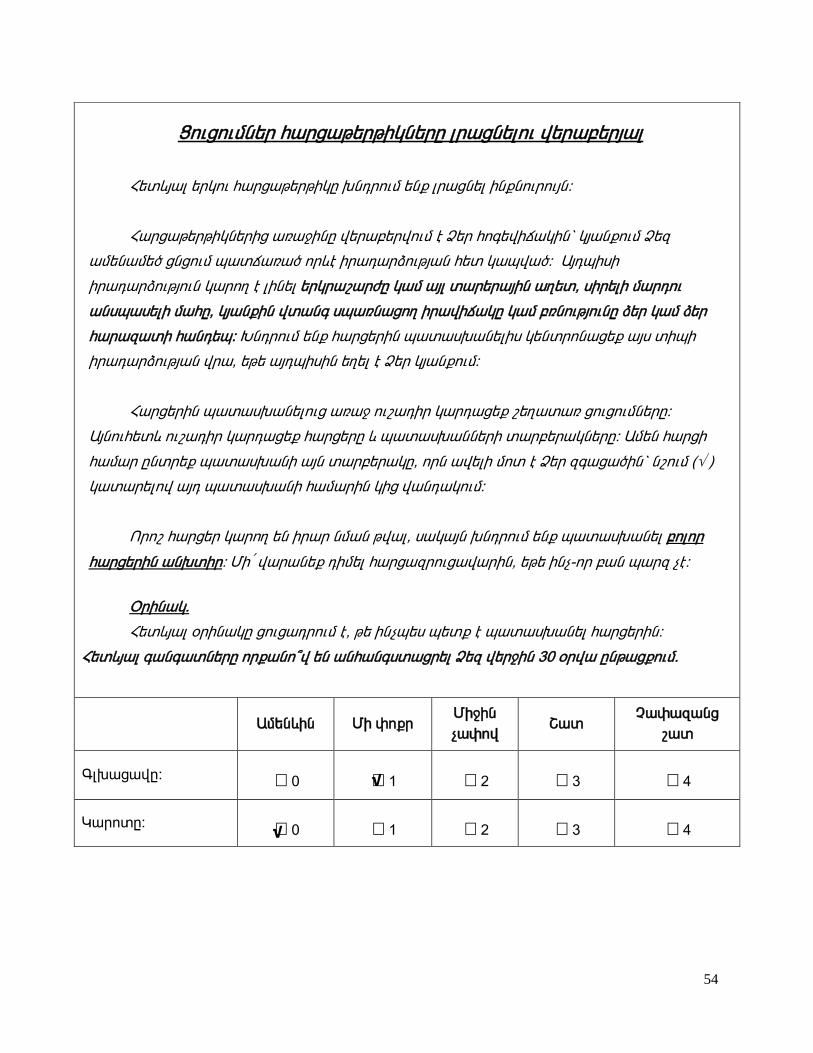
54
òáõóáõÙÝ»ñ ѳñó³Ã»ñÃÇÏÝ»ñÁ Éñ³óÝ»Éáõ í»ñ³µ»ñÛ³É
лï¨Û³É »ñÏáõ ѳñó³Ã»ñÃÇÏÁ ËݹñáõÙ »Ýù Éñ³óÝ»É ÇÝùÝáõñáõÛÝ:
гñó³Ã»ñÃÇÏÝ»ñÇó ³é³çÇÝÁ í»ñ³µ»ñíáõÙ ¿ Ò»ñ Ñá·»íÇ׳ÏÇÝ` ÏÛ³ÝùáõÙ Ò»½
³Ù»Ý³Ù»Í óÝóáõÙ å³ï׳é³Í áñ¨¿ Çñ³¹³ñÓáõÃÛ³Ý Ñ»ï ϳåí³Í: ²Û¹åÇëÇ
Çñ³¹³ñÓáõÃÛáõÝ Ï³ñáÕ ¿ ÉÇÝ»É »ñÏñ³ß³ñÅÁ ϳ٠³ÛÉ ï³ñ»ñ³ÛÇÝ ³Õ»ï, ëÇñ»ÉÇ Ù³ñ¹áõ
³Ýëå³ë»ÉÇ Ù³ÑÁ, ÏÛ³ÝùÇÝ íï³Ý· ëå³éݳóáÕ Çñ³íÇ׳ÏÁ ϳ٠µéÝáõÃÛáõÝÁ Ó»ñ ϳ٠ӻñ
ѳñ³½³ïÇ Ñ³Ý¹»å: ÊݹñáõÙ »Ýù ѳñó»ñÇÝ å³ï³ë˳ݻÉÇë Ï»Ýïñáݳó»ù ³Ûë ïÇåÇ
Çñ³¹³ñÓáõÃÛ³Ý íñ³, »Ã» ³Û¹åÇëÇÝ »Õ»É ¿ Ò»ñ ÏÛ³ÝùáõÙ:
гñó»ñÇÝ å³ï³ë˳ݻÉáõó ³é³ç áõß³¹Çñ ϳñ¹³ó»ù ߻ճï³é óáõóáõÙÝ»ñÁ:
²ÛÝáõÑ»ï¨ áõß³¹Çñ ϳñ¹³ó»ù ѳñó»ñÁ ¨ å³ï³ë˳ÝÝ»ñÇ ï³ñµ»ñ³ÏÝ»ñÁ: ²Ù»Ý ѳñóÇ
ѳٳñ ÁÝïñ»ù å³ï³ë˳ÝÇ ³ÛÝ ï³ñµ»ñ³ÏÁ, áñÝ ³í»ÉÇ Ùáï ¿ Ò»ñ ½·³ó³ÍÇÝ` ÝßáõÙ ( )
ϳï³ñ»Éáí ³Û¹ å³ï³ë˳ÝÇ Ñ³Ù³ñÇÝ ÏÇó í³Ý¹³ÏáõÙ:
àñáß Ñ³ñó»ñ ϳñáÕ »Ý Çñ³ñ ÝÙ³Ý Ãí³É, ë³Ï³ÛÝ ËݹñáõÙ »Ýù å³ï³ëË³Ý»É µáÉáñ
ѳñó»ñÇÝ ³ÝËïÇñ: ØÇ՛ í³ñ³Ý»ù ¹ÇÙ»É Ñ³ñó³½ñáõó³í³ñÇÝ, »Ã» ÇÝã-áñ µ³Ý å³ñ½ ã¿:
úñÇݳÏ.
лï¨Û³É ûñÇݳÏÁ óáõó³¹ñáõÙ ¿, û ÇÝãå»ë å»ïù ¿ å³ï³ëË³Ý»É Ñ³ñó»ñÇÝ:
лï¨Û³É ·³Ý·³ïÝ»ñÁ áñù³Ýá±í »Ý ³Ýѳݷëï³óñ»É Ò»½ í»ñçÇÝ 30 ûñí³ ÁÝóóùáõÙ.
²Ù»Ý¨ÇÝ ØÇ ÷áùñ
ØÇçÇÝ
ã³÷áí Þ³ï
â³÷³½³Ýó
ß³ï
¶É˳ó³íÁ:
� 0
� 1
� 2
� 3
� 4
γñáïÁ:
� 0
� 1
� 2
� 3
� 4
√
√
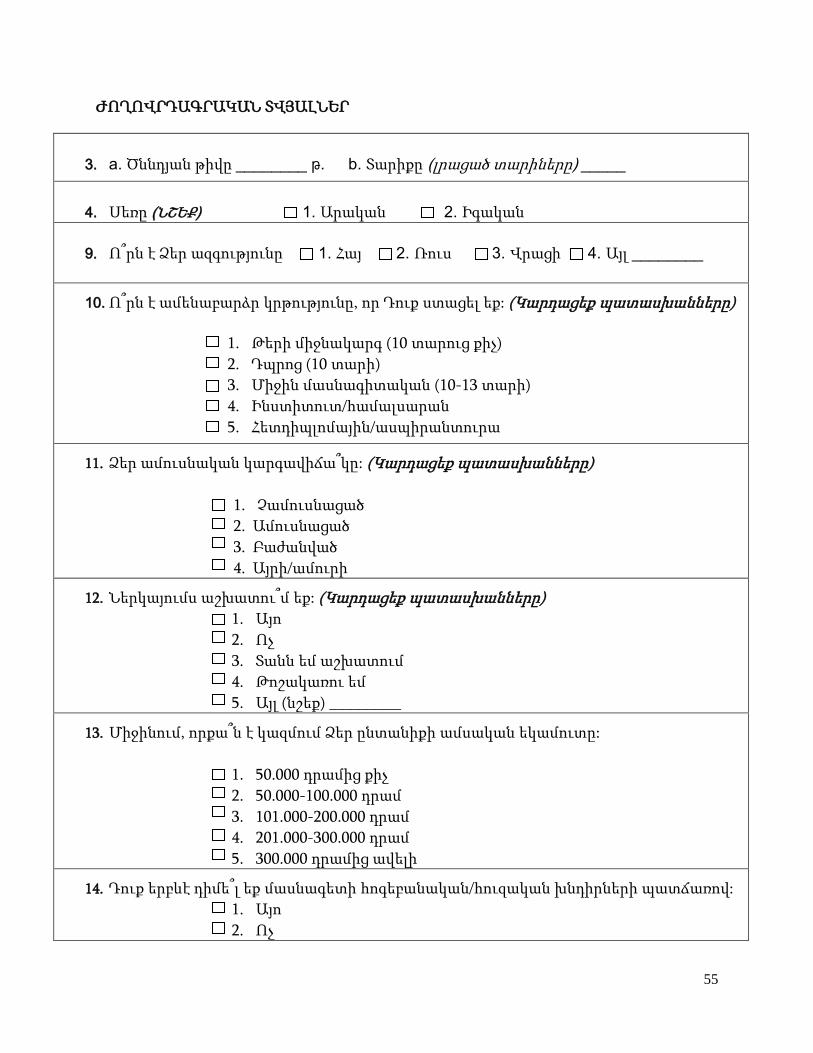
55
ԺՈՂՈՎՐԴԱԳՐԱԿԱՆ ՏՎՅԱԼՆԵՐ
3. a. Ծննդյան թիվը ________ Ã. b. Տարիքը (լրացած տարիները) _____
4. Սեռը (ՆՇԵՔ) 1. Արական 2. Իգական
9. Ո՞րն է Ձեր ազգությունը 1. Հայ 2. Ռուս 3. Վրացի 4. Այլ ________
10. Ո՞րն է ամենաբարձր կրթությունը, որ Դուք ստացել եք: (Կարդացեք պատասխանները)
1. Թերի միջնակարգ (10 տարուց քիչ)
2. Դպրոց (10 տարի)
3. Միջին մասնագիտական (10-13 տարի)
4. Ինստիտուտ/համալսարան
5. Հետդիպլոմային/ասպիրանտուրա
11. Ձեր ամուսնական կարգավիճա՞կը: (Կարդացեք պատասխանները)
1. Չամուսնացած
2. Ամուսնացած
3. Բաժանված
4. Այրի/ամուրի
12. Ներկայումս աշխատու՞մ եք: (Կարդացեք պատասխանները) 1. Այո
2. Ոչ
3. Տանն եմ աշխատում
4. Թոշակառու եմ
5. Այլ (նշեք) _________
13. Միջինում, որքա՞ն է կազմում Ձեր ընտանիքի ամսական եկամուտը:
1. 50.000 դրամից քիչ
2. 50.000-100.000 դրամ
3. 101.000-200.000 դրամ
4. 201.000-300.000 դրամ
5. 300.000 դրամից ավելի
14. Դուք երբևէ դիմե՞լ եք մասնագետի հոգեբանական/հուզական խնդիրների պատճառով:
1. Այո
2. Ոչ
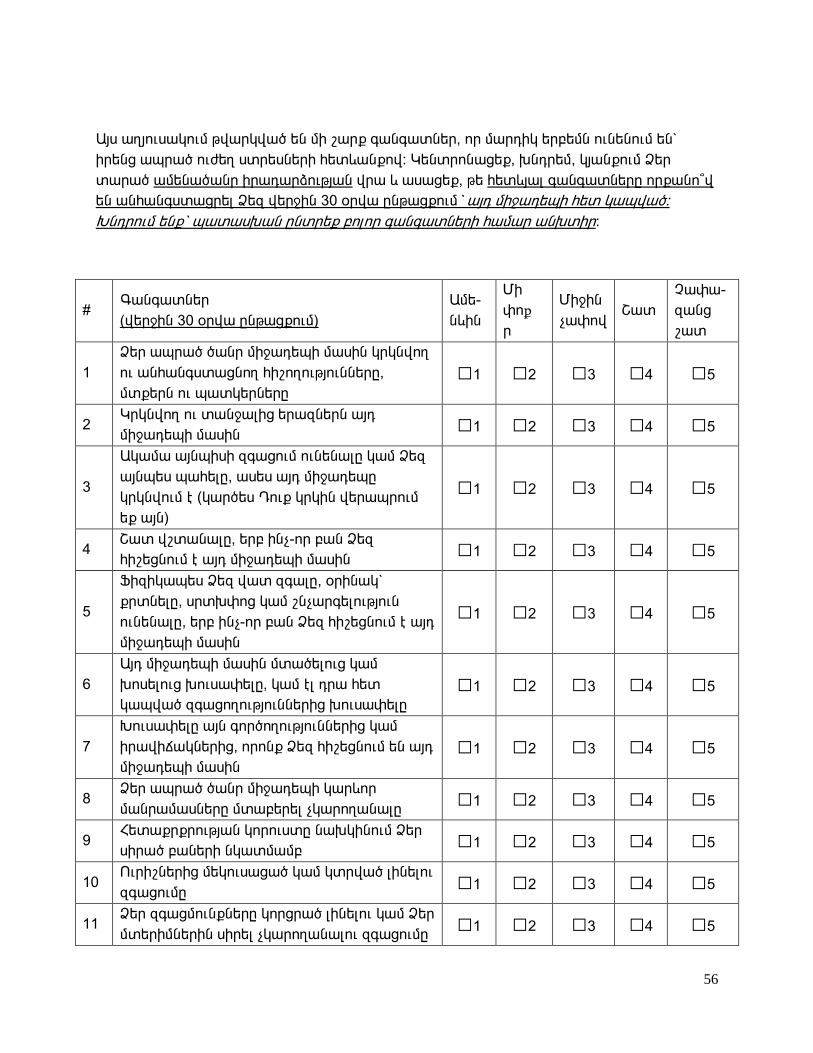
56
²Ûë ³ÕÛáõë³ÏáõÙ Ãí³ñÏí³Í »Ý ÙÇ ß³ñù ·³Ý·³ïÝ»ñ, áñ Ù³ñ¹ÇÏ »ñµ»ÙÝ áõÝ»ÝáõÙ »Ý`
Çñ»Ýó ³åñ³Í áõÅ»Õ ëïñ»ëÝ»ñÇ Ñ»ï¨³Ýùáí: λÝïñáݳó»ù, Ëݹñ»Ù, ÏÛ³ÝùáõÙ Ò»ñ
ï³ñ³Í ³Ù»Ý³Í³Ýñ Çñ³¹³ñÓáõÃÛ³Ý íñ³ ¨ ³ë³ó»ù, û Ñ»ï¨Û³É ·³Ý·³ïÝ»ñÁ áñù³Ýá±í
»Ý ³Ýѳݷëï³óñ»É Ò»½ í»ñçÇÝ 30 ûñí³ ÁÝóóùáõÙ` ³Û¹ ÙÇç³¹»åÇ Ñ»ï ϳåí³Í:
ÊݹñáõÙ »Ýù` å³ï³ëË³Ý ÁÝïñ»ù µáÉáñ ·³Ý·³ïÝ»ñÇ Ñ³Ù³ñ ³ÝËïÇñ:
# ¶³Ý·³ïÝ»ñ
(í»ñçÇÝ 30 ûñí³ ÁÝóóùáõÙ)
²Ù»-
ݨÇÝ
ØÇ
÷áք
ñ
ØÇçÇÝ
ã³÷áí Þ³ï
â³÷³-
½³Ýó
ß³ï
1
Ò»ñ ³åñ³Í ͳÝñ ÙÇç³¹»åÇ Ù³ëÇÝ ÏñÏÝíáÕ
áõ ³Ýѳݷëï³óÝáÕ ÑÇßáÕáõÃÛáõÝÝ»ñÁ,
Ùïù»ñÝ áõ å³ïÏ»ñÝ»ñÁ
□1 □2 □3 □4 □5
2 ÎñÏÝíáÕ áõ ï³Ýç³ÉÇó »ñ³½Ý»ñÝ ³Û¹
ÙÇç³¹»åÇ Ù³ëÇÝ □1 □2 □3 □4 □5
3
²Ï³Ù³ ³ÛÝåÇëÇ ½·³óáõÙ áõݻݳÉÁ ϳ٠һ½
³ÛÝå»ë å³Ñ»ÉÁ, ³ë»ë ³Û¹ ÙÇç³¹»åÁ
ÏñÏÝíáõÙ ¿ (ϳñÍ»ë ¸áõù ÏñÏÇÝ í»ñ³åñáõÙ
»ù ³ÛÝ)
□1 □2 □3 □4 □5
4 Þ³ï íßï³Ý³ÉÁ, »ñµ ÇÝã-áñ µ³Ý Ò»½
ÑÇß»óÝáõÙ ¿ ³Û¹ ÙÇç³¹»åÇ Ù³ëÇÝ □1 □2 □3 □4 □5
5
üǽÇϳå»ë Ò»½ í³ï ½·³ÉÁ, ûñÇݳÏ`
ùñïÝ»ÉÁ, ëñïË÷áó ϳ٠ßÝã³ñ·»ÉáõÃÛáõÝ
áõݻݳÉÁ, »ñµ ÇÝã-áñ µ³Ý Ò»½ ÑÇß»óÝáõÙ ¿ ³Û¹
ÙÇç³¹»åÇ Ù³ëÇÝ
□1 □2 □3 □4 □5
6
²Û¹ ÙÇç³¹»åÇ Ù³ëÇÝ Ùï³Í»Éáõó ϳÙ
Ëáë»Éáõó Ëáõë³÷»ÉÁ, ϳ٠¿É ¹ñ³ Ñ»ï
ϳåí³Í ½·³óáÕáõÃÛáõÝÝ»ñÇó Ëáõë³÷»ÉÁ
□1 □2 □3 □4 □5
7
Êáõë³÷»ÉÁ ³ÛÝ ·áñÍáÕáõÃÛáõÝÝ»ñÇó ϳÙ
Çñ³íÇ׳ÏÝ»ñÇó, áñáÝù Ò»½ ÑÇß»óÝáõÙ »Ý ³Û¹
ÙÇç³¹»åÇ Ù³ëÇÝ
□1 □2 □3 □4 □5
8 Ò»ñ ³åñ³Í ͳÝñ ÙÇç³¹»åÇ Ï³ñ¨áñ
Ù³Ýñ³Ù³ëÝ»ñÁ Ùï³µ»ñ»É ãϳñáճݳÉÁ □1 □2 □3 □4 □5
9 лï³ùñùñáõÃÛ³Ý ÏáñáõëïÁ ݳËÏÇÝáõÙ Ò»ñ
ëÇñ³Í µ³Ý»ñÇ Ýϳïٳٵ □1 □2 □3 □4 □5
10 àõñÇßÝ»ñÇó Ù»Ïáõë³ó³Í ϳ٠Ïïñí³Í ÉÇÝ»Éáõ
½·³óáõÙÁ □1 □2 □3 □4 □5
11 Ò»ñ ½·³óÙáõÝùÝ»ñÁ Ïáñóñ³Í ÉÇÝ»Éáõ ϳ٠һñ
Ùï»ñÇÙÝ»ñÇÝ ëÇñ»É ãϳñáճݳÉáõ ½·³óáõÙÁ □1 □2 □3 □4 □5

57
# ¶³Ý·³ïÝ»ñ
(í»ñçÇÝ 30 ûñí³ ÁÝóóùáõÙ)
²Ù»-
ݨÇÝ
ØÇ
÷áք
ñ
ØÇçÇÝ
ã³÷áí Þ³ï
â³÷³-
½³Ýó
ß³ï
12 ²ÛÝå»ë ½·³ÉÁ, áñ Ò»ñ ³å³·³Ý »ñϳñ ãÇ
ï¨Ç □1 □2 □3 □4 □5
13 øáõÝ ÙïÝ»Éáõ ϳ٠ùÝ³Í ÙݳÉáõ
¹Åí³ñáõÃÛáõÝÝ»ñÁ □1 □2 □3 □4 □5
14 ¶ñ·éí³Í ÉÇÝ»ÉÁ ϳ٠ϳï³ÕáõÃÛ³Ý Ýáå³Ý»ñ
áõݻݳÉÁ □1 □2 □3 □4 □5
15 λÝïñáݳݳÉáõ ¹Åí³ñáõÃÛáõÝÝ»ñ áõݻݳÉÁ □1 □2 □3 □4 □5
16 §Þ³ï ½·áݦ ÉÇÝ»ÉÁ ϳ٠³ÝÁݹѳï íï³Ý·Ç
ëå³ë»ÉÁ □1 □2 □3 □4 □5
17 êáíáñ³Ï³Ý »ñ¨áõÛÃÝ»ñÇó §í»ñ Ãéã»ÉÁ¦ ϳÙ
í³Ë»Ý³ÉÁ □1 □2 □3 □4 □5
Üß»ù, Ëݹñ»Ù, á±ñÝ ¿ñ ³ÛÝ Í³Ýñ ÙÇç³¹»åÁ, áñÇ íñ³ Ï»Ýïñáݳó³ù` ³Ûë ѳñó»ñÇÝ
å³ï³ë˳ݻÉÇë:
1. 1988 թ.-ի երկրաշարժը
2. Մտերիմ մարդու կորուստը
3. Այլ միջադեպ ___________________
Նշեք, խնդրեմ, թե վերջին 7 օրվա ընթացքում Դուք որքա՞ն հաճախ եք զգացել Ձեզ այնպես,
ինչպես նկարագրված է այստեղ
(Պատասխանեք, խնդրեմ, ԲՈԼՈՐ հարցերին):
Վերջին 7 օրվա ընթացքում
Հազվադեպ/
երբեք
(1 օրից քիչ)
Երբեմն
(1-ից 2 օր)
Բավականին
հաճախ
(3-ից 4 օր)
Մշտապես
5-ից 7 օր)
1.Ես հուզվում էի այնպիսի բաներից,
որոնք սովորաբար ինձ չեն հուզում □1 □2 □3 □4
2.Ես չէր ուզում ուտել: Վատ
ախորժակ ունեի □1 □2 □3 □4
3.Ես չէի կարողանում ազատվել
տխրությունից՝ անգամ ընտանիքիս և
ընկերներիս օգնությամբ □1 □2 □3 □4
4.Ես զգում էի, որ ավելի վատն եմ,
քան՝ մյուս մարդիկ □1 □2 □3 □4

58
Վերջին 7 օրվա ընթացքում
Հազվադեպ/
երբեք
(1 օրից քիչ)
Երբեմն
(1-ից 2 օր)
Բավականին
հաճախ
(3-ից 4 օր)
Մշտապես
5-ից 7 օր)
5.Ես չէի կարողանում ուշադրությունս
կենտրոնացնել արածիս վրա □1 □2 □3 □4
6. Ես ինձ ընկճված էի զգում □1 □2 □3 □4
7.Ես ամեն ինչ անում էի մեծ
դժվարությամբ □1 □2 □3 □4
8.Ես ապագայի հետ հույսեր չէի
կապում □1 □2 □3 □4
9.Ես մտածում էի, որ կյանքս իզուր է
անցել □1 □2 □3 □4
10.Ես վախ էի զգում □1 □2 □3 □4
11.Ես վատ էի քնում □1 □2 □3 □4
12.Ես դժբախտ էի □1 □2 □3 □4
13. Ես ավելի քիչ էի խոսում, քան
սովորաբար □1 □2 □3 □4
14.Ես ինձ միայնակ էի զգում □1 □2 □3 □4
15.Մարդիկ անբարյացկամ էին □1 □2 □3 □4
16. Ես չէի կարողանում հաճույք
ստանալ իմ կյանքից □1 □2 □3 □4
17.Ես լացի պոռթկումներ էի ունենում □1 □2 □3 □4
18.Ես տխուր էի □1 □2 □3 □4
19.Ես զգում էի, որ դուր չեմ գալիս
մարդկանց □1 □2 □3 □4
20. Ես չէի կարողանում հունի մեջ
ընկնել □1 □2 □3 □4
59
APPENDIX 5
Consent Form (English and Armenian)
American University of Armenia
Institutional Review Board #1/Committee on Human Research
Consent form
Hello, my name is Ani. I am a psychologist and also a graduate student of the Master of Public Health program at the College of Health Sciences at the American University of Armenia and within the scope of my thesis project we are doing a study about the diagnostic accuracy of the instruments measuring psychiatric and psychological conditions.
I am inviting you to participate in this study, because you have witnessed and lived through the 1988 earthquake. You will be one of approximately 132 people who have been randomly selected to participate in this project. Participating will involve a onetime meeting with two sessions. The whole process will take about 45-60 minutes to complete. You will need to fill out two short questionnaires followed by an interview. Your name will not appear in any presentation of the results. None of your answers will be identified by your name or any other personal or identifiable information. All your answers will be analyzed and generalized with other participants’ data.
Your participation in this study is voluntary. There is no penalty if you decline to take part in this project. You may refuse to answer any question or may stop the interview at any time.
Since the study involves a diagnostic interview measuring your psychological conditions, in case of need, you will be provided with options for further psychological consultation. It is your decision to accept or reject this support. Your participation in this project will help us better estimate the psychological status of the population of the earthquake zone.
If you have any questions regarding this study you can call the Principal Investigator Dr. Anahit Demirchyan at (37410) 51 25 92. If you feel you have not been treated fairly or think you have been hurt by joining the study you should contact Dr. Hripsime Martirosyan, the Human Subject Protection Administrator of the American University of Armenia (37410) 51 25 61.
Do you agree to participate? Thank you.
If yes, shall we continue?

60
Հայաստանի ամերիկյան համալսարան
Հանրային առողջապահության բաժին
Գիտահետազոտական էթիկայի թիվ 1 հանձնաժողով
Իրազեկ համաձայնության ձև
Բարև Ձեզ, իմ անունը Անի է: Ես հոգեբան եմ և այժմ սովորում եմ Հայաստանի
ամերիկյան համալսարանում՝ Հանրային առողջապահության բաժնում: Իմ
ավարտական թեզի շրջանակներում մենք իրականացնում ենք հետազոտություն, որի
նպատակն է պարզել, թե որքան ճշգրիտ են գնահատում մարդու հոգեվիճակը այս
հետազոտության մեջ կիրառվող հարցաշարերը:
Դուք հրավիրված եք մասնակցելու այս հետազոտությանը, քանի որ վերապրել
եք 1988թ. երկրաշարժը : Դուք կլինեք այս հետազոտության 132 մասնակիցներից
մեկը:
Ձեր մասնակցությունն այս հետազոտությանը կսահմանափակվի
մեկանգամյա հանդիպումով, որի ընթացքում Դուք կլրացնեք երկու կարճ
հարցաթերթիկ, ապա կմասնակցեք հարցարզրույցի` հոգեբանի հետ: Ամբողջ
ընթացքը կտևի մոտավորապես 45-60 րոպե: Ձեր անունը չի նշվի ոչ մի զեկույցում:
Ձեր կողմից տրամադրված ոչ մի տեղեկություն չի կցվի Ձեր անվան կամ անձնական
այլ տվյալների հետ: Ձեր տրամադրած տեղեկությունները կօգտագործվեն միայն այս
հետազոտության շրջանակներում` ընդհանրացված այլ մասնակիցների տվյալների
հետ:
Ձեր մասնակցությունն այս հետազոտությանը կամավոր է: Ձեզ ոչինչ չի
սպառնում, եթե Դուք հրաժարվեք մասնակցել այս հետազոտությանը: Դուք կարող եք
հրաժարվել պատասխանել ցանկացած հարցի կամ ցանկացած պահի ընդհատել
հարցազրույցը:
Դուք ոչ մի ռիսկի չեք դիմում` մասնակցելով այս հետազոտությանը:
Քանի որ հետազոտությունը ներառում է հարցազրույց հոգեբանի հետ,
անհրաժեշտության դեպքում, Ձեզ կտրամադրվի հոգեբանական օգնություն
ստանալու խորհրդատվություն: Դուք ինքներդ եք որուշում ընդունել կամ հրաժարվել
այդ օգնությունից:
Ձեր անկեղծ պատասխանները կօգնեն մեզ ավելի ճիշտ գնահատել 1988թ.
երկրաշարժը վերապրած անձանց հոգեվիճակը:
Այս հետազոտության վերաբերյալ հարցեր ունենալու դեպքում կարող եք
զանգահարել հետազոտության համակարգողին` Անահիտ Դեմիրճյանին (37410) 51
25 92 հեռախոսահամարով: Եթե Դուք կարծում եք, որ այս հետազոտությանը
մասնակցելու ընթացքում Ձեզ լավ չեն վերաբերվել կամ որ մասնակցությունը Ձեզ
վնաս է պատճառել, կարող եք զանգահարել Հայաստանի ամերիկյան համալսարանի

61
Էթիկայի հանձնաժողովի քարտուղար՝ Հռիփսիմե Մարտիրոսյանին՝ (37410) 51 25
61 հեռախոսահամարով:
Համաձա՞յն եք մասնակցել:
Շնորհակալություն: Կարո՞ղ ենք շարունակել: