Embed Size (px)
Citation preview
DIAGNOSTIC TWIN SCREW EXTRUDER FOR CHARACTERIZING
FUSION TOKAMAK FUEL PRODUCTION
By
JACOB THOMAS FISHER
A dissertation submitted in partial fulfillment of
the requirements for the degree of
DOCTORATE OF PHILOSOPHY OF MECHANICAL ENGINEERING
WASHINGTON STATE UNIVERSITY
School of Mechanical and Materials Engineering
JULY 2015
ii
To the Faculty of Washington State University:
The members of the Committee appointed to examine the
dissertation of JACOB THOMAS FISHER find it satisfactory and
recommend that it be accepted.
___________________________________
Jacob W. Leachman, Ph.D., Chair
___________________________________
Prashanta Dutta, Ph.D.
___________________________________
Robert H. Dillon, Ph.D.
___________________________________
John S. McCloy, Ph.D.

iii
DIAGNOSTIC TWIN SCREW EXTRUDER FOR CHARACTERIZING
FUSION TOKAMAK FUEL PRODUCTION
Abstract
by Jacob Thomas Fisher, Ph.D.
Washington State University
July 2015
Chair: Jacob W. Leachman
Fusion tokamaks require highly reliable fuel production systems to sustain reactions and
continuously produce energy. For example, the ITER tokamak design specifies a control
accuracy of 5 % for fueling. Counter rotating twin screw extrusion has a long history of success
in the polymer industry and is theoretically the most reliable and efficient method for
continuously producing hydrogenic fuel for fusion tokamaks. However, hydrogenic fuel
solidifies at extremely low temperatures (in the range 10 – 30 K) so extruders designed for this
extreme operational environment are fundamentally different and initial prototypes have had
problems with stalling and rapid expulsion. Polymer extrusion has benefited from specially
designed extruder experiments for characterizing heat transfer and fluid flow. Data from these
experimental machines has validated throughput models used to create characteristic curves for
optimizing extruder performance. Currently there is no data to develop or validate throughput
models for hydrogenic twin screw extrusion and no extruder experiment built for collecting such
data. The only option for fusion scientists is to improve prototypes iteratively, costing significant
time and resources. The objective of this research is to design an experiment that produces
fundamental data for characterizing hydrogenic twin screw extruders. The Diagnostic Twin

iv
Screw Extruder (DTSE) was designed specifically for characterization with a unique operating
cycle and instrumentation including temperature sensors embedded in the screws. A full
description of the DTSE design and operation is presented. Data has been collected from
processing solid hydrogen, deuterium, and neon. Data analysis has shown heat transfer and fluid
flow characteristics for reference when diagnosing extruder operation. Basic heat transfer
predictions have been compared to experimental data to show how models can be developed
using the DTSE. The DTSE enables fusion engineers to develop characteristic curves for
designing reliable twin screw extruders for fueling ITER and other future tokamaks.

v
TABLE OF CONTENTS
Page
Abstract .................................................................................................................................... iii
LIST OF TABLES ................................................................................................................. viii
LIST OF FIGURES ............................................................................................................... viii
CHAPTER 1: INTRODUCTION ............................................................................................. 1
1.1 Fueling the ITER Tokamak .......................................................................................... 1
1.1.1 Fusion energy .............................................................................................................. 1
1.1.2 Pellet Injection System for ITER ................................................................................ 3
1.2 Twin Screw Extrusion for ITER ................................................................................... 5
1.3 Special Considerations for Hydrogenic TSEs............................................................... 9
1.4 Current Hydrogenic TSE Models ............................................................................... 10
1.5 Strategic Approach...................................................................................................... 11
References ......................................................................................................................... 13
CHAPTER 2: STATE OF THE ART ..................................................................................... 14
2.1 Piston extrusion research ............................................................................................ 14
2.2 Single Screw Extruder ................................................................................................ 19
2.2.1 Development of Hydrogenic Single Screw Extruders .............................................. 19
2.2.2 Single Screw Extruder Modeling .............................................................................. 24
2.3 Twin Screw Extrusion................................................................................................. 27
2.3.1 Hydrogenic twin screw extruder development ......................................................... 27
2.3.2 Design calculations for hydrogenic TSE .................................................................. 30
2.3.3 Rheology of solid cryogens ...................................................................................... 33

vi
2.3.4 Heat transfer modeling of hydrogenic TSE .............................................................. 35
2.3.5 Characterizing Polymer Twin Screw Extruders ....................................................... 38
References ......................................................................................................................... 42
CHAPTER 3: MODELING .................................................................................................... 45
3.1 Shear Rates and Viscous Dissipation .......................................................................... 45
3.2 Constitutive Equations ................................................................................................ 47
3.3 Energy Balance ........................................................................................................... 50
3.4 1-D Finite Difference Method .................................................................................... 51
References: ........................................................................................................................ 53
CHAPTER 4: THE DIAGNOSTIC TWIN SCREW EXTRUDER ....................................... 54
4.1 Auxiliary Systems ....................................................................................................... 55
4.1.1 Vacuum System ........................................................................................................ 55
4.1.2 Gas Manifold ............................................................................................................ 56
4.1.3 Thermal Radiation Shielding .................................................................................... 58
4.1.4 Cryocooler and Cooling Loop .................................................................................. 60
4.1.5 Sensing ...................................................................................................................... 61
4.1.6 Temperature Controllers ........................................................................................... 63
4.1.7 DAQ and User Interface ........................................................................................... 63
4.1.8 Pressure Seals and Wire Feedthroughs ..................................................................... 65
4.2 DTSE Design .............................................................................................................. 67
4.2.1 Powertrain ................................................................................................................. 68
4.2.2 Extruder Body and Screws........................................................................................ 70
4.2.3 Nozzle and Circulation Loop .................................................................................... 73

vii
4.2.4 Modularity................................................................................................................. 75
4.3 Experimental Procedures ............................................................................................ 76
4.3.1 Evacuating, Purging, and Charging Procedures ....................................................... 76
4.3.2 Steady State Operating .............................................................................................. 77
4.3.3 Idle State and Warm-up Procedures ......................................................................... 79
4.4 Uncertainty .................................................................................................................. 79
CHAPTER 5: RESULTS ........................................................................................................ 82
5.1 Experimental Results: Controlling Barrel Temperature ............................................. 82
5.1.1 Comparing screw and barrel temperatures ............................................................... 82
5.1.2 Comparing Torque and Barrel Temperature ............................................................. 89
5.2 Experimental Results: Controlling Screw Speed ........................................................ 92
5.2.1 Comparing Temperature and Screw Speed............................................................... 92
5.2.2 Comparing Torque and Screw Speed ....................................................................... 94
5.3 Experimental Results: Controlling Nozzle Area and Location................................... 94
5.3.1 Comparing Temperature and Nozzle Area ............................................................... 95
5.3.2 Comparing Torque and Nozzle Area ........................................................................ 98
5.3.3 Comparing Nozzle Locations ................................................................................... 99
5.4 Experimental Results: Viscous Dissipation .............................................................. 101
5.5 Experimental Results: Controlling Circulation Loop Heater Power ........................ 104
5.6 Modeling Results: Guiding Development of a Basic Heat Transfer Model ............. 105
5.6.1 Convection heat transfer coefficient ....................................................................... 105
5.6.2 Azimuthal temperature variations ........................................................................... 108
References: ...................................................................................................................... 110

viii
CHAPTER 6: CONCLUSION ............................................................................................. 111
6.1 Concluding Remarks ................................................................................................. 111
6.2 Method for Characterizing Hydrogenic Twin Screw Extruders ............................... 113
6.3 Future Work .............................................................................................................. 114
References: ...................................................................................................................... 116
LIST OF TABLES
Page
Table 2.1 Values of terms in Leachman shear stress model. .........................................................34
Table 3.1 Temperature dependent property formulas ....................................................................47
Table 4.1 Experiment uncertainty values. .....................................................................................80
Table 5.1 Predicted torque for augmented gap temperature scenarios ........................................109
LIST OF FIGURES
Page
Figure 1.1 Section view rendering of the ITER tokamak. .............................................................. 3
Figure 1.2 Rendering of pellet injection guide tube locations on ITER. ........................................ 4
Figure 1.3 Proposed TSE for ITER................................................................................................. 6
Figure 1.4 Sketch of c-chamber ...................................................................................................... 7
Figure 1.5 Leakage gap locations. .................................................................................................. 8
Figure 2.1 Early piston extruder. .................................................................................................. 15
Figure 2.2 Repeating three-barrel pellet injector .......................................................................... 16
Figure 2.3 High throughput piston extrusion system. ................................................................... 18

ix
Figure 2.4 TPOP-II piston extruder for extruding tritium. ........................................................... 19
Figure 2.5 Tritium extruded rod (left) and pellet (right). .............................................................. 19
Figure 2.6 Single screw extruder for solid hydrogen. ................................................................... 21
Figure 2.7 H2 single screw extruder throughput data for various barrel temperatures (left) and
screw speeds (right). ..................................................................................................................... 22
Figure 2.8 Solid rod of deuterium from single screw extruder. .................................................... 23
Figure 2.9 Vinyar et al. model results for solid hydrogen extrusion pressures at screw speeds (1)
10, (2) 15, (3) 20, and (4) 25 rpm and nozzle pressures at (a) 10 K and (b) 11 K. ....................... 26
Figure 2.10 Vinyar et al. single screw extruder experiment and model results............................ 27
Figure 2.11 Rendering of 1st ORNL prototype D2 twin screw extruder. ...................................... 28
Figure 2.12 ORNL prototype 1 throughput performance for various barrel temperatures (left) and
screw speeds (right). ..................................................................................................................... 29
Figure 2.13 Schematic of 2nd ORNL prototype D2 twin screw extruder. ..................................... 30
Figure 2.14 Twin screw extruder geometric variables.................................................................. 32
Figure 2.15 Couette viscometer for rheology studies of solid cryogens....................................... 34
Figure 2.16 Shear stress measurements and model predictions for H2 (left), D2 (center), and Ne
(right). ........................................................................................................................................... 35
Figure 2.17 Diagram for heat transfer in control volume. ............................................................ 36
Figure 2.18 Model predictions for deuterium temperatures along barrel. .................................... 38
Figure 2.19 Characteristic curves for twin screw extruders with thick (left) and thin (right)
flights. ........................................................................................................................................... 39
Figure 2.20 Characteristic TSE curve for non-isothermal and non-Newtonian fluids is non-linear.
....................................................................................................................................................... 40

x
Figure 2.21 Screws are removed to measure fully filled length in thick (top) and thin flight
(bottom) polymer TSE’s. .............................................................................................................. 41
Figure 3.1 Heat capacity of hydrogen augmented to include latent heat of fusion during phase
change. .......................................................................................................................................... 49
Figure 3.2 Density of hydrogen at various temperatures. ............................................................. 49
Figure 3.3 viscosity of hydrogen at various temperatures. ........................................................... 50
Figure 3.4 Shear stress of hydrogen at various temperatures and shear rates............................... 50
Figure 4.1 DTSE experiment setup front view. ............................................................................ 54
Figure 4.2 DTSE experiment setup back view. ............................................................................ 55
Figure 4.3 Vacuum system: (1) chamber, (2) valve, (3) controller, (4) vent line, (5) vacuum
gauge, (6) line to gas manifold, (7) roughing pump, and (8) turbo pump. ................................... 56
Figure 4.4 Gas manifold controls process gas in the extruder. ..................................................... 57
Figure 4.5 Manifold discharge port and pressure relief valves vent to a fume hood. ................... 58
Figure 4.6 Copper thermal radiation shield and MLI blanket enclose the extruder. .................... 59
Figure 4.7 Cryocooler (left) and plate heat exchanger (right) cool the experiment. .................... 60
Figure 4.8 Torque sensor being calibrated (left) and during extruder operation (right). .............. 61
Figure 4.9 RuOx sensor (left) is installed in the extruder screw thread (right). ........................... 62
Figure 4.10 Data acquisition controller for sampling and generating signals. ............................. 64
Figure 4.11 User interface for controlling and monitoring DTSE. ............................................... 64
Figure 4.12 Compressed indium wire is used for cryogenic pressure seals. ................................ 66
Figure 4.13 Shaft wire feedthroughs with rotating connector assembly and vacuum chamber
feedthrough transfer signals across pressure vessel walls. ........................................................... 66
Figure 4.14 Conceptual rendering of experiment: ........................................................................ 67

xi
Figure 4.15 DTSE drive train and close-ups of gear set and bearing block: ................................ 69
Figure 4.16 Rendering of DTSE cross-section view: ................................................................... 73
Figure 4.17 Nozzle gaskets (left) go in circulation loop (right) that connects the extruder outlet to
the feedzone and liquefies extrudate. ............................................................................................ 74
Figure 5.1 Hydrogen shear stress at various temperatures. .......................................................... 83
Figure 5.2 (hydrogen, ITER nozzle, 4 RPM)................................................................................ 84
Figure 5.3 Level of fill increases with throughput. ....................................................................... 86
Figure 5.4 Screw temperatures for deuterium (left) and neon (right) have similar distribution. .. 87
(D2 with ITER nozzle at 4 rpm, Ne with 48 mm3 nozzle at 5 rpm) .............................................. 87
Figure 5.5 Azimuthal temperature profiles for H2 extrusion at barrel temperature of 13.6 K. ..... 88
Figure 5.6 Azimuthal temperature profiles for H2 extrusion at barrel temperature of 11.5 K. ..... 88
Figure 5.7 Converging end of intermeshing zone creates high pressure (pluses). ....................... 89
Figure 5.8 Extruder torque for H2 extrusions at various barrel temperatures. .............................. 90
Figure 5.9 Extruder torque for D2 extrusions at various barrel temperatures and 4 rpm. ............. 91
Figure 5.10 Extruder torque for Ne extrusions at constant speed and various barrel temperatures.
....................................................................................................................................................... 92
Figure 5.11 Barrel and screw temperatures increase with screw speed at constant barrel
temperature for H2 extrusions. ...................................................................................................... 93
Figure 5.12 Screw temperature period decreases with increasing screw speed for H2 extrusions.
....................................................................................................................................................... 93
Figure 5.13 Torque at various screw speeds and constant cooling powers for H2, D2, and Ne. ... 94
Figure 5.14 Screw temperatures are higher for H2 extrusions using the nozzle blank (right)
compared to the open ITER nozzle (left) at 4 rpm. ...................................................................... 97

xii
Figure 5.15 Torque comparison between blank gasket and ITER nozzle for H2 extrusions at
various barrel temperatures and constant screw speed of 4 rpm. ................................................. 98
Figure 5.16 Torque comparison between blank gasket and ITER nozzle for D2 extrusions at
various barrel temperatures and constant screw speed of 4 rpm. ................................................. 99
Figure 5.17 actively cooled nozzle gasket creates lower barrel temperatures, higher screw
temperatures (left) and higher torque (right) than isolated (deuterium, 4 rpm, ITER nozzle) ... 100
Figure 5.18 Parity plot comparison of viscous dissipation and cooling power of H2 extrusions.
..................................................................................................................................................... 102
Figure 5.19 Parity plots for viscous dissipation and cooling power of hydrogen (left) and
deuterium (right) operation at 4 rpm. .......................................................................................... 103
Figure 5.20 circulation loop heater power above 0.5 W decreases extruder torque (deuterium,
constant motor power, low < 0.5 W, high ~ 1 W). ..................................................................... 105
Figure 5.21 Hydrogen temperature distributions at various conduction lengths for fixed barrel
temperature of 11.5 K compared to data from ITER nozzle, 3.5 rpm, and 8.6 W cooling power.
..................................................................................................................................................... 106
Figure 5.22 Hydrogen temperature distributions at constant conduction length (H/2.5) and two
barrel temperatures compared to data from ITER nozzle, ~ 3.33 rpm, 12.2 K barrel (squares), and
11.5 K barrel (diamonds). ........................................................................................................... 107

1
CHAPTER 1: INTRODUCTION
The first section of this chapter introduces the general problem this research addresses by
explaining the application: fusion energy. The second section describes the importance of
hydrogenic twin screw extrusion research. The third section talks about the difficulties of
understanding twin screw extruders that process solid cryogens. The fourth section describes
why other approaches to characterizing hydrogenic extruders cannot fully describe the necessary
operational characteristics. The last section describes the approach taken in this research.
1.1 Fueling the ITER Tokamak
1.1.1 Fusion energy
Fusion is a thermonuclear reaction occurring when two nuclei combine to form a new
particle. The hydrogen isotopes deuterium and tritium have the highest reactivity rate for the
most feasible reaction conditions on earth. Each deuterium-tritium (DT) reaction creates a
helium atom, referred to as an α-particle, and a neutron is liberated. When this occurs, mass is
converted to kinetic energy carried by the resulting particles. The total energy released per
reaction is 17.6 MeV. That is an increase in energy by a factor of 880 when taking the energy
needed for each deuterium and tritium particle to be 10 keV. To put the energy gain of fusion
into perspective; 1 kg of DT fuel can produce 108 kWh of energy. If that energy was converted to
electricity it could power the five boroughs of New York City for approximately a week. Fusion
energy research is focused on turning this theoretical possibility into reality. The primary goal is
for a fusion reaction to reach ignition, when the energy released is enough to sustain further
reactions and no auxiliary heating is needed. Once fusion ignition is achieved, mankind will have
a sustainable thermal energy source.

2
The fusion fuel deuterium (D2) has a natural abundance of about 1 in 6,420 atoms of
hydrogen in sea water. Tritium (T2) can be bred inside a fusion reactor using lithium mined from
the Earth’s crust or extracted from ocean water. These fuel reserves are expected to last on the
order of 10 million years at the current world energy consumption rate of 6x10¹¹ GJ/year
(Wesson 2011). Fusion energy does not produce greenhouse gases or high level radioactive
waste. Fusion only occurs when a reactor is energized so there is no danger of a meltdown.
These attributes of fusion will make energy production safe and sustainable for the future.
Fusion fuel atoms must maintain a temperature on the order of 100 million degrees and
remain relatively close in proximity for a sufficient length of time in order to fuse together.
Superheated deuterons and tritons disassociate from their electrons and become a collection of
charged particles known as plasma. The positive charge of deuterons and tritons allows them to
be manipulated by a magnetic field. The most widely supported plasma containment method for
fusion is a toroidal configuration called a tokamak- a magnetic field in the shape of a doughnut.
The basic science of fusion energy is mature enough to begin working on technical issues
regarding commercial scale reactors. ITER (pronounced ‘eater’) is a tokamak designed to
demonstrate high net gains in fusion power and test components under those conditions (Figure
1.1). It is currently under construction in Aix-en-Provence in southern France but some
components are still in development. Work on the fuel delivery system is being conducted at Oak
Ridge National Laboratory in Oak Ridge, Tennessee, U.S.A.

3
Figure 1.1 Section view rendering of the ITER tokamak.
(ITER)
1.1.2 Pellet Injection System for ITER
ITER will ultimately be fueled by injection of an equal part mixture of deuterium and
tritium (DT). The 50:50 mixture is a collection of D2 and T2 molecules as opposed to the
molecularly bound deuterium-tritide. Experimental studies on smaller tokamaks have shown that
injection of solid fuel at the high field side of the plasma can efficiently deliver fuel particles to
the core (Baylor 2007). The fuel pellet begins to ablate upon entry into the plasma and is insThe
ITER Project Integration Document specifies solid DT pellets with 5 mm diameters injected at a
4
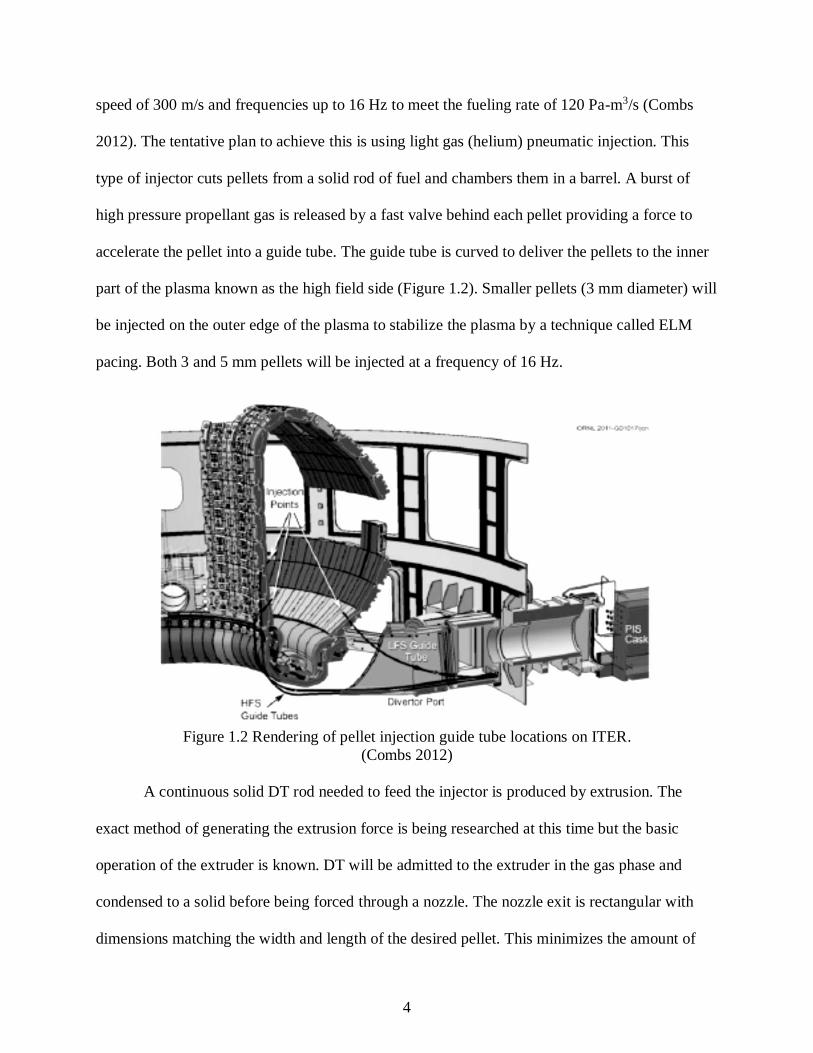
speed of 300 m/s and frequencies up to 16 Hz to meet the fueling rate of 120 Pa-m3/s (Combs
2012). The tentative plan to achieve this is using light gas (helium) pneumatic injection. This
type of injector cuts pellets from a solid rod of fuel and chambers them in a barrel. A burst of
high pressure propellant gas is released by a fast valve behind each pellet providing a force to
accelerate the pellet into a guide tube. The guide tube is curved to deliver the pellets to the inner
part of the plasma known as the high field side (Figure 1.2). Smaller pellets (3 mm diameter) will
be injected on the outer edge of the plasma to stabilize the plasma by a technique called ELM
pacing. Both 3 and 5 mm pellets will be injected at a frequency of 16 Hz.
Figure 1.2 Rendering of pellet injection guide tube locations on ITER.
(Combs 2012)
A continuous solid DT rod needed to feed the injector is produced by extrusion. The
exact method of generating the extrusion force is being researched at this time but the basic
operation of the extruder is known. DT will be admitted to the extruder in the gas phase and
condensed to a solid before being forced through a nozzle. The nozzle exit is rectangular with
dimensions matching the width and length of the desired pellet. This minimizes the amount of

5
solid missed by the injector pellet cutter. The amount of tritium in the extruder must be
minimized due to its radioactivity. Therefore an extruder that can solidify and extrude at a high
rate with little reserve is desired. The triple point temperatures of deuterium and tritium are 18.69
K and 20.62 K, respectively (Souers 1986). Therefore cryogenic techniques are required. Helium
at 4.5 K will be on-hand at ITER to provide the cooling to reach such extreme low temperatures.
The volumetric flow rate of DT required to fuel ITER is 1500 mm3/s considering losses in pellet
formation and delivery.
1.2 Twin Screw Extrusion for ITER
Intermeshing counter-rotating Twin Screw Extruders (TSE) are being considered for
forming solid DT in the ITER Pellet Injection System (PIS). The inherent stability of operation
and the effectiveness in continuously producing extrudate from a relatively small inventory
makes TSE’s favorable for the stringent safety and reliability requirements of the ITER PIS.
Polymer literature lends support to the understanding of basic TSE design and operation. The
basic TSE theory has helped the construction of two prototype deuterium TSE’s for
demonstrating feasibility and performance. The prototypes have shown successful extrusion of
solid D2 strengthening support for TSE use in ITER. However, performance was lower than
predicted by basic TSE theory. It is important to identify the breakdown in the basic TSE theory
and develop a new theory specific to hydrogenic twin screw extruders in order to accurately
design and reliably operate these machines for ITER. Specifics on how polymer extruder
operating principles were found and quantified are given in Chapter 2.
The basic understanding of twin screw extruders begins with their construction. The TSE
construction currently being investigated for ITER consists of a left-hand and right-hand screw
each with approximately square thread profiles (Figure 1.3). The screws are closely conjugated

6
meaning the threads of each screw fit closely into the channels of the opposite screw. Counter-
rotating means the screws rotate in opposite directions: the right-hand screw rotates counter-
clockwise and the left-hand screw rotates clockwise. The screws rotate in a barrel with an 8-
shaped bore down the middle. A nozzle is attached at the bottom of the barrel where the
extrudate is formed into a rod.
Figure 1.3 Proposed TSE for ITER.
(Combs 2012)
The stability of TSE operation comes from the forming of closed volumes of extrudate
between threads. These channels are enclosed on either end by the intermeshing threads of the
opposite screw. This blocks material from rotating with the screw allowing the inclined flight
surfaces of the threads to force the extrudate along the screw axis of rotation (axial direction)
towards the nozzle. The closed volume along one pitch is commonly referred to as a “c-

7
chamber” (Figure 1.4). This configuration creates a constant positive displacement of extrudate
suitable for the ITER PIS.
Figure 1.4 Sketch of c-chamber
(van der Goot 1996)
Theoretically the volume of two c-chambers is displaced per one full rotation of the
screws. In reality leakage flow reduces the amount displaced. Polymer extruder research has
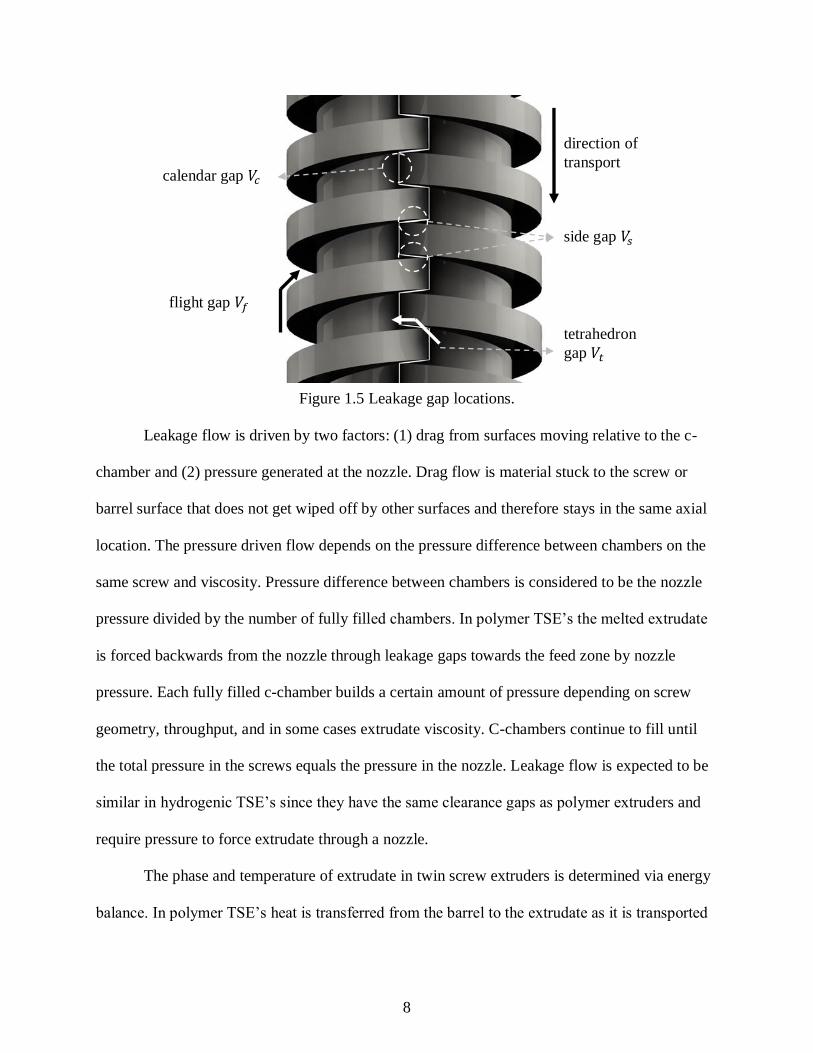
identified 4 clearance gaps where backflow occurs (Figure 1.5):
(1) calendar gap (𝑉𝑐): clearance between screw root and thread tip of opposite screw
(2) side gap (𝑉𝑠): clearance between flight surfaces of intermeshing screws
(3) tetrahedron gap (𝑉𝑡): opening just before edges of threads begin to intermesh
(4) flight gap (𝑉𝑓): clearance between the thread tip and the barrel wall
8
Figure 1.5 Leakage gap locations.
Leakage flow is driven by two factors: (1) drag from surfaces moving relative to the c-
chamber and (2) pressure generated at the nozzle. Drag flow is material stuck to the screw or
barrel surface that does not get wiped off by other surfaces and therefore stays in the same axial
location. The pressure driven flow depends on the pressure difference between chambers on the
same screw and viscosity. Pressure difference between chambers is considered to be the nozzle
pressure divided by the number of fully filled chambers. In polymer TSE’s the melted extrudate
is forced backwards from the nozzle through leakage gaps towards the feed zone by nozzle
pressure. Each fully filled c-chamber builds a certain amount of pressure depending on screw
geometry, throughput, and in some cases extrudate viscosity. C-chambers continue to fill until
the total pressure in the screws equals the pressure in the nozzle. Leakage flow is expected to be
similar in hydrogenic TSE’s since they have the same clearance gaps as polymer extruders and
require pressure to force extrudate through a nozzle.
The phase and temperature of extrudate in twin screw extruders is determined via energy
balance. In polymer TSE’s heat is transferred from the barrel to the extrudate as it is transported
calendar gap 𝑉𝑐
direction of
transport
flight gap 𝑉𝑓
side gap 𝑉𝑠
tetrahedron
gap 𝑉𝑡
9
towards the nozzle. Solid polymer pellets are usually poured into the feed zone then transported
by the screws while heat is applied to the barrel causing the pellets to melt. Viscous dissipation
(shear heating) is generated as extrudate is sheared along moving surfaces which also increases
extrudate temperature and is a factor in melting pellets. These energy terms can be applied to
hydrogenic twin screw extruders to determine thermal management requirements.
Lessons from polymer twin screw extruders show the importance of understanding
extruder operation. Hydrogenic twin screw extruder operation must be understood prior to use
for the ITER PIS. Mathematical models have the benefit of low development cost and increased
utility as opposed to expensive prototype iterations. Therefore a primary goal of this research is
to provide data for validating mathematical models of hydrogenic twin screw extruder operation.
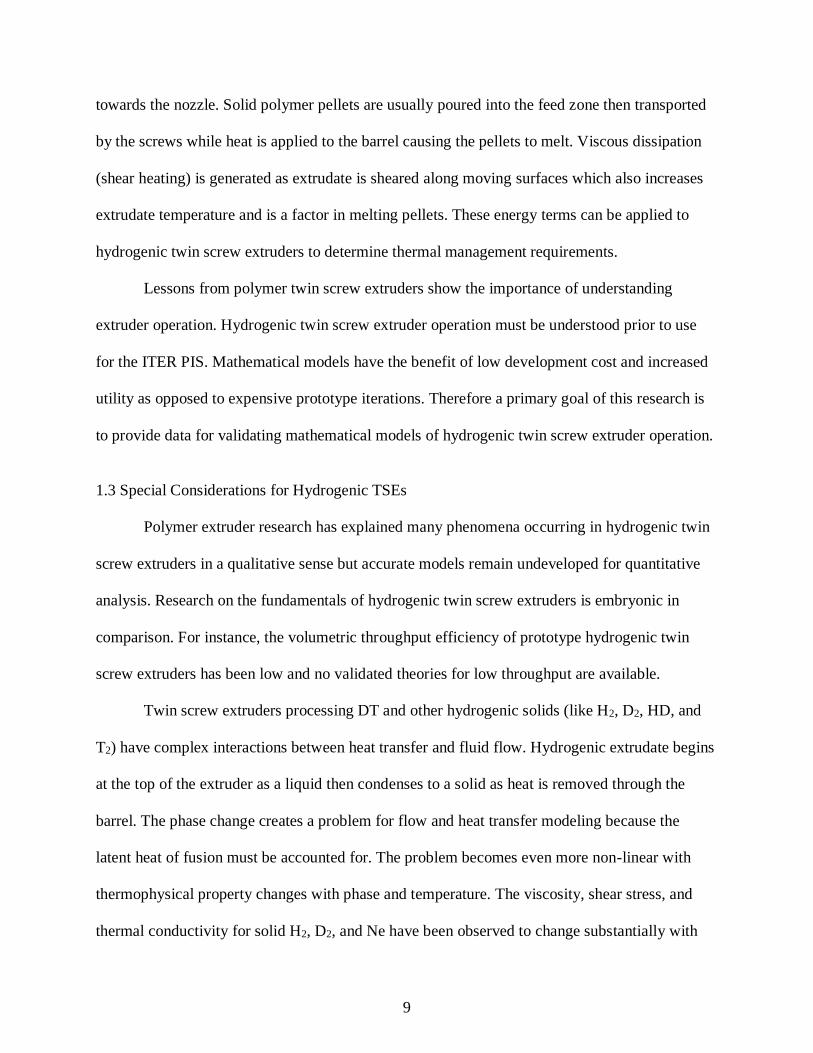
1.3 Special Considerations for Hydrogenic TSEs
Polymer extruder research has explained many phenomena occurring in hydrogenic twin
screw extruders in a qualitative sense but accurate models remain undeveloped for quantitative
analysis. Research on the fundamentals of hydrogenic twin screw extruders is embryonic in
comparison. For instance, the volumetric throughput efficiency of prototype hydrogenic twin
screw extruders has been low and no validated theories for low throughput are available.
Twin screw extruders processing DT and other hydrogenic solids (like H2, D2, HD, and
T2) have complex interactions between heat transfer and fluid flow. Hydrogenic extrudate begins
at the top of the extruder as a liquid then condenses to a solid as heat is removed through the
barrel. The phase change creates a problem for flow and heat transfer modeling because the
latent heat of fusion must be accounted for. The problem becomes even more non-linear with
thermophysical property changes with phase and temperature. The viscosity, shear stress, and
thermal conductivity for solid H2, D2, and Ne have been observed to change substantially with

10
temperature (Leachman et al. 2012). The properties of DT are expected to show the same
characteristics based on the quantum law of corresponding states (Leachman 2011). Analytical
solutions to energy balance and motion equations cannot be reached when the flow is non-
isothermal and non-isoviscous. When heat is removed from the extrudate the temperature
decreases; when the temperature decreases the viscosity increases reducing the leakage rate
which decreases the amount of solid filled chambers; less solid filled chambers means less
viscous dissipation which further reduces the temperature but a decrease in extrudate temperature
increases shear stress which increase viscous dissipation. Energy balance and motion equations
must be solved simultaneously in order to accurately predict TSE operation.
1.4 Current Hydrogenic TSE Models
Research prior to this work has been conducted to model the non-isothermal conditions in
hydrogenic twin screw extruders. A heat transfer model was developed to predict the temperature
of extrudate inside a hydrogenic TSE during steady state operation (Leachman 2010). The model
uses functions for material properties to account for temperature dependency. It solves the
energy balance for the extrudate numerically which was otherwise intractable. However, the
approach does not account for flow leakage which is interrelated with heat transfer as described
above. As a result, the predicted temperature distribution is fundamentally different than the
experimental measurements. A discrepancy in temperature means torque and cooling predictions
also differ from reality. Lastly, without including fluid flow, predicting extruder throughput is
difficult.
Experiments with physical models have not yielded the data needed to validate
mathematical models. The one hydrogenic TSE to produce published data measured the outside
barrel temperature. As will be shown in the results of this work, it is difficult to explicitly

11
determine the extrudate temperature inside the extruder from a barrel temperature measurement
because the barrel has a uniform temperature and the extrudate has a non-uniform distribution
along the length of the barrel. Estimates of extrudate temperature from barrel temperature can be
made if a correlation is developed. The correlation would require extrudate temperature
measurements for validation. Prior to this work, no hydrogenic TSEs exist that can measure
extrudate conditions inside the barrel.
1.5 Strategic Approach
The Diagnostic Twin Screw Extruder (DTSE) has been designed to produce fundamental
measurements of extruder conditions during steady state operation. Sensors are embedded in the
screw threads at three locations along the length of the screws to measure the extrudate
temperature distribution. A circulation loop connects the extruder outlet with the inlet to enable
closed cycle operation to conserve the rare gases tested. The nozzle outlet area can be adjusted
by changing a gasket with different size openings. The extruder is cooled by a single cryogenic
refrigerator for simple low cost operation.
The DTSE has yielded measurements of extrudate temperature, barrel temperature, screw
speed, torque, and cooling power for steady state processing of hydrogen, deuterium, and neon.
The data has elucidated extruder behavior previously un-explainable from adjusting barrel
temperature (cooling power), screw speed, and nozzle area.
The original heat transfer model for hydrogenic twin screw extruders has been revisited.
The model predictions have been compared to measurements from the DTSE showing
discrepancies. An investigation of the terms in the energy balance has highlighted the parameters
responsible for the errant temperature predictions. The torque and cooling power predictions

12
from the basic model have been compared to experimental results. An outline for using DTSE
data for developing predictive throughput models is presented.
The objective of this research is to design an experiment that produces fundamental data
for characterizing hydrogenic twin screw extruders. The contributions to the field made during
this project are
1. Designed the first ever hydrogenic extruder that circulates extrudate, has temperature
sensors in the screws, can change nozzle restrictions by replacing a copper gasket, and is
cooled by a cryocooler. This gives fusion engineers an instrument to test hypotheses for a
large number of scenarios over a virtually unlimited amount of extrusion time.
2. Collected and analyzed H2, D2, and Ne data explaining barrel temperature, screw speed,
and nozzle area effects providing fusion scientists a reference for diagnosing extruder
operation.
3. Explained the methodology of comparing DTSE data to theoretical predictions to guide
and validate mathematical models. This approach can be used to develop a scalable
predictive throughput model to generate TSE specifications for fueling ITER and other
tokamaks.

13
References
Baylor, L.R., Parks, P.B., Jernigan, T.C., Caughman, J.B., Combs, S.K., Foust, C.R., Houlberg,
W.A., Maruyama, S., Rasmussen, D.A., “Pellet Fuelling and Control of Burning Plasmas in
ITER,” Nuclear Fusion, Vol. 47, 443-448, (2007).
Combs, S.K., Baylor, L.R., Meitner, S.J., Caughman, J.B.O., Rasmussen, D.A., Maruyama, S.,
“Overview of Recent Developments in Pellet Injection for ITER,” Fusion Engineering and
Design, Vol. 87, 634-640, (2012).
How, J., “Project Integration Document,” ITER Organization, ITER_D_2234RH, Version 3.0,
152, (2007).
ITER, “ITER – The Way to New Energy,” Web, accessed January 20, 2015.
Jiang, Q., “Modeling Flow, Melting, Solid Conveying and Global Behavior in Intermeshing
Counter-rotating Twin Screw Extruders,” Dissertation, University of Akron, (2008).
Leachman, J.W., “Thermophysical Properties and Modeling of a Hydrogenic Pellet Production
System,” Dissertation, University of Wisconsin-Madison, (2010).
Leachman, J.W., “Visco-plastic Flow Predictions of Solidified Deuterium Tritium Mixtures,”
Fusion Science and Technology, Vol. 60, 486-490, (2011).
Leachman, J.W., Pfotenhauer, J., Nellis, G., “Dynamic Shear Stress and Heat Transfer of Solid
Hydrogen, Deuterium, and Neon,” J. Appl. Phys., 111, (2012).
Meitner, S.J., Baylor, L.R., Combs, S.K., Fehling, D.T., Foust, C.R., McGill, J.M., Rasmussen,
D.A., Maruyama, S., “Twin-Screw Extruder and Pellet Accelerator Integration Developments for
ITER,” 24th Symposium on Fusion Energy, (2011).
Souers, P.C., Hydrogen Properties for Fusion Energy, University of California Press, pg. 48,
(1986).
Van der Goot, A.J., “The Extruder as a Polymerisation Reactor for Styrene Based Polymers,”
Dissertation, University of Groningen, (1996).
Wesson, J., Tokamaks, Oxford University Press, 4th Edition, (2011).

14
CHAPTER 2: STATE OF THE ART
A literature review has been conducted to determine the state of the art for hydrogenic
twin screw extrusion. Hydrogenic twin screw extrusion is a solution to a broader topic:
continuous solidification of hydrogenic material. Advancements in this field are important
because the ITER tokamak requires continuous and reliable injection of solid hydrogenic pellets
to fuel plasma. Currently there is no system that has met all ITER fueling specifications.
Research relating to pellet injection has provided literature on three main methods for
producing solid hydrogenic material as highlighted in Sections 2.1, 2.2, and 2.3. Twin screw
extrusion is theoretically the best method of the three for providing solid fuel for fusion
tokamaks. This argument is supported by literature in Section 2.3.1. The reason twin screw
extrusion has not met tokamak requirements already is prototypes have uncovered operating
issues that have not been explained (also in Section 2.3.1). Mathematical modeling that could
explain the operating issues has been hindered by a lack of experimental data from TSE’s and
unknown properties of hydrogenic solids as shown in Section 2.3.2. Research gathered on
thermophysical properties of hydrogenic solids is covered in Section 2.3.3. Lastly, a lone study
on heat transfer modeling of hydrogenic twin screw extrusion has provided a start to explaining
prototype problems (Section 2.3.4).
2.1 Piston extrusion research
Arguably the simplest method to produce a stream of solid is to freeze a billet in a
cylinder and force it through a nozzle with a piston. Such were the early extruders for pellet
production (Figure 2.1). In the United Kingdom, Taylor et al. built one of the first extruders
specifically for solid hydrogen (Taylor 1969). The throughput requirements for the laser
irradiation experiment were much less extreme than fueling fusion tokamaks: the extruder fed an

15
injector operating at 4 pellets per minute. The pellets were 0.25 mm in length and diameter and
the extruder held a batch of 150 pellets. To put the size of this pellet production system in
perspective, it would take 1.2 million of these to produce the instantaneous volumetric flow rate
required by ITER.
The design of the piston extruder described by Taylor et al. has features that withstood
the advancements that culminated in the extruder designs seen today. Indium was used to seal the
flanges of pressure vessels that were subjected to low temperature operation. The nozzle was
warmed 1-2 K above the melting point to reduce breakaway shear strength at the beginning of
the extrusion. Qualitative analysis of solid extrudate was done by photography. Physical
connections to room temperature sinks were actively cooled (Figure 2.1).
Figure 2.1 Early piston extruder.
(Combs 1993)

16
Piston extruder based pellet injectors reached peak performance with the repeating three-
barrel injector for the Joint European Torus (JET) tokamak (Figure 2.2). The injector was
designed by Oak Ridge National Laboratory (ORNL) to produce 2.7, 4, and 6 mm diameter
pellets and inject them at frequencies of 5, 2.5, and 1 Hz, respectively (Combs 1989). The ORNL
extruder had three separate piston extruders creating frozen deuterium for three individual gun
barrels. It was capable of an instantaneous volumetric flow rate of 373 mm3/s (assuming pellet
length equaled diameter). Its flow rate was a marked improvement compared to the early injector
by Taylor et al. However, the flow rate was still below the ITER requirement of 1500 mm3/s and
the duration was only 15 seconds as limited by the volume of the freeze cylinders. Larger
volume three-barrel units would be required to meet the ITER operating pulse of 3000 seconds.
Figure 2.2 Repeating three-barrel pellet injector
(Combs 1989)
motor/screw-press
drive unit for solid
deuterium extruder
cryogenic
blocks
gun barrel
pellet chambering
mechanism
hydrogen
propellant
valve

17
The extruder design for the JET repeating three-barrel injector was modified to double
the solid capacity to increase piston extrusion throughput and duration shown in Figure 2.3
(Combs 1998). The nozzle openings were increased to 10 mm diameter round holes for all three
extruders. An experiment to demonstrate high throughput was done using solid deuterium at
barrel temperatures of 14 K. All three extruders were operated at the same time to achieve an
instantaneous throughput of 1300 mm3/s. Although the solid D2 was not formed into pellets and
injected repeatedly, the high throughput was very close to the ITER specification. Effectively
continuous throughput was demonstrated using solid hydrogen at barrel temperatures of 10 K.
The extruders were computer controlled to operate one after another to deliver a steady
throughput of 330 mm3/s for 1 hour. Extrusion speed was increased for a short period
successfully demonstrating throughput of 670 mm3/s.
These experiments showed that piston extrusion could be extrapolated to meet ITER
throughput requirements for throughput and duration. ORNL suggested 1 to 3 additional
extruders of the same design (4 to 6 total) to insure an extruder would be filled with solid in time
to maintain ITER level throughput. Multiple piston extruders are a concern for the high
reliability requirement of ITER fueling. Each extruder added improves availability but also
increases the potential for leaks and increases complexity. Complexity is an obvious problem for
designing and controlling the extruders. Mitigating leaks is a major concern for ITER operation
because of the use of radioactive tritium. By the same token, the volume of solid fuel must be
limited and increasing the number of extruders increases the tritium inventory. Tritium has a 12.3
year half-life making it a fervent producer of gamma radiation.

18
Figure 2.3 High throughput piston extrusion system.
(Combs 1998)
Solid pure tritium and deuterium-tritium mixtures have been extruded using a piston
extruder as part of pellet fueling research for ITER (Fisher 1996). The Tritium Proof of Principle
phase two (TPOP-II) experiment used a piston extruder to feed solid T2 and DT to a repeating
pneumatic injector (Figure 2.4). The nozzle outlet was a 5.5 by 9.5 mm rectangle. The pellet
cutter punched out pellets that were 7.5 mm diameter and 7.5 mm long (after considering
forming and erosion). The injector operated at a pellet frequency of 1 Hz and the inventory was
large enough to produce > 10 pellets consecutively. The freeze zone was maintained at 13 K. The
decay heat of tritium was deemed not a problem for cooling or extruding even for the relatively
large volume and thick stream of solid. Helium impurities formed from tritium decay were as
large as 1 % but did not affect extruder performance as seen in the photographs of clear solid
tritium extruded rod and pellet in Figure 2.5.

19
Figure 2.4 TPOP-II piston extruder for extruding tritium.
(Fisher 1998)
Figure 2.5 Tritium extruded rod (left) and pellet (right).
(Fisher 1998)
2.2 Single Screw Extruder
2.2.1 Development of Hydrogenic Single Screw Extruders
The hydrogenic single screw extruder was developed in response to the limited
throughput duration of a piston extruder and the tritium inventory and reliability involved with

20
sequencing multiple piston extruders to achieve continuous extrusion (Vinyar 1997, 2000b).
Single screw extruders use inclined flights to force material towards the nozzle. The rotating
inclined flights create a constant axial pressure enabling continuous extrusion. Viscosity creates
a velocity gradient in the extrudate slowing its azimuthal motion near the barrel wall and
allowing it to be forced axially. Viscosity of hydrogenic solids decreases with increasing
temperature. Therefore extrudate temperature increase from heat generated by viscous
dissipation can severely limit throughput.
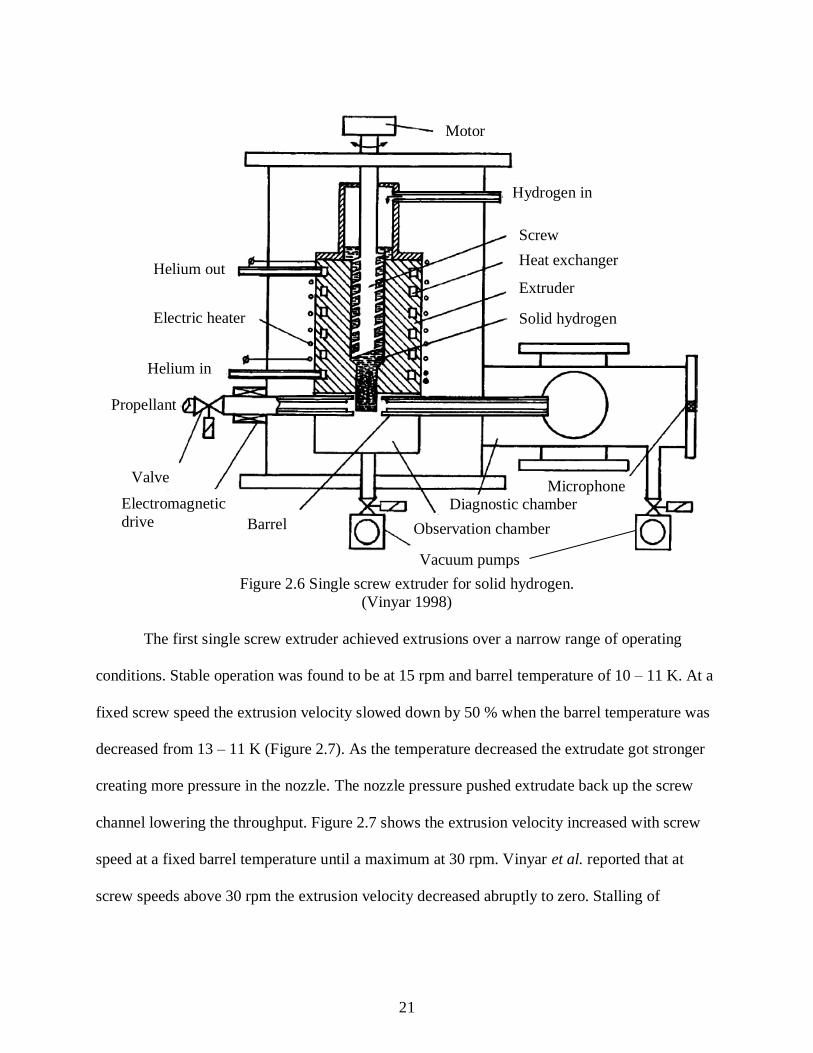
The first hydrogenic single screw extruder for pellet production was designed by Vinyar
et al. (Vinyar 1997). It had a 12 mm diameter screw, 12 mm pitch, 150 mm long barrel, and was
designed to extrude solid hydrogen (Figure 2.6). It demonstrated continuous throughput of
approximately 60 mm3/s for more than 30 minutes approaching the expected pulse duration of
ITER (50 minutes). The extruder contained no more than 5 cm3 of solid during operation proving
efficient production of solid with minimal inventory. This experiment validated the single screw
extruder as a continuous hydrogenic extrusion method.
21
Figure 2.6 Single screw extruder for solid hydrogen.
(Vinyar 1998)
The first single screw extruder achieved extrusions over a narrow range of operating
conditions. Stable operation was found to be at 15 rpm and barrel temperature of 10 – 11 K. At a
fixed screw speed the extrusion velocity slowed down by 50 % when the barrel temperature was
decreased from 13 – 11 K (Figure 2.7). As the temperature decreased the extrudate got stronger
creating more pressure in the nozzle. The nozzle pressure pushed extrudate back up the screw
channel lowering the throughput. Figure 2.7 shows the extrusion velocity increased with screw
speed at a fixed barrel temperature until a maximum at 30 rpm. Vinyar et al. reported that at
screw speeds above 30 rpm the extrusion velocity decreased abruptly to zero. Stalling of
Helium out
Helium in
Hydrogen in
Motor
Screw
Extruder
Solid hydrogen Electric heater
Valve
Electromagnetic
drive Barrel
Vacuum pumps
Observation chamber
Microphone
Heat exchanger
Propellant
Diagnostic chamber

22
extrusion at a high screw speed was presumed to be from high heat generation due to high shear
rate of solid hydrogen in the barrel.
Figure 2.7 H2 single screw extruder throughput data for various barrel temperatures (left) and
screw speeds (right).
(Vinyar 1998)
Hydrogenic single screw extruders began improving with a design to extrude deuterium
for the fusion tokamak Tore Supra (Vinyar 2000b). The original single screw extruder from
Vinyar et al. was modified by increasing the screw and barrel length. The intent was to increase
pressure generated by the screw leading to more stable extrusions. This new configuration
produced solid D2 continuously at 94-110 mm3/s for more than 30 minutes with a screw speed of
15 rpm and a barrel temperature of 16 K (Figure 2.8). It is difficult to compare the performance
of this single screw extruder design with the earlier one because they processed different gases.
However, the extrusion velocity was higher for the new design at the same screw speed and
nozzle opening. This extruder by Vinyar et al. showed how screw extrusion could be improved
but was still not performing to the level ITER required.

23
Figure 2.8 Solid rod of deuterium from single screw extruder.
(Vinyar 2000b)
Hydrogenic single screw extruders were incrementally improved after the success of the
H2 and D2 extruder by Vinyar et al. A single screw extruder designed to demonstrate tritium
operation was constructed (Vinyar 2002, 2004). The design was based on the earlier Vinyar et al.
extruder but special attention was given to sealing the radioactive tritium. The rotational motion
from the screw drive motor was transmitted through the extruder pressure vessel wall by a
swinging bellows unit. This allowed robust static copper gaskets to seal the power transmission
into the cryostat. The extruder and pneumatic injector are enclosed in a hermetically sealed
radiation shield to safeguard against exposure. In addition to the tritium safety, the cooling
system was improved by precooling the process gas and actively cooling the thermal shield
surrounding the extruder. The extruder was tested with hydrogen and deuterium but tritium
results were not found.
Single screw extruders were built and installed on 10 fusion experiments including Tore
Supra (France), Large Helical Device (Japan), JT-60 (Japan), EAST (China), and JET (U.K.).
Rod

24
The JET single screw extruder is significant because its 1400 mm3/s throughput makes it the first
screw extruder to demonstrate extrusions close to the fueling requirements of ITER (1500
mm3/s) (Geraud 2012).
2.2.2 Single Screw Extruder Modeling
A mathematical model of flow and heat transfer inside hydrogenic single screw extruders
was made to aid in their design and operation. The detailed derivation can be found in the
referenced manuscript (Vinyar 2000a). The key aspects of the model and its results are discussed
here to highlight the steps specific to hydrogenic extrusions. Vinyar et al. used experimental data
to create empirical formulas of threshold shear stress (𝜏0) and viscosity (𝜇) of solid hydrogen at
temperature (𝑇) in relation to the triple point temperature (𝑇𝑠):
𝜏0 = 0.026𝑒𝑥𝑝[0.28(𝑇𝑠 − 𝑇)]
𝜇 = 0.0027𝑒𝑥𝑝[0.44(𝑇𝑠 − 𝑇)].
Solid hydrogen was thought to behave like a Bingham plastic that acts like a solid below a
threshold shear stress and a viscous fluid above;
�̇� = 0, when 𝜏 ≤ 𝜏0 and
𝜇�̇� = 𝜏, when 𝜏 > 𝜏0.
The throughput (𝑄) of the nozzle was calculated by combining threshold shear stress and
extrudate viscosity from above with pressure drop across the nozzle (∆𝑃), nozzle radius (𝑅), and
nozzle length (𝑙) in the Buckingham equation
𝑄 =𝜋𝑅4
8𝜇
∆𝑃
𝑙[1 −
4
3(
2𝜏0𝑙
𝑅∆𝑃) +
1
3(
2𝜏0𝑙
𝑅∆𝑃)
4
]
A simplified 2D Cartesian coordinate system was used to model the fluid motion inside the
single screw channel. From the equations of motion a system was set up to solve the flux balance
in the axial direction. The fluxes for each pitch length were calculated by integrating the velocity
25
over the channel depth and width. Leakage rate over the thread tip was considered by integrating
the velocity over the gap length and width. The difference of the two flows equaled the net flow
in the axial direction.
Heat transfer effects were considered by setting up an energy balance between the
extrudate and helium cooling channel embedded in the barrel wall. The extrudate energy balance
included axial heat conduction, extrudate enthalpy change, convection heat transfer to the barrel,
and viscous dissipation. The viscous dissipation was calculated from the viscosity and shear rate.
The heat transfer to the barrel wall was influenced by the heat capacity of helium flowing in the
cooling channel. An energy balance for the helium flow was solved to get the cooling rate based
on constant helium temperature.
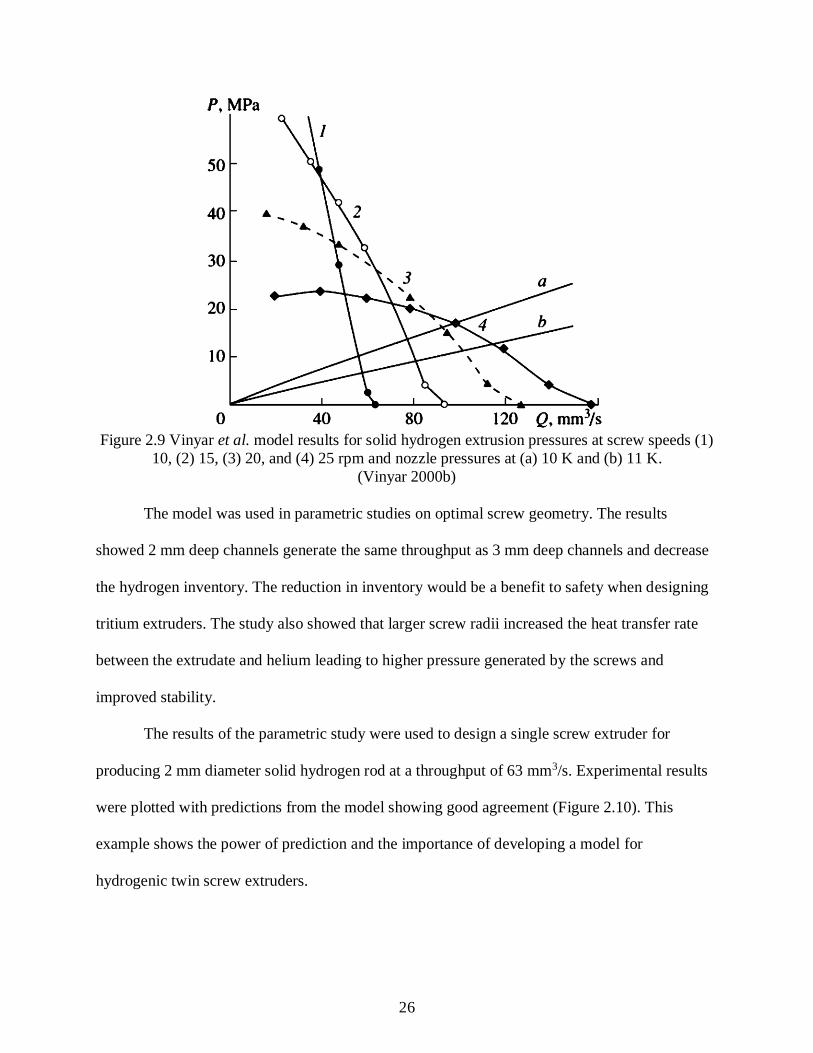
The flow and heat transfer equation were solved simultaneously using numerical
techniques. The result was a model that could calculate throughput based on geometry and
operating parameters. Figure 2.9 shows the results of the model for 4 screw speeds. The
intersection of the extruder and nozzle characteristic curves (from the Buckingham equation)
determines the operating point at those conditions. Throughput is increased dramatically by
increasing screw speed along a fixed nozzle setting. The throughput decreases ~ 25 % if the
nozzle temperature is decreased 11 – 10 K for screw speed of 25 rpm. That much decrease in
throughput from a temperature fluctuation of 1 K is an indication of instability. The lower screw
speeds show more stable operation but considerably less throughput.
26
Figure 2.9 Vinyar et al. model results for solid hydrogen extrusion pressures at screw speeds (1)
10, (2) 15, (3) 20, and (4) 25 rpm and nozzle pressures at (a) 10 K and (b) 11 K.
(Vinyar 2000b)
The model was used in parametric studies on optimal screw geometry. The results
showed 2 mm deep channels generate the same throughput as 3 mm deep channels and decrease
the hydrogen inventory. The reduction in inventory would be a benefit to safety when designing
tritium extruders. The study also showed that larger screw radii increased the heat transfer rate
between the extrudate and helium leading to higher pressure generated by the screws and
improved stability.
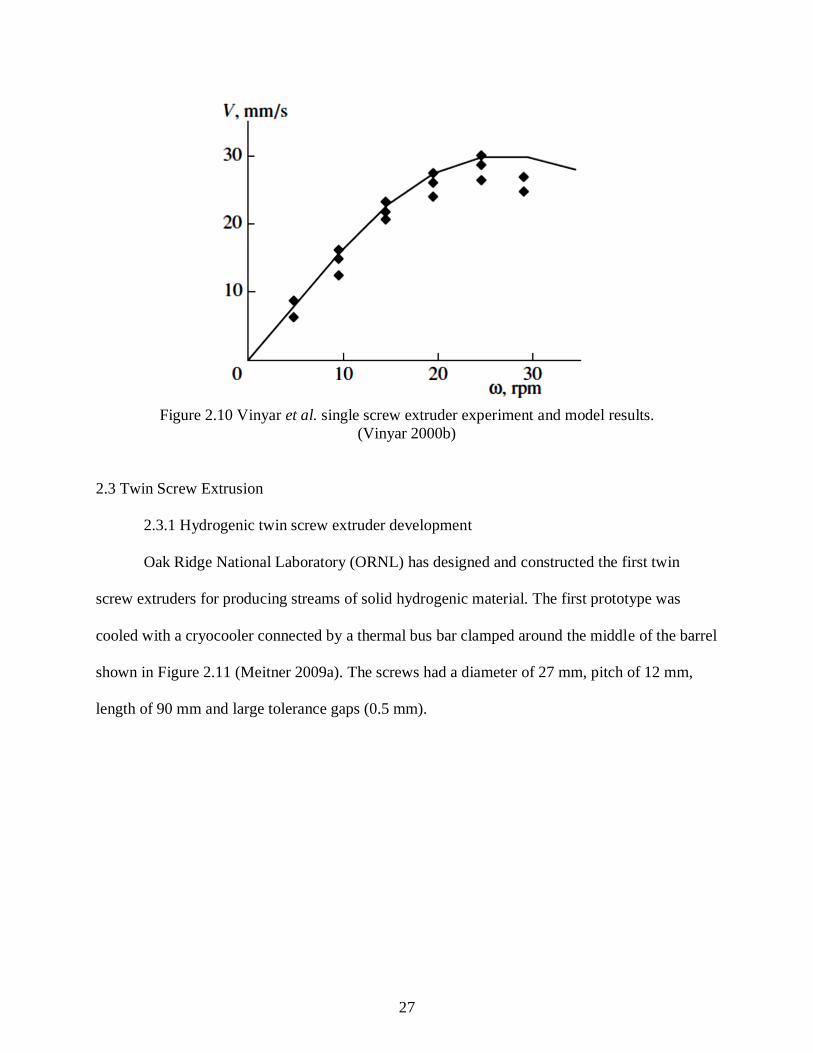
The results of the parametric study were used to design a single screw extruder for
producing 2 mm diameter solid hydrogen rod at a throughput of 63 mm3/s. Experimental results
were plotted with predictions from the model showing good agreement (Figure 2.10). This
example shows the power of prediction and the importance of developing a model for
hydrogenic twin screw extruders.
27
Figure 2.10 Vinyar et al. single screw extruder experiment and model results.
(Vinyar 2000b)
2.3 Twin Screw Extrusion
2.3.1 Hydrogenic twin screw extruder development
Oak Ridge National Laboratory (ORNL) has designed and constructed the first twin
screw extruders for producing streams of solid hydrogenic material. The first prototype was
cooled with a cryocooler connected by a thermal bus bar clamped around the middle of the barrel
shown in Figure 2.11 (Meitner 2009a). The screws had a diameter of 27 mm, pitch of 12 mm,
length of 90 mm and large tolerance gaps (0.5 mm).

28
Figure 2.11 Rendering of 1st ORNL prototype D2 twin screw extruder.
(Meitner 2009a)
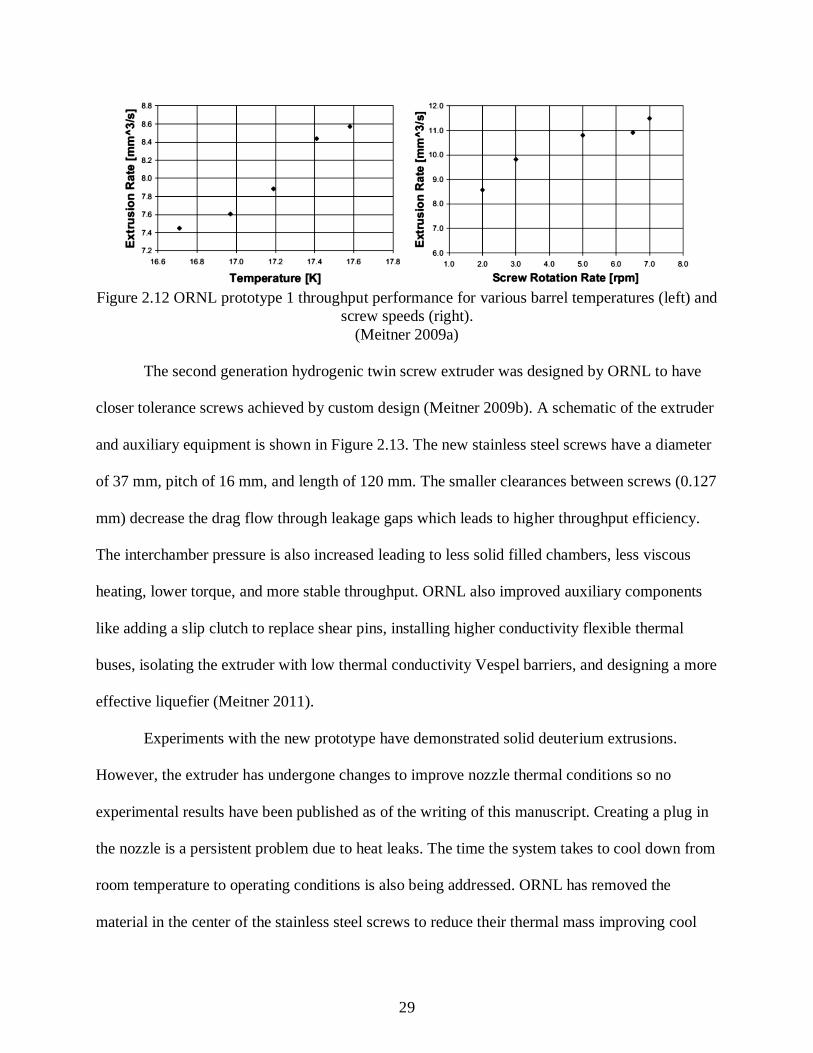
The machine extruded solid deuterium continuously for longer than 20 minutes. The
maximum throughput achieved was 200 mm3/s (Baylor 2009). The throughput decreased with
barrel temperature at a constant screw speed (Figure 2.12). This was most likely because the
decrease in temperature increased viscosity which increased nozzle pressure. An increase in
nozzle pressure requires an increase in the interchamber pressure to maintain throughput.
Interchamber pressure is difficult to build with large clearance gaps and the total pressure build
up is difficult when the extruder is short. The throughput increased with screw speed at a
constant barrel temperature but reached a plateau and the extrusion eventually stalled. The design
inefficiencies found were mainly from qualitative observations because there was no throughput
model to quantify leakage rates or carry out parametric studies. ORNL knew throughput was
below the theoretical amount but could not quantify why.
29
Figure 2.12 ORNL prototype 1 throughput performance for various barrel temperatures (left) and
screw speeds (right).
(Meitner 2009a)
The second generation hydrogenic twin screw extruder was designed by ORNL to have
closer tolerance screws achieved by custom design (Meitner 2009b). A schematic of the extruder
and auxiliary equipment is shown in Figure 2.13. The new stainless steel screws have a diameter
of 37 mm, pitch of 16 mm, and length of 120 mm. The smaller clearances between screws (0.127
mm) decrease the drag flow through leakage gaps which leads to higher throughput efficiency.
The interchamber pressure is also increased leading to less solid filled chambers, less viscous
heating, lower torque, and more stable throughput. ORNL also improved auxiliary components
like adding a slip clutch to replace shear pins, installing higher conductivity flexible thermal
buses, isolating the extruder with low thermal conductivity Vespel barriers, and designing a more
effective liquefier (Meitner 2011).
Experiments with the new prototype have demonstrated solid deuterium extrusions.
However, the extruder has undergone changes to improve nozzle thermal conditions so no
experimental results have been published as of the writing of this manuscript. Creating a plug in
the nozzle is a persistent problem due to heat leaks. The time the system takes to cool down from
room temperature to operating conditions is also being addressed. ORNL has removed the
material in the center of the stainless steel screws to reduce their thermal mass improving cool

30
down time. The reduced thermal mass also helps the system equilibrate faster after operating
conditions are changed.
Figure 2.13 Schematic of 2nd ORNL prototype D2 twin screw extruder.
(Meitner 2011)
2.3.2 Design calculations for hydrogenic TSE
Literature on mathematical modeling of hydrogenic twin screw extrusion has taken a
simplified approach due to the vague understanding of interaction between solid hydrogenic
material and twin screw motion. The rheological properties of solid hydrogenic materials have
had to be investigated simultaneously by TSE researchers. Each branch of the modeling problem
has produced helpful formulas for developing a global throughput model.
31
One of the first publications on calculations for hydrogenic twin screw extruders was a
feasibility analysis (Andrashko 2006). The study looked at throughput, loading from mechanical
pressure, and cooling requirements in order to support the design of the first ORNL hydrogenic
TSE. The throughput was assumed to be equal to the theoretical amount determined by the c-
chamber volume and screw rotation rate.
To calculate the volume of one c-chamber the volume taken up by the flight (𝑉𝑓) and
screw root (𝑉𝑟) over one pitch length (𝑆) is subtracted from the volume of the barrel (𝑉𝑏).
𝑉 = 𝑉𝑏 − 𝑉𝑟 − 𝑉𝑓
where
𝑉𝑏 = {(𝜋 −𝛼
2) (𝑅 + 𝛿)2 + [(𝑅 + 𝛿) −
𝐻 − 𝜎
2] √𝑅(𝐻 − 𝜎) − (
𝐻 − 𝜎
2)
2
} 𝑆
𝑉𝑟 = 𝜋(𝑅 − 𝐻)2𝑆
𝑉𝑓 = 2𝜋 [(𝑅𝐻 −𝐻2
4) 𝐵 + (𝑅𝐻2 −
2
3𝐻3) tan 𝜓]
𝛼 = cos−1 (2𝑅 − 𝐻 + 𝜎
2𝑅)
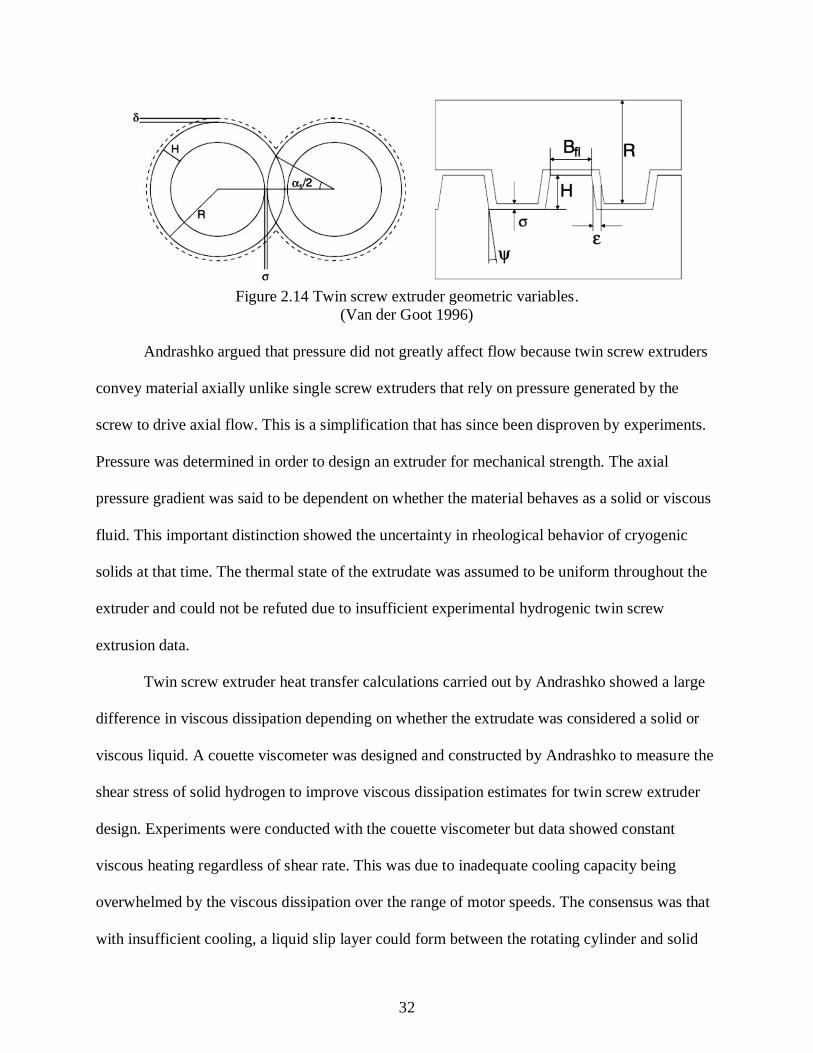
The geometric variables are shown in Figure 2.14. These equations have been used by other
hydrogenic TSE researchers (Meitner 2008, Leachman 2010) and originate from well-known
screw geometry equations in polymer literature (Janssen 1979, White 2003). The actual
throughput is lower than the theoretical amount and can go to zero as seen in experimental
results described in Section 2.3.1. The theoretical throughput was used to estimate the cooling
rate required to condense hydrogenic material at a desired screw speed.
32
Figure 2.14 Twin screw extruder geometric variables.
(Van der Goot 1996)
Andrashko argued that pressure did not greatly affect flow because twin screw extruders
convey material axially unlike single screw extruders that rely on pressure generated by the
screw to drive axial flow. This is a simplification that has since been disproven by experiments.
Pressure was determined in order to design an extruder for mechanical strength. The axial
pressure gradient was said to be dependent on whether the material behaves as a solid or viscous
fluid. This important distinction showed the uncertainty in rheological behavior of cryogenic
solids at that time. The thermal state of the extrudate was assumed to be uniform throughout the
extruder and could not be refuted due to insufficient experimental hydrogenic twin screw
extrusion data.
Twin screw extruder heat transfer calculations carried out by Andrashko showed a large
difference in viscous dissipation depending on whether the extrudate was considered a solid or
viscous liquid. A couette viscometer was designed and constructed by Andrashko to measure the
shear stress of solid hydrogen to improve viscous dissipation estimates for twin screw extruder
design. Experiments were conducted with the couette viscometer but data showed constant
viscous heating regardless of shear rate. This was due to inadequate cooling capacity being
overwhelmed by the viscous dissipation over the range of motor speeds. The consensus was that
with insufficient cooling, a liquid slip layer could form between the rotating cylinder and solid
33
hydrogen. This phenomenon could have profound effects on twin screw extruder operation. The
liquid from solid melting on moving screw surfaces could be easily driven by nozzle pressure
through leakage gaps diminishing throughput.
2.3.3 Rheology of solid cryogens
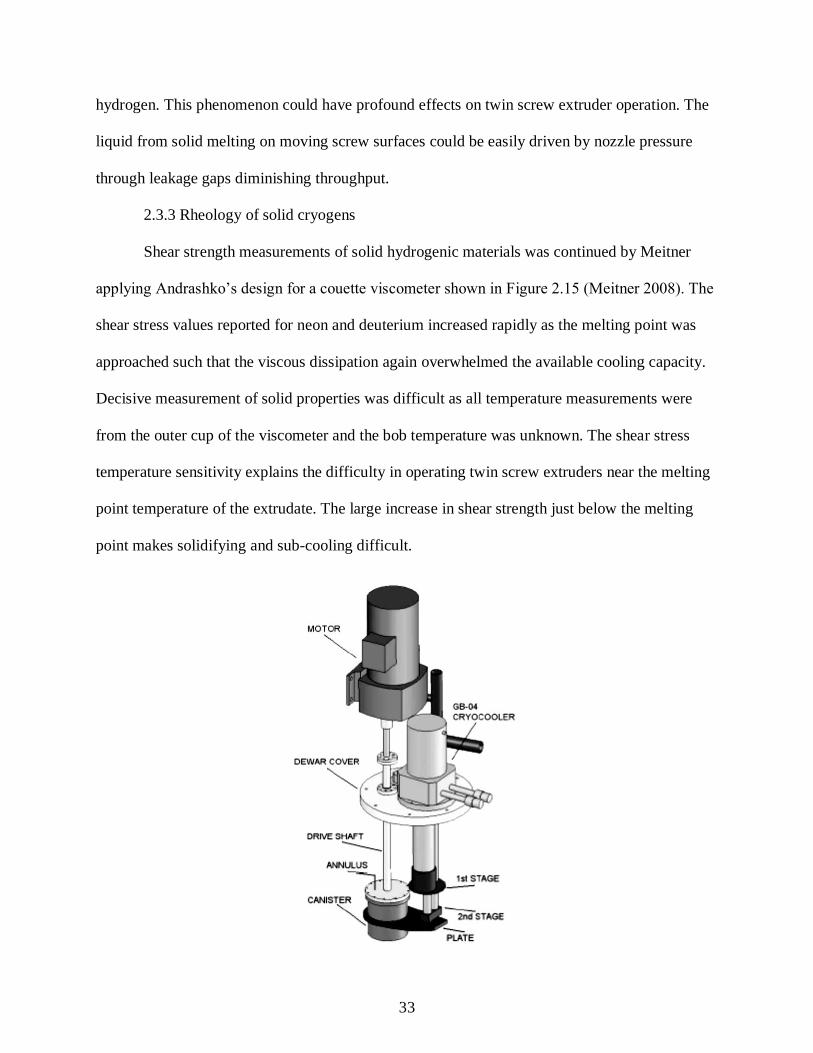
Shear strength measurements of solid hydrogenic materials was continued by Meitner
applying Andrashko’s design for a couette viscometer shown in Figure 2.15 (Meitner 2008). The
shear stress values reported for neon and deuterium increased rapidly as the melting point was
approached such that the viscous dissipation again overwhelmed the available cooling capacity.
Decisive measurement of solid properties was difficult as all temperature measurements were
from the outer cup of the viscometer and the bob temperature was unknown. The shear stress
temperature sensitivity explains the difficulty in operating twin screw extruders near the melting
point temperature of the extrudate. The large increase in shear strength just below the melting
point makes solidifying and sub-cooling difficult.

34
Figure 2.15 Couette viscometer for rheology studies of solid cryogens.
(Meitner 2008)
Leachman redesigned the couette viscometer to reduce the outer bob diameter to less than
25% of original (thereby increasing sensitivity) and incorporating a temperature sensor and
heater within the bob for heat transfer studies. Using this modified viscometer Leachman
obtained steady state viscosity and heat transfer measurements of sub-cooled solid. Empirical
correlations for the shear stress of solid hydrogen, deuterium, and neon were fit by Leachman
using data from the couette viscometer (Leachman 2010). A theoretically derived formula for
shear stress was fitted to the experimental values using an optimization function to find
coefficients. The general form of the shear stress is
𝜏 = 𝑎1 (𝑣0 + 𝑎5𝑇𝑚
𝑎6
𝑣0 + 𝑎5𝑇𝑎6)
𝑎2
+ 𝑎3 (𝑣0 + 𝑎5𝑇𝑚
𝑎6
𝑣0 + 𝑎5𝑇𝑎6)
𝑎4
�̇�𝑛
The coefficients and exponents for the three solid cryogens tested are listed in Table 2.1. Data
from the couette viscometer and curves from the shear stress model are shown in Figure 2.16.
Leachman also created a function for the viscosity of solid hydrogen, deuterium, and neon from
experimental data having the same coefficients as the shear stress function;
𝜇 = 𝑎3 (𝜌
𝜌𝑚)
𝑎4
Table 2.1 Values of terms in Leachman shear stress model.
Parameter (Units) Hydrogen Deuterium Neon
n (-) 0.5 0.5 0.5
a1 (kPa) 17 40.61 56.2
a2 (-) 103.8021 75.5955 24.0683
a3 (kPa-s0.5/mm0.5) 6.74005 15.314 35.5974
a4 (-) 101.505 32.597 66.7655
a5 (μm3/mol-K) 0.000002233 0.000001788 0.00005038
a6 (-) 4.424 4.308 2.974
a7 (-) 1.305 1.2665 --
a8 (-) 0.3052 0.256 --
v0 (μm3/mol) 23.14 19.86 13.38

35
Figure 2.16 Shear stress measurements and model predictions for H2 (left), D2 (center), and Ne
(right).
(Leachman 2010)
2.3.4 Heat transfer modeling of hydrogenic TSE
A basic heat transfer model for hydrogenic twin screw extrusion was developed by
Leachman based on extrudate and barrel wall energy balances during steady state extruder
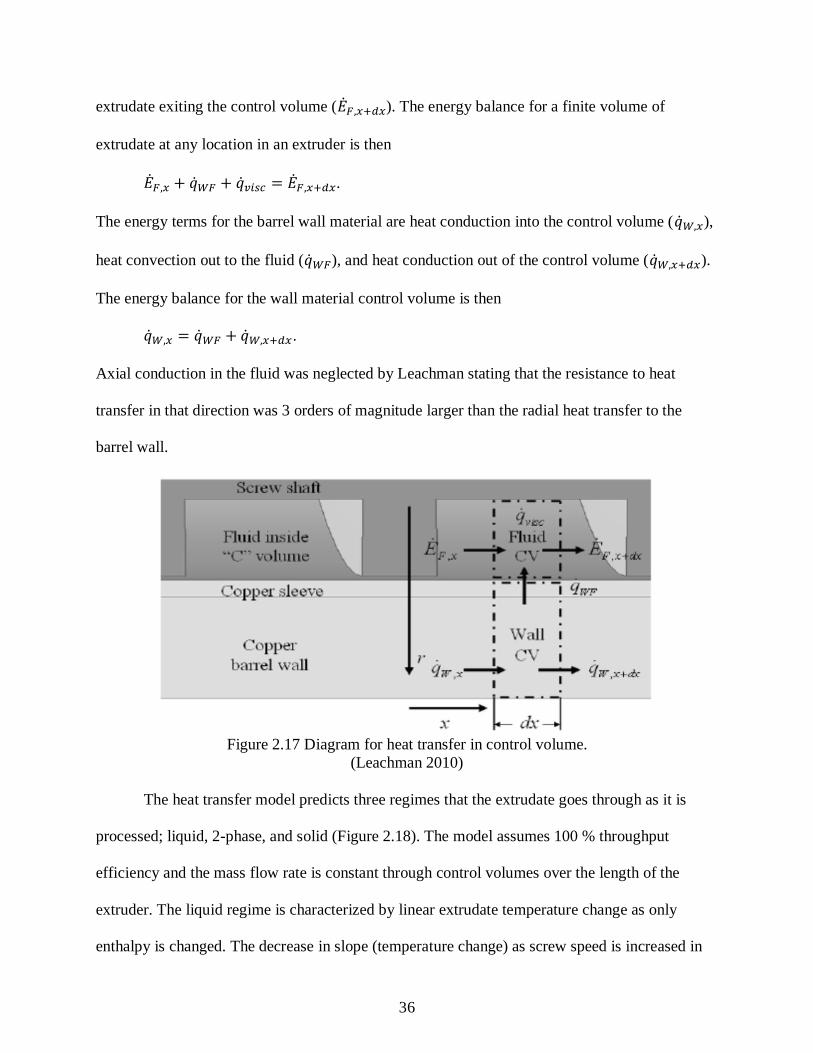
operation (Leachman 2010). In the analysis the energy balance is established for a control
volume between positions x and x + dx along the barrel length (Figure 2.17). The control volume
includes extrudate contained between screw flights on both screws. Heat transfer is considered to
be quasi 1-dimensional. The energy terms for the extrudate are the enthalpy of the extrudate into
the control volume (�̇�𝐹,𝑥), heat convection into the control volume from the barrel wall (�̇�𝑊𝐹),
heat generated inside the control volume by viscous dissipation (�̇�𝑣𝑖𝑠𝑐), and enthalpy of the
36
extrudate exiting the control volume (�̇�𝐹,𝑥+𝑑𝑥). The energy balance for a finite volume of
extrudate at any location in an extruder is then
�̇�𝐹,𝑥 + �̇�𝑊𝐹 + �̇�𝑣𝑖𝑠𝑐 = �̇�𝐹,𝑥+𝑑𝑥.
The energy terms for the barrel wall material are heat conduction into the control volume (�̇�𝑊,𝑥),
heat convection out to the fluid (�̇�𝑊𝐹), and heat conduction out of the control volume (�̇�𝑊,𝑥+𝑑𝑥).
The energy balance for the wall material control volume is then
�̇�𝑊,𝑥 = �̇�𝑊𝐹 + �̇�𝑊,𝑥+𝑑𝑥.
Axial conduction in the fluid was neglected by Leachman stating that the resistance to heat
transfer in that direction was 3 orders of magnitude larger than the radial heat transfer to the
barrel wall.
Figure 2.17 Diagram for heat transfer in control volume.
(Leachman 2010)
The heat transfer model predicts three regimes that the extrudate goes through as it is
processed; liquid, 2-phase, and solid (Figure 2.18). The model assumes 100 % throughput
efficiency and the mass flow rate is constant through control volumes over the length of the
extruder. The liquid regime is characterized by linear extrudate temperature change as only
enthalpy is changed. The decrease in slope (temperature change) as screw speed is increased in
37
the liquid regime indicates the temperature is mainly dependent on mass flow rate. The slope of
the temperature in the solid regime changes only slightly with screw speed owing to the balance
of heat generated from viscous dissipation and amount of mass in the control volume: the higher
the screw speed the more heat is generated but with higher mass flow more energy is required to
change the extrudate temperature. The flattening out of the temperature curve through the 2-
phase regime is due to the phase change process. Heat is removed from the extrudate to convert
it from liquid to solid (latent heat of fusion) in addition to the heat generated from shearing solid.
This additional heat load causes a decrease in the temperature change (slope) over a small
temperature region above and below the melting point temperature. The barrel length that this
occurs over is dependent on the amount of mass being solidified and therefore the mass flow rate
and screw speed. This is evident in Figure 2.18 as the length of the 2-phase regime increases
with screw speed.
The temperature in a real hydrogenic twin screw extruder differs from the predictions of
the Leachman model: the main difference being the amount of mass in a control volume.
Experiments and theory in polymer literature have shown that melt accumulates in the barrel
depending on the amount of nozzle pressure (Janssen 1978). Solid flows backward from the
nozzle filling c-chambers and building pressure until there is enough to overcome the nozzle
pressure. This level of fill is maintained during steady state operation as the amount leaving the
nozzle is replaced by an equal amount solidified at the beginning of the fully filled zone. This
greatly affects the temperature distribution because there is a length of the barrel that is at or
below the melting point and the length depends on heat transfer and leakage flow. The amount of
fully filled chambers also affects the amount of viscous dissipation and therefore influences
torque and cooling requirements. Therefore the basic heat transfer model developed by

38
Leachman must be expanded to include leakage flow. A realistic model can be used to design
and control reliable, efficient twin screw extruders for fueling fusion reactors.
Figure 2.18 Model predictions for deuterium temperatures along barrel.
(Leachman 2010)
2.3.5 Characterizing Polymer Twin Screw Extruders
How twin screw extruders are characterized is important to understand for an accurate
efficient design of the DTSE. Therefore literature on characterizing TSE’s has been investigated
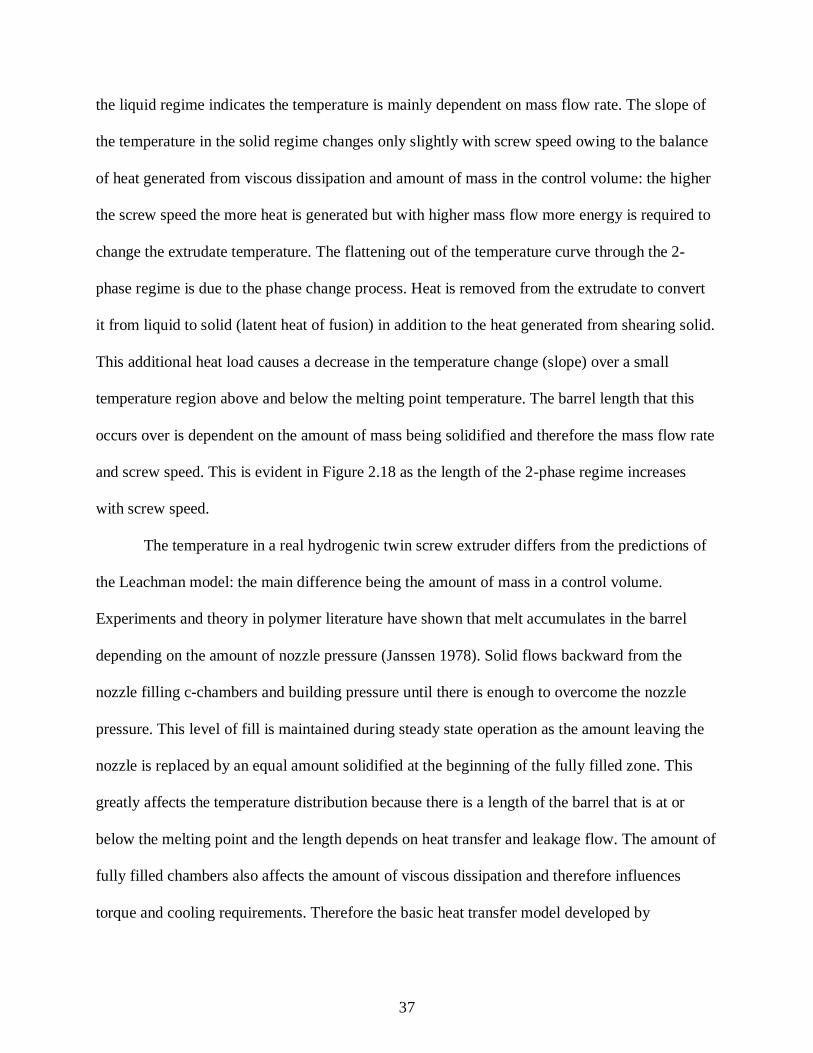
to identify the key parameters of extruder performance. The main purpose of twin screw
extrusion is to force material through a specific nozzle opening. The volumetric flow rate or
throughput achieved at a given driving pressure for a specific nozzle is the measure of
performance for any particular design. For example, Figure 2.19 shows a comparison of
performance between polymer twin screw extruders with thick and thin flight screws. The
throughput is made dimensionless by dividing by the theoretical throughput and the pressure

39
gradient (pressure increase per unit length of screw) is divided by the theoretical nozzle pressure
over the fully filled length. The comparison clearly shows that the extruder with thick flight
screws can provide more throughput at a higher pressure gradient than the extruder with thin
flights. In other words, the extruder with thick flight screws has better pumping performance.
The curves are particular to the extruder modeled or tested therefore they are called characteristic
curves. Extruders can be designed for specific applications using characteristic curves therefore
theoretical TSE research should be focused on modeling throughput performance as the pressure
gradient changes.
Figure 2.19 Characteristic curves for twin screw extruders with thick (left) and thin (right)
flights.
(Jiang 2011)
The characteristic curve for non-isothermal and non-Newtonian fluids like hydrogenic
materials is non-linear (Figure 2.20). The non-linearity is due to the shear thinning effect of non-
Newtonian fluids. The increase in temperature from increasing viscous dissipation in non-
isothermal flows adds to the non-linearity.
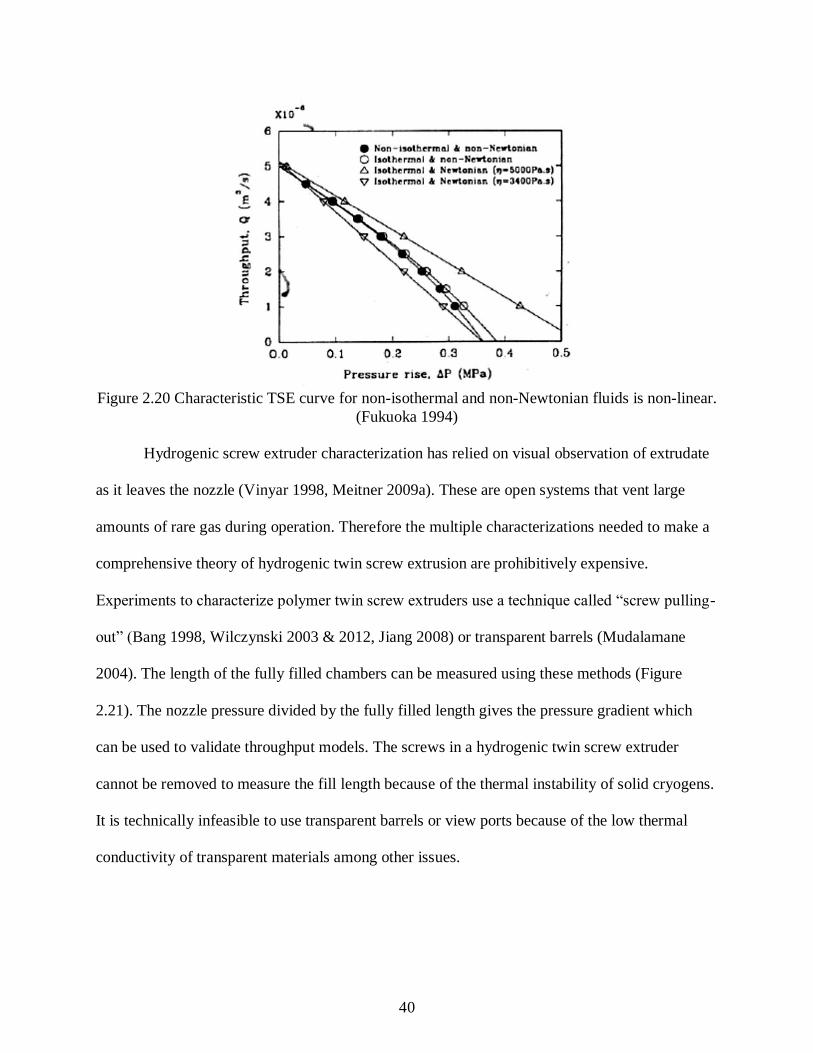
40
Figure 2.20 Characteristic TSE curve for non-isothermal and non-Newtonian fluids is non-linear.
(Fukuoka 1994)
Hydrogenic screw extruder characterization has relied on visual observation of extrudate
as it leaves the nozzle (Vinyar 1998, Meitner 2009a). These are open systems that vent large
amounts of rare gas during operation. Therefore the multiple characterizations needed to make a
comprehensive theory of hydrogenic twin screw extrusion are prohibitively expensive.
Experiments to characterize polymer twin screw extruders use a technique called “screw pulling-
out” (Bang 1998, Wilczynski 2003 & 2012, Jiang 2008) or transparent barrels (Mudalamane
2004). The length of the fully filled chambers can be measured using these methods (Figure
2.21). The nozzle pressure divided by the fully filled length gives the pressure gradient which
can be used to validate throughput models. The screws in a hydrogenic twin screw extruder
cannot be removed to measure the fill length because of the thermal instability of solid cryogens.
It is technically infeasible to use transparent barrels or view ports because of the low thermal
conductivity of transparent materials among other issues.
41
Figure 2.21 Screws are removed to measure fully filled length in thick (top) and thin flight
(bottom) polymer TSE’s.
(Wilczynski 2003)
Pressure and temperature are measured experimentally and used in characterizing
polymer twin screw extruders (Bang 1998, Wilczynski 2012). Nozzle pressure is directly
measured and compared to the fully filled length from the screw pull-out method to get the
pressure gradient. The pressure gradient is compared to the throughput which is set by the feed
rate at the hopper to get the characteristic curve for the polymer extruder. Measuring the pressure
of flowing solid cryogens has not been done to the author’s knowledge so it is not an option for
hydrogenic extrusions. Therefore the most feasible experimental measurement for characterizing
hydrogenic twin screw extruders is temperature. Temperature measurements are used extensively
in this research for understanding extruder operation and a method for characterizing hydrogenic
TSE’s from this data is discussed in Chapter 5.

42
References
Andraschko, M.A. “Twin Screw Extrusion and Viscous Dissipation for the Pellet Fueling of
Fusion Reactors,” Thesis, University of Wisconsin - Madison, (2006).
Baylor, L.R. “Pellet Fuelling, ELM Pacing and Disruption Mitigation Technology Development
for ITER,” Nuclear Fusion, 49, (2009).
Bang, D.S., Hong, M.H., White, J.L., “Modular Tangential Counter-Rotating Twin Screw
Extrusion: Determination of Screw Pumping Characteristics of Modules and Composite Machine
Behavior,” Polymer Engineering and Science, 38, 485-498, (1998).
Combs, S.K., Jernigan, T.C., Baylor, L.R., Milora, S.L., Foust, C.R., Kupschus, P., Gadeberg,
M., Bailey, W., “Performance of a Pneumatic Hydrogen-Pellet Injection System on the Joint
European Torus,” Review of Scientific Instruments, 60, 2697, (1989).
Combs, S.K., “Pellet Injection Technology,” Review of Scientific Instruments, 64, 7, (1993).
Combs, S.K., Foust, C.R., Qualls, A.L., “Extruder System for High-throughput/Steady-state
Hydrogen Ice Supply and Application for Pellet Fueling of Reactor-scale Fusion Experiments,”
Review of Scientific Instruments, 69, 4012-4013, (1998).
Fisher, P.W., Gouge, M.J., Denny, B.J., “Extrusion of Tritium and D-T Pellets for ITER
Fueling,” Fusion Technology, 30, 845-849, (1996).
Fisher, P.W. “Development of a Tritium Extruder for ITER Pellet Injector,” Oak Ridge National
Laboratory, ORNL-TM-13637, (1998).
Fukuoka, T., Min, K., “Numerical Nonisothermal Flow Analysis of Non-Newtonian Fluid in a
Nonintermeshing Counter-Rotating Twin Screw Extruder,” Polymer Engineering and Science,
34, 1033-1046, (1994).
Geraud, A. “Status of the JET High Frequency Pellet Injector,” Fusion Engineering and Design,
88, 1064-1068, (2012).
Janssen, L.P.B.M. Twin Screw Extrusion, Elsevier Scientific Pub. Co., Amsterdam, (1978).
Jiang, Q., “Modeling Flow, Melting, Solid Conveying and Global Behavior in Intermeshing
Counter-rotating Twin Screw Extruders,” Dissertation, University of Akron, (2008).
Leachman, J.W., “Thermophysical Properties and Modeling of a Hydrogenic Pellet Production
System,” Dissertation, University of Wisconsin-Madison, (2010).
Meitner, S.J., “Viscous Energy Dissipation in Frozen Cryogens,” Thesis, University of
Wisconsin-Madison, (2008).

43
Meitner, S.J. “Development of a Twin-Screw D2 Extruder for the ITER Pellet Injection System,”
Fusion Science and Technology, 56, (2009a).
Meitner, S.J. “Twin-Screw Extruder Development for the ITER Pellet Injection System,” 23rd
Symposium on Fusion Energy, (2009b).
Mudalamane, R., Bigio, D.I., “Experimental Characterization of Fill Length Behavior in
Extruders,” Polymer Engineering and Science, 44, 557–563, (2004).
Taylor, A F “A Solid Hydrogen Pellet Launcher.” Journal of Scientific Instruments, Series 2, 2,
696-700, (1969).
Van der Goot, A.J. “The Extruder as a Polymerisation Reactor for Styrene Based Polymers,”
Dissertation, University of Groningen, (1996).
Vinyar, I.V., Kuteev, B.V., Skoblikov, S.V., Koblents, P.V., Christyakov, V.O., “Method for the
Continuous Extrusion of Solid Thermonuclear Fuel,” Technical Physics, 40, 723-727, (1995).
Vinyar, I.V., Lukin, A. Ya., “Screw Extruder Development,” Liral International Trading Inc.,
correspondence to Oak Ridge National Laboratory and Lockheed Martin Energy Systems,
(1997).
Vinyar, I.V. “Repetitive Hydrogen Pellet Injector Utilizing a Screw Extruder,” Technical
Physics, 43, 5, 588-590, (1998).
Vinyar, I.V. “Screw Extruder for Solid Hydrogen,” Technical Physics, 45, No. 1, 107-112,
(2000a).
Vinyar, I.V., Lukin, A.Y., “A Pneumatic Injector of Deuterium Pellets for Fusion Devices,”
Instrument and Experimental Techniques, 43, 5, 722-727, (2000b).
Vinyar, I.V., Krisl’nikov, I.A., Skoblikov, S.V., Lukin, A.Ya., Saksaganskii, G.L., “A Large-
Scale Prototype of a Tritium Pellet Injector for the ITER International Tokamak,” Instruments
and Experimental Techniques, 45, 127-131, (2002).
Vinyar, I.V., Geraud, A., Yamada, H., Sakamoto, R., Oda, Y., Lukin, A.Ya., Umov, A.,
Skoblikov, S.V., Gros, G., Saksaganskii, G.L., Reznichenko, P., Krasilnikov, I.A., Panchenkol,
V., “Pellet Injectors Developed at the Pelin Laboratory for Steady-State Plasma Fueling,” Plasma
Science and Technology, 6, 2286-2290, (2004).
White, J.L., Kim, E.K., Twin Screw Extrusion : Technology and Principles, 2nd Edition, Hanser
Publishers, Cincinnati, (2003).
Wilczynski, K., White, J.L., “Melting Model for lntermeshing Counter-Rotating Twin-Screw
Extruders,” Polymer Engineering and Science, 43, 1715-1726, (2003).

44
Wilczynski, K., Lewandowski, A., “Experimental Study of Melting of LDPE/PS Polyblend in an
Intermeshing Counter-Rotating Twin Screw Extruder,” Polymer Engineering and Science, 52,
449–458, (2012).

45
CHAPTER 3: MODELING
General heat transfer characteristics of hydrogenic twin screw extruders can be
determined by comparing experimental data to model predictions. Parametric studies using a
heat transfer model to simulate trends and experimental data can validate or refute them. Each
study adds to the understanding of how energy is transferred throughout the extruder. In this
chapter a basic heat transfer model for hydrogenic twin screw extrusion is described.
3.1 Shear Rates and Viscous Dissipation
46
Viscous dissipation occurs when there is a velocity mismatch between extrudate and
screw surfaces. In this model the reference frame is fixed to the c-chamber as it moves axially in
the barrel. There are 4 surfaces moving relative to the material in each c-chamber (omitting end
effects): screw root, barrel wall, top flight, and bottom flight. The formula for each surface area
is
𝐴𝑟𝑜𝑜𝑡 = 𝑊(2𝜋 − 𝛼)(𝑅 − 𝐻)
cos 𝜑
𝐴𝑏𝑎𝑟𝑟𝑒𝑙 = 𝑊(𝜋 −
𝛼2) 𝐷𝑏
cos 𝜑
𝐴𝑓𝑙𝑖𝑔ℎ𝑡 = 2𝐻(2𝜋 − 𝛼) (𝑅 −
𝐻2 )
cos 𝜑
Shearing also takes place in the intermeshing zone on the flight surfaces, screw root, and
opposite screw thread tip;
𝐴𝑚𝑒𝑠ℎ,𝑡𝑖𝑝 = 𝐵𝑡
𝛼𝑅
cos 𝜑
𝐴𝑚𝑒𝑠ℎ,𝑓𝑙𝑖𝑔ℎ𝑡 = 2𝐻𝛼 (𝑅 −
𝐻2 )
cos 𝜑
𝐴𝑚𝑒𝑠ℎ,𝑟𝑜𝑜𝑡 = 𝑊𝛼(𝑅 − 𝐻)
cos 𝜑
Shearing along the thread tip near the barrel wall does not affect extrudate bulk temperature in
the c-chamber directly. The heat transfer from the flight gap to the barrel wall is higher because
the conduction length to the barrel wall is shorter than to the c-chamber. Therefore shearing in
this gap contributes to barrel wall heat load and extruder torque. The area of the thread tip near
the barrel wall is found using the equation

47
𝐴𝑡𝑖𝑝 = 𝐵𝑡
(2𝜋 − 𝛼)𝑅
cos 𝜑
The shear rate experienced by the extrudate in contact with each moving surface is determined
by
�̇�𝑟𝑜𝑜𝑡 = 𝜔(𝑅 − 𝐻)
�̇�𝑏𝑎𝑟𝑟𝑒𝑙 =𝜔𝑆
2𝜋
�̇�𝑓𝑙𝑖𝑔ℎ𝑡 = 𝜔 ∫𝑟
𝐻𝑑𝑟
𝑅
𝑅−𝐻
�̇�𝑡𝑖𝑝 = 𝜔
Viscous dissipation (shear heating) is the product of shear stress (τ), surface area (As), and shear
rate (�̇�). The total rate of heat generation in a solid filled c-chamber is the sum of all shearing
surfaces,
�̇�𝑣𝑖𝑠𝑐 = 𝜏(𝐴𝑠�̇�)𝑟𝑜𝑜𝑡 + 𝜏(𝐴𝑠�̇�)𝑏𝑎𝑟𝑟𝑒𝑙 + 2𝜏(𝐴𝑠�̇�)𝑓𝑙𝑖𝑔ℎ𝑡 + 𝜏(𝐴𝑠�̇�)𝑡𝑖𝑝.
3.2 Constitutive Equations
Hydrogenic material properties change significantly with temperature. Experimental
results from Leachman show a dramatic increase in shear stress just below the melting point of
hydrogenic solids (Leachman 2010). Therefore it is important to account for variability when
building a realistic model. The basic heat transfer model from Leachman was developed using
constitutive equations summarized in Table 3.1.
Table 3.1 Temperature dependent property formulas
Description Formula
solid viscosity 𝜇 = 𝑎3 (𝜌
𝜌𝑚)
𝑎4
48
convective heat
transfer coefficient ℎ̅𝑙𝑖𝑞𝑢𝑖𝑑 =
𝑁𝑢𝑘𝑙
𝐿𝑐ℎ𝑎𝑟 , ℎ̅𝑠𝑜𝑙𝑖𝑑 =
𝑘𝑠
𝐿𝑐𝑜𝑛𝑑
2-phase heat
capacity 𝑐𝑒𝑓𝑓𝑒𝑐𝑡𝑖𝑣𝑒 =∆𝑖𝑓𝑢𝑠
2∆𝑇+
𝑐𝑙 + 𝑐𝑠
2
solid shear stress 𝜏 = 𝑎1 (𝑣0 + 𝑎5𝑇𝑚
𝑎6
𝑣0 + 𝑎5𝑇𝑎6)
𝑎2
+ 𝑎3 (𝑣0 + 𝑎5𝑇𝑚
𝑎6
𝑣0 + 𝑎5𝑇𝑎6)
𝑎4
�̇�𝑛
Part of the model not explained by Leachman is the use of equations fitted to property
data to account for the temperature dependence of specific heat capacity, density at the melting
point, thermal conductivity, and melting point temperature. Normal hydrogen solid density
comes from a polynomial fit of data taken from Souers and looks like
𝜌𝐻2= −0.00359𝑇2 + 0.00562𝑇 + 44.221
where temperature is in Kelvin and the density is given as kg/m3 (Souers 1986). The constitutive
equation for specific heat capacity of solid hydrogen is
𝑐𝑝,𝐻2= 99.808𝑇2 − 1338.87𝑇 + 5562.24
Modeling thermophysical properties in the 2-phase temperature region requires a linear
combination of the property value at the bottom of the liquid range and top of the solid range.
The basic model uses the following general formula
𝑥𝑇 = 𝑥𝑇𝑚+∆𝑇 (𝑇 − (𝑇𝑚 − ∆𝑇)
2∆𝑇) + 𝑥𝑇𝑚−∆𝑇 (
(𝑇𝑚 + ∆𝑇) − 𝑇
2∆𝑇)
where 𝑥𝑇 is the property value at the desired temperature, 𝑥𝑇𝑚+∆𝑇 is the property value at the
bottom of the liquid range, and 𝑥𝑇𝑚−∆𝑇 is the property value at the top of the solid range. By
using this function the basic model can smoothly transition from liquid to solid as the phase
changes (Figure 3.1 – 3.4).

49
Figure 3.1 Heat capacity of hydrogen augmented to include latent heat of fusion during phase
change.
Figure 3.2 Density of hydrogen at various temperatures.

50
Figure 3.3 viscosity of hydrogen at various temperatures.
Figure 3.4 Shear stress of hydrogen at various temperatures and shear rates.
3.3 Energy Balance
The First Law of Thermodynamics can be applied to twin screw extruders in order to get
a basic model of heat transfer during steady state extrusions. Energy flows in and out of the
system carried by the extrudate (�̇�in, �̇�out). Energy is also generated by the conversion of
mechanical energy to heat as solid is sheared by the rotating screws (�̇�visc). Energy is transferred

51
between the extrudate and barrel wall via convection (�̇�conv). Thus, the energy balance for the
extrudate is
�̇�𝑖𝑛 + �̇�𝑐𝑜𝑛𝑣 + �̇�𝑣𝑖𝑠𝑐 = �̇�𝑜𝑢𝑡.
The amount of heat that can be transferred from the extrudate to the barrel is dependent on the
thermal state of the barrel. Therefore an energy balance for the barrel is also solved. Energy in
the form of heat transfers in to the top of the barrel from the support section (�̇�𝑖𝑛) and out of the
barrel at the thermal bus bar (�̇�𝑜𝑢𝑡). Heat also transfers from the extrudate to the barrel by
convection along the length of the extruder (�̇�𝑐𝑜𝑛𝑣). The energy balance for the barrel wall is
�̇�𝑖𝑛 + �̇�𝑐𝑜𝑛𝑣 = �̇�𝑜𝑢𝑡.
3.4 1-D Finite Difference Method
The finite difference method provides a way to solve the heat transfer partial differential
equations to find the temperature of the extrudate and barrel wall along the length of the extruder
(x-direction). The domain is divided into small control volumes and the energy balance equations
are solved in each volume to get the corresponding temperature gradient. The temperature
gradient is solved in the i-th volume then used to calculate the temperature in the next control
volume (i+1) setting up a numerical scheme for solving the temperature across the domain
x=[0,L]. The temperature for the extrudate and wall are evaluated in two different domains but
are coupled by the convection heat transfer at the same x-location. Leachman gives a detailed
derivation of the numerical scheme from the energy balance equations and therefore is not
derived here (Leachman 2010). The temperature gradient equation from the energy balance for
the extrudate is
(𝑑𝑇𝑓
𝑑𝑥)
𝑖−1
=ℎ̅𝑖−1𝑝𝑒𝑟(𝑇𝑤,𝑖−1 − 𝑇𝑓,𝑖−1) + �̇�𝑣𝑖𝑠𝑐,𝑖−1
�̇�𝑐𝑓,𝑖−1

52
for i=1,N. Using the difference method for approximating derivatives the fluid temperature in the
adjacent control volume is
𝑇𝑓,𝑖 = 𝑇𝑓,𝑖−1 + (𝑑𝑇𝑓
𝑑𝑥)
𝑖−1
∆𝑥
for i=1,N. In the same respect, the temperature gradient in the barrel wall can be found by
solving for it in the wall energy balance
(𝑑2𝑇𝑤
𝑑𝑥2)
𝑖−1
= ℎ̅𝑖−1𝑝𝑒𝑟𝑇𝑤,𝑖−1 − 𝑇𝑓,𝑖−1
𝑘𝑖−1𝐴𝑐,𝑐𝑟𝑜𝑠𝑠
and the wall temperature is
𝑇𝑤,𝑖 = 𝑇𝑤,𝑖−1 + (𝑑𝑇𝑤
𝑑𝑥)
𝑖−1∆𝑥
for i=1,N. The wall temperature equation requires an additional equation to obtain the
temperature gradient since the conduction term in the wall energy balance has a 2nd order
derivative
(𝑑𝑇𝑤
𝑑𝑥)
𝑖= (
𝑑𝑇𝑤
𝑑𝑥)
𝑖−1+ (
𝑑2𝑇𝑤
𝑑𝑥2)
𝑖−1
∆𝑥
for i=1,N.

53
References:
Leachman, J.W., “Thermophysical Properties and Modeling of a Hydrogenic Pellet Production
System,” Dissertation, University of Wisconsin-Madison, (2010).
Souers, P.C., Hydrogen Properties for Fusion Energy, University of California Press, pg. 48,
(1986).

54
CHAPTER 4: THE DIAGNOSTIC TWIN SCREW EXTRUDER
In the previous chapter, development of a numerical model was explained and the need
for fundamental measurements to validate model predictions was established. In Chapter 2, the
state of the art in experimental hydrogenic twin screw extruders showed there were no extruders
capable of collecting fundamental measurements. It is for these reasons that a Diagnostic Twin
Screw Extruder (DTSE) has been designed and constructed. The front and back of the entire
experiment setup are shown in Figure 4.1 and 4.2, respectively. This chapter explains the design
and operation of the DTSE and how the data is obtained to create and validate a predictive
throughput model for hydrogenic twin screw extrusions.
Figure 4.1 DTSE experiment setup front view.

55
Figure 4.2 DTSE experiment setup back view.
4.1 Auxiliary Systems
4.1.1 Vacuum System
A vacuum pump is used in this experiment to minimize the heat transfer between the low
temperature extruder and the room temperature vacuum chamber. The chamber is a custom
designed cube with 61 cm diameter openings covered by removable lids on all six faces (Figure
4.3). The vacuum chamber can be reconfigured by designing new flanges making it modular for
extruder add-ons or other experiments entirely. The chamber walls are made of 13 mm thick 316
stainless steel plate TIG welded along the inner and outer seams. The outside faces were polished
with a wire wheel to improve flange seals. Each 13 mm thick flange is held by 24 bolts with
7/16-18 threads.
A Leybold D8-A rotary vane pump evacuates the vacuum chamber from atmospheric
pressure to 100 millitorr (Figure 4.3). The pump is connected to the vacuum chamber in series

56
with a Varian Turbo-V-81M turbo-molecular pump. The turbo pump operates in the molecular
transport regime to achieve chamber pressures of ~1x10⁻⁶ torr. Vacuum pressure is read using a
Varian inverted magnetron gauge mounted directly on the chamber. Vacuum pressure and turbo
pump vitals are displayed on a computer using Turbo Pumps Linked User Software (T-plus). The
interface also allows the operator to control the turbo pump, vent valve, and auxiliary cooling
fan. A manual bellows sealed valve between the turbo and roughing pumps is used to isolate the
vacuum chamber.
Figure 4.3 Vacuum system: (1) chamber, (2) valve, (3) controller, (4) vent line, (5) vacuum
gauge, (6) line to gas manifold, (7) roughing pump, and (8) turbo pump.
4.1.2 Gas Manifold
Process gas inside the extruder is handled by the gas manifold (Figure 4.4). The manifold
is made of brass valves, ports, and sensors to perform several functions. The H2, D2, and Ne
gases tested all had a purity exceeding 99.999 %. Process gas is kept in a 109 L reservoir
2
1
3
4
5
6
7 8

57
connected to the manifold. The manifold connects the reservoir to the experiment during
extrusion tests. The manifold also provides a pressure relief valve to guard against over
pressurization and a digital pressure transducer to monitor pressure. The reservoir is filled from
an external source through the fill port in the manifold. The extruder and reservoir are evacuated
or leak checked through the vacuum port. The process gas is vented to a fume hood through the
discharge port (Figure 4.5).
Figure 4.4 Gas manifold controls process gas in the extruder.
reservoir
relief valve
pressure transducer
58
Figure 4.5 Manifold discharge port and pressure relief valves vent to a fume hood.
4.1.3 Thermal Radiation Shielding
Heat transfer to the extruder by thermal radiation is minimized in this experiment by
using an actively cooled copper shield and multi-layer insulation (MLI) (Figure 4.6). The copper
shield is made from two 1.6 mm thick sheets that are bent into five sided boxes. The two boxes
vent lines
fume hood

59
are put together to fully enclose the extruder. Both boxes are fixed on one end to the cryocooler
first stage using machine screws and indium foil to improve the thermal connection. This allows
active cooling of the shield to temperatures < 70 K. The other end is supported by plastic cable
ties.
Figure 4.6 Copper thermal radiation shield and MLI blanket enclose the extruder.
Multi-layer insulation is placed around the copper shield to reflect thermal radiation from
the vacuum chamber walls. MLI primarily reduces the heat load on the copper radiation shield
which indirectly improves the cryocooler second stage performance and therefore extruder
cooling. It is constructed from 32 layers of high emissivity aluminized Mylar separated by
fiberglass matting to limit heat conduction between layers. The layers are wrapped around a form
made of 0.5 mm thick aluminum sheet to retain the shape of the copper shield helping to ease
assembly. The MLI blanket is slid over the copper shield during extruder assembly and the layers
at the top are folded completely enclosing the copper shield and therefore the extruder.
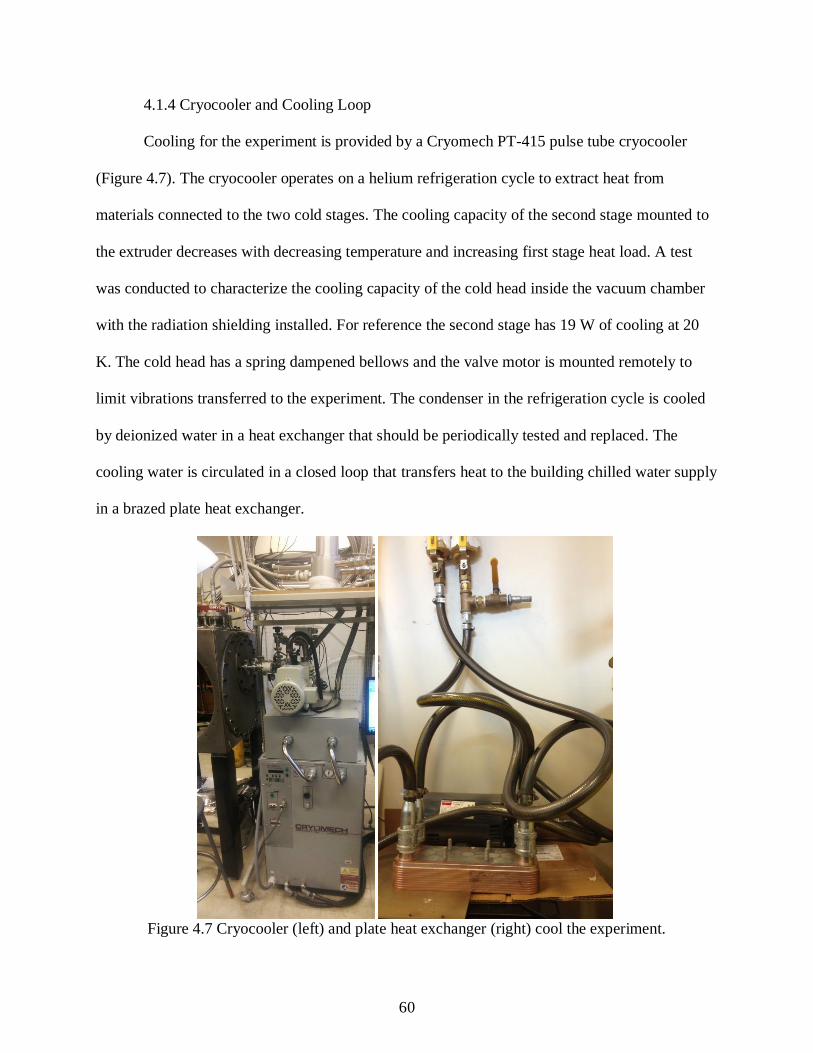
60
4.1.4 Cryocooler and Cooling Loop
Cooling for the experiment is provided by a Cryomech PT-415 pulse tube cryocooler
(Figure 4.7). The cryocooler operates on a helium refrigeration cycle to extract heat from
materials connected to the two cold stages. The cooling capacity of the second stage mounted to
the extruder decreases with decreasing temperature and increasing first stage heat load. A test
was conducted to characterize the cooling capacity of the cold head inside the vacuum chamber
with the radiation shielding installed. For reference the second stage has 19 W of cooling at 20
K. The cold head has a spring dampened bellows and the valve motor is mounted remotely to
limit vibrations transferred to the experiment. The condenser in the refrigeration cycle is cooled
by deionized water in a heat exchanger that should be periodically tested and replaced. The
cooling water is circulated in a closed loop that transfers heat to the building chilled water supply
in a brazed plate heat exchanger.
Figure 4.7 Cryocooler (left) and plate heat exchanger (right) cool the experiment.

61
4.1.5 Sensing
Torque is measured using strain gages mounted on a lever arm (Figure 4.8). The lever
arm is mounted on one end to the motor perpendicular to the axis of rotation. The other end is
restrained to keep the motor body from rotating. When the motor experiences torque from
resistance in the extruder or drivetrain the torque arm bends and the strain gages create a voltage
related to the level of torque. The voltage across the strain gauges is measured through a standard
half-Wheatstone bridge configuration. The signal is amplified and sent to the analog input
module for logging. The torque sensor is calibrated by fixing the motor body and applying
known weight to the free end of the lever arm. This allows for measurements of the torque
needed to shear extrudate during DTSE operation and thereby an estimate of total viscous
dissipation can be made.
Figure 4.8 Torque sensor being calibrated (left) and during extruder operation (right).
Temperature is measured using Lakeshore Silicon Diode, Lakeshore Cernox, and
Cryocon Ruthenium Oxide (Ru-Ox) sensors. The Silicon Diode and Cernox sensors have a

62
“bobbin” construction with a hole for mounting. A 4-40 machine screw and pen spring are used
to mount these sensors. The pen spring provides a constant clamping force so the thermal contact
does not change as the bobbin and screw shrink with temperature. The Ru-Ox sensors use a
cylindrical package and are mounted in close fit holes (Figure 4.9). All temperature sensors are
mounted with Apiezon-N thermal grease to promote thermal contact. The Ru-Ox sensors
mounted in the screw threads responsible for measuring extrudate temperature use 2-wire voltage
sensing connections due to the limited number of pins in the rotating electrical connectors. The
Ru-Ox sensors use a standard calibration curve. The Silicon Diode and Cernox sensors were
calibrated by the manufacturer. Uncertainties for these sensors are given in Section 4.5.
Figure 4.9 RuOx sensor (left) is installed in the extruder screw thread (right).
Process gas pressure is measured using MKS Baratron® capacitance manometers. These
sensors monitor pressure inside the reservoir and extruder from ports on the gas manifold. They
receive power from the 12 VDC power supply. The pressure signal leads are connected to the
analog input module where they are sampled and recorded by the DAQ.

63
Motor speed is measured with a 12 tooth gear and Hall-effect sensor. The gear is
mounted on the motor driveshaft. The speed is displayed on a Shimpo digital tachometer. The
extruder screws rotate faster than the motor driveshaft due to the ratio of the geartrain. Therefore
motor speed values are multiplied by a factor of 2 to get extruder speed. The values are manually
entered into the steady state data tables.
4.1.6 Temperature Controllers
The temperature sensors and heaters for this experiment are controlled by two
temperature controllers. The Lakeshore 336 has 4 channels used to monitor the cold stage, barrel,
and two locations on the circulation loop. The 2 heater outputs on the controller are used to
power the bus bar heater and circulation loop heater. The Lakeshore controller is connected to
the DAQ to communicate temperature and heater power values. The Cryocon 24C monitors the
three sensors inside the screws and controls an extra circulation loop heater. It also
communicates values with the DAQ.
4.1.7 DAQ and User Interface
Input and output signals associated with the experiment are managed by the data acquisition
systems (DAQ). The DAQ consists of a National Instruments Compact DAQ controller with NI
9201 analog input and NI 9401 output modules, a desktop PC, and National Instruments
LabView software (Figure 4.10 and 4.11). The LabView program developed for this experiment
has 3 functions: control motor speed, monitor experiment sensors, and record data. Temperature
and pressure values are plotted on histograms to visually determine when values are constant.
Data is recorded at a frequency of 1-2 Hz. The sampling frequency is limited by the speed at
which the temperature controllers communicate. A detailed description of this code is provided
in the Appendix.
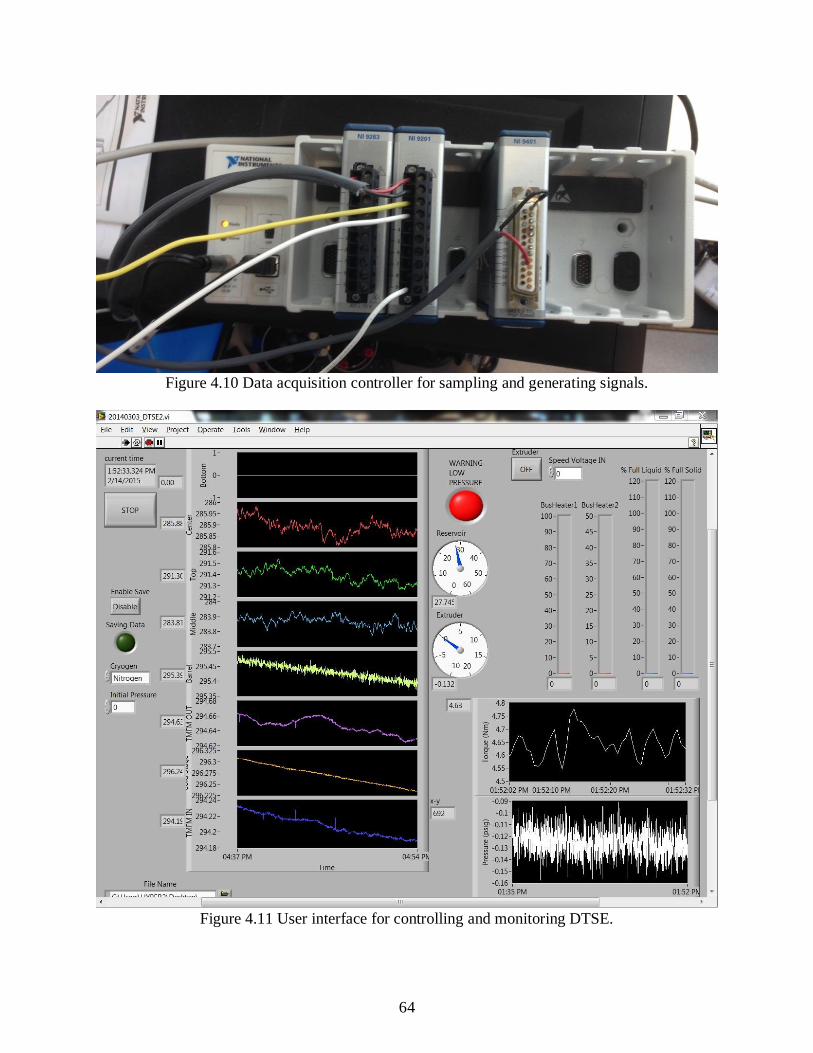
64
Figure 4.10 Data acquisition controller for sampling and generating signals.
Figure 4.11 User interface for controlling and monitoring DTSE.

65
4.1.8 Pressure Seals and Wire Feedthroughs
Extruder parts, vacuum chamber lids, driveshafts, wiring harnesses, and pipe connections
are all sealed using different techniques that will be described subsequently. Static vacuum seals
for room temperature service use a Nitrile o-ring placed inside a groove and compressed against
a flat surface using a bolted connection. Dynamic pressure seals used on rotating shafts involve a
Nitrile o-ring compressed between the shaft and a smooth groove wall machined into a flange
held in place by bolts. The rotating shafts in this experiment have two dynamic seals each for
extra assurance. The static and dynamic seal groove dimensions were specified using the Parker
O-ring Handbook. Indium wire is used for static pressure seals that are subjected to cryogenic
conditions (Figure 4.12). Indium remains ductile to extremely low temperature allowing it to
deform and maintain contact as surfaces contract. Low temperature static seals are made by
placing 1.6 mm diameter indium wire in a groove and compressed against a flat surface using a
bolted connection. Pipe connection seals for both room temperature and cryogenic service use
NPT threading and Teflon pipe tape. All seals are routinely checked with a helium leak detector.
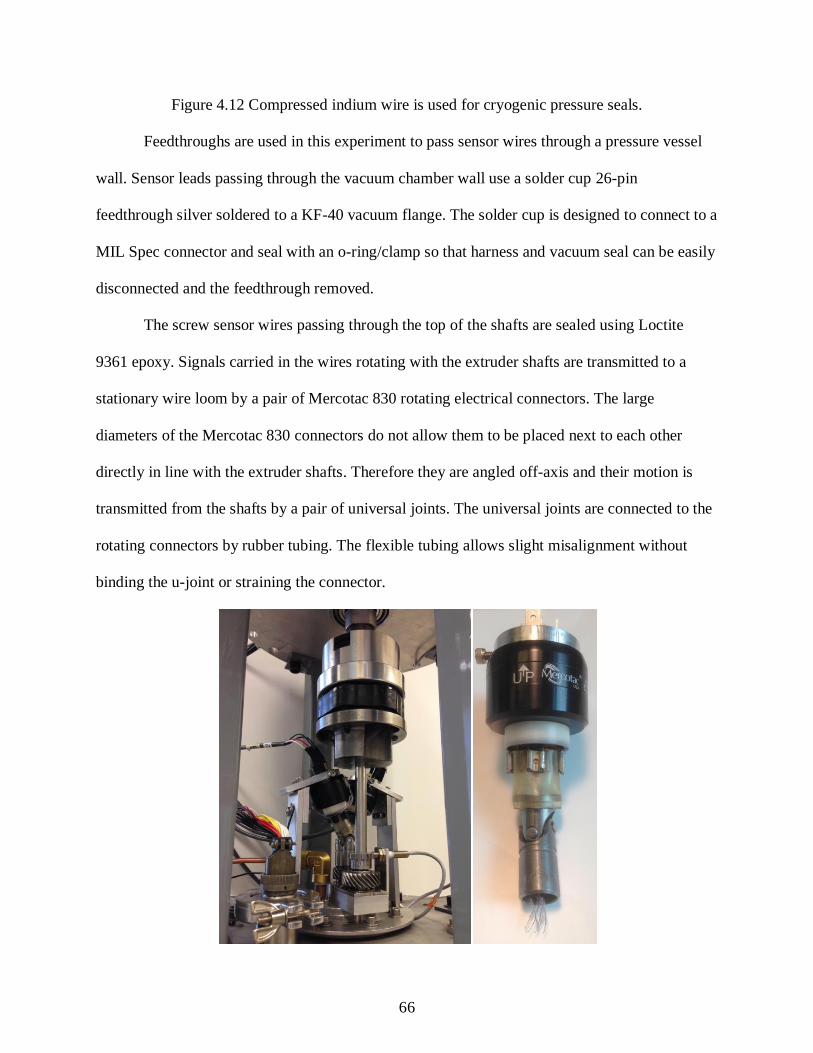
66
Figure 4.12 Compressed indium wire is used for cryogenic pressure seals.
Feedthroughs are used in this experiment to pass sensor wires through a pressure vessel
wall. Sensor leads passing through the vacuum chamber wall use a solder cup 26-pin
feedthrough silver soldered to a KF-40 vacuum flange. The solder cup is designed to connect to a
MIL Spec connector and seal with an o-ring/clamp so that harness and vacuum seal can be easily
disconnected and the feedthrough removed.
The screw sensor wires passing through the top of the shafts are sealed using Loctite
9361 epoxy. Signals carried in the wires rotating with the extruder shafts are transmitted to a
stationary wire loom by a pair of Mercotac 830 rotating electrical connectors. The large
diameters of the Mercotac 830 connectors do not allow them to be placed next to each other
directly in line with the extruder shafts. Therefore they are angled off-axis and their motion is
transmitted from the shafts by a pair of universal joints. The universal joints are connected to the
rotating connectors by rubber tubing. The flexible tubing allows slight misalignment without
binding the u-joint or straining the connector.
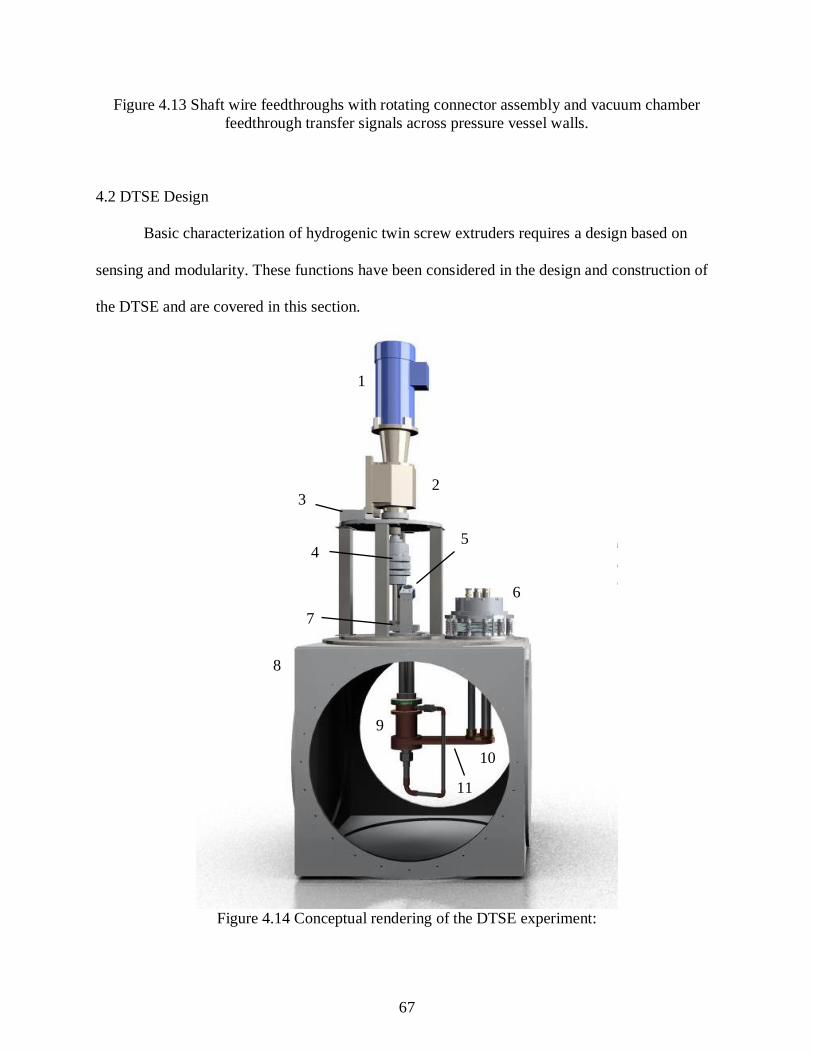
67
Figure 4.13 Shaft wire feedthroughs with rotating connector assembly and vacuum chamber
feedthrough transfer signals across pressure vessel walls.
4.2 DTSE Design
Basic characterization of hydrogenic twin screw extruders requires a design based on
sensing and modularity. These functions have been considered in the design and construction of
the DTSE and are covered in this section.
Figure 4.14 Conceptual rendering of the DTSE experiment:
1
2 3
4
8
10
11
5
7
6
9
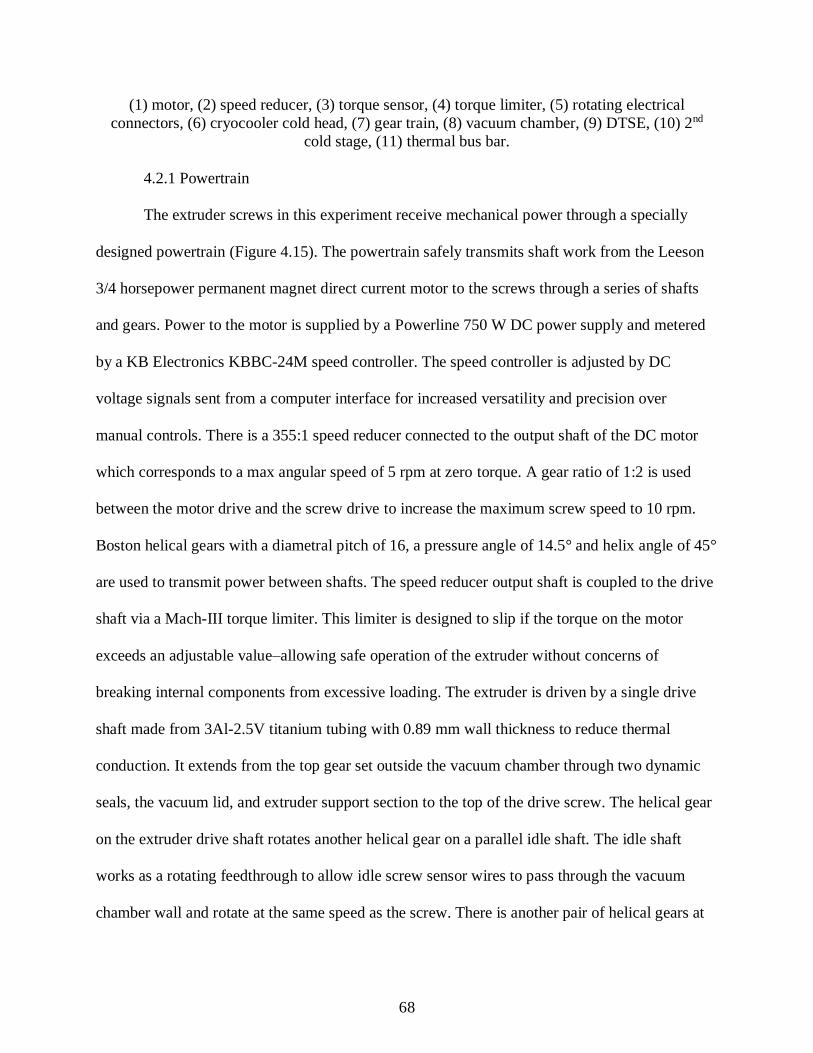
68
(1) motor, (2) speed reducer, (3) torque sensor, (4) torque limiter, (5) rotating electrical
connectors, (6) cryocooler cold head, (7) gear train, (8) vacuum chamber, (9) DTSE, (10) 2nd
cold stage, (11) thermal bus bar.
4.2.1 Powertrain
The extruder screws in this experiment receive mechanical power through a specially
designed powertrain (Figure 4.15). The powertrain safely transmits shaft work from the Leeson
3/4 horsepower permanent magnet direct current motor to the screws through a series of shafts
and gears. Power to the motor is supplied by a Powerline 750 W DC power supply and metered
by a KB Electronics KBBC-24M speed controller. The speed controller is adjusted by DC
voltage signals sent from a computer interface for increased versatility and precision over
manual controls. There is a 355:1 speed reducer connected to the output shaft of the DC motor
which corresponds to a max angular speed of 5 rpm at zero torque. A gear ratio of 1:2 is used
between the motor drive and the screw drive to increase the maximum screw speed to 10 rpm.
Boston helical gears with a diametral pitch of 16, a pressure angle of 14.5° and helix angle of 45°
are used to transmit power between shafts. The speed reducer output shaft is coupled to the drive
shaft via a Mach-III torque limiter. This limiter is designed to slip if the torque on the motor
exceeds an adjustable value–allowing safe operation of the extruder without concerns of
breaking internal components from excessive loading. The extruder is driven by a single drive
shaft made from 3Al-2.5V titanium tubing with 0.89 mm wall thickness to reduce thermal
conduction. It extends from the top gear set outside the vacuum chamber through two dynamic
seals, the vacuum lid, and extruder support section to the top of the drive screw. The helical gear
on the extruder drive shaft rotates another helical gear on a parallel idle shaft. The idle shaft
works as a rotating feedthrough to allow idle screw sensor wires to pass through the vacuum
chamber wall and rotate at the same speed as the screw. There is another pair of helical gears at

69
the top of the screws inside the extruder body. These gears are identical to the set outside the
vacuum chamber and are used to transmit power from the drive screw to the idle screw.
Figure 4.15 DTSE drive train and close-ups of gear set and bearing block:
(1) torque limiter, (2) motor drive shaft, (3) screw drive shaft, (4) idle shaft, (5) motor gear, (6)
screw gear, (7) idle gear, (8) thrust needle bearing, (9) tapered bearing, (10) needle bearings.
The drive shafts and screws are constrained from axial and radial movement by a system
of bushings and bearings. The bottom of the motor drive shaft and the top end of the extruder
drive and idle shafts are kept in alignment by bearings in the bearing block. The motor drive
shaft uses a tapered roller bearing for both radial and axial alignment. The bearing is mounted
upside down because the axial force component from transmitting power to the extruder drive
shaft is directed upward. The extruder drive shaft uses a needle bearing for radial support and a
needle-roller thrust bearing for axial support. The idle shaft uses a needle bearing for radial
restraint but only requires a solid brass thrust washer for axial restraint because the forces on the
1
2
5
6 7
3 4
8
9 10
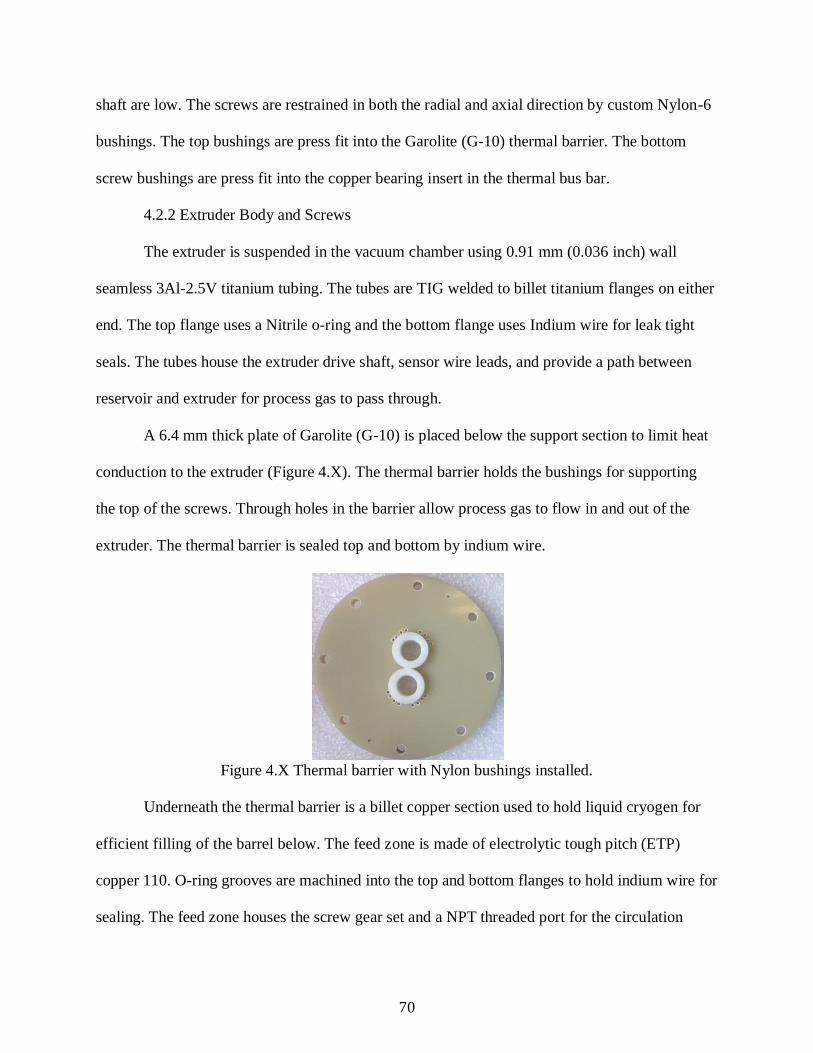
70
shaft are low. The screws are restrained in both the radial and axial direction by custom Nylon-6
bushings. The top bushings are press fit into the Garolite (G-10) thermal barrier. The bottom
screw bushings are press fit into the copper bearing insert in the thermal bus bar.
4.2.2 Extruder Body and Screws
The extruder is suspended in the vacuum chamber using 0.91 mm (0.036 inch) wall
seamless 3Al-2.5V titanium tubing. The tubes are TIG welded to billet titanium flanges on either
end. The top flange uses a Nitrile o-ring and the bottom flange uses Indium wire for leak tight
seals. The tubes house the extruder drive shaft, sensor wire leads, and provide a path between
reservoir and extruder for process gas to pass through.
A 6.4 mm thick plate of Garolite (G-10) is placed below the support section to limit heat
conduction to the extruder (Figure 4.X). The thermal barrier holds the bushings for supporting
the top of the screws. Through holes in the barrier allow process gas to flow in and out of the
extruder. The thermal barrier is sealed top and bottom by indium wire.
Figure 4.X Thermal barrier with Nylon bushings installed.
Underneath the thermal barrier is a billet copper section used to hold liquid cryogen for
efficient filling of the barrel below. The feed zone is made of electrolytic tough pitch (ETP)
copper 110. O-ring grooves are machined into the top and bottom flanges to hold indium wire for
sealing. The feed zone houses the screw gear set and a NPT threaded port for the circulation

71
loop. The feed zone temperature is typically equal to the barrel temperature due to the good
thermal contact of the indium seal.
Connected to the bottom of the feed zone is the barrel of the extruder. The barrel is made
of ETP copper 110 and is used as a heat sink to condense the fluid being conveyed by the two
screws running down its center. The high thermal conductivity of copper allows the barrel to
have a nearly uniform temperature along its length; improving heat transfer while simplifying
heat transfer modeling calculations.
The custom screws of the diagnostic twin screw extruder are made of 304L stainless steel
(Figure 4.X). The dimensions of the screws are listed in Table 4.1 along with other geometric
values important to design and modeling. The screws are unique because the center of each one
is bored out. This opening reduces the thermal mass of the screws which decreases the time for
the system to equilibrate. It also enables the installation of heaters and temperature sensors. The
sensor wires run to the screw center passage and then up and out of the top.
Table 4.1 Extruder dimensions.
Description Symbol Value
screw radius R 12 mm
pitch S 12 mm
screw length L 101.6 mm
interaxis spacing I 19.05 mm
chamber height H 5.08 mm
chamber width W 6.05 mm
thread tip width Bt 5.34 mm
flight angle ψ 3 °
barrel diameter Dbrl 24.25 mm
flight gap δ 0.13 mm
calendar gap σ 0.13 mm
side gap ε 0.29 mm
overlap angle α 1.325 rad
thread starts m 1
c-chambers vtot 17
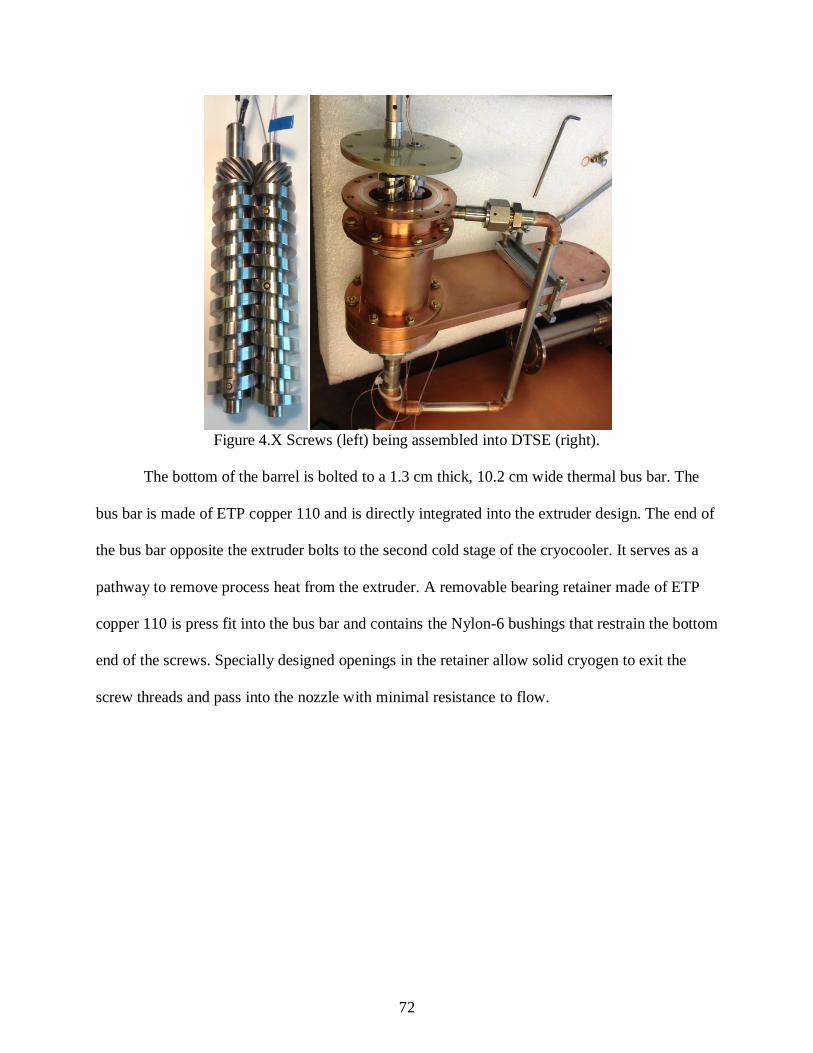
72
Figure 4.X Screws (left) being assembled into DTSE (right).
The bottom of the barrel is bolted to a 1.3 cm thick, 10.2 cm wide thermal bus bar. The
bus bar is made of ETP copper 110 and is directly integrated into the extruder design. The end of
the bus bar opposite the extruder bolts to the second cold stage of the cryocooler. It serves as a
pathway to remove process heat from the extruder. A removable bearing retainer made of ETP
copper 110 is press fit into the bus bar and contains the Nylon-6 bushings that restrain the bottom
end of the screws. Specially designed openings in the retainer allow solid cryogen to exit the
screw threads and pass into the nozzle with minimal resistance to flow.

73
Figure 4.16 Rendering of DTSE cross-section view:
(1) support tubes, (2) driveshaft, (3) upper bushings, (4) thermal barrier, (5) feed zone, (6) helical
gears, (7) barrel, (8) screw heaters, (9) screw temperature sensors, (10) screws, (11) lower
bushings, (12) barrel temperature sensor location, (13) bus bar, (14) bearing retainer, (15) nozzle,
(16) nozzle gasket, (17) circulation loop heater location, (18) circulation loop temperature sensor
locations, (19) circulation loop.
4.2.3 Nozzle and Circulation Loop
Mated to the bottom of the bus bar is the extruder nozzle. The nozzle is made of ETP
copper 110 machined into a rectangular funnel with a circular outlet. It combines the extrudate
flow from each screw into one stream with a diameter of 17.4 mm. This diameter corresponds to
1 2
5
4
7 6
9
11
8
10
12
13 14
15
16
17 18
19
3

74
an area equal to the cross sectional area that extrudate flows through axially inside the barrel.
Think of the c-chamber area in a plane perpendicular to the screw axis not including the
intermeshing zone. The equal areas allow the extruder to be operated with zero reduction at the
outlet for a baseline measurement. Extrudate flows from the copper nozzle to a stainless steel
nozzle adapter plate welded to a 3/4 inch Swagelok VCR® compression fitting. The inner
diameter of the gland is machined to match the exit of the nozzle (17.4 mm). The gland joins to
the circulation loop via VCR compression fittings. The normal Swagelok gaskets are replaced
with custom copper gaskets made with different size openings to easily vary the nozzle area size
(Figure 4.17).
Figure 4.17 Nozzle gaskets (left) are placed in nozzle body (top right) or compression fitting
(bottom right) as shown in section view rendering (center).
The extrudate flowing out of the nozzle is heated, liquefied, and sent back to the feed
zone inside a circulation loop. The circulation loop is made of straight sections of stainless steel
17.4 mm
13.5 mm
7.8 mm
ITER
5.5x5.5 mm
blank

75
tubing connected by 90° copper elbows. The first section of tubing after the VCR connection is
sized to not reduce the cross sectional area of flow. In this section a Nichrome heater wire is
wrapped around the outside of the tube to provide the energy needed to melt the extrudate before
the first elbow. The first copper elbow turns the flow from vertical to horizontal and reduces the
cross sectional area to 107 mm2. The circulation loop ends with a 1/2 inch Swagelok VCR
connection to a gland connected to the feed zone. The thin wall stainless steel tubing that makes
up the circulation loop has a very low heat conduction rate which helps to isolate the heaters
from the nozzle and feed zone.
Figure 4.# Circulation loop liquefies extrudate and returns it to feed-zone.
4.2.4 Modularity
The DTSE was designed to accommodate different size screws by changing a minimal
number of parts. The same extruder components can be used if the screw diameters and lengths
do not change which is beneficial for testing effects of pitch, gap size, and channel depth. Some
heaters
temperature sensors
76
new parts must be made if the screw interaxis spacing increases but the extruder does not have to
be redesigned due to the modularity of the DTSE.
The DTSE can support up to a 25.4 mm (1 inch) interaxis spacing before major
modifications have to be done. Within that spacing the only components that have to change are
both sets of gears, the bearing block, dynamic seal flanges, G-10 thermal barrier, barrel, bearing
retainer insert, and nozzle. The brackets holding the rotating electrical connectors are slotted to
adjust for such a change. The titanium support tubes are already spaced 25.4 mm apart. The
bearing retainer in the bus bar was designed to be changeable without remaking the bus bar. O-
ring grooves were machined into the permanent parts (support section, feed zone, bus bar, and
nozzle adapter plate) to make manufacturing new G-10 barriers, barrels, and nozzles easier.
These design considerations allow the DTSE to measure the operating effects of scaling as
extruder throughput is increased to meet the ITER tokamak specifications.
4.3 Experimental Procedures
4.3.1 Evacuating, Purging, and Charging Procedures
Experiments conducted with the DTSE begin with conditioning the different pressure
vessels in the system. STEP 1 is evacuating the vacuum chamber. The roughing pump is used to
bring the chamber pressure to less than 0.13 mbar. This step takes 2-3 hours due to the moderate
flow rate of the pump and the low conduction of gas molecules inside the MLI blanket. In STEP
2 the manual valve between the roughing pump and vacuum chamber is closed and the extruder
is purged of unwanted gas molecules to insure only the desired process gas is in the system.
Purging is done by pressurizing the extruder with process gas from the reservoir or helium from
an external cylinder and then evacuating it with the roughing pump. Typically only the volume
of the gas manifold at the reservoir pressure (2-4 bar) is required for each purge. This step is

77
repeated twice to insure the best results. STEP 3 is charging the extruder with process gas. In this
step the reservoir is opened to the extruder so their pressures equilibrate. It is important that the
rotating electrical connector assembly is installed on the drive shaft before this step because there
is nothing to keep the shaft from being forced out of its seals by the gas pressure. Once STEP 3
is complete the manual valve on the vacuum chamber is opened and the turbo pump is turned on
to attain high vacuum conditions. The cryocooler is started once the vacuum pressure reaches
1.0x10⁻⁴ mbar to avoid condensing water vapor on the DTSE. The extruder is always above
atmospheric pressure when cold to avoid the risk of air leaking in creating an impurity or a
potentially combustible mixture. Process gas is added to the system through the charge port if
pressure is lost during operation.
4.3.2 Steady State Operation
Extrusions begin after thermal equilibrium is reached throughout the system. The
cryocooler takes approximately 4 hours to cool the extruder from room temperature to 10 K. The
barrel is held at the melting point of the process gas during cool down to allow the gas to
condense to liquid and fill the extruder. The torque sensor is calibrated while the process gas
condenses (see Section 4.1.4). Torque calibrations are done once at the beginning of every
experiment. The circulation loop is essentially thermally isolated from the bus bar other than
fluid flow due to its thin wall stainless steel construction. Therefore the extruder is operated at 6
rpm for approximately one hour to further cool the circulation loop. During that time the heater
mounted on the circulation loop is turned on to control the temperature of the extrudate entering
the loop. The heater ensures that only liquid is flowing in the circulation loop by keeping the
inlet 1 K above the melting point. Equilibrium is reached when the pressure in the reservoir and
all temperatures are constant.

78
The full data set for a single gas includes a range of motor powers, cooling powers, and
nozzle areas. A typical one day experiment involves testing Ne, H2, or D2 with a set nozzle area
over a range of motor powers and cooling powers. The motor power is put to the lowest setting
first and the cooling power is set to a minimum value corresponding to a barrel temperature ~0.1
K above the melting point. Cooling power is adjusted by changing the bus bar heater power to
allow more or less heat to flow out of the extruder; a decrease in heater power results in an equal
increase in cooling power. Experience has shown that the same starting cooling power can be
selected for each motor power setting to achieve a barrel temperature slightly above the melting
point. The viscous heat load in the liquid filled extruder is essentially constant due to the very
low viscosity of liquid cryogens regardless of the changing screw speed. The cooling power is
increased incrementally from the minimum power until the extruder stalls or the predetermined
torque limit is reached. The cooling power (�̇�𝑐𝑜𝑜𝑙) is considered to be the difference between the
current bus heater power (𝑃ℎ) and the bus heater power when the barrel is at the melting point
temperature (𝑃ℎ,0)
�̇�𝑐𝑜𝑜𝑙 = 𝑃ℎ,0 − 𝑃ℎ.
The bus heater power is found using
𝑃ℎ[𝑊] = ((𝐼𝑠𝑒𝑡[%]
100) ∗ 1[𝐴])
2
∗ 100[𝑜ℎ𝑚𝑠]
where 𝐼𝑠𝑒𝑡 is the percentage of max current set on the Lakeshore 336 temperature controller. The
bus heater power at the melting point is found by interpolating the data after the experiment.
Steady-state is determined to be when the barrel temperature, screw temperatures, and torque
values oscillate about a mean value that changes < 1 % over a 5 minute period. The rotation rate
is recorded when steady state is reached. When the cooling power end condition is reached the

79
motor power is increased to the next setting and the cooling power is reset to the minimum
amount. Measurements continue for the next motor power once the barrel temperature is > Tm.
4.3.3 Idle State and Warm-up Procedures
In the idle state the cryocooler and vacuum system are left running but the extruder is
stopped. The bus bar heater power is increased to maintain a barrel temperature > Tm. With the
extruder kept just above the melting point temperature the time needed to restart is short (< 10
minutes) and there is no risk of the extruder pressure going below atmospheric pressure from
over condensing.
The warm-up procedure begins by turning off the extruder motor and cryocooler. The
cryocooler second stage set point temperature is given a value of 290 K and the controller
increases the bus bar heater power to 100 %. Heater power is also turned up to 100 % on the
circulation loop heaters. These heaters will turn off when the circulation loop temperature
sensors reach 290 K. The vacuum system is kept on as a precaution in case of a leak in either the
extruder or vacuum chamber. Warm-up from 10-290 K usually takes 10-12 hours. Once all
extruder temperatures are above 273 K the roughing pump is turned off and air is admitted into
the vacuum chamber. The reservoir valve is shut preserving the process gas for the next
experiment. The process gas is evacuated from the extruder into the fume hood if it is flammable.
The vacuum chamber can be opened and the nozzle changed or the extruder disassembled at this
point.
4.4 Uncertainty
The measurement error was calculated for all data presented in this research and
tabulated in Table 4.2. The random error was found by taking 20 samples from each sensor at
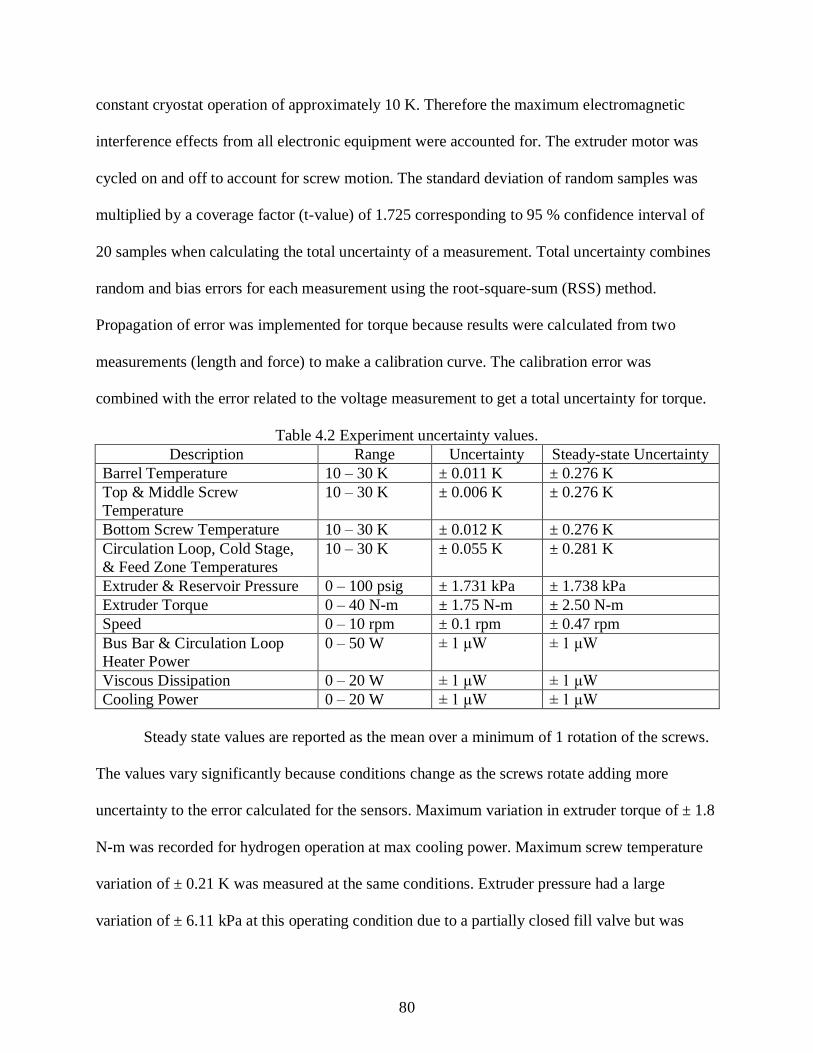
80
constant cryostat operation of approximately 10 K. Therefore the maximum electromagnetic
interference effects from all electronic equipment were accounted for. The extruder motor was
cycled on and off to account for screw motion. The standard deviation of random samples was
multiplied by a coverage factor (t-value) of 1.725 corresponding to 95 % confidence interval of
20 samples when calculating the total uncertainty of a measurement. Total uncertainty combines
random and bias errors for each measurement using the root-square-sum (RSS) method.
Propagation of error was implemented for torque because results were calculated from two
measurements (length and force) to make a calibration curve. The calibration error was
combined with the error related to the voltage measurement to get a total uncertainty for torque.
Table 4.2 Experiment uncertainty values.
Description Range Uncertainty Steady-state Uncertainty
Barrel Temperature 10 – 30 K ± 0.011 K ± 0.276 K
Top & Middle Screw
Temperature
10 – 30 K ± 0.006 K ± 0.276 K
Bottom Screw Temperature 10 – 30 K ± 0.012 K ± 0.276 K
Circulation Loop, Cold Stage,
& Feed Zone Temperatures
10 – 30 K ± 0.055 K ± 0.281 K
Extruder & Reservoir Pressure 0 – 100 psig ± 1.731 kPa ± 1.738 kPa
Extruder Torque 0 – 40 N-m ± 1.75 N-m ± 2.50 N-m
Speed 0 – 10 rpm ± 0.1 rpm ± 0.47 rpm
Bus Bar & Circulation Loop
Heater Power
0 – 50 W ± 1 μW ± 1 μW
Viscous Dissipation 0 – 20 W ± 1 μW ± 1 μW
Cooling Power 0 – 20 W ± 1 μW ± 1 μW
Steady state values are reported as the mean over a minimum of 1 rotation of the screws.
The values vary significantly because conditions change as the screws rotate adding more
uncertainty to the error calculated for the sensors. Maximum variation in extruder torque of ± 1.8
N-m was recorded for hydrogen operation at max cooling power. Maximum screw temperature
variation of ± 0.21 K was measured at the same conditions. Extruder pressure had a large
variation of ± 6.11 kPa at this operating condition due to a partially closed fill valve but was

81
typically ± 0.123 kPa. These errors are combined with the sensor uncertainty using RSS and
reported in a separate column in Table 4.1.

82
CHAPTER 5: RESULTS
Experimental observations and theoretical predictions are needed to identify the heat
transfer and fluid flow characteristics of hydrogenic twin screw extrusion. The Diagnostic Twin
Screw Extruder (DTSE) was used to investigate the effects of independent controls on dependent
thermal and flow conditions. The DTSE was operated through a range of cooling powers, screw
speeds, nozzle areas, and barrel temperature; each control affecting extrudate temperature and
torque. A basic heat transfer model was used to predict extrudate temperature and torque then
compare predictions to experimental values. The objective of this chapter is show that the DTSE
data can be used to understand heat transfer and fluid flow characteristics.
5.1 Experimental Results: Controlling Barrel Temperature
An important consideration in characterizing hydrogenic twin screw extruders is how
extruders respond to changes in barrel temperature. The barrel temperature is controlled by
balancing thermal energy of the DTSE. The cooling power of the pulse-tube cryocooler is
balanced by electric heater power. Various barrel temperature settings are compared to screw
temperature measurements in Section 5.1.1 and torque measurements in Section 5.1.2. Barrel
temperature is proportional to cooling power therefore results in this section are synonymous
with controlling cooling power. For convenience, cooling powers are reported wherever barrel
temperatures are.
5.1.1 Comparing screw and barrel temperatures
Shear strength of hydrogenic solids increases greatly just below the melting point
temperatures. For example, the shear strength of hydrogen goes from essentially zero to greater
than 24 kPa when decreasing over the range 14-13.8 K (Figure 5.1). The shear strength of
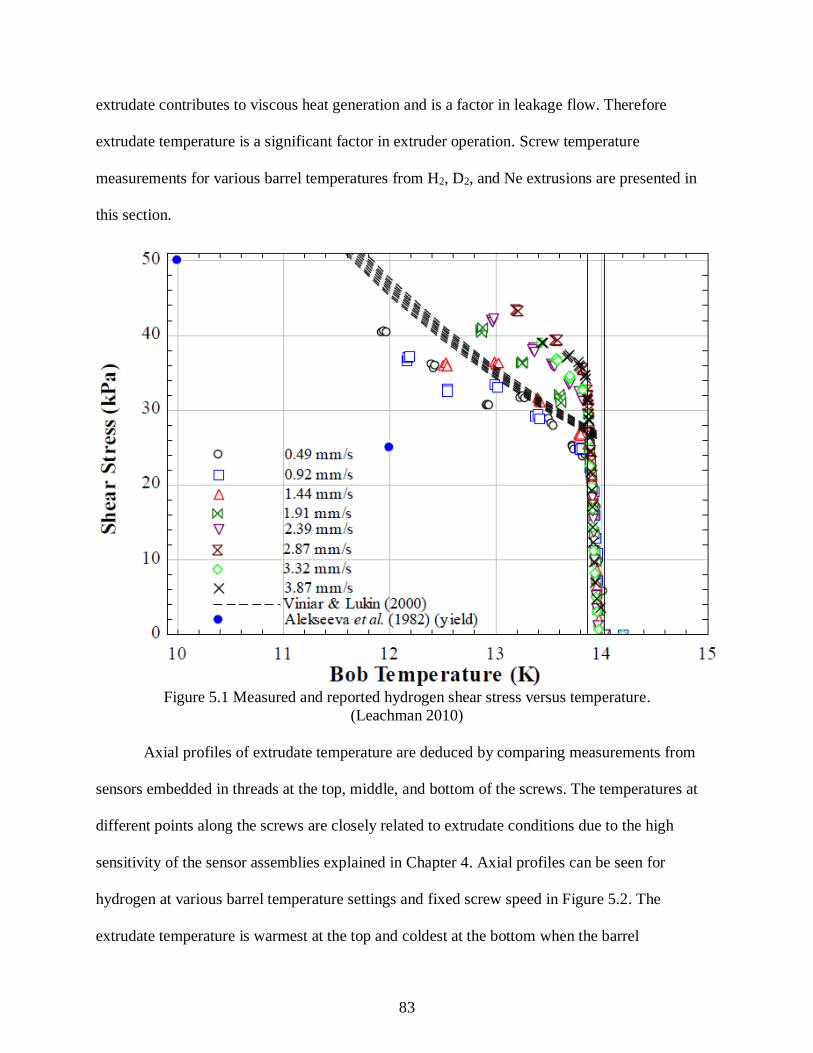
83
extrudate contributes to viscous heat generation and is a factor in leakage flow. Therefore
extrudate temperature is a significant factor in extruder operation. Screw temperature
measurements for various barrel temperatures from H2, D2, and Ne extrusions are presented in
this section.
Figure 5.1 Measured and reported hydrogen shear stress versus temperature.
(Leachman 2010)
Axial profiles of extrudate temperature are deduced by comparing measurements from
sensors embedded in threads at the top, middle, and bottom of the screws. The temperatures at
different points along the screws are closely related to extrudate conditions due to the high
sensitivity of the sensor assemblies explained in Chapter 4. Axial profiles can be seen for
hydrogen at various barrel temperature settings and fixed screw speed in Figure 5.2. The
extrudate temperature is warmest at the top and coldest at the bottom when the barrel
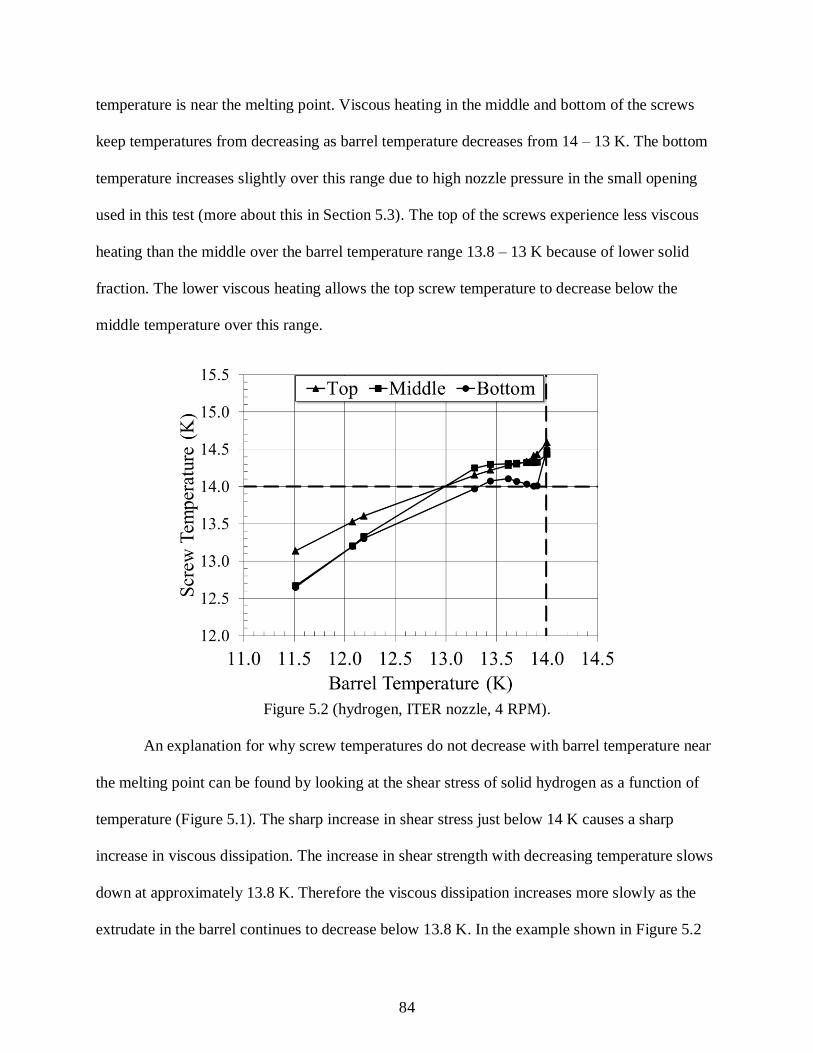
84
temperature is near the melting point. Viscous heating in the middle and bottom of the screws
keep temperatures from decreasing as barrel temperature decreases from 14 – 13 K. The bottom
temperature increases slightly over this range due to high nozzle pressure in the small opening
used in this test (more about this in Section 5.3). The top of the screws experience less viscous
heating than the middle over the barrel temperature range 13.8 – 13 K because of lower solid
fraction. The lower viscous heating allows the top screw temperature to decrease below the
middle temperature over this range.
Figure 5.2 (hydrogen, ITER nozzle, 4 RPM).
An explanation for why screw temperatures do not decrease with barrel temperature near
the melting point can be found by looking at the shear stress of solid hydrogen as a function of
temperature (Figure 5.1). The sharp increase in shear stress just below 14 K causes a sharp
increase in viscous dissipation. The increase in shear strength with decreasing temperature slows
down at approximately 13.8 K. Therefore the viscous dissipation increases more slowly as the
extrudate in the barrel continues to decrease below 13.8 K. In the example shown in Figure 5.2

85
the screw temperatures decrease below the melting point at a barrel temperature of
approximately 13 K. This threshold barrel temperature coincides with extrusion instability at
barrel temperatures just below the melting point seen in a prototype D2 TSE (Meitner 2009).
According to these results the instability is caused by screw temperatures exceeding the melting
point due to viscous dissipation.
The screw temperature distribution changes form at barrel temperature below the
threshold; all screw temperatures decrease with barrel temperature at a high rate of change. This
is again due to the change in shear stress behavior at a specific temperature below the melting
point. In this regime the middle and bottom screw sensors show nearly the same steady state
temperature. The temperature can only be the same if the viscous dissipation and convection heat
transfer is the same at both locations. Therefore the extrudate must be the same high solid
fraction at both locations. This has important ramifications in the extruder pumping ability;
throughput increases with fill length (Figure 5.3). In polymer TSE’s c-chambers are partially
filled with solid pellets until the pumping zone where the chambers are fully filled with melt.
This is because the higher viscosity of the melt fills leakage gaps causing a buildup of pressure.
The higher viscosity condition of hydrogenic material is the solid state. Therefore the pumping
zone in hydrogenic TSE’s is characterized by c-chambers fully filled with solid extrudate. The
fully filled length can be roughly estimated from the three screw temperature sensors. The
extruder is at least half full of solid when the middle and bottom sensors are the same
temperature below the melting point.
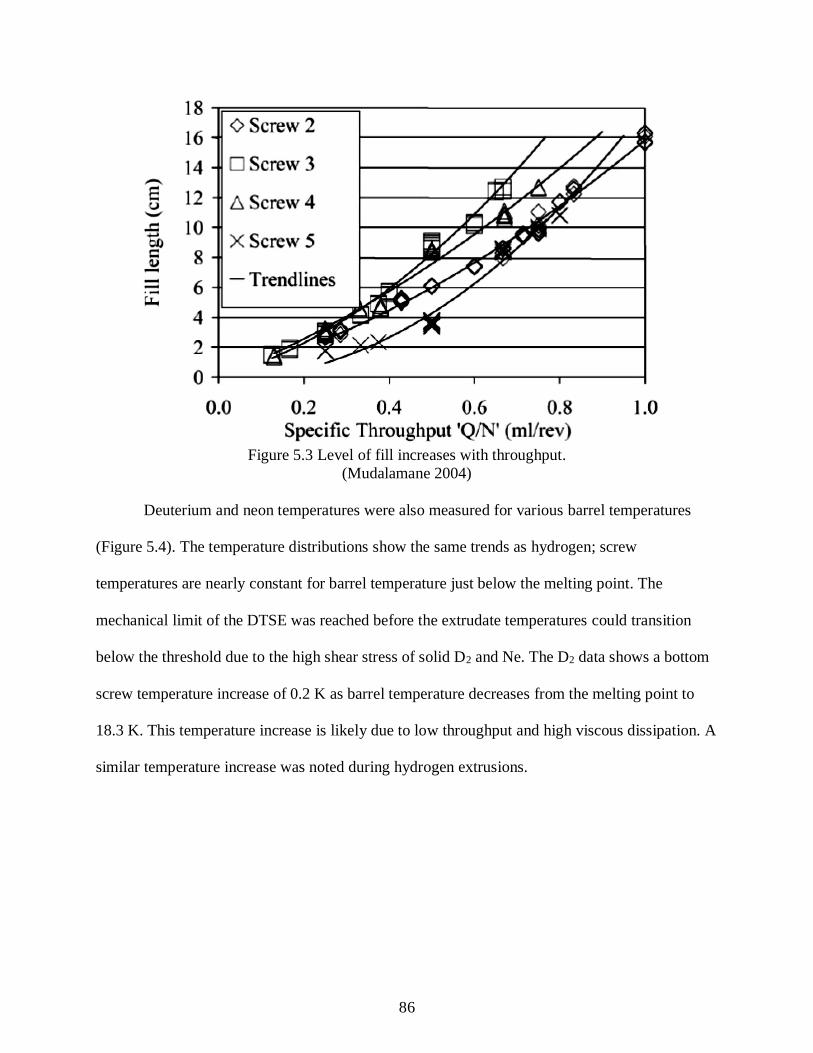
86
Figure 5.3 Level of fill increases with throughput.
(Mudalamane 2004)
Deuterium and neon temperatures were also measured for various barrel temperatures
(Figure 5.4). The temperature distributions show the same trends as hydrogen; screw
temperatures are nearly constant for barrel temperature just below the melting point. The
mechanical limit of the DTSE was reached before the extrudate temperatures could transition
below the threshold due to the high shear stress of solid D2 and Ne. The D2 data shows a bottom
screw temperature increase of 0.2 K as barrel temperature decreases from the melting point to
18.3 K. This temperature increase is likely due to low throughput and high viscous dissipation. A
similar temperature increase was noted during hydrogen extrusions.

87
Figure 5.4 Screw temperatures for deuterium (left) and neon (right) have similar distributions.
(D2 with ITER nozzle at 4 rpm, Ne with 7.8 mm diameter nozzle at 5 rpm)
Azimuthal extrudate temperature distributions are captured by sampling the screw
sensors at the periphery as they rotate over time: the sensors travel from near the barrel wall to
inside the intermeshing zone. This path explicitly gives the extrudate temperature in the flight
and calendar gaps. The top and middle temperature profiles are synchronized because the sensors
are mounted at the same azimuthal location on the idle screw. The bottom sensor is mounted on
the drive screw in a different orientation.
Transient temperatures during DTSE operation at barrel temperatures of 13.6 and 11.5 K
are shown in Figure 5.5 and 5.6. The transient curves provide more detail about the local
temperature variation than the steady state points when comparing the two figures. The screw
temperatures are above the melting line at all angular positions for the higher barrel temperature.
Torque measurements indicate that solid is present in the extruder at this barrel temperature
therefore viscous dissipation must be controlling screw temperatures. A large amount of mixing
is occurring at this condition as indicated by the constant screw temperatures. Mixing is an
indication of high leakage flow so a low throughput is expected.

88
Figure 5.5 Azimuthal temperature profiles for H2 extrusion at barrel temperature of 13.6 K.
(4 rpm, ITER nozzle)
Figure 5.6 Azimuthal temperature profiles for H2 extrusion at barrel temperature of 11.5 K.
(3.16 rpm, ITER nozzle, Tb = 11.5 K)
The screw temperatures fluctuate as much as 0.6 K azimuthally at the barrel temperature
setting. The fluctuation is due to viscous dissipation being higher in the intermeshing zone than

89
near the barrel wall because there are more moving surfaces shearing solid. The difference in
conduction length between the two locations also has an effect on the local temperatures: heat
has less distance to travel near the barrel wall therefore the rate of heat transfer is higher than in
the intermeshing zone.
Upon close inspection the temperature leading into the intermeshing zone has a higher
rate of change than the temperature leading away (the slope is steeper on the left side of the peak
than the right). This is due to the difference in viscous heating between the converging and
diverging ends of the intermeshing zone. The entrance of the intermeshing zone (converging
end) is where drag flow creates relatively high heat and pressure leading to high temperature
(Figure 5.7). Therefore the screw temperature measurement increases quickly as the screw sensor
passes from near the low temperature barrel wall to the converging end of the intermeshing zone.
The screw sensor then passes through the diverging end of the intermeshing zone kept warm by
leakage flow causing a slower rate of temperature change before going near the barrel wall again.
Figure 5.7 Converging end of intermeshing zone creates high pressure (plusses).
(Van der Goot 1996)
5.1.2 Comparing Torque and Barrel Temperature
Torque data for hydrogen extrusions at various barrel temperatures and constant screw
speed is shown in Figure 5.8. The data shows that torque increases with decreasing barrel
temperature. The torque increase indicates that extrudate shear stress is increasing with
decreasing barrel temperature and therefore the extrudate temperature must also be decreasing.
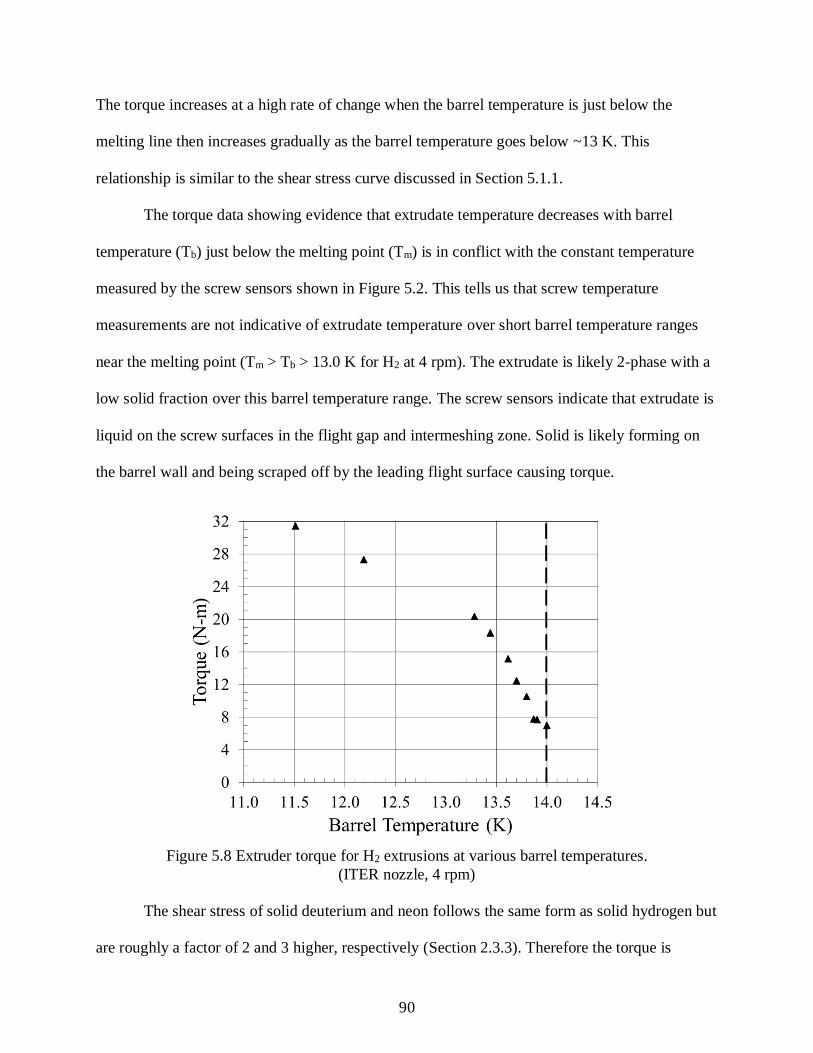
90
The torque increases at a high rate of change when the barrel temperature is just below the
melting line then increases gradually as the barrel temperature goes below ~13 K. This
relationship is similar to the shear stress curve discussed in Section 5.1.1.
The torque data showing evidence that extrudate temperature decreases with barrel
temperature (Tb) just below the melting point (Tm) is in conflict with the constant temperature
measured by the screw sensors shown in Figure 5.2. This tells us that screw temperature
measurements are not indicative of extrudate temperature over short barrel temperature ranges
near the melting point (Tm > Tb > 13.0 K for H2 at 4 rpm). The extrudate is likely 2-phase with a
low solid fraction over this barrel temperature range. The screw sensors indicate that extrudate is
liquid on the screw surfaces in the flight gap and intermeshing zone. Solid is likely forming on
the barrel wall and being scraped off by the leading flight surface causing torque.
Figure 5.8 Extruder torque for H2 extrusions at various barrel temperatures.
(ITER nozzle, 4 rpm)
The shear stress of solid deuterium and neon follows the same form as solid hydrogen but
are roughly a factor of 2 and 3 higher, respectively (Section 2.3.3). Therefore the torque is
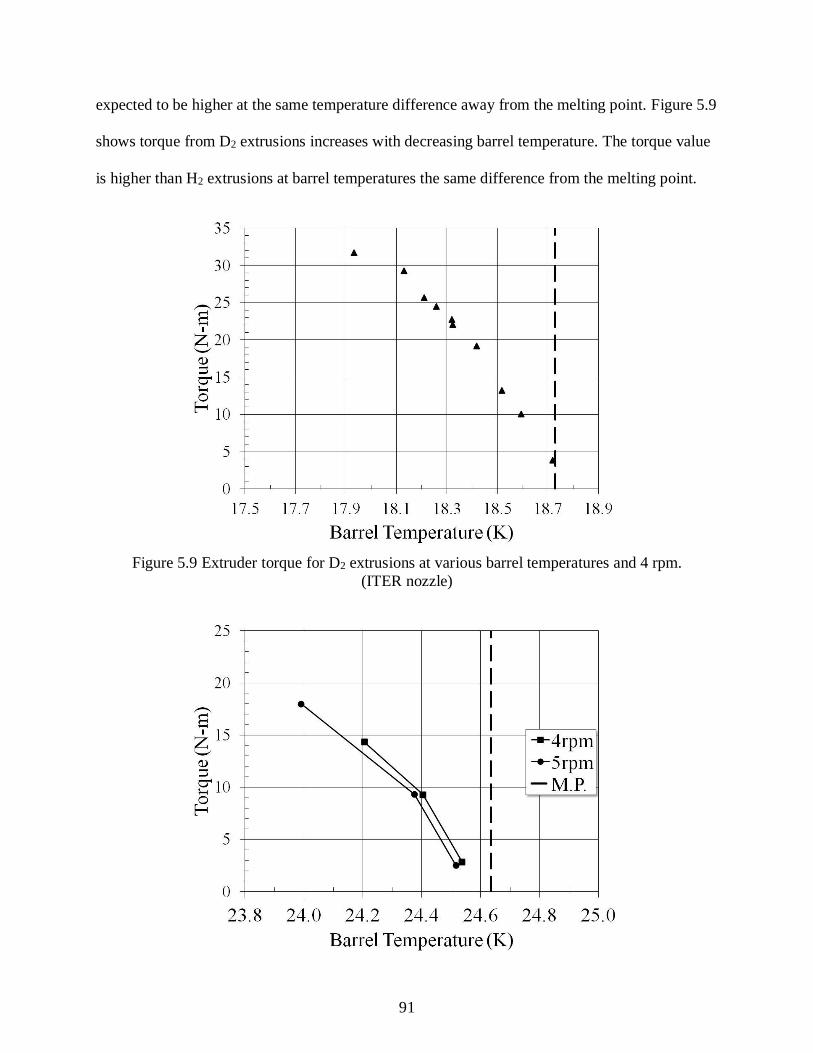
91
expected to be higher at the same temperature difference away from the melting point. Figure 5.9
shows torque from D2 extrusions increases with decreasing barrel temperature. The torque value
is higher than H2 extrusions at barrel temperatures the same difference from the melting point.
Figure 5.9 Extruder torque for D2 extrusions at various barrel temperatures and 4 rpm.
(ITER nozzle)
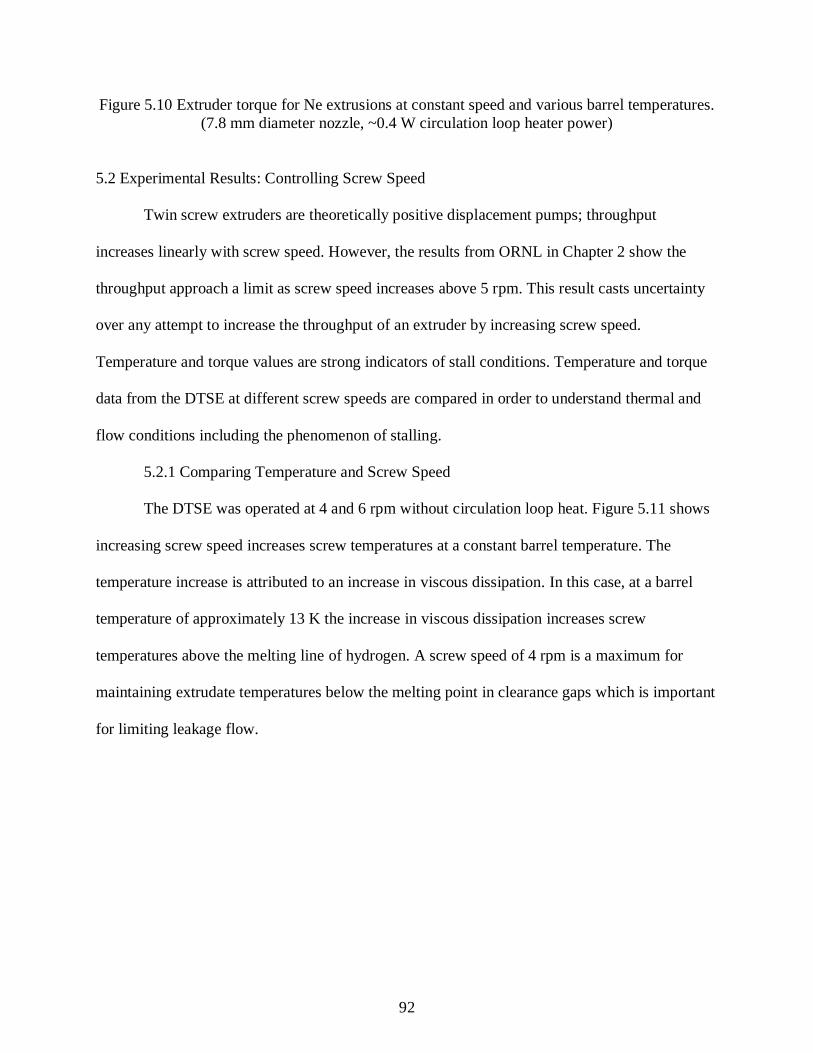
92
Figure 5.10 Extruder torque for Ne extrusions at constant speed and various barrel temperatures.
(7.8 mm diameter nozzle, ~0.4 W circulation loop heater power)
5.2 Experimental Results: Controlling Screw Speed
Twin screw extruders are theoretically positive displacement pumps; throughput
increases linearly with screw speed. However, the results from ORNL in Chapter 2 show the
throughput approach a limit as screw speed increases above 5 rpm. This result casts uncertainty
over any attempt to increase the throughput of an extruder by increasing screw speed.
Temperature and torque values are strong indicators of stall conditions. Temperature and torque
data from the DTSE at different screw speeds are compared in order to understand thermal and
flow conditions including the phenomenon of stalling.
5.2.1 Comparing Temperature and Screw Speed
The DTSE was operated at 4 and 6 rpm without circulation loop heat. Figure 5.11 shows
increasing screw speed increases screw temperatures at a constant barrel temperature. The
temperature increase is attributed to an increase in viscous dissipation. In this case, at a barrel
temperature of approximately 13 K the increase in viscous dissipation increases screw
temperatures above the melting line of hydrogen. A screw speed of 4 rpm is a maximum for
maintaining extrudate temperatures below the melting point in clearance gaps which is important
for limiting leakage flow.

93
Figure 5.11 Barrel and screw temperatures increase with screw speed at constant barrel
temperature for H2 extrusions.
(ITER nozzle, (left) 4 rpm, (right) 6 rpm)
The period of azimuthal temperature distribution varies with screw speed (Figure 5.12).
At a higher screw speed the period of the temperature oscillations is shorter matching the higher
frequency at which the sensors pass by the barrel wall (minimum) and through the intermeshing
zone (maximum). These measurements are also useful for estimating the screw speed; screw
speed is the inverse of temperature period.
Figure 5.12 Screw temperature period decreases with increasing screw speed for H2 extrusions.
(ITER nozzle, 10.2 W cooling power, (left) 4 rpm, (right) 6 rpm)
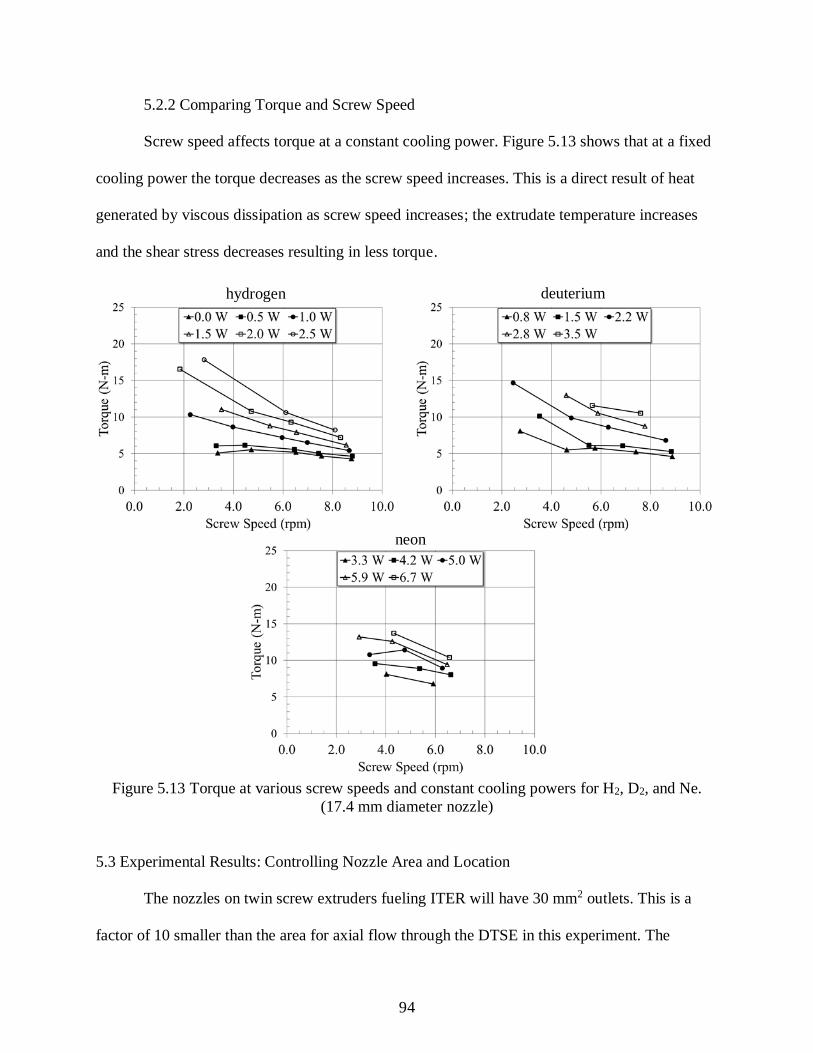
94
5.2.2 Comparing Torque and Screw Speed
Screw speed affects torque at a constant cooling power. Figure 5.13 shows that at a fixed
cooling power the torque decreases as the screw speed increases. This is a direct result of heat
generated by viscous dissipation as screw speed increases; the extrudate temperature increases
and the shear stress decreases resulting in less torque.
Figure 5.13 Torque at various screw speeds and constant cooling powers for H2, D2, and Ne.
(17.4 mm diameter nozzle)
5.3 Experimental Results: Controlling Nozzle Area and Location
The nozzles on twin screw extruders fueling ITER will have 30 mm2 outlets. This is a
factor of 10 smaller than the area for axial flow through the DTSE in this experiment. The
hydrogen deuterium
neon
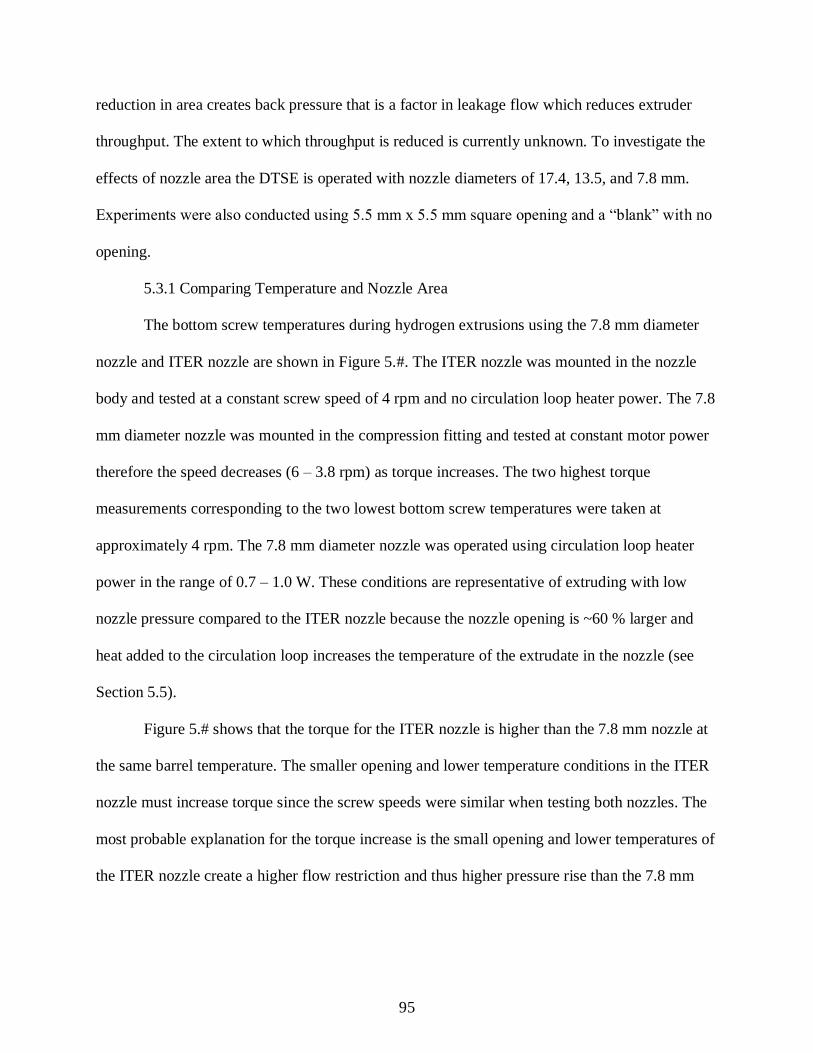
95
reduction in area creates back pressure that is a factor in leakage flow which reduces extruder
throughput. The extent to which throughput is reduced is currently unknown. To investigate the
effects of nozzle area the DTSE is operated with nozzle diameters of 17.4, 13.5, and 7.8 mm.
Experiments were also conducted using 5.5 mm x 5.5 mm square opening and a “blank” with no
opening.
5.3.1 Comparing Temperature and Nozzle Area
The bottom screw temperatures during hydrogen extrusions using the 7.8 mm diameter
nozzle and ITER nozzle are shown in Figure 5.#. The ITER nozzle was mounted in the nozzle
body and tested at a constant screw speed of 4 rpm and no circulation loop heater power. The 7.8
mm diameter nozzle was mounted in the compression fitting and tested at constant motor power
therefore the speed decreases (6 – 3.8 rpm) as torque increases. The two highest torque
measurements corresponding to the two lowest bottom screw temperatures were taken at
approximately 4 rpm. The 7.8 mm diameter nozzle was operated using circulation loop heater
power in the range of 0.7 – 1.0 W. These conditions are representative of extruding with low
nozzle pressure compared to the ITER nozzle because the nozzle opening is ~60 % larger and
heat added to the circulation loop increases the temperature of the extrudate in the nozzle (see
Section 5.5).
Figure 5.# shows that the torque for the ITER nozzle is higher than the 7.8 mm nozzle at
the same barrel temperature. The smaller opening and lower temperature conditions in the ITER
nozzle must increase torque since the screw speeds were similar when testing both nozzles. The
most probable explanation for the torque increase is the small opening and lower temperatures of
the ITER nozzle create a higher flow restriction and thus higher pressure rise than the 7.8 mm
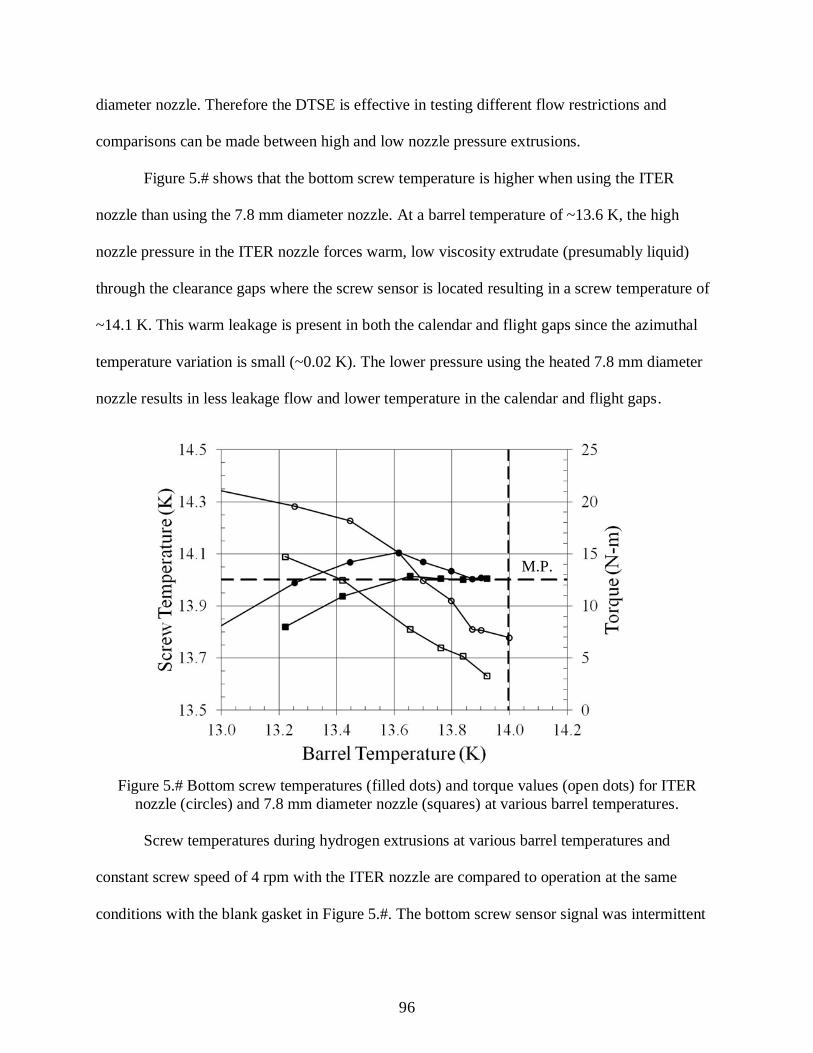
96
diameter nozzle. Therefore the DTSE is effective in testing different flow restrictions and
comparisons can be made between high and low nozzle pressure extrusions.
Figure 5.# shows that the bottom screw temperature is higher when using the ITER
nozzle than using the 7.8 mm diameter nozzle. At a barrel temperature of ~13.6 K, the high
nozzle pressure in the ITER nozzle forces warm, low viscosity extrudate (presumably liquid)
through the clearance gaps where the screw sensor is located resulting in a screw temperature of
~14.1 K. This warm leakage is present in both the calendar and flight gaps since the azimuthal
temperature variation is small (~0.02 K). The lower pressure using the heated 7.8 mm diameter
nozzle results in less leakage flow and lower temperature in the calendar and flight gaps.
Figure 5.# Bottom screw temperatures (filled dots) and torque values (open dots) for ITER
nozzle (circles) and 7.8 mm diameter nozzle (squares) at various barrel temperatures.
Screw temperatures during hydrogen extrusions at various barrel temperatures and
constant screw speed of 4 rpm with the ITER nozzle are compared to operation at the same
conditions with the blank gasket in Figure 5.#. The bottom screw sensor signal was intermittent
M.P.

97
for barrel temperature settings below 13.2 K. Bottom screw temperatures were predicted
assuming the temperature difference was constant between the middle and bottom starting at a
barrel temperature of ~12.7 K. The data shows bottom screw temperature increases above the
melting point at a barrel temperature of ~13.6 K for both nozzle configurations. This is attributed
to warm leakage flow from high nozzle pressure as previously stated. The top screw
temperatures are similar for both nozzles at barrel temperatures below 13.0 K. The middle screw
temperature behavior is different between the two nozzles at barrel temperatures below 13.0 K;
the middle temperature is close to the bottom temperature for the ITER nozzle and close to the
top for the blank nozzle. Energy from viscous dissipation remains in the extruder when the
nozzle is sealed with the blank gasket. This energy warms extrudate and lowers the viscosity.
The warm low viscosity extrudate is displaced by nozzle pressure increasing the screw sensor in
the leakage gaps at the middle of the barrel. The temperature between the calendar and flight gap
varies more than 0.2 K for both configurations at barrel temperatures below 13.0 K. Therefore
the leakage flow is not the same in both locations.
Figure 5.14 Screw temperatures are higher for H2 extrusions using the nozzle blank (right)
compared to the open ITER nozzle (left) at 4 rpm.
(open dots are predicted bottom screw temperatures)
signal loss
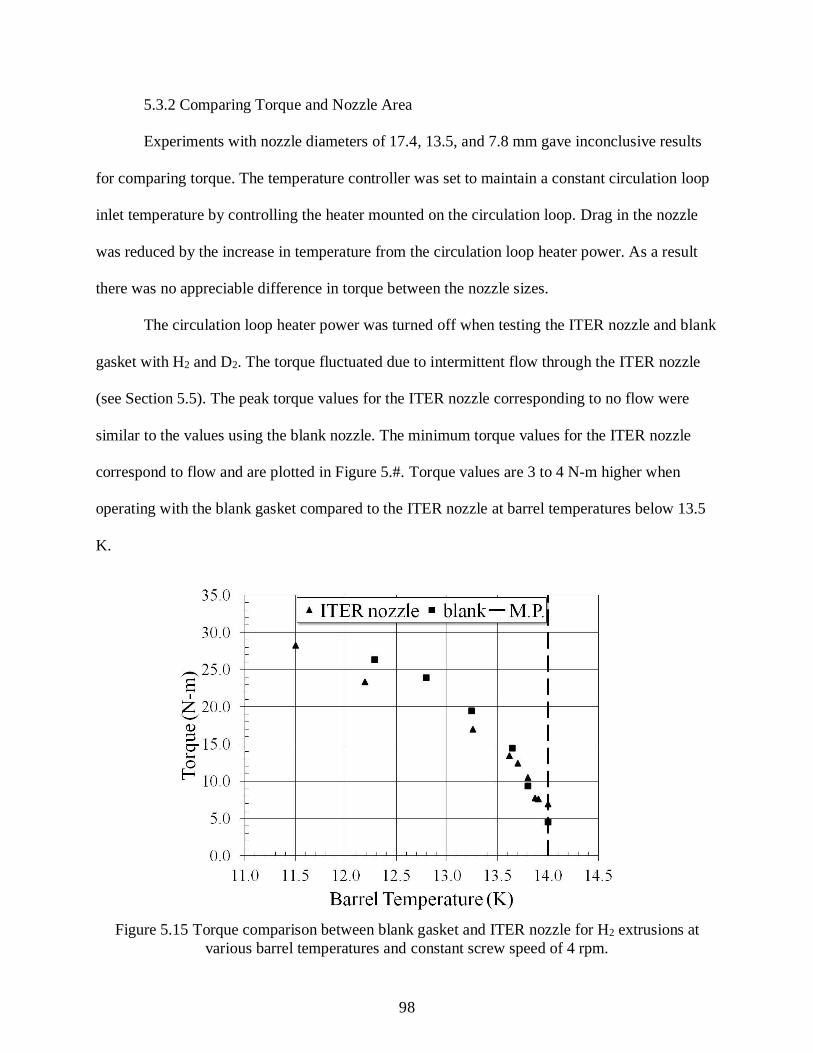
98
5.3.2 Comparing Torque and Nozzle Area
Experiments with nozzle diameters of 17.4, 13.5, and 7.8 mm gave inconclusive results
for comparing torque. The temperature controller was set to maintain a constant circulation loop
inlet temperature by controlling the heater mounted on the circulation loop. Drag in the nozzle
was reduced by the increase in temperature from the circulation loop heater power. As a result
there was no appreciable difference in torque between the nozzle sizes.
The circulation loop heater power was turned off when testing the ITER nozzle and blank
gasket with H2 and D2. The torque fluctuated due to intermittent flow through the ITER nozzle
(see Section 5.5). The peak torque values for the ITER nozzle corresponding to no flow were
similar to the values using the blank nozzle. The minimum torque values for the ITER nozzle
correspond to flow and are plotted in Figure 5.#. Torque values are 3 to 4 N-m higher when
operating with the blank gasket compared to the ITER nozzle at barrel temperatures below 13.5
K.
Figure 5.15 Torque comparison between blank gasket and ITER nozzle for H2 extrusions at
various barrel temperatures and constant screw speed of 4 rpm.

99
Torque values for deuterium extrusions using the ITER nozzle and blank gasket at
various barrel temperatures and constant screw speed of 4 rpm are shown in Figure 5.#. The
extrudate flow through the ITER nozzle was intermittent. The torque is 4 to 6 N-m higher when
operating with the blank gasket.
Figure 5.16 Torque comparison between blank gasket and ITER nozzle for D2 extrusions at
various barrel temperatures and constant screw speed of 4 rpm.
5.3.3 Comparing Nozzle Locations
The DTSE was originally designed with the ability to change the nozzle area by replacing
the gasket in the Swagelok VCR ® fitting that connects the circulation loop to the extruder. This
put the gasket approximately 4 cm below the actively cooled copper nozzle body. Conduction
through the VCR gland from the gasket is essentially zero because of the low thermal
conductivity of type-316 stainless steel making the gasket thermally isolated. The temperature of
the gasket in this location is dependent on the condition and flow rate of the extrudate and heat
leak from the circulation loop. The gasket was therefore moved to the nozzle body so that it

100
could be actively cooled. The intent was to make the gasket temperature less susceptible to
viscous dissipation and circulation loop heat; thus more stable.
Experiments were carried out using deuterium at a screw speed of 4 rpm (Figure 5.17).
The results show that torque was higher using the actively cooled nozzle. This suggests that
extrudate flowing through the actively cooled nozzle has higher shear stress and therefore is at a
lower temperature than the isolated gasket. Heat from shearing solid as it flows through the
gasket cannot be removed by the cooling system when the gasket is isolated so the heat is
absorbed by the extrudate increasing the temperature and decreasing the shear stress.
The barrel temperature is lower when using the actively cooled nozzle gasket compared
to the isolated one. A larger portion of the viscous dissipation is taking place in the nozzle
instead of the barrel when the gasket is located in the nozzle body. The increase in viscous
dissipation in the nozzle is detected by the bottom screw temperature sensor: temperatures are
higher when operating with the actively cooled nozzle.
Figure 5.17 actively cooled nozzle gasket creates lower barrel temperatures, higher screw
temperatures (left) and higher torque (right) than isolated (deuterium, 4 rpm, ITER nozzle)
screw
barrel

101
5.4 Experimental Results: Viscous Dissipation
Viscous dissipation is the heat released when solid extrudate is strained. The amount of
viscous dissipation in the extruder can be determined experimentally by the product of torque
and screw speed assuming the mechanical power is being converted to heat. Extruder torque and
speed are deduced from data recorded for the DC motor.
Viscous dissipation at various cooling powers is shown in Figure 5.18. The data falls
close to the 1:1 ratio line supporting the theory that cooling power is balanced by viscous
dissipation in the DTSE. The extrudate regulates viscous dissipation at each cooling power
setting because extrudate shear stress is a function of temperature and shear rate. For instance, if
there is excess viscous heating extrudate temperature increases which decreases shear strength
causing a decrease in torque and consequently a decrease in viscous heating. The cooling power
is only the amount required to remove the energy from viscous dissipation since this is a closed
system (no mass transfer). Extruders for pellet production would need extra cooling power to
condense gas to subcooled solid.
102
Figure 5.18 Parity plot comparison of viscous dissipation and cooling power of H2 extrusions.
(ITER nozzle)
Viscous dissipation measured for hydrogen operation with the ITER and blank nozzles
closely follows a 1:1 ratio with cooling power. Closing the nozzle did not affect the control
cooling power had over viscous dissipation. This could be because steady state measurements for
the ITER nozzle were taken at the high torque peaks when the nozzle seemed to be plugged in
which case the flow is stopped just like operating with a closed nozzle. Steady state
measurements were also taken at peak torque for deuterium when the extruder showed signs of
no flow. However, the viscous dissipation for deuterium showed a systematic difference between
the open and closed nozzle operations. The higher viscous dissipation for the closed nozzle
follows from the higher torque for deuterium using a closed nozzle explained in the previous
section. Higher torque at the same screw speed results in higher viscous dissipation. Neither set
of viscous dissipation data follow the theoretical 1:1 ratio with cooling power. A simple
explanation could be that the system was not allowed enough time to reach thermal equilibrium.
The screw temperature is indirectly controlled by cooling power through viscous dissipation.
When cooling power is increased the barrel temperature immediately decreases and the shear
stress of the extrudate condensing on the barrel wall increases just as fast. Higher shear stress
initially induces higher viscous dissipation but over time the screw temperatures increase and
viscous dissipation decreases to match the cooling power. If cooling power is continuously
increased before the thermal equilibrium is reached then the screws remain cold and viscous
dissipation continues to increase faster than cooling power.

103
Figure 5.19 Parity plots for viscous dissipation and cooling power of hydrogen (left) and
deuterium (right) operation at 4 rpm.
Figure 5.## shows that more viscous dissipation is generated at a screw speed of 6 rpm
than 4 rpm at a constant barrel temperature. The barrel temperature reached 11.5 K for screw
speed of 4 rpm at the maximum cooling power. The barrel temperature reached a minimum of
only 13.1 K for 6 rpm.
Figure 5.## Increasing screw speed requires more cooling power to keep barrel temperature
constant.

104
(hydrogen, ITER nozzle)
5.5 Experimental Results: Controlling Circulation Loop Heater Power
The DTSE circulation loop has two 10 Ω electric heaters to control the temperature of the
extrudate once it leaves the nozzle. In the first experiment campaign the heater closest to the
nozzle (loop heater #1) was used to set the outlet temperature 1 K above the melting point. The
intent was to liquefy any solid leaving the nozzle to limit the drag induced pressure. This would
more closely mimic pellet production conditions where solid is extruded into vacuum. Heat from
either of the circulation loop heaters was found to have an effect on nozzle conditions in the
second experiment campaign. Therefore an investigation on the effect was conducted by
operating the extruder at various circulation loop heater powers and with the heaters turned off.
The circulation loop heater power caused a 50 – 60 % decrease in extruder torque when
set above approximately 0.5 W (Figure 5.20). Liquid flows from the heated part of the
circulation loop to the nozzle due to a density gradient. This creates convection heating of the
nozzle softening the extrudate and decreasing nozzle pressure. The extruder torque decreases
because the extrudate flows easier through the heated nozzle. This indicates that the cross
sectional area of the circulation loop should match the nozzle area for effective use of the loop in
diagnostic measurements.
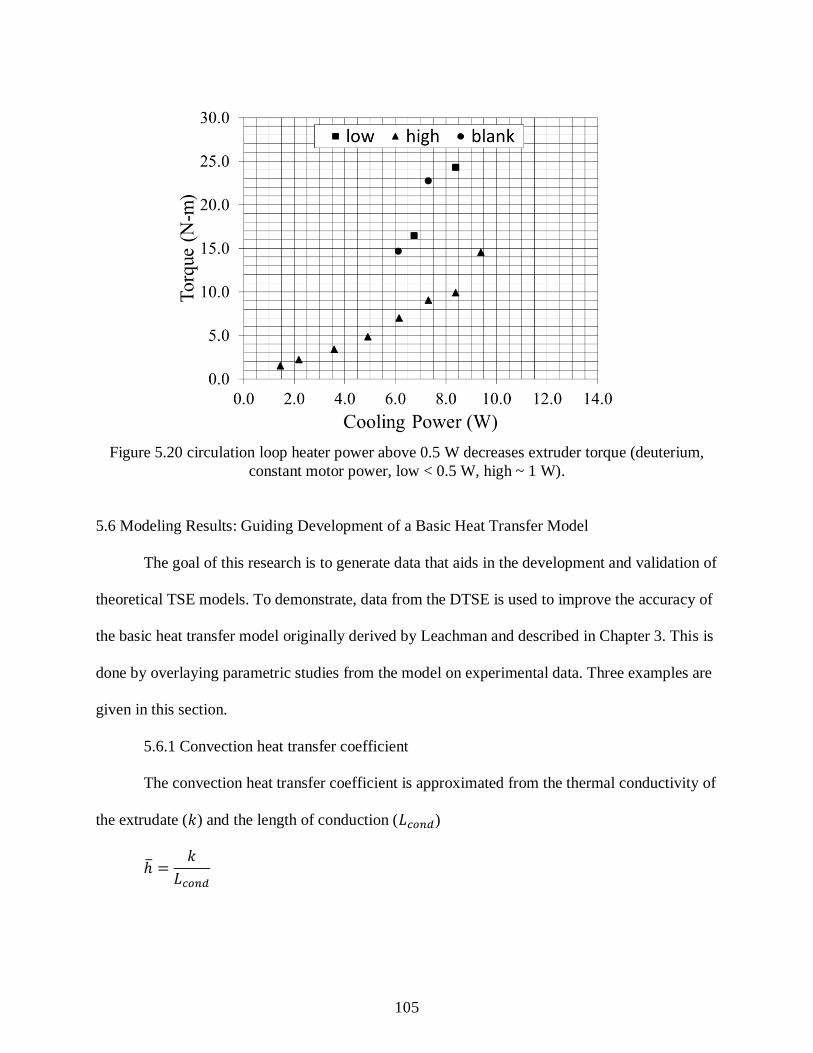
105
Figure 5.20 circulation loop heater power above 0.5 W decreases extruder torque (deuterium,
constant motor power, low < 0.5 W, high ~ 1 W).
5.6 Modeling Results: Guiding Development of a Basic Heat Transfer Model
The goal of this research is to generate data that aids in the development and validation of
theoretical TSE models. To demonstrate, data from the DTSE is used to improve the accuracy of
the basic heat transfer model originally derived by Leachman and described in Chapter 3. This is
done by overlaying parametric studies from the model on experimental data. Three examples are
given in this section.
5.6.1 Convection heat transfer coefficient
The convection heat transfer coefficient is approximated from the thermal conductivity of
the extrudate (𝑘) and the length of conduction (𝐿𝑐𝑜𝑛𝑑)
ℎ̅ =𝑘
𝐿𝑐𝑜𝑛𝑑
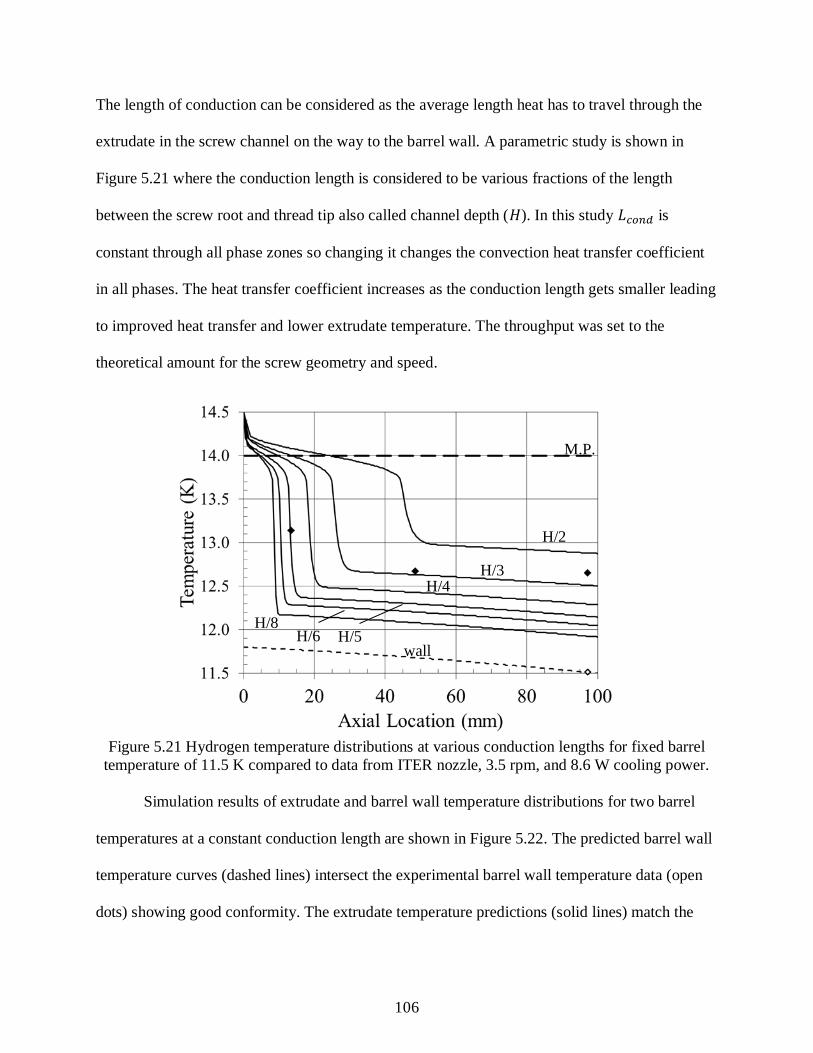
106
The length of conduction can be considered as the average length heat has to travel through the
extrudate in the screw channel on the way to the barrel wall. A parametric study is shown in
Figure 5.21 where the conduction length is considered to be various fractions of the length
between the screw root and thread tip also called channel depth (𝐻). In this study 𝐿𝑐𝑜𝑛𝑑 is
constant through all phase zones so changing it changes the convection heat transfer coefficient
in all phases. The heat transfer coefficient increases as the conduction length gets smaller leading
to improved heat transfer and lower extrudate temperature. The throughput was set to the
theoretical amount for the screw geometry and speed.
Figure 5.21 Hydrogen temperature distributions at various conduction lengths for fixed barrel
temperature of 11.5 K compared to data from ITER nozzle, 3.5 rpm, and 8.6 W cooling power.
Simulation results of extrudate and barrel wall temperature distributions for two barrel
temperatures at a constant conduction length are shown in Figure 5.22. The predicted barrel wall
temperature curves (dashed lines) intersect the experimental barrel wall temperature data (open
dots) showing good conformity. The extrudate temperature predictions (solid lines) match the
wall
H/2
H/3 H/4
H/5 H/6 H/8
M.P.

107
experimental data from the screw sensors (filled dots) within 1 %. The good match between
predicted and measured temperature means that the constant conduction length assumption is
accurate for solid extrudate. Therefore the temperature difference between the barrel wall and
extrudate (~ 1.5 K) is fixed once the screw channels fill with solid.
Figure 5.22 Hydrogen temperature distributions at constant conduction length (H/2.5) and two
barrel temperatures compared to data from ITER nozzle, ~ 3.33 rpm, 12.2 K barrel (squares), and
11.5 K barrel (diamonds).
The experimental data shows that the average solid extrudate temperature is
approximately 13.25 K in the middle and bottom of the barrel. The conduction length from the
model simulations that matches this temperature falls between H/3 and H/2. This suggests a long
conduction length for heat to escape or a low convection heat transfer coefficient at these
operating conditions. The study shows that the length of the 2-phase zone changes largely with
heat transfer out. This zone is also largely influenced by the mass flow rate which is constant in
this study therefore the location of the transition to solid is ignored when investigating
convection heat transfer effects. The close resemblance between the simulations in the solid zone

108
and the middle and bottom temperature data indicates that the convection heat transfer
coefficient is essentially constant in the solid filled portion of the extruder.
5.6.2 Azimuthal temperature variations
Azimuthal temperature distributions discussed in Section 5.1.1 showed temperature
variations as large as 0.6 K between the intermeshing zone and near the barrel wall. The
difference affects the amount of torque predicted by the basic heat transfer model. Simulations
were conducted that assumed different temperatures in three locations: c-chamber, intermeshing
zone, and flight gap. The temperature that the shear stress is calculated at for the different
locations was augmented by a fixed amount in the model thereby changing the shear strength of
the solid at that location. The other extruder parameters were taken from steady state hydrogen
extrusion data at a screw speed of 3.16 rpm and barrel temperature of 11.5 K. The extruder level
of solid fill is equal for all scenarios.
Scenario 3 in Table 5.1 shows the predicted torque assuming no temperature difference
between the extrudate at the three locations. Scenario 2 and 4 assume the temperature varies an
equal amount (0.3 K) above and below the average for the c-chamber, intermeshing zone, and
flight gap. The difference in the two scenarios is whether the material in the c-chamber is equal
to the intermeshing zone or the flight gap. Scenario 2 assumes the material in the c-chamber is
the same temperature as the material in the intermeshing zone resulting in lower shear stress and
lower torque. Scenario 4 assumes the material in the c-chamber is equal to the flight gap
resulting in higher shear stress and higher torque.
Scenario 1 and 6 assume the extreme condition if the temperature varies 0.6 K in
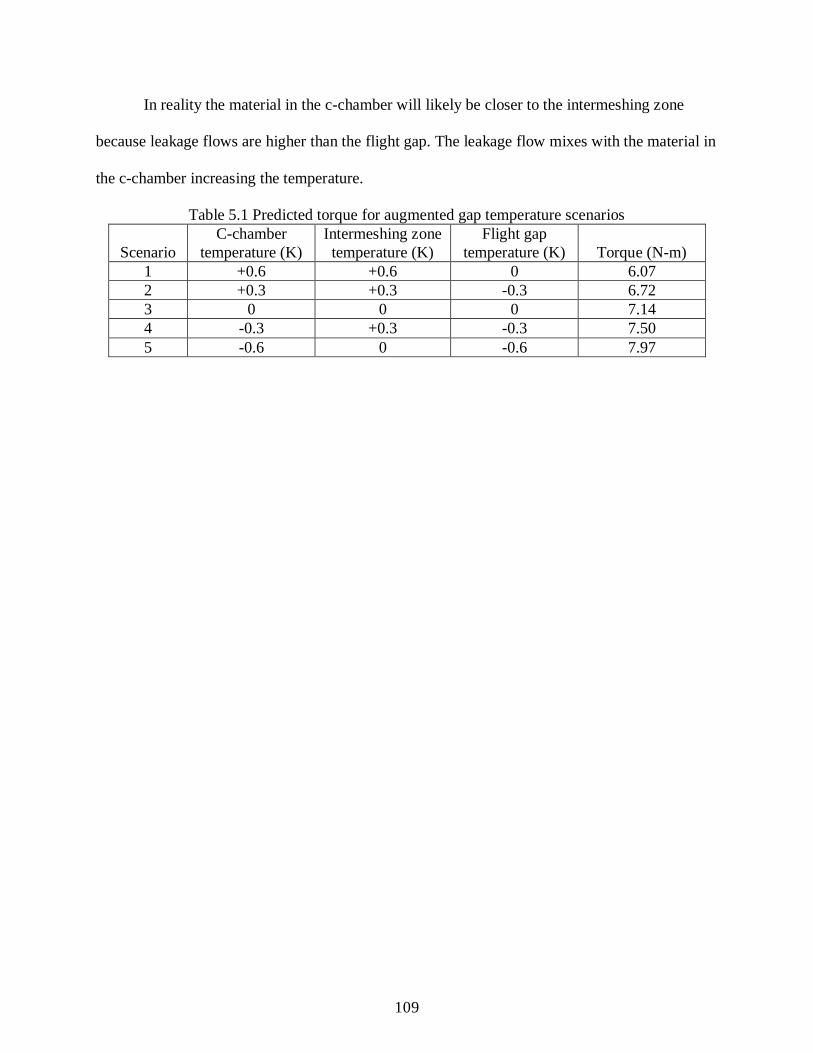
109
In reality the material in the c-chamber will likely be closer to the intermeshing zone
because leakage flows are higher than the flight gap. The leakage flow mixes with the material in
the c-chamber increasing the temperature.
Table 5.1 Predicted torque for augmented gap temperature scenarios
Scenario
C-chamber
temperature (K)
Intermeshing zone
temperature (K)
Flight gap
temperature (K) Torque (N-m)
1 +0.6 +0.6 0 6.07
2 +0.3 +0.3 -0.3 6.72
3 0 0 0 7.14
4 -0.3 +0.3 -0.3 7.50
5 -0.6 0 -0.6 7.97

110
References:
Leachman, J.W., “Thermophysical Properties and Modeling of a Hydrogenic Pellet Production
System,” Dissertation, University of Wisconsin-Madison, (2010).
Meitner, S.J. “Development of a Twin-Screw D2 Extruder for the ITER Pellet Injection System,”
Fusion Science and Technology, 56, (2009).
Mudalamane, R., Bigio, D. I., “Experimental Characterization of Fill Length Behavior in
Extruders,” Polym. Eng. Sci., 44, 557 – 564, (2004).

111
CHAPTER 6: CONCLUSIONS & RECOMMENDATIONS FOR ADDITIONAL WORK
6.1 Concluding Remarks
Twin screw extrusion is a promising process to produce solid hydrogenic material for
fueling fusion tokamaks. Twin screw extruders are inherently stable and can continuously
process material from a relatively small inventory. Early prototype hydrogenic twin screw
extruders have shown throughput instability and stalling. This has prompted an investigation into
heat transfer and fluid flow theory. Theoretical models have been made for polymer extrusions
benefiting from the well understood rheological properties of polymer melts. However, complex
screw geometry and 3D flow profiles required extensive experimental research to guide and
validate these theoretical models. There are no models that predict throughput of hydrogenic
materials from a twin screw extruder and no experiment to guide the development of such
models. This research has successfully produced the design of a diagnostic twin screw extruder
and the methodology for using experimental data to develop theoretical throughput models.
The Diagnostic Twin Screw Extruder design was successful in producing the first ever
temperature measurements from inside the screws. Reliably transferring the temperature sensor
signals was the most difficult part of the design. The most robust wiring harness configuration
used phosphor-bronze wires sheathed and strain relieved by Teflon tubing and sealed using
Loctite 9361 epoxy. The use of a circulation loop and cryocooler allowed essentially closed
system steady operation leading to approximately 200 hours of extruder operation. The steady
operation and modular design enabled testing of the most configurations of any single
hydrogenic TSE to date. Four gases, five nozzle sizes, two nozzle locations, and two circulation
loop heater and temperature sensor locations were tested over a range of barrel temperatures and
screw speeds. The DTSE experienced limitations in cooling power and mechanical strength. The

112
bottom screw temperature sensor reached a minimum of 12.4 K during hydrogen operation at 30
N-m, 3.8 rpm, and maximum cooling power. Mechanical strength limits were exceeded for the
torque arm, motor driveshaft retaining washers, and two helical gears. The DC motor helical
drive gear showed excessive wear on the contact surfaces of the gear teeth. The maximum
extruder torque during stable operation was 38 N-m when processing deuterium at 3.6 rpm.
Torque and screw temperature measurements have shown a number of important
characteristics of the DTSE and hydrogenic twin screw extruders in general. TSE’s have a barrel
temperature threshold below which screw (extrudate) temperatures decrease at a high rate and
torque increases at a slow rate with decreasing barrel temperature. The threshold temperature is
unique for each extrudate material, screw speed, and nozzle size. The level of solid fill changes
with nozzle size and nozzle thermal conditions. The fill level can be estimated by the screw
temperature distribution. The extrudate temperature varies between the flight gap near the barrel
wall and the intermeshing zone (variations as high as 0.6 K were recorded for hydrogen). This
supports the hypothesis of high viscous dissipation and leakage flow (from decreased viscosity)
in the intermeshing zone. Thermal energy in the circulation loop is transferred to the nozzle by
convection which increases the nozzle temperature and decreases the drag flow (pressure
increase) in the nozzle.
Basic heat transfer model simulations compared to experimental data have contributed to
theoretical understanding of hydrogenic TSE’s and laid out a method for developing accurate
predictive throughput models. The parametric study of conduction length showed that the
average convection heat transfer coefficient is constant at various barrel temperatures for solid
filled c-chambers at a constant screw speed.

113
The Diagnostic Twin Screw Extruder is an instrument proven to provide data for
characterizing heat transfer and fluid flow for solid hydrogenic material extrusions. The DTSE
modularity enables the characterization of many screw and nozzle configurations so that a theory
can be built to scale TSE’s to meet fueling specifications for ITER and future tokamaks.
6.2 Method for Characterizing Hydrogenic Twin Screw Extruders
The performance of twin screw extruders changes with extruder geometry and operating
conditions. These correlations change again for different extrudate materials. There are
numerical methods that can solve for temperature, pressure, and throughput of twin screw
extruders. Fukuoka shows a method for solving non-isothermal and non-Newtonian extrusions.
The proposed characterization method is this
1. Use numerical methods to solve continuity, momentum, and energy balance equations
considering phase change, temperature dependency of hydrogenic material properties,
and non-isoviscous effects for DTSE geometry.
2. Compare simulation results of extrudate temperature distribution to DTSE screw sensor
data and adjust numerical model accordingly.
3. Iterate numerical model until temperature distribution and torque predictions match
DTSE data.
4. Use numerical model to specify extruder geometry and operating parameters for meeting
fueling requirements for ITER and other tokamaks.

114
6.3 Future Work
A scalable predictive throughput model for hydrogenic twin screw extruders can now be
pursued using the data provided by the DTSE. The basic throughput model in this research
solves the energy balance while allowing thermophysical properties to change with temperature
but does not consider how fluid flow affects the energy balance. Analytical and empirical
solutions of the continuity and momentum equations for Newtonian fluids from polymer TSE
research are solved separately using the previously calculated temperature distribution to vary
the viscosity and get a general sense of how DTSE conditions affect throughput. More realistic
simulations for non-isothermal and non-Newtonian conditions should be conducted using
numerical approaches found in literature (Fukuoka 1994, Jiang 2008). Calculated extrudate
temperature and extruder torque can be compared to measured values from the DTSE as was
shown in this research to validate the model.
The bearing block should be remade to improve geartrain reliability while operating at
high torque. Separation between the motor and extruder drive gears has been observed leading to
excessive wear and high bending loads on gear teeth. Interference fits of +0.002 inches should be
applied to the needle bearings and tapered roller bearing to prohibit gear separation. The
increased durability will allow the DTSE to process solid deuterium at lower extrudate
temperatures possibly below the shear stress threshold.
The circulation loop heater and temperature sensors should be characterized as a thermal
mass flow meter (TMFM) for measuring DTSE throughput. A thermal mass flow meter uses a
measured amount of heat (�̇�) and temperature change (𝑇𝑜𝑢𝑡 − 𝑇𝑖𝑛) to calculate the mass flow
using the relation
�̇� =�̇�
𝑐𝑝(𝑇𝑜𝑢𝑡 − 𝑇𝑖𝑛)

115
where 𝑐𝑝 is the specific heat capacity of the fluid at constant pressure. The low heat of fusion
and low thermal conductivity of solid hydrogenic material creates a melt layer at the tube wall
and a solid core in the middle of the tube. This is a complex heat transfer problem to solve
analytically therefore experimental techniques could be used to create an empirical relation for
mass flow. This can be done by replacing the screws and barrel in the DTSE with a Vespel
piston and copper cylinder to create a hydrogenic piston extruder. The piston extruder provides a
known mass flow rate for characterizing the TMFM on the circulation loop. Measuring the
throughput of the DTSE is an important diagnostic for characterizing hydrogenic extrusions.
Nozzle conductance should be characterized for the geometries used in this research to
provide a relationship between throughput and nozzle pressure. Hydrogenic TSE’s can be
characterized more accurately if the nozzle pressure in the DTSE is known. The nozzle pressure
can be calculated from the expression
𝑃𝑛𝑜𝑧 = 𝜇�̇�
𝐾
where 𝜇 is the extrudate viscosity, �̇� is the throughput, and 𝐾 is the nozzle conductance. The
conductance can be found experimentally by again replacing the DTSE with a piston extruder.
The nozzle pressure can be calculated from the extrusion force (measured by a load cell on the
piston) divided by the piston area. The throughput can be measured by using the previously
described thermal mass flow meter. The conductance of each nozzle can be determined by
measuring throughput and extrusion pressure for three piston velocities. Thus the nozzle pressure
can be calculated with the known nozzle conductance and measured throughput providing
another important diagnostic for characterizing TSE’s.

116
References:
Fukuoka, T., Min, K., “Numerical Nonisothermal Flow Analysis of Non-Newtonian Fluid in a
Nonintermeshing Counter-Rotating Twin Screw Extruder,” Poly. Engr. Sci., 34, 1033-1046,
(1994).
Jiang, Q., “Modeling Flow, Melting, Solid Conveying and Global Behavior in Intermeshing
Counter-rotating Twin Screw Extruders,” Dissertation, University of Akron, (2008).