Embed Size (px)
Citation preview
© 2011 actifsource GmbH, Switzerland - all rights reserved.
Tutorial
Diagram with Graphviz
© 2011 actifsource GmbH, Switzerland - all rights reserved.
Tutorial Actifsource Tutorial – Diagram with Graphviz Required Time 60 Minutes
Prerequisites Actifsource Tutorial – Installing Actifsource
Actifsource Tutorial – Simple Service
Goal Write a template to generate a UML Class Diagram as Graphviz DOT file
Generate a SVG graphic using GraphvizBuildTask
Topics covered Setup Graphviz
Create an UML model
Create a graph template for Graphviz
Add Visibility to Methods and Attributes
Distinguish Association types
Notation To do Information
Bold: Terms from actifsource or other technologies and tools
Bold underlined: actifsource Resources
Underlined: User Resources
UnderlinedItalics: Resource Functions
Monospaced: User input
Italics: Important terms in current situation
Disclaimer The authors do not accept any liability arising out of the application or use of any information or equipment described herein. The information contained within this document is by its very nature incomplete. Therefore the authors accept no responsibility for the precise accuracy of the documentation contained herein. It should be used rather as a guide and starting point.
Contact actifsource GmbH Täfernstrasse 37 5405 Baden-Dättwil Switzerland www.actifsource.com
Trademark actifsource is a registered trademark of actifsource GmbH in Switzerland, the EU, USA, and China. Other names appearing on the site may be trademarks of their respective owners.
© 2011 actifsource GmbH, Switzerland - all rights reserved.
Overview 3
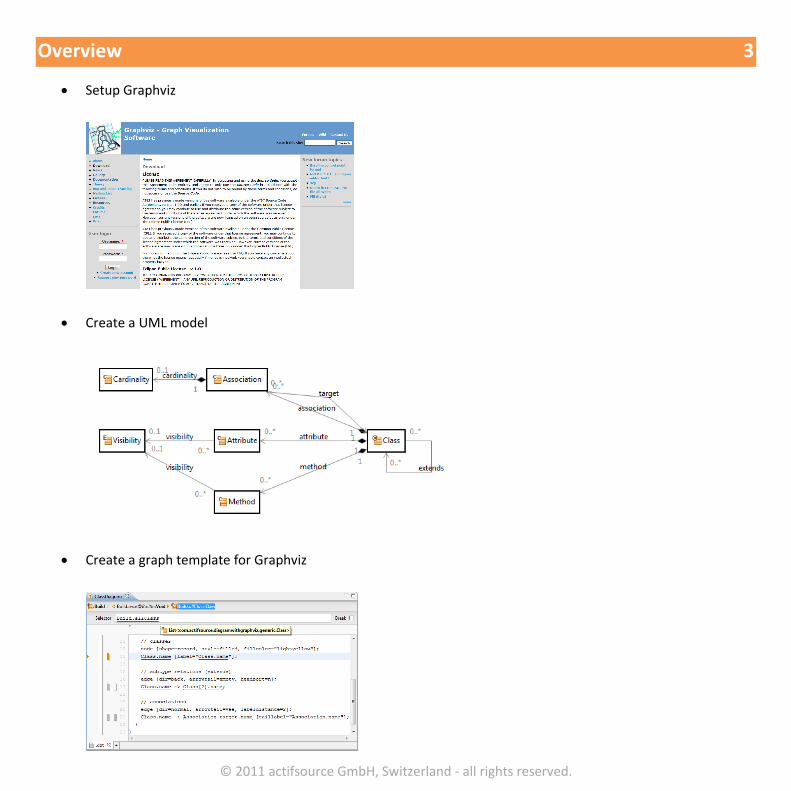
Setup Graphviz
Create a UML model
Create a graph template for Graphviz

© 2011 actifsource GmbH, Switzerland - all rights reserved.
Overview 4
Add more UML features

© 2011 actifsource GmbH, Switzerland - all rights reserved.
Part I: 5
Preparation Setup the Graphviz software.
Set Built-in Dependencies of an actifsource Project for graph generation.

© 2011 actifsource GmbH, Switzerland - all rights reserved.
Setup Graphviz 6
Before you can generate UML diagram, you need a running environment of Graphviz. If you already have the
Graphviz commands working from command line (with the PATH environment variable set), you can skip the
following setup and proceed with the actifsource Project settings.
Graphviz is an open source graph visualization software. Previously developed by AT&T it is now available under
Eclipse Public Licence.
Start your internet browser and open the address www.graphviz.org.

© 2011 actifsource GmbH, Switzerland - all rights reserved.
Setup Graphviz 7
Goto “Download” and check the licence agreement (Eclipse Public Licence).
Select the executable package provided for your operating system, download the current release and run it.
Follow the steps of the installation routine.
Add the “bin” folder of the installation path (e.g. C:\Program Files\Graphviz\bin) to your PATH
environment variable.

© 2011 actifsource GmbH, Switzerland - all rights reserved.
Create a Project 8
Prepare a new actifsource Project named DiagramWithGraphviz as seen in the Actifsource Tutorial – Simple
Service
o Setup the Target Folder graph
Use the following package structure
© 2011 actifsource GmbH, Switzerland - all rights reserved.
Create a Project 9
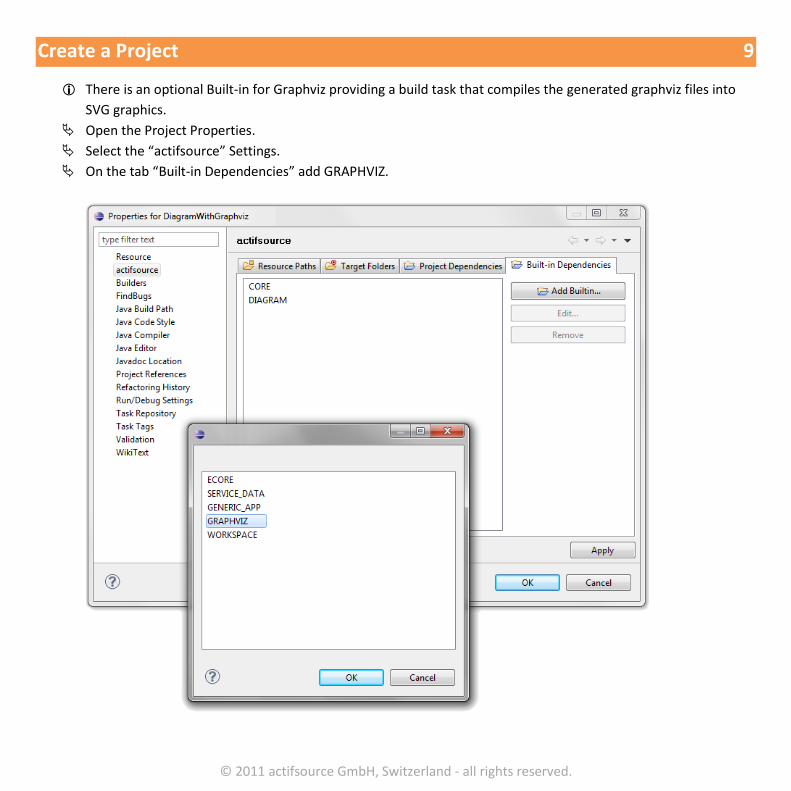
There is an optional Built-in for Graphviz providing a build task that compiles the generated graphviz files into
SVG graphics.
Open the Project Properties.
Select the “actifsource” Settings.
On the tab “Built-in Dependencies” add GRAPHVIZ.
© 2011 actifsource GmbH, Switzerland - all rights reserved.
Part II: 10
Create a UML Model We need a metamodel that provides those features we want to get displayed on our UML Class Diagram.
The generated diagram will depend only on this model. So, in order to create a Class Diagram that displays the
same classes as the generated code, we will have to write a template that generates for every class in the code
a class in the Class Diagram.

© 2011 actifsource GmbH, Switzerland - all rights reserved.
Create a UML Model 11
Create a ClassDiagram named Metamodel.
Add a new Classes for Class, Method, Attribute, Association and Cardinality.
Add a new Enum Visibility.
You don’t have to model the UML features explicitly in your real project – but you must be aware how to read
those features out of your model. To avoid code duplication, Functions as in the Actifsource Tutorial - Complex
Service might help.
© 2011 actifsource GmbH, Switzerland - all rights reserved.
Create a UML Model 12
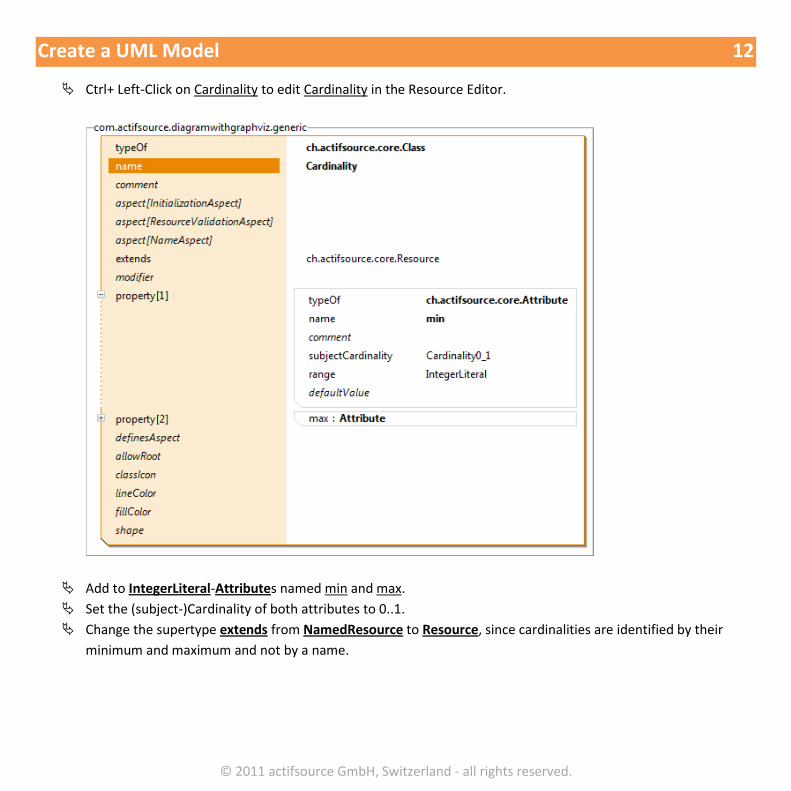
Ctrl+ Left-Click on Cardinality to edit Cardinality in the Resource Editor.
Add to IntegerLiteral-Attributes named min and max.
Set the (subject-)Cardinality of both attributes to 0..1.
Change the supertype extends from NamedResource to Resource, since cardinalities are identified by their
minimum and maximum and not by a name.
© 2011 actifsource GmbH, Switzerland - all rights reserved.
Create a UML Model 13
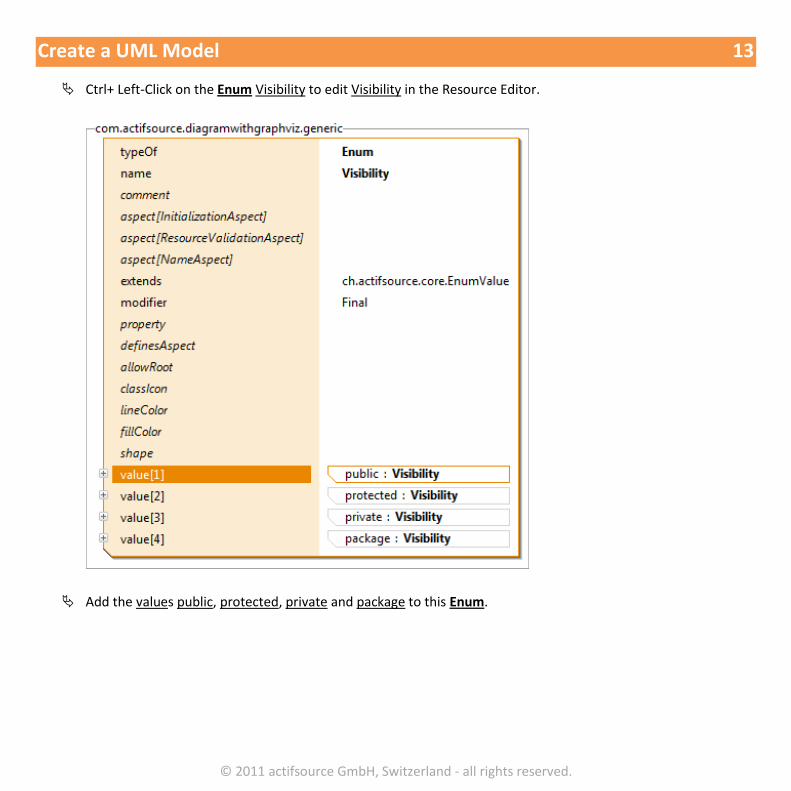
Ctrl+ Left-Click on the Enum Visibility to edit Visibility in the Resource Editor.
Add the values public, protected, private and package to this Enum.

© 2011 actifsource GmbH, Switzerland - all rights reserved.
Create a UML Model 14
Add a UseRelation extends from Class to itself.
Add a OwnRelation from Class to Association.
Add a UseRelation target back from Association to Class.
Set the (subject-)cardinality of target to exactly 1.
Add OwnRelations from Class to Method and Class to Attribute.
Add a Relation from Association to Cardinality, let it be an OwnRelation for simplicity sake.
Add a UseRelation from Attribute to Visibility and from Method to Visibility.
Set the (subject-)cardinality of the 3 Relations to 0..1.
© 2011 actifsource GmbH, Switzerland - all rights reserved.
Create a UML Model 15
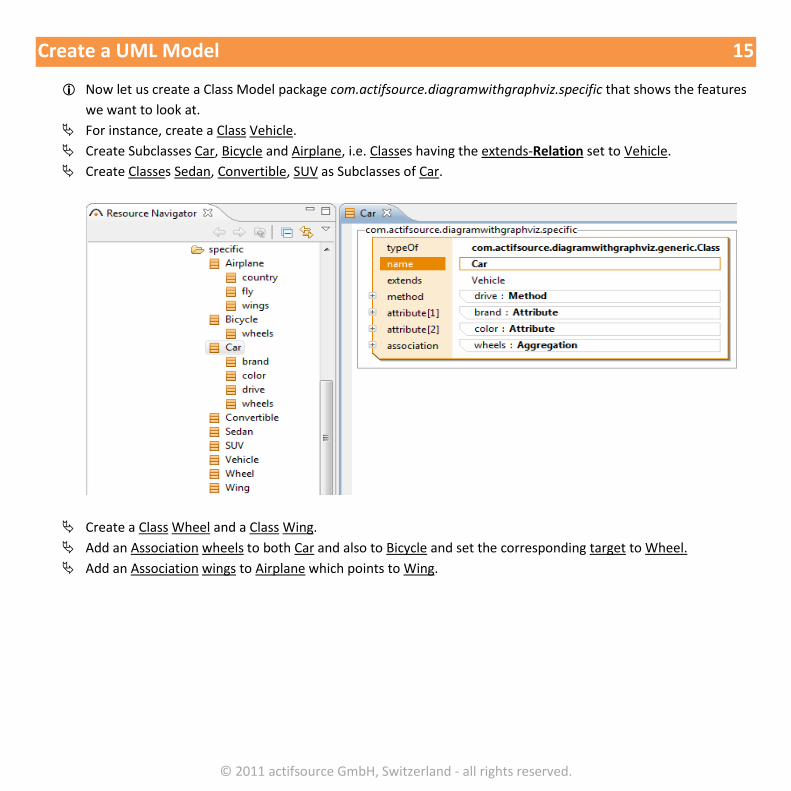
Now let us create a Class Model package com.actifsource.diagramwithgraphviz.specific that shows the features
we want to look at.
For instance, create a Class Vehicle.
Create Subclasses Car, Bicycle and Airplane, i.e. Classes having the extends-Relation set to Vehicle.
Create Classes Sedan, Convertible, SUV as Subclasses of Car.
Create a Class Wheel and a Class Wing.
Add an Association wheels to both Car and also to Bicycle and set the corresponding target to Wheel.
Add an Association wings to Airplane which points to Wing.
© 2011 actifsource GmbH, Switzerland - all rights reserved.
Part IV: 16
Create a graph template for Graphviz We will generate graph definitions in the Graphviz DOT language and then in layout the graph to define our
UML Class Diagram using the Graphviz DOT command. You can find the documentation of the DOT language on
the Graphviz homepage.
Graphviz provides several output formats: raster graphics like PNG, or vector graphics like PostScript or SVG.
We will prefer SVG as output format since it can easily be post-processed, and the graphics can be embedded in
HTML Pages and contain tooltips and hyperlinks.
© 2011 actifsource GmbH, Switzerland - all rights reserved.
Create a build configuration 17
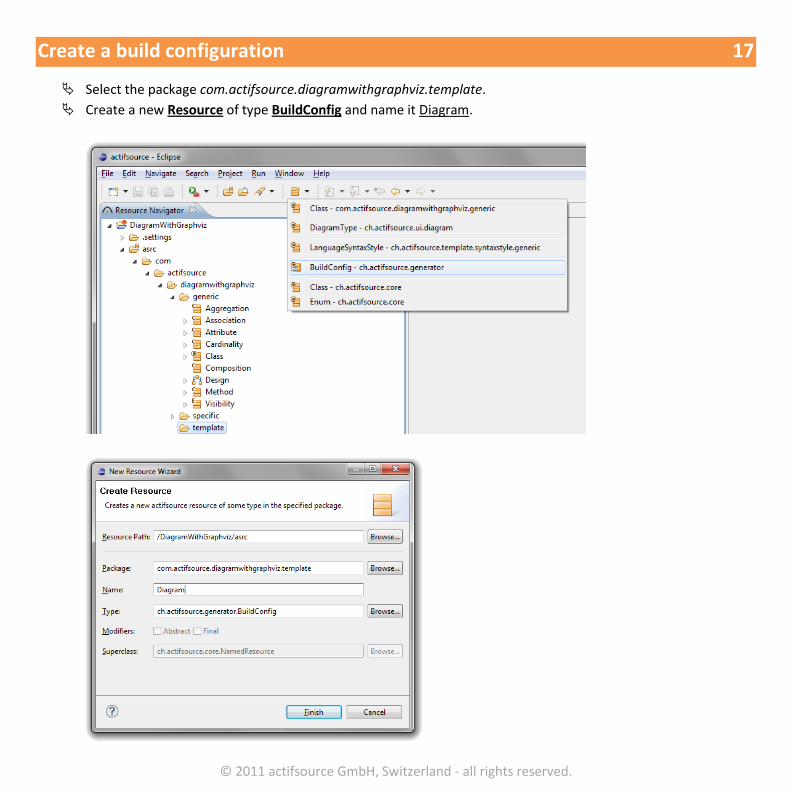
Select the package com.actifsource.diagramwithgraphviz.template.
Create a new Resource of type BuildConfig and name it Diagram.
© 2011 actifsource GmbH, Switzerland - all rights reserved.
Create a build configuration 18
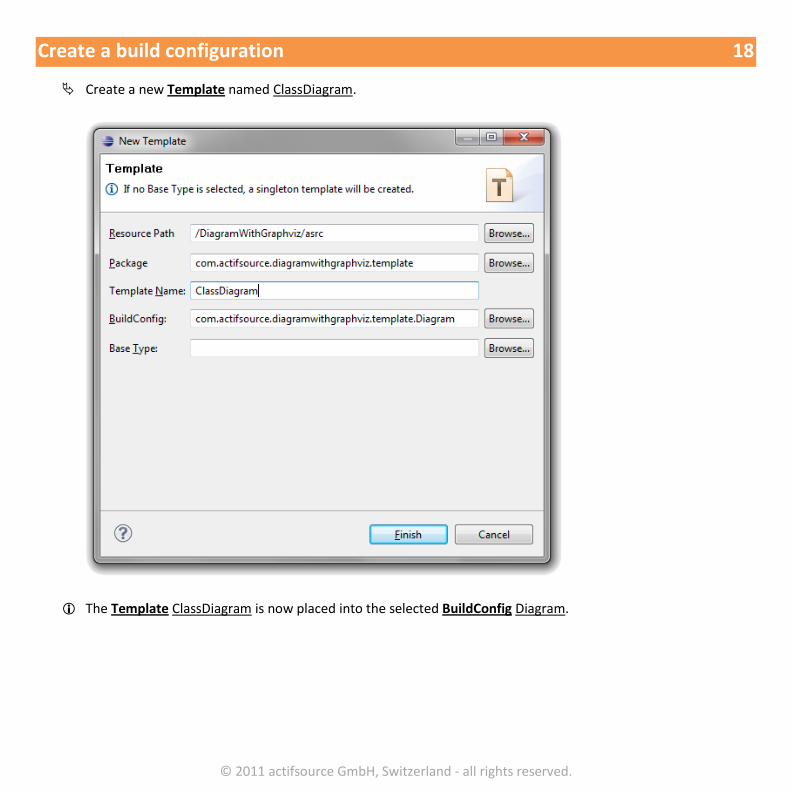
Create a new Template named ClassDiagram.
The Template ClassDiagram is now placed into the selected BuildConfig Diagram.
© 2011 actifsource GmbH, Switzerland - all rights reserved.
Create a build configuration 19
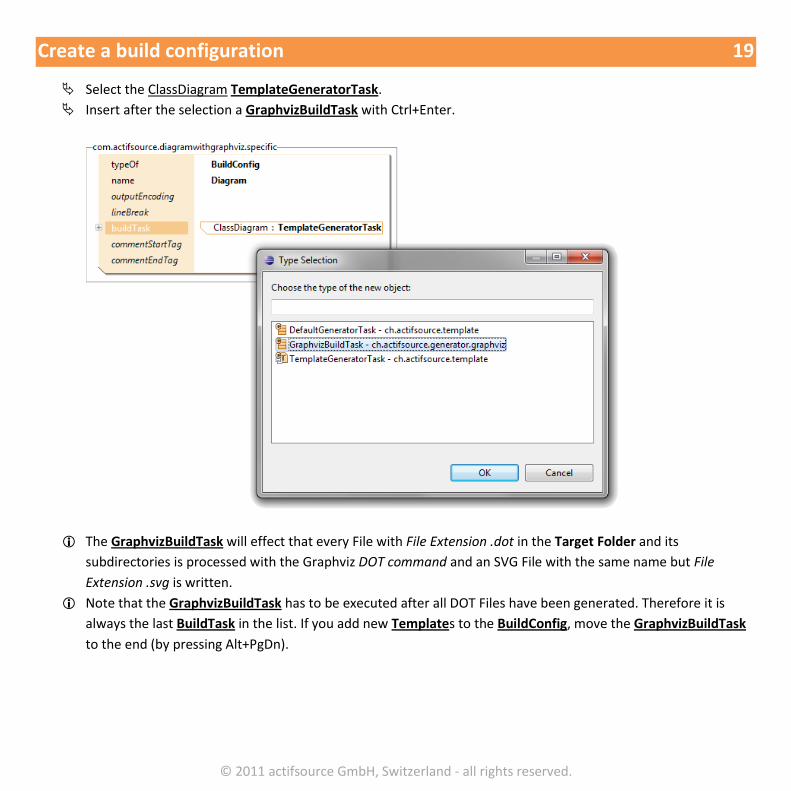
Select the ClassDiagram TemplateGeneratorTask.
Insert after the selection a GraphvizBuildTask with Ctrl+Enter.
The GraphvizBuildTask will effect that every File with File Extension .dot in the Target Folder and its
subdirectories is processed with the Graphviz DOT command and an SVG File with the same name but File
Extension .svg is written.
Note that the GraphvizBuildTask has to be executed after all DOT Files have been generated. Therefore it is
always the last BuildTask in the list. If you add new Templates to the BuildConfig, move the GraphvizBuildTask
to the end (by pressing Alt+PgDn).
© 2011 actifsource GmbH, Switzerland - all rights reserved.
Create a graph template 20
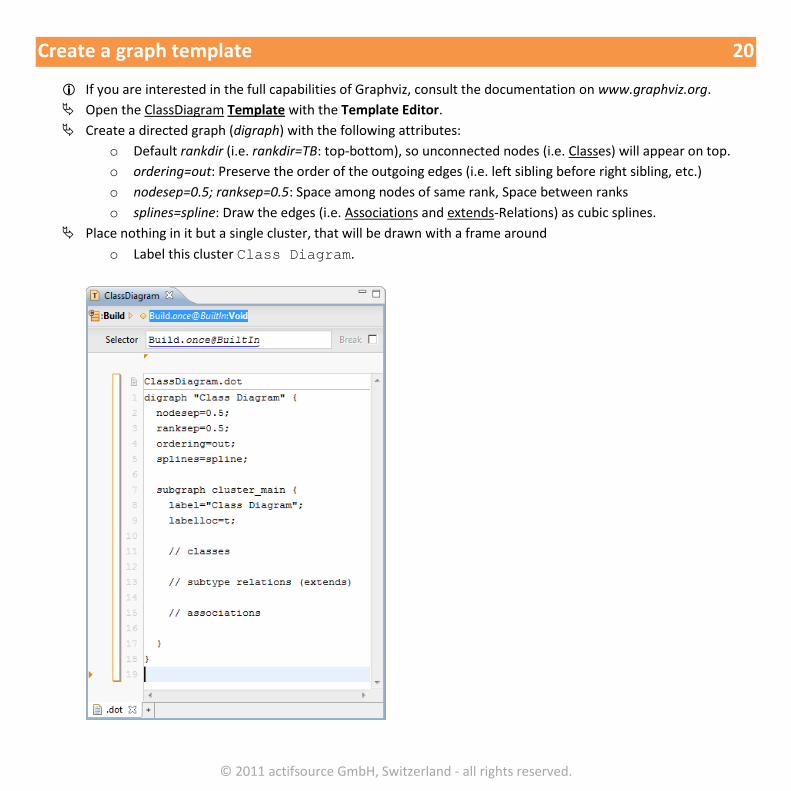
If you are interested in the full capabilities of Graphviz, consult the documentation on www.graphviz.org.
Open the ClassDiagram Template with the Template Editor.
Create a directed graph (digraph) with the following attributes:
o Default rankdir (i.e. rankdir=TB: top-bottom), so unconnected nodes (i.e. Classes) will appear on top.
o ordering=out: Preserve the order of the outgoing edges (i.e. left sibling before right sibling, etc.)
o nodesep=0.5; ranksep=0.5: Space among nodes of same rank, Space between ranks
o splines=spline: Draw the edges (i.e. Associations and extends-Relations) as cubic splines.
Place nothing in it but a single cluster, that will be drawn with a frame around
o Label this cluster Class Diagram.
© 2011 actifsource GmbH, Switzerland - all rights reserved.
Create a graph template 21
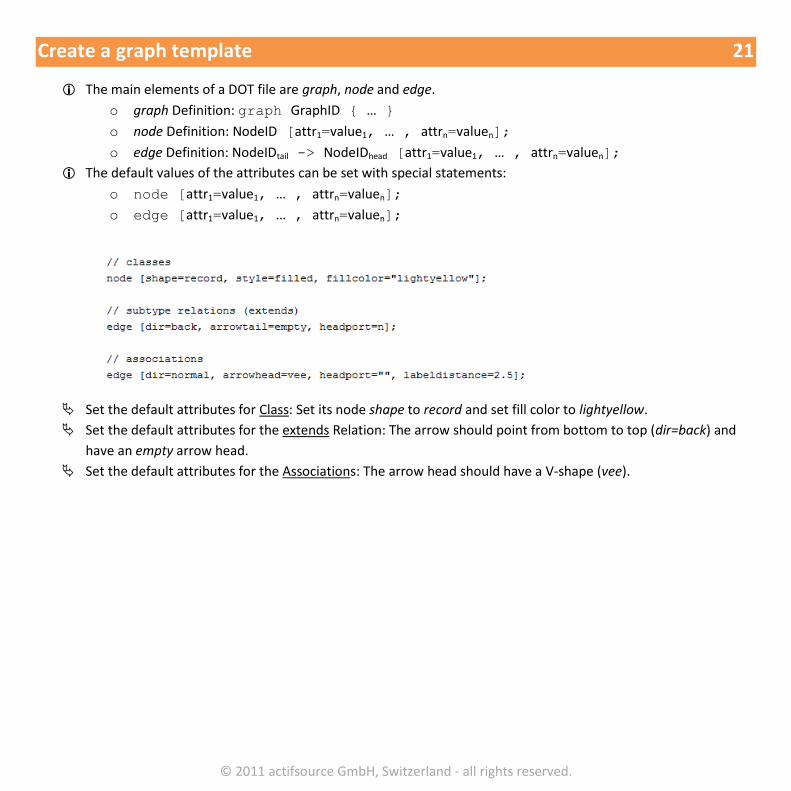
The main elements of a DOT file are graph, node and edge.
o graph Definition: graph GraphID { … }
o node Definition: NodeID [attr1=value1, … , attrn=valuen];
o edge Definition: NodeIDtail -> NodeIDhead [attr1=value1, … , attrn=valuen];
The default values of the attributes can be set with special statements:
o node [attr1=value1, … , attrn=valuen];
o edge [attr1=value1, … , attrn=valuen];
Set the default attributes for Class: Set its node shape to record and set fill color to lightyellow.
Set the default attributes for the extends Relation: The arrow should point from bottom to top (dir=back) and
have an empty arrow head.
Set the default attributes for the Associations: The arrow head should have a V-shape (vee).
© 2011 actifsource GmbH, Switzerland - all rights reserved.
Declare Classes, Subtype relations and Associations 22
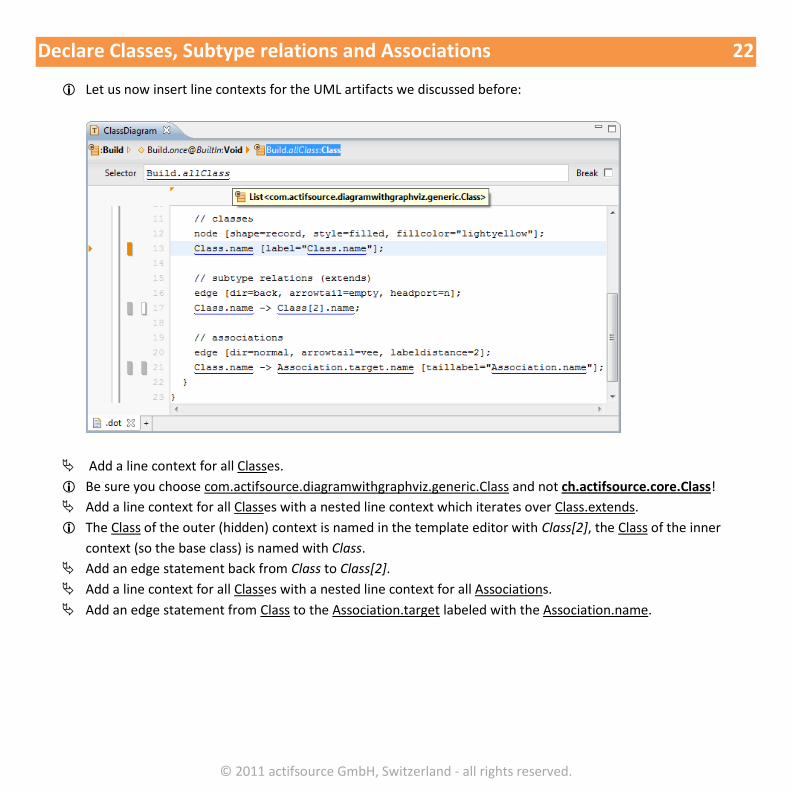
Let us now insert line contexts for the UML artifacts we discussed before:
Add a line context for all Classes.
Be sure you choose com.actifsource.diagramwithgraphviz.generic.Class and not ch.actifsource.core.Class!
Add a line context for all Classes with a nested line context which iterates over Class.extends.
The Class of the outer (hidden) context is named in the template editor with Class[2], the Class of the inner
context (so the base class) is named with Class.
Add an edge statement back from Class to Class[2].
Add a line context for all Classes with a nested line context for all Associations.
Add an edge statement from Class to the Association.target labeled with the Association.name.

© 2011 actifsource GmbH, Switzerland - all rights reserved.
Declare Classes, Subtype relations and Associations 23
The resulting graph will look like this:
© 2011 actifsource GmbH, Switzerland - all rights reserved.
Add Methods and Attributes 24
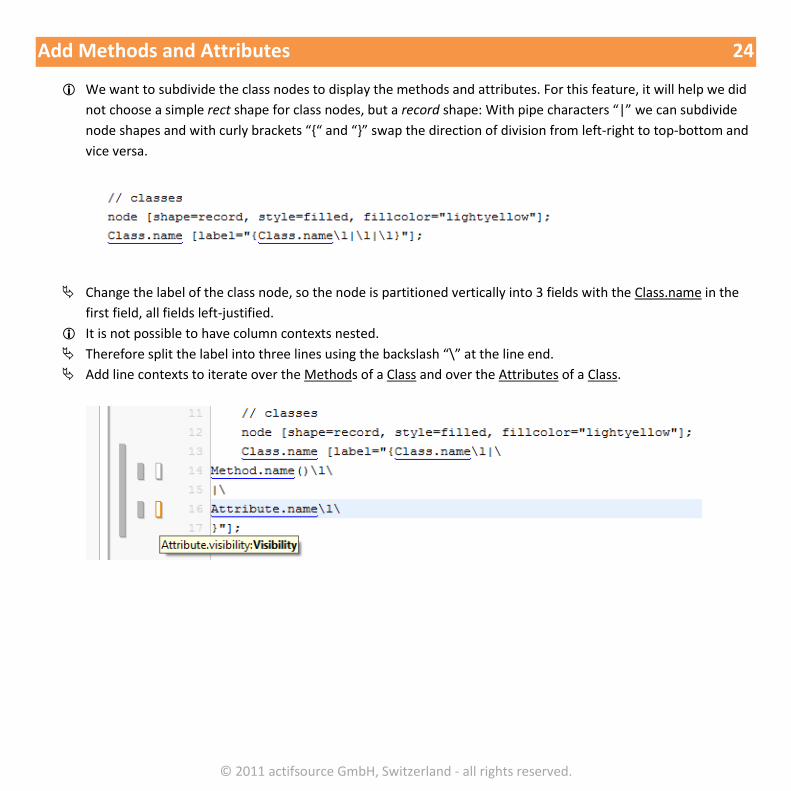
We want to subdivide the class nodes to display the methods and attributes. For this feature, it will help we did
not choose a simple rect shape for class nodes, but a record shape: With pipe characters “|” we can subdivide
node shapes and with curly brackets “{“ and “}” swap the direction of division from left-right to top-bottom and
vice versa.
Change the label of the class node, so the node is partitioned vertically into 3 fields with the Class.name in the
first field, all fields left-justified.
It is not possible to have column contexts nested.
Therefore split the label into three lines using the backslash “\” at the line end.
Add line contexts to iterate over the Methods of a Class and over the Attributes of a Class.
© 2011 actifsource GmbH, Switzerland - all rights reserved.
Add Methods and Attributes 25
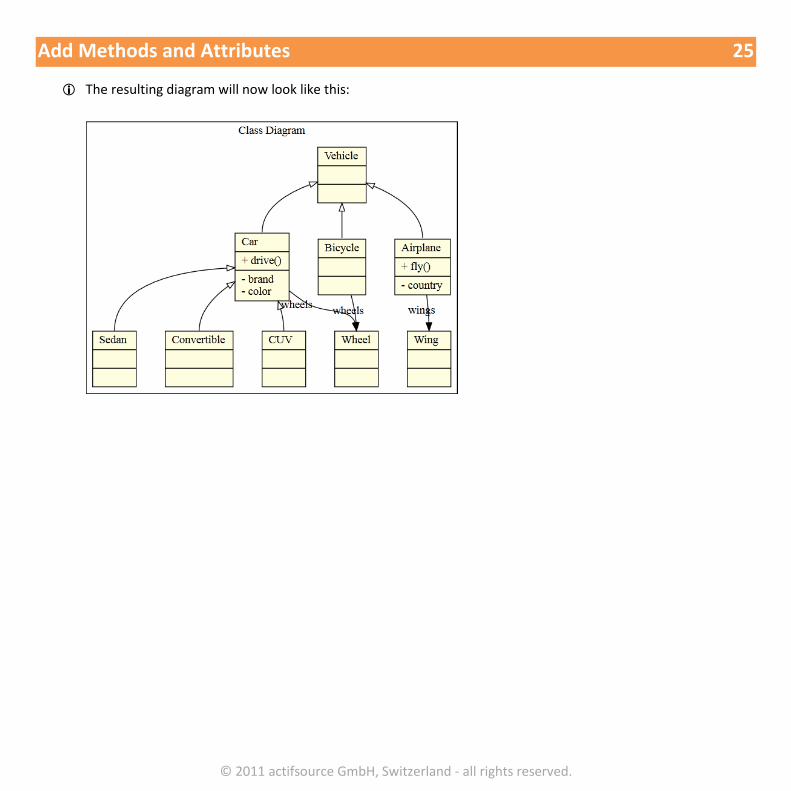
The resulting diagram will now look like this:
© 2011 actifsource GmbH, Switzerland - all rights reserved.
Add Visibility to Methods and Attributes 26
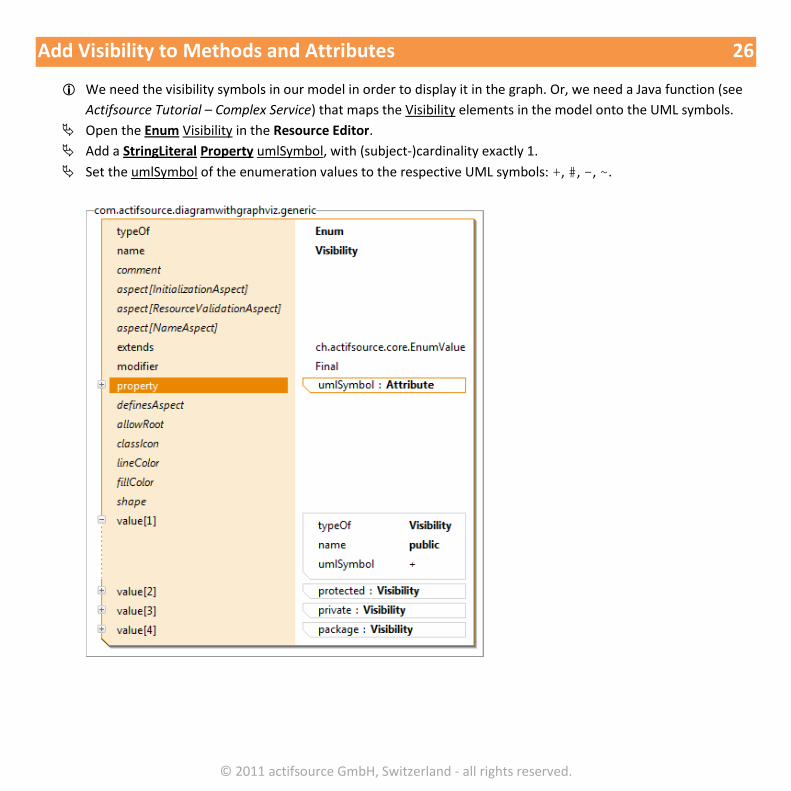
We need the visibility symbols in our model in order to display it in the graph. Or, we need a Java function (see
Actifsource Tutorial – Complex Service) that maps the Visibility elements in the model onto the UML symbols.
Open the Enum Visibility in the Resource Editor.
Add a StringLiteral Property umlSymbol, with (subject-)cardinality exactly 1.
Set the umlSymbol of the enumeration values to the respective UML symbols: +, #, -, ~.
© 2011 actifsource GmbH, Switzerland - all rights reserved.
Add Visibility to Methods and Attributes 27
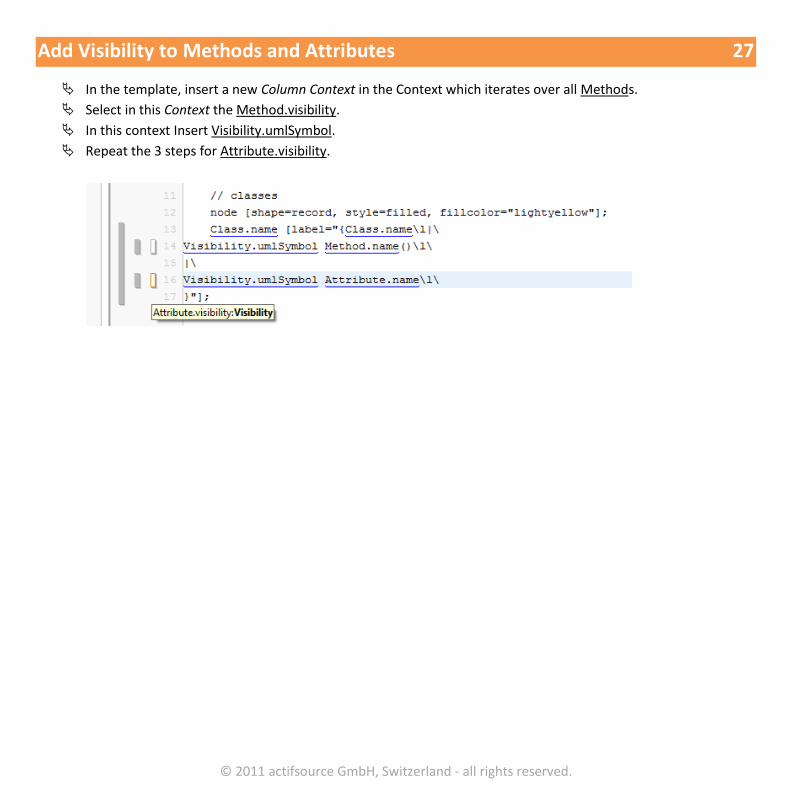
In the template, insert a new Column Context in the Context which iterates over all Methods.
Select in this Context the Method.visibility.
In this context Insert Visibility.umlSymbol.
Repeat the 3 steps for Attribute.visibility.
© 2011 actifsource GmbH, Switzerland - all rights reserved.
Add Visibility to Methods and Attributes 28
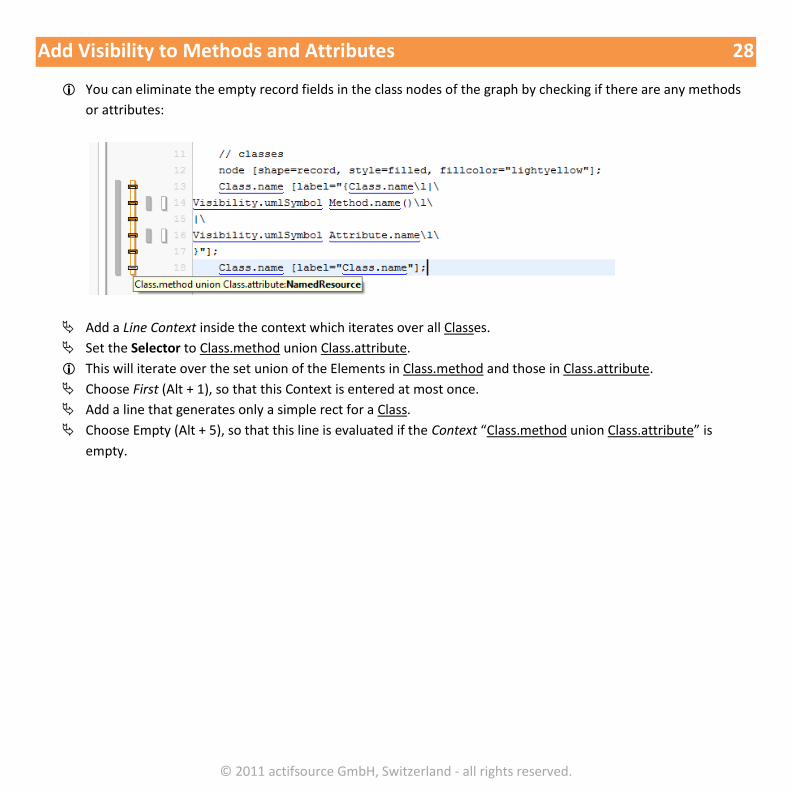
You can eliminate the empty record fields in the class nodes of the graph by checking if there are any methods
or attributes:
Add a Line Context inside the context which iterates over all Classes.
Set the Selector to Class.method union Class.attribute.
This will iterate over the set union of the Elements in Class.method and those in Class.attribute.
Choose First (Alt + 1), so that this Context is entered at most once.
Add a line that generates only a simple rect for a Class.
Choose Empty (Alt + 5), so that this line is evaluated if the Context “Class.method union Class.attribute” is
empty.
© 2011 actifsource GmbH, Switzerland - all rights reserved.
Add Cardinality 29
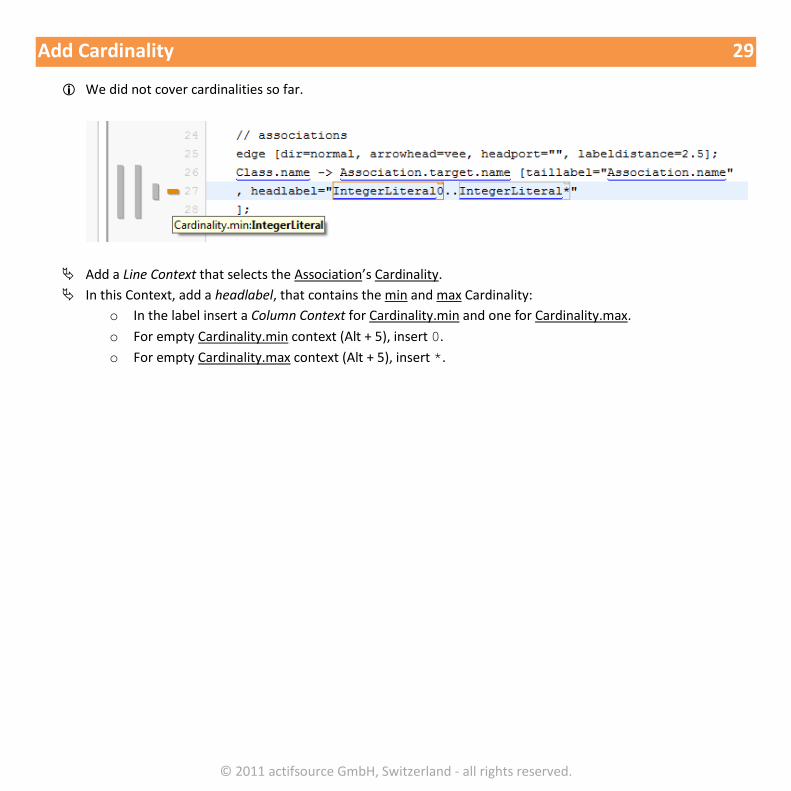
We did not cover cardinalities so far.
Add a Line Context that selects the Association’s Cardinality.
In this Context, add a headlabel, that contains the min and max Cardinality:
o In the label insert a Column Context for Cardinality.min and one for Cardinality.max.
o For empty Cardinality.min context (Alt + 5), insert 0.
o For empty Cardinality.max context (Alt + 5), insert *.

© 2011 actifsource GmbH, Switzerland - all rights reserved.
Distinguish Association types 30
In UML, associations are marked with a diamond, if they are aggregations or compositions.
Add the Classes Aggregation and Composition which are subclasses of Association.
Edit the typeOf Property of the Relations wheels and wings and replace Association by Aggregation and
Composition respectively.
Add a Line Context
In the Selector, cast Association to Aggregation and Composition respectively. The Line Contexts will be entered
then only if it os an Aggregation or Composition.
Set the arrowhead attribute to diamond and to ediamond (=empty diamond).

© 2011 actifsource GmbH, Switzerland - all rights reserved.
UML Class Diagram 31
The resulting graph will look now similar to this one:

© 2011 actifsource GmbH, Switzerland - all rights reserved.