Embed Size (px)
Citation preview
Dial - a- Ride booking preferences
09003
October 2009

Confidentiality
Please note that the copyright in the attached report is owned by TfL and the provision of information under Freedom of Information Act does not give the recipient a right to re-use the information in a way that would infringe copyright (for example, by publishing and issuing copies to the public).
Brief extracts of the material may be reproduced under the fair dealing provisions of the Copyright, Designs and Patents Act 1988 for the purposes of research for non-commercial purposes, private study, criticism, review and news reporting.
Details of the arrangements for reusing the material owned by TfL for any other purpose can be obtained by contacting us at [email protected].
Research conducted by Steer Davies Gleave.

Contents 0 EXECUTIVE SUMMARY 1
Overview 1
Responses 1
Other Points of Interest 3
Conclusions 3
1 INTRODUCTION 5
Overview of Dial-a-Ride 5
Objectives of this Study 6
Remainder of this Report 6
2 WORKSHOP 7
Workshop Process 8
Summary of the Current Booking System 9
Short History of the Dial-a-Ride Booking System 9
Issues and Considerations with the Current System 10
Potential Attributes for Inclusion in Research Study 11
3 QUESTIONNAIRE DESIGN 13
Introduction 13
Questionnaire Structure 13
User Questionnaire 14
Non-User Questionnaire 14
Common Section of Questionnaires 14
4 FIELDWORK AND SAMPLE PROFILE 17
Overview 17
Pilot Study 17
Socio-Demographic Information 17
Current Usage and Perception of Service 23
5 DIAL-A-RIDE SERVICE LEVEL ATTRIBUTES 32
Analysis Measure 32
Individual Attribute Question Responses 32
Multiple Attribute Question Responses 36
Interdependency of Attributes 40
Socio-Demographic Influences 42
Other Influential Factors 46
6 CONCLUSIONS 49

Outputs from this Study 49
Next Steps 50
FIGURES Figure 0.1 Responses to Single Attribute Changes to the Booking System 1
Figure 0.2 Respondents’ Answers to Combined Attribute Changes to the Booking System 2
Figure 0.3 Users: At what time of day do you usually call DaR to arrange your trip? 3
Figure 1.1 London Dial-a-Ride Vehicle 5
Figure 2.1 Request for Pre-Submission of Options 7
Figure 3.1 Overview Of Questionnaires 13
Figure 4.1 Sample Profile and DaR Population Age Groups. 20
Figure 4.2 Distribution of Questionnaire Respondents by BorouGH 22
Figure 4.3 Users: Have you made Any DaR bookings in the last 6 months? 23
Figure 4.4 Users: When did you last use Dial-a-Ride 23
Figure 4.5 Users: At what time of day do you usually call DaR to arrange your trip? 24
Figure 4.6 Users: How easy (user-friendly) do you find the current booking system to understand and use? 24
Figure 4.7 Users: How often do you book Advanced trips? 25
Figure 4.8 Users: How often do you book normal day-before trips? 25
Figure 4.9 Users: How often do you book ad-hoc (same day as travel) trips? 26
Figure 4.10 Users making advanced trips: How often are your advanced bookings refused so that you are unable to travel? 26
Figure 4.11 Users making day-before trips: How often are your day-before trips refused so that you are unable to travel? 27
Figure 4.12 Users making ad-hoc trips: How often are your ad-hoc (same day as travel) trips refused to that you are unable to travel? 27
Figure 4.13 Users: Do you ever get put on the wait list for your trips? 28
Figure 4.14 Users who are ‘Wait Listed’: If you are put on the wait list, what normally happens? 28
Figure 4.15 Users: If your booking is refused so that you are unable to travel at all, what do you normally do instead? 29
Figure 4.16 Non-Users: Do you ever use any other door-to-door services offered by Transport for London? 30
Figure 4.17 Non-Users: What other modes of transport do you typically use for travel within London? 30
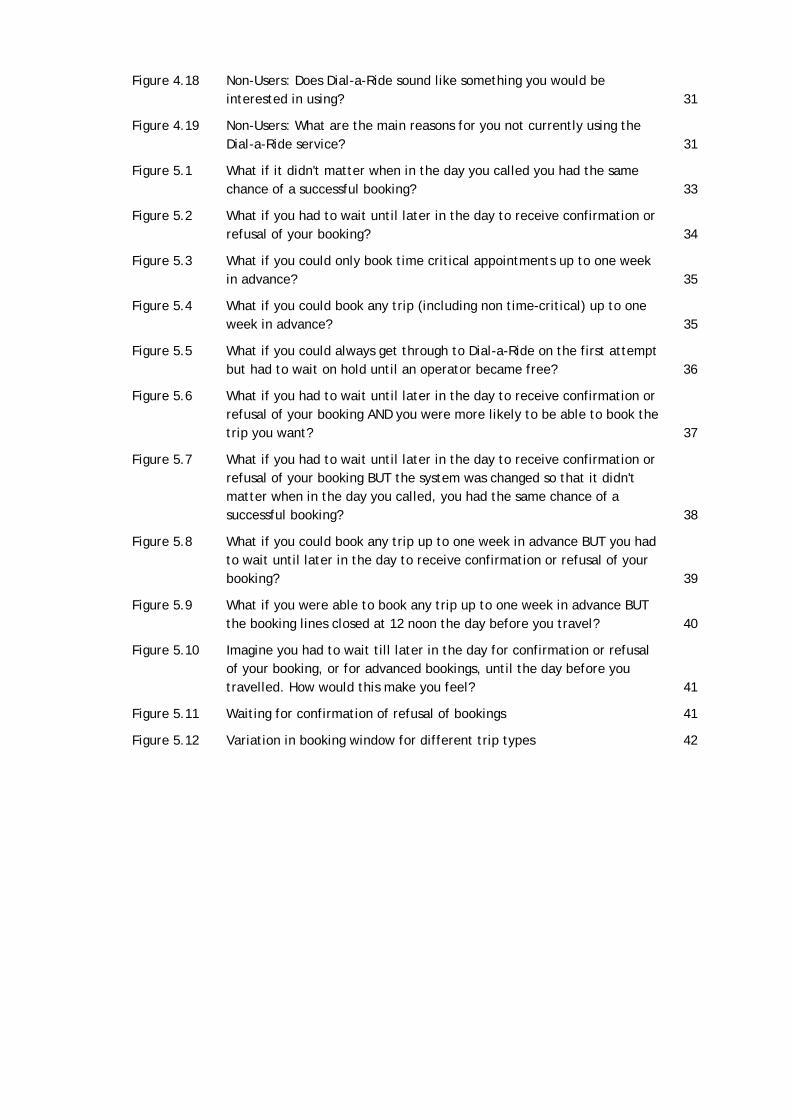
Figure 4.18 Non-Users: Does Dial-a-Ride sound like something you would be interested in using? 31
Figure 4.19 Non-Users: What are the main reasons for you not currently using the Dial-a-Ride service? 31
Figure 5.1 What if it didn't matter when in the day you called you had the same chance of a successful booking? 33
Figure 5.2 What if you had to wait until later in the day to receive confirmation or refusal of your booking? 34
Figure 5.3 What if you could only book time critical appointments up to one week in advance? 35
Figure 5.4 What if you could book any trip (including non time-critical) up to one week in advance? 35
Figure 5.5 What if you could always get through to Dial-a-Ride on the first attempt but had to wait on hold until an operator became free? 36
Figure 5.6 What if you had to wait until later in the day to receive confirmation or refusal of your booking AND you were more likely to be able to book the trip you want? 37
Figure 5.7 What if you had to wait until later in the day to receive confirmation or refusal of your booking BUT the system was changed so that it didn't matter when in the day you called, you had the same chance of a successful booking? 38
Figure 5.8 What if you could book any trip up to one week in advance BUT you had to wait until later in the day to receive confirmation or refusal of your booking? 39
Figure 5.9 What if you were able to book any trip up to one week in advance BUT the booking lines closed at 12 noon the day before you travel? 40
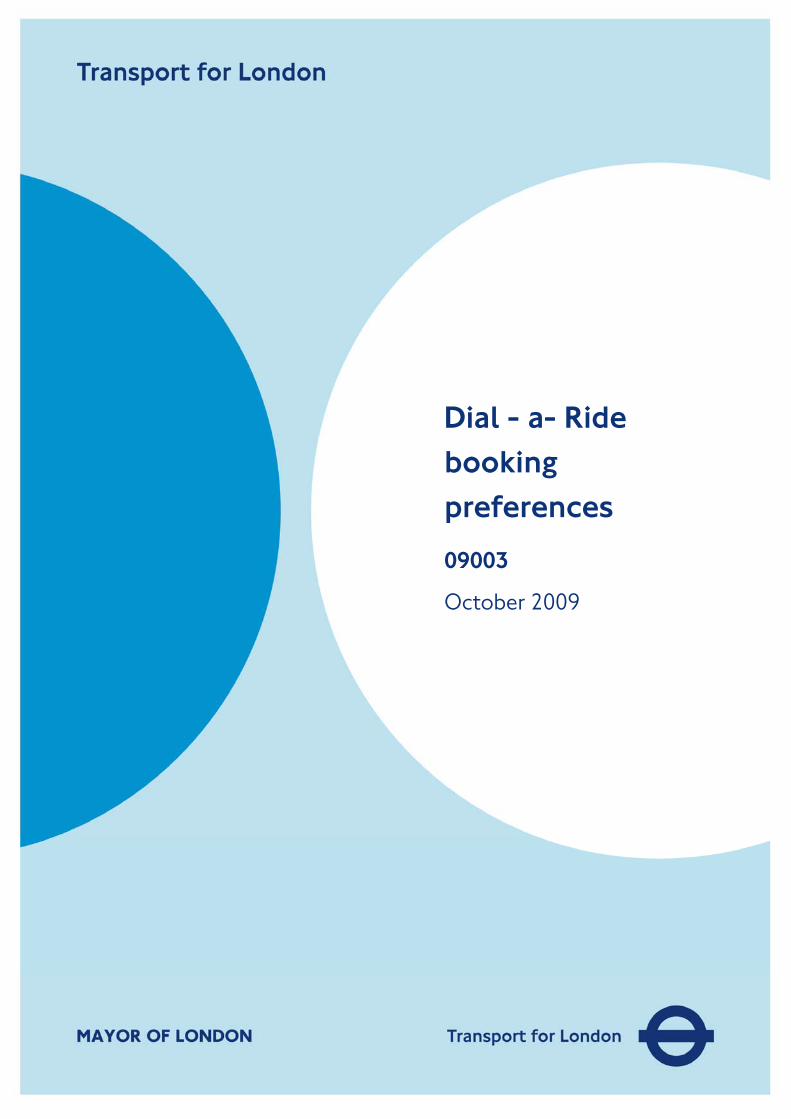
Figure 5.10 Imagine you had to wait till later in the day for confirmation or refusal of your booking, or for advanced bookings, until the day before you travelled. How would this make you feel? 41
Figure 5.11 Waiting for confirmation of refusal of bookings 41
Figure 5.12 Variation in booking window for different trip types 42
TABLES Table 2-1 Summary of Pre-Submitted Options 8
Table 2-2 Final List of Attributes for Quantiative Research 11
Table 4-1 Socio-Demographic Splits By User Type 18
Table 4-2 Socio-Demographic Splits for Dial-a-Ride User population 19
Table 4-3 Disability Classifications 20
Table 5-1 Respondents' preferences to individual attribute questions 33
Table 5-2 Respondents' preferences to multiple attribute questions 37
Table 5-3 Users (Current + Lapsed): Socio-demographic Results 44
Table 5-4 Users: Responses to Attribute Rating Questions 46
Table 5-5 Users: Other influential factors regression 48
APPENDICES TRANSCRIPT OF USER QUESTIONNAIRE
TRANSCRIPT OF NON-USER QUESTIONNAIRE
USER QUESTIONNAIRE 'TOP LINES'
NON-USER QUESTIONNAIRE 'TOP LINES'
LOCAL AREA PANEL MEETINGS
OTHER RELEVANT RESEARCH - DOOR-TO-DOOR STUDY

0 Executive Summary
Overview
0.1 In June 2009, Steer Davies Gleave was commissioned by Transport for London (TfL) to undertake research aimed at understanding how users and potential users of the London Dial-a-Ride scheme would react to the implementation of different booking mechanisms. Given such information, TfL hope to gain a greater understanding of which current booking procedures are important and which could be simplified, changed or even removed, and thus provide a basis for further discussion around potential changes to the system.
0.2 The research was undertaken via Telephone Interview and covered 351 users and 100 non-users. Respondents were asked to rate their preference or otherwise across a series of five questions detailing single attribute changes to the booking system, and four questions detailing combined attribute changes to the booking system.
Responses
0.3 Respondents’ answers are rated on a scale of -2 to 2, with 2 being a very strong preference for a change over the current system, and -2 being a very strong aversion for a change over the current system. A score of zero indicated indifference to the proposed change.
Single Attribute Changes
FIGURE 0.1 RESPONSES TO SINGLE ATTRIBUTE CHANGES TO THE BOOKING SYSTEM
What if you could always get through to DaR on the first attempt, but had to wait on hold until an operator became free?
What if you could book any trip (including non time critical) up to one week in advance?
What if you could only book time critical appointments up to one week in advance?
What if you had to wait until later in the day to receive confirmation or refusal of your booking?
What if it didn't matter when in the day you called, you had the same chance of a successful booking?
-0.60 -0.40 -0.20 0.00 0.20 0.40 0.60 0.80 1.00 1.20 1.40
Preference Rating
User Non-User
I Changing the booking system such that it didn’t matter when in the day you called, you had the same chance of a successful booking (as opposed to the current system whereby those who call early in the morning have a greater chance of a successful booking) is seen as the most positive change by Dial-a-Ride users.
I Non-users would find being able to book any trip (including non time-critical trips) up to one week in advance (as opposed to the current system whereby non time-critical trips can only be made the day before travel) the most beneficial potential change to the booking system.
I Being able to get through to Dial-a-Ride on the first attempt is also seen as a benefit to both groups, but to a lesser extent.
I All respondents would find having to wait until later in the day to receive confirmation or refusal of their booking a disbenefit compared to the current system whereby bookings are arranged during the initial call.
I Somewhat counter-intuitively, all respondents were favourable towards a change of the time-critical trip booking window from two weeks to just one week. Further research into this however has suggested there may be an element of misunderstanding of both the current system and the potential change skewing this response.
Combined Attribute Changes
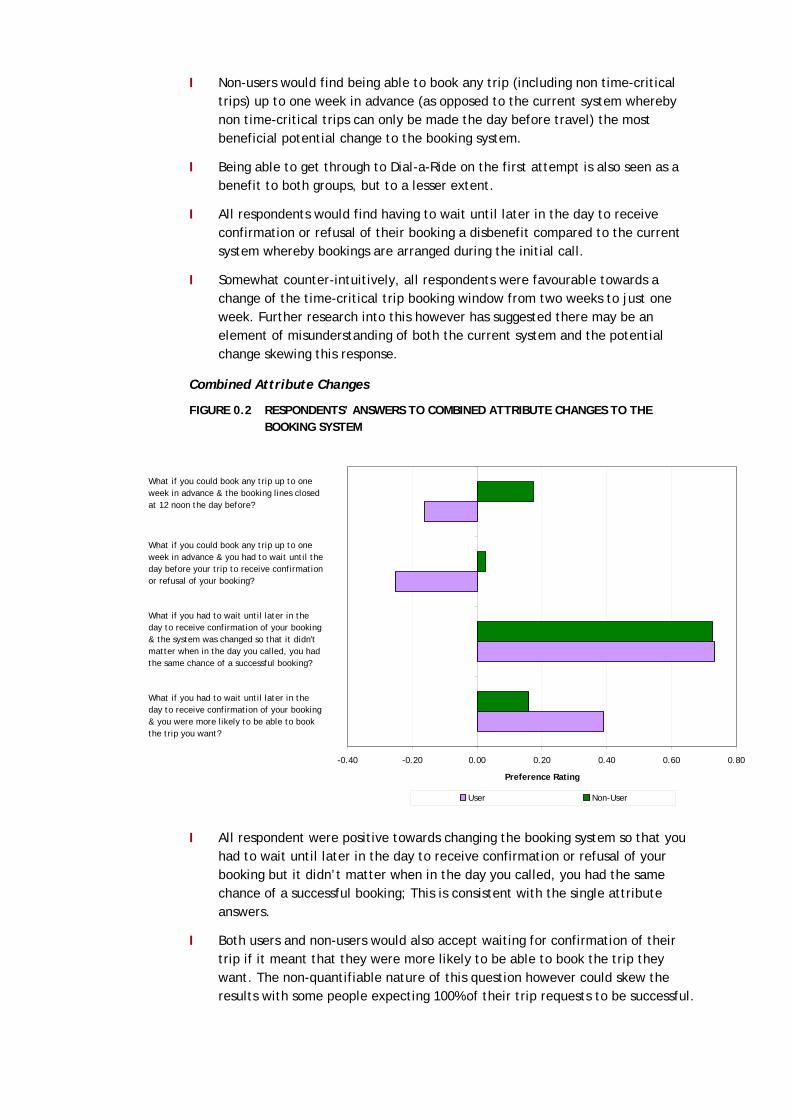
FIGURE 0.2 RESPONDENTS’ ANSWERS TO COMBINED ATTRIBUTE CHANGES TO THE BOOKING SYSTEM
What if you could book any trip up to one week in advance & the booking lines closed at 12 noon the day before?
What if you could book any trip up to one week in advance & you had to wait until the day before your trip to receive confirmation or refusal of your booking?
What if you had to wait until later in the day to receive confirmation of your booking & the system was changed so that it didn't matter when in the day you called, you had the same chance of a successful booking?
What if you had to wait until later in the day to receive confirmation of your booking & you were more likely to be able to book the trip you want?
-0.40 -0.20 0.00 0.20 0.40 0.60 0.80
Preference Rating
User Non-User
I All respondent were positive towards changing the booking system so that you had to wait until later in the day to receive confirmation or refusal of your booking but it didn’t matter when in the day you called, you had the same chance of a successful booking; This is consistent with the single attribute answers.
I Both users and non-users would also accept waiting for confirmation of their trip if it meant that they were more likely to be able to book the trip they want. The non-quantifiable nature of this question however could skew the results with some people expecting 100% of their trip requests to be successful.

I There is a difference of opinion between users and non-users concerning the benefit or otherwise of being able to book trips one week in advance but having to accept either lines closing at 12 noon or having to wait for confirmation of their booking. As such it would seem that the preference for booking any trip in advance is not as strong as the single attribute responses suggest.
I It should be noted however that the length of wait specified here is until the ‘day before travel’ as opposed to ‘later in the day’; hence users may feel that the benefit granted by being able to plan trips ahead is lost by the length of wait.
Other Points of Interest
0.4 The majority of current Dial-a-Ride users interviewed were satisfied with the system: their advance and day before travel bookings were usually accepted (see Figures 4.10 and 4.11) and experience of the wait list was limited to a small number (see Figure 4.13).
0.5 Furthermore the vast majority of respondents stated that they usually call DaR in the morning, this is shown in the figure below. Anecdotal evidence suggested that there is a peak in calls late afternoon – this is not borne out by the responses to this question.
FIGURE 0.3 USERS: AT WHAT TIME OF DAY DO YOU USUALLY CALL DAR TO ARRANGE YOUR TRIP?
0%
10%
20%
30%
40%
50%
60%
70%
80%
90%
100%
At 9am when the
telephone lines
open
In the morning
between 9am and
11am
Late
morning/lunchtime
- between 11am
and 1pm
Mid afternoon -
between 1pm and
3pm
Late afternoon -
between 3pm and
4pm
I don't call at a
regular time
User - User (140) User - Carer (23) Lapsed - User (61) Lapsed - Carer (34)
The majority of calls are made in
the morning, though a large
number of respondents say they do
not call at a regular time.
Conclusions
0.6 The implicit interdependency of many of these options ensures that in reality they could not be considered in isolation. For example, being able to improve the likelihood of trips being accepted may require users having to wait later in the day for confirmation as well as lines closing earlier to allow time to efficiently timetable bus routes. However, this may yield the benefit of callers at all times having an equal likelihood of a successful trip, albeit with a shorter booking window.
0.7 Such an all-encompassing option was deemed too complex for users to fully comprehend in a short telephone interview and as such did not form part of this research. These results demonstrate clear preferences for attributes an ideal booking system would share, but do not fully allow us to determine the true tendency of preference towards a combined option.
Potential Next Steps
I Further face-to-face research, perhaps in small discussion groups, would allow the full array of issues concerning such options to be discussed and help gain a more complete understanding of the relative importance of each attribute.
I Such discussions however could only realistically take place for a minority of the Dial-a-Ride user base, and as such a level of marketing would be required for the wider user group to comprehensively explain and communicate the benefits of any new system.
I Further discussion of the reasons behind preferences could help inform any future marketing initiatives.

1 Introduction 1.1 In June 2009, Steer Davies Gleave was commissioned by Transport for London (TfL)
to undertake research aimed at understanding how different groups of users and non-users of the London Dial-a-Ride scheme would react to the implementation of different booking mechanisms. The scope of work was targeted at those making bookings for travel the next day, those making ad-hoc bookings on the day of travel itself and also those making advanced bookings for time critical trips. Those users who only travel with regular a booking were excluded from the research.
1.2 Given such information, TfL hope to gain a greater understanding of which current booking procedures are important and which could be simplified, changed or even removed, and thus provide a basis for further discussion around potential changes to the system.
Overview of Dial-a-Ride
1.3 Dial-a-Ride (DaR) provides free multi-occupancy door-to-door transport for residents of London boroughs with a permanent or long term disability or health problem who are restricted in their use of conventional public transport; In 2008/09 Dial-a-Ride provided 1.2 million journeys.
FIGURE 1.1 LONDON DIAL-A-RIDE VEHICLE
1.4 The current booking system allows for bookings to be made in a variety of ways including up to two weeks in advance (for time critical appointments only), the day before travelling and on the day of travel (although this greatly increases the chance that the booking will not be able to be made). A number of improvements to this system have been proposed to try to simplify this system.

Objectives of this Study
1.5 The existing booking procedure is perceived to be relatively complex which leads to some confusion over which trips can be booked in advance (i.e. which are classified as time critical) as well as high peaks in demand making call waiting times long and scheduling tasks inefficient. Thus the primary objective of this study has been to understand how current users, lapsed users and potential new users of the Dial-a-Ride scheme rate different booking mechanisms. In the context of this study we define these groups of users and non users as follows:
I Current Users – eligible users or their carers who have made a trip using Dial-a-Ride in the past six months.
I Lapsed Users - eligible users or their carers who have not made a trip using Dial-a-Ride in the past six months.
I Non Users - eligible users who have never used Dial-a-Ride but are interested in learning more about the service.
1.6 The study has comprised three main stages: workshop with relevant stakeholders, pilot study and main survey. These are all described in the chapters that follow.
Remainder of this Report
1.7 This report provides an overview of the preliminary results attained from the research undertaken as follows:
I Chapter 2 discusses the stakeholder workshop held in June 2009.
I Chapter 3 provides an overview of the questionnaire design.
I Chapter 4 provides information about the fieldwork process, key points raised during the pilot survey and an overview of the sample profile from the main study.
I Chapter 5 summarises the analysis undertaken and the key results emerging from this.
I Chapter 6 highlights the key results along with recommendations as to the potential acceptability of different options, along with discussion of potential further research.
2 Workshop 2.1 This chapter discusses the workshop held in June 2009 with representatives from
London Dial-a-Ride and Transport for London’s Customer Research group. The workshop formed a necessary stage in the overall work programme since it allowed the various stakeholders to meet and discuss the current booking system, as well as what changes might be made in the future.
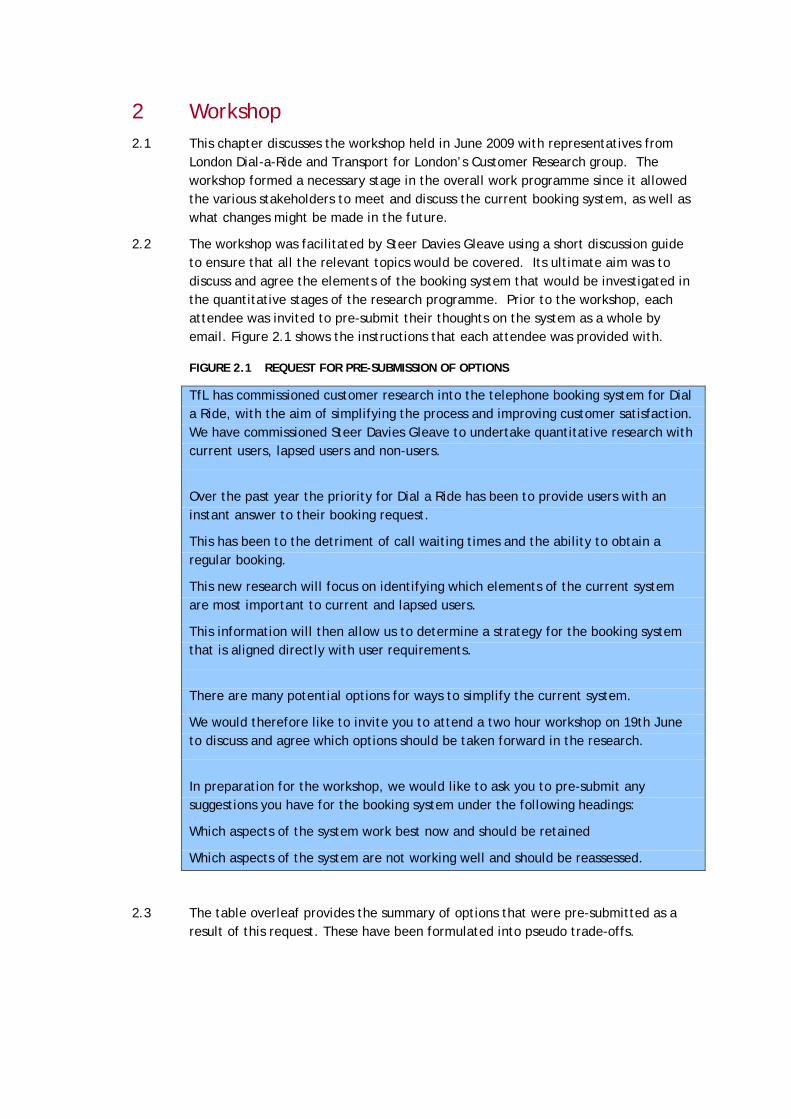
2.2 The workshop was facilitated by Steer Davies Gleave using a short discussion guide to ensure that all the relevant topics would be covered. Its ultimate aim was to discuss and agree the elements of the booking system that would be investigated in the quantitative stages of the research programme. Prior to the workshop, each attendee was invited to pre-submit their thoughts on the system as a whole by email. Figure 2.1 shows the instructions that each attendee was provided with.
FIGURE 2.1 REQUEST FOR PRE-SUBMISSION OF OPTIONS
TfL has commissioned customer research into the telephone booking system for Dial a Ride, with the aim of simplifying the process and improving customer satisfaction. We have commissioned Steer Davies Gleave to undertake quantitative research with current users, lapsed users and non-users.
Over the past year the priority for Dial a Ride has been to provide users with an instant answer to their booking request.
This has been to the detriment of call waiting times and the ability to obtain a regular booking.
This new research will focus on identifying which elements of the current system are most important to current and lapsed users.
This information will then allow us to determine a strategy for the booking system that is aligned directly with user requirements.
There are many potential options for ways to simplify the current system.
We would therefore like to invite you to attend a two hour workshop on 19th June to discuss and agree which options should be taken forward in the research.
In preparation for the workshop, we would like to ask you to pre-submit any suggestions you have for the booking system under the following headings:
Which aspects of the system work best now and should be retained
Which aspects of the system are not working well and should be reassessed.
2.3 The table overleaf provides the summary of options that were pre-submitted as a result of this request. These have been formulated into pseudo trade-offs.

TABLE 2-1 SUMMARY OF PRE-SUBMITTED OPTIONS
ID Option A Option B
1 Quicker call handling (so easier to get through on phone)
Instant confirmation on booking request
2 Longer booking window (up to 2 weeks in advance)
Less availability of next day and same day bookings
3 Restricting flexible time window to no more than 15 mins
Wider flexible window, lower refusal rate but greater uncertainty.
4 Shorter wait in call queue (so cheaper phone bill but have to redial repeatedly to get into queue)
Easy access to call queue but then a long wait incurring telephone charges
5 DaR confirming through a second phone call all journeys whether refused, time altered or agreed as requested
Only contact user when time altered or trip refused lower refusal rate
6 DaR contacting passenger to inform of refusals/time changes
Passengers contacting DAR to confirm trip details
7 First come, first served (Benefits individual but not the customer as a group as more trip refused)
Scheduling requests in batches to accommodate all trips with best fit, regardless of which were requested first or other form of priority lower refusal rate
8 First come, first served Some trips given priority( e.g. medical appointments )
9 Wait listing if no solution available at time of call (So lower refusal rate, uncertainty until trip confirmed phone call)
As Current System
10
If no solution available, call wait listed if no solution eventually available trip request transferred to Taxicard. (This lowers DaR refusal rate, trip guaranteed subject to customer having Taxicard trips available NB Taxicard trips incur a charge)
As Current System
Workshop Process
2.4 The workshop itself was arranged as follows:
I Introductions;
I Perceived problems with the existing system and options for improving this;
I Option Feasibility:
P Ease of implementation;
P Likelihood of acceptance by current users; and
P Impact of the change on the DaR operation.
I Finalising list of options for testing in the quantitative research.
2.5 We now describe some of the key discussions in more detail. A full account of this workshop is available as an audio file, which has been appended to this document.

Summary of the Current Booking System
2.6 There are three main types of booking possible under the current DaR booking service:
I Regular repeat bookings which are arranged in advance - scheduled and continue to occur until the user cancels them.
I Advance booking of time-critical appointments up to two weeks in advance of the journey - Time critical trips are classed as journeys where the user must be somewhere at a certain time. This includes trips to the hair dressers but not trips to visit friends or family, or trips to the shops.
I Ad-hoc bookings for non-time critical trips which can be made up to one day in advance or on the same day as the trip itself.
2.7 All booking requests are taken via a single dedicated Dial-a-Ride call centre. This call centre is organised into two sections: reservations and service delivery. The vast majority of resources are deployed within the reservations department to cope with the volume of calls that DaR receives each day.
2.8 Call receivers try to allocate appointments to individuals during the initial call when ever possible. They search for availability in a window around the requested time. If this time is not available they offer a series of alternatives. If no suitable alternative exists, the booking is placed on a wait list until such a time when it can be scheduled. As such the booking system effectively works on a first-come-first-served basis.
2.9 The set up of the current system results in a large morning peak as users compete to be first to get their booking in. Thursday morning is by far the busiest time when the call centre can get as many as 5,000 attempted calls in a 15 minute period. There are a limited number of call receivers and as such many people have to keep calling until they can get through to an operator. The inability to get through first time due to high call volumes can be further exacerbated by long call durations; the average call length is around three and a half minutes.
2.10 From an operational perspective, the allocation of buses is initially zone-based, before opening up at 3pm to wider areas if buses are not filled. This widening can lead to dead mileage as buses may have to travel long distances between pick-ups. However if can also lead to a secondary peak of calls as it is well known to a sub-set of users that successful bookings can be arranged at this time with relative ease.
2.11 Dial-a-Ride phased in a new computer system for scheduling journeys between September 2005 and September 2008. The implementation of this has not been smooth and as such there has been a loss of confidence in the system overall. A new telephone system is scheduled to ‘go live’ in October 2009.
Short History of the Dial-a-Ride Booking System
2.12 Before moving to a centralised system, bookings were handled by 6 individual operating centres. Each depot received its own calls and arranged appointments. This system utilised an ‘operational scheduling’ technique. In other words, appointments were allocated manually at midday and people were informed by phone if their trip wasn’t available. This contrasts with the current system which uses ‘real-time scheduling’.
2.13 The historical system is looked on favourably by most, particularly at depots where it operated well. In particular the Wimbledon depot was seen as the best example of the system working efficiently. Wimbledon customers had a lot of confidence that their bookings would be successfully arranged and were thus very satisfied with the service. However there is a perception that each depot offered a different level of service quality.
2.14 The move to centralisation was initiated in September 2005 with the Wimbledon operating area the first to have its calls migrated to the new centralised call centre. The final area to move was Woodford in September 2008.
Issues and Considerations with the Current System
2.15 There are two common complaints with the current booking system:
I The time it takes to get through when calling; and
I The refusal rate (currently 9%).
2.16 Alongside this, Dial-a-Ride has a target to significantly increase the number of trips it makes per year. The target for this year is 1.4m delivered trips which is 15% higher than the previous year. Furthermore there is an utilisation target for each driver of 17 ‘jobs’ per shift. It is widely believed that if the overall DaR operation was made more ’slick’, demand could be significantly increased and targets met.
A Three Day System
2.17 From an operational point of view, it might be advantageous to organise the system so that it is akin to a three-day booking system where only trip requests are taken and scheduling is carried out later. This would allow optimisation of trip allocation and thus increase the number of potential trips whilst reducing the refusal rate. This could also reduce the call length as only requests are taken, not actual bookings.
2.18 The main drawback of this approach however is the delay that users would be subjected to before being informed of whether their trip has been arranged or not. In practice this may lead to user anxiety and even to ‘comfort calling’ to check the situation with the booking. Some re-education of users would also be needed with regards calling habits as many are conditioned to dial as early as possible.
Potential Attributes for Inclusion in Research Study
2.19 Through the discussion of the historical and current system it became evident that some of the pre-submitted options would simply not be tolerated by users. For example any changes which would involve additional phone calls by either the DaR call handlers or the users such as in options 5 and 6 in Table 2-1 above.
2.20 Furthermore the offer of making a trip by TaxiCard was believed to be outside the scope of this current research programme.
2.21 At the conclusion of these discussions, the following service elements remained from the original list:
I Length of booking window;
I Call handling speed;
I First-come-first-served system; and
I Whether Dial-a-Ride contacts users upon refusal/alteration of bookings or for confirmation of bookings as well.
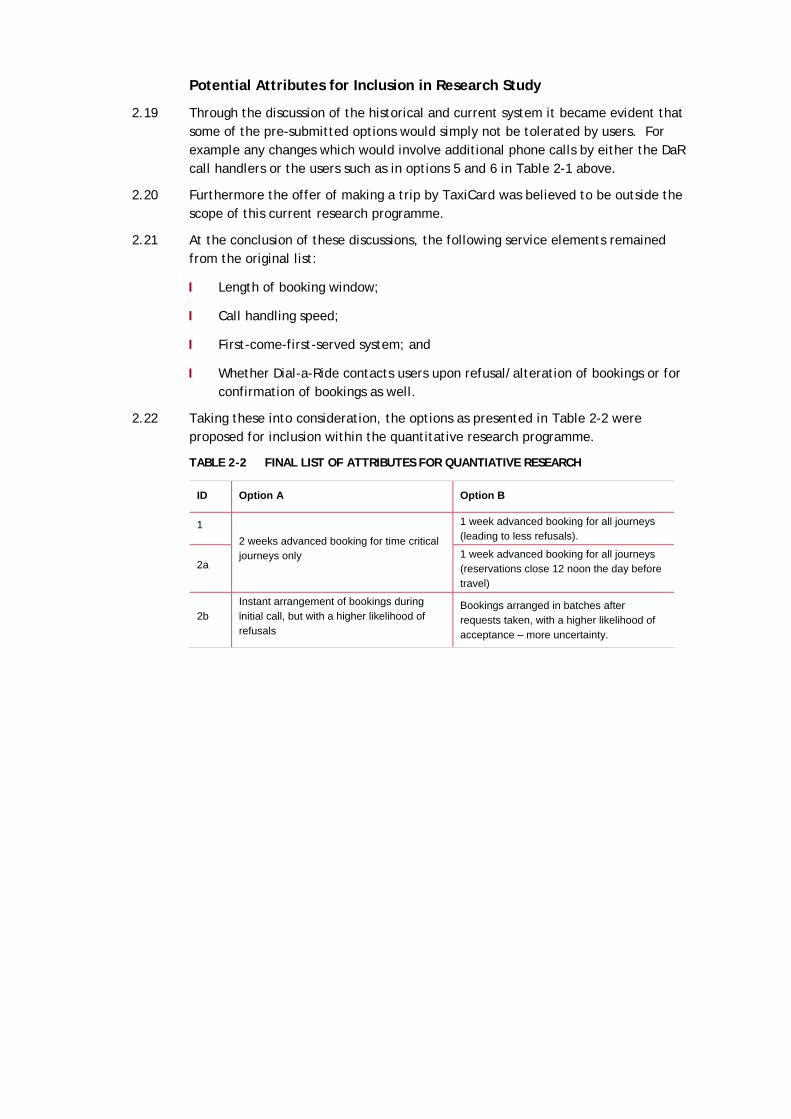
2.22 Taking these into consideration, the options as presented in Table 2-2 were proposed for inclusion within the quantitative research programme.
TABLE 2-2 FINAL LIST OF ATTRIBUTES FOR QUANTIATIVE RESEARCH
ID Option A Option B
1 2 weeks advanced booking for time critical journeys only
1 week advanced booking for all journeys (leading to less refusals).
2a 1 week advanced booking for all journeys (reservations close 12 noon the day before travel)
2b Instant arrangement of bookings during initial call, but with a higher likelihood of refusals
Bookings arranged in batches after requests taken, with a higher likelihood of acceptance – more uncertainty.


3 Questionnaire Design
Introduction
3.1 This chapter provides an overview of the questionnaire design used in the quantitative stages of the study. This quantitative study was first envisaged as a Stated Preference style survey, where respondents would be offered different combinations of service offerings and asked to state which they would prefer. However given the relative complexity of the existing booking system and its user base which is skewed towards the elderly, this approach was adapted and simplified to ensure that respondents would be able to process the information presented to them.
3.2 The research itself was undertaken via a Computer Assisted Telephone Interview (CATI). A CATI approach has the significant benefit of being fully inclusive of all user types (as opposed to any on-vehicle method) whilst not excluding anybody who may have a visual impairment. Given that bookings for the Dial-a-Ride system are currently taken primarily via telephone, this is also a medium which most respondents should be comfortable with. From a questionnaire design perspective however, it does exclude the possibility of any visual aids to explain trade-offs, and as such choices must be kept as simple as possible to avoid any confusion. Such issues were thoroughly considered as part of the questionnaire design process.
Questionnaire Structure
3.3 Two distinct questionnaires were produced to account for the fundamental differences between Users and Non-Users of the Dial-a-Ride service. The figure below shows an overview of the structure of the questionnaires.
FIGURE 3.1 OVERVIEW OF QUESTIONNAIRES

User Questionnaire
3.4 Of the three user types defined (Users, Lapsed-Users and Non-Users), the “User Questionnaire” was seen by both the User and Lapsed-User types.
Information on Current Use
3.5 The first section collected information about the respondents’ current usage of Dial-a-Ride. Particular focus was given to:
I Type of trips booked and frequency of such bookings.
I Usual time of day within which users call Dial-a-Ride to book trips.
I Alternatives to Dial-a-Ride if bookings are refused.
Questions on Perceptions of Current Service
3.6 In order to gauge the respondents general perception of the current service offered, questions were asked with regards:
I How user-friendly respondents find the current booking system.
I Respondents’ perceptions of how often their trips are refused.
I Respondents’ perceptions of the wait-listing process.
Non-User Questionnaire
3.7 The “Non-user Questionnaire” was seen only by the Non-user group.
Alternatives to Dial-a-Ride and Reasons for Non-Use
3.8 Given that by definition Non-Users have never (or at least not in the last few years) used Dial-a-Ride, it would not be appropriate to ask questions on use and perceptions of the current system. As such, Non-Users were asked an alternative set of questions relating to the trips they make via other modes. The type of questions included were:
I Do you use any other door-to-door services offered by Transport for London?
I What other modes of transport do you typically use for travel within London?
I What are the main reasons for you not currently using the Dial-a-Ride service?
3.9 Additionally, a summary was provided of the current service offered by Dial-a-Ride and respondents were asked to give an indication as to whether this is a service they would consider using.
Common Section of Questionnaires
3.10 Much of the sections of the two questionnaires are common. They were kept as separate entities however to allow for the slight differences in tone (i.e. ‘would x increase your likelihood of using Dial-a-Ride’ as opposed to ‘would x improve the service Dial-a-Ride provides you with’).
3.11 In each case, the order of questions was randomised for both the single and combined attribute questions.

Single Attribute Rating Questions
3.12 Respondents of all types were presented with a series of 5 questions detailing a potential change to the Dial-a-Ride booking system. These were framed around the current system operated by Dial-a-Ride, thus making the choice for users ‘given the current situation, how would you rate changing this to x?’
3.13 The single attribute questions asked are detailed below:
I At the moment people who call Dial-a-Ride earlier in the day have a higher chance of a successful booking. What if it didn’t matter when in the day you called, you had the same chance of a successful booking?
I At the moment your booking is confirmed or refused when you call Dial-a-Ride. What if you had to wait until later in the day to receive confirmation or refusal of your booking?
I At the moment you can book time-critical appointments up to two weeks in advance. What if you could only book time-critical appointments up to one week in advance?
I At the moment you can only book non time-critical trips the day before you want to travel. What if you could book any trip (including non time-critical trips) up to one week in advance?
I At the moment it is not always possible to get through to a Dial-a-Ride operator on the first attempt so you may have to redial. What if you could always get through to Dial-a-Ride on the first attempt, but had to wait on hold until and operator became free?
3.14 For each question, respondents were asked to rate the change on a five point scale:
I Much better than the current system
I Slightly better than the current system
I No difference
I Slightly worse than the current system
I Much worse than the current system
3.15 This rating was slightly altered for the non-users whereby their choices were ‘Strongly improves likelihood of using Dial-a-Ride’ … etc.
Combined Attribute Rating Questions
3.16 Respondents were shown two out of four randomly assigned combined attribute questions and were asked to rate these combinations of attribute changes. Only two were shown to reduce respondent fatigue at this stage. Again, these were framed around the current Dial-a-Ride system, thus making the choice for users ‘given the current situation, how would you rate changing this to x and y?’
3.17 The combined attribute questions asked were:
I At the moment you are told if your trip can be booked or not at the time when you call BUT there is a chance you will not be able to book the trip you want. What if you had to wait until later in the day to receive confirmation of your booking AND you were more likely to be able to book the trip you want?
I Currently you are told if your trip can be booked when you call AND those who call Dial-a-Ride first are more likely to get their booking. What if you had to wait until later in the day to receive confirmation of your booking BUT the system was changed so that it didn’t matter when in the day you called, you had the same chance of a successful booking?
I At the moment you can only book non time-critical trips (such as trips to the shops) the day before you travel AND Dial-a-Ride try to book your trip when you call. What if you could book any trip up to one week in advance BUT you had to wait until the day before your trip to receive confirmation or refusal of your booking?
I Currently it is possible to book trips between 9am and 4pm the day before you want to travel. What if you were able to book any trip one week in advance BUT the booking lines closed at 12 noon the day before?
3.18 The same rating scale was used for these questions as was used for the single attribute questions.
Socio-demographic Information
3.19 The final section collected information about the respondents’ socio-demographic information. This included information such as age, gender, car availability and borough of residence.

4 Fieldwork and Sample Profile 4.1 This chapter provides information about the quantitative fieldwork process, key
points raised during the pilot survey and an overview of the sample profile from the main study.
Overview
4.2 The CATI fieldwork was undertaken by specialist market research company FieldWorks. This consisted of a two day pilot exercise of 50 respondents, followed by the main fieldwork which consisted of 450 separate interviews split 175:175:100 between Users, Lapsed-users and Non-users.
4.3 Dial-a-Ride provided a database of its current registered users along with details of last use to provide a split between Users and Lapsed-users. For the Non-users, the London Travel Demand Survey (LTDS) was used to provide details of potential but unregistered users of the Dial-a-Ride service.
Pilot Study
4.4 The pilot study ran over two days throughout which a total of 58 respondents were interviewed. The purpose of the pilot study was to test:
I Whether the questionnaire operated as intended;
I That the logic was correct;
I Whether the set-up of the questionnaire was comprehensible to the study group;
I That the questions were worded unambiguously;
I Whether the options for individual questions were sufficient to cover the majority of responses; and
I That the estimated average call length was accurate.
4.5 The pilot exercise flagged up the following issues:
I The average call length was slightly higher than anticipated, at around 15 minutes for users and 11 minutes for non-users; and
I Additional information with regards the respondents’ car availability would be beneficial in understanding respondent’s dependency on DaR.
4.6 The pilot produced positive results, and though small changes were made to the questionnaire for the main fieldwork, these were deemed minor enough to allow the pilot sample to form part of the main fieldwork group.
Socio-Demographic Information
4.7 The following table gives information on the socio-demographic make up of the overall sample, segmented by user type.

4.8 The sample is skewed towards female respondents amongst current and lapsed users, but relatively even for non-users. Current and lapsed users also tended to be 70 years of age or older whereas non-users tend to be somewhat younger with 37% falling under the age of 65. This could indicate an increased desire to retain independence from younger individuals.
TABLE 4-1 SOCIO-DEMOGRAPHIC SPLITS BY USER TYPE
RESPONDENT TYPE
CATEGORY User Carer of User Lapsed-UserCarer of
Lapsed-User Non-User TOTALGENDERMale 15% (22) 19% (5) 23% (29) 29% (14) 43% (43) 25% (113)Female 85% (126) 81% (22) 77% (98) 71% (35) 57% (57) 75% (338)AGE<16 0% (0) 0% (0) 0% (0) 2% (1) 0% (0) 0% (1)16-24 1% (1) 4% (1) 0% (0) 5% (2) 3% (3) 2% (7)25-34 0% (0) 0% (0) 3% (4) 7% (3) 2% (2) 2% (9)35-44 2% (3) 12% (3) 2% (2) 12% (5) 2% (2) 3% (15)45-54 6% (9) 8% (2) 2% (3) 2% (1) 10% (10) 6% (25)55-59 5% (7) 8% (2) 4% (5) 10% (4) 10% (10) 6% (28)60-64 5% (8) 8% (2) 5% (6) 12% (5) 10% (10) 7% (31)65-69 5% (8) 0% (0) 7% (9) 7% (3) 7% (7) 6% (27)70-74 10% (15) 4% (1) 17% (22) 7% (3) 12% (12) 12% (53)75-79 20% (30) 8% (2) 17% (22) 7% (3) 19% (19) 17% (76)80-84 17% (25) 12% (3) 19% (24) 10% (4) 13% (13) 16% (69)85-89 22% (33) 24% (6) 13% (16) 7% (3) 12% (12) 16% (70)90-94 5% (7) 12% (3) 11% (14) 10% (4) 0% (0) 6% (28)95+ 1% (1) 0% (0) 0% (0) 2% (1) 0% (0) 0% (2)DISABILITYMobility Impairment 69% (125) 45% (20) 69% (99) 53% (29) 59% (77) 63% (350)Visual Impairment 4% (7) 7% (3) 6% (9) 7% (4) 7% (9) 6% (32)Hearing Impairment 2% (3) 9% (4) 1% (2) 2% (1) 2% (3) 2% (13)Learning Impairment 1% (2) 2% (1) 0% (0) 5% (3) 2% (2) 1% (8)Mental Health Condition 2% (3) 16% (7) 1% (2) 15% (8) 5% (6) 5% (26)Age Related Disability 13% (23) 11% (5) 9% (13) 7% (4) 12% (16) 11% (61)Other 10% (18) 9% (4) 13% (19) 11% (6) 14% (18) 12% (65)FLAT/HOUSELive Alone 68% (88) 4% (1) 59% (64) 9% (4) 36% (27) 49% (184)1 Other Person 23% (30) 33% (8) 34% (37) 28% (12) 47% (35) 32% (122)2 Other People 2% (2) 8% (2) 4% (4) 0% (0) 5% (4) 3% (12)2+ Other People 7% (9) 54% (13) 4% (4) 63% (27) 11% (8) 16% (61)CAR DIRECTLY AVAILABLEYes 11% (14) 32% (8) 20% (23) 33% (15) 56% (42) 26% (102)No 89% (117) 68% (17) 80% (90) 67% (31) 44% (33) 74% (288)RESIDENCENorth East 22% (32) 8% (2) 12% (15) 6% (3) 17% (16) 15% (68)South Central 11% (16) 4% (1) 14% (17) 14% (7) 10% (10) 12% (51)North Central 12% (17) 8% (2) 14% (18) 4% (2) 11% (11) 11% (50)North 10% (15) 31% (8) 8% (10) 29% (14) 15% (14) 14% (61)Central 16% (23) 23% (6) 13% (16) 18% (9) 17% (16) 16% (70)South East 12% (17) 19% (5) 16% (20) 14% (7) 9% (9) 13% (58)South West 16% (23) 8% (2) 23% (29) 14% (7) 21% (20) 18% (81)BASE (148) (27) (127) (49) (100) (451)
4.9 Those with carers are more likely to live in accommodation with a larger number of people, though interestingly Non-Users are more likely to do so than Users without carers. The sample population as a whole however tend to live alone or with one other individual.
4.10 The majority of users (both current and lapsed) do not have a car available to them whereas over half on Non-Users do. As one would expect, those with carers are more likely to have this option of travel available to them though not to the same extent as the non-users. This highlights the fact that Dial-a-Ride users have a higher dependency on door to door services than the wider eligible population.
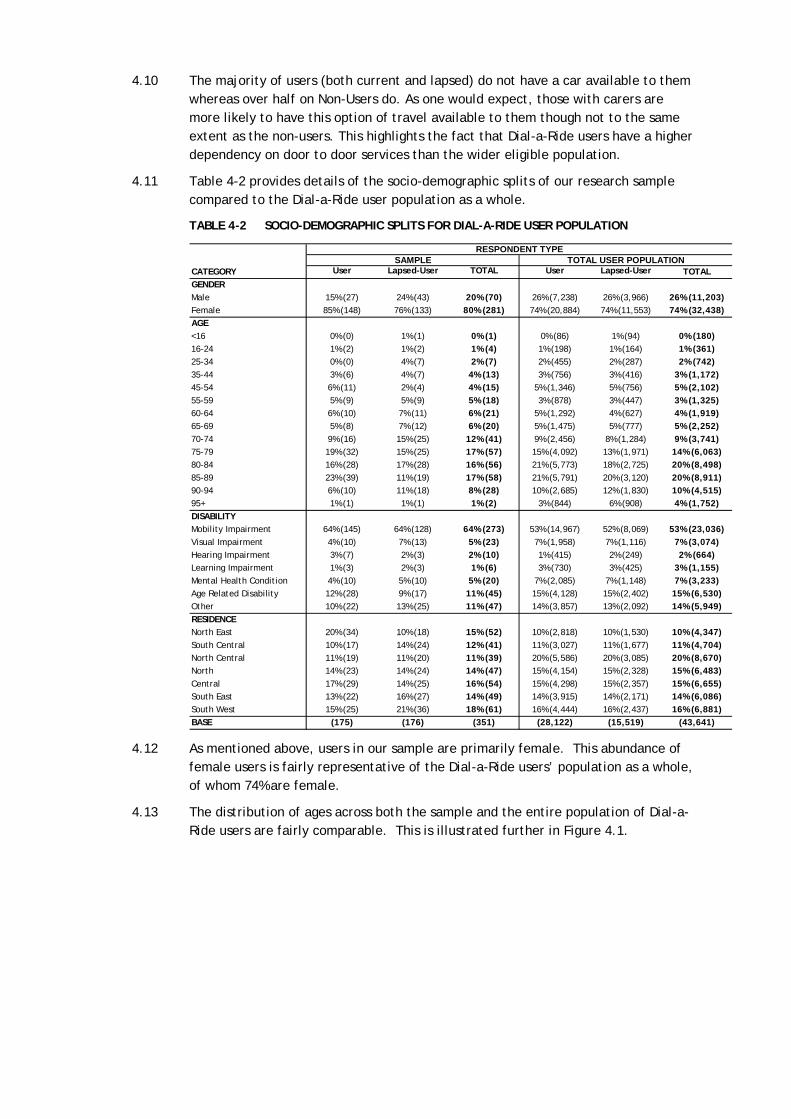
4.11 Table 4-2 provides details of the socio-demographic splits of our research sample compared to the Dial-a-Ride user population as a whole.
TABLE 4-2 SOCIO-DEMOGRAPHIC SPLITS FOR DIAL-A-RIDE USER POPULATION
RESPONDENT TYPESAMPLE TOTAL USER POPULATION
CATEGORY User Lapsed-User TOTAL User Lapsed-User TOTALGENDERMale 15% (27) 24% (43) 20% (70) 26% (7,238) 26% (3,966) 26% (11,203)Female 85% (148) 76% (133) 80% (281) 74% (20,884) 74% (11,553) 74% (32,438)AGE<16 0% (0) 1% (1) 0% (1) 0% (86) 1% (94) 0% (180)16-24 1% (2) 1% (2) 1% (4) 1% (198) 1% (164) 1% (361)25-34 0% (0) 4% (7) 2% (7) 2% (455) 2% (287) 2% (742)35-44 3% (6) 4% (7) 4% (13) 3% (756) 3% (416) 3% (1,172)45-54 6% (11) 2% (4) 4% (15) 5% (1,346) 5% (756) 5% (2,102)55-59 5% (9) 5% (9) 5% (18) 3% (878) 3% (447) 3% (1,325)60-64 6% (10) 7% (11) 6% (21) 5% (1,292) 4% (627) 4% (1,919)65-69 5% (8) 7% (12) 6% (20) 5% (1,475) 5% (777) 5% (2,252)70-74 9% (16) 15% (25) 12% (41) 9% (2,456) 8% (1,284) 9% (3,741)75-79 19% (32) 15% (25) 17% (57) 15% (4,092) 13% (1,971) 14% (6,063)80-84 16% (28) 17% (28) 16% (56) 21% (5,773) 18% (2,725) 20% (8,498)85-89 23% (39) 11% (19) 17% (58) 21% (5,791) 20% (3,120) 20% (8,911)90-94 6% (10) 11% (18) 8% (28) 10% (2,685) 12% (1,830) 10% (4,515)95+ 1% (1) 1% (1) 1% (2) 3% (844) 6% (908) 4% (1,752)DISABILITYMobility Impairment 64% (145) 64% (128) 64% (273) 53% (14,967) 52% (8,069) 53% (23,036)Visual Impairment 4% (10) 7% (13) 5% (23) 7% (1,958) 7% (1,116) 7% (3,074)Hearing Impairment 3% (7) 2% (3) 2% (10) 1% (415) 2% (249) 2% (664)Learning Impairment 1% (3) 2% (3) 1% (6) 3% (730) 3% (425) 3% (1,155)Mental Health Condition 4% (10) 5% (10) 5% (20) 7% (2,085) 7% (1,148) 7% (3,233)Age Related Disability 12% (28) 9% (17) 11% (45) 15% (4,128) 15% (2,402) 15% (6,530)Other 10% (22) 13% (25) 11% (47) 14% (3,857) 13% (2,092) 14% (5,949)RESIDENCENorth East 20% (34) 10% (18) 15% (52) 10% (2,818) 10% (1,530) 10% (4,347)South Central 10% (17) 14% (24) 12% (41) 11% (3,027) 11% (1,677) 11% (4,704)North Central 11% (19) 11% (20) 11% (39) 20% (5,586) 20% (3,085) 20% (8,670)North 14% (23) 14% (24) 14% (47) 15% (4,154) 15% (2,328) 15% (6,483)Central 17% (29) 14% (25) 16% (54) 15% (4,298) 15% (2,357) 15% (6,655)South East 13% (22) 16% (27) 14% (49) 14% (3,915) 14% (2,171) 14% (6,086)South West 15% (25) 21% (36) 18% (61) 16% (4,444) 16% (2,437) 16% (6,881)BASE (175) (176) (351) (28,122) (15,519) (43,641)
4.12 As mentioned above, users in our sample are primarily female. This abundance of female users is fairly representative of the Dial-a-Ride users’ population as a whole, of whom 74% are female.
4.13 The distribution of ages across both the sample and the entire population of Dial-a-Ride users are fairly comparable. This is illustrated further in Figure 4.1.

FIGURE 4.1 SAMPLE PROFILE AND DAR POPULATION AGE GROUPS.
0%
5%
10%
15%
20%
25%
<16 16-24 25-34 35-44 45-54 55-59 60-64 65-69 70-74 75-79 80-84 85-89 90-94 95+
Sample User DaR User Sample Lapsed-User DaR Lapsed-User
4.14 The vast majority of all user types suffer from some form of mobility impairment, though this categorisation is somewhat judgemental. As such any differences between our sample and the official disability listings from the Dial-a-Ride database may not necessarily be real differences, rather differences in individuals’ perceptions. We provide our assumptions on disability classifications in the table below.
TABLE 4-3 DISABILITY CLASSIFICATIONS
ID Disability Class ID Disability Class
ART Arthritis/osteoarthritis Mobility MD Muscular dystrophy Mobility
BAL Vertigo/balance prob Mobility ME ME Mobility
BD Brain damage Mental Health MEM Confusion/memory loss Mental Health
BEH Behavioural problems Learning MH Mental health problems Mental Health
BNE Back/neck problem Mobility MND Motor Neurone Disease Mental Health
CAN Cancer Other MS Multiple Sclerosis Mobility
CP Cerebral palsy Mobility OBE Obesity Mobility
DEM Dementia/Alzheimer’s Mental Health OST Osteoporosis/brittle bones Mobility
DIB Diabetes Other PAR Parkinson's disease Mental Health
ELD Frail, elderly Age Related POL Polio Mobility
EPL Epilepsy/seizures Mental Health RES Respiratory conditions Mobility

ID Disability Class ID Disability Class
FRA Fracture Mobility SB Spina bifida Mobility
HEA Angina/heart problems Mobility SPE Speech defect Learning
HIM Hearing impairment Hearing SPI Spinal cord injury Mobility
INC Incontinence Age Related STR Stroke Mobility
JOI Joint replacement Mobility VIM Visual impairment Visual
LDS Learning disabilities Learning ZZ Disability unknown Other
LIM Limb amputation Mobility
4.15 The distribution of users across regions is fairly uniform, though the Dial-a-Ride database population does have a slightly higher number within the North Central1 region.
4.16 A further disaggregation of respondents by borough is shown in the following map. Note that there were no Dial-a-Ride users interviewed in the borough of Newham as a joint Dial-a-Ride and Taxicard service operates locally, the users of which were outside of the scope of this research.
1 Formed of the Boroughs of Camden, Hackney, Haringey, Islington, Redbridge and Waltham Forest

FIGURE 4.2 DISTRIBUTION OF QUESTIONNAIRE RESPONDENTS BY BOROUGH
Current Usage and Perception of Service
4.17 In this section we present respondents’ answers to each of the questions in the initial sections of the questionnaires:
I ‘Information on current use’ and ‘Perceptions of current service’ for Users and Lapsed-Users. These responses have been segmented by whether the carer or the user usually books trips; and
I ‘Alternatives to Dial-a-Ride and reasons for non-use’ for Non-Users.
Users / Lapsed-Users
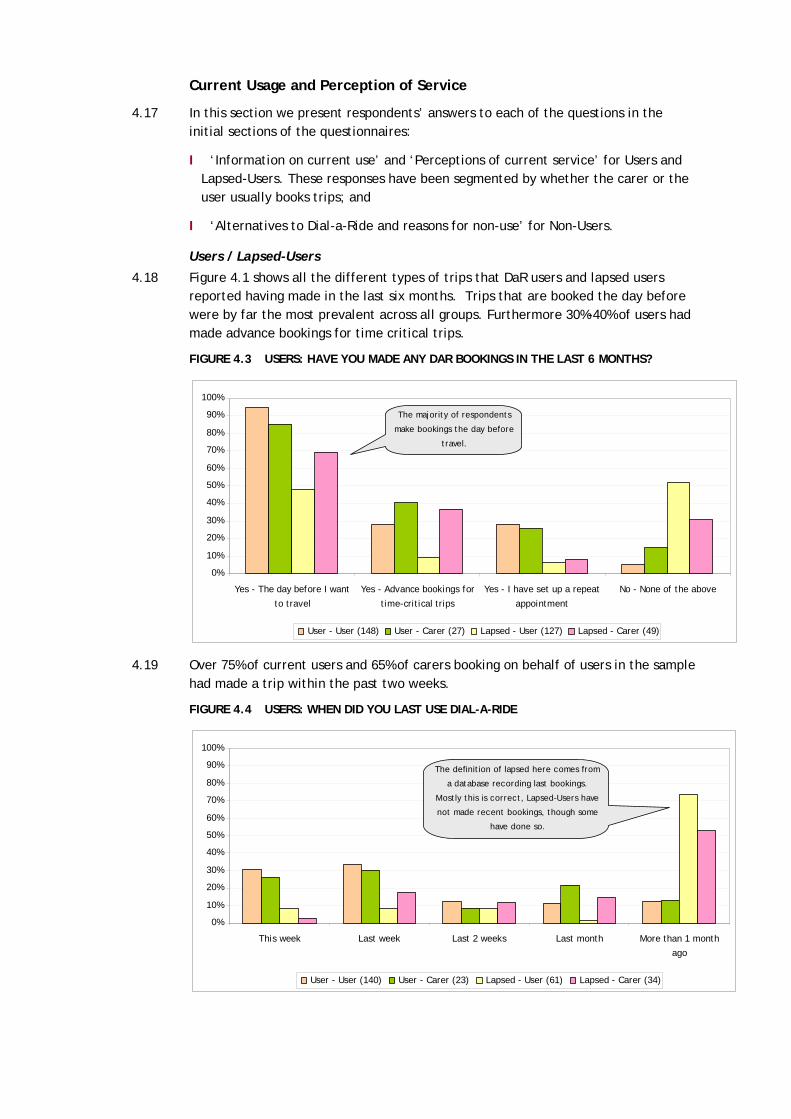
4.18 Figure 4.1 shows all the different types of trips that DaR users and lapsed users reported having made in the last six months. Trips that are booked the day before were by far the most prevalent across all groups. Furthermore 30%-40% of users had made advance bookings for time critical trips.
FIGURE 4.3 USERS: HAVE YOU MADE ANY DAR BOOKINGS IN THE LAST 6 MONTHS?
0%
10%
20%
30%
40%
50%
60%
70%
80%
90%
100%
Yes - The day before I want
to travel
Yes - Advance bookings for
time-critical trips
Yes - I have set up a repeat
appointment
No - None of the above
User - User (148) User - Carer (27) Lapsed - User (127) Lapsed - Carer (49)
The majority of respondents
make bookings the day before
travel.
4.19 Over 75% of current users and 65% of carers booking on behalf of users in the sample had made a trip within the past two weeks.
FIGURE 4.4 USERS: WHEN DID YOU LAST USE DIAL-A-RIDE
0%
10%
20%
30%
40%
50%
60%
70%
80%
90%
100%
This week Last week Last 2 weeks Last month More than 1 month
ago
User - User (140) User - Carer (23) Lapsed - User (61) Lapsed - Carer (34)
The definition of lapsed here comes from
a database recording last bookings.
Mostly this is correct, Lapsed-Users have
not made recent bookings, though some
have done so.

4.20 Around 20% of the sample across all user groups (current and lapsed) stated that they usually try to call Dial-a-Ride at 9am when the line first open, with larger numbers stating they typically call between 9am and 11am. The smallest proportion (less than 5% across all groups) reported making their calls between 3pm and 4pm, suggesting that for most, their strategy is to book a trip as early in the day as possible. However 10% and 26% of current users and their carers respectively stated that they do not call at a regular time.
FIGURE 4.5 USERS: AT WHAT TIME OF DAY DO YOU USUALLY CALL DAR TO ARRANGE YOUR TRIP?
0%
10%
20%
30%
40%
50%
60%
70%
80%
90%
100%
At 9am when the
telephone lines
open
In the morning
between 9am and
11am
Late
morning/lunchtime
- between 11am
and 1pm
Mid afternoon -
between 1pm and
3pm
Late afternoon -
between 3pm and
4pm
I don't call at a
regular time
User - User (140) User - Carer (23) Lapsed - User (61) Lapsed - Carer (34)
The majority of calls are made in
the morning, though a large
number of respondents say they do
not call at a regular time.
4.21 Respondents were asked how user friendly they found the current booking system. Large numbers said that they found it easy to understand. Note that this question was re-worded following the pilot as it was unclear whether respondents were answering on the basis of the user friendliness of the system or the friendliness of the call handling staff.
FIGURE 4.6 USERS: HOW EASY (USER-FRIENDLY) DO YOU FIND THE CURRENT BOOKING SYSTEM TO UNDERSTAND AND USE?
0%
10%
20%
30%
40%
50%
60%
70%
80%
90%
100%
Very easy to
understand
Quite easy to
understand
Neutral Quite difficult to
understand
Very difficult to
understand
Don't know
User - User (148) User - Carer (27) Lapsed - User (127) Lapsed - Carer (49)
Overall there is a positive response to
the user-friendliness of the current
system, with current users being the
most favourable towards it.

Frequency of Booking Each Type of Trip
4.22 Following on from the earlier question about the types of trips that had been booked in the past six months, respondents were also asked about the frequency of booking advance trips. Around 50% stated that they never made this type of trip. Carers booking on behalf of either current or lapsed users appear to make the greatest use of this service with 53% of carers booking on behalf of current users having made an appointment in the last month.
FIGURE 4.7 USERS: HOW OFTEN DO YOU BOOK ADVANCED TRIPS?
0%
10%
20%
30%
40%
50%
60%
70%
80%
90%
100%
More than once
per week
Once per week Once per fortnight Once a month or
less
Never Don't know
User - User (148) User - Carer (27) Lapsed - User (127) Lapsed - Carer (49)
Around 50% of all respondent types
never make advanced bookings. Less
than 15% do so once per week or more.
4.23 As suggested in Figure 4.3, most user groups regularly arrange trips for the day before they want to travel. Over 50% of current users and their carers book these trips at least once each week. In general carers tend to book these types of trips less often than the users themselves.
FIGURE 4.8 USERS: HOW OFTEN DO YOU BOOK NORMAL DAY-BEFORE TRIPS?
0%
10%
20%
30%
40%
50%
60%
70%
80%
90%
100%
More than once
per week
Once per week Once per fortnight Once a month or
less
Never Don't know
User - User (148) User - Carer (27) Lapsed - User (127) Lapsed - Carer (49)
Most people make at
least some day-before
trips, though Carers of
Users make these
bookings less frequently
than Users themselves.
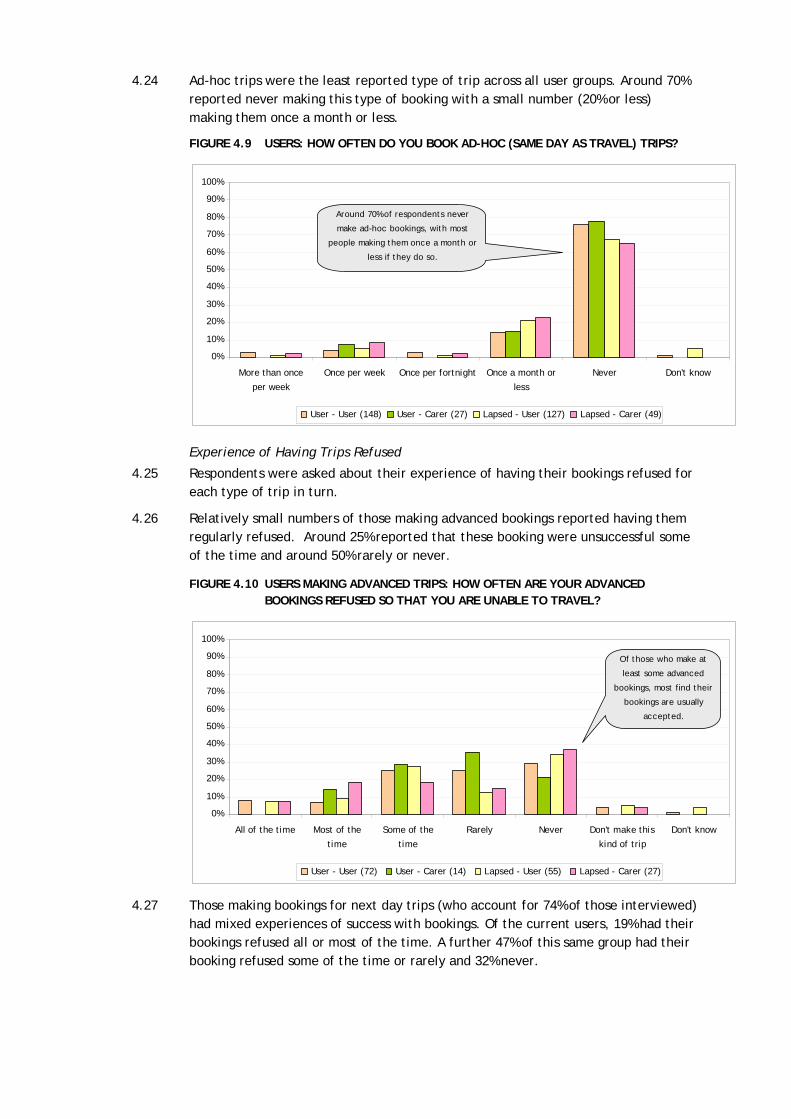
4.24 Ad-hoc trips were the least reported type of trip across all user groups. Around 70% reported never making this type of booking with a small number (20% or less) making them once a month or less.
FIGURE 4.9 USERS: HOW OFTEN DO YOU BOOK AD-HOC (SAME DAY AS TRAVEL) TRIPS?
0%
10%
20%
30%
40%
50%
60%
70%
80%
90%
100%
More than once
per week
Once per week Once per fortnight Once a month or
less
Never Don't know
User - User (148) User - Carer (27) Lapsed - User (127) Lapsed - Carer (49)
Around 70% of respondents never
make ad-hoc bookings, with most
people making them once a month or
less if they do so.
Experience of Having Trips Refused
4.25 Respondents were asked about their experience of having their bookings refused for each type of trip in turn.
4.26 Relatively small numbers of those making advanced bookings reported having them regularly refused. Around 25% reported that these booking were unsuccessful some of the time and around 50% rarely or never.
FIGURE 4.10 USERS MAKING ADVANCED TRIPS: HOW OFTEN ARE YOUR ADVANCED BOOKINGS REFUSED SO THAT YOU ARE UNABLE TO TRAVEL?
0%
10%
20%
30%
40%
50%
60%
70%
80%
90%
100%
All of the time Most of the
time
Some of the
time
Rarely Never Don't make this
kind of trip
Don't know
User - User (72) User - Carer (14) Lapsed - User (55) Lapsed - Carer (27)
Of those who make at
least some advanced
bookings, most find their
bookings are usually
accepted.
4.27 Those making bookings for next day trips (who account for 74% of those interviewed) had mixed experiences of success with bookings. Of the current users, 19% had their bookings refused all or most of the time. A further 47% of this same group had their booking refused some of the time or rarely and 32% never.
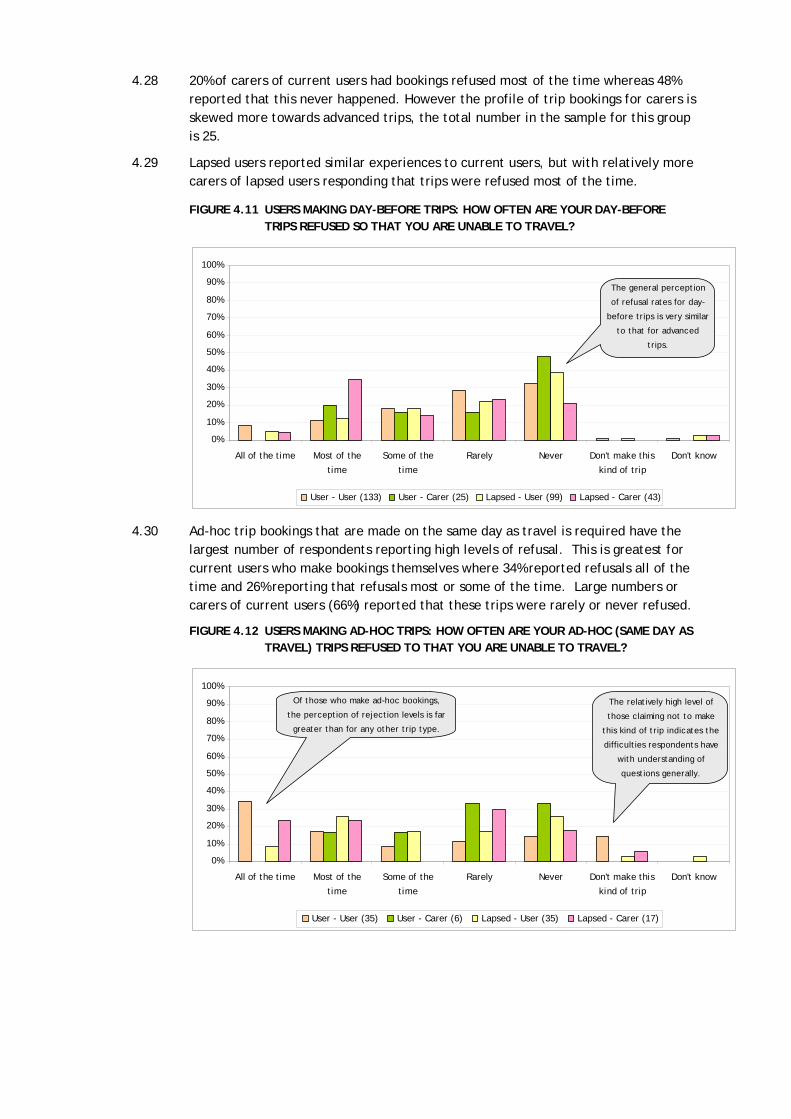
4.28 20% of carers of current users had bookings refused most of the time whereas 48% reported that this never happened. However the profile of trip bookings for carers is skewed more towards advanced trips, the total number in the sample for this group is 25.
4.29 Lapsed users reported similar experiences to current users, but with relatively more carers of lapsed users responding that trips were refused most of the time.
FIGURE 4.11 USERS MAKING DAY-BEFORE TRIPS: HOW OFTEN ARE YOUR DAY-BEFORE TRIPS REFUSED SO THAT YOU ARE UNABLE TO TRAVEL?
0%
10%
20%
30%
40%
50%
60%
70%
80%
90%
100%
All of the time Most of the
time
Some of the
time
Rarely Never Don't make this
kind of trip
Don't know
User - User (133) User - Carer (25) Lapsed - User (99) Lapsed - Carer (43)
The general perception
of refusal rates for day-
before trips is very similar
to that for advanced
trips.
4.30 Ad-hoc trip bookings that are made on the same day as travel is required have the largest number of respondents reporting high levels of refusal. This is greatest for current users who make bookings themselves where 34% reported refusals all of the time and 26% reporting that refusals most or some of the time. Large numbers or carers of current users (66%) reported that these trips were rarely or never refused.
FIGURE 4.12 USERS MAKING AD-HOC TRIPS: HOW OFTEN ARE YOUR AD-HOC (SAME DAY AS TRAVEL) TRIPS REFUSED TO THAT YOU ARE UNABLE TO TRAVEL?
0%
10%
20%
30%
40%
50%
60%
70%
80%
90%
100%
All of the time Most of the
time
Some of the
time
Rarely Never Don't make this
kind of trip
Don't know
User - User (35) User - Carer (6) Lapsed - User (35) Lapsed - Carer (17)
Of those who make ad-hoc bookings,
the perception of rejection levels is far
greater than for any other trip type.
The relatively high level of
those claiming not to make
this kind of trip indicates the
difficulties respondents have
with understanding of
questions generally.
Experience of Wait List and Alternative Arrangements
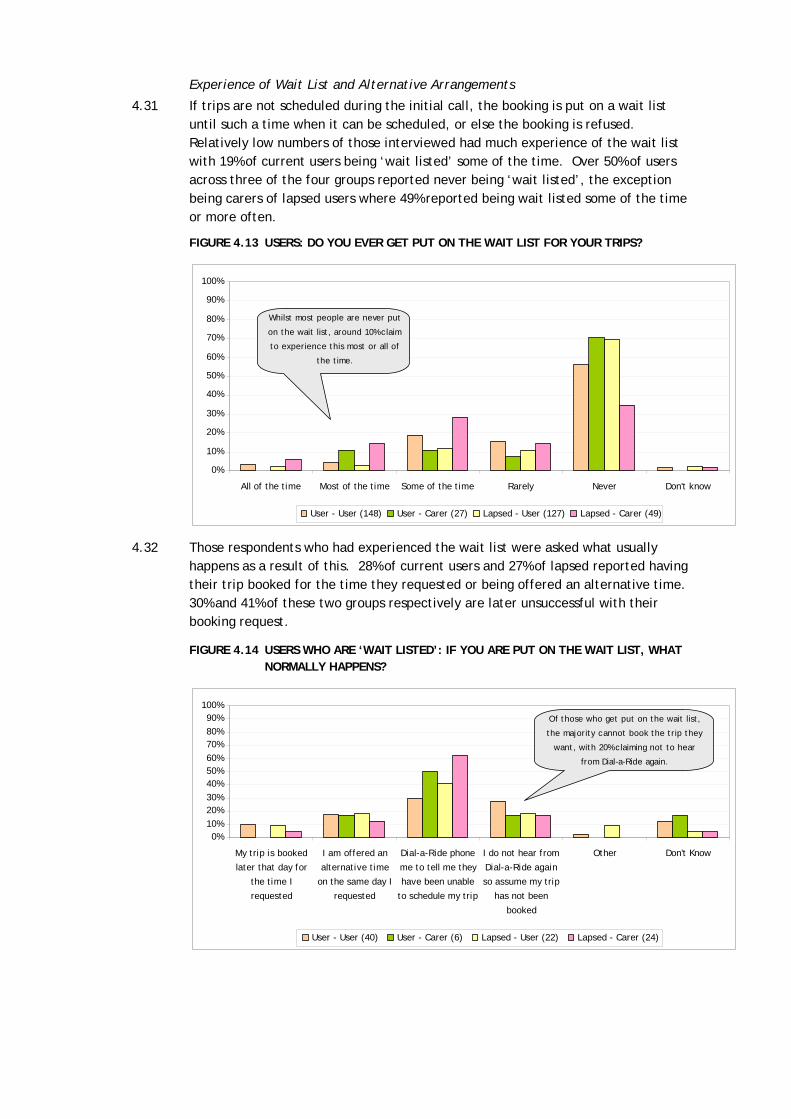
4.31 If trips are not scheduled during the initial call, the booking is put on a wait list until such a time when it can be scheduled, or else the booking is refused. Relatively low numbers of those interviewed had much experience of the wait list with 19% of current users being ‘wait listed’ some of the time. Over 50% of users across three of the four groups reported never being ‘wait listed’, the exception being carers of lapsed users where 49% reported being wait listed some of the time or more often.
FIGURE 4.13 USERS: DO YOU EVER GET PUT ON THE WAIT LIST FOR YOUR TRIPS?
0%
10%
20%
30%
40%
50%
60%
70%
80%
90%
100%
All of the time Most of the time Some of the time Rarely Never Don't know
User - User (148) User - Carer (27) Lapsed - User (127) Lapsed - Carer (49)
Whilst most people are never put
on the wait list, around 10% claim
to experience this most or all of
the time.
4.32 Those respondents who had experienced the wait list were asked what usually happens as a result of this. 28% of current users and 27% of lapsed reported having their trip booked for the time they requested or being offered an alternative time. 30% and 41% of these two groups respectively are later unsuccessful with their booking request.
FIGURE 4.14 USERS WHO ARE ‘WAIT LISTED’: IF YOU ARE PUT ON THE WAIT LIST, WHAT NORMALLY HAPPENS?
0%10%20%30%40%50%60%70%80%90%
100%
My trip is booked
later that day for
the time I
requested
I am offered an
alternative time
on the same day I
requested
Dial-a-Ride phone
me to tell me they
have been unable
to schedule my trip
I do not hear from
Dial-a-Ride again
so assume my trip
has not been
booked
Other Don't Know
User - User (40) User - Carer (6) Lapsed - User (22) Lapsed - Carer (24)
Of those who get put on the wait list,
the majority cannot book the trip they
want, with 20% claiming not to hear
from Dial-a-Ride again.

4.33 Carers of current users most commonly reported being unsuccessful following being informed that their request was on the wait list (50%), with this rising to 63% of carers of lapsed users.
4.34 Around 20% across all four groups claim that their trip is neither confirmed nor cancelled following the wait list process. This is consistent with current Dial-a-Ride policy whereby those wait-listed for normal day-before trips are only contacted if their trip can be arranged, be it for the exact time they requested or for an alternative time. Those who are wait listed for advanced trips however are contacted in all cases – these therefore make up the group who say ‘Dial-a-Ride phone me back to tell me they have been unable to schedule my trip’.
4.35 Figure 4.15 shows the responses to the question on alternative arrangements if a booking is refused.
FIGURE 4.15 USERS: IF YOUR BOOKING IS REFUSED SO THAT YOU ARE UNABLE TO TRAVEL AT ALL, WHAT DO YOU NORMALLY DO INSTEAD?
0%10%20%30%40%50%60%70%80%90%
100%
Use
another
door-to-
door
service
(eg.
Taxicard,
Capital Call)
Use a bus Use tube Use a train Use a tram Use a taxi Use a car Ask a friend
/ relative
to take you
You're
unable to
make the
trip
Other Don't know
User - User (131) User - Carer (25) Lapsed - User (113) Lapsed - Carer (48)
Approximately equal numbers will use a taxi or just
not be able to make their trip if their booking with
Dial-a-Ride is refused. No respondents at all claimed
to then use the tube or a train.
4.36 Around a third of all respondents reported that they used a taxi to make their trip if Dial-a-Ride were unable to take their booking. This is perhaps somewhat surprising given the economic profile of many Dial-a-Ride users; there is the potential that respondents (or indeed callers) mistakenly claimed to use a taxi when they were instead referring to use of Taxicard. Between 5% and 13% reported using an alternative Door to Door service such as Taxicard or Capital Call explicitly.
4.37 Large numbers of respondents reported not making the trip at all if Dial-a-Ride were unable to take their booking. This suggests a high dependency on the service, particularly amongst current users where 43% gave this response together with 40% of their carers.

Non-Users
4.38 Non-users were asked a series of questions about their usage of other modes of transport together with their overall perception of Dial-a-Ride.
4.39 Most non-users (84%) did not use any door to door service offered by Transport for London at present.
FIGURE 4.16 NON-USERS: DO YOU EVER USE ANY OTHER DOOR-TO-DOOR SERVICES OFFERED BY TRANSPORT FOR LONDON?
0%
10%
20%
30%
40%
50%
60%
70%
80%
90%
100%
TaxiCard Capital Call Other No
Non-Users (100)
The vast majority of Non-Users do
not use any other door-to-door
service either. This highlights that
far fewer Non-Users are
dependant on services such as Dial-
4.40 High numbers of non-users (59%) reported using buses for their travel around London. The Underground, trains and trams were reported as less well used.
FIGURE 4.17 NON-USERS: WHAT OTHER MODES OF TRANSPORT DO YOU TYPICALLY USE FOR TRAVEL WITHIN LONDON?
0%
10%
20%
30%
40%
50%
60%
70%
80%
90%
100%
Bus Tube Train Tram Taxi Car - drive
myself
Car - friend /
relative driving
Non-Users (66)
There is a wide spread of
alternativ modes used by Non-
Users, with Bus the most
popular.

Non-Users Interest in Dial-a-Ride
4.41 Most non-users were potentially interested in using Dial-a-Ride with 78% responding positively.
FIGURE 4.18 NON-USERS: DOES DIAL-A-RIDE SOUND LIKE SOMETHING YOU WOULD BE INTERESTED IN USING?
0%
10%
20%
30%
40%
50%
60%
70%
80%
90%
100%
Yes - Definitely Yes - Maybe Not sure No - But interested in
hearing more anyway
Don't Know
Non-Users (96)
The majority of Non-Users would
potentially be interested in using
the service offered by Dial-a-Ride.
4.42 The main reasons for non use amongst this group tended to be because alternative travel arrangements were available: 14% stated using public transport, 7% used another door to door service, 29% had access to a car and 16% could get a lift from a friend or relative. Relatively small numbers cited reasons related to the booking process or Dial-a-Ride system as a whole.
FIGURE 4.19 NON-USERS: WHAT ARE THE MAIN REASONS FOR YOU NOT CURRENTLY USING THE DIAL-A-RIDE SERVICE?
0%10%
20%30%
40%50%60%
70%80%
90%100%
Can't get
a regular
booking
Booking
process
takes too
long
Can only
book short
trips
Unfamiliar
with staff
I use a
different
door-to-
door
service
I have no
need for
the
service
Never
heard of
Dial-a-Ride
before
now
I use
public
transport
I have
access to
a car
I have
friends /
relatives
who take
me places
Wasn't
aware I
was
eligible
Other
Non-Users (90)
There are a wide range of reasons for Non-
Users not using the service, though having
access to other forms of transportation is the
most frequent. Over 15% however did not
know they were eligible to use Dial-a-Ride.

5 Dial-a-Ride Service Level Attributes 5.1 In this chapter we describe the responses to the single attribute and combined
attribute questions. We also describe the analysis techniques that have been used and key conclusions emerging from this work.
Analysis Measure
5.2 As discussed in chapter 3, respondents were asked to score single and combined changes made to various aspects of the Dial-a-Ride booking system on a scale of 1 to 5, with 1 being ‘much better than the current system’ and 5 being ‘much worse than the current system’.
5.3 This scale was firstly transformed into a scale from -2 to 2, with a positive number representing a preference for the change over the base position calculated thus:
P = (2*B + b – w – 2*W)
Where:
P = Measure of preference;
B = proportion of respondents who indicated option would be ‘much better’ than current system;
b = proportion of respondents who indicated option would be ‘slightly better’ than current system;
w = proportion of respondents who indicated option would be ‘slightly worse’ than current system;
W = proportion of respondents who indicated option would be ‘much worse’ than current system;
5.4 Note that the wording for non-users specifies an improved likelihood of using Dial-a-Ride as opposed to a general improvement in the system, but this is treated as effectively the same response to allow direct comparison here.
5.5 This measure is discussed in relation to responses individual questions throughout this chapter.
Individual Attribute Question Responses
5.6 The table below details this measure of preference for each of the individual attribute questions. This is segmented by current user, carer of current user, lapsed user, carer of lapsed user and non-user.

TABLE 5-1 RESPONDENTS' PREFERENCES TO INDIVIDUAL ATTRIBUTE QUESTIONS
RESPONDENT TYPE
Code Question User Carer of User Lapsed-UserCarer of
Lapsed-User TOTAL User Non-User
Q11(1) What if it didn't matter when in the day you called, you had the same chance of a successful booking? 1.20 1.19 1.20 1.27 1.21 1.00
Q11(2) What if you had to wait until later in the day to receive confirmation or refusal of your booking? -0.49 -0.20 -0.50 -0.23 -0.43 -0.34
Q11(3) What if you could only book time critical appointments up to one week in advance? 0.41 0.25 0.60 0.53 0.49 0.62
Q11(4) What if you could book any trip (including non time critical) up to one week in advance? 1.11 1.20 1.15 1.25 1.15 1.09
Q11(6) What if you could always get through to DaR on the first attempt, but had to wait on hold until an operator became free?
0.51 1.04 0.55 0.63 0.58 0.78
5.7 For example, an ‘average user’ would rate a system where it didn’t matter when in the day you called, you had the same chance of a successful booking (Q11(1)), as better than the current system. This is indicated by the high score of 1.21 out of a possible maximum score of 2. Carers of lapsed users responded the most favourably to this change giving it an average score of 1.27 out of 2.
Summary of Results
5.8 Some clear positive and negative features with regards the individual booking system attributes emerge from the questionnaires responses. These are described below. In each case we show the distribution of responses and also the average scores.
What if it didn’t matter when in the day you called, you had the same chance of a successful booking?
5.9 Both users and non-users were positive about the ability to call throughout the day and still have the same chance of a successful booking, though users somewhat more so than non-users.
FIGURE 5.1 WHAT IF IT DIDN'T MATTER WHEN IN THE DAY YOU CALLED YOU HAD THE SAME CHANCE OF A SUCCESSFUL BOOKING?
0%
10%
20%
30%
40%
50%
60%
70%
Much better than
current system
Slightly better than
current system
No difference Slightly worse than
current system
Much worse than
current system
Don't know
User - User (148) User - Carer (27) Lapsed - User (127) Lapsed - Carer (49) Non-User (100)
User
Carer of User
Lapsed-User
Carer of Lapsed-User
Non-User
1.20
1.19
1.20
1.27
1.00

5.10 For users, changing the system so that it is not necessary to call first thing in the morning is the most important change which could be made, though the ability to book any trip in advance is slightly more important to non-users (see below). Having had no direct exposure to the system however, non-users may be slightly under-estimating the inconvenience to themselves of having, or at least the perception of having, to call first thing in the morning.
What if you had to wait until later in the day to receive confirmation or refusal of your booking?
5.11 Both users and non-users would find waiting for confirmation (or refusal) of their booking a large disbenefit, though users find this slightly worse than non-users. This could be explained by the fact that more users are dependant on services such as Dial-a-Ride. Only 19% of users stated that they, or someone in their household, drives a car compared to 56% of non-users; 37% of users also say that they would be unable to make their trip if their booking with Dial-a-Ride was refused, thus potentially increasing the anxiety of not knowing whether their booking can be accepted or not.
5.12 This question was asked in isolation (as with all single attribute questions) without any further explanation of what this might also involve. An implicit benefit of such a system could be a reduction in average call length and therefore a reduction in the associated cost of booking a trip with Dial-a-Ride; many respondents would not have been aware of this additional benefit.
FIGURE 5.2 WHAT IF YOU HAD TO WAIT UNTIL LATER IN THE DAY TO RECEIVE CONFIRMATION OR REFUSAL OF YOUR BOOKING?
0%
10%
20%
30%
40%
50%
60%
70%
Much better than
current system
Slightly better than
current system
No difference Slightly worse than
current system
Much worse than
current system
Don't know
User - User (148) User - Carer (27) Lapsed - User (127) Lapsed - Carer (49) Non-User (100)
User
Carer of User
Lapsed-User
Carer of Lapsed-User
Non-User
-0.49
-0.20
-0.50
-0.23
-0.34
What if you could only book time critical appointments up to one week in advance?
5.13 Both users and non-users would find only being able to book time critical appointments one week in advance, as opposed to two weeks in advance as you can now, better than the current system which is somewhat counter-intuitive. Initially it was thought this was due to misunderstanding as the current situation was not made as clear in the pilot as in the main fieldwork. However, the rating of preference for this given by users in the pilot was 0.41 compared to 0.49 in the main fieldwork. This demonstrates that users from the main fieldwork actually found this more preferable when compared to those in the pilot.

5.14 A possible explanation may be that people feel they have to book two weeks in advance in order to get the booking they want, when they may not know in advance exactly when they wish to go. Thus this could make two weeks in advance more of a burden than a benefit. Further in depth interviews with users may highlight whether such issues do indeed exist, or whether this was in fact more a case of misunderstanding of the current situation.
FIGURE 5.3 WHAT IF YOU COULD ONLY BOOK TIME CRITICAL APPOINTMENTS UP TO ONE WEEK IN ADVANCE?
0%
10%
20%
30%
40%
50%
60%
70%
Much better than
current system
Slightly better than
current system
No difference Slightly worse than
current system
Much worse than
current system
Don't know
User - User (148) User - Carer (27) Lapsed - User (127) Lapsed - Carer (49) Non-User (100)
User
Carer of User
Lapsed-User
Carer of Lapsed-User
Non-User
0.41
0.25
0.60
0.53
0.62
5.15 These issues were raised in two Local Area Panel (LAP) meetings held by Dial-a-Ride to try to ascertain whether this is indeed a true preference or if there is some element of misunderstanding clouding the results. Details of the outcomes from these discussions can be found in the appendix to this report.
What if you could only book any trip (including non time critical) up to one week in advance?
5.16 All user types were very positive about being able to book any trip up to one week in advance. Indeed for non-users, this is seen as the most important aspect which could change.
FIGURE 5.4 WHAT IF YOU COULD BOOK ANY TRIP (INCLUDING NON TIME-CRITICAL) UP TO ONE WEEK IN ADVANCE?
0%
10%
20%
30%
40%
50%
60%
70%
Much better than
current system
Slightly better than
current system
No difference Slightly worse than
current system
Much worse than
current system
Don't know
User - User (148) User - Carer (27) Lapsed - User (127) Lapsed - Carer (49) Non-User (100)
User
Carer of User
Lapsed-User
Carer of Lapsed-User
Non-User
1.11
1.20
1.15
1.25
1.09

5.17 There is also a slight difference between users who do or do not currently make advanced bookings, with those who say they never make advanced booking rating this as 0.99 whereas those who do make such trips rating this as 1.20. This is to be expected, as those who already make advanced bookings are more likely to want to make bookings in advance generally.
5.18 However, discussion in the two Local Area Panel meetings attended suggested that the preference for booking all trips in advance is not quite as strong as it appears here. Indeed this is also highlighted in some of the multiple attribute question responses detailed later in this chapter. As such, some caution should be observed in interpreting these results – certainly more research would be beneficial before implementing such a change to the booking procedures.
What if you could always get through to Dial-a-Ride on the first attempt but had to wait on hold until an operator became free?
5.19 In general, people would prefer to wait on hold rather than have to continually call up until you can through to an operator, though the preference for this is not as strong as for some of the other proposed changes.
FIGURE 5.5 WHAT IF YOU COULD ALWAYS GET THROUGH TO DIAL-A-RIDE ON THE FIRST ATTEMPT BUT HAD TO WAIT ON HOLD UNTIL AN OPERATOR BECAME FREE?
0%
10%
20%
30%
40%
50%
60%
70%
Much better than
current system
Slightly better than
current system
No difference Slightly worse than
current system
Much worse than
current system
Don't know
User - User (148) User - Carer (27) Lapsed - User (127) Lapsed - Carer (49) Non-User (100)
User
Carer of User
Lapsed-User
Carer of Lapsed-User
Non-User
0.51
1.04
0.55
0.63
0.78
Multiple Attribute Question Responses
5.20 In this section we present the results from the multiple attribute questions, where respondents were asked to rate changes to more than one attribute change at a time. The objective of this was to establish a measurement for each combination of attributes that could then be compared against the individual ones reported in the previous section.

TABLE 5-2 RESPONDENTS' PREFERENCES TO MULTIPLE ATTRIBUTE QUESTIONS
RESPONDENT TYPE
Code Question User Carer of User Lapsed-UserCarer of
Lapsed-User TOTAL User Non-User
Q12(1) What if you had to wait until later in the day to receive confirmation of your booking & you were more likely to be able to book the trip you want?
0.27 0.83 0.29 0.81 0.39 0.16
Q12(2) What if you had to wait until later in the day to receive confirmation of your booking & the system was changed so that it didn't matter when in the day you called, you had the same chance of a successful booking?
0.63 1.00 0.63 1.26 0.73 0.73
Q12(3) What if you could book any trip up to one week in advance & you had to wait until the day before your trip to receive confirmation or refusal of your booking?
-0.44 -0.21 -0.20 0.13 -0.25 0.03
Q12(4) What if you could book any trip up to one week in advance & the booking lines closed at 12 noon the day before?
-0.38 0.07 -0.22 0.31 -0.16 0.17
5.21 The preference for any multiple trade-off changes is, as expected, not as strong as for the individual attributes, though there are still some significant results.
What if you had to wait until later in the day to receive confirmation or refusal of your booking and you were more likely to be able to book the trip you want?
5.22 Overall people would be prepared to wait for booking confirmation if it meant they were more likely to get the trip they want. Users are more favourable to this option, though they are also more polarised, with significantly more users finding this 'much worse than the current system' than non-users. Clearly the exact quantification of 'more likely to be able to book the trip you want' is subject to individual judgement, so there may be a risk of people expecting 100% of their trips to be confirmed given they have the large inconvenience of waiting for confirmation.
FIGURE 5.6 WHAT IF YOU HAD TO WAIT UNTIL LATER IN THE DAY TO RECEIVE CONFIRMATION OR REFUSAL OF YOUR BOOKING AND YOU WERE MORE LIKELY TO BE ABLE TO BOOK THE TRIP YOU WANT?
0%
10%
20%
30%
40%
50%
60%
70%
Much better than
current system
Slightly better than
current system
No difference Slightly worse than
current system
Much worse than
current system
Don't know
User - User (75) User - Carer (12) Lapsed - User (60) Lapsed - Carer (22) Non-User (54)
User
Carer of User
Lapsed-User
Carer of Lapsed-User
Non-User
0.27
0.83
0.29
0.81
0.16

5.23 Such a scenario would most likely allow a degree of batch scheduling which in turn would increase the likelihood of trips being accepted. It should be noted however, that whilst this would certainly be true at an overall aggregate level, there is a possibility that such scheduling could negatively impact of those who make atypical or long distance trips. In such cases, whereas they could be allocated a bus if booking was made sufficiently early in the scheduling in the current system, a move to a batch scheduling system could potentially reduce the number of such trips accepted in favour of more widely used or shorter distance routes.
5.24 There is also a relatively clear, and expected, link between those who feel they have their trips refused often compared to those who never have them refused. Those who say their normal day-before trips are never refused (34%) still find this beneficial (rating of 0.27) though those who claim to be refused all or most of the time (22%) rate this as 0.56.
What if you had to wait until later in the day to receive confirmation or refusal of your booking but the system was changed so that it didn’t matter when in the day you called, you had the same chance of a successful booking?
5.25 Both users and non-users find the benefit of being able to call at any time during the day as opposed to feeling they must call early in the morning, far outweighs the disbenefit of having to wait until later in the day to receive confirmation of their booking.
5.26 This is consistent with the responses to the earlier individual questions, where although the largest disbenefit was seen for waiting for confirmation, the largest benefit (for users at least) was seen for being able to call at any time.
FIGURE 5.7 WHAT IF YOU HAD TO WAIT UNTIL LATER IN THE DAY TO RECEIVE CONFIRMATION OR REFUSAL OF YOUR BOOKING BUT THE SYSTEM WAS CHANGED SO THAT IT DIDN'T MATTER WHEN IN THE DAY YOU CALLED, YOU HAD THE SAME CHANCE OF A SUCCESSFUL BOOKING?
0%
10%
20%
30%
40%
50%
60%
70%
Much better than
current system
Slightly better than
current system
No difference Slightly worse than
current system
Much worse than
current system
Don't know
User - User (75) User - Carer (13) Lapsed - User (63) Lapsed - Carer (20) Non-User (53)
User
Carer of User
Lapsed-User
Carer of Lapsed-User
Non-User
0.63
1.00
0.63
1.26
0.73
What if you could book any trip up to one week in advance but you had to wait until later in the day to receive confirmation or refusal of your booking?
5.27 There is a split of opinion between users and non-users as to whether booking in advance is more important than waiting for confirmation or not, though neither have particularly conclusive views on this.
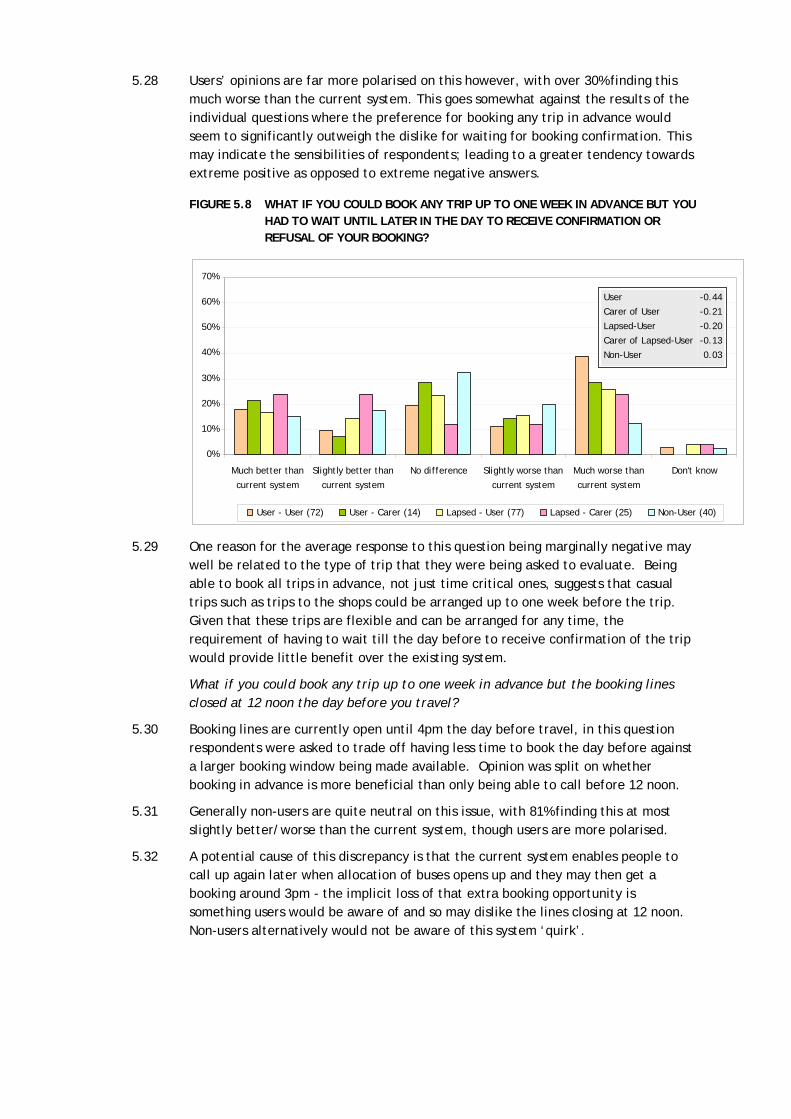
5.28 Users’ opinions are far more polarised on this however, with over 30% finding this much worse than the current system. This goes somewhat against the results of the individual questions where the preference for booking any trip in advance would seem to significantly outweigh the dislike for waiting for booking confirmation. This may indicate the sensibilities of respondents; leading to a greater tendency towards extreme positive as opposed to extreme negative answers.
FIGURE 5.8 WHAT IF YOU COULD BOOK ANY TRIP UP TO ONE WEEK IN ADVANCE BUT YOU HAD TO WAIT UNTIL LATER IN THE DAY TO RECEIVE CONFIRMATION OR REFUSAL OF YOUR BOOKING?
0%
10%
20%
30%
40%
50%
60%
70%
Much better than
current system
Slightly better than
current system
No difference Slightly worse than
current system
Much worse than
current system
Don't know
User - User (72) User - Carer (14) Lapsed - User (77) Lapsed - Carer (25) Non-User (40)
User
Carer of User
Lapsed-User
Carer of Lapsed-User
Non-User
-0.44
-0.21
-0.20
-0.13
0.03
5.29 One reason for the average response to this question being marginally negative may well be related to the type of trip that they were being asked to evaluate. Being able to book all trips in advance, not just time critical ones, suggests that casual trips such as trips to the shops could be arranged up to one week before the trip. Given that these trips are flexible and can be arranged for any time, the requirement of having to wait till the day before to receive confirmation of the trip would provide little benefit over the existing system.
What if you could book any trip up to one week in advance but the booking lines closed at 12 noon the day before you travel?
5.30 Booking lines are currently open until 4pm the day before travel, in this question respondents were asked to trade off having less time to book the day before against a larger booking window being made available. Opinion was split on whether booking in advance is more beneficial than only being able to call before 12 noon.
5.31 Generally non-users are quite neutral on this issue, with 81% finding this at most slightly better/worse than the current system, though users are more polarised.
5.32 A potential cause of this discrepancy is that the current system enables people to call up again later when allocation of buses opens up and they may then get a booking around 3pm - the implicit loss of that extra booking opportunity is something users would be aware of and so may dislike the lines closing at 12 noon. Non-users alternatively would not be aware of this system ‘quirk’.

FIGURE 5.9 WHAT IF YOU WERE ABLE TO BOOK ANY TRIP UP TO ONE WEEK IN ADVANCE BUT THE BOOKING LINES CLOSED AT 12 NOON THE DAY BEFORE YOU TRAVEL?
0%
10%
20%
30%
40%
50%
60%
70%
Much better than
current system
Slightly better than
current system
No difference Slightly worse than
current system
Much worse than
current system
Don't know
User - User (74) User - Carer (15) Lapsed - User (54) Lapsed - Carer (31) Non-User (53)
User
Carer of User
Lapsed-User
Carer of Lapsed-User
Non-User
-0.38
0.07
-0.22
0.31
0.17
Interdependency of Attributes
5.33 By design the multiple attribute questions are combinations of the individual attribute questions, albeit combined in some cases with additional caveats. As such, direct comparison of these results to those of the individual attribute questions can give an indication of the true comparable preference of these questions as opposed to the face-value figures.
5.34 There are two key attributes which feature heavily in the multiple attribute trade-off’s:
I Waiting for confirmation or refusal of your booking; and
I The booking window for different types of trips.
Waiting for Confirmation or Refusal of Booking
5.35 As an individual attribute change, users were very negative to the prospect of having to wait for confirmation or refusal of their trip. It should be noted that respondents were informed here that for advanced bookings they would need to wait until the day before travel to receive confirmation or refusal of their booking. In practical terms there may be potential to arrange trips in smaller batches and to update this process continually until buses are filled up. As such, the specification included in the research is considered to be the most pessimistic of the likely scenarios.
5.36 The negative response here is common across all user types as demonstrated in the figure overleaf which details the level of concern respondents’ would feel should they be required to wait for booking confirmation.

FIGURE 5.10 IMAGINE YOU HAD TO WAIT TILL LATER IN THE DAY FOR CONFIRMATION OR REFUSAL OF YOUR BOOKING, OR FOR ADVANCED BOOKINGS, UNTIL THE DAY BEFORE YOU TRAVELLED. HOW WOULD THIS MAKE YOU FEEL?
0%
5%
10%
15%
20%
25%
30%
35%
40%
Very confident your
booking would be made
Quite confident your
booking would be made
Neutral Quite concerned your
booking would not be
made
Very concerned your
booking would not be
made
User - User (131) User - Carer (25) Lapsed - User (113) Lapsed - Carer (48) Non-Users (76)
5.37 However as demonstrated Figure 5.11, this disbenefit is outweighed by the benefit of being able to call at any point throughout the day, or by the benefit of an increased likelihood of having your trip accepted. The one attribute which is not deemed to be more important than waiting for booking confirmation (for users) is the ability to book any trip up to one week in advance. These results are illustrated in Figure 5.11 - the score for the single attribute question is shown in the first set of bars for users and non-users respectively, with the three multiple attribute question responses shown to the right of this.
FIGURE 5.11 WAITING FOR CONFIRMATION OF REFUSAL OF BOOKINGS
0.39
0.73
-0.34
0.16
0.73
0.03-0.43 -0.25
-0.60
-0.40
-0.20
0.00
0.20
0.40
0.60
0.80
What if you had to wait untillater in the day to receiveconfirmation or refusal of
your booking?
What if you had to wait untillater in the day to receive
confirmation of your booking& you were more likely to be
able to book the trip youwant?
What if you had to wait untillater in the day to receive
confirmation of your booking& the system was changed sothat it didn't matter when inthe day you called, you had
the same chance of asuccessful booking?
What if you could book anytrip up to one week in
advance & you had to waituntil the day before your trip
to receive confirmation orrefusal of your booking?
Pref
eren
ce M
easu
re
Users Non Users
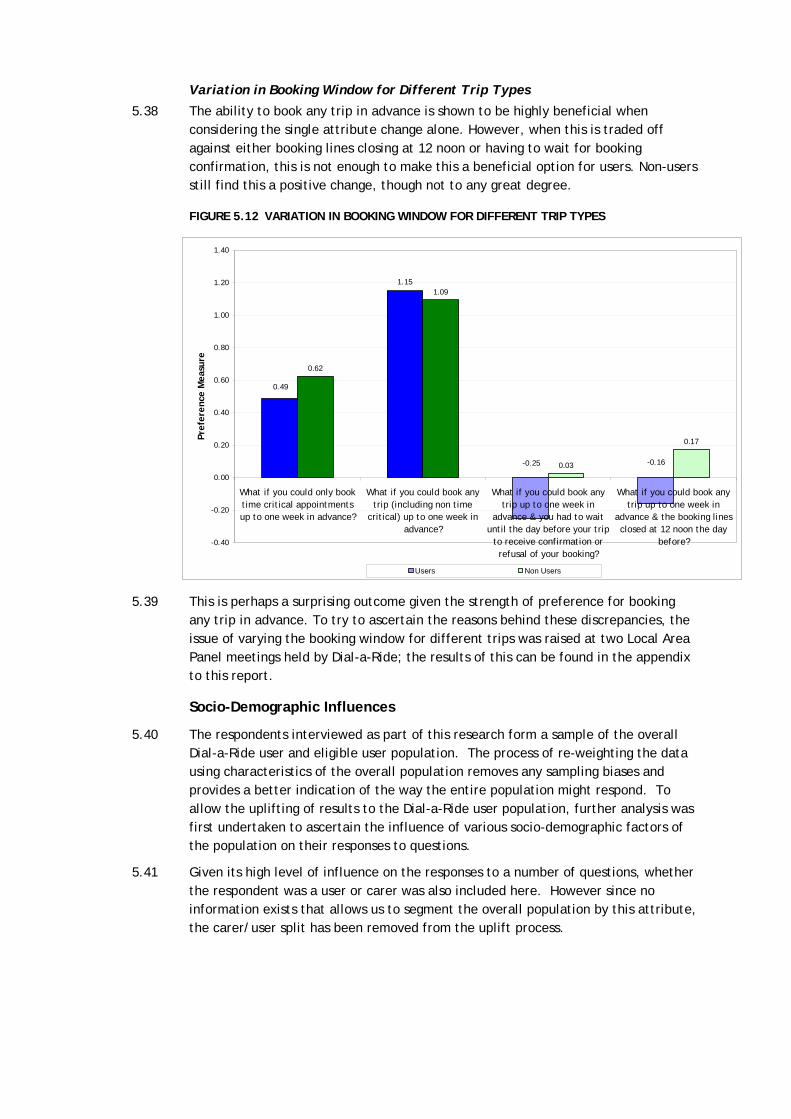
Variation in Booking Window for Different Trip Types
5.38 The ability to book any trip in advance is shown to be highly beneficial when considering the single attribute change alone. However, when this is traded off against either booking lines closing at 12 noon or having to wait for booking confirmation, this is not enough to make this a beneficial option for users. Non-users still find this a positive change, though not to any great degree.
FIGURE 5.12 VARIATION IN BOOKING WINDOW FOR DIFFERENT TRIP TYPES
1.15
0.62
1.09
0.03
0.17
0.49
-0.16-0.25
-0.40
-0.20
0.00
0.20
0.40
0.60
0.80
1.00
1.20
1.40
What if you could only booktime critical appointmentsup to one week in advance?
What if you could book anytrip (including non time
critical) up to one week inadvance?
What if you could book anytrip up to one week in
advance & you had to waituntil the day before your trip
to receive confirmation orrefusal of your booking?
What if you could book anytrip up to one week in
advance & the booking linesclosed at 12 noon the day
before?
Pref
eren
ce M
easu
re
Users Non Users
5.39 This is perhaps a surprising outcome given the strength of preference for booking any trip in advance. To try to ascertain the reasons behind these discrepancies, the issue of varying the booking window for different trips was raised at two Local Area Panel meetings held by Dial-a-Ride; the results of this can be found in the appendix to this report.
Socio-Demographic Influences
5.40 The respondents interviewed as part of this research form a sample of the overall Dial-a-Ride user and eligible user population. The process of re-weighting the data using characteristics of the overall population removes any sampling biases and provides a better indication of the way the entire population might respond. To allow the uplifting of results to the Dial-a-Ride user population, further analysis was first undertaken to ascertain the influence of various socio-demographic factors of the population on their responses to questions.
5.41 Given its high level of influence on the responses to a number of questions, whether the respondent was a user or carer was also included here. However since no information exists that allows us to segment the overall population by this attribute, the carer/user split has been removed from the uplift process.

5.42 The respondents’ choices for each individual question were used as dependant variables to construct linear regression models based upon multiple socio-demographic independent variables. In such models the constant indicates the preference of an ‘average user’ with any additional attributes indicating a statistically significant variation from this base preference according to our specified socio-demographic groupings.
5.43 The different socio-demographic groupings that were tested were:
I User/Carer – With the base position being that the respondent was a user;
I Age – The base age range was between 75 and 79 years old (the modal group of our sample population). Other age groups considered were ‘Under 55’, ’55 to 69’, ’70 to 74’, ’80 to 84’, ’85 to 89’ and ’90 and over’.
I Disability – This was split into two groups, mobility impaired and non-mobility impaired with these forming the base and alternative positions respectively.
I Area of residence – The base position was for the area of residence to be unknown. Boroughs were then grouped into geographic areas throughout London. The two areas found to be significant in our analysis were North London (comprising Barnet and Enfield) and South East London (comprising Bexley, Bromley, Croydon and Greenwich).
5.44 The results from this analysis are presented in the following table. This analysis shows for example that an ‘average user’ would rate a system where you had to wait for confirmation of your booking but it didn’t matter when in the day you called, you had the same chance of a successful booking (Q12(2)), as significantly beneficial. This is indicated by the high score of 0.63. In addition to this, carers (as opposed to users) find this even more preferable, indicated by their rating of 1.16.
5.45 The number of respondents who fall into the disaggregated categories shown are displayed in the brackets. Note these are not mutually exclusive hence respondents could be included as part of multiple categories. Wherever a cell is left blank, this indicates that no statistically significant difference to the base position was found for responses from individuals in this sub-category.

TABLE 5-3 USERS (CURRENT + LAPSED): SOCIO-DEMOGRAPHIC RESULTS
Other Socio-demographic Attributes
Code Question Constant CarerAge -
Under 55Age - 55
to 69
Disability - Non
Mobility Impaired
Residence -North
Residence -South East
Q11(1) What if it didn't matter when in the day you called, you had the same chance of a successful booking? 1.15 (351) - - 1.50 (59) - - -
Q11(2) What if you had to wait until later in the day to receive confirmation or refusal of your booking?
-0.45 (351) -0.10 (76) - - - -0.88 (47) -
Q11(3) What if you could only book time critical appointments up to one week in advance?
0.49 (351) - - - - - -
Q11(4) What if you could book any trip (including non time critical) up to one week in advance? 1.16 (351) - - 1.45 (59) - - 0.71 (58)
Q11(6) What if you could always get through to DaR on the first attempt, but had to wait on hold until an operator became free?
0.54 (351) - 0.95 (40) - - - -
Q12(1) What if you had to wait until later in the day to receive confirmation of your booking & you were more likely to be able to book the trip you want? 0.39 (169) - - - - - -
Q12(2) What if you had to wait until later in the day to receive confirmation of your booking & the system was changed so that it didn't matter when in the day you called, you had the same chance of a successful booking? 0.63 (171) 1.16 (33) - - - - -
Q12(3) What if you could book any trip up to one week in advance & you had to wait until the day before your trip to receive confirmation or refusal of your booking?
-0.39 (188) - - - 0.18 (44) - -
Q12(4) What if you could book any trip up to one week in advance & the booking lines closed at 12 noon the day before? -0.31 (174) - - - 0.32 (39) - -
*A significance level of 10% was used within this analysis
Differential Responses
5.46 Carers were found to have significantly different responses to the base group of users across two key questions: waiting later in the day for a response and the combination of this with being able to call at any time during the day with an equal chance of a successful booking. In both cases they responded more favourably than the base group of users.
5.47 The impact of age can be seen to affect three of the single attribute questions. The younger Dial-a-Ride users were more inclined to prefer a telephone system that allowed them to hold until an operator became free. Their response to this question was the highest amongst all the groups. Those in the age range 55 to 69 years were more sensitive to being able to call at any time with an equal chance of a successful booking, again valuing this highest of all the segmentations at 1.50 as compared to 1.15 for the average user in other age groups.
5.48 Those with disabilities other than mobility impairments had significant responses to two of the combined attribute questions. In both cases they viewed each of the changes positively whilst the average user with a mobility impairment valued them negatively.
5.49 Finally the geographical segmentation has had an impact on two of the individual attributes: waiting till later in the day for confirmation and booking any trip up to a week in advance. Residents of northern boroughs perceived the delay in confirmation as the most negative.
Dial-a-Ride Population Uplifting
5.50 Data with regards the socio-demographic make-up of the Dial-a-Ride user base was provided which has allowed these results to be uplifted to the population as a whole. This analysis allows us to confirm (or disparage) the robustness of our questionnaire sample. The result of this uplifting process is shown in the following table for users only.
5.51 Given the highly representative nature of the sample group (as discussed in chapter 4), the expectation was for very few differences between the sample and forecast population responses.
5.52 This is indeed the result of this weighting, particularly with regard the single attribute questions, where the largest discrepancy from the sample response is 0.02 for the question ‘What if it didn’t matter when in the day you called, you had the same chance of a successful booking?’ The cause of this slight difference is the slightly inflated number of people in the age range 55 to 69 who were in our sample though this is certainly not extreme. As such, it is reasonable to assume no major bias here in our sample.
5.53 The final two questions however do display quite large differences. The reason for this discrepancy however is the balance of people classed as having a mobility related disability or not. Whilst our sample contains 63% classified with such a disability, the overall Dial-a-Ride population only contains 53%.

TABLE 5-4 USERS: RESPONSES TO ATTRIBUTE RATING QUESTIONS
Code QuestionSAMPLE RESPONSE
(Actual)
POPULATION WEIGHTING (Forecast)
Q11(1) What if it didn't matter when in the day you called, you had the same chance of a successful booking? 1.21 1.19
Q11(2) What if you had to wait until later in the day to receive confirmation or refusal of your booking? -0.43 -0.43
Q11(3) What if you could only book time critical appointments up to one week in advance? 0.49 0.49
Q11(4) What if you could book any trip (including non time critical) up to one week in advance? 1.15 1.14
Q11(6) What if you could always get through to DaR on the first attempt, but had to wait on hold until an operator became free?
0.58 0.58
Q12(1) What if you had to wait until later in the day to receive confirmation of your booking & you were more likely to be able to book the trip you want?
0.39 0.39
Q12(2) What if you had to wait until later in the day to receive confirmation of your booking & the system was changed so that it didn't matter when in the day you called, you had the same chance of a successful booking?
0.73 0.73
Q12(3) What if you could book any trip up to one week in advance & you had to wait until the day before your trip to receive confirmation or refusal of your booking?
-0.25 -0.12
Q12(4) What if you could book any trip up to one week in advance & the booking lines closed at 12 noon the day before?
-0.16 -0.01
5.54 In both cases, this user group was identified through our regression analysis to be more likely to be favourable to these final two options. As discussed in chapter 4 however, the vast majority of all user types suffer from some form of mobility impairment and this categorisation is somewhat judgemental. As such any differences between our sample and the official disability listings from the Dial-a-Ride database may not necessarily be real differences, rather differences in individuals’ perceptions. However the magnitudes of the r3esponse between the weighted and unweighted scores are comparable, with both being perceived as marginally negative and we would therefore not attach any great significance to the variation in result.
Other Influential Factors
5.55 Whilst we cannot use the responses to non socio demographic questions to re-weight the dataset to the level of the Dial-a-Ride population, analysis of whether these factors have any significant influence still provides useful insight into the drivers of users’ responses. The table overleaf displays the results of this analysis. The number of respondents who fall into the disaggregated categories shown are displayed in the brackets. Note these are not mutually exclusive hence respondents could be included as part of multiple categories.

5.56 The following factors were considered in this analysis and found to be statistically significant in one or more of the questions:
I Experience of the wait list;
I Types of trips booked;
I Ease of understanding the current system;
I Experience of booking refusals; and
I Frequency of trip bookings by type.
5.57 In addition to these, the following factors were found not to be significant in determining individuals’ responses to any of the questions:
I Time since last booking;
I Time of day users call Dial-a-Ride; and
I Alternatives should booking be refused.
5.58 Many of these responses seem very logical, for example those who already find the current booking system difficult to understand are less receptive to having to wait for confirmation as this may well be viewed as yet more complication for an already confusing system. Equally, those who make ad-hoc bookings see the benefit of being able to book in advance to be less than average as they are less likely to want to plan trips so far in advance.
5.59 It is perhaps surprising however that some other factors were not shown to be significant, particularly the alternatives people have to Dial-a-Ride. The expectation that those who are more dependent on Dial-a-Ride would find having to wait for confirmation less favourable than the average user for example has not been demonstrated here.

TABLE 5-5 USERS: OTHER INFLUENTIAL FACTORS REGRESSION
Other Influential Question Responses
Code Question ConstantPut on wait
list
Make advanced bookings
Find booking system
difficult to understand
Advanced bookings refused often
Make normal bookings at least once per week
Make ad-hoc bookings
Normal bookings refused often
Ad-hoc bookings refused often
Q11(1) What if it didn't matter when in the day you called, you had the same chance of a successful booking?
1.49 (351) 1.21 (144) 1.27 (173) 1.15 (58) - - - - -
Q11(2) What if you had to wait until later in the day to receive confirmation or refusal of your booking? -0.59 (351) - - - -0.04 (29) -0.33 (150) - - -
Q11(3) What if you could only book time critical appointments up to one week in advance?
0.39 (351) 0 (144) 0.82 (173) - 0.92 (29) - - - -
Q11(4) What if you could book any trip (including non time critical) up to one week in advance?
1.17 (351) 1.56 (144) - - 1.65 (29) - 0.94 (100) 0.86 (65) -
Q11(6) What if you could always get through to DaR on the first attempt, but had to wait on hold until an operator became free?
0.59 (351) - - - 1.21 (29) - - - -0.01 (39)
Q12(1) What if you had to wait until later in the day to receive confirmation of your booking & you were more likely to be able to book the trip you want?
0.66 (169) - - - 0.12 (17) - - - -
Q12(2) What if you had to wait until later in the day to receive confirmation of your booking & the system was changed so that it didn't matter when in the day you called, you had the same chance of a successful booking?
0.73 (171) - - - - - - - -
Q12(3) What if you could book any trip up to one week in advance & you had to wait until the day before your trip to receive confirmation or refusal of your booking?
0.25 (188) - - -0.3 (30) - - -0.31 (48) - -
Q12(4) What if you could book any trip up to one week in advance & the booking lines closed at 12 noon the day before?
-0.06 (174) - - -0.71 (27) - - - - -
*A significance level of 10% was used within this analysis
6 Conclusions 6.1 This chapter highlights the key results from the analysis undertaken with
recommendations as to the potential acceptability of different options for changes to the booking system.
Outputs from this Study
6.2 There are several attributes of the Dial-a-Ride system which have been explicitly measured in this research that would be very beneficial for all user types should they be implemented as changes. However the implicit interaction of many of these options ensures that they cannot be considered in isolation.
6.3 Furthermore other insights have emerged which may stimulate some changes in the strategy for the call centre; changes that may improve users perception of the system without making any material changes to the way they book their trips. For example, focussing on the wait list and reducing the number of users who do not have their trip re-booked may be one way to make a real difference since between 20% and 30% of current and lapsed users claimed that they were never contacted by Dial-a-Ride again after being ‘wait-listed’.
6.4 Similarly improving the level of understanding around the booking procedures may also yield benefits by potentially reducing call durations. Although this research has shown that most respondents find the system relatively user friendly and easy to understand this was not borne out at the Local Area Panel meetings where several group members said that elements of the current system were confusing.
Most Favoured Tested Attributes and Attribute Combinations
6.5 The single attributes that were rated most favourably were:
I Changing the system so that it didn’t matter when in the day you called, you had the same chance of a successful booking.
I Changing the system so you could book any trip (including non time-critical) up to one week in advance.
6.6 As presented in chapter 5, changing the system so that it did not matter when you called you still had the same chance of success, has been positively rated by all. The difficulty however is in making this aspiration a reality. In practical terms it would likely come as a result of a number of different changes to the system which users may resist in the short-term.
6.7 One potential combination of changes however did appear to be welcomed by all user types:
I Changing the system so that you had to wait until later in the day to receive confirmation of your booking, but it didn’t matter when in the day you called, you had the same chance of a successful booking.
6.8 In spite of the large perceived disbenefit of having to wait for confirmation or refusal, and the high levels of anxiety that this may cause some people, this is still something people appear willing to accept if the system was made fairer for all.
6.9 Equally, all user types in the study would accept having to wait for confirmation if this meant that they were more likely to get the trip they want, though this preference is not as strong as being able to call at any time. This perhaps is to be expected given the relatively high level of people who perceive their bookings are ‘rarely’ or ‘never’ refused. The non-quantifiable nature of this question however is open to individual interpretation and as such this response has to be considered with some caution.
6.10 Despite the high preference for being able to book any trip up to one week in advance, this does not appear to be as strong a preference as suggested. Users are not willing to accept either waiting for booking confirmation or lines closing at 12 noon in order to receive this benefit. Non-Users are more receptive, but their preference is certainly not strong, so it would appear such systems would not be easily accepted by the Dial-a-Ride clientele. Indeed if such a change was required from an operational perspective, it may be prudent to carry out further research on this topic. This further research should take the form of focus groups or using other face to face methodologies, and have the objective of ensuring that the true impact on users is well understood and some complementary measures either through marketing or education of users, used to mitigate any risks.
6.11 Other attributes, such as allowing callers to wait on hold as opposed to having to call Dial-a-Ride back, and changing the system so that time-critical trips could only be made one week in advance, also appear to be positive changes when taken in isolation. There remains an element of uncertainty over these attributes however, and the preference for them is certainly not as strong as the changes to the booking window and increasing the chance of success.
Next Steps
6.12 The results would suggest that an ideal system would be one where users had the benefit of not having to call at any particular time of the day and gaining an increased chance of a successful booking, though with the trade-off of having to wait until later in the day to receive confirmation or refusal of their bookings. Given the time required however to efficiently timetable bus routes to allow such an improvement, there may be a requirement for users to accept lines closing earlier than they currently do which is viewed as quite a strong disbenefit, to users particularly.
6.13 Such an all-encompassing option however was deemed too complicated to explain to respondents in these initial telephone-based interviews. These results demonstrate clear preferences for attributes an ideal booking system would share, but do not fully allow us to determine the true tendency of preference towards a combined option. Further research, perhaps based at a more detailed face-to-face interview level such as through discussions at Local Area Panel meetings, would allow greater time to explain such options and indeed facilitate further probing into the reasoning behind such preferences.
6.14 This could be particularly useful with regards:
I More detailed understanding of respondents’ choices.
I Further probing into questionable outcomes – particularly with regards the preference of changing the time-critical booking window from two weeks to one week.
I Facilitate discussion of more detailed, and indeed more viable, complete options and users’ responses to such changes.
6.15 Initial discussions to this effect have highlighted a particular need to ensure effective marketing strategies irrespective of the changes being made. Current users can have a natural apprehension towards changes which could potentially lead to a negative response to them. With the introduction of any new system, some teething problems during the early phases are almost inevitable, and such issues could serve to exacerbate such aggravations amongst users.
6.16 It will therefore be essential not only to comprehensively explain and communicate the benefits of any new system to users, but also ensure that the true extent of these benefits are fully realised.

APPENDIX
A
TRANSCRIPT OF USER QUESTIONNAIRE

A1.

APPENDIX
B
TRANSCRIPT OF NON-USER QUESTIONNAIRE

B1.

APPENDIX
C
USER QUESTIONNAIRE 'TOP LINES'

C1.

APPENDIX
D
NON-USER QUESTIONNAIRE 'TOP LINES'

D1.

APPENDIX
E
LOCAL AREA PANEL MEETINGS

E1. NOTES FROM LOCAL AREA PANEL MEETINGS
Dial-a-Ride host a series of Local Area Panel discussion groups throughout the year with users of the Dial-a-Ride service along with representatives from other interested organisations (e.g. Age Concern). These sessions provide Dial-a-Ride with the opportunity to communicate improvements being considered for the service, discuss potential issues arising from these, and provide attendees with an opportunity to shape the future service which Dial-a-Ride provides.
These meetings provided us with a platform to discuss issues arising from our research with particular regards to the booking window for either normal or advanced bookings. Our research showed that people were very favourable towards a system whereby you could book any trip up to one week in advance, however somewhat surprisingly respondents also reacted positively to a system whereby you could only book advanced trips one week in advanced as opposed to the current window of two weeks.
Steer Davies Gleave attended a Local Area Panel meeting for users from Camden, Hammersmith and Fulham, Kensington, Chelsea and Westminster to discuss these issues. Specific questions raised are noted below:
I How many members make use of advanced bookings at the moment?
I Dial-a-Ride are reviewing the advanced booking system and considering whether to reduce the booking window to one week. How much better or worse than the current system would this be?
I Another option is to reduce the advanced booking window to one week but extend eligibility to cover all trips, not just time critical ones. How much better or worse than the current system would this be?
Similar issues were discussed at a meeting for users in Enfield, though no specific record of answers to direct questions were recorded.
Of the 14 attendees from the first session, six claimed to use advanced booking currently. However a number of concerns over the current system, particularly with regards confusion over which trips can be booked in advance, were highly prevalent amongst the group.
When asked whether reducing the booking window for advanced trips to one week would be beneficial or not, respondents were almost unanimous that such a change would be a disbenefit to them. This response is fundamentally different to the outcome from our main research.

APPENDIX: FIGURE E1.1 WOULD REDUCING THE ADVANCED BOOKING WINDOW TO ONE WEEK BE BETTER OR WORSE THAN THE CURRENT SYSTEM?
0%
10%
20%
30%
40%
50%
60%
70%
80%
90%
Better Neutral Worse
Perc
enta
ge o
f Re
spon
dent
s
LAP Respondents Research Respondents
When asked whether reducing the booking window for advanced trips to one week but extending the normal booking window alongside this to one week would be beneficial or not, respondents were more mixed, with three immediately claiming this would be beneficial to them but still with seven saying this would be a disbenefit.
APPENDIX: FIGURE E1.2 WOULD HAVING A UNIFORM ONE WEEK BOOKING WINDOW FOR ALL TRIPS BE BETTER OR WORSE THAN THE CURRENT SYSTEM?
0%
10%
20%
30%
40%
50%
60%
70%
80%
Better Neutral Worse
Perc
enta
ge o
f Re
spon
dent
s
LAP Respondents Research Respondents

Here the response was more favourable, particularly with people seeing the benefit of removal of confusion over classification of ‘time-critical trips’, however the response was still much less strong than found in the main research.
Some responses from attendees from both panel discussions are detailed below.
APPENDIX: TABLE E1.1 LAP ATTENDEES RESPONSES
Camden, Westminster … Enfield
Having a 2 week booking window allows you to make plans and know your transport is arranged.
Would be OK to have a one week window but maybe special preference for certain things like doctors, shows or funerals.
If the benefits of changes were highlighted properly I think most people would prefer to book all requests up to 1 week in advance.
Sometimes when making advanced bookings I have to wait 3 days to hear if I have the booking – but I mostly do get it.
Need more information on such a system before we can make a decision – not sure if it would be better or not without more information.
A feeling that the disbenefit of loosing the two week advanced booking window, especially for important trips such as to the doctors, was still widely prevalent; many were concerned that increasing the normal trip booking window to one week could lead to more critical trips being refused.
Following discussions of the potential benefits of such a system however, there was a greater feeling that it might be a positive change, though thorough explanation of the benefits such a system would bring would certainly be necessary. This is a fundamental issue which has been highlighted throughout this research, so the need for appropriate information and marketing would be critical to convince users that such changes could be positive.

APPENDIX
F
OTHER RELEVANT RESEARCH - DOOR-TO-DOOR STUDY
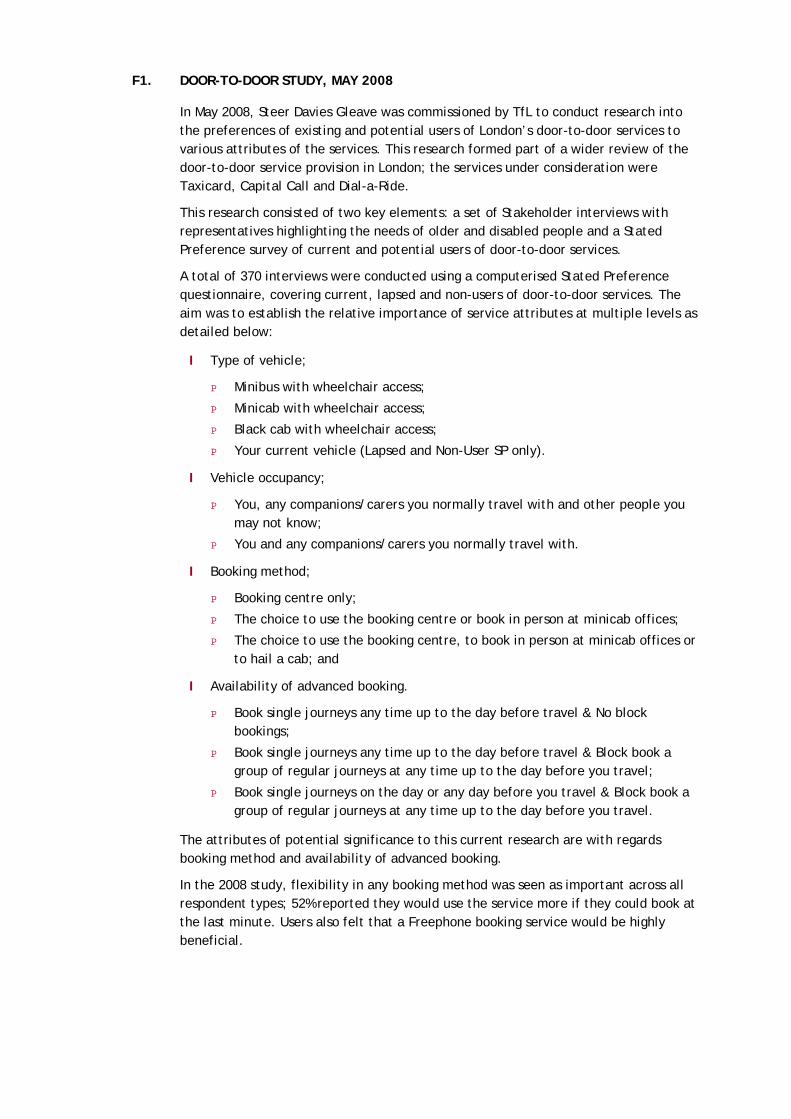
F1. DOOR-TO-DOOR STUDY, MAY 2008
In May 2008, Steer Davies Gleave was commissioned by TfL to conduct research into the preferences of existing and potential users of London’s door-to-door services to various attributes of the services. This research formed part of a wider review of the door-to-door service provision in London; the services under consideration were Taxicard, Capital Call and Dial-a-Ride.
This research consisted of two key elements: a set of Stakeholder interviews with representatives highlighting the needs of older and disabled people and a Stated Preference survey of current and potential users of door-to-door services.
A total of 370 interviews were conducted using a computerised Stated Preference questionnaire, covering current, lapsed and non-users of door-to-door services. The aim was to establish the relative importance of service attributes at multiple levels as detailed below:
I Type of vehicle;
P Minibus with wheelchair access;
P Minicab with wheelchair access;
P Black cab with wheelchair access;
P Your current vehicle (Lapsed and Non-User SP only).
I Vehicle occupancy;
P You, any companions/carers you normally travel with and other people you may not know;
P You and any companions/carers you normally travel with.
I Booking method;
P Booking centre only;
P The choice to use the booking centre or book in person at minicab offices;
P The choice to use the booking centre, to book in person at minicab offices or to hail a cab; and
I Availability of advanced booking.
P Book single journeys any time up to the day before travel & No block bookings;
P Book single journeys any time up to the day before travel & Block book a group of regular journeys at any time up to the day before you travel;
P Book single journeys on the day or any day before you travel & Block book a group of regular journeys at any time up to the day before you travel.
The attributes of potential significance to this current research are with regards booking method and availability of advanced booking.
In the 2008 study, flexibility in any booking method was seen as important across all respondent types; 52% reported they would use the service more if they could book at the last minute. Users also felt that a Freephone booking service would be highly beneficial.

Attributes with regards booking multiple or single journeys, booking at least a day in advance or on the day of travel, and the ability to make block bookings were all tested. In all cases, greater flexibility was generally desired, though the preferences for such measures was not as strong when compared to issues of vehicle type or vehicle occupancy.
Users of the Dial-a-Ride service however saw less benefit from the ability to book in person at minicab offices. Comments received indicated a barrier to such an approach: “Why was I asked for booking in person if I could not get their anyway?”
Of particular relevance to direct comparison with results from this study were responses given with regards non-use of these services.
Reasons for Not Registering with Door-to-Door Services
The key reasons cited for not registering with Dial-a-Ride were issues booking journeys at the times you want (35% of lapsed users noted this) along with the ability to use other modes of transport (26% of users highlighting this alternative). In our research, the ability to use other modes was also seen as a key reason not to use Dial-a-Ride amongst non-users.
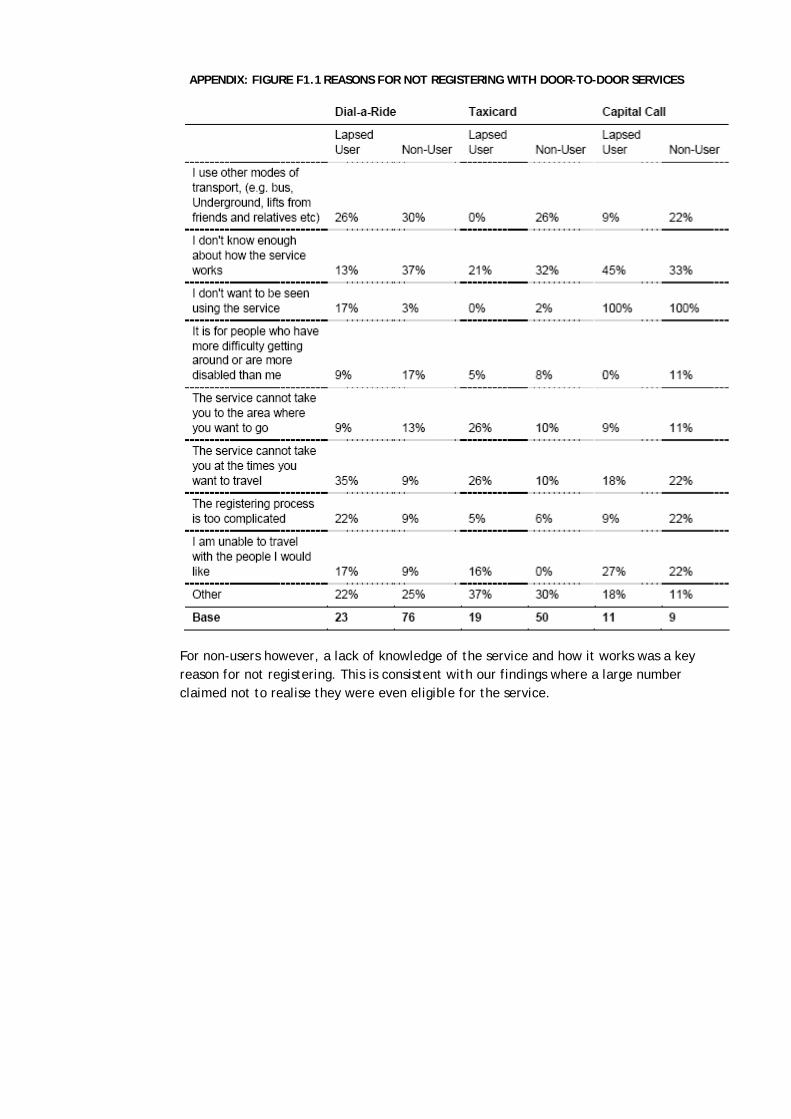
APPENDIX: FIGURE F1.1 REASONS FOR NOT REGISTERING WITH DOOR-TO-DOOR SERVICES
For non-users however, a lack of knowledge of the service and how it works was a key reason for not registering. This is consistent with our findings where a large number claimed not to realise they were even eligible for the service.

Lapsed Users Reasons for Not Registering with Door-to-Door Services
The key reason cited for not using the service follow a very similar pattern to issues with regards not registering – people either feel the service is not reliable and cannot provide them with the trips they want or they have alternative options when travelling.
APPENDIX: FIGURE F1.1 REASONS FOR NON-USE OF DOOR-TO-DOOR SERVICES (LAPSED USERS ONLY)