Embed Size (px)
Citation preview
Electronic Supplementary Information
Dialysis process for the removal of surfactants to form colloidal mesoporous silica nanoparticles 5
Chihiro Urata, Yuko Aoyama, Akihisa Tonegawa, Yusuke Yamauchi and Kazuyuki Kuroda*
Materials
Hexadecyltrimethylammonium bromide (C16TMABr), triethanolamine (TEA), Rhodamine 6G (R6G), 10
and acetic acid were purchased from Wako Pure Chemical Industries, Ltd. Tetramethoxysilane (TMOS: Si(OCH3)4) was purchased from Kishida Chemical Ltd. Ethanol was purchased from Junsei Chemical Co., Ltd. Experimental 15
1) Preparation of colloidal mesostructured silica (CMSS) TEA (0.420 g) and 2.00 g of C16TMABr was added to 240 ml of water and the solution was stirred for 30 min at 80 °C. Then 11 mmol of TMOS was added to the C16TMABr solution and stirred vigorously for 2 h at 80 °C. Finally, the colloid was filtered with a filtering paper (No. 5). The molar ratio of the precursor solution was 1 TMOS : 0.50 C16TMABr : 0.25 TEA : 1200 H2O. 20
2) Removal of surfactants from CMSS In the next step, 50 ml of the colloid was transferred into a dialysis membrane tube composed of cellulose (Molecular Weight Cut Off = 12000-14000) and was dialyzed for 24 h against 250 ml of the mixture containing 2M acetic acid and ethanol (1:1, v/v) to remove C16TMABr and this process was repeated three times. Then the tube, which contained colloidal mesoporous silica (CMPS), was 25
immersed in water to remove acetic acid / EtOH in the tube, and the process was repeated three times. CMPS was filtered through a 0.45 μm regenerated cellulose syringe filter. 3) Adsorption of Rhodamine 6G into CMPS A tube containing 10 ml of CMPS was immersed into a R6G solution (40 ml, 50 mg/l) and the solution was stirred to accelerate the transfer of the dye for 12 h at room temperature. Finally, the 30
concentrations of R6G inside and outside the tube were determined by the absorbance at 526 nm. Characterization
Dynamic light scattering (DLS) measurements were conducted with a HORIBA LB-550 Dynamic Light Scattering Nanoparticle Size Analyzer at 17 °C. Zeta-potential measurements were conducted 35
with an OTSUKA ELECTRONICS ELSZ-1 at 20 °C. UV-vis spectra were obtained by using a SHIMADZU UV-2500PC spectrophotometer. Thermogravimetry differential thermal analysis (TG-DTA) measurements were carried out with a RIGAKU Thermo Plus 2 instrument under a dry air flow at a heating rate of 10 °C min-1 up to 800 °C. CHN elemental analysis was performed with a Perkin-Elmer, 2400 Series II. The Nitrogen gas adsorption-desorption measurement were performed 40
by an Quantachrome Instruments Autosorb-2 instrument at 77K. Samples were preheated at 120 °C for 3 h under 1×10⁻² Torr. The Brunauer−Emmett−Teller (BET) surface area was calculated from the adsorption data in the relative pressure range from 0.05 to 0.30. The pore size distribution was evaluated using the non-local density functional theory (NLDFT). SEM and bright field STEM studies
Supplementary Material (ESI) for Chemical CommunicationsThis journal is (c) The Royal Society of Chemistry 2009

were carried out on HITACHI S-5500 microscope operated at 30kV. SEM samples, CMSS or CMPS were dropped and dried carbon-coated micro-grid (Okenshoji Co.). TEM studies were carried out on JEOL JEM-2010 microscope operated at 200kV. TEM samples, CMSS or CMPS were dropped and dried on a carbon-coated micro-grid (Okenshoji Co.). SAXS 2D-images and patterns of the samples were obtained on a RIGAKU Nano-Viewer. The samples for the SAXS measurement were used as 5
colloidal state. The particle diameter distributions were calculated based on the scattering profiles by using Nano-solverTM. The powder XRD patterns of the dried samples were obtained on a Mac Science M03XHF22 diffractometer with Mn-filtered Fe Kα radiation.
Supplementary Material (ESI) for Chemical CommunicationsThis journal is (c) The Royal Society of Chemistry 2009
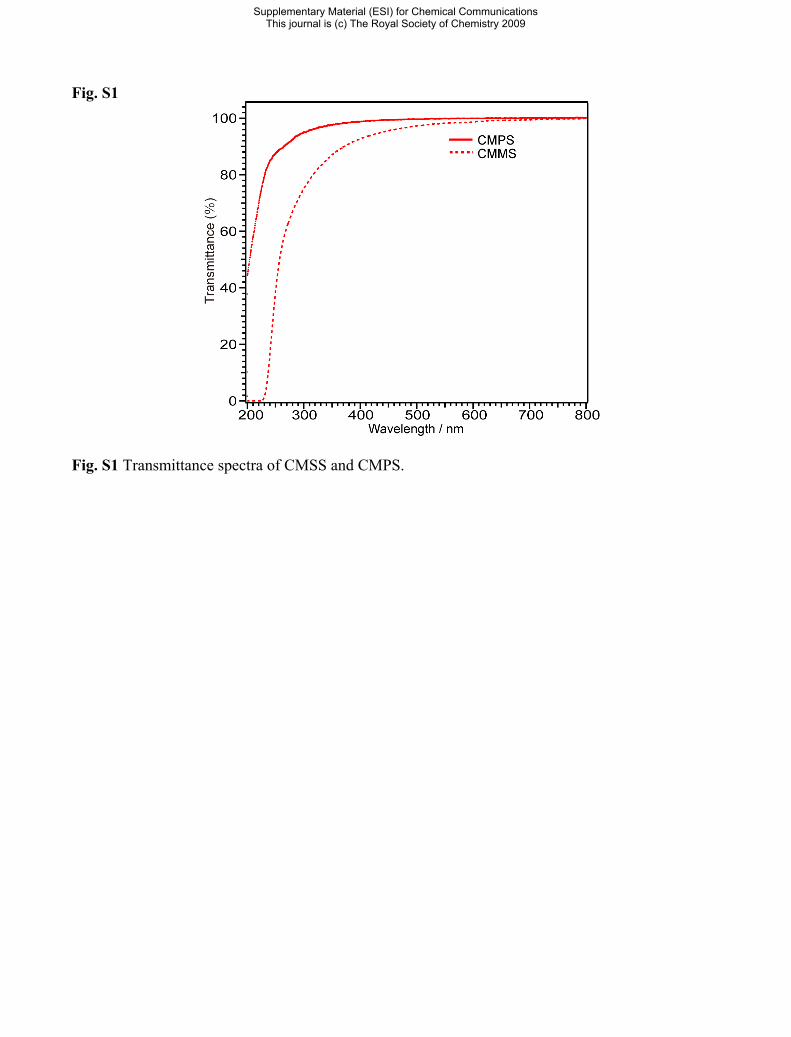
Fig. S1
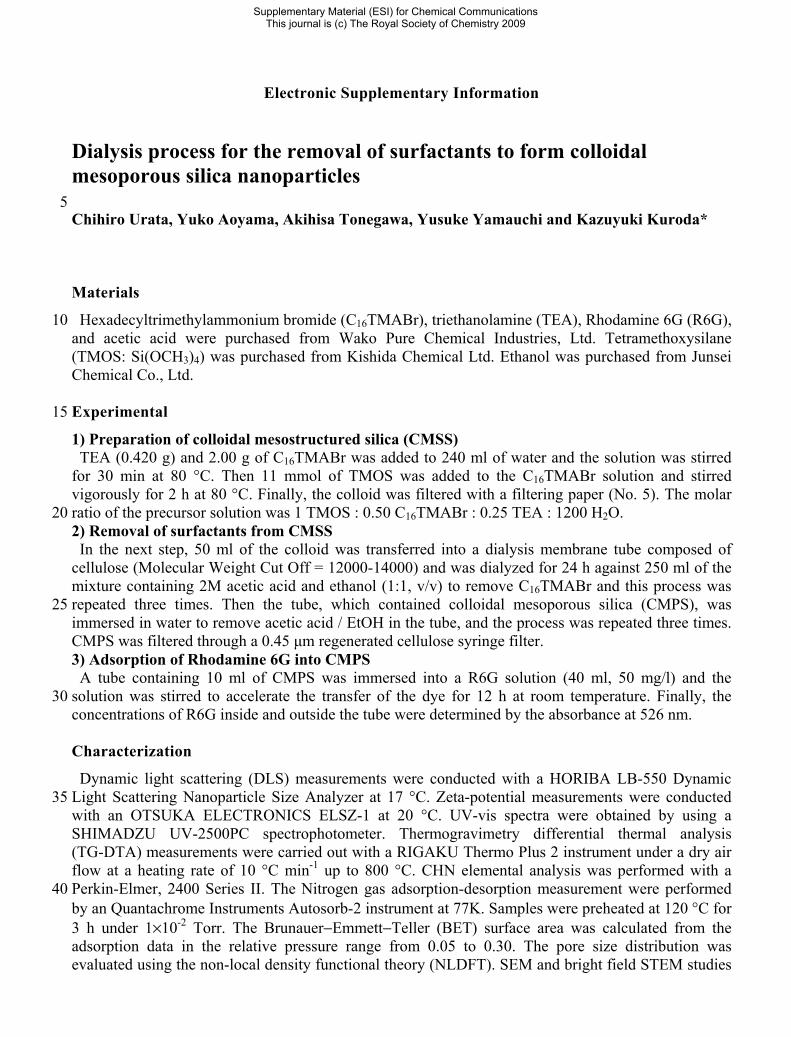
Fig. S1 Transmittance spectra of CMSS and CMPS.
Supplementary Material (ESI) for Chemical CommunicationsThis journal is (c) The Royal Society of Chemistry 2009
Fig. S2
Fig. S2 (a) N2 sorption isotherm, BET surface area, and pore volume of d-CMPS, (b) Pore size distribution of d-CMPS obtained by NLDFT method, and (c) XRD pattern of d-CMPS. 5
Supplementary Material (ESI) for Chemical CommunicationsThis journal is (c) The Royal Society of Chemistry 2009
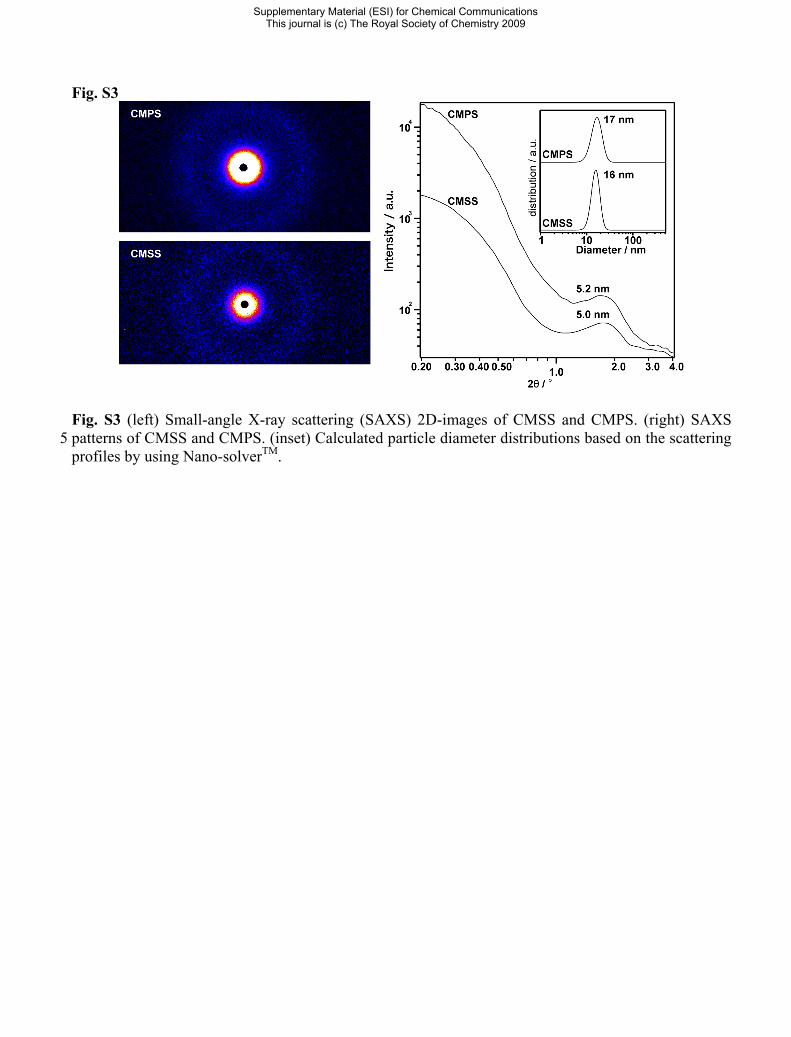
Fig. S3
Fig. S3 (left) Small-angle X-ray scattering (SAXS) 2D-images of CMSS and CMPS. (right) SAXS patterns of CMSS and CMPS. (inset) Calculated particle diameter distributions based on the scattering 5
profiles by using Nano-solverTM.
Supplementary Material (ESI) for Chemical CommunicationsThis journal is (c) The Royal Society of Chemistry 2009
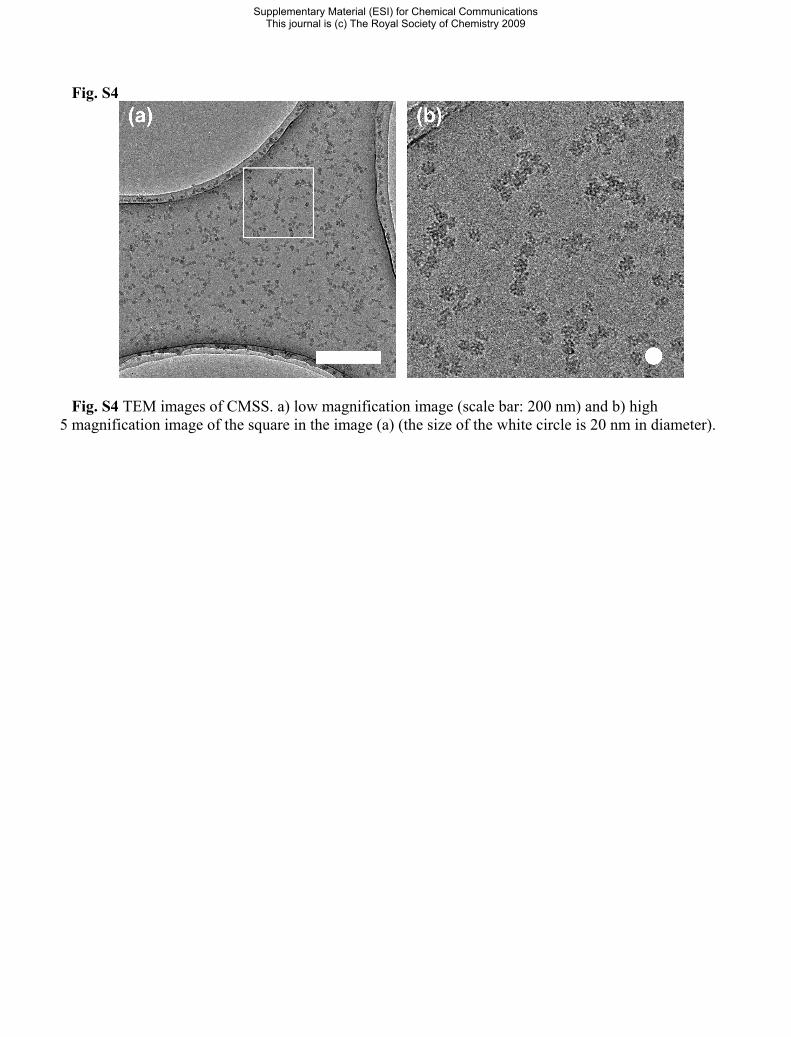
Fig. S4
Fig. S4 TEM images of CMSS. a) low magnification image (scale bar: 200 nm) and b) high magnification image of the square in the image (a) (the size of the white circle is 20 nm in diameter). 5
Supplementary Material (ESI) for Chemical CommunicationsThis journal is (c) The Royal Society of Chemistry 2009
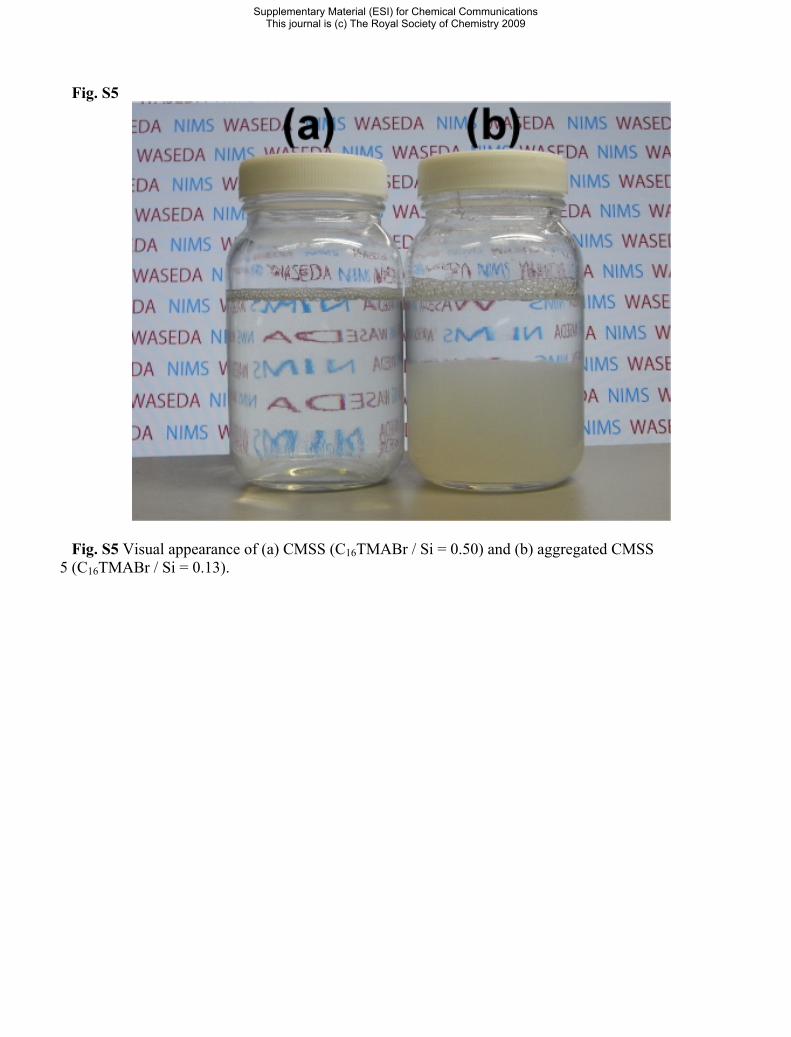
Fig. S5
Fig. S5 Visual appearance of (a) CMSS (C16TMABr / Si = 0.50) and (b) aggregated CMSS (C16TMABr / Si = 0.13). 5
Supplementary Material (ESI) for Chemical CommunicationsThis journal is (c) The Royal Society of Chemistry 2009
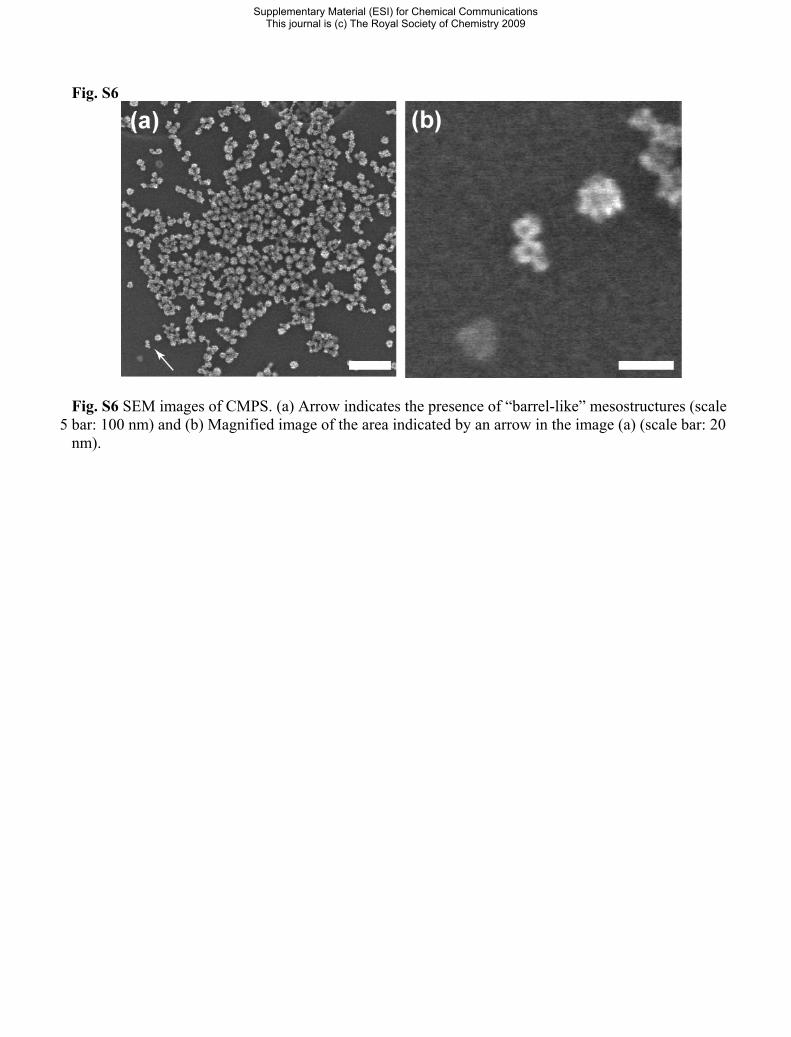
Fig. S6
Fig. S6 SEM images of CMPS. (a) Arrow indicates the presence of “barrel-like” mesostructures (scale bar: 100 nm) and (b) Magnified image of the area indicated by an arrow in the image (a) (scale bar: 20 5
nm).
Supplementary Material (ESI) for Chemical CommunicationsThis journal is (c) The Royal Society of Chemistry 2009
![Publications - University of AdelaideInfluences of spinel type and polymeric surfactants on the size evolution of colloidal magnetic nanocrystals (MFe2O4, M= Fe, Mn). [10.1007/s11705-014-1441-y]](https://img.pdfslide.net/doc/110x75/60a8f46f5ea07960277ac9b7/publications-university-of-adelaide-influences-of-spinel-type-and-polymeric-surfactants.jpg)