Embed Size (px)
Citation preview

Did the Elimination of Mandatory Retirement Affect Faculty Retirement?
Orley Ashenfelter; David Card
The American Economic Review, Vol. 92, No. 4. (Sep., 2002), pp. 957-980.
Stable URL:
http://links.jstor.org/sici?sici=0002-8282%28200209%2992%3A4%3C957%3ADTEOMR%3E2.0.CO%3B2-R
The American Economic Review is currently published by American Economic Association.
Your use of the JSTOR archive indicates your acceptance of JSTOR's Terms and Conditions of Use, available athttp://www.jstor.org/about/terms.html. JSTOR's Terms and Conditions of Use provides, in part, that unless you have obtainedprior permission, you may not download an entire issue of a journal or multiple copies of articles, and you may use content inthe JSTOR archive only for your personal, non-commercial use.
Please contact the publisher regarding any further use of this work. Publisher contact information may be obtained athttp://www.jstor.org/journals/aea.html.
Each copy of any part of a JSTOR transmission must contain the same copyright notice that appears on the screen or printedpage of such transmission.
The JSTOR Archive is a trusted digital repository providing for long-term preservation and access to leading academicjournals and scholarly literature from around the world. The Archive is supported by libraries, scholarly societies, publishers,and foundations. It is an initiative of JSTOR, a not-for-profit organization with a mission to help the scholarly community takeadvantage of advances in technology. For more information regarding JSTOR, please contact [email protected].
http://www.jstor.orgMon Jul 2 14:04:55 2007

Did the Elimination of Mandatory Retirement Affect Faculty Retirement?
A special exemption from the 1986 Age Discrimination Act allowed colleges and universities to enforce mandatory retirement of faculty at age 70 until 1994. We construct a survey that permits us to compare faculty turnover rates before and after the law changed at a large sample of institutions with dejned contribution pension plans. After the elimination of compulsory retirement the retirement rates of 70- and 71-year-olds fell by two-thirds and were comparable to rates of 69-year-olds. These findings indicate that U.S. colleges and universities will experience a rise in the number of older faculty over the coming years. (JEL J26, 121)
Over the past three decades the institution of mandatory retirement has all but disappeared from American life. College and university professors were among the handful of occupa- iions exempted from the general prohibition of age-related employment barriers in the 1986 amendments of the Age Discrimination in Em- ployment Act. The law granted a temporary exemption for postsecondary institutions to en- force mandatory retirement at age 70. The ex- emption was a hard-fought victory for college and university representatives, who argued that mandatory retirement was needed to maintain a steady inflow of young faculty and promote the hiring of women and minorities. ~ollowing a review in the early 1990's, however, Congress allowed the exemption to expire, and mandatory retirement was eliminated on January 1, 1994. With this change, the United States became one of the few countries in the world to offer true lifetime employment security to tenured faculty
* Ashenfelter: Department of Economics, Princeton Uni- versity, Princeton, NJ 08544; Card: Department of Econom- ics, University of California, Berkeley, CA 94720. The data collection for this research was managed by David Ash- more. We gratefully acknowledge his important contribu- tion to this paper. We also thank Teny Layman, Linda Moskowitz, Ethan Lewis, and Olivier Deschenes for their assistance. This project was funded by the Andrew W. Mellon Foundation and was conducted with the cooperation of TIAA-CREF and the participating institutions. We are grateful to William Bowen and John Biggs for their support, and to Ronald Ehrenberg and an anonymous referee for detailed comments. Finally, we thank seminar participants at the NBER and TIAA-CREF for helpful comments.
members.' The lifting of mandatory retirement occurred just as the wave of faculty hired in the early 1960's was about to reach traditional re- tirement age, prompting some critics to argue that the highereducation system soon would be overwhelmed by a "gerontacracy" of aging teachers and scholars (Henry Rosovsky, 1990 pp. 211-12).
This paper presents the first comprehensive study of the effect of the elimination of manda- tory retirement on faculty retirement patterns, using data for 16,000 older faculty at 104 col- leges and universities across the country. This new database, the Faculty Retirement Survey (F'RS), combines payroll records from individ- ual institutions with pension information from the TIAA-CREF pension plan. The FRS in- cludes all regular faculty age 50 or older who were employed at a random sample of four-year colleges and universities in the mid-1980's, and follows them for the next 10-1 1 years, yielding a rich source of information on faculty retire- ment flows in both the mandatory and post- mandatory eras.
' Many other developed countries, including the United Kingdom, Germany, and France, continue to allow manda- tory retirement for most workers, including university fac- ulty, although the U.K. government has proposed eliminating compulsory retirement (Andrew Sparrow, 2001). In Canada, mandatory retirement of university fac- ulty was found constitutional in a 1990 Supreme Court decision. Australia and New Zealand eliminated mandatory retirement for most workers, including university faculty, in the late 1990's.
957

958 THE AMERICAN ECONOMIC REVIEW SEPTEMBER 2002
Although this new data set has many strengths it also has several limitations. Most impo&antly, it is limited to faculty at colleges and universities with significant faculty partici- pation in TIAA-CREF. Although over 90 per- cent of all four-year colleges and universities offer defined contribution pensions through TIAA-CREF, some public institutions offer only defined benefit pensions.2 Our results should be interpreted accordingly. In addition, we follow faculty for only a few years after mandated retirement was eliminated. As a con- sequence our results do not represent what may materialize if colleges and universities imple- ment new retirement incentives.
Our analysis is intended to shed light on several key issues that may affect the present and future age structure of institutions of higher education in the United States and elsewhere. First, we evaluate the role of the government prohibition of mandatory retirement contracts on actual retirement behavior. More broadly, our data also provide a rich opportunity to test hypotheses about individual determinants of re- tirement behavior, including the role of both pension wealth and wages.
Our empirical findings indicate that the pro- hibition of mandatory retirement had no effect on retirement rates of faculty under the age of 70. In contrast, the law substantially reduced the retirement rates of 70- and 71-year-old profes- sors. In the mandatory era about 75 percent of faculty who reached the age of 70 retired within a year. The retirement rate of 71-year-olds was also over 60 percent. Immediately after the pro- hibition of mandatory retirement both rates fell to under 30 percent. These reductions have led to a marked increase in the fraction of faculty who continue working into their seventies. While before less than 10 percent of 70-year-old faculty were still working at age 72, after the prohibition close to one-half were still teaching two years later. In addition, our findings indi- cate that faculty with higher salaries or lower pension wealth are less likely to retire at any given age. More surprising, retirement rates are
'Defined contribution plans, such as those offered by TIAA-CREF, use employer and employee contributions to create an asset fund that is converted into a pension annuity at retirement. Defined benefit pensions are payment streams that an employer promises to pay at retirement.
also affected by a faculty member's relative salary: individuals with a higher rank within the salary distribution of their institution have lower retirement rates, even controlling for the level of their salary, suggesting that nonpecuniary fac- tors play a quantifiable role in retirement decisions.
I. Background
A. Mandatory Retirement of Postsecondary Faculty
In a provocative 1905 address to the Johns Hopkins medical school, William Osler, the outgoing chief physician, proposed that U.S. universities adopt mandatory retirement of pro- fessors at age 6 0 . ~ While Osler's proposal led to no immediate action, over the next several de- cades many colleges and universities adopted mandatory retirement rules. As in other sectors of the U.S. economy, the introduction of man- datory retirement was tied to the availability of pensions. A central role was played by the Car- negie Foundation for the Advancement of Teaching, which was established by Andrew Carnegie in the same year as Osler's address to fund pensions for retiring professors at private nonsectarian colleges. Echoing Osler's concern over the age structure of the professorate, Car- negie wrote that "... able men hesitate to adopt teaching as a profession and many old profes- sors whose places should be occupied by younger men cannot be retired" (quoted in Wil- liam Graebner [I980 p. 1091). Carnegie pen- sions initially were available to retirees from only 52 colleges (John H. Biggs, 2001). By 1916 the number of participating institutions had expanded and the system was converted into a contributory pension plan-the Teacher's Insurance Annuity Association (TIAA). In the 1920's and 1930's pension plans and mandatory retirement spread to many state institutions.'
Osler argued that faculty over 40 were unproductive and those over 60 were a nuisance. William Graebner (I980 pp. 3-10) reproduces several paragraphs of the address and provides an interesting account of its reception.
For example, in 1932 Pennsylvania State University set up a group life and pension plan and instituted mandatory retirement at age 65 (Michael Bezilla, 1985). See Dora L. Costa (1998 pp. 166-172) for a discussion of the spread of "pension movement" in the 1920's and 1930's.
959 VOL. 92 NO. 4 ASHENFELTER AND (IARD: RETIREMENT
By the 1970's, mandatory retirement was a nearly universal feature of academic life.5 A serious challenge was posed by the 1978 amendments to the Age Discrimination in Em- ployment Act (ADEA), which outlawed man- datory retirement for most workers before age 70. Extensive lobbying by college and univer- sity representatives managed to win a four-year delay in the application of the law to postsec- ondary faculty. Effective July 1982, however, the compulsory retirement age in higher educa- tion was raised to 70. A similar effort resulted in an eight-year exemption from the 1986 amend- ments of the ADEA, which outlawed compul- sory retirement altogether for most workem6 The 1986 legislation called for a National Acad- emy of Sciences review of the impact of the elimination of mandatory retirement in higher education, which was presented to Congress in 1991. The review (P. Brett Hammond and Harriet P. Morgan, 1991) concluded that a con- tinuing exemption for tenured faculty was un- necessary and Congress allowed it to expire on schedule on December 3 1, 1993.
B. College Enrollment and the Age Distribution of Postsecondary Faculty
The implications of a shift in retirement pat- terns among postsecondary faculty depend crit- ically on the relative size of the population of older faculty. Because entry into the professor- ate is concentrated at younger ages, the current age structure of college faculty is largely a reflection of historical hiring patterns, which in turn were driven by trends in postsecondary
It is difficult to precisely estimate what fraction of postsecondary institutions had mandatory retirement provi- sions. Results from the FRS, and from an earlier study by Albert Rees and Sharon P. Smith (1991) suggest that man- datory retirement was nearly universal. In the labor force as a whole about 40 percent of workers were covered by mandatory retirement in the early 1970's (Gary S. Fields and Olivia S. Mitchell, 1984 p. 7), with higher coverage among better educated men in managerial occupations (Ed- ward P. Lazear, 1979).
The specific wording of the exemption was as follows: "Nothing in this Act shall be construed to prohibit compul- sory retirement of any employee who has attained 70 years of age, and who is serving under a contract of unlimited tenure (or similar arrangement providing for unlimited ten- ure) at an institution of higher education (as defined by Sec. 1201(a) of the Higher Education Act of 1965)."
enrollment.' Figure 1 shows two alternative measures of the inflow of new students to the postsecondary education system over the 1955- 1996 period. The first is the number of first-time freshman enrollees at four-year institutions; the second is the number of new high-school grad- uates enrolled in two- or four-year college^.^ Both measures show rapid growth until the early 1970's, and relative stagnation thereafter.
The growth in the number of college entrants up to 1970 was driven by a combination of rising cohort size (i.e., the baby boom) and rising enrollment rates among successive co- horts. Enrollment pressure in the 1960's led to a rapid expansion of the college and university system and a hiring boom for younger faculty. Although the number of college-age youth con- tinued to rise over the next decade, the fraction who enrolled in college dropped, leading to a stable inflow of college freshmen in the 1970's (see Card and Lemieux, 2001). In the 1980's cohort size fell but enrollment rates rebounded, with the offsetting effects again leading to a roughly constant inflow of freshmen. he rela-tive stability in enrollment inflows from 1970 to 1990 was associated with a prolonged era of depressed demand for new faculty (see William G. Bowen and Julie Ann Sosa, 1989).
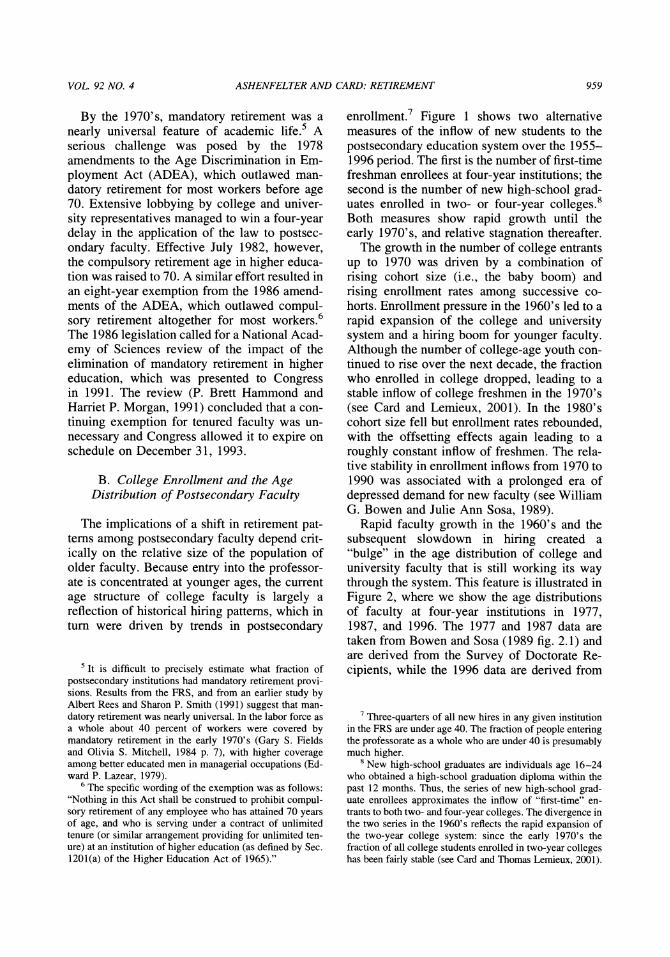
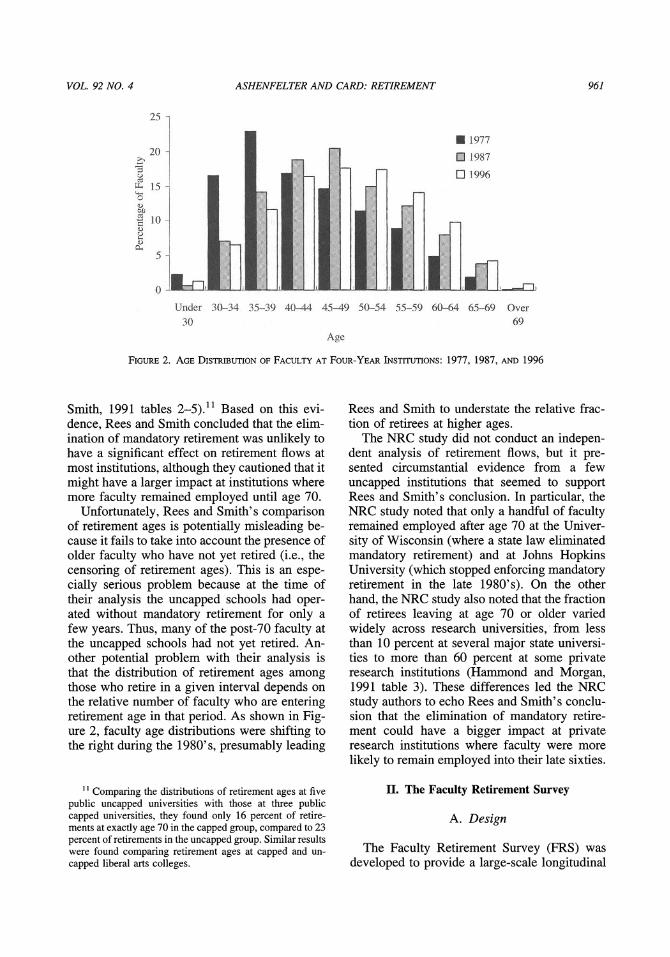
Rapid faculty growth in the 1960's and the subsequent slowdown in hiring created a "bulge" in the age distribution of college and university faculty that is still working its way through the system. This feature is illustrated in Figure 2, where we show the age distributions of faculty at four-year institutions in 1977, 1987, and 1996. The 1977 and 1987 data are taken from Bowen and Sosa (1989 fig. 2.1) and are derived from the Survey of Doctorate Re- cipients, while the 1996 data are derived from
'Three-quarters of all new hires in any given institution in the FRS are under age 40. The fraction of people entering the professorate as a whole who are under 40 is presumably much higher.
New high-school graduates are individuals age 16-24 who obtained a high-school graduation diploma within the past 12 months. Thus, the series of new high-school grad- uate enrollees approximates the inflow of "first-time" en- trants to both two- and four-year colleges. The divergence in the two series in the 1960's reflects the rapid expansion of the two-year college system: since the early 1970's the fraction of all college students enrolled in two-year colleges has been fairly stable (see Card and Thomas Lemieux, 2001).

960 THE AMERICAN ECONOMIC REVIEW SEPTEMBER 2002
New High-School Graduates Enrolled in College (CPS Data)
I
2..
.Q. d .u
6. 0.8.= \
First-Time Freshmen Enrollees at Four-Year Institutions (Administrative Data)
I
I i
the FRS. (FRS data for 1987 are very similar to those reported by Bowen and Sosa). Reflecting the pace of hiring in the 1960's and early 1970's, the 1977 age distribution is highly skewed toward younger faculty. Over the past two decades the age distribution has gradually flattened and shifted to the right, with a decline in the fraction under age 40 and a rise in the fraction over age 55. Between 1977 and 1996 the median age of faculty at four-year institutions rose by eight years, from 40 to 48. A key implication of these shifts is that the fraction of faculty now at risk to be affected by changes in retirement rates is higher today than in the past. For example, FRS data suggest that about 14 percent of all faculty in 1996 were between the ages of 60 and 69. As the wave of faculty hired in the 1960's moves into their sixties, this fraction will continue to rise for another 5-10 years. The growing rela- tive size of the older faculty population under- scores the importance of understanding changes in retirement patterns associated with the recent lifting of mandatory retirement.
C. Previous Research on Faculty Retirement
Prior to the of the that allowed colleges and universities to continue -mandatory retirement, two major studies were conducted to evaluate the likely effect of the law: Rees and Smith and the Academy of ScienceLVational Research Coun- cil (NRC) study mandated by Congress (Ham-
mond and Morgan, 1991) .~ The Rees and Smith study is particularly interesting because it at- tempted to evaluate the effect of mandatory retirement by examining faculty retirement rates at colleges and universities in states that had already passed state laws banning manda- tory retirement." Rees and Smith compared the distribution of retirement ages at 12 institutions that were covered by state laws prohibiting mandatory retirement to the distribution at 21 other institutions that were unaffected by such laws. Contrary to expectations, their analysis suggested that the mean retirement age was lower at the "uncapped institutions (those that were prohibited from enforcing mandatory re- tirement) than at the "capped" institutions (those that could enforce mandatory retire-ment). Moreover, a comparison of retirement ages at capped and uncapped institutions showed a higher fraction of retirements at age 70 at the uncapped institutions than at the capped colleges and universities (Rees and
'Previous research on the general issue of faculty retire- ment include Karen C. Holden and W. Lee Hansen (1989) and the Commission on College Retirement (1990). Bowen and Sosa (1989) also present some analysis of faculty re- tirement rates. John H. Pencavel(2001) oresents an analysis of the early retirement incentives offered to University of California faculty in the late 1980's and early 1990's. Rob- ert L. Clark et al. (1998) and Ronald G. Ehrenberg et al. (1998) present case studies of specific institutions.
In manv states these laws onlv ao~lied to facultv at , . &
state institutibns.
VOL. 92 NO. 4 ASHENFELTER AND CARD: RETIREMENT
Under 30-34 35-39 40-44 45-49 50-54 55-59 60-64 65-69 Over 30 69
Ape
Smith, 1991 tables 2-5)." Based on this evi- dence, Rees and Smith concluded that the elim- ination of mandatory retirement was unlikely to have a significant effect on retirement flows at most institutions, although they cautioned that it might have a larger impact at institutions where more faculty remained employed until age 70.
Unfortunately, Rees and Smith's comparison of retirement ages is potentially misleading be- cause it fails to take into account the presence of older faculty who have not yet retired (i.e., the censoring of retirement ages). This is an espe- cially serious problem because at the time of their analysis the uncapped schools had oper- ated without mandatory retirement for only a few years. Thus, many of the post-70 faculty at the uncapped schools had not yet retired. An- other potential problem with their analysis is that the distribution of retirement ages among those who retire in a given interval depends on the relative number of faculty who are entering retirement age in that period. As shown in Fig- ure 2, faculty age distributions were shifting to the right during the 1980's, presumably leading
I ' Comparing the distributions of retirement ages at five public uncapped universities with those at three public capped universities, they found only 16 percent of retire- ments at exactly age 70 in the capped group, compared to 23 percent of retirements in the uncapped group. Similar results were found comparing retirement ages at capped and un- capped liberal arts colleges.
Rees and Smith to understate the relative frac- tion of retirees at higher ages.
The NRC study did not conduct an indepen- dent analysis of retirement flows, but it pre- sented circumstantial evidence from a few uncapped institutions that seemed to support Rees and Smith's conclusion. In particular, the NRC study noted that only a handful of faculty remained employed after age 70 at the Univer- sity of Wisconsin (where a state law eliminated mandatory retirement) and at Johns Hopkins University (which stopped enforcing mandatory retirement in the late 1980's). On the other hand, the NRC study also noted that the fraction of retirees leaving at age 70 or older varied widely across research universities, from less than 10 percent at several major state universi- ties to more than 60 percent at some private research institutions (Harnmond and Morgan, 1991 table 3). These differences led the NRC study authors to echo Rees and Smith's conclu- sion that the elimination of mandatory retire- ment could have a bigger impact at private research institutions where faculty were more likely to remain employed into their late sixties.
11. The Faculty Retirement Survey
A. Design
The Faculty Retirement Survey (FRS) was developed to provide a large-scale longitudinal
962 THE AMERICAN ECONOMIC REVIEW SEPTEMBER ZOO2
database of older faculty at four-year colleges and universities before and after the elimination of mandatory retirement. To simplify the data collection and analysis we decided to limit the FRS to faculty at the roughly 90 percent of four-year institutions that offered defined con- tribution pension plans through TIAA-CREF, and to use TIAA-CREF records as the source of pension information.12 Starting from a list of accredited four-year colleges in the National Sci- ence Foundation's CASPAR database, we used TIAA-CREF account records to draw up a sample universe of 1,198 institutions with significant TIAA-CREF representation.13 We then used a stratified random-quota sampling scheme to select schools for inclusion in the FRS. The 16 sample strata represent the four geographic regions of the country (Northeast, South, Midwest, and West), cross-classified with the four "Carnegie classes" of institutional types (research universi- ties, doctorate-granting institutions, comprehen- sive institutions, and liberal arts college^).'^ The original target sample was 35 research institutions, 20 doctorate-granting institutions, 25 comprehen- sive institutions, and 30 liberal arts colleges. The sampling rates reflected our desire to concentrate on larger institutions, and our experience in a pilot study, which suggested that research-oriented in- stitutions are more likely to have high-quality and readily accessible payroll data.
Once a school was selected for the sample, a letter was sent to the head of the institution from the sponsors of the FRS study informing them
'' Results from the 1992 National Survey of Postsecond- ary Faculty show that 90 percent of accredited four-year institutions offer TIAA-CREF pension coverage-see U.S. Department of Education (1997 table 5.1). According to this survey, TIAA-CREF coverage is offered by 90 percent of public research schools, 93 percent of private research schools, 91 percent of public doctoral institutions, 87 per- cent of private doctoral institutions, 87 percent of public comprehensives, 96 percent of private comprehensives, and 97 percent of liberal arts colleges.
l 3 There were 1,454 accredited four-year colleges in the United States in 1992 (see U.S. Department of Education, 1997). Relative to this universe, we exclude schools with limited or zero TIAA-CREF participation, and about 100 specialized professional schools.
"See Camegie Foundation for the Advancement of Teaching (1987) for a description of these classifications. The categories are defined on the basis of federal research funding received, number of Ph.D. degrees awarded, and relative size of professional or specialized undergraduate programs versus arts and sciences.
of the objectives of the study and asking for their cooperation. We then contacted the insti- tution to determine their willingness to partici- pate and inquire about the availability of computerized payroll data. Institutions that were unwilling to participate or lacked comput- erized payroll data for at least five years were dropped from the study and replaced by another institution from the same sample stratum. De- lays in finalizing participation of the selected institutions led us to stop data collection in late 1997, when we had obtained data from a total of 100 institutions.'"n addition to the schools selected in this manner, we include in the sam- ple four nonrandomly selected institutions that participated in a pilot study conducted in 1995 to judge the feasibility of the FRS design.
Participating institutions were asked to pro- vide a complete set of payroll records for all regular tenured or tenure-track faculty (includ- ing permanent lectures) who were 45 or older as of September 1, 1986, or at the earliest date that computerized records were readily available. The payroll data include individual salaries for each academic year from the baseline date for- ward, and information on the date and reason for any subsequent employment termination. We also collected basic descriptive information for each faculty member, including age, gender, race, education, and academic department.
In the final step of data assembly the payroll records were matched by name and social secu- rity number to pension accounts at TIAA-CREF. The TIAA-CREF data include the total value of all pension accounts as of January 1 of each calendar year from 1986 onward, along with the amounts of any pension contributions after 1986. It should be noted that faculty in the FRS may have other sources of pension wealth besides their TIAA-CREF account. This is es- pecially likely for those who work at state in- stitutions, since many public universities (and a few private institutions) give faculty the option of joining TIAA-CREF or some other pension plan.'"aculty may also have other personal
l 5 One institution provided data but had no faculty over age 50 in 1986, and was subsequently dropped.
16 Some public institutions have switched their pension plans over the years, so that faculty hired before a certain date are covered by one pension plan and those hired later are covered by another.

963 VOL. 92 NO. 4 ASHENFELTER AND CARD: RETIREMENT
retirement accounts, such as Keough accounts, that are excluded from our TIAA-CREF totals.
B . Sample Representativeness
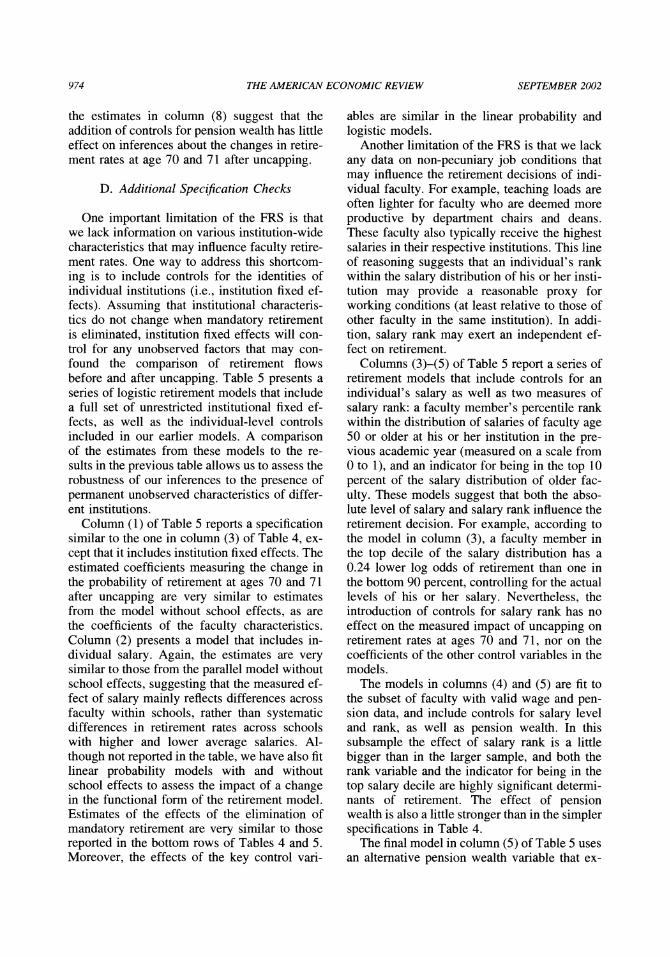
We successfully recruited 33 research univer- sities, 17 doctorate-granting institutions, 25 comprehensive institutions, and 29 liberal arts colleges to participate in the FRS. The final sample includes one-third of all research uni- versities in the country, about 15 percent of all doctorate-granting institutions, and about 5 per- cent of the comprehensive colleges and liberal arts col~eges . '~ We evaluated the representa- tiveness of FRS by comparing the characteris- tics of older faculty in the FRS to those of older faculty in the 1993 National Survey of Postsec- ondary Faculty (NSPF).'~ As documented in Appendix Table A2, this comparison suggests that within each of the four Carnegie classifica- tions the FRS sample is very similar to the NSPF sample. In particular, the FRS and NSPF samples have nearly identical age distributions, similar fractions of female and nonwhite pro- fessors, and similar mean salaries. The only significant discrepancy arises in average sala- ries for liberal arts colleges: relative to the NSPF, salaries for liberal arts faculty in the FRS are 18 percent higher. We suspect that this gap arises because the liberal arts colleges in the FRS tend to be larger than average, in part because of our requirement of at least six years of computerized payroll records.19 This differ- ential should be kept in mind in interpreting our results.
l7 Appendix Table A1 presents more detail on the sam- ple universe and the final sample.
l 8 Since the public use micro samples of the NSPF do not contain sufficiently rich detail on characteristics such as age and salary, we used the interactive data analysis system (DAS) operated by the National Center for Education Sta- tistics to construct characteristics of the NSPF sample. The number of faculty in the NSPF is relatively small: approx- imately 1,000 observations each at research and doctorate institutions, 1,800 at comprehensive institutions, and 480 at liberal arts colleges.
l9 The average size for liberal arts colleges in the FRS is 98 tenured and tenure-track faculty in the FRS, versus 69 in the overall population. Several of the smallest liberal arts colleges that were contacted to participate in the FRS did not have such records. For the other three categories of schools the average number of tenured and tenure-track faculty in the FRS is very similar to the average from the 1988 National Survey of Postsecondary Faculty.
C. Sample Overview and Description of Mandatory Retirement Provisions
Prior to 1994
Although most institutions in the FRS en-forced mandatory retirement until December 31, 1993, 14 schools had eliminated mandatory retirement before that date. In all but one case this decision was driven by a state law that prohibited mandatory retiremew2' Table 1 shows the composition of institutions and older faculty in the overall FRS sample, and in three subgroups of institutions: those that were capped until the federal law took effect in 1994; those that uncapped relatively early (before 1989); and those that uncapped somewhat later (mainly in 1990 or 1991). The early uncapped group includes all institutions in Wisconsin, Maine, and Utah, along with one school that voluntarily eliminated mandatory retirement in the late 1980's. The later uncapped group in- cludes public institutions in Alabama, Arizona, Connecticut, Florida, Idaho, Louisiana, New Hampshire, New York, Texas, Virginia, and Wyoming, and all institutions in Montana and Nevada.
A comparison of the characteristics of older faculty in the three subgroups of institutions reveals many similarities and a few key dif- ferences. Owing to the nature of the state laws, schools that uncapped before 1994 are more likely to be public institutions. On the other hand, the age distributions and fractions of female and nonwhite faculty are similar in the three subgroups, as are the fractions of faculty with a Ph.D., the fraction in arts and sciences (as compared to professional schools such as Engineering, Business, or Law), and average annual salaries at the sample baseline date. In all three subgroups of institutions the majority of older faculty is made up of white men, about 80 percent hold a Ph.D., 70 per-cent are full professors, and about one-half teach in the arts and sciences. The mean an- nual salary of older faculty at the sample
20 In a few cases the state law prohibited mandatory retirement at both public and private institutions (specifi- cally, the statutes in Wisconsin, Maine, Montana, Nevada, and Utah), whereas in most cases it applied only to public institutions. See Harnmond and Morgan (1991 table 1) and Rees and Smith (1991 p. 6) for a list of state laws.

964 THE AMERICAN ECONOMIC REVIEW SEPTEMBER 2002
TABLE 1-CHARACTERISTICS AND FACULTY STATUSOF INSTITUT~ONS BY UNCAPPING
Capped Early Later All until 1994 uncapped uncapped
Number of Institutions.
Total Public research Private research Doctorate granting Comprehensive Liberal arts
F a c u l ~ Characteristics:
Number of faculty age 50-plus
Type of Institution (percent):
Public research Private research Doctorate granting Comprehensive Liberal arts
Age Distribution (percent):
Other Characteristics:
Percentage female Percentage nonwhite Percentage with Ph.D. Percentage full professors Percentage arts and sciences Mean salary (1996$) Percent in TIAA-CREF Mean pension (1996$)
Notes: Mean salary refers to salary in sample baseline year (typically 1986). Mean pension wealth refers to average accumulation (for those in TIAA-CREF) as of sample baseline year.
baseline year (in most cases, 1986) was around $70,000.
Overall, 83.6 percent of faculty in the FRS have a TIAA-CREF retirement account. This fraction varies substantially across schools, however, ranging from a low of 30 percent at a couple of state institutions to 100 percent at many private institutions. The fraction of fac- ulty with TIAA-CREF accounts is relatively low in the early uncapped schools, and also somewhat below average in the later uncapped schools, reflecting the high fraction of state in- stitutions in these subsamples. Among faculty
with a TIAA-CREF account, mean pension wealth is about three times annual salary (the median ratio is 2.8, the mean is 3.3), although again there is some variation across schools, with a tendency for lower average wealth levels at a few public schools that offered state pen- sion funds to faculty in the past. This observa- tion underscores the incomplete nature of our pension wealth measure. An examination of the pension data reveals that faculty with higher salaries tend to have higher pension wealth, although the correlation is imperfect (the simple correlation coefficient is 0.28), reflecting differ-

965 VOL. 92 NO. 4 ASHENFELTER AND CARD: RETIREMENT
ences in age and the number of years working at colleges that participate in TIAA-CREF, differ-ences in pension contribution rates of current and previous employers, and the past history of pension allocation decisions.
111. Retirement Flows
The FRS design allows us to develop a vari- ety of measures of faculty retirement flows. In this paper we focus on one-year exit rates (or hazard rates) defined for specific age groups and for specific reasons for leaving employment. We begin by defining the subset of individuals who are at risk to exit at a particular age. To account for the fact that the typical academic year starts in the early fall, we measure age as of September 1. Thus, the group at risk to retire at age 65 in a particular year consists of those who have reached their 65th birthday by September 1 of that year and who were employed in the previous September. The mandatory retirement rate at age 65 is defined as the fraction of this at-risk group whose payroll records indicate that their date of separation is before September 1, and whose reason for se aration is recorded as a compulsory retirement!' We define voluntary retirements and "other exits" (quits, tennina- tions, and people who leave because of disabil- ity) similarly.
An examination of retirement flows by age in the period prior to the elimination of mandatory retirement shows a discrete rise in the probabil- ity of retirement at age 62 (when individuals are first eligible for social security benefits) and a larger peak at age 65. These patterns are similar to those observed for other samples of U.S. workers (see e.g., Christopher Phelan and John Rust, 1997; Robin L. Lumsdaine et al., 1995; Jonathan Gruber and Wise, 2001). Between the ages of 66 and 69, the average faculty exit rate in the pre-mandatory era was about 16 per- cent per year. At age 70, however, the rate jumped to 75 percent. The exit rate at age 71 was also relatively high: around 65 percent per
21 Note that someone who works in the fall semester and retires in December at age 65 will be coded as retiring at age 66. An examination of the data for retirees suggested that almost all retirements take place at the end of the academic year. Thus, people whose birthdays fall after September typically work one year longer than those born earlier in the year.
year.22 Thus, in the era of mandatory retirement, only about 8 percent of faculty who were teach- ing in the year before their 70th birthday were still employed two years later. Among those who survived through the age 70 barrier, retire- ment rates at ages 72-75 were considerably lower, averaging around 25 percent per year.
An interesting feature of the "spike" in retirement rates at ages 70 and 7 1 in the mandatory era is that most of the exits were recorded as voluntary re- tirements. Of course many faculty who would have preferred to continue teaching after age 70 may have decided to voluntarily retire to avoid the unpleasantness of a forced retirement. Given the fact that employers could force faculty members to retire after age 70, and the observed rise in voluntary retirements at age 70, we do not believe it is useful to distinguish between voluntary and mandatory retirements. Consequently, in the re- mainder of the paper we focus on a simple clas- sification of exits into retirements and other exits.
A. Changes in Retirement Rates at the Capped Institutions after January 1, 1994
How did exit rates of faculty at various ages change after the elimination of mandatory re- tirement? A first answer is provided by compar- ing retirement rates at different ages in the capped institutions (those that maintained man- datory retirement until the change in the federal law) before and after 1994. Figure 3A shows average retirement rates at different ages in the pre-mandatory and post-mandatory periods for faculty at the 90 capped institutions in the FRS. Figure 3, Panel B shows average rates of other non-retirement exits in the two periods. (Note that the scales of the vertical axes are very different in these two graphs). The data in the upper panel reveal that average retirement rates at ages 58-69, and at ages 72-73, were quite similar in the pre-mandatory and post-manda- tory periods. Retirement rates at ages 70 and 71
22 Many institutions appear to have allowed faculty to continue teaching if they were under 70 at the start of the fiscal year, which typically begins on July 1. Thus, individ- uals who turned 70 in July or August and retired as late as possible are recorded as retiring at 7 1by our conventions. In addition, some schools apparently allowed professors to continue teaching as long as they had not yet turned 71 as of the start of the tenn.

966 THE AMERICAN ECONOMIC REVIEW SEPTEMBER 2002
,~o x -7 A
55 11.6-
, , m . - - -
hi) h l 62 63 64 h i 66 67 68 69 70 71 72 73
FIGUKE3. AGE-SPECIFICEXIT RATES AT CAPPED INSTITUT~ONSBEFOREAVD AFTER1994:
(A) RETIKEMEKT:(B) OTHEK EXITS
were sharply lower in the post-mandatory era, and more nearly in line with rates at ages 69 and 72. In other words, after the lifting of mandatory retirement, the pronounced "spike" in retirement rates at ages 70 and 7 1 was nearly eliminated. Looking at quits and other nonre- tirement exits. it appears that rates were slightly lower after 1994 for all age groups (the average differential is 0.4 percentage points for ages 60-70), with a notable drop at age 71 (3.2 percentage points with standard error 1.8) and at 72 (4.2 percentage points with standard error 3.5). Nevertheless. before 1994 only a small fraction of faculty at the capped institu- tions remained at work after age 70. Thus, the apparent "spikes" in the rate of other exits at ages 71 and 72 in the pre-mandatory era arises from the exit behavior of only a handful of individ~als.~'Given this fact, the declines in the rate of other exits at ages 71 and 72 after the
"The rate o f other exits at age 71 in the pre-1994 period is the result o f behavior by 11 faculty (four o f whom died), while the rate o f other exits at age 72 in the pre-1994 period is the result o f behavior by four faculty (one o f whom died).
elimination of mandatory retirement are statis- tically insignificant.
While the results in Figure 3, Panel A suggest that average retirement rates were very similar before and after 1994 for all ages other than 70 or 71, it is important to check that this apparent stability is not masking underlying variability in age-specific retirement rates over time. This concern is addressed in Figure 4, where we plot the average retirement rates at six different ages in each year from 1987 to 1996. Although there is some year-to-year variability. retire- ment rates at ages 60, 62, 65, and 68 are all relatively constant, with no obvious trend over the 1987-1996 period. By comparison, the drops in the retirement rates of 70- and 7 1-year-olds between 1993 and 1994 are very pro-nounced. This evidence suggests that these declines were attributable to the law change, rather than to other underlying factors that hap- pened to coincide with the elimination of man- datory retirement.
Table 2 presents a series of comparisons of age-specific retirement rates before and after the elimination of mandatory retirement. We show the number of faculty at uncapped institutions in the FRS who were at risk of retiring at each age between 60 and 72, the average retirement rates in the 1987-1993 and 1994-1996 periods. and the difference in average retirement rates be- tween the periods. As a check on whether this difference is confounded by changes in the composition of the sample at risk to retire in the two periods, the final column of the table shows an adjusted difference in retirement rates ob- tained from a series of logistic regression mod- els. The models are fit separately by age and include 19 control variables and a simple dummy variable indicating whether the tial retirement event took place before or after 1994. The covariates are indicators for gender. nonwhite race. holding of Ph.D., geographic region of the United States, Carnegie classifica- tion and publiclprivate status of the institution. and indicators for six broad devartmental cate- gories. For comparability with the unadjusted differences in retirement rates, the estimated coefficients of the post-1994 dummy variable from the logistic regression are transformed into (approximate) estimates of the difference in the average probability of retirement before and after 1994.

VOL. 92 NO. 4 ASHENFELTER AND CARD: RETIREMENT
2 0.6 .-2 0.5 B
An examination of the raw and adjusted dif- ferences in retirement rates in Table 2 confirms the key findings in Figure 3, Panel A. Apart from ages 70 and 7 1, retirement rates before and after 1994 were very similar. Indeed, none of the differences in retirement rates at ages other than 70 or 71 is even close to statistical signif- icance. Moreover, the large drops in retirement rates observed for 70- and 71-year-old faculty are very similar whether or not adjustments are made for the changing characteristics of older faculty.
B . Comparisons of Retirement Rates at Capped and Uncapped Institutions
Before 1994
Another way to evaluate the impact of the elimination of mandatory retirement is to com- pare retirement flows at different institutions before 1994, when some schools had already eliminated mandatory retirement and others had not. This is the research design used by Rees and Smith (1991), although at the time of their study only a small number of institutions were uncapped, and most had been uncapped for only one or two years. Table 3 presents the results of such a comparison, utilizing retirement flows in the three-year period from 1991 to 1993. The advantage of limiting the comparison to this period is that there are only two groups of schools: those that retained mandatory retire-
-+- Age 60 -.-o..Age 62 ...A,.. Age 65 -Age 68 -t Age 70 -+- Age 71
ment (and did so until January 1994), and those that had uncapped sometime before 199 1.
The patterns in Table 3 are similar to those in Table 2, and lead to the same conclusion about the effect of the elimination of mandatory re- tirement on retirement rates at ages 70 and 7 1. In particular, the retirement rate at age 70 was 45 percentage points higher at the capped insti- tutions than at the uncapped institutions in the early 1990's, while the retirement rate at age 7 1 was 32 percentage points higher. These differ- entials are remarkably similar to the declines in average retirement rates observed for the capped schools after 1994, and provide addi- tional confirmation of the effect of mandatory retirement rules on retirement flows of 70-and 7 1 -year-old faculty. Unlike the patterns in Table 2, however, there is some indication in Table 3 that retirement rates at earlier ages were slightly different at the uncapped institu- tions than at the schools that maintained com- pulsory retirement. Such differences suggest that the retirement profile of faculty at the un- capped institutions may not be an entirely ap- propriate counterfactual for the behavior of those at capped institutions in the absence of manda- tory retirement.24 Nevertheless, compared to the
24 In an earlier draft we compared average retirement rates before and after the lifting of mandatory retirement at the three groups of institutions described in Table 1. These comparisons suggest that prior to the elimination of man- datory retirement, retirement rates were quite similar at the

THE AMERICAN ECONOMIC REVIEW SEPTEMBER 2002
TABLE2-AGE-SPECIFIC RETIREMENT AND AFTER 1994 RATES, BEFORE
Average Change in retirement rate retirement rate
Number of Percentage Adjusted Age observations post-1994 1987-1993 199&1996 Unadjusted fromlogit
Notes: Retirement rates expressed as percent per year. Estimated standard errors are in parentheses. An individual's retirement age is measured as of September 1 following the date of retirement. The adjusted change in retirement rates is the normalized regression coefficient from a logit model for the event of retirement, fit by age and including a total of 19 covariates: gender, Ph.D., nonwhite race, region (three dummies), Carnegie classification and public1 private status of institution, and six department dummies.
differences in retirement rates at ages 70 and 7 1, to a reduction in the retirement rate at age 70.~' the differences at earlier ages are quite small. The declines were similar for the institutions
Further insight into the behavior of retire- that uncapped in 1990-1991 and those that re- ment rates at the early uncapped institutions is tained mandatory retirement until 1994, but provided in Figure 5, which graphs the retire- somewhat smaller at schools that uncapped be- ment rates of 70-year-old faculty by year for fore 1990. The latter group of schools had rel- institutions that uncapped early (before 1990), atively low retirement rates for 70-year-olds in later (1990 or 1991), or not until 1994. The the earliest years of the FRS sample, perhaps patterns for all three sets of institutions suggest because some schools in the group eliminated that the elimination of mandatory retirement led mandatory retirement even before 1989. The
number of 70-year-old faculty at the early un- capped schools is only 10-14 per year, how-
three groups of schools. After the lifting of mandatory retirement, however, retirement rates of 60-68 year olds rose by 3-5 percentage points at schools that eliminated 25 Graphs similar to those in Figure 5 for faculty age 71 mandatory retirement before 1994, whereas they were rel- are not very informative because of the very small numbers atively constant at other schools. of 71-year-olds in the pre-mandatory era.

969 VOL. 92 NO. 4 ASHENFELTER AND CARD: RETIREMENT
Capped Uncappedinstitutions Difference:institutions
c a ~ ~ e d-L.
Age Number Rate Number Rate uncapped
60
61
62
63
64
65
66
67
68
69
70
7 1
72
Notes: Standard errors are in parentheses. See notes to Table 2. The sample is restricted to observations from 1991 to 1993.
ever, so differences in retirement rates in the pre-1989 period between these and other schools are not statistically significant.
C. Pooled Models
The results in Figures 3-5 and Tables 2-3 provide compelling evidence that the elimina- tion of mandatory retirement led to a large re- duction in faculty retirement rates at ages 70 and 71, with little systematic change at other ages. Moreover, the effects of uncapping are similar whether we compare changes in retire- ment rates before and after 1994 at institutions that remained uncapped until the federal law change, or differences in retirement rates be- tween capped and uncapped institutions in the early 1990's. To probe these results even fur- ther, we fit a series of logistic regression models
that combine the data on retirement rates at different ages for all the institutions in the FRS sample.26 These models take the form
where P(i , j, a, t) is the probability that indi- vidual i, who is employed at institution j at age a in year t retires before the start of the next academic year, conditional on having remained in employment up to age a, X(i, j , a, t) rep- resents a set of observed characteristics of indi- vidual i and institution j, P is a coefficient vector, and c,(j, t) represents a set of baseline retirement-probability parameters for people of age a in year t at institution j . A simple speci- fication of the baseline retirement probabilities is
where I[.] is the indicator function and Un- cap(j) is the date that institution j uncapped. This specification includes an unrestricted pa- rameter d, for the baseline retirement rate at each age under a mandatory retirement regime, and another parameter A, for the change in the probability of retirement at age a after uncap- ping. A more parsimonious specification, sug- gested by the patterns in Figures 3-5, imposes the restriction that retirement rates at ages other than 70 and 71 are unaffected by the lifting of mandatory retirement (i.e., A, = 0 for a f 70 or 71).
Table 4 presents estimation results for a se- ries of models based on equations (1) and (2). The specification in the first column of the table includes a full set of unrestricted baseline pa- rameters for each age, and another set of inter- actions of the age effects with a post-uncapping indicator, but excludes any other control vari- ables. The estimated coefficients of the post- uncapping interaction terms with ages 70 and 71
26 See Ross L. Prentice and John D. Kalbfleisch (1980), Paul D. Allison (1982), and Bradley Efron (1988) for dis- cussions of the use of logistic regression models to model hazard probabilities. Note that in the estimation we treat quits and other forms of exit as independent competing risks.

THE AMERICAN ECONOMIC REVIEW SEPTEMBER 2002
are shown in the first two rows of the table, while the approximate changes in the probabil- ity of retirement for 70- and 71-year-olds after uncapping are reported in the bottom rows of the table.27 Column (2) presents an expanded specification that adds 21 control variables (the 19 covariates used in the models in Table 2 plus two indicators for institutions that uncapped early and later). Although many of the control variables exert statistically significant effects on individual retirement probabilities, their inclu- sion has no effect on the estimated change in retirement rates for 70- or 71-year-olds after uncapping.
The coefficients of the key covariates re-ported in Table 4 show some interesting pat- terns. Retirement rates are higher at public research universities than at private comprehen- sive institutions (the omitted group in the mod- els), while rates at private research universities are lower. Retirement rates are also higher at liberal arts colleges (all of which are private) than at the reference private comprehensive institutions. Finally, publicly controlled non-research institutions have significantly higher
"Given the properties of the logit model, the model in column (1) of Table 4 leads to predicted probabilities of retirement for each age group before and after uncapping that exactly match the sample average probabilities. The reported changes in the probability of retirement are con- structed using the approximation A,, X P,, X ( 1 - P,) where P, is the average probability of retirement at age a prior to uncapping.
retirement flows. Interestingly, the public-private difference in the log odds of retirement is not much different among the research and non-research institutions.
Turning to the coefficients of the individual faculty characteristics, the estimates suggest that nonwhites and individuals who hold a Ph.D. have lower average retirement rates. Women at research universities have slightly higher retirement rates than their male col-leagues, whereas those at other institutions have comparable rates.28 Although the coefficients are not reported in the table, there are also some significant differences in retirement rates by region, discipline, and between the institutions that uncapped earlier versus later. Retirement rates at institutions in the West and Midwest are higher than those in the Northeast and South. Retirement rates for faculty in social sciences and physical sciences are significantly lower than those for faculty in humanities or life sci- ences, while retirement rates for faculty at pro- fessional schools tend to be higher than for other groups. Finally, retirement rates at schools that uncapped early (i.e., before 1990) or later (1990 or 1991) tend to be higher than at the institutions that maintained mandatory retire- ment until 1994.
28 We experimented with a number of other interactions between gender, race, and type of institution but found that only the female X research university interaction was sta- tistically significant.

971 VOL. 92 NO. 4 ASHENFELTER AND CARD: RETIREMENT
NO Pre-1994 Ages 65+ Subset Subset with wage controls with controls only only with wages and pension data
Variable (5) (6) (7) (8)- - ~
Age 70 X uncapped -1.99 -2.11 -2.11 -2.18 -2.09 -2.19 -2.14 -2.18 (0.11) (0.1 1) (0.1 1) (0.20) (0.1 1) (0.11) (0.13) (0.13)
Age 71 X uncapped -1.46 -1.55 -1.55 -1.39 -1.56 -1.67 -1.67 -1.66 (0.17) (0.17) (0.17) (0.29) (0.17) (0.19) (0.23) (0.23)
Other ages X uncapped Yes Yes no no no no no no
Institutional Characteristics:
Public research university - 0.24 (0.07)
Private research university - -0.24 (0.06)
Doctorate-granting institution - 0.09 (0.06)
Liberal arts college - 0.34 (0.08)
Public institution (non-research) - 0.61 (0.06)
Faculty Characteristics:
Female at research university - 0.09 (0.05)
Female at other institution - -0.02 (0.07)
Nonwhite - -0.19 (0.05)
Hold Ph.D. - -0.22 (0.04)
Log wage last year - -
Log pension last year - - - -
Controls for region and no Yes Yes Yes department?
Implied Change in Mean Retirement Rate after Uncapping (percent):
At age 70
At age 71
Notes: Standard errors are in parentheses. Models are fit to retirement probabilities for ages 58-72 in 1987-1996. All models include unrestricted age dummies for baseline retirement hazard. Other controls include three region dummies and six department dummies. Models in columns (1) and (2) include fully unrestricted age dummies for pre- and post-uncapping. Other models assume that uncapping only affects retirement rates at ages 70 and 71.
The specification in column (3) of Table 4 is square = 13.06 with 13 degrees of freedom, p similar to the one in column (2), but it imposes value = 0.44). Moreover, the coefficient esti- the restriction that retirement rates are the same mates for the control variables are very similar before and after uncapping at all ages except 70 in the two specifications. and 71. A comparison of the fit of this model to The model in column (4) is fit to retirement the fit of the specification in column (2) shows outcomes in the period from 1987 to 1993. Iden- that this restriction is easily accepted (chi- tification of the effect of uncapping in this
972 THE AMERICAN ECONOMIC REVIEW SEPTEMBER 2002
specification is obtained by comparing retire- ment probabilities before and after uncapping at institutions that eliminated mandatory retire-ment prior to the change in federal law, and to the rates at other institutions that maintained mandatory retirement until 1994. As suggested by the patterns in Table 3, the estimates of the effect of uncapping on retirement rates at ages 70 and 71 from this model are very similar to the estimates obtained using all the available data. In light of this similarity, we believe that the pooled specifications in the rest of the table are justified.
The model in the fifth column of Table 4 is fit to the subset of individuals who are ages 65 or older. A comparison of the parameter estimates from this model to the estimates in column (3) provides an indication of whether the control variables have a differential effect at different ages, and whether such differences have any effect on inferences about the change in retire- ment probabilities for 70- and 71-year-olds after uncapping. Although the estimated coefficients of some of the covariates are slightly different in the subsample of older faculty, these differ- ences have v&tually no effect on the implied changes in retirement rates after uncapping.
The models in columns (1)-(5) exclude con- trols for the salaries or pension wealth of indi- vidual faculty. Such controls are potentially important since standard economic models sug- gest that faculty members are less likely to retire if they can earn a higher salary, and more likely to retire if they expect a higher level of pension income during retirement (Lumsdaine and Olivia S. Mitchell, 1999, provide a comprehen- sive review of these models and empirical research on their implications). Moreover, al- though real salaries of older faculty were fairly constant over our sample period, pension wealth rose over the 1990's, leading to a potential difference between faculty who were at risk of retiring in the mandatory and post-mandatory periods. Column (6) reports a specification sim- ilar to the one in column (3), but with the addition of a variable representing the log of the faculty member's real annual salary in the pre- vious academic year.29 As expected, salary ex-
29 Salary information is missing for a small fraction of observations. The characteristics of the subsample with
erts a strong negative effect on retirement. On average, a faculty member with a 10-percent higher salary has about a 1-percent lower prob- ability of retiring at ages 66-69 (conditional on having worked up to the previous year).30 The addition of salary information also leads to modest changes in the estimated effects of sev- eral other covariates that are correlated with salary, such as gender, race, and type of insti- tution." Nevertheless, the introduction of con- trols for salary levels has little effect on the magnitude of the estimated changes in retire- ment rates at ages 70 and 71 after uncapping.
As noted in Table 1, only 84 percent of older faculty in the FRS have a TIAA-CREF pension account. The model in column (7) of Table 5 reproduces the specification from column (3), but fit to the subset of observations that have valid data on both salary and TIAA-CREF pen- sion wealth. This subsample gives rise to pa- rameter estimates that are fairly similar to the estimates for the overall sample. Finally, the model in column (8) includes controls for salary and pension wealth (as of December 31 of the previous calendar year). As in the specification in column (6), the estimates from this model suggest that salary exerts a strong negative ef- fect on the probability of retirement. Pension wealth works in the opposite direction, but has a considerably smaller effect.
One concern with the estimated pension ef- fect in column (8) is that we only observe an individual's TIAA-CREF retirement ac-counts and supplemental retirement accounts
observed salaries are very similar to those of the overall sample, and estimates for a model that excludes the salary variable are very similar in the subsample and the overall sample.
30 The measured effects of a higher salary are not nec- essarily athibutable to pay alone, since faculty with higher salaries may also have lower teaching loads, or may enjoy their work more.
3 1 An analysis of salaries shows that average pay is similar at private comprehensive institutions, public doctorate- granting institutions, and liberal arts colleges. Relative to this reference group, salaries are about 25 percent higher at private research universities, 15 percent higher at pub- lic research universities, and 6 percent higher at private doctoral-granting institutions. Among the older faculty in the FRS, women are paid 10 percent less than men and nonwhites are paid 2 percent less than whites, controlling for age, rank, full-time status, highest degree, and institu- tional characteristics.

VOL. 92 NO. 4 ASHENFELTER AND CARD: RETIREMENT
T ~ L E5-LOGISTIC RETIREMENTMODELSWITH ~STITUTION FIXED EFFECTS
Variable
Age 70 X uncapped
(1)
Subset with wage data
(2) (3)
Subset with wage and
pension data
(4) (5)
Age 71 X uncapped
Female at research university
Female at other institution
Nonwhite
Hold Ph.D.
Log wage last year
Rank in salary distribution (0 to 1)
Indicator if in top 10 percent of salaries
Log pension last year
Log pension last year excluding SRA's - - -
Controls for faculty characteristics yes yes yes Unrestricted fixed effects for individual yes yes yes
institutions
Implied Change in Mean Retirement Rate after Uncapping (percent):
At age 70
At age 71
Notes: Standard errors are in parentheses. Models are fit to retirement probabilities for ages 58-72 in 1987-1996. All models include unrestricted age dummies for baseline retirement hazard, controls for region and department, and unrestricted fixed effects for individual institutions in the sample. Models assume that uncapping only affects retirement rates at ages 70 and 71.
(SM's).~' Measurement errors arising from the pect that people with higher wealth in TIAA- presence of other pension assets may bias the CREF accounts have less wealth in other assets, estimated effect of measured pension wealth. If leading to a downward bias in the coefficient of the gap between total wealth and measured measured wealth. Another problem is the poten- wealth is uncorrelated with measured wealth, tial endogeneity of SRA's, which are only held then the coefficient on measured wealth will not by one-third of older faculty in the FRS. To the be biased. More realistically, however, we sus- extent that people who intend to retire earlier
contribute more to an SRA, pension wealth will be negatively correlated with tastes for work,
32TIAA-CREF retirement accounts are the accounts leading to a positive bias in the estimated pen- whose value is based on previous contributions by the employer (or employers). SRA's are tax-sheltered individ- sion wealth effect. We discuss some attempts to ual contributory retirement plans similar to 403(b) plans, address the potential biases in the coefficient of and subject to similar regulations. measured pension wealth below. In any case,
974 THE AMERICAN ECONOMIC REVIEW SEPTEMBER 2002
the estimates in column (8) suggest that the addition of controls for pension wealth has little effect on inferences about the changes in retire- ment rates at age 70 and 71 after uncapping.
D. Additional Speci$cation Checks
One important limitation of the FRS is that we lack information on various institution-wide characteristics that may influence faculty retire- ment rates. One way to address this shortcom- ing is to include controls for the identities of individual institutions (i.e., institution fixed ef- fects). Assuming that institutional characteris- tics do not change when mandatory retirement is eliminated, institution fixed effects will con- trol for any unobserved factors that may con- found the comparison of retirement flows before and after uncapping. Table 5 presents a series of logistic retirement models that include a full set of unrestricted institutional fixed ef- fects, as well as the individual-level controls included in our earlier models. A comparison of the estimates from these models to the re- sults in the previous table allows us to assess the robustness of our inferences to the presence of permanent unobserved characteristics of differ- ent institutions.
Column (1) of Table 5 reports a specification similar to the one in column (3) of Table 4, ex-cept that it includes institution fixed effects. The estimated coefficients measuring the change in the probability of retirement at ages 70 and 71 after uncapping are very similar to estimates from the model without school effects, as are the coefficients of the faculty characteristics. Column (2) presents a model that includes in- dividual salary. Again, the estimates are very similar to those from the parallel model without school effects, suggesting that the measured ef- fect of salary mainly reflects differences across faculty within schools, rather than systematic differences in retirement rates across schools with higher and lower average salaries. Al- though not reported in the table, we have also fit linear probability models with and without school effects to assess the impact of a change in the functional form of the retirement model. Estimates of the effects of the elimination of mandatory retirement are very similar to those reported in the bottom rows of Tables 4 and 5. Moreover, the effects of the key control vari-
ables are similar in the linear probability and logistic models.
Another limitation of the FRS is that we lack any data on non-pecuniary job conditions that may influence the retirement decisions of indi- vidual faculty. For example, teaching loads are often lighter for faculty who are deemed more productive by department chairs and deans. These faculty also typically receive the highest salaries in their respective institutions. This line of reasoning suggests that an individual's rank within the salary distribution of his or her insti- tution may provide a reasonable proxy for working conditions (at least relative to those of other faculty in the same institution). In addi- tion, salary rank may exert an independent ef- fect on retirement.
Columns (3)-(5) of Table 5 report a series of retirement models that include controls for an individual's salary as well as two measures of salary rank: a faculty member's percentile rank within the distribution of salaries of faculty age 50 or older at his or her institution in the pre- vious academic year (measured on a scale from 0 to I), and an indicator for being in the top 10 percent of the salary distribution of older fac- ulty. These models suggest that both the abso- lute level of salary and salary rank influence the retirement decision. For example, according to the model in column (3), a faculty member in the top decile of the salary distribution has a 0.24 lower log odds of retirement than one in the bottom 90 percent, controlling for the actual levels of his or her salary. Nevertheless, the introduction of controls for salary rank has no effect on the measured impact of uncapping on retirement rates at ages 70 and 71, nor on the coefficients of the other control variables in the models.
The models in columns (4) and (5) are fit to the subset of faculty with valid wage and pen- sion data, and include controls for salary level and rank, as well as pension wealth. In this subsample the effect of salary rank is a little bigger than in the larger sample, and both the rank variable and the indicator for being in the top salary decile are highly significant determi- nants of retirement. The effect of pension wealth is also a little stronger than in the simpler specifications in Table 4.
The final model in column (5) of Table 5 uses an alternative pension wealth variable that ex-

VOL. 92 NO. 4 ASHENFELTER AND CARD: RETIREMENT Y 75
cludes SRA's. This model is motivated by the observation that the component of pension wealth attributable to employer pension con-tributions is arguably less correlated with un- observed taste factors than the component attributable to the employee's contributions (i.e., SRA's). To the extent that employer-contributed pension wealth is independent of tastes for leisure, health, spousal earnings, and similar factors, it could be used as an instru- mental variable for total pension wealth. Unfor- tunately, we cannot implement such a procedure because total wealth is not observed. We can estimate a "reduced-form" model that relates retirement propensities to employer-contributed pension wealth, and interpret the pension coef- ficient as the product of the true wealth effect and the elasticity of total pension wealth with respect to employer-contributed wealth.33 The resulting estimate of the effect of employer- provided pension wealth on retirement is only slightly smaller than the effect of total observed pension wealth (a coefficient of 0.06 versus 0.07). Comparing the other coefficients, there are only very small differences between the estimates in columns (4) and (5) of Table 6. These results do not suggest a serious bias in uncapping coefficients arising from the poten- tial endogeneity of pension wealth.34
33 Formally, consider a two-equation model of retire- ment and wealth:
y: = X a + y Z y + E , y2 = P + SRA + .s2
where v: is a latent variable measuring an individual's propensity to retire at a given age, X is a set of controls, y , represents total pension wealth, E , represents an unobserved component of retirement propensity, P is the value of employer-provided pensions (i.e., TIAA-CREF retirement accounts), SRA is the value of any SRA accounts, and E ,
represents all other components of pension wealth. Let a, represent the coefficient of P when total pension wealth is regressed on P and X, and let a, represent the coefficient of P in the "reduced-form" model that relates yT to P and X. Then a2= ya,.We measure the wealth variables in loga- rithms so a,is the elasticity of total wealth with respect to P: a,= P l y , X (1 + r ) , where r is the derivative of the total value of pension assets other than P with respect to a dollar increase in P. In general, one would expect - I < r < 0 , since people with higher P do not have to save as much in other assets to achieve the same retirement income. Thus, we expect 0 < a,< 1.
'4 We also tried using the individual share of TIAA- CREF assets allocated to equities versus bonds as an instru-
E. The Effect of Lifting Mandatory Retirement on Subgroups
Up to this point we have been ignoring the possibility that the elimination of mandatory retirement had a differential effect on faculty at different types of institutions, or in different disciplines. Graphs of age-specific retirement rates before and after uncapping by Camegie classification are very similar to Figure 3, Panel A, with large drops in retirement rates at 70 and 71 and few systematic changes at other ages. Detailed comparisons of the changes in retire- ment rates at ages 70 and 71 across institution types suggest that there were similar declines in average retirement rates at ages 70 and 71 across the different types of institutions, with the exception of the comprehensive institutions, where the changes were smaller (see Ashen- felter and Card, 2001). Given the relatively small numbers of observations at these institu- tions, however, the changes are not significantly different from those observed at other types of colleges and universities. Indeed, we cannot reject the hypothesis that the log odds of retire- ment at ages 70 and 71 fell by the same amount at the five types of institutions after uncapping.
We have also compared age-specific retire- ment rates before and after uncapping for fac- ulty in five sets of disciplines: humanities, social sciences, physical and life sciences (in- cluding mathematics), engineering, and busi- ness and professional schools. The patterns of relative retirement rates at different ages in the " mandatory and post-mandatory eras are similar across disciplines, with uniform declines in re- tirement rates at ages 70 and 71, and few sys- tematic changes at other ages (see Ashenfelter and Card, 2001 table 7). As with the analysis
mental variable for pension wealth (in a linear-probability framework). This fraction is an excellent predictor of pen- sion wealth (controlling for salary, age, etc.), but is nega- tively correlated with retirement probabilities, leading to a negative instrumental-variables estimate of the pension wealth effect. We suspect that the share of assets in equities may itself be endogenous with respect to retirement plans, since people tend to reduce the equity share in the years just prior to retirement (relative to non-retirees of the same age). For what they are worth. the estimated effects of uncapping on the retirement rates of 70 and 71 year olds from the instrumental variables model are nearly identical to the estimates reported in Table 6.

976 THE AMERICAN ECONOMIC REVIEW SEPTEMBER 2002
TABLE &ESTIMATED PROBABILITIES OF REMAININGEMPLOYED EMPLOYEDUNTIL AGE 70, AND REMAINING AFTER AGE 70
Faculty affected by mandatory retirement Faculty exempt from mandatory retirement
Research Research
All Public Private Others All Public Private Others
Prohahili@ of Staying to Age 70 (percent):
From age 60 26.1 20.5 41.3 23.0 25.4 22.0 39.0 22.9 From age 65 39.2 31.7 54.2 37.2 38.6 34.9 50.7 35.6
Employnzent Outcomes for. those Working at Age 70 (percent):
Leave at 70 76.6 80.4 75.1 72.5 29.6 29.4 29.6 29.9 Still employed:
At age 71 23.4 19.6 24.9 27.5 70.4 70.5 70.4 70.1 At age 72 8.4 5.6 8.6 13.0 51.6 52.5 52.9 48.3 At age 73 6.3 3.5 6.8 9.9 39.4 41.5 40.8 33.5
Notes: The table is based on estimated exit hazard rates (for retirement and all other reasons). Faculty affected by mandatory retirement include person-year observations for individuals who were employed at an institution that was enforcing mandatory retirement in that year.
across institutional categories, the declines in retirement rates across disciplines are similar enough that we cannot reject the hypothesis of equal effects. Perhaps surprisingly, the elimina- tion of mandatory retirement had very similar effects on faculty retirement rates across all the disciplines.
F . Summarizing the Effect of the Elimination of Mandatory Retirement on Faculty Flows
The estimated exit rates for faculty at differ- ent ages derived from the FRS can be used to construct two kev statistics that are useful in summarizing faculty retirement flows before and after the lifting of mandatory retirement. The first is the fraction of faculty who are em- ployed at a given age (say 60) who can be expected to remain employed until age 70. The second is the fraction of those who are em-ployed at age 70 who will remain teaching at ages 7 1, 72,73, etc. Estimates of these summary measures are presented in Table 6. We show estimates for all faculty, for those at public and private research universities, and for those at other types of institutions (doctorate universi- ties, comprehensive institutions, and liberal arts colleges).35
"We have pooled doctorate, comprehensive, and liberal arts institutions to increase the reliability of the estimates.
The upper panel of Table 6 shows estimated survival probabilities to age 70 for faculty who are ages 60 and 65. These survival probabilities incorporate the risks of both retirement and other exits (including quits and death). As might be expected given the evidence presented so far, the estimated survival probabilities up to age 70 are very similar before and after the elimination of mandatory retirement. However, the fraction of older faculty that is expected to stay until age 70 varies widely across institutions, with a higher fraction at private research universities than at other institutions. As an illustration of this heterogeneity, Figure 6 graphs the fre-quency distributions of the institution-specific survival rates from age 60 to age 70 for private research universities, public research universi- ties, and other institutions in the F R S . ~ ~ An important feature of this graph is the gap be- tween private research universities and other institutions. The estimated survival probabilities for the private research universities in the FRS range from 25 to 80 percent, whereas at the public research and non-research institutions the distribution of survival probabilities is con- centrated below 40 percent.
'6 On the assumption that retirement rates prior to age 70 were unaffected by the elimination of mandatory retirement, these institution-specific survivor rates are estimated using data from the entire FRS sample period.

VOL. 92 NO. 4 ASHENFELTER AND CARD: RETIREMENT
-Private Research
0.0 0.1 0.2 0.3 0.4 0.5 0.6 0.7 0.8 0.9 1.0 Proportion Surviving from Age 60 to Age 70
The lower panel of Table 6 shows employ- ment survival probabilities after age 70. Com- pared to the differences across institution types in the fraction of faculty who remain from age 60 to 70, the post-70 exit rates are remarkably homogeneous. In the mandatory era, only 8-10 percent of 70 year olds were still working two years later. Since the abolition of mandatory retirement this rate has risen to about 40 per- cent. Unfortunately, given the very small frac- tion of faculty who stayed past age 71 in the mandatory era and the relatively short time that elapsed between the lifting of mandatory retire- ment and the collection of the FRS data, we cannot reliably estimate survival probabilities beyond age 73.
We can use the entries in the upper and lower panels of Table 6 to summarize the impact of the lifting of mandatory retirement on the ex- pected fraction of older faculty who will con- tinue working into their mid-70's. For example, when mandatory retirement was in place, only about 3 percent (=0.413 X 0.068) of 60-year- old faculty at private research universities were still employed at age 73. The fraction was even smaller at public research and non-research in- stitutions. In the post-mandatory era the ex-pected fraction of 60-year-olds who remain at work until 73 has risen to about 10 percent, on average, but at some private research institu- tions where a very high fraction of faculty re- mains working in their sixties it is 30 percent or
even higher.37 At the vast majority of public research universities and non-research institu- tions the expected fraction is below 15 percent, although it is still 7-10 times higher than in the mandatory era.
IV. Interpretation
The results of our analysis of retirement flows in the FRS raise several additional issues. First, although our findings are representative of the changes at institutions that have TIAA-CREF- defined contribution programs, and these com- prise the vast majority of four-year institutions, they do not reflect outcomes in institutions with defined benefit programs. As suggested by the results in Ehrenberg (2001), it is likely that the effect of the elimination of mandatory retire- ment has a smaller effect on the retirement rates in institutions that rely on defined benefit pro- grams because it is far easier for these institu- tions to structure their benefits to encourage retirement.
Second, some institutions will no doubt take steps to alter their pension plans in response to the elimination of mandatory retirement. The
37 For confidentiality reasons, we were not informed of the identities of the individual institutions in the FRS, so we cannot identify the schools with particularly high fractions of faculty who remain until age 70.

978 THE AMERICAN ECONOMIC REVIEW SEPTEMBER 2002
window used in our data collection may be too narrow at this point to reflect such behavior, but the evidence provided in Ehrenberg (2001) sug- gests that it has not become an important part of the regime in institutions with defined contribu- tion programs. On the other hand, Pencavel (2001) reports on an elaborate series of defined benefit schemes implemented by the University of California that were designed to encourage retirement.
Finally, there remains the question of what implications our findings have for issues of public policy toward institutions of higher education. On the one hand, it may well be
that rising enrollment and voluntary retire- ments of the large cohort of professors hired in the 1960's will create such an increase in demand for faculty that the modest increase in supply attributable to the continuing employ- ment of faculty over age 70 will be wel-comed. Alternatively, it is apparent that the average age of the faculty in four-year col- leges and universities will increase in the future and that it will increase by even more than would have been the case in the presence of mandatory retirement. A careful analysis of the implications of these changes is an impor- tant issue for further research.
Number of institutions: Average number of faculty
In FRS In FRS Percent Total In TICREF universe sample All Age SO+ age SO+
Institution class (1) (2) (3) (4) (5) (6) (7)
Research 102 93 94 33 921 354 42.0 Doctorate-granting 176 157 104 17 334 127 37.3 Comprehensive 603 548 521 25 194 80 41.9 Liberal arts 573 507 479 29 98 30 32.2 All 1,454 1,305 1,198 104 415 161 38.5
(weighted)" (220) (85) (38.1)
iVotes: Column (1) is the numher of accredited four-year colleges and universities in the sample frame of the 1992 National Survey of Postsecondary Faculty (NSPF); see table 5.1 of U.S. Department of Education (1997). Column (2) is the estimated fraction of institutions that have at least some participation in TIAA-CREF, based on the results of the NSPF Institutional Survey (U.S. Department of Education, 1997 table 5.1). Column (3) is the numher of institutions in the Faculty Retirement Survey (FRS) sample universe. This was obtained from a list of institutions with substantial TIAA-CREF participation in 1995, excluding specialized medical and law schools. Column (4) is the number of institutions that participated in the FRS survey, including two research universities and two comprehensive institutions from the pilot study. Column (5)-(7) report the characteristics of the faculty in the FRS sample institutions, as of the survey baseline date (typically 1986). Information on the total number of all faculty is missing for four schools.
" The entry in parentheses is the weighted average, using FRS institutional sample weights.
979 VOL. 92 NO. 4 ASHENFELTER AND CARD: RETIREMENT
TABLEA2-<OMPARISONOF FACULTY IN FRS AND NSPFCHARACTERISTICS
Faculty retirement survey National survey of postsecondary faculty
Liberal Liberal Variable Research Doctorate Comprehensive arts Research Doctorate Comprehensive arts
Mean age 57.3 57.2 56.5 56.6 58.1 57.6 56.9 57.6 Age distribution
(percent) 50-54 35.1 36.0 40.8 41.4 34.0 37.5 41.1 36.1 55-59 31.9 31.4 32.0 29.8 30.0 27.9 29.2 29.7 60-64 22.9 23.2 21.2 21.6 20.8 20.4 19.6 21.6 65+ 10.2 9.3 6.1 7.2 15.2 14.2 10.1 12.6
Percent female 12.3 14.2 20.4 20.2 12.2 18.3 26.1 28.6 Percent nonwhite 7.2 7.5 10.4 17.1 7.6 8.0 10.5 6.0 Percent with Ph.D. 84.3 81.0 68.7 78.4 75.7 69.7 72.4 67.4 Percent full professor 74.7 67.0 54.6 75.1 75.6 62.6 55.9 61.3 Percent arts and sciences 52.8 51.9 53.7 77.3 44.4 41.6 47.5 62.1 Mean salary (1996$) 73,200 65,200 52,000 56,800 79,500 67,600 54,700 48,200 Percent in TIAA-CREF 78.0 83.5 71.2 91.4 - - - -Mean pension (1996$) 255.200 220,000 119,000 195,900 - - - -
Number of observations 11,692 2,158 2,009 865 - - - -
Notes: Tabulations refer to faculty age 50 and older. Mean salary for FRS refers to salary in sample baseline year (typically 1986). Mean salary for NSPF refers to annual salary in 1992. Mean pension wealth refers to average accumulation (for those in TIAA-CREF) as of sample baseline year. Tabulations from NSPF were performed using the DAS system, using observations for tenured and tenure-track faculty at four-year institutions age 50 and older.
REFERENCES Jonathan Gruber, ed., Risky behavior among youths: An economic analysis. Chicago: Uni-
Allison, Paul D. "Discrete-time Methods for the versity of Chicago Press, 2001, pp. 439-82. Analysis of Event Histories," in Samuel Carnegie Foundation for the Advancement of Leinhardt, ed., Sociological methodology. Teaching. A classz$cation of institutions of San Fransisco, CA: Jossey-Bass, 1982, pp. higher education (1987 Edition). Princeton, 61-98. NJ: The Carnegie Foundation for the Ad-
Ashenfelter, Orley and Card, David. "Did the vancement of Teaching, 1987. Elimination of Mandatory Retirement Affect Clark, Robert L.; Ghent, Linda S. and Kreps, Faculty Retirement Flow?" National Bureau Juanita. "Faculty Retirement and the Impact of Economic Research (Cambridge, MA) of the Elimination of Mandatory Retirement Working Paper No. 8378, 2001. at Three North Carolina Universities." Un-
Bezilla, Michael. Penn state: An illustrated his- published manuscript, University of North tory. University Park, PA: Pennsylvania State Carolina, 1998. University Press, 1985. Commission on College Retirement. Pension
Biggs, John H. "Pension Systems for the Acad- and retirement policies in colleges and uni- emy and the Church: The Leadership of An- versities. San Francisco, CA: Jossey-Bass, drew Carnegie and J. P. Morgan." Richard 1990. W. Couper Lecture to the Fellows of the Phi Costa, Dora L. The evolution of retirement: An Beta Kappa Society, April 2001. American economic history, 1880-1990.
Bowen, William G. and Sosa, Julie Ann. Pros- Chicago: University of Chicago Press, 1998. pects for faculty retirement in the arts and Efron, Bradley. "Logistic Regression, Survival sciences. Princeton, NJ: Princeton University Analysis, and the Kaplan-Meier Curve." Press, 1989. Journal of the American Statistical Associa-
Card, David and Lemieux, Thomas. "Dropout tion, June 1988, 83(402), pp. 414-25. and Enrollment Trends in the Post-war Pe- Ehrenberg, Ronald G.; Matier, Michael and Fon- riod: What Went Wrong in the 1970s?," in tanella, David. "Cornell University Confronts

980 THE AMERICAN ECONOMIC REVIEW SEPTEMBER 2002
the End of Mandatory Retirement." Unpub- lished manuscript, Cornell University, 1998.
Ehrenberg, Ronald G. "The Survey of Changes in Faculty Retirement Policies." Washington, DC: American Association of University Professors, 2001. [Online: (www.aaup.org/ Issues/retirement/retrpt.htm).]
Fields, Gary S. and Mitchell, Olivia S. Retire-ment, pensions, and social security. Cam-bridge, MA: MIT Press, 1984.
Graebner, William. A history of retirement. New Haven: Yale University Press, 1980.
Gruber, Jonathan and Wise, David A. "Social Security, Retirement Incentives, and Retire- ment Behavior: An International Perspec-tive," in Alan J. Auerbach and Ronald D. Lee, eds., Demographic change and jiscal policy. New York: Cambridge University Press, 2001.
Hammond, P. Brett and Morgan, Harriet P., eds. Ending mandatory retirement for tenured faculty. Washington DC: National Academy Press, 1991.
Holden, Karen C. and Hansen, W. Lee, eds. Tl~eend of mandatory retirement in higher education. San Francisco, CA: Jossey-Bass, 1989.
Lazear, Edward P. "Why Is There Mandatory Retirement?'Journal of Political Economy, December 1979, 87(6), pp. 1261- 84.
Lumsdaine, Robin L. and Mitchell, Olivia S. "New Developments in the Economic Anal- ysis of Retirement," in Orley Ashenfelter and David Card, eds., Handbook of labor eco-nomics, Vol. 3c. New York: Elsevier, 1999, pp. 3261-3307.
Lumsdaine, Robin L.; Stock, James H. and Wise, David A. "Why Are Retirement Rates So High At Age 65?" National Bureau of Eco- nomic Research (Cambridge, MA) Working Paper No. 5 190, 1995.
Pencavel, John H. "The Response of Employees to Severance Incentives: The University of California's Faculty, 1991-94." Journal of Human Resources, Winter 2001, 36(1). pp. 58-84.
Phelan, Christopher and Rust, John. "How So- cial Security and Medicare Affect Retirement Behavior in a World of Incomplete Markets." Econornetrica, July 1997, 65(4), pp. 781-832.
Prentice, Ross L. and Kalbfleisch, John D. The statistical analysis of failure time data. New York: John Wiley, 1980.
Rees, Albert and Smith, Sharon P. Faculty retire- ment in the arts and sciences. Princeton, NJ: Princeton University Press. 199 1.
Rosovsky, Henry. The university: An owner's manual. New York: W. W. Norton, 1990.
Sparrow, Andrew. "Compulsory Retirement May be Banned." Daily Telegraph (Lon-don), 13 February 2001. [Available online: (www.globalaging.org/pension/world/ compulsoryretirement.htm).]
United States Department of Education. Office of Educational Research and Improvement. "1993 National Study of Postsecondary Fac- ulty: Institutional Policies and Practices." Washington. DC: U.S. Department of Educa- tion, 1997.

You have printed the following article:
Did the Elimination of Mandatory Retirement Affect Faculty Retirement?Orley Ashenfelter; David CardThe American Economic Review, Vol. 92, No. 4. (Sep., 2002), pp. 957-980.Stable URL:
http://links.jstor.org/sici?sici=0002-8282%28200209%2992%3A4%3C957%3ADTEOMR%3E2.0.CO%3B2-R
This article references the following linked citations. If you are trying to access articles from anoff-campus location, you may be required to first logon via your library web site to access JSTOR. Pleasevisit your library's website or contact a librarian to learn about options for remote access to JSTOR.
[Footnotes]
5 Why Is There Mandatory Retirement?Edward P. LazearThe Journal of Political Economy, Vol. 87, No. 6. (Dec., 1979), pp. 1261-1284.Stable URL:
http://links.jstor.org/sici?sici=0022-3808%28197912%2987%3A6%3C1261%3AWITMR%3E2.0.CO%3B2-C
9 The Response of Employees to Severance Incentives: The University of California's Faculty,1991-94John PencavelThe Journal of Human Resources, Vol. 36, No. 1. (Winter, 2001), pp. 58-84.Stable URL:
http://links.jstor.org/sici?sici=0022-166X%28200124%2936%3A1%3C58%3ATROETS%3E2.0.CO%3B2-N
26 Logistic Regression, Survival Analysis, and the Kaplan-Meier CurveBradley EfronJournal of the American Statistical Association, Vol. 83, No. 402. (Jun., 1988), pp. 414-425.Stable URL:
http://links.jstor.org/sici?sici=0162-1459%28198806%2983%3A402%3C414%3ALRSAAT%3E2.0.CO%3B2-B
References
http://www.jstor.org
LINKED CITATIONS- Page 1 of 2 -
NOTE: The reference numbering from the original has been maintained in this citation list.
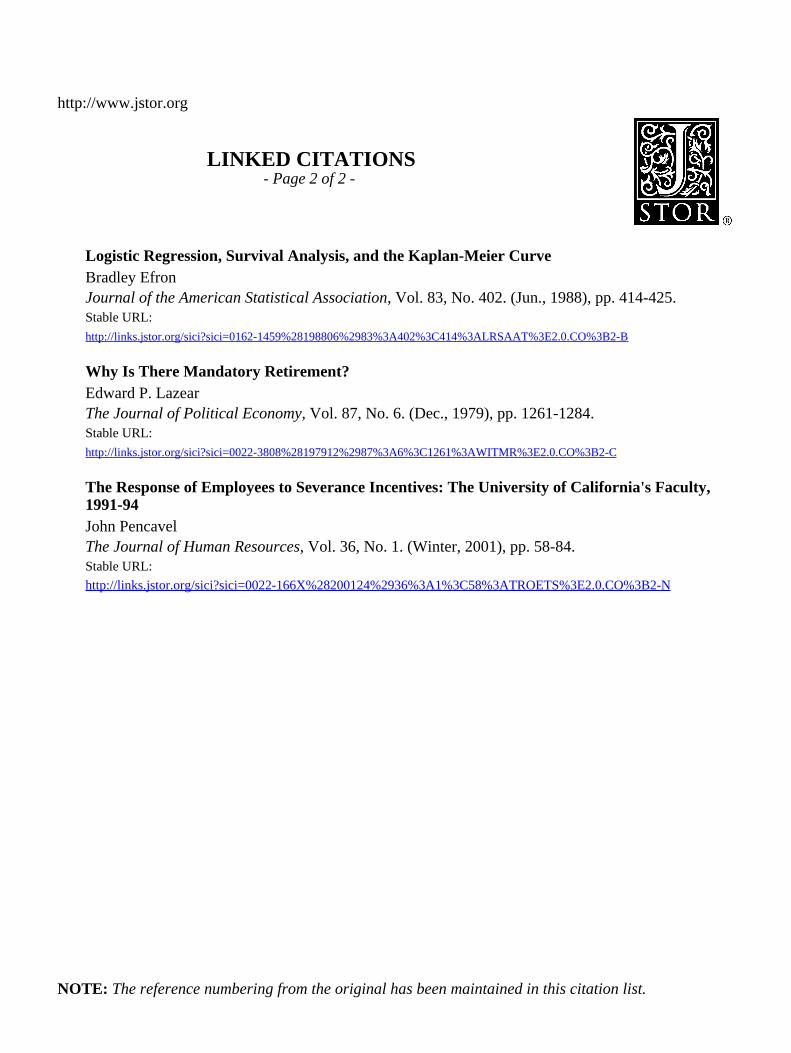
Logistic Regression, Survival Analysis, and the Kaplan-Meier CurveBradley EfronJournal of the American Statistical Association, Vol. 83, No. 402. (Jun., 1988), pp. 414-425.Stable URL:
http://links.jstor.org/sici?sici=0162-1459%28198806%2983%3A402%3C414%3ALRSAAT%3E2.0.CO%3B2-B
Why Is There Mandatory Retirement?Edward P. LazearThe Journal of Political Economy, Vol. 87, No. 6. (Dec., 1979), pp. 1261-1284.Stable URL:
http://links.jstor.org/sici?sici=0022-3808%28197912%2987%3A6%3C1261%3AWITMR%3E2.0.CO%3B2-C
The Response of Employees to Severance Incentives: The University of California's Faculty,1991-94John PencavelThe Journal of Human Resources, Vol. 36, No. 1. (Winter, 2001), pp. 58-84.Stable URL:
http://links.jstor.org/sici?sici=0022-166X%28200124%2936%3A1%3C58%3ATROETS%3E2.0.CO%3B2-N
http://www.jstor.org
LINKED CITATIONS- Page 2 of 2 -
NOTE: The reference numbering from the original has been maintained in this citation list.