Embed Size (px)
Citation preview

Confidential: For Review OnlyDietary Sources of Calcium and Protein Reduce Hip
Fractures and Falls in Institutionalised Older Adults: a Cluster-Randomised Controlled Trial
Journal: BMJ
Manuscript ID BMJ-2021-066231
Article Type: Original research
Date Submitted by the Author: 03-May-2021
Complete List of Authors: Iuliano, Sandra; University of Melbourne, MedicinePoon, Shirley; University of Melbourne, MedicineRobbins, Judy; University of Melbourne, MedicineBui, Minh; 3Centre for Epidemiology and Biostatistics, University of Melbourne, CEBWang, Xiao-Fang; University of Melbourne, Medicinede Groot, Lisette; Wageningen UniversityVan Loan, Marta; University of California DavisGhasem-Zadeh, Ali; University of Melbourne, Endocrine Centre, Austin HealthNguyen, Tuan; Garvan Institute of Medical Research, Osteoporosis and Bone Biology Program; University of Technology SydneySeeman, Ego; University of Melbourne, Endocrine Centre, Austin Health
Keywords: Aged-care, Dairy food, Falls, Fractures
https://mc.manuscriptcentral.com/bmj
BMJ

Confidential: For Review Only
1
Dietary Sources of Calcium and Protein Reduce Hip Fractures and Falls in
Institutionalised Older Adults: a Cluster-Randomised Controlled Trial
S Iuliano Ph.D.1 [email protected] Principal Investigator
S Poon B.Nutr.Diet.1 [email protected] Dietician
J Robbins D.Diet.1 [email protected] Dietician
M Bui Ph.D.2 [email protected] Statistician
X Wang M.D. Ph.D.1 [email protected] Statistician
L De Groot Ph.D.3 [email protected] Nutritionist
M Van Loan Ph.D.4 [email protected] Physiologist
A Ghasem Zadeh M.Sc1 [email protected] Medical Physicist
T Nguyen Ph.D.5,6 [email protected] Statistician
E Seeman M.D.1 [email protected] Endocrinologist
1Departments of Medicine and Endocrinology, Austin Health, University of Melbourne, Australia2School of Population and Global Health, University of Melbourne, Australia
3Division of Human Nutrition, Wageningen University, Wageningen, The Netherlands4US Department of Agriculture-ARS, University of California, Davis, USA
5Garvan Institute of Medical Research and 6University of Technology Sydney, Sydney, Australia
Correspondence: Dr. Sandra Iuliano, Department of Endocrinology, Austin Health, Repatriation
Campus, Level 2 Centaur Wing, West Heidelberg, Victoria, 3081 Australia, Phone: + 61 3 9496 3216.
Fax: + 61 3 9496 3365 Email: [email protected]
Page 1 of 29
https://mc.manuscriptcentral.com/bmj
BMJ
123456789101112131415161718192021222324252627282930313233343536373839404142434445464748495051525354555657585960

Confidential: For Review Only
2
Summary box
What is already known is this topic
Few studies have investigated the efficacy and safety of a nutritional approach to fracture risk
reduction in aged-care residents.
One study using pharmacological doses of calcium and vitamin D reduced hip fractures in female
nursing home residents with low calcium intakes and vitamin D deficiency.
What this study adds
Supplementation using high-calcium, high-protein dairy foods reduced falls and fractures in older
adults in aged-care.
Page 2 of 29
https://mc.manuscriptcentral.com/bmj
BMJ
123456789101112131415161718192021222324252627282930313233343536373839404142434445464748495051525354555657585960

Confidential: For Review Only
3
Abstract
Objectives: To assess the antifracture efficacy and safety of a nutritional intervention in
institutionalised older adults with daily calcium and protein intakes of 600 mg and < 1 g /kg body
weight but replete in vitamin D.
Design: Two-year cluster-randomised controlled trial.
Setting: 60 residential aged-care facilities.
Participants: 7195 residents [72% females, mean (SD) age 86.0 (8.2) years].
Intervention: Thirty facilities were randomised to provide residents with high-calcium and high-
protein milk, yogurt and cheese containing 562 (166) mg/day calcium and 12 (6) g/day protein. Thirty
control facilities continue their residents’ current daily intakes of 700 (247) mg calcium and 58 (14 )
g protein.
Main outcome measures: Fractures, falls and all-cause mortality.
Results: A total of 324 fractures, of which 135 were hip fractures, and 4302 falls occurred
during 2 years. The intervention was associated with risk reductions of 33% for all fractures (HR
0.67, 95% CI, 0.48 to 0.93, P = 0.018), 46% for hip fractures (HR 0.54, 95%CI, 0.35 to 0.83, P =
0.005) and 11% for falls (HR 0.89, 95% CI, 0.78 to 0.98, P = 0.041). The risk reduction for hip
fractures and falls achieved significance at 5 months (P = 0.021) and 3 months (P = 0.004)
respectively. Mortality was unchanged (HR 1.01, 95%CI, 0.43 to 3.08).
Conclusions: Improving calcium and protein intakes using dairy foods is a widely accessible, safe,
intervention that reduces risk of fractures and falls commonly occurring in aged-care residents.
Trial Registration: Australian New Zealand Clinical Trials Registry (ACTRN12613000228785).
Page 3 of 29
https://mc.manuscriptcentral.com/bmj
BMJ
123456789101112131415161718192021222324252627282930313233343536373839404142434445464748495051525354555657585960

Confidential: For Review Only
4
Introduction
Longevity increases the proportion of older adults in the population. The accompanying increased
prevalence of chronic illnesses, loss of musculoskeletal mass, frailty and bone fragility increase the
risk of falls and fractures.(1) Loss of independence increases the number of individuals requiring full-
time institutionalized care, the source of ~30% of all hip fractures in the community.(2) Thus,
targeting an intervention to all aged-care residents is a rational approach to reducing the fracture
burden in the whole community.
The widespread use of antiresorptive therapy is unlikely to reduce this fracture burden because of a
paucity of evidence of antifracture efficacy in persons over 80 years of age, the common occurrence
of adverse events, and high cost given large numbers of individuals must be treated.(3) These persons
often have calcium intakes below 700 mg daily, an amount unlikely to offset obligatory loss of
calcium.(4) They also often have protein intakes below 1 gram/kg body weight/day predisposing to
loss of lean muscle mass.(5) Thus, an alternative approach is to target all institutionalized older adults
to a non-pharmaceutical nutritional intervention.
Few studies have investigated the efficacy and safety of a nutritional approach to fracture risk
reduction in aged-care residents. Chapuy et al. demonstrated anti-fracture efficacy using
pharmacological doses of calcium and vitamin D in female nursing home residents with low calcium
intakes and vitamin D deficiency.(6) No studies have examined effects of protein supplementation on
fracture risk reduction, but there is evidence of improved muscle function and reduced falls.(7)
Consumption of milk, yoghurt and cheese, foods rich in calcium and protein, slows bone loss and
improves IGF-1.(8, 9) These foods are widely available, palatable, low cost and so are likely to be
adhered to. Accordingly, we conducted a two-year cluster-randomized controlled trial to test the
hypothesis that achieving recommended intakes of 1300 mg/day calcium and 1 gram protein/kg body
weight, will reduce the risk of fragility fractures and falls when targeted to institutionalized older
adults replete in vitamin D but with intakes below these levels.
Methods
Study design This two-year cluster-randomized controlled intervention involved 60 residential
aged-care facilities housing 7195 older adults in metropolitan Melbourne and regional Victoria,
Australia recruited between December 2013 to August 2016. To ensure similar standards of care, we
Page 4 of 29
https://mc.manuscriptcentral.com/bmj
BMJ
123456789101112131415161718192021222324252627282930313233343536373839404142434445464748495051525354555657585960

Confidential: For Review Only
5
recruited only facilities accredited with the Australian Aged-Care Accreditation Agency that housed
predominantly ambulant residents (similar to residential care in the UK and assisted care facilities
in the USA). Facilities recruited were representative of charitable, private and religious organisations
with an even distribution of small (up to 50 beds) medium (51-100 beds) and large (>100 beds)
facilities (supplementary figure S3). Menu audits were performed to ensure facilities met the
inclusion criteria of providing 2 or less dairy servings daily.
Randomization procedure The unit of randomization was facility. Eligible facilities were
randomly assigned in a 1:1 ratio to either intervention (n = 30) or control (n = 30), with the later
maintaining their existing menus. The randomization was conducted with the use of a computer with
block sizes being varied according to oraganization (to ensure similar procedures and policies) and
was stratified by geographical location (similar socio-economic status). An organization may have 2
to 10 facilities, and randomization was done within an organization.
Consent Facility managers consented to provided non-identifiable details of age and sex of residents,
and access to all mandatory incident reports. Falls (time, location, circumstances and outcome /
injury) were verified from mandatory incident reports maintained at all facilities and fractures verified
using hospital x-ray reports. Residents and families were informed of the study during regular
meetings. Residents (n = 371) or their next of kin (n = 345) from all facilities voluntarily consented
to have dietary intake recorded and medical records reviewed. The 371 residents also consented to
blood sampling, measurement of body composition, bone mineral density and bone
microarchitecture.
Intervention Dairy foods were classified using the Australian Dietary Guidelines with a ‘serving’
defined as milk (250 ml), yogurt (200 grams) and cheese (40 grams).(10) Lactose free options were
provided to accommodate the few participants (<0.001%) with reported lactose intolerance. Butter,
cream and ice-cream were not provided as they contain little calcium or protein. Vitamin D adequacy
in aged-care residents is achieved by routine supplementation as dairy foods are not vitamin D
fortified. All facilities prepared and cooked foods on-site. Intervention facilities were assigned a food
service dietician to assist food service staff to increase the provision of dairy foods at all meals and
snacks. Methods used to increase dairy foods included milk powder to fortify milk used in recipes
and beverages and dairy-based desserts and snacks offered in place of less nutritious foods such as
cakes and biscuits.
Page 5 of 29
https://mc.manuscriptcentral.com/bmj
BMJ
123456789101112131415161718192021222324252627282930313233343536373839404142434445464748495051525354555657585960

Confidential: For Review Only
6
Dairy foods were provided by Fonterra International (New Zealand) and distributed by Bidfoods
(Australia). A single distributor ensured accurate recording of costs for all dairy foods provided.
During dietary assessments, foods and beverages were weighed on a food scale (±1g) (Sohnele Page
Profi, Germany) at all facilities. During 2-days every 3 months dieticians assessed compliance using
the validated visual estimation of plate-waste with data collected from 55,000 foods and beverages
during the study.(11) Nutrient intakes were calculated using a nutritional analysis software
(FoodWorks, Australia), or the Australian food composition database NUTTAB 2010.
Data monitoring Data safety monitoring was carried out by the Study Trial Review Board who
were provided with quarterly reports.
Outcomes The primary outcome was time to fragility fracture. Secondary outcomes were time to
fall and changes in body composition, bone morphology and biochemistry. All-cause mortality was
a tertiary outcome. Fasting morning serum samples were obtained from 189 residents at baseline and
12 months for measurement of 25-hydroxy-vitamin D (baseline only), C-terminal telopeptide of type
1 collagen, procollagen type 1 N propeptide and parathyroid hormone (Roche Cobas E170) and
insulin-like growth factor 1 (LIASON) (supplementary figure S1).
Body composition and bone morphology were assessed at baseline and 12 months in 72 residents
(supplementary figure S2). Total and appendicular (arms and legs) lean mass and fat mass were
determined from total body scans and BMD was measured at the lumbar spine and femoral neck using
dual x-ray absorptiometry (Prodigy, GE Lunar, Madison, WI, CV=1%). Volumetric bone mineral
density (vBMD) was measured at the distal tibia and distal radius using high-resolution peripheral
quantitative computed tomography (Scanco Medical AG, Switzerland, CV 0.5–4.0%).(12) Cortical
porosity was determined using automated image processing (StrAx1.0, Straxcorp, Melbourne,
Australia).
Blinding and power Once a facility was randomized, only the principal investigator, food service
research dieticians, facility managers and food service staff were aware of allocation. Data acquisition
and analyses were carried out by staff blinded to group allocation (SP, XW, MB, AGZ, TN). The
sample size was determined based on a hypothesized effect size and intra-cluster correlation
coefficient (r). Under the hypothesis that the intervention reduces the risk of fracture by 30%, and
that r ranges from .10 to .50, the sample size needed was 25 to 50 residents per facility and 25 facilities
per arm to achieve the power of 80%. From falls data, an r of .20 was used to calculate the sample
Page 6 of 29
https://mc.manuscriptcentral.com/bmj
BMJ
123456789101112131415161718192021222324252627282930313233343536373839404142434445464748495051525354555657585960

Confidential: For Review Only
7
size.(13) To account for ~20% annual attrition, we recruited 60 facilities with a minimum number of
50 residents per facility.
To maintain the required sample size, recruitment continued throughout the 24-months. This was
achieved by including new admissions (forming the replacement cohort) to the same bed as occupied
by the participant lost from the initial (inception) cohort. The study commenced with 3980 residents
with an additional 3215 residents included as residents were lost to follow up due to death or
discharge. Details of new residents and those lost to follow-up were obtained from admission and
discharge records from each facility.
Analyses Baseline data were expressed as mean (± standard deviation, SD) with the unit of
analysis being clusters. Fracture incidence, falls and death were expressed per 100 person-years
follow-up. The product limit (Kaplan–Meier) method was used to determine the cumulative risk of
an event. There were no missing data for outcomes. The duration of follow-up was based on date of
study entry to date of an event. When no event occurred, follow-up duration was date of study entry
to date of study termination.
As individuals were 'nested' within clusters (facilities), the primary analysis was based on the mixed-
effects Cox’s proportional hazards model; effects of intervention, age and sex were fixed effects, and
the facility considered the random effect. (See Supplement for additional statistical analysis). The
results were expressed as a hazard ratio with 95% confidence limits. Model parameters were
estimated by the ‘coxme’ package. Mortality competing risk analysis was also conducted using the
Fine - Gray sub-distribution method with the 'cmprsk' package.
Between-group differences in serum biomarkers and measurements of body composition and bone
morphology at baseline were tested by the weighted t-test with cluster being the unit of analysis.
Biomarkers not normally distributed were log transformed. Effects of intervention were analysed by
the mixed-effects model in which the within-person change in outcome was modelled as a function
of treatment or control group, time of follow-up, age, weight and sex. All analyses used the R
Statistical Environment.
Ethics The study was approved by the Austin Hospital Human Research Ethics committee
(Project Number 04958) and is recorded on the Australian New Zealand Clinical Trials Registry
(ACTRN12613000228785).
Page 7 of 29
https://mc.manuscriptcentral.com/bmj
BMJ
123456789101112131415161718192021222324252627282930313233343536373839404142434445464748495051525354555657585960

Confidential: For Review Only
8
Results
Of the 60 facilities, 54 completed the 24-month intervention (figure 1). One control facility and 3
intervention facilities withdrew after randomisation. Two intervention facilities closed at months 15
and 20 but the data were included up to the date of closure. At baseline, the two groups had
comparable demographics and were vitamin D replete. Daily calcium and protein intakes were 689
(266) mg and 57 (16) grams respectively (Table 1, Supplementary figure S4).
Nutritional Changes Dairy food intake increased from 2.0 to 3.5 servings daily with
intervention (figure 2). This provided 562 (166) mg calcium, achieving 1142 (353) mg calcium daily,
and 12 (6) g protein achieving an intake of 69 (15) g (1.1 g/kg body weight) daily. In controls, dairy
intake remained at < 2 servings daily with intakes of 700 (247) mg calcium and 58 (14) g protein
(0.88 g/kg body weight) daily. There were no adverse gastrointestinal events related to the
intervention. No detectable within or between group differences in energy intake were observed
during follow-up (Figure 2). However, group differences were observed for the change in body
weight (Table 2). In absolute terms, there was no weight change in the intervention group (0.3 kg,
95%CI -0.8 to 1.4, P = 0.563). In controls, weight loss of 1.4 kg (95% CI 0.6 to 2.1, P = 0.0001) was
due to a 0.3 (95%CI -0.6 to 0.0) kg decline in appendicular lean mass (P = 0.028) and 0.8 kg (95%CI
-1.6 to -0.2) decline in total body fat mass (P = 0.017).
Fractures, falls and mortality During 90,557 person-months follow-up [mean (SD) 12.6 (8.9)
months], there were 324 fractures: 121 (3.7%) in the intervention group and 203 (5.2%) in controls
(HR 0.67, 95% CI, 0.48 to 0.93, P = 0.018); a 33% risk reduction. The incidence of hip fracture was
1.3% (n = 42) in the intervention group and 2.4% (n = 93) in controls; a 46% risk reduction (HR 0.54,
95% CI, 0.35 to 0.83, P = 0.005). The separation in cumulative incidence of fractures between the
groups achieved significance at 5 months for all fractures (P = 0.015) and hip fractures (P = 0.021)
(Figure 3). Competing risk analysis adjusted for mortality showed that intervention was associated
with average fracture risk reductions of 27% (HR 0.73, 95% CI, 0.58 to 0.92) for all fractures and
44% (HR 0.56, 95% CI, 0.39 to 0.82) for hip fractures. A Markovian analysis showed that the effect
was observed in the transition between no fracture to fracture (see supplementary file).
The cumulative incidence of falls was 57% (n = 1879) in the intervention group and 62% (n = 2423)
in controls; an 11% relative risk reduction (HR 0.89, 95% CI, 0.78 to 0.98, P = 0.041). The separation
in the incidence of falls between groups achieved significance at 3 months (P = .004) (Figure 3). All
but one fracture was the result of a fall. Mortality did not differ between the intervention and control
Page 8 of 29
https://mc.manuscriptcentral.com/bmj
BMJ
123456789101112131415161718192021222324252627282930313233343536373839404142434445464748495051525354555657585960

Confidential: For Review Only
9
groups (28%, n = 900 versus 28%, n = 1074 respectively) (HR 1.01, 95% CI, 0.43 to 3.08, P = 0.913)
(figure 3). The numbers needing treatment to prevent any fracture, hip fracture or a fall were 52, 82
and 17, respectively.
We examined the effects of the intervention on fracture risk and falls relative to controls in a post-
hoc analyses of the inception and replacement cohorts separately. The inception cohort was older
that the replacement cohort [86.5 (8.1) versus 85.2 (8.4) years, P < .001] but age did not differ between
the intervention and control groups in the inception cohort [86.7 (8.2) versus 86.4 (8.0) years, P =
0.245], nor did age differ between the two groups in the replacement cohort [85.1 (8.5) versus 85.3
(8.2) years, P = 0.601]. Significant reductions in all fractures, hip fractures and falls were observed
in the intervention group relative to the controls in both the inception and replacement cohorts (see
Supplementary figure 5).
Biochemistry and bone morphology The subgroup providing data for biochemistry, body
composition and bone morphology did not differ from the entire cohort in age (85.9 [8.2] versus 85.6
[8.2] years), proportion of women to men (70% versus 69%) and proportion with prior fractures (38%
versus 39%) respectively.
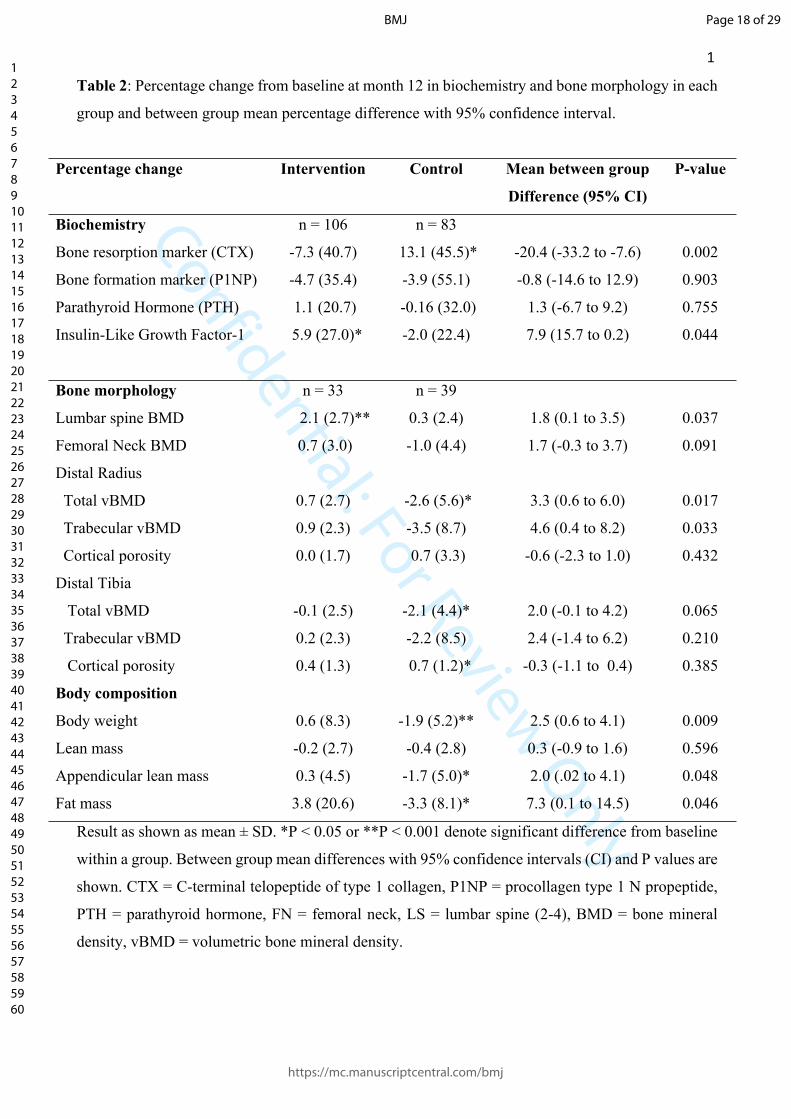
As shown in table 2, at 12 months, there was a 20.4% between-group difference in serum CTX (P =
0.002), the result of no change in the intervention group and a 13.1% increase in controls (P < 0.05).
There was no between-group difference in P1NP or PTH. There was a 7.9% between-group
difference in serum IGF-1 (P = 0.044), the result of a 5.9% increase in the intervention group (P <
0.05) and no change in controls.
There was a 1.8% between-group difference in spine BMD (P = 0.037), the result of a 2.1% increase
in the intervention group (P < 0.001) and no change in controls. The 1.7% between-group difference
in femoral neck BMD was not significant (P = 0.091). The 3.3% between-group difference in distal
radius total vBMD (P = 0.017) and 2.0% between-group difference in distal tibial total vBMD (P =
0.065) were the result of decreases at each site in controls (both P < 0.05). There was a 4.6% between-
group difference in distal radial trabecular vBMD (P = 0.033) due to a nonsignificant decrease in
controls and a 0.7% increase in distal tibia cortical porosity in controls (P < .05).
Page 9 of 29
https://mc.manuscriptcentral.com/bmj
BMJ
123456789101112131415161718192021222324252627282930313233343536373839404142434445464748495051525354555657585960

Confidential: For Review Only
10
Discussion
This nutritional approach using high-calcium and high-protein dairy foods to increase calcium and
protein intakes in institutionalized older adults replete in vitamin D was associated with a 33%
reduction in risk of fractures of any type, a 46% reduction in risk of hip fractures, and an 11%
reduction in risk of falls relative to controls. There was no group difference in all-cause mortality.
Most interventions aimed at reducing fracture risk target a pharmacological therapy to individuals
with osteoporosis because they are at high risk of fracture. This approach confers a large benefit to
the individual and does so cost-effectively, because few persons need to be treated to avert one event.
However, averting fractures in small numbers of persons at high risk does not reduce the burden of
fractures in the community.
The population burden of fractures - the number of events, the morbidity, mortality and cost to the
community arises from the vast numbers of individuals with risk factors that confer a modest
attributable risk to the individual.(14) For example, most fragility fractures in the community arise
among women with osteopenia (BMD T-score– 2.5 to 1 SD) because they form the largest segment
of the community.(15) Likewise, most fractures attributable to nutritional inadequacy arise among
the great many individuals with intakes of calcium and protein that are below recommended
levels.(16) This nutritional inadequacy confers a small attributable risk to the individual but accounts
for a large attributable fraction of the fracture burden in the community as a whole. This is the
Geoffrey Rose prevention paradox; a community-based approach producing a small benefit to an
individual may still confer a large benefit to the community.(14) Safety is essential because most
individuals treated may derive little or no benefit from the intervention. For example, the Dietary
Approach to Stop Hypertension study reduced blood pressure by replacing a ‘Western’ diet with a
diet rich in fruit, vegetables and low-fat dairy foods; an approach associated with fewer cardiovascular
events.(17)
Most nutrition-based studies assessing anti-fracture efficacy in aged-care residents and persons in the
community used pharmacological doses of calcium with or without vitamin D.(18) In a meta-analysis
of 17 of these studies, only two studies reported a fracture risk reduction - a study of nursing home
residents with calcium intakes < 600 mg/day and vitamin D levels < 50 nmol/L, and a community-
based study in women and men, ≥ 65 years of age with mean calcium intakes of 700 mg/day.(18) In
the remaining 15 studies, poor compliance, large numbers of dropouts and a low prevalence of the
risk factor may have contributed to the null findings.(19, 20) Benefits are unlikely if the prevalence
Page 10 of 29
https://mc.manuscriptcentral.com/bmj
BMJ
123456789101112131415161718192021222324252627282930313233343536373839404142434445464748495051525354555657585960

Confidential: For Review Only
11
of a risk factor (like inadequate calcium and protein intakes) is low.(21) For example, in the meta-
analysis, fracture risk reduction reported with treatment was confined to the 7272 individuals with
calcium intakes < 700 mg/day (RR 0.80; 95%CI 0.71 - 0.89), not the 45,241 individuals with calcium
intakes above 700 mg daily.(18)
The fracture risk reduction observed using calcium and protein rich foods in this study may have been
the result of attention to several of the above factors. Compliance was addressed by supervised
provision and consumption of the foods. Those lost to follow up were replaced by newly admitted
residents. We intentionally targeted a cohort at high risk for fracture in whom low calcium and protein
intakes were common, and so, were likely to partly contribute to the already high fracture burden in
this community.
This nutritional intervention produced two unanticipated novel observations. The risk reduction for
falls and fractures was detected by 3 and 5 months, respectively, and the relative risk reduction for
fractures was similar to that found in trials using potent antiresorptive therapy to treat high risk
individuals with osteoporosis. The two most likely explanations for each of these observations is a
risk reduction for falls and slowing progression of bone fragility. IGF-1 increased in the intervention
group only, while the decrease in appendicular lean mass was confined to controls, consistent with
the notion that protein intakes of 1 to 1.5 gm/kg/day is needed to prevent protein catabolism and
preserve or increase muscle mass in older adults, in particular, those at risk of malnutrition or
frailty.(22) The increase in serum CTX and deterioration in tibial and radial total vBMD in controls
was not observed in the intervention group consistent with slowing of bone loss and slowing of
microstructural deterioration.(23) These changes were modest, but slowing microstructural
deterioration disproportionately reduces progression of bone fragility because fragility increases as a
power function to the bone loss producing it.(24)
Mortality did not differ between the groups. Some, but not all, studies suggest milk consumption is
associated with increase mortality but consumption of yogurt and cheese (fermented foods) with
reduced mortality and favourable blood lipid profiles .(25),(26, 27) Fermented and non-fermented dairy
foods were used during the intervention. and milk consumption did not differ between the intervention
and control groups (data not shown).
The results were robust to interrogation using different models of analysis such as standard mixed
effects model, competing risk adjusted model and Markovian model. All gave a similar effect size.
Page 11 of 29
https://mc.manuscriptcentral.com/bmj
BMJ
123456789101112131415161718192021222324252627282930313233343536373839404142434445464748495051525354555657585960

Confidential: For Review Only
12
In addition, the benefits of the dietary intervention in reducing fracture risk and falls in the whole
cohort were replicated when analyses were done in the inception and replacement cohorts separately.
The study has several limitations. Less than half of the participants had follow-up longer than 15
months. However, the risk reduction in fractures and falls reduction was detected within 6 months.
Compliance was monitored in ~10% of residents. However, recorded intakes of 55,000 foods and
beverages consumed are likely representative of all residents as most, if not all, food is provided at
facilities. Facilities were randomised to intervention or control so we could not compare fracture risk
stratified by intakes of calcium and protein. Assessment of body composition, bone morphology and
biochemistry was confined to a subgroup of residents. Attrition of these participants limited the
power to examine differences in body composition, morphology and biochemistry between the
groups. Therefore, our ability to make inferences concerning the role of this intervention in slowing
microstructural deterioration and loss of muscle mass is limited. Serum PTH remained unchanged,
perhaps due to administration of the ~1100 mg calcium throughout the day as food, not as a single
supplement of elemental calcium.(28) Moreover this intervention used whole dairy foods so any
potential benefit of other components of the dairy matrix cannot be determined.
In conclusion, targeting a nutritional intervention of high-calcium and high-protein milk, yoghurt and
cheese to older individuals with low intakes of these nutrients reduced the risk of fractures and falls.
This is an effective, safe, widely available approach that is palatable and easily adhered to; features
that support the use of this nutritional intervention as a public health measure to avert fragility
fractures.
Page 12 of 29
https://mc.manuscriptcentral.com/bmj
BMJ
123456789101112131415161718192021222324252627282930313233343536373839404142434445464748495051525354555657585960

Confidential: For Review Only
13
References
1. Prince MJ, Wu F, Guo Y, Gutierrez Robledo LM, O'Donnell M, Sullivan R, et al. The burden of
disease in older people and implications for health policy and practice. Lancet.
2015;385(9967):549-62.
2. Australian Institute of Health and Welfare. Hip fracture incidence and hospitalisations in
Australia 2015-16. Canberra: AIHW; 2018.
3. Greenspan SL, Perera S, Ferchak MA, Nace DA, Resnick NM. Efficacy and safety of single-
dose zoledronic acid for osteoporosis in frail elderly women: a randomized clinical trial. JAMA
Intern Med. 2015;175(6):913-21.
4. Nordin BE. Calcium and osteoporosis. Nutrition. 1997;13(7-8):664-86.
5. Iuliano S, Poon S, Wang X, Bui M, Seeman E. Dairy food supplementation may reduce
malnutrition risk in institutionalised elderly. The British journal of nutrition. 2017;117(1):142-
7.
6. Chapuy MC, Arlot ME, Duboeuf F, Brun J, Crouzet B, Arnaud S, et al. Vitamin D3 and calcium
to prevent hip fractures in the elderly women. The New England journal of medicine.
1992;327(23):1637-42.
7. Neelemaat F, Lips P, Bosmans JE, Thijs A, Seidell JC, van Bokhorst-de van der Schueren MA.
Short-term oral nutritional intervention with protein and vitamin D decreases falls in
malnourished older adults. Journal of the American Geriatrics Society. 2012;60(4):691-9.
8. Moschonis G, Katsaroli I, Lyritis GP, Manios Y. The effects of a 30-month dietary intervention
on bone mineral density: the Postmenopausal Health Study. The British journal of nutrition.
2010;104(1):100-7.
9. Heaney RP, McCarron DA, Dawson-Hughes B, Oparil S, Berga SL, Stern JS, et al. Dietary
changes favorably affect bone remodeling in older adults. Journal of the American Dietetic
Association. 1999;99(10):1228-33.
10. Australian Government NHMRC, Department of Health and Ageing. Australian Guide to
Healthy Eating 2015 www.eatforhealth.gov.au.
11. Sherwin A, Nowson CA, McPhee J, Alexander JL, Wark JD, Flicker L. Nutrient intake as meals
in residential care facilities at the aged: validated visual estimation of plate waste. Australian
journal of nutrtion and dietetics. 1988;55:188-93.
12. Chapurlat R, Bui M, Sornay-Rendu E, Zebaze R, Delmas PD, Liew D, et al. Deterioration of
Cortical and Trabecular Microstructure Identifies Women With Osteopenia or Normal Bone
Mineral Density at Imminent and Long-Term Risk for Fragility Fracture: A Prospective Study.
Journal of bone and mineral research. 2020;35(5):833-44.
Page 13 of 29
https://mc.manuscriptcentral.com/bmj
BMJ
123456789101112131415161718192021222324252627282930313233343536373839404142434445464748495051525354555657585960

Confidential: For Review Only
14
13. Iuliano-Burns S, Woods J, King K, Ghasem Zadeh A, Wang X-F, Wang Q, et al. A dairy-based
protein, calcium and vitamin D supplement reduces falls and femoral neck bone loss in aged care
residents: a cluster randomised trial. Journal of Aging Research and Clinical Practice.
2012;2(2):141-6.
14. Rose G. Sick individuals and sick populations. 1985. [see comments.]. Bulletin of the World
Health Organization. 2001;79(10):990-6.
15. Siris ES, Chen YT, Abbott TA, Barrett-Connor E, Miller PD, Wehren LE, et al. Bone mineral
density thresholds for pharmacological intervention to prevent fractures. Archives of internal
medicine. 2004;164(10):1108-12.
16. Nutrient Reference Values for Australia and New Zealand. www.nrv.gov.au. 1991.
17. Jones NRV, Forouhi NG, Khaw KT, Wareham NJ, Monsivais P. Accordance to the Dietary
Approaches to Stop Hypertension diet pattern and cardiovascular disease in a British,
population-based cohort. Eur J Epidemiol. 2018;33(2):235-44.
18. Tang BM, Eslick GD, Nowson C, Smith C, Bensoussan A. Use of calcium or calcium in
combination with vitamin D supplementation to prevent fractures and bone loss in people aged
50 years and older: a meta-analysis. Lancet. 2007;370(9588):657-66.
19. Reid IR, Mason B, Horne A, Ames R, Reid HE, Bava U, et al. Randomized controlled trial of
calcium in healthy older women. The American journal of medicine. 2006;119(9):777-85.
20. Grant AM, Avenell A, Campbell MK, McDonald AM, MacLennan GS, McPherson GC, et al.
Oral vitamin D3 and calcium for secondary prevention of low-trauma fractures in elderly people
(Randomised Evaluation of Calcium Or vitamin D, RECORD): a randomised placebo-controlled
trial. Lancet. 2005;365(9471):1621-8.
21. Heaney RP. Vitamin D--baseline status and effective dose. The New England journal of
medicine. 2012;367(1):77-8.
22. Bauer J, Biolo G, Cederholm T, Cesari M, Cruz-Jentoft AJ, Morley JE, et al. Evidence-based
recommendations for optimal dietary protein intake in older people: a position paper from the
PROT-AGE Study Group. Journal of the American Medical Directors Association.
2013;14(8):542-59.
23. Johansson H, Oden A, Kanis JA, McCloskey EV, Morris HA, Cooper C, et al. A meta-analysis
of reference markers of bone turnover for prediction of fracture. Calcified tissue international.
2014;94(5):560-7.
24. Schaffler MB, Burr DB. Stiffness of compact bone: effects of porosity and density. J Biomech.
1988;21(1):13-6.
Page 14 of 29
https://mc.manuscriptcentral.com/bmj
BMJ
123456789101112131415161718192021222324252627282930313233343536373839404142434445464748495051525354555657585960

Confidential: For Review Only
15
25. Michaelsson K, Wolk A, Langenskiold S, Basu S, Warensjo Lemming E, Melhus H, et al. Milk
intake and risk of mortality and fractures in women and men: cohort studies. Bmj.
2014;349:g6015.
26. Dehghan M, Mente A, Rangarajan S, Sheridan P, Mohan V, Iqbal R, et al. Association of dairy
intake with cardiovascular disease and mortality in 21 countries from five continents (PURE): a
prospective cohort study. Lancet. 2018;392(10161):2288-97.
27. Kiessling G, Schneider J, Jahreis G. Long-term consumption of fermented dairy products over
6 months increases HDL cholesterol. European journal of clinical nutrition. 2002;56(9):843-9.
28. Bristow SM, Gamble GD, Stewart A, Kalluru R, Horne AM, Reid IR. Acute effects of calcium
citrate with or without a meal, calcium-fortified juice and a dairy product meal on serum calcium
and phosphate: a randomised cross-over trial. The British journal of nutrition.
2015;113(10):1585-94.
Page 15 of 29
https://mc.manuscriptcentral.com/bmj
BMJ
123456789101112131415161718192021222324252627282930313233343536373839404142434445464748495051525354555657585960
Confidential: For Review Only
16
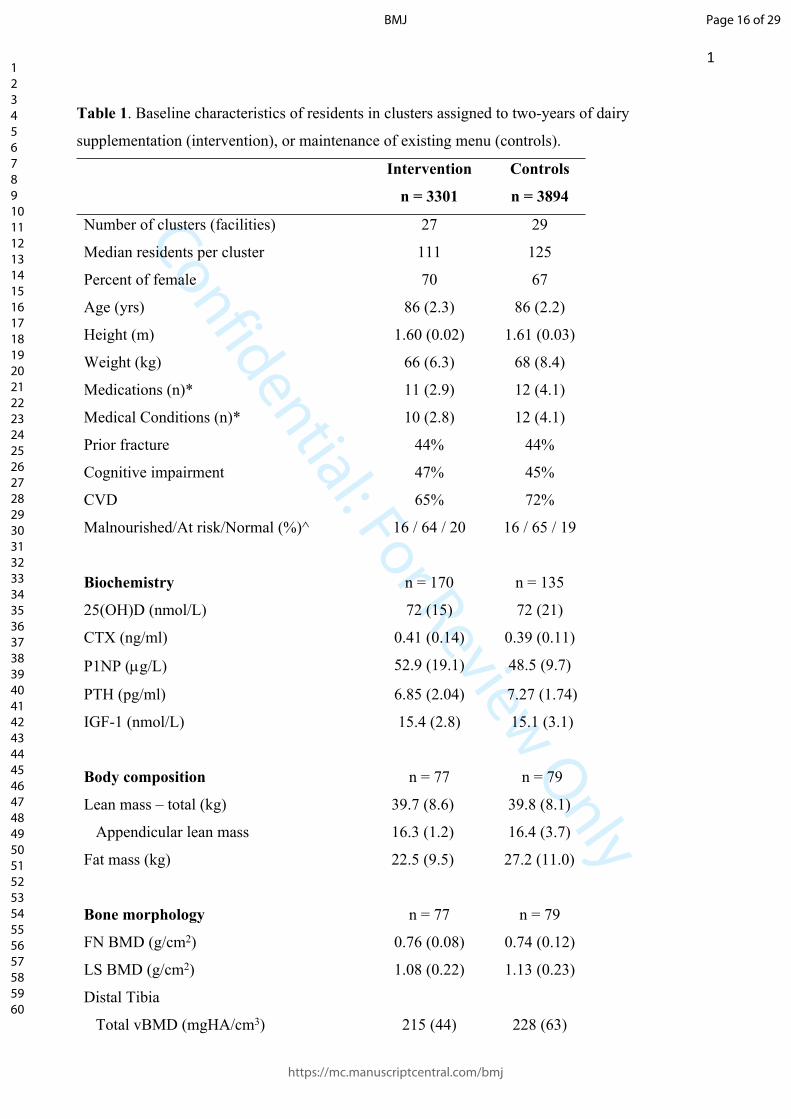
Table 1. Baseline characteristics of residents in clusters assigned to two-years of dairy
supplementation (intervention), or maintenance of existing menu (controls).
Intervention
n = 3301
Controls
n = 3894
Number of clusters (facilities) 27 29
Median residents per cluster 111 125
Percent of female 70 67
Age (yrs) 86 (2.3) 86 (2.2)
Height (m) 1.60 (0.02) 1.61 (0.03)
Weight (kg) 66 (6.3) 68 (8.4)
Medications (n)* 11 (2.9) 12 (4.1)
Medical Conditions (n)* 10 (2.8) 12 (4.1)
Prior fracture 44% 44%
Cognitive impairment 47% 45%
CVD 65% 72%
Malnourished/At risk/Normal (%)^ 16 / 64 / 20 16 / 65 / 19
Biochemistry n = 170 n = 135
25(OH)D (nmol/L) 72 (15) 72 (21)
CTX (ng/ml) 0.41 (0.14) 0.39 (0.11)
P1NP (g/L) 52.9 (19.1) 48.5 (9.7)
PTH (pg/ml) 6.85 (2.04) 7.27 (1.74)
IGF-1 (nmol/L) 15.4 (2.8) 15.1 (3.1)
Body composition n = 77 n = 79
Lean mass – total (kg) 39.7 (8.6) 39.8 (8.1)
Appendicular lean mass 16.3 (1.2) 16.4 (3.7)
Fat mass (kg) 22.5 (9.5) 27.2 (11.0)
Bone morphology n = 77 n = 79
FN BMD (g/cm2) 0.76 (0.08) 0.74 (0.12)
LS BMD (g/cm2) 1.08 (0.22) 1.13 (0.23)
Distal Tibia
Total vBMD (mgHA/cm3) 215 (44) 228 (63)
Page 16 of 29
https://mc.manuscriptcentral.com/bmj
BMJ
123456789101112131415161718192021222324252627282930313233343536373839404142434445464748495051525354555657585960

Confidential: For Review Only
17
Cortical porosity (%) 75 (5.6) 75 (6.6)
Trabecular vBMD (mgHA/cm3) 155 (35) 167 (47)
Distal Radius
Total vBMD (mgHA/cm3) 257 (41) 247 (68)
Cortical porosity (%) 68 (3.8) 69 (7.5)
Trabecular vBMD (mgHA/cm3) 155 (34) 148 (47)
Results are shown as mean (SD) or *median (interquartile range). ^Mini Nutrition Assessment Score;
24-30 = normal nutritional status, 17 – 23.5 = at risk of malnutrition, <17 = malnourished. 25(OH)D
= 25-hydroxy-vitamin D (25(OH)D), CTX = C-terminal telopeptide of type 1 collagen, P1NP =
procollagen type 1 N propeptide, PTH = parathyroid hormone, IGF-1 = Insulin-like Growth Factor
1, FN = femoral neck, LS = lumbar spine (2-4), BMD = bone mineral density, vBMD = volumetric
bone mineral density.
Page 17 of 29
https://mc.manuscriptcentral.com/bmj
BMJ
123456789101112131415161718192021222324252627282930313233343536373839404142434445464748495051525354555657585960
Confidential: For Review Only
18
Table 2: Percentage change from baseline at month 12 in biochemistry and bone morphology in each
group and between group mean percentage difference with 95% confidence interval.
Percentage change Intervention Control Mean between group
Difference (95% CI)
P-value
Biochemistry n = 106 n = 83
Bone resorption marker (CTX) -7.3 (40.7) 13.1 (45.5)* -20.4 (-33.2 to -7.6) 0.002
Bone formation marker (P1NP) -4.7 (35.4) -3.9 (55.1) -0.8 (-14.6 to 12.9) 0.903
Parathyroid Hormone (PTH) 1.1 (20.7) -0.16 (32.0) 1.3 (-6.7 to 9.2) 0.755
Insulin-Like Growth Factor-1 5.9 (27.0)* -2.0 (22.4) 7.9 (15.7 to 0.2) 0.044
Bone morphology n = 33 n = 39
Lumbar spine BMD 2.1 (2.7)** 0.3 (2.4) 1.8 (0.1 to 3.5) 0.037
Femoral Neck BMD 0.7 (3.0) -1.0 (4.4) 1.7 (-0.3 to 3.7) 0.091
Distal Radius
Total vBMD 0.7 (2.7) -2.6 (5.6)* 3.3 (0.6 to 6.0) 0.017
Trabecular vBMD 0.9 (2.3) -3.5 (8.7) 4.6 (0.4 to 8.2) 0.033
Cortical porosity 0.0 (1.7) 0.7 (3.3) -0.6 (-2.3 to 1.0) 0.432
Distal Tibia
Total vBMD -0.1 (2.5) -2.1 (4.4)* 2.0 (-0.1 to 4.2) 0.065
Trabecular vBMD 0.2 (2.3) -2.2 (8.5) 2.4 (-1.4 to 6.2) 0.210
Cortical porosity 0.4 (1.3) 0.7 (1.2)* -0.3 (-1.1 to 0.4) 0.385
Body composition
Body weight 0.6 (8.3) -1.9 (5.2)** 2.5 (0.6 to 4.1) 0.009
Lean mass -0.2 (2.7) -0.4 (2.8) 0.3 (-0.9 to 1.6) 0.596
Appendicular lean mass 0.3 (4.5) -1.7 (5.0)* 2.0 (.02 to 4.1) 0.048
Fat mass 3.8 (20.6) -3.3 (8.1)* 7.3 (0.1 to 14.5) 0.046
Result as shown as mean ± SD. *P < 0.05 or **P < 0.001 denote significant difference from baseline
within a group. Between group mean differences with 95% confidence intervals (CI) and P values are
shown. CTX = C-terminal telopeptide of type 1 collagen, P1NP = procollagen type 1 N propeptide,
PTH = parathyroid hormone, FN = femoral neck, LS = lumbar spine (2-4), BMD = bone mineral
density, vBMD = volumetric bone mineral density.
Page 18 of 29
https://mc.manuscriptcentral.com/bmj
BMJ
123456789101112131415161718192021222324252627282930313233343536373839404142434445464748495051525354555657585960

Confidential: For Review Only
19
Figure 1. Flow chart for participating aged-care facilities. Of 108 eligible facilities, 48 were
excluded leaving 60 randomised to intervention or control. Three intervention and one control
facility did not commence leaving 27 intervention and 29 control facilities participating of which two
intervention facilities closed during the study period. The median number of residents in the
intervention and control groups were 111 (IQR 75 to 147) and 125 (IQR 88 to 163) respectively; P
= 0.42 by Wilcoxon's rank test.
Aged-Care facilities assessed for eligibility (n = 108)
Excluded (n = 48) No response (n = 7)Busy / other projects (n = 22)Organizational decision (n = 16)Facility closure (n = 3)
Randomized (n = 60)
Intervention (n = 30) n = 27 n = 12 n = 11
n = 4n = 3
Control (n = 30) n = 29 n = 11 n = 13n = 5 n = 1
n = 2 Facility closed: month 15 (n = 1)
month 20 (n = 1)
n = 0
n = 27 n = 25n = 1n = 1111
75 to 147
n = 29 n = 29n = 0n = 0125
88 to 163
Commenced - total - 50-99 residents - 100-199 residents - 200+ residentsDid not commence
Lost to follow up
Analyzed
Total Completed 24 months
20 months 15 monthsResident / facility Interquartile range
Page 19 of 29
https://mc.manuscriptcentral.com/bmj
BMJ
123456789101112131415161718192021222324252627282930313233343536373839404142434445464748495051525354555657585960

Confidential: For Review Only
20
Figure 2. Mean (SD) daily dietary intake of dairy servings, energy, calcium and protein at
baseline (regular menu) and during the two-year study period in the intervention group (orange line)
compared to controls (blue line). *P < 0.05 denotes significant difference between groups at the
corresponding time point.
Months
5
4
3
2
1
0
Dairy Servings
0 3 6 9 12 15 18 21 24
Servings/day
* * **
* *
800
400
1600
1200
0
Dietary Calcium
0 3 6 9 12 15 18 21 24
mg/day
* * * ** *
0 3 6 9 12 15 18 21 24
105
90
75
60
45
Dietary Proteing/day
* *
** *
10
8
6
4
2
0
Energy
0 3 6 9 12 15 18 21 24
Mj/day
Months
Page 20 of 29
https://mc.manuscriptcentral.com/bmj
BMJ
123456789101112131415161718192021222324252627282930313233343536373839404142434445464748495051525354555657585960

Confidential: For Review Only
21
Figure 3. Cumulative probability of an event over 24-months for (a) all fractures, (b) hip
fractures, (c) falls and (d) mortality in intervention group (orange line) and controls (blue line). The
numbers of participants in the two groups at risk for each event are shown below the panels.
Page 21 of 29
https://mc.manuscriptcentral.com/bmj
BMJ
123456789101112131415161718192021222324252627282930313233343536373839404142434445464748495051525354555657585960

Confidential: For Review Only
22
Acknowledgements
We thank dieticians; Anishya Gangadharan, Annemarie Murrell, Caryn Batchelor, Deanna Lavanty,
Ella Smits, Lexie Griffin, Stephanie Renehan, Samantha Chiodo, Sally Collins, Simone Karafilis,
Simone Mastronado, Kako Choi, for assisting in data collection, food service specialists Brenda
Cook, Denise Burbidge and Megan Dodds for their work with food service staff and research nurses
Angela Sones and Kylie King. This study was support by grants from Dairy Australia (grant number
TP 701722), California Dairy Research Foundation, National Dairy Council, Aarhus University
Hospital and Danish Dairy Research Foundation, Fonterra Co-operative Group Ltd, Dutch Dairy
Association, Dairy Council of California, Dairy Farmers of Canada the Centre national
interprofessionnel de l’economie laitiere, University of Melbourne, Austin Hospital Medical
Research Foundation and Sir Edward Dunlop Medical Research Foundation. The funding groups
played no role in the design, execution, analyses or interpretation of the data or any aspect that is
pertinent to the study. We dedicate this manuscript to the late Dr Gonca Pasin of the California Dairy
Research Foundation whose drive, enthusiasm and vision were instrumental in the initiation of this
project. SI has received lecture fees from Abbott. TVN has received research support and lecture fees
from Amgen, MSD and Novartis. ES has received research support from Amgen and MSD, and has
received lecture fees from Amgen, Eli Lilly, and Allergan. ES is a director and board member of
StraxCorp. SI was involved in the conception, design, planning and management of the study, data
acquisition, interpretation of results, drafting the manuscript and critically reviewing or revising the
manuscript for important intellectual content. SP was involved in data acquisition and management,
and critically reviewing or revising the manuscript. JR was involved in data acquisition and
management, and critically reviewing or revising the manuscript. MB was involved in data analysis,
interpretation of results and critically reviewing or revising the manuscript for important intellectual
content. XW was involved in data analysis, interpretation of results and critically reviewing or
revising the manuscript. LDG was involved in the design of the study and critically reviewing or
revising the manuscript. MVL was involved in the design of the study, data acquisition and critically
reviewing or revising the manuscript. AGZ was involved in data acquisition and interpretation of
results. TN was involved in the design of the study, data analysis, interpretation of results, and
critically reviewing or revising the manuscript. ES was involved in the conception and design of the
study, interpretation of results, drafting the manuscript and critically reviewing or revising the
manuscript for important intellectual content.
Page 22 of 29
https://mc.manuscriptcentral.com/bmj
BMJ
123456789101112131415161718192021222324252627282930313233343536373839404142434445464748495051525354555657585960

Confidential: For Review Only
1
Supplementary Material
Supplementary Figure S1: Flow chart for assessment of biochemistry at baseline and month 12 among residents in aged-care facilities randomized to intervention or control.
Residents who consented to provide serum samples (n = 371)
Excluded (n = 69) Cognitive decline (n = 2)Deceased (n = 6)Hospitalized / ill health (n = 11)Unavailable / left facility (n = 15)Refused / withdrew (n = 13)Unknown / other (n = 22)
Intervention (n = 173) Control (n = 129)
Total n = 67 n = 5
n = 17 n = 19n = 5n = 7
n = 14
Analyzed (n = 106) Analyzed (n = 83)
Total n = 46 n = 9n = 5
n = 16n = 8n = 6n = 2
Baseline assessment
Lost to follow up
Cognitive declineDeceasedHospitalized / ill healthUnavailable / left facilityRefused / withdrewUnknown / other
Month 12 assessment
Page 23 of 29
https://mc.manuscriptcentral.com/bmj
BMJ
123456789101112131415161718192021222324252627282930313233343536373839404142434445464748495051525354555657585960

Confidential: For Review Only
2
Supplementary Figure S2: Flow chart for assessment of bone and body composition at baseline and month 12 among residents in aged-care facilities randomized to intervention or control.
Residents who consented to bone and body composition assessment (n = 371)
Excluded (n = 215) Cognitive decline (n = 20)Deceased (n = 12)Hospitalized / ill health (n = 45)Unavailable / left facility (n = 18)Refused / withdrew (n = 40)Poor mobility (n = 18)Regional facility (n = 35)Unknown / other (n = 27)
Intervention (n = 80) Control (n = 76)
Total n = 47 n = 6n = 8n = 9n = 3n = 3n = 9n = 9
Analyzed (n = 33) Analyzed (n = 39)
Total n = 37 n = 4n = 2
n = 13n = 6n = 3n = 6n = 3
Baseline assessment
Lost to follow up
Cognitive declineDeceasedHospitalized / ill healthUnavailable / left facilityRefused / withdrewPoor mobilityUnknown / other
Month 12 assessment
Page 24 of 29
https://mc.manuscriptcentral.com/bmj
BMJ
123456789101112131415161718192021222324252627282930313233343536373839404142434445464748495051525354555657585960

Confidential: For Review Only
3
Supplementary Figure S3: The median number of residents in each facility in the intervention (orange bars) and control (blue bar) groups were 111 (IQR 75 to 147) and 125 (IQR 88 to 163) respectively; not different (P = 0·42 by Wilcoxon's rank test). There were 12 intervention and 11 control facilities with between 50-99 residents, 11 intervention and 13 control facilites with between 100 to 199 residents and 4 intervention and 5 control facilities with over 200 residents.
0
50
100
150
200
250
300
Number ofResidents
Facilities
Page 25 of 29
https://mc.manuscriptcentral.com/bmj
BMJ
123456789101112131415161718192021222324252627282930313233343536373839404142434445464748495051525354555657585960

Confidential: For Review Only
4
Supplementary Figure S4: Distribution of the potential confounders. (a) Age, (b) Body Mass Index, (c) proportion of females, and (d) proportion with a fracture history among residents in control (blue) and intervention (orange) facilities. No significant between-group differences were observed.
Page 26 of 29
https://mc.manuscriptcentral.com/bmj
BMJ
123456789101112131415161718192021222324252627282930313233343536373839404142434445464748495051525354555657585960

Confidential: For Review Only
5
Further statistical analysis
Power consideration Based on a fracture rate of 7% per year in older Australians living in aged-care, (14% over the 2-year study) 2000 participant are needed to detect a 30% reduction in fractures with 80% power.(1, 2) We used an estimation of an average of 60 residents per facility, so that 50 facilities will provide a minimum of 3600 residents. With an estimated 20% yearly attrition rate, 2400 residents will remain by the completion of the 2-year study providing the sample size needed to detect a fracture rate reduction of 30% at 80% power, P < 0·05.
Data Analysis The study was designed as a cluster randomized clinical trial where participants were clustered within facilities. There are two approaches to the analysis of data: patient-level and cluster-level. We used the traditional cluster-level approach with the mixed effects model to analyze the data. Let the hazard of an outcome for an individual i at time t be . The hazard ℎ𝑖(𝑡)was modelled as follows: , where ℎ𝑖(𝑡) = ℎ0(𝑡)𝑒𝑥𝑝(𝛼𝑗 + 𝛽1𝑇𝑟𝑒𝑎𝑡𝑚𝑒𝑛𝑡 + 𝛽2𝐴𝑔𝑒 + 𝛽3𝑆𝑒𝑥) 𝛼𝑗denotes the random effect associated with the jth facility; , , and represent the effect of 𝛽1 𝛽2 𝛽3intervention, participant's age and sex, respectively. In this formulation, the random effect can be thought of as a random intercept that modifies the linear predictor, while the exponential of the random effect has a multiplicative effect on the baseline hazard function. Scaled Schoenfeld residuals showed that the assumption of proportionality was satisfied. The R package 'coxme' was used to estimate the model parameters.(3) We further used the analyzed the data by taking into account the competing risk of death, and the results remained statistically unchanged. The analysis was conducted on the basis of the intention to treat principle (ITT).
Markovian analysis We also conducted a Markvian analysis to gain insights into the transition between states. There were 3 states: (i) no fracture at baseline; (ii) survived and sustained a fracture; and (iii) death. The following table presents the hazard ratio for each pair of states:
Effect of intervention (intervention vs control)From To Hazard Ratio No fracture Fracture 0·71 (0·56 - 0·89)No fracture Death 1·03 (0·94 - 1·13)Fracture Death 1·20 (0·76 - 1·90)
References
1. Chapuy MC, Arlot ME, Duboeuf F, Brun J, Crouzet B, Arnaud S, et al. Vitamin D3 and calcium to prevent hip fractures in the elderly women. The New England journal of medicine. 1992;327(23):1637-42.
2. Sanders KM, Nicholson GC, editors. Anti-fracture treatment of nursing home and hostel residetns is cost effective. 10th National Osteoporosis Society Annual Conference; 2004; Harigate, UK.
3. Therneau TM, Grambsch, P. M., Pankratz, V. S. Penalized survival models and frailty. Journal of Computational and Graphical Statistics. 2003;12(1):156-75.
Page 27 of 29
https://mc.manuscriptcentral.com/bmj
BMJ
123456789101112131415161718192021222324252627282930313233343536373839404142434445464748495051525354555657585960

Confidential: For Review Only
6
Supplementary table S1: Total number and type of first fractures over a 2-year period among residents in the intervention and control groups.
Fracture type Intervention ControlAnkle / tibia / fibula 2 5Facial / nasal / skull 5 8Femur 5 8Finger / hand 3 3Foot / toe 3 2Hip 42 93Patella 2 0Humerus 6 17Pelvis 10 16Ribs 10 14Scapula / clavicle 4 6Spine 10 13Sternum 0 1Wrist / radius / ulna 19 17
Page 28 of 29
https://mc.manuscriptcentral.com/bmj
BMJ
123456789101112131415161718192021222324252627282930313233343536373839404142434445464748495051525354555657585960

Confidential: For Review Only
7
Supplementary figure 5: The respective cumulative incidence of any fracture was lower in the intervention than control group in both the inception cohort (4·5% vs. 6·4% respectively, P = 0·009, panel a) and replacement cohort, (2·5% vs. 3·6% respectively, P = 0·044, panel b). Likewise, the cumulative incidence of hip fractures was lower in the intervention than control group in the inception cohort (1·6% vs. 2·8% respectively, P = 0·012, panel c) and replacement cohort (0·8% vs. 1·9% respectively, P = 0.014, panel d). The incidence of participants having falls was also lower in the intervention than control group in the inception (64·2% vs 70·0%, P < 0·001, panel e) and replacement (46·6% vs 53·7%, P < 0·001, panel f) cohorts.
Page 29 of 29
https://mc.manuscriptcentral.com/bmj
BMJ
123456789101112131415161718192021222324252627282930313233343536373839404142434445464748495051525354555657585960