Embed Size (px)
Citation preview
Different Ways to Measure Fidelity of Implementation of PBISof Implementation of PBIS
“Brown Bag” PresentationgMarch 5, 2012
Tary J. Tobin, Ph.D.bi @ [email protected]
Educational and Community SupportsUniversity of OregonUniversity of Oregon
Eugene, OR
AcknowledgementsAcknowledgementsThe primary resources for this presentation can be found on the following web sites:
OSEP Technical Assistance Center on Positive Behavioral Interventions and Supports:http://pbis.org
Educational and Community Supports (ECS):https://www.pbisassessment.orghttp://www.pbiseval.org/Resources.aspxhttp://www.uoecs.orgp // g
2
Advance Organizer: 5 SectionsAdvance Organizer: 5 Sections
I. What is fidelity of implementation (FOI)?I. What is fidelity of implementation (FOI)?II. What is Positive Behavior Interventions and Supports (PBIS)?and Supports (PBIS)?
III. Why take time to measure fidelity?
IV Examples of PBIS measures of fidelityIV. Examples of PBIS measures of fidelity (With some new data about the Team I l i Ch kli )Implementation Checklist)
V. Your experiences with this? Your thoughts?

I. What is fidelity of implementation (FOI)?
• Example: Crash diet plan: Cabbage Soup!Example: Crash diet plan: Cabbage Soup!
• Definition: “the extent to which the delivery of an intervention adheres to the protocol oran intervention adheres to the protocol or program model originally developed”
(Mowbray et al. 2003, p. 315).
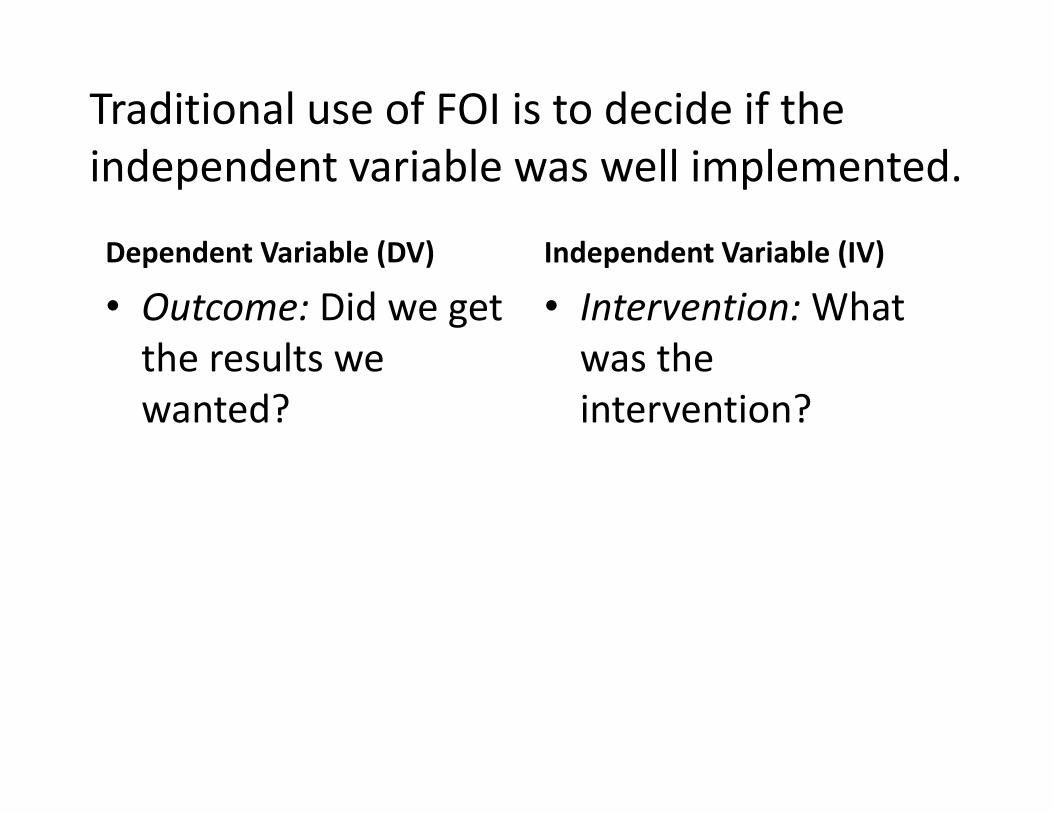
Traditional use of FOI is to decide if the i d d i bl ll i l dindependent variable was well implemented.
Dependent Variable (DV) Independent Variable (IV)Dependent Variable (DV)
• Outcome: Did we get the results we
Independent Variable (IV)
• Intervention:What was thethe results we
wanted? was the intervention?
In the past, FOI often was just d d f b dassumed instead of being measured.
• When it was measured in school research itWhen it was measured in school research, it often was used by researchers to explain why some schools got good results and some gotsome schools got good results and some got bad results.
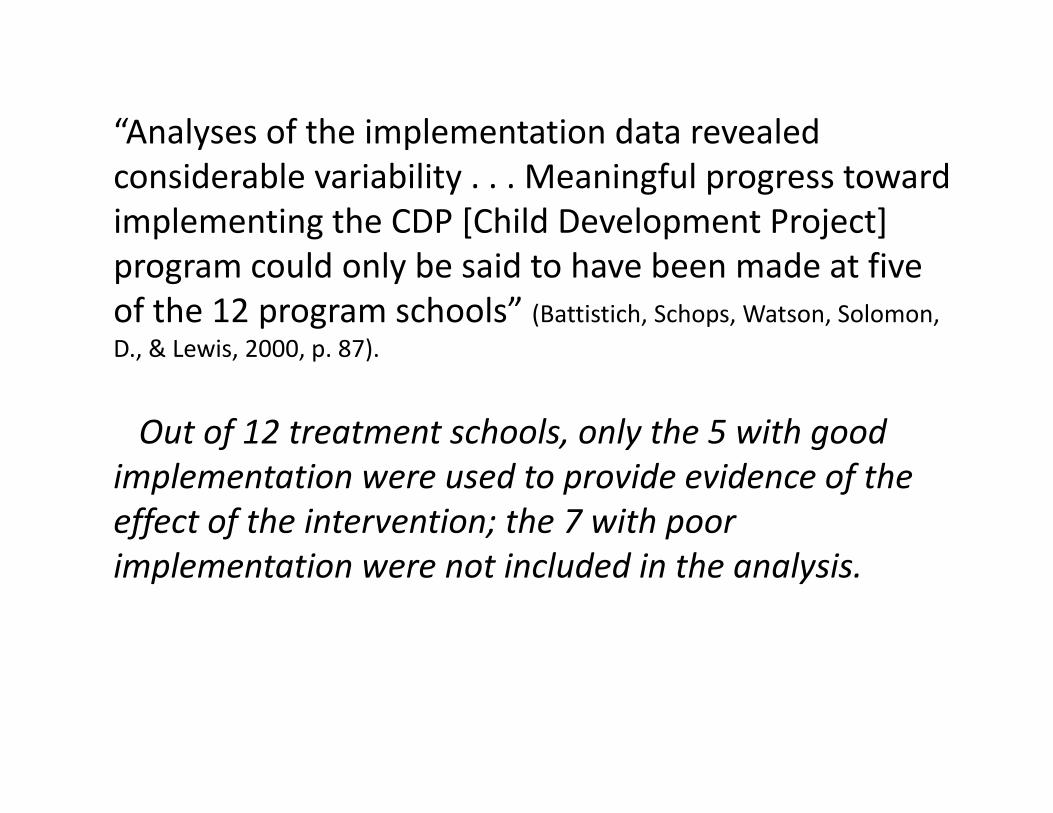
“Analyses of the implementation data revealed considerable variability . . . Meaningful progress toward implementing the CDP [Child Development Project]
ld l b d h b d fprogram could only be said to have been made at five of the 12 program schools” (Battistich, Schops, Watson, Solomon, D., & Lewis, 2000, p. 87).D., & Lewis, 2000, p. 87).
Out of 12 treatment schools, only the 5 with good implementation were used to provide evidence of the effect of the intervention; the 7 with poor implementation were not included in the analysisimplementation were not included in the analysis.

A different perspective on FOIA different perspective on FOI
• Fidelity measurement is becoming part of theFidelity measurement is becoming part of the independent variable with respect to program implementation in schoolsimplementation in schools.
• “Through the use of self‐assessment, teachers themselves become the originators of changethemselves become the originators of change and professional learning” (Powell 2000, p. 47)47).
II. What is Positive Behavior d ( )Interventions and Supports (PBIS)?
• You probably know!You probably know!
• Several definitions exist
i “ d b k” d “fill i h bl k”• Here is a “word bank” and a “fill in the blank” for one definition ‐‐

Word Bank for “Fill in the Blank”Word Bank for Fill in the Blank
A. all F. data‐basedA. all
B. diminishing problem behavior
F. data based decision‐making
G. social and academic p
C. intensive individual
D. framework
gains
H. applied behavior D. framework
E. social culture
ppanalysis
I. evidence‐based practices
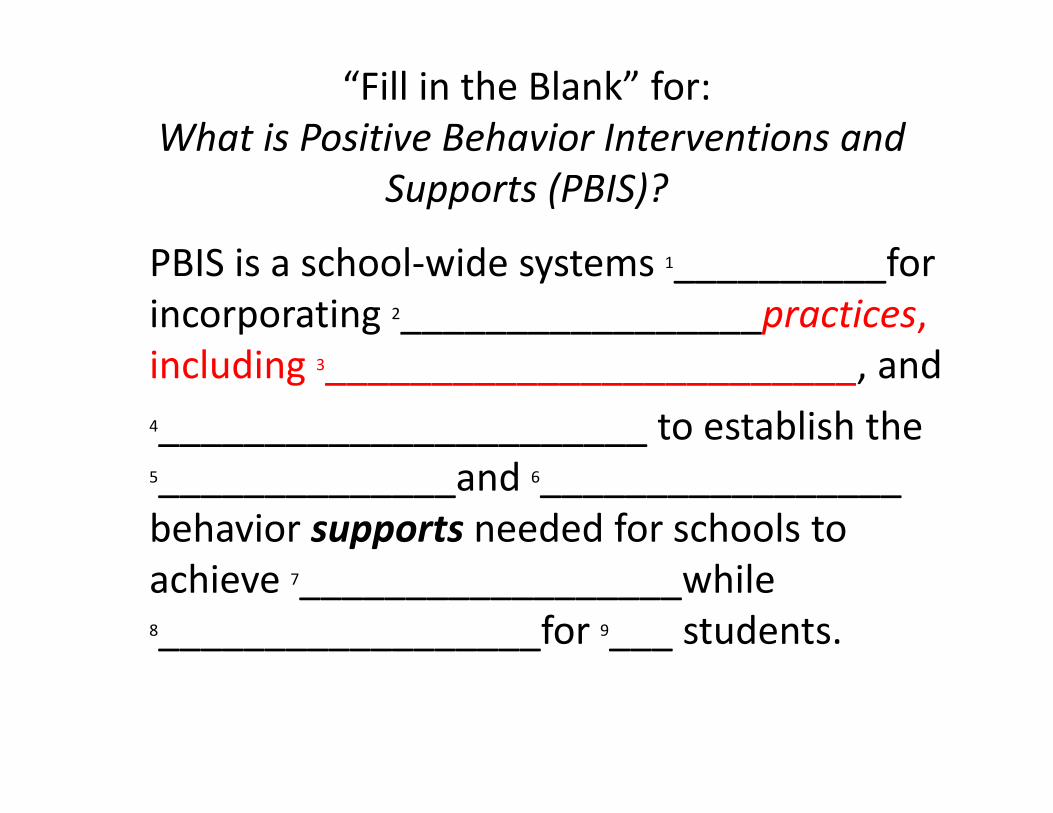
“Fill in the Blank” for:What is Positive Behavior Interventions andWhat is Positive Behavior Interventions and
Supports (PBIS)?
PBIS i h l id t fPBIS is a school‐wide systems 1__________for incorporating 2_________________practices, i l di dincluding 3_________________________, and 4_______________________ to establish the 5______________and 6_________________ behavior supports needed for schools to achieve 7__________________while 8__________________for 9___ students.
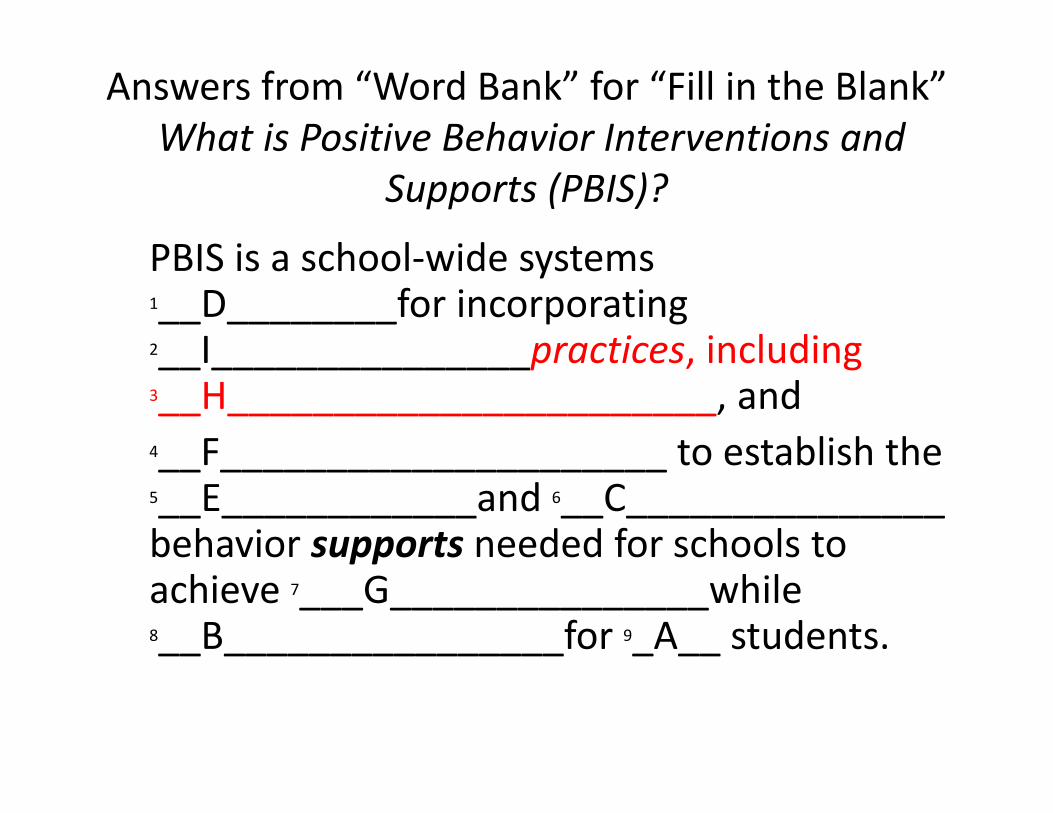
Answers from “Word Bank” for “Fill in the Blank” What is Positive Behavior Interventions andWhat is Positive Behavior Interventions and
Supports (PBIS)?
PBIS is a school wide systemsPBIS is a school‐wide systems 1__D________for incorporating 2 I practices including__I_______________practices, including 3__H_______________________, and 4 F to establish the__F_____________________ to establish the 5__E____________and 6__C_______________ behavior supports needed for schools to ppachieve 7___G_______________while 8__B________________for 9_A__ students.
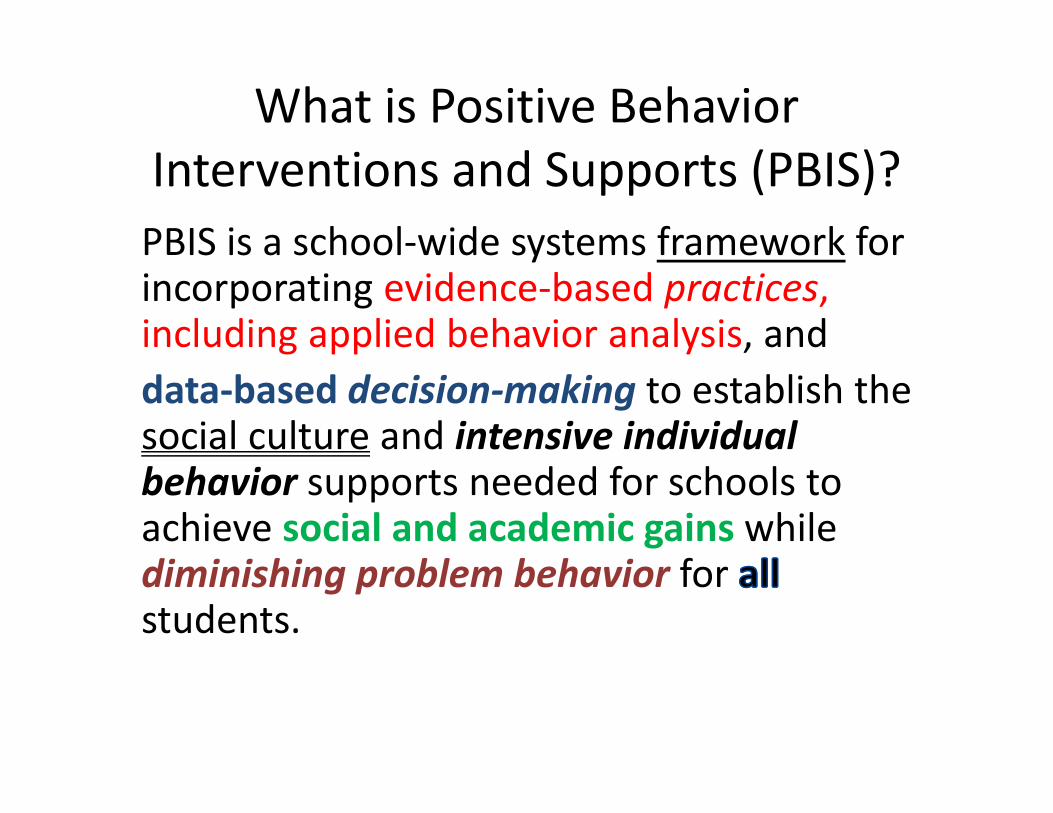
What is Positive Behavior d ( )Interventions and Supports (PBIS)?
PBIS is a school‐wide systems framework forPBIS is a school wide systems framework for incorporating evidence‐based practices, including applied behavior analysis, and data‐based decision‐making to establish the social culture and intensive individual behavior supports needed for schools to achieve social and academic gains while di i i hi bl b h i fdiminishing problem behavior for students.
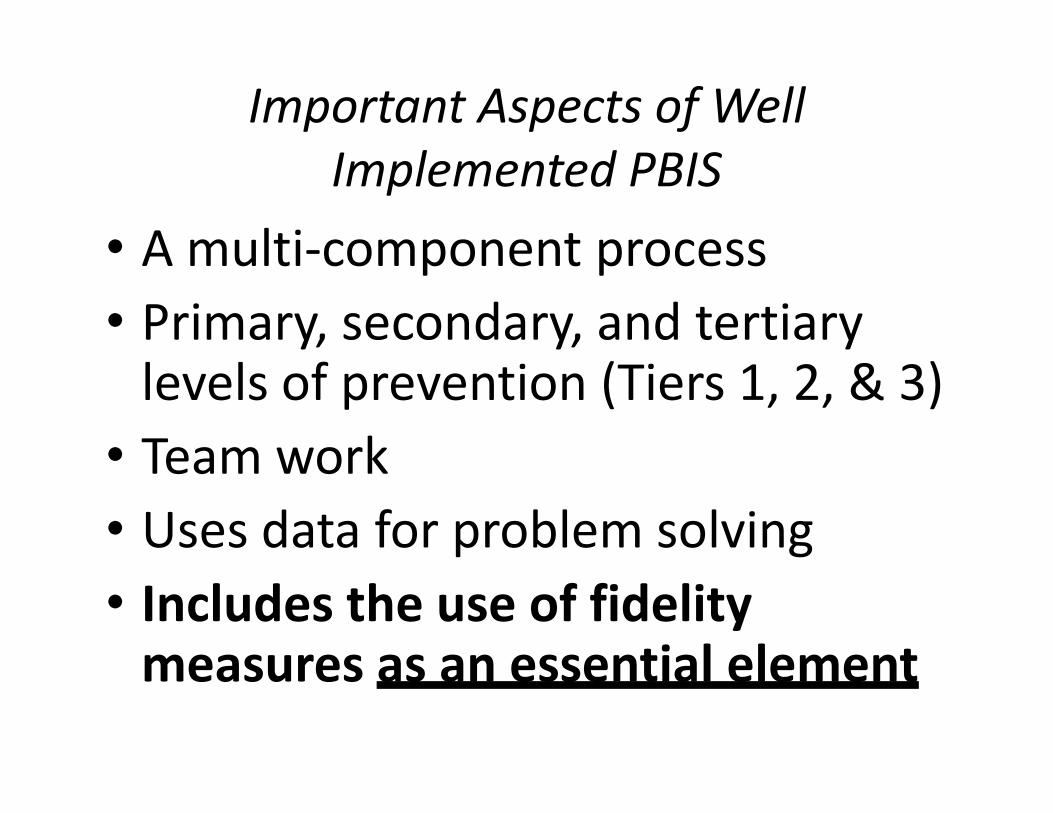
Important Aspects of Well l dImplemented PBIS
• A multi‐component process• A multi‐component process • Primary, secondary, and tertiary levels of prevention (Tiers 1, 2, & 3) • Team work• Team work• Uses data for problem solving• Includes the use of fidelity measures as an essential elementmeasures as an essential element
III. Why take time to measure f d lfidelity?
• Research / Summative EvaluationResearch / Summative Evaluation
• Action Planning / Formative Evaluation
Research / SummativeResearch / Summative
• Compare outcome measures before and afterCompare outcome measures, before and after the intervention – did it work? Examples:◆Fewer suspensions◆Fewer suspensions◆Academic achievement improvedQ it ti ? W it did ll d it?• Quit or continue? – Wait, did we really do it?
• Is PBIS itself – the whole approach ‐‐ an “evidence‐based intervention?”
Action Planning / FormativeAction Planning / Formative
• Figure out how to improveFigure out how to improve
• Like self‐management
S i lik “ i ” h di i• PBIS is more like a “recipe” than a medication
• Which ingredient is missing or which substitution didn’t work?
IV. Several examples of PBIS f fid lit 2 tmeasures of fidelity, 2 types:
• Research Tools / External Evaluation
• Self‐Assessment Tools / Internal Evaluation/
About this set of examples ‐‐p• Available online• Focused on core elements of PBISFocused on core elements of PBIS• Have been used for some time by many schools with good results
• Assessments of their psychometric properties and/or descriptions of the development and use have been publishedpublished.
Stay tuned* – other measures are currently being developed or are “in press” or can be found in p p fconnection with specific projects.
*By checking web sites such as the ones mentioned on the 2nd slide (Acknowledgments) or found in the references2nd slide (Acknowledgments) or found in the references.
R h T l / E l E l iResearch Tools / External Evaluation
• Direct observations with inter‐observer agreement reported
• Interviews
• Review of archival records and permanent pproducts

Formative, internal evaluation: ,Frequent progress monitoring of how well we
are doing with the implementationg p
• Are we really using PBIS?
U i th d t t k ti l ?• Using the data to make action plans?
• Checking on how well our own local action plans are followed?
Research Tools / External Evaluation
• Schoolwide Evaluation Tool (SET)
• Individual Student System Evaluation Tool (ISSET)

S h l id E l i T l (SET)Schoolwide Evaluation Tool (SET)Sugai, G., Lewis‐Palmer, T., Todd, A. W., & g , , , , , ,Horner, R. H. (2001). School‐wide Evaluation Tool. Eugene: University of Oregon, g y g ,Educational and Community Supports. Retrieved from http://www.pbis.org/evaluation/evaluation_tools.aspxp
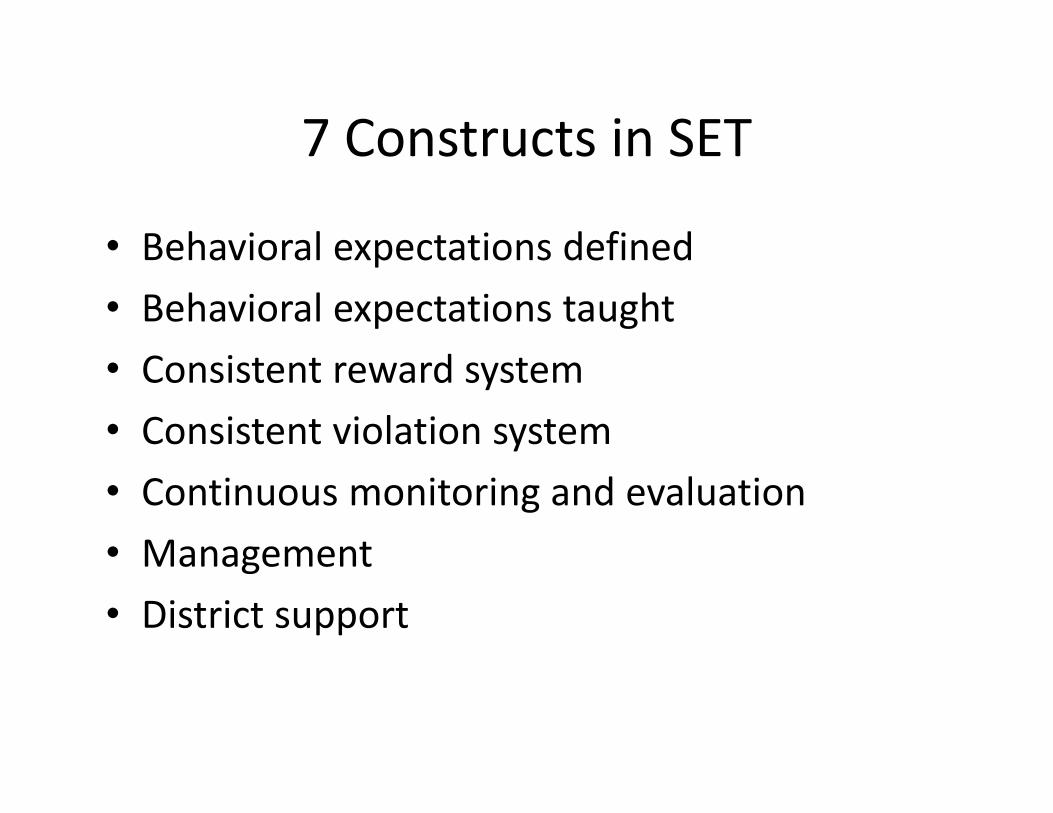
7 Constructs in SET7 Constructs in SET
• Behavioral expectations definedBehavioral expectations defined
• Behavioral expectations taught
C i d• Consistent reward system
• Consistent violation system
• Continuous monitoring and evaluation
• ManagementManagement
• District support
Tier 1: Primary Prevention / Universal Intervention
• To assess the impact of PBIS as a three tieredTo assess the impact of PBIS as a three tiered
approach, the SET should be used in combination with measures that addresscombination with measures that address secondary and tertiary levels of prevention:
• “The SET does not offer information about secondary and tertiary prevention efforts in h l ” ( l )schools” (Horner et al. 2004, p. 11).
Individual Student SystemIndividual Student System Evaluation Tool (ISSET)
Anderson, C. M., Lewis‐Palmer, T., Todd, A. W., Horner, R. H., Sugai, G., and Sampson, N. K. (2011). Individual Student Systems Evaluation Tool, Version 2.8. Eugene: University of Oregon, Educational and Community Supports. Retrieved from http://www.pbis.org/common/pbisresources/tools/ISSET_TOOL_v2.8_February_2011.pdf
The ISSET has 3 Scales:• Foundations: Basic attitudes indicating staff interest in trying to use positive rather thaninterest in trying to use positive rather than punitive and exclusionary methods
• Targeted: Interventions that can be efficientlyg yprovided to students who need extra support; focus on Tier 2, Secondary Prevention, Selective I t tiInterventions
• Intensive: Function‐based, individualized interventions; focus on Tier 3 Tertiaryinterventions; focus on Tier 3, Tertiary Prevention, Indicated Interventions
In the works: MATTIn the works: MATT
• Monitoring Advanced Tier Toolo to g d a ced e oo• Similar to ISSET but does not require an external evaluator –
• Instead, a PBIS coach works with the school team to use this for action planning
• Currently being pilot tested at the University of Oregon ‐‐ for up‐dates in near future, see
https://www.pbisassessment.org andhttp://www.pbiseval.org/Resources.aspx
The MATT has three parts:The MATT has three parts:
• The Coaches’ Interview GuideThe Coaches Interview Guide
• The Team Scoring Guide
h i l• The Action Plan
Self Assessment Tools / InternalSelf‐Assessment Tools / Internal Evaluation & Action Planningg
• Benchmarks of Advanced Tiers (BAT)
• Team Implementation Checklist (TIC)
• Benchmarks of Quality (BoQ)
• Staff Self‐Assessment Survey (SAS) ‐‐ also known as Effective Behavior Support Survey (EBS Survey)
• Implementation Phases Inventory (IPI)
Benchmarks for Advanced Tiers (BAT)Benchmarks for Advanced Tiers (BAT)
Anderson C Childs K Kincaid D Horner RAnderson, C., Childs, K., Kincaid, D., Horner, R., George, H., Todd, A. . . . Spaulding, S. (2009). Benchmarks for Advanced Tiers UnpublishedBenchmarks for Advanced Tiers. Unpublished instrument. Educational and Community Supports University of Oregon & DepartmentSupports, University of Oregon & Department of Child and Family Studies, University of South Florida Retrieved fromSouth Florida. Retrieved from http://pbis.org/common/pbisresources/tools/BAT v2 5 pdfBAT_v2.5.pdf
BAT was derived from the ISSET.BAT was derived from the ISSET.
• Does not depend on external evaluators or onDoes not depend on external evaluators or on a PBIS coach
• School teams self assess Tiers 2 and 3• School teams self‐assess Tiers 2 and 3 implementation status
Th l f• Then plan for next steps
Benchmarks of Quality (BoQ)Benchmarks of Quality (BoQ)
Kincaid D Childs K and George H (2010)Kincaid, D., Childs, K., and George, H. (2010).School‐wide Benchmarks of Quality (Revised).Unpublished instrument Tampa: University ofUnpublished instrument. Tampa: University of South Florida. Retrieved from https://www pbisassessment org/Evaluation/Shttps://www.pbisassessment.org/Evaluation/Surveys
BoQ recently has been revised y(Kincaid, Childs, & George, 2010) and
d h d i diff tassessed when used in different ways (Childs, George, & Kincaid, 2011). y ( , g , , )
“Th B h k f Q lit d l d d“The Benchmarks of Quality was developed and validated to be administered by the Coach . . . utilizing the Scoring Guide to complete theutilizing the Scoring Guide to complete the Scoring Form with feedback from members through the TeamMember Rating Howeverthrough the Team Member Rating . . . However, many PBIS Teams and some statewide PBIS Projects desired access and input using the moreProjects desired access and input using the more comprehensive Scoring Guide/Scoring Form”Retrieved from http://www.pbis.org/evaluation/evaluation_briefs/mar_11_(2).aspx
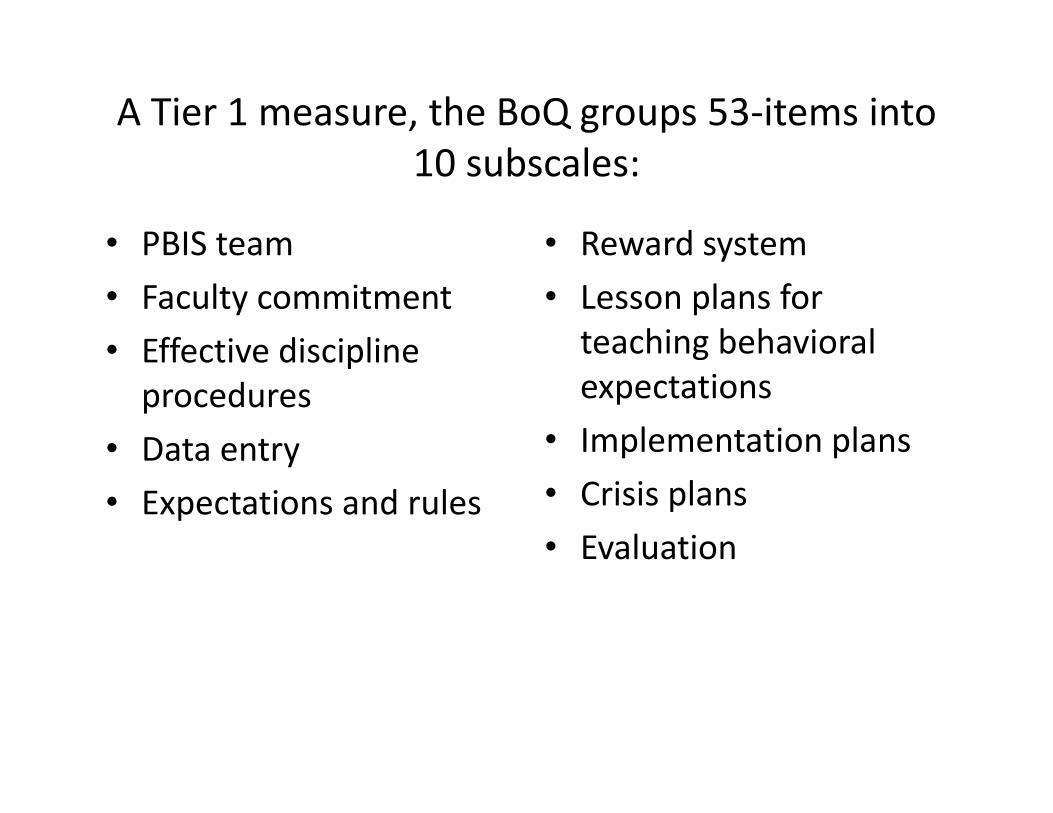
A Tier 1 measure, the BoQ groups 53‐items into 10 b l10 subscales:
• PBIS team • Reward systemPBIS team
• Faculty commitment
• Effective discipline
Reward system
• Lesson plans for teaching behavioral Effective discipline
procedures
• Data entry
gexpectations
• Implementation plansData entry
• Expectations and rules
p p
• Crisis plans
• Evaluation

Team Implementation Checklist (TIC)Team Implementation Checklist (TIC)
Sugai G Horner R H Lewis‐Palmer T &Sugai, G, Horner, R.H., Lewis Palmer, T.,& Rossetto Dickey, C. (2011). Team Implementation Checklist Version 3 1Implementation Checklist, Version 3.1, University of Oregon. Retrieved from https://www pbisassessment org/Evaluation/Shttps://www.pbisassessment.org/Evaluation/Surveys.
● Focus on the universal level of prevention (Tier 1) although it has 3 it t t d3 items to assess progress toward implementing Tiers 2 and 3. p g● For example, item 20 asks if “ l bl id“Personnel are able to provide behavior expertise for studentsbehavior expertise for students needing Tier II and Tier III support.”

TIC, Version 3.1, has 22 numbered d fitems, organized into 7 features:
• Establish CommitmentEstablish Commitment• Establish and Maintain Team• Self‐Assessment• Self‐Assessment• Prevention Systems (defining and teaching
expectations rewarding appropriate behavior andexpectations, rewarding appropriate behavior, and responding to violations)
• Classroom System (a new category)y ( g y)• Information System• Build Capacity for Function‐based SupportBuild Capacity for Function based Support
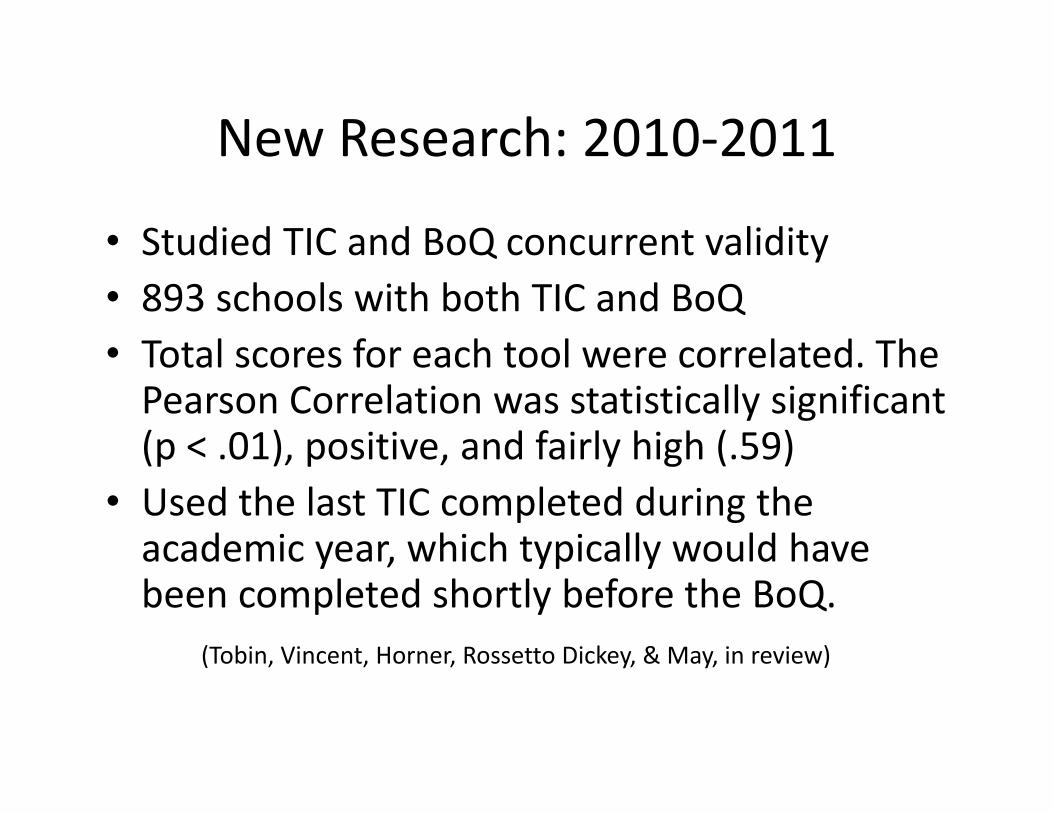
New Research: 2010‐2011New Research: 2010 2011
• Studied TIC and BoQ concurrent validityStudied TIC and BoQ concurrent validity• 893 schools with both TIC and BoQ• Total scores for each tool were correlated The• Total scores for each tool were correlated. The Pearson Correlation was statistically significant (p < .01), positive, and fairly high (.59)(p .01), positive, and fairly high (.59)
• Used the last TIC completed during the academic year, which typically would haveacademic year, which typically would have been completed shortly before the BoQ.
(Tobin, Vincent, Horner, Rossetto Dickey, & May, in review)(Tobin, Vincent, Horner, Rossetto Dickey, & May, in review)
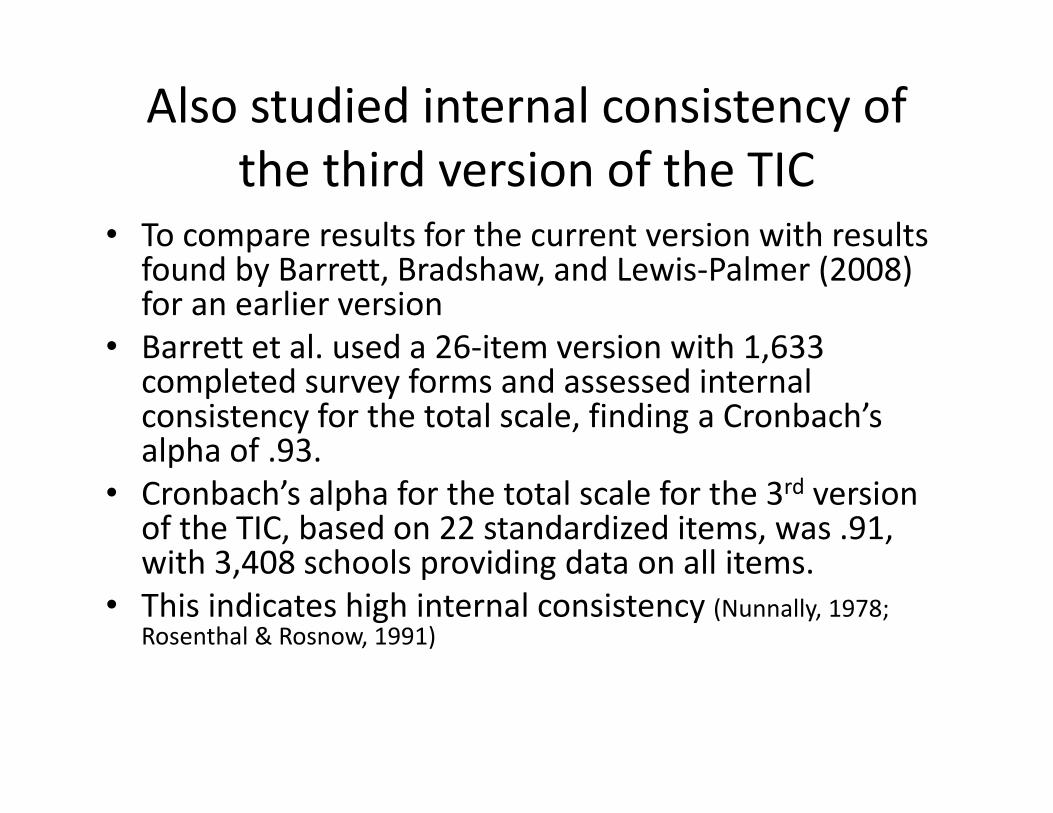
Also studied internal consistency of h h d f hthe third version of the TIC
• To compare results for the current version with results found by Barrett, Bradshaw, and Lewis‐Palmer (2008) for an earlier version
• Barrett et al. used a 26‐item version with 1,633Barrett et al. used a 26 item version with 1,633 completed survey forms and assessed internal consistency for the total scale, finding a Cronbach’s alpha of .93.alpha of .93.
• Cronbach’s alpha for the total scale for the 3rd version of the TIC, based on 22 standardized items, was .91, with 3 408 schools providing data on all itemswith 3,408 schools providing data on all items.
• This indicates high internal consistency (Nunnally, 1978; Rosenthal & Rosnow, 1991)

Also assessed internal consistency for h f f hthe 7 features of the current TIC
• Keep in mind that scales with few items,Keep in mind that scales with few items, unless the items refer to very similar competencies, tend to have low alphas, and should be interpreted within the context of the overall measure (Achenbach & Rescorla, 2001).
• In addition, the following table compares total possible score with average score for all 3,408 h l l i h li TIC i hschools completing the online TIC with
consent for use in research.

Scale Cronbach’s Number of Items Maximum Average Scale Score
Internal Consistency of Third Version of the Team Implementation Checklist and Mean Scores
Scale Cronbach s Alpha, Items Standardized
Number of Items Maximum Possible Score
Average Scale Score for 3,408 Schools
Total .91 22 44 32.39 (SD = 8.38)
Commitment .56 2 4 3.36 (SD = .81)
Team .57 3 6 4.84 (SD = 1.17)
Self-assessment .71 3 6 4.13 (SD = 1.66)
Prevention .86 6 12 9.68 (SD = 2.74)
Classroom 72 3 6 3 21 (SD = 1 81)Classroom .72 3 6 3.21 (SD = 1.81)
Information .87 2 4 2.49 (SD = 1.46)
Function-based .72 3 6 4.68 (SD = 1.52)
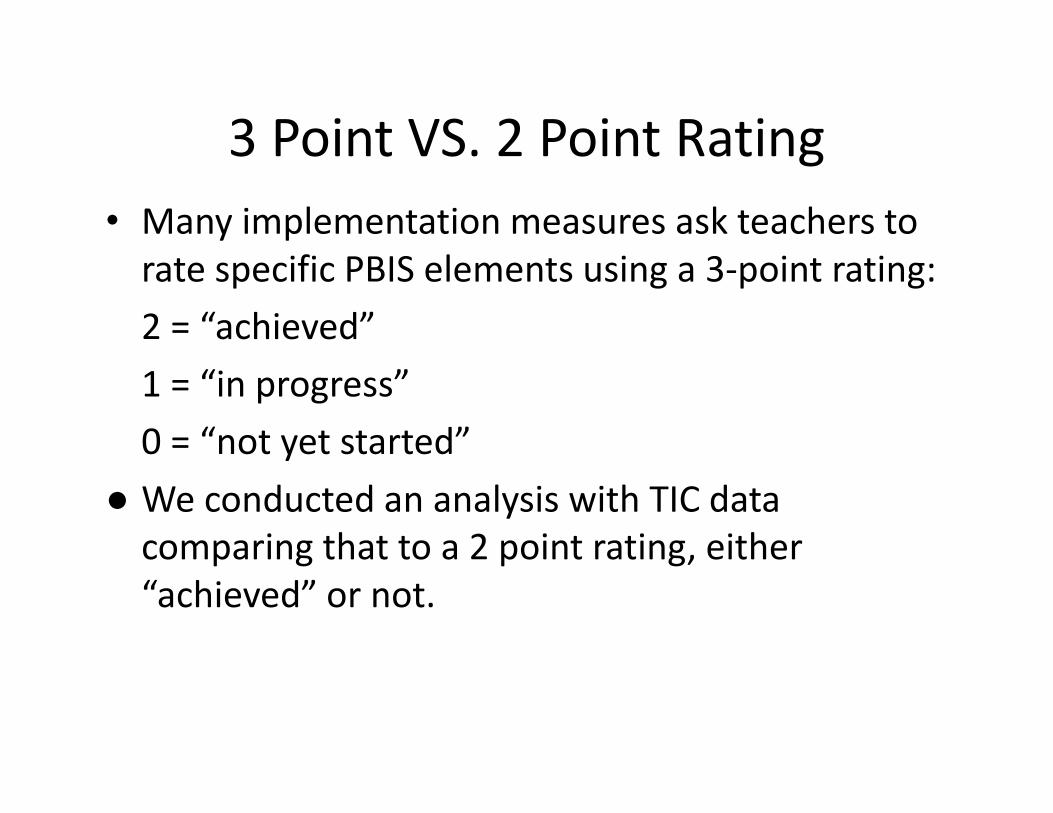
3 Point VS. 2 Point Rating3 Point VS. 2 Point Rating• Many implementation measures ask teachers to rate specific PBIS elements using a 3‐point rating:
2 = “achieved”
1 = “in progress”
0 = “not yet started”y
● We conducted an analysis with TIC data comparing that to a 2 point rating, either p g p g,“achieved” or not.

Raw Points or Achieved Items?Raw Points or Achieved Items?
• A count of raw points includes points for “inA count of raw points includes points for in progress” (the 3 point rating)
• Because an item rated “in progress” is not yet• Because an item rated in progress is not yet fully implemented, an alternative calculation of the TIC criterion could be based on theof the TIC criterion could be based on the number of items rated “achieved” (2 point rating)rating).
• Like: Are you doing this? Yes or no?
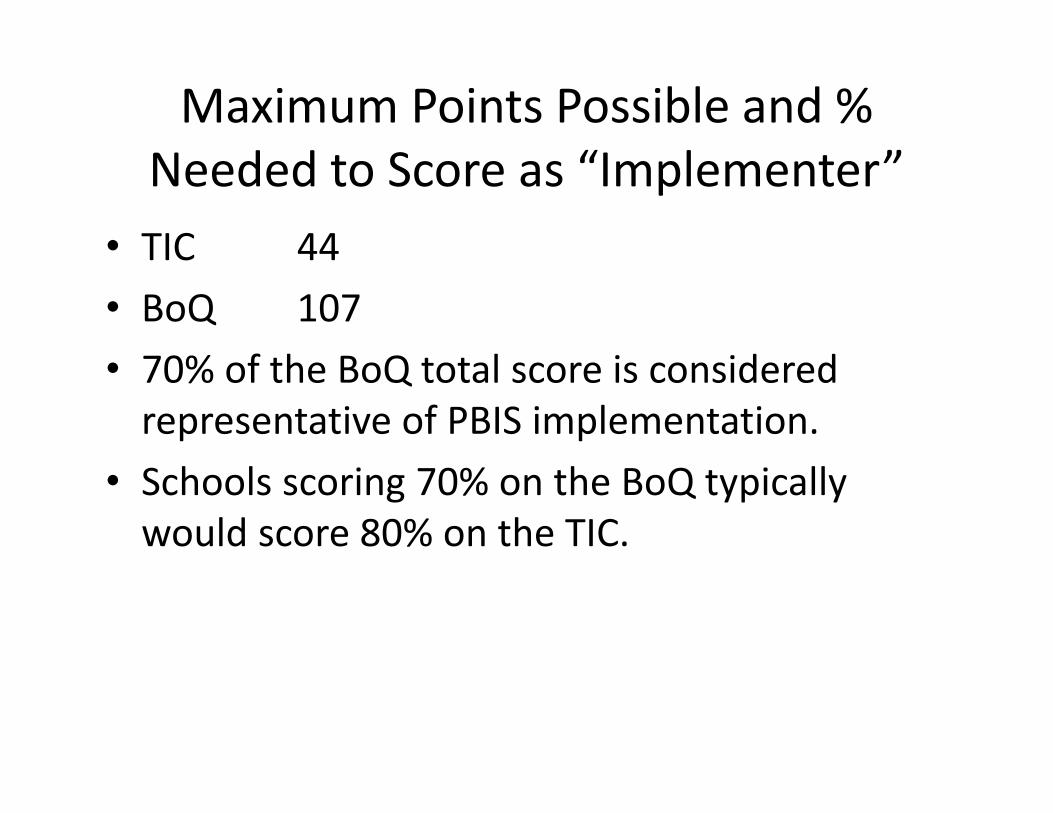
Maximum Points Possible and % d d “ l ”Needed to Score as “Implementer”
• TIC 44TIC 44
• BoQ 107
0% f h Q l i id d• 70% of the BoQ total score is considered representative of PBIS implementation.
• Schools scoring 70% on the BoQ typically would score 80% on the TIC.

Percent of raw points or percent of items fully implemented? Evaluation briefimplemented? Evaluation brief.
Vincent & Tobin (in review)
• Using BoQ score as the criteriaUsing BoQ score as the criteria,
• We compared 2 groups:
→ S h l h b i d 80% f ll→ Schools that obtained 80% or more of all TIC raw points (using the 3 point rating)
→ Schools that rated 80% or more of all TIC items as “achieved” (using the 2 point rating).
N = 448 schools
2010‐20112010 2011
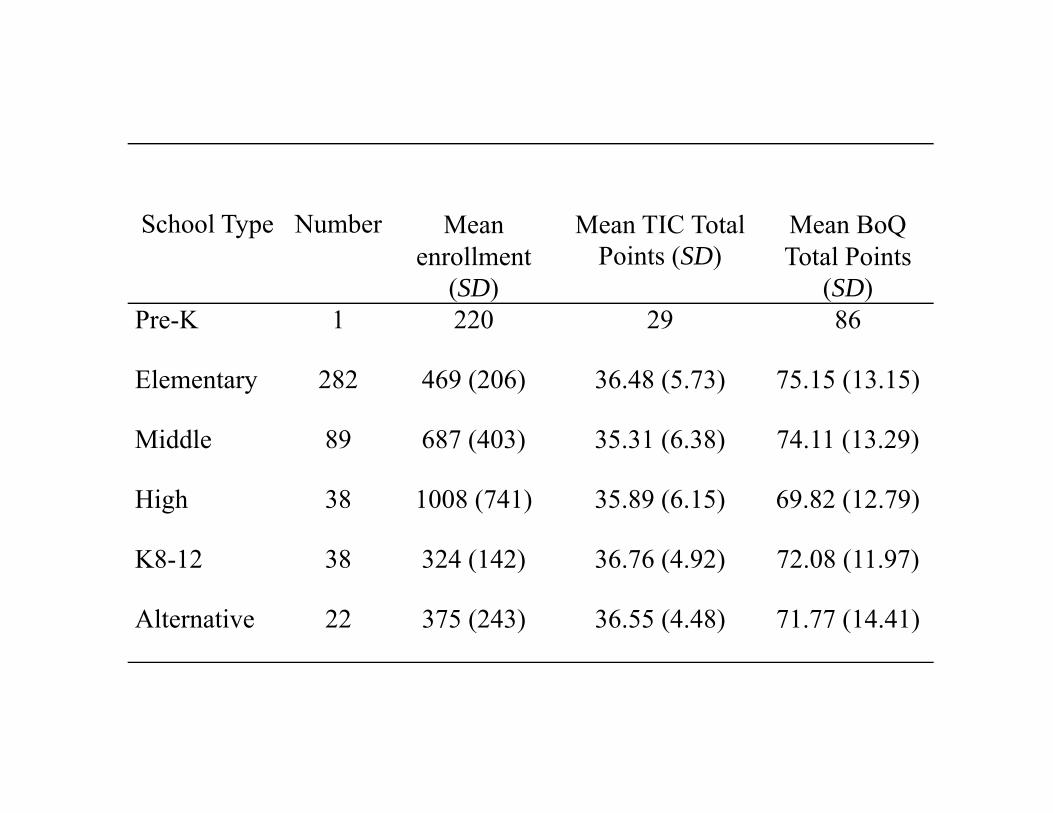
School Type Number Mean enrollment
Mean TIC Total Points (SD)
Mean BoQ Total Pointsenrollment
(SD)Points (SD) Total Points
(SD)Pre-K 1 220 29 86
Elementary 282 469 (206) 36.48 (5.73) 75.15 (13.15)
Middle 89 687 (403) 35.31 (6.38) 74.11 (13.29)
High 38 1008 (741) 35.89 (6.15) 69.82 (12.79)
K8 12 38 324 (142) 36 76 (4 92) 72 08 (11 97)K8-12 38 324 (142) 36.76 (4.92) 72.08 (11.97)
Alternative 22 375 (243) 36.55 (4.48) 71.77 (14.41)
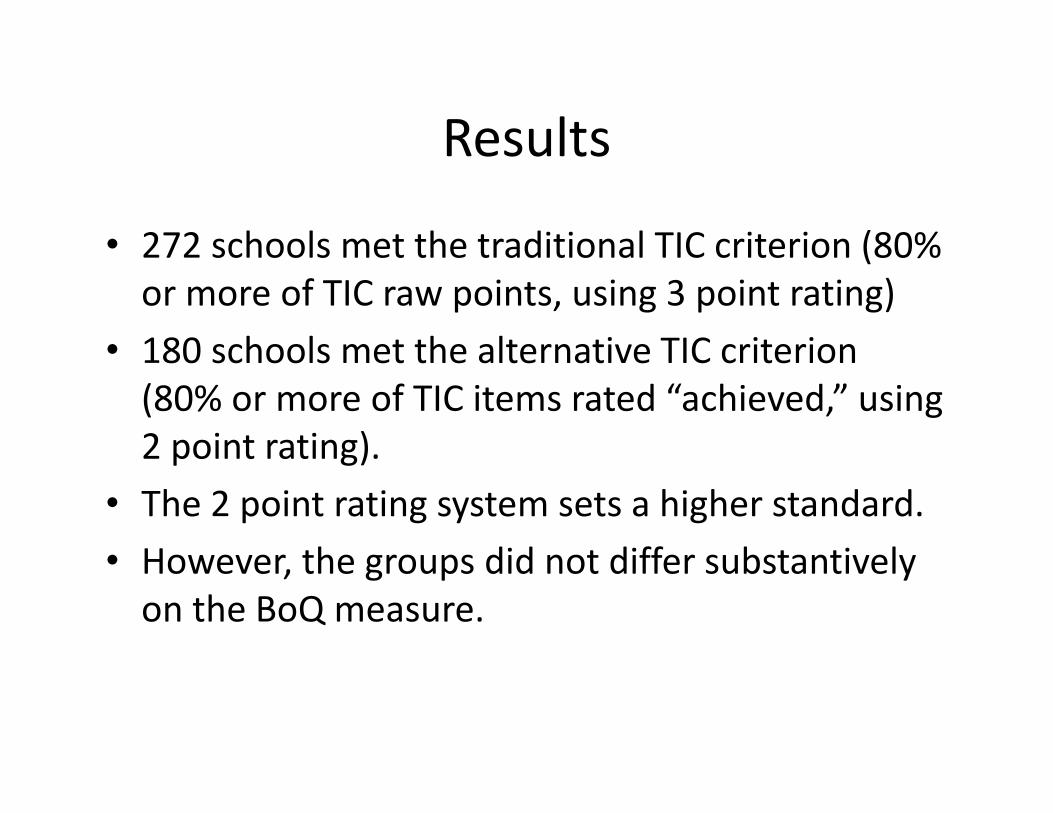
ResultsResults
• 272 schools met the traditional TIC criterion (80%272 schools met the traditional TIC criterion (80% or more of TIC raw points, using 3 point rating)
• 180 schools met the alternative TIC criterion180 schools met the alternative TIC criterion (80% or more of TIC items rated “achieved,” using 2 point rating).2 point rating).
• The 2 point rating system sets a higher standard.
• However the groups did not differ substantively• However, the groups did not differ substantively on the BoQ measure.
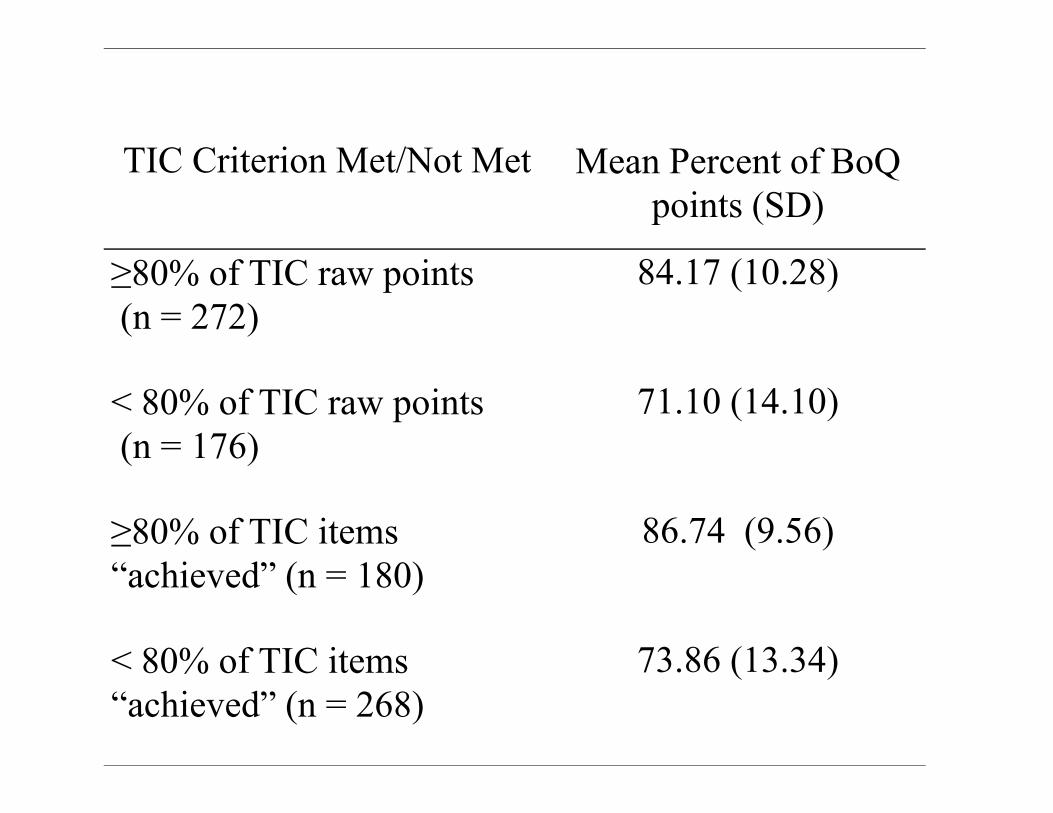
TIC C it i M t/N t M t M P f B QTIC Criterion Met/Not Met Mean Percent of BoQ points (SD)
≥80% of TIC raw points(n = 272)
84.17 (10.28)
< 80% of TIC raw points(n = 176)
71.10 (14.10)( 76)
≥80% of TIC items 86.74 (9.56)“achieved” (n = 180)
< 80% of TIC items 73 86 (13 34)< 80% of TIC items “achieved” (n = 268)
73.86 (13.34)
• Of the 180 schools with 80% or more of the TIC items achieved, 93% (n = 167) also met the BoQ implementation criterion of 70% or more BoQ points.
• Of the 272 schools that met the traditional TIC criterion (80% or more TIC raw points), 88% (n ( p ), (= 238) also met the BoQ implementation criterion of 70% or more BoQ pointsp

Schools were doing well – either way!Schools were doing well either way!
• Schools that met the TIC criterion calculatedSchools that met the TIC criterion calculated with either method had similar BoQ scores far exceeding the BoQ implementation criterionexceeding the BoQ implementation criterion.
• Schools that did not meet the TIC criterion calculated with either method also had similarcalculated with either method also had similar BoQ scores close to the minimum BoQ implementation criterion of 70%implementation criterion of 70%.
Staff Self‐Assessment Survey (SAS) ‐‐Staff Self Assessment Survey (SAS) also known as Effective Behavior Support
Survey (EBS Survey)Survey (EBS Survey)Sugai, G., Horner, R.H., & Todd, A. (2003). Self Assessment Survey University of OregonAssessment Survey. University of Oregon, Retrieved from https://www.pbisassessment.org/Evaluation/Sp // p g/ /urveys.
Todd, A.W., Sugai, G., and Horner, R.H. (2003). Effective Behavior Support (EBS) Survey University of OregonBehavior Support (EBS) Survey. University of Oregon, Retrieved February 2, 2012, from http://pbis.org/pbis_resource_detail_page.aspx?Type=4andPBIS ResourceID=2194andPBIS_ResourceID=219.
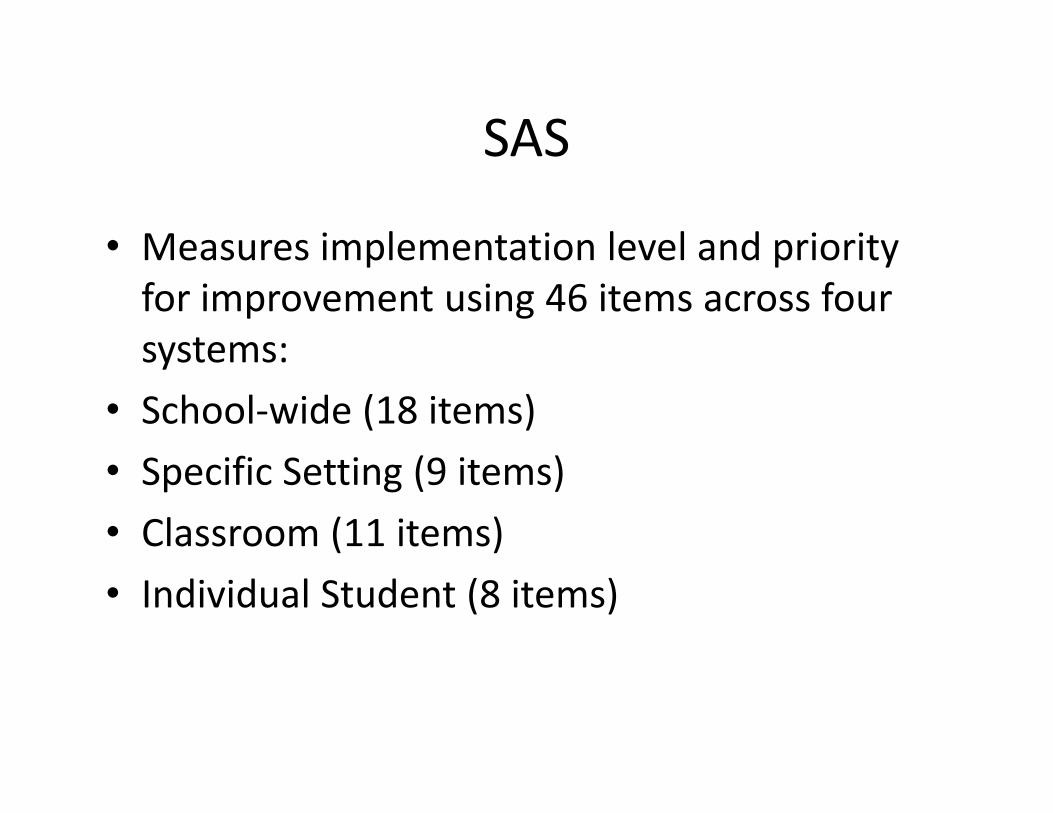
SASSAS
• Measures implementation level and priorityMeasures implementation level and priority for improvement using 46 items across four systems:systems:
• School‐wide (18 items)
S ifi S i (9 i )• Specific Setting (9 items)
• Classroom (11 items)
• Individual Student (8 items)

Often is used as part of staff pdevelopment with initial PBIS training.
• Measures “Priority for Improvement” as well as staff perceptions of level of implementation (“in place” or “partially in place” or “not in place”)
• Many schools continue to use this as a measure of progress over time.
• Data from the online version of SAS was sensitive to the value of using School Wide gInformation System (SWIS, May et al. 2006) when implementing PBIS (Tobin 2006a). p g
• Also, SAS data made it possible to identify specific strategies associated with reductionsspecific strategies associated with reductions in disproportionate suspensions of African American students (Tobin & Vincent 2011)American students (Tobin & Vincent, 2011).
Implementation Phases Inventory (IPI)
Bradshaw, C. P., Barrett, S., & McKenna, M. (2008) Implementation Phases Inventory (IPI)(2008). Implementation Phases Inventory (IPI), Baltimore: PBIS Maryland. Retrieved from http://www pbismaryland org/forms htmhttp://www.pbismaryland.org/forms.htm.
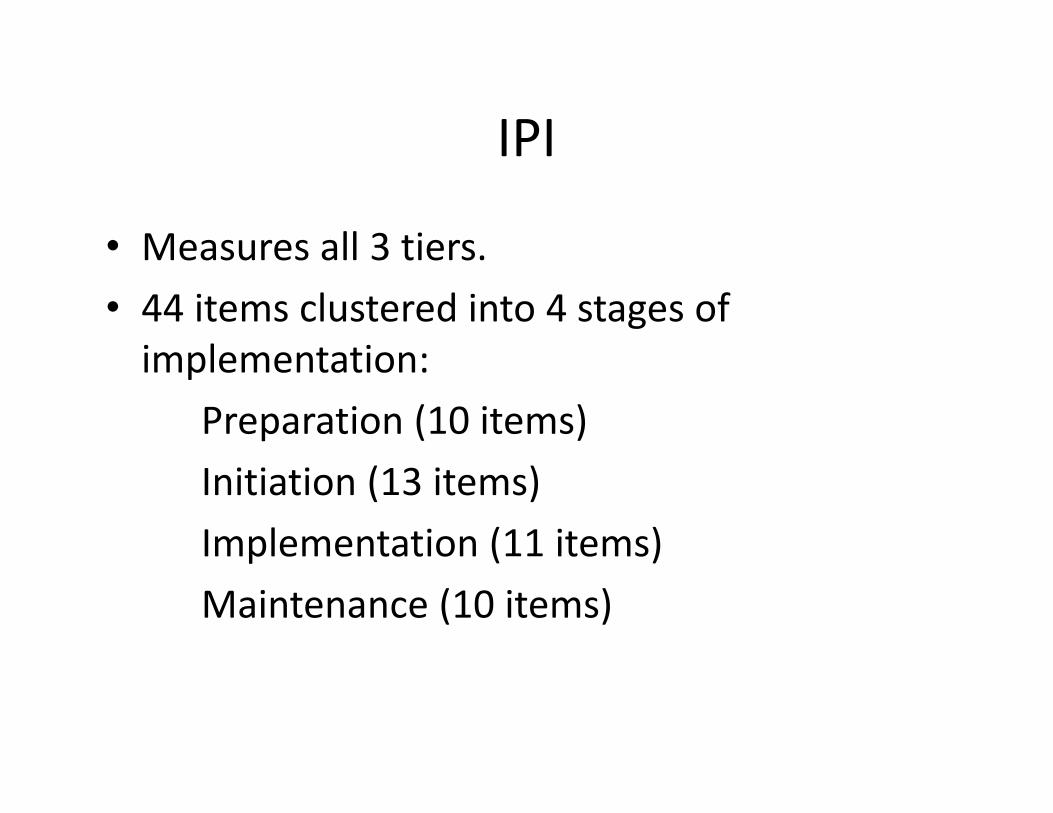
IPIIPI
• Measures all 3 tiersMeasures all 3 tiers.
• 44 items clustered into 4 stages of implementation:implementation:
Preparation (10 items)
Initiation (13 items)
Implementation (11 items)p ( )
Maintenance (10 items)
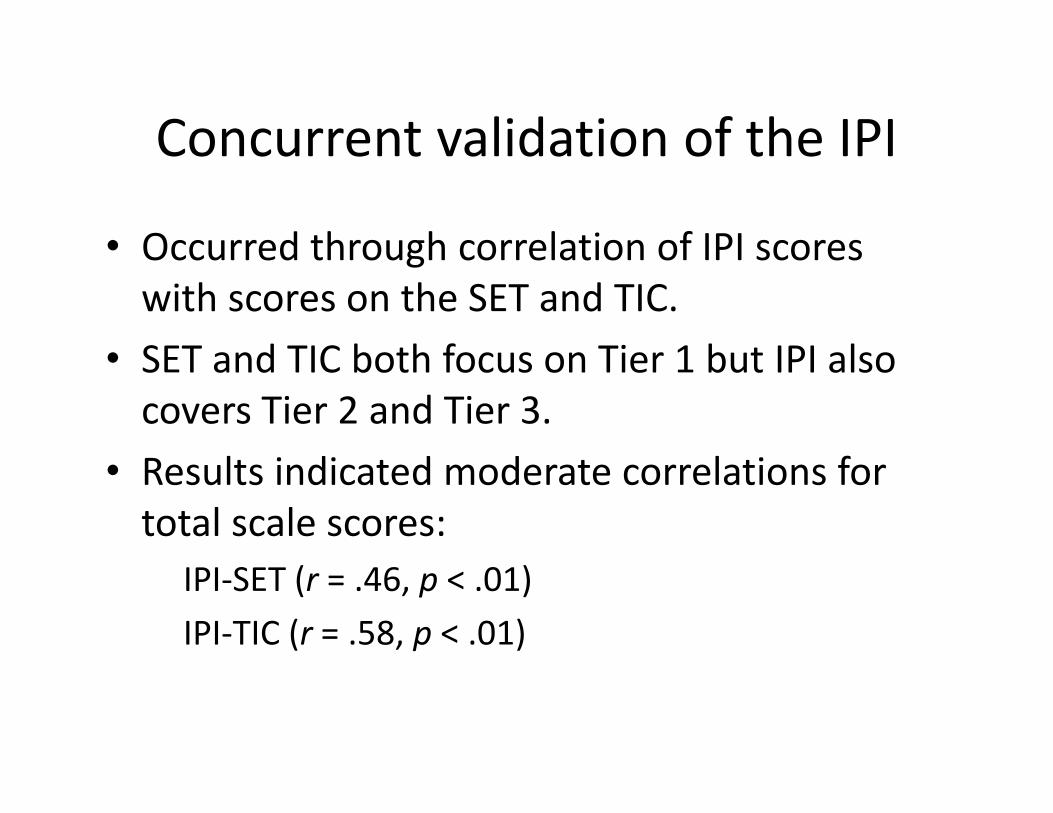
Concurrent validation of the IPIConcurrent validation of the IPI
• Occurred through correlation of IPI scoresOccurred through correlation of IPI scores with scores on the SET and TIC.
• SET and TIC both focus on Tier 1 but IPI also• SET and TIC both focus on Tier 1 but IPI also covers Tier 2 and Tier 3.
R l i di d d l i f• Results indicated moderate correlations for total scale scores:
IPI‐SET (r = .46, p < .01)
IPI‐TIC (r = .58, p < .01)

Summary of Our Sample of Currently l bl l lAvailable Online Tools
• External Evaluation / Research:te a a uat o / esea c :SET for Tier 1ISSET for Tier 2 and Tier 3
● Internal Evaluation / Action Planning:BAT for Tier 2 and Tier 3TIC mostly for Tier 1, does have some on Tiers 2 & 3BoQ for Tier 1SAS mostly for Tier 1 does have some on Tiers 2 & 3SAS mostly for Tier 1, does have some on Tiers 2 & 3IPS for all Tiers + looks at phases in the process
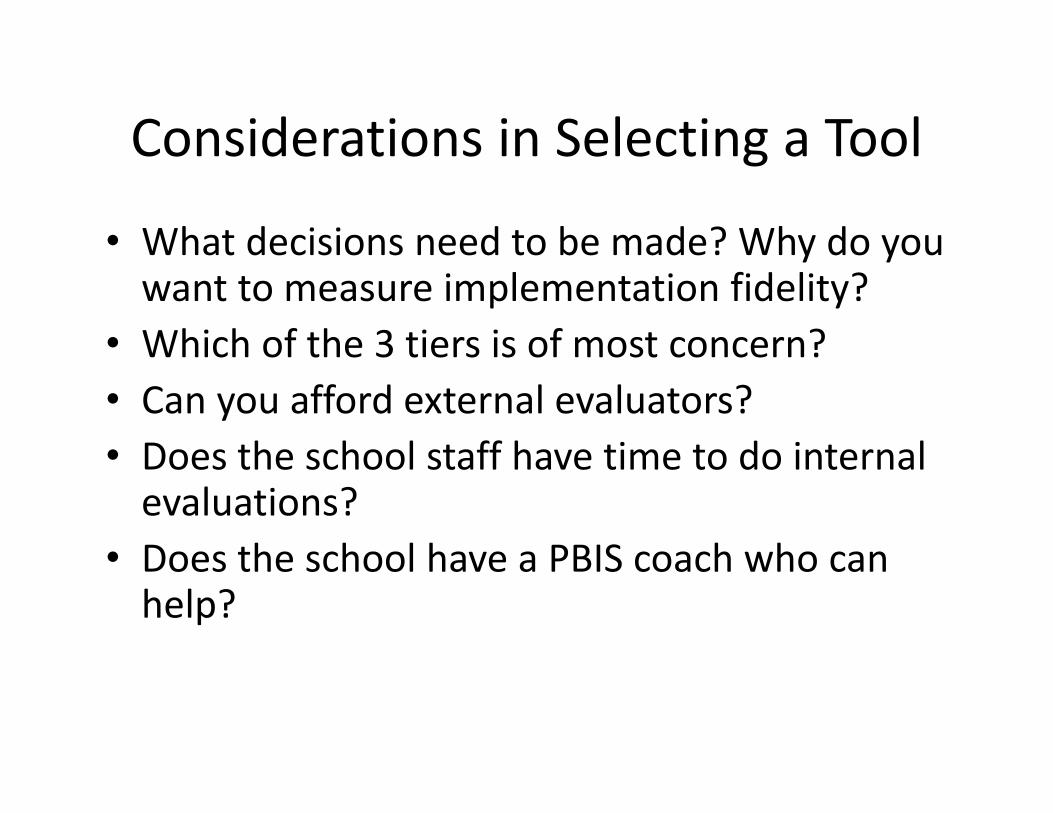
Considerations in Selecting a ToolConsiderations in Selecting a Tool
• What decisions need to be made? Why do youWhat decisions need to be made? Why do you want to measure implementation fidelity?
• Which of the 3 tiers is of most concern?Which of the 3 tiers is of most concern?• Can you afford external evaluators?• Does the school staff have time to do internal• Does the school staff have time to do internal evaluations?
• Does the school have a PBIS coach who can• Does the school have a PBIS coach who can help?
For more information see:For more information, see:http://pbis.org
https://www.pbisassessment.organd the separate hand out onand the separate hand out on
references

Big Picture QuestionsBig Picture Questions
• Do you also have outcome data on social o you a so a e outco e data o soc abehaviors, discipline, academic achievement?Can this be related to the PBIS implementation?
• Are you interested in specific groups of students?Consider disaggregating data by ethnicity, race, gender, grade, etc.
• Besides PBIS, what other interventions are going h h ff d ffon that may have affected outcomes – or staff
willingness to participate?
V. Your experiences with this?Your thoughts?Your thoughts?