Embed Size (px)
Citation preview
REVIEW ARTICLE
Differential Diagnosis of rSr’ Pattern in Leads V1-V2.Comprehensive Review and Proposed Algorithm
Adrian Baranchuk, M.D., F.A.C.C., F.R.C.P.C.,∗ Andres Enriquez, M.D.,∗Javier Garcıa-Niebla, R.N.,† Antoni Bayes-Genıs, M.D., Ph.D.,‡Roger Villuendas, M.D.,‡ and Antoni Bayes de Luna, M.D.§From the ∗Division of Cardiology, Queen’s University, Kingston, Ontario, Canada; †Sanitary Health Services, Valledel Golfo Health Center, Canary Islands, Spain; ‡Cardiology Service, Germans Trias I Pujol Hospital, Badalona,Catalunya, Spain; and §ICCC-Hospital Sant Pau, Barcelona, Catalunya, Spain
One of the more frequent dilemmas in ECG interpretation is the differential diagnosis of an rSr’pattern in leads V1-V2. We often face this finding in asymptomatic and otherwise healthy individualsand the causes may vary from benign nonpathological variants to severe or life-threatening heartdiseases, such as Brugada syndrome or arrhythmogenic right ventricular dysplasia. In other cases, anormal variant of rSr’ pattern can be misinterpreted as pathological after the occurrence of certainclinical events such as cardiac arrest or syncope of unknown cause. In this review we analyzein detail all the possible conditions, both benign and pathological that may explain the presenceof this electrocardiographic pattern. We also propose a simple electrocardiographic algorithm fordifferential diagnosis.
Ann Noninvasive Electrocardiol 2015;20(1):7–17
rSr’ pattern; Brugada ECG pattern; ARVD; algorithm
The normal electrocardiographic QRS morphologythat is recorded in leads V1-V2 is the conse-quence of the normal electrical activation of theventricles.1–3 This is explained by the presenceof three vectors; the first, generated by septalactivation is directed from left to right and explainsthe small “r” in lead V1 (and the small “q” in leadsV5-V6). In general, it is directed upwards, but inobese people it may point downwards. The secondvector is the consequence of the activation of thefree walls of both ventricles from endocardial toepicardial layers. Given the thicker left ventricularwall, the resultant vector is directed leftwards andto the apex and explains the S wave in leads V1-V2 (and the R wave in leads V5-V6). Finally, thethird vector corresponds to the depolarization ofthe basal regions of both ventricles; it is directedto the right and upwards and explains the small “s”in leads V5-V6, the final “r” usually found in leadaVR and part of the ascending slope of the S wave
Address for correspondence: Adrian Baranchuk, M.D., F.A.C.C., F.R.C.P.C., Associate Professor of Medicine, Cardiac Electrophysiologyand Pacing, Kingston General Hospital K7L 2V7, Queen’s University, Kingston, Ontario, Canada. Fax: 613 548 1387; E-mail:[email protected]
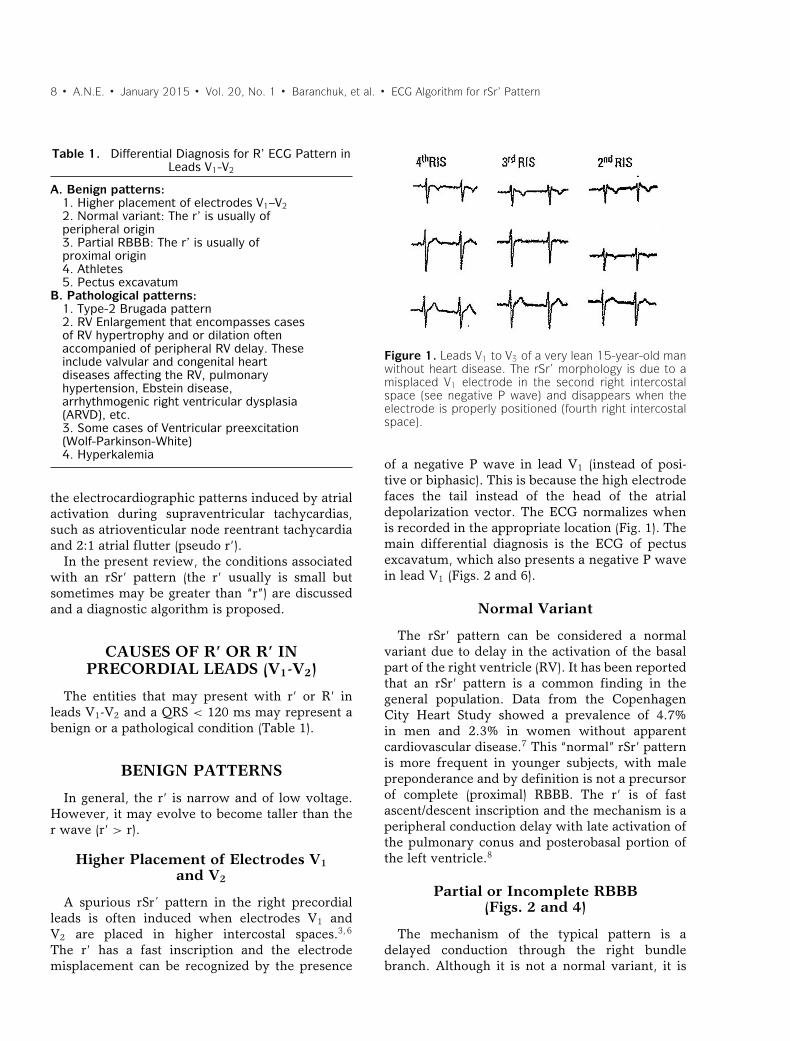
in leads V1-V2. If the electrodes V1-V2 are placedin a higher position (second intercostal space), theymay face the head of the third vector and a terminal“r” may be recorded in these leads (Fig. 1).
An rSr’ pattern in the right precordial leads isa relatively common electrocardiographic findingthat has been described in up to 7% of patientswithout apparent heart disease.4 If the QRS is wide,the presence of an R’ in leads V1-V2 usually is inthe context of a complete right bundle branch block(RBBB), but other causes have been described,including some cases of ventricular preexcitationsyndrome.5 We will particularly focus in the differ-ential diagnosis of r’ (R’) in leads V1-V2 with a QRSduration of less than 120 ms. This morphology canbe due to incomplete RBBB or can be a normal elec-trophysiological variant, especially in young peopleand athletes. However, it also can be the expressionof serious pathological conditions that should berecognized. We have not included in this review
C© 2014 Wiley Periodicals, Inc.DOI:10.1111/anec.12241
7
8 � A.N.E. � January 2015 � Vol. 20, No. 1 � Baranchuk, et al. � ECG Algorithm for rSr’ Pattern
Table 1. Differential Diagnosis for R’ ECG Pattern inLeads V1-V2
A. Benign patterns:1. Higher placement of electrodes V1–V22. Normal variant: The r’ is usually ofperipheral origin3. Partial RBBB: The r’ is usually ofproximal origin4. Athletes5. Pectus excavatum
B. Pathological patterns:1. Type-2 Brugada pattern2. RV Enlargement that encompasses casesof RV hypertrophy and or dilation oftenaccompanied of peripheral RV delay. Theseinclude valvular and congenital heartdiseases affecting the RV, pulmonaryhypertension, Ebstein disease,arrhythmogenic right ventricular dysplasia(ARVD), etc.3. Some cases of Ventricular preexcitation(Wolf-Parkinson-White)4. Hyperkalemia
the electrocardiographic patterns induced by atrialactivation during supraventricular tachycardias,such as atrioventicular node reentrant tachycardiaand 2:1 atrial flutter (pseudo r’).
In the present review, the conditions associatedwith an rSr’ pattern (the r’ usually is small butsometimes may be greater than “r”) are discussedand a diagnostic algorithm is proposed.
CAUSES OF R’ OR R’ INPRECORDIAL LEADS (V1-V2)
The entities that may present with r’ or R’ inleads V1-V2 and a QRS < 120 ms may represent abenign or a pathological condition (Table 1).
BENIGN PATTERNS
In general, the r’ is narrow and of low voltage.However, it may evolve to become taller than ther wave (r’ > r).
Higher Placement of Electrodes V1and V2
A spurious rSr´ pattern in the right precordialleads is often induced when electrodes V1 andV2 are placed in higher intercostal spaces.3,6
The r’ has a fast inscription and the electrodemisplacement can be recognized by the presence
Figure 1. Leads V1 to V3 of a very lean 15-year-old manwithout heart disease. The rSr’ morphology is due to amisplaced V1 electrode in the second right intercostalspace (see negative P wave) and disappears when theelectrode is properly positioned (fourth right intercostalspace).
of a negative P wave in lead V1 (instead of posi-tive or biphasic). This is because the high electrodefaces the tail instead of the head of the atrialdepolarization vector. The ECG normalizes whenis recorded in the appropriate location (Fig. 1). Themain differential diagnosis is the ECG of pectusexcavatum, which also presents a negative P wavein lead V1 (Figs. 2 and 6).
Normal Variant
The rSr’ pattern can be considered a normalvariant due to delay in the activation of the basalpart of the right ventricle (RV). It has been reportedthat an rSr’ pattern is a common finding in thegeneral population. Data from the CopenhagenCity Heart Study showed a prevalence of 4.7%in men and 2.3% in women without apparentcardiovascular disease.7 This “normal” rSr’ patternis more frequent in younger subjects, with malepreponderance and by definition is not a precursorof complete (proximal) RBBB. The r’ is of fastascent/descent inscription and the mechanism is aperipheral conduction delay with late activation ofthe pulmonary conus and posterobasal portion ofthe left ventricle.8
Partial or Incomplete RBBB(Figs. 2 and 4)
The mechanism of the typical pattern is adelayed conduction through the right bundlebranch. Although it is not a normal variant, it is
A.N.E. � January 2015 � Vol. 20, No. 1 � Baranchuk, et al. � ECG Algorithm for rSr’ Pattern � 9
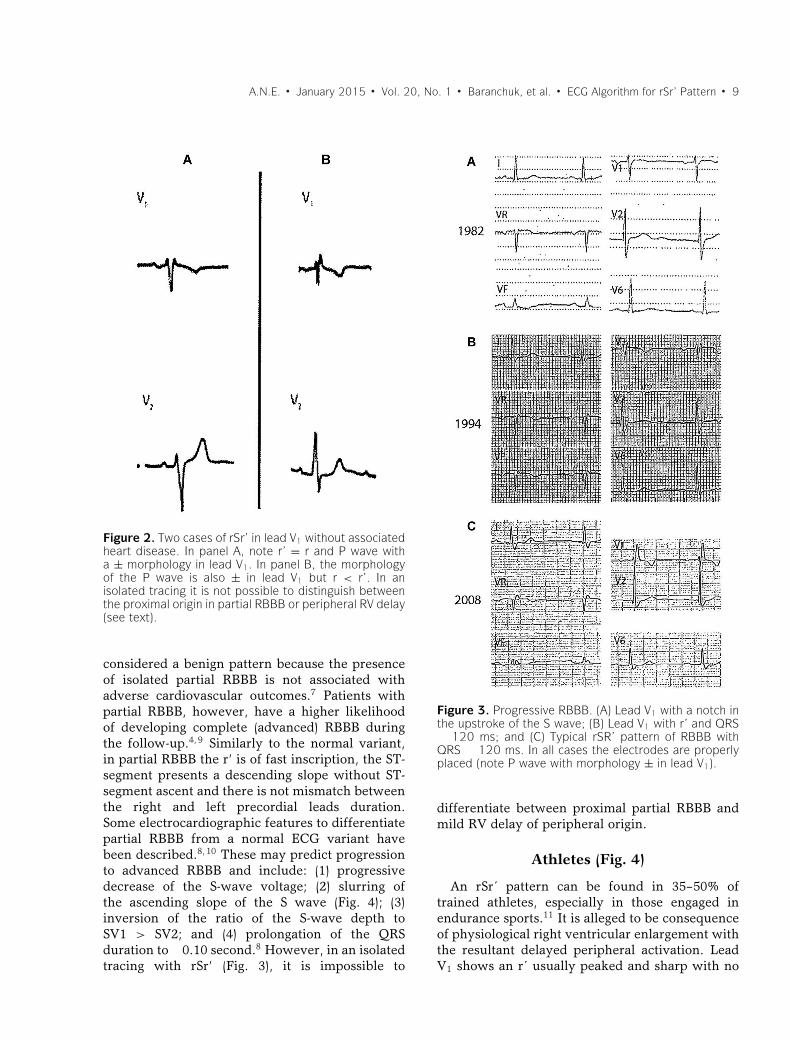
Figure 2. Two cases of rSr’ in lead V1 without associatedheart disease. In panel A, note r’ = r and P wave witha ± morphology in lead V1. In panel B, the morphologyof the P wave is also ± in lead V1 but r < r’. In anisolated tracing it is not possible to distinguish betweenthe proximal origin in partial RBBB or peripheral RV delay(see text).
considered a benign pattern because the presenceof isolated partial RBBB is not associated withadverse cardiovascular outcomes.7 Patients withpartial RBBB, however, have a higher likelihoodof developing complete (advanced) RBBB duringthe follow-up.4,9 Similarly to the normal variant,in partial RBBB the r’ is of fast inscription, the ST-segment presents a descending slope without ST-segment ascent and there is not mismatch betweenthe right and left precordial leads duration.Some electrocardiographic features to differentiatepartial RBBB from a normal ECG variant havebeen described.8,10 These may predict progressionto advanced RBBB and include: (1) progressivedecrease of the S-wave voltage; (2) slurring ofthe ascending slope of the S wave (Fig. 4); (3)inversion of the ratio of the S-wave depth toSV1 > SV2; and (4) prolongation of the QRSduration to �0.10 second.8 However, in an isolatedtracing with rSr’ (Fig. 3), it is impossible to
Figure 3. Progressive RBBB. (A) Lead V1 with a notch inthe upstroke of the S wave; (B) Lead V1 with r’ and QRS� 120 ms; and (C) Typical rSR’ pattern of RBBB withQRS � 120 ms. In all cases the electrodes are properlyplaced (note P wave with morphology ± in lead V1).
differentiate between proximal partial RBBB andmild RV delay of peripheral origin.
Athletes (Fig. 4)
An rSr´ pattern can be found in 35–50% oftrained athletes, especially in those engaged inendurance sports.11 It is alleged to be consequenceof physiological right ventricular enlargement withthe resultant delayed peripheral activation. LeadV1 shows an r´ usually peaked and sharp with no
10 � A.N.E. � January 2015 � Vol. 20, No. 1 � Baranchuk, et al. � ECG Algorithm for rSr’ Pattern
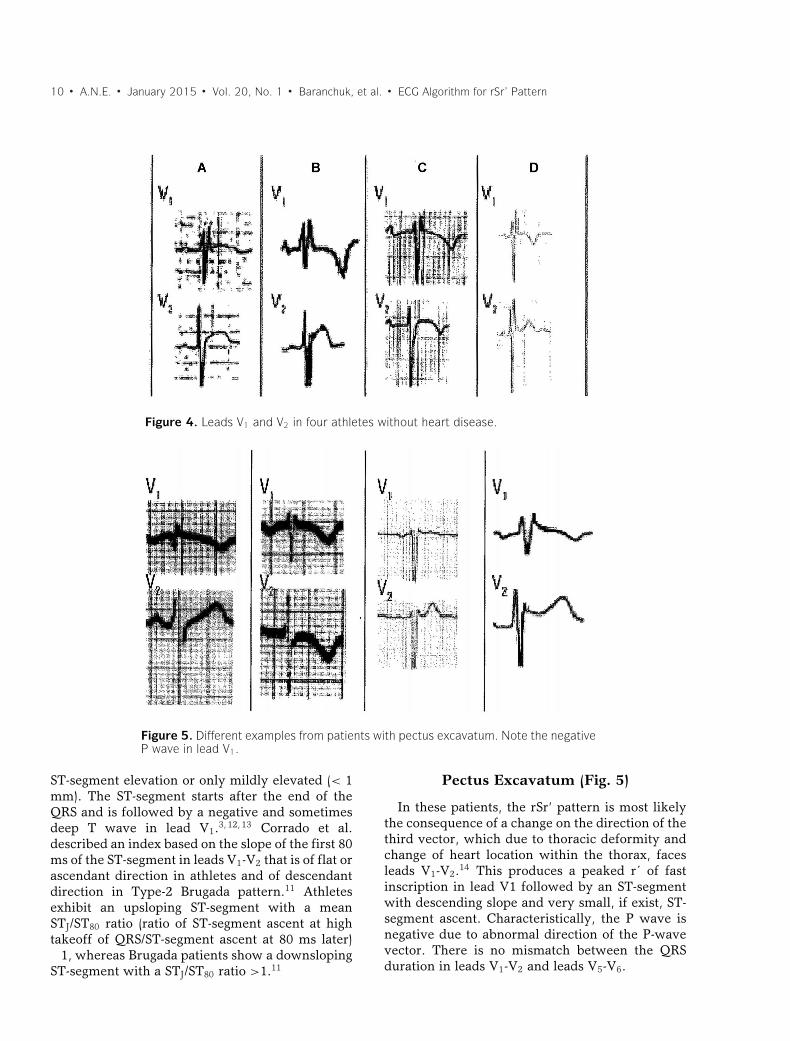
Figure 4. Leads V1 and V2 in four athletes without heart disease.
Figure 5. Different examples from patients with pectus excavatum. Note the negativeP wave in lead V1.
ST-segment elevation or only mildly elevated (< 1mm). The ST-segment starts after the end of theQRS and is followed by a negative and sometimesdeep T wave in lead V1.3,12,13 Corrado et al.described an index based on the slope of the first 80ms of the ST-segment in leads V1-V2 that is of flat orascendant direction in athletes and of descendantdirection in Type-2 Brugada pattern.11 Athletesexhibit an upsloping ST-segment with a meanSTJ/ST80 ratio (ratio of ST-segment ascent at hightakeoff of QRS/ST-segment ascent at 80 ms later)�1, whereas Brugada patients show a downslopingST-segment with a STJ/ST80 ratio >1.11
Pectus Excavatum (Fig. 5)
In these patients, the rSr’ pattern is most likelythe consequence of a change on the direction of thethird vector, which due to thoracic deformity andchange of heart location within the thorax, facesleads V1-V2.14 This produces a peaked r´ of fastinscription in lead V1 followed by an ST-segmentwith descending slope and very small, if exist, ST-segment ascent. Characteristically, the P wave isnegative due to abnormal direction of the P-wavevector. There is no mismatch between the QRSduration in leads V1-V2 and leads V5-V6.

A.N.E. � January 2015 � Vol. 20, No. 1 � Baranchuk, et al. � ECG Algorithm for rSr’ Pattern � 11
Figure 6. Typical ECG patterns of Type-1 (coved) Brugada pattern (A) andType-2 (saddle-back) (B).
Figure 7. (A) Mitral stenosis with moderate pulmonary hypertension and functional tricuspidregurgitation, (B) A 9-year-old girl with mild pulmonary stenosis, (C) Chronic cor pulmonalesecondary to chronic obstructive pulmonary disease (COPD) in elderly, (D) Ostium secundum-type atrial septal defect, (E) ECG pattern after regression of RVE in postsurgery of tetralogyof Fallot, (F) epsilon wave (arrow) in lead V1 in a patient with ARVD, (G) Ebstein disease(note massive atrial enlargement), and (H) Biventricular enlargement in a 8-year-old patientwith ventricular septal defect and hyperkinetic pulmonary hypertension (Katz-Watchellpattern).
PATHOLOGICAL PATTERNS
Usually the r’ is taller than r, with a lessfast ascent–descent morphology than in normalvariants.
Type-2 Brugada ECG Pattern(Figs. 6, 11, and 12)
The classic electrocardiographic abnormalitiesconstitute the hallmark of Brugada syndrome.Recently a consensus report endorsed by theISHNE13 has reduced the Brugada ECG patterns
to only two variants: (1) Type 1 (coved pattern)characterized by ST-segment elevation �2 mm inleads V1-V2 followed by a symmetric negativeT wave; and (2) Type 2 (saddle-back pattern) thatincludes “old” patterns 2 and 3 from the previousconsensus and is characterized by an r´ in leadsV1-V2, followed by convex ST-elevation � 0.5 mmwith positive T wave in lead V2 and of variablemorphology in lead V1. Type 1 is very specificand easy to recognize, however, differentiation ofType-2 Brugada pattern from incomplete RBBBand other benign rSr´ patterns may be challenging.
12 � A.N.E. � January 2015 � Vol. 20, No. 1 � Baranchuk, et al. � ECG Algorithm for rSr’ Pattern
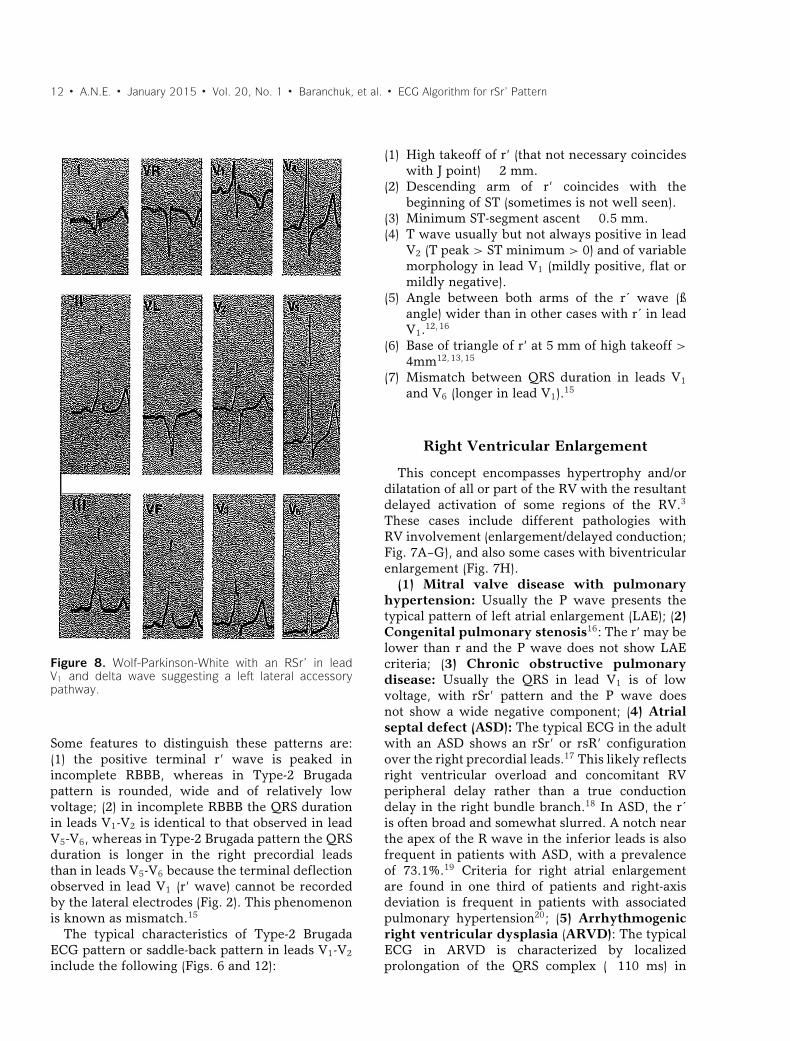
Figure 8. Wolf-Parkinson-White with an RSr’ in leadV1 and delta wave suggesting a left lateral accessorypathway.
Some features to distinguish these patterns are:(1) the positive terminal r’ wave is peaked inincomplete RBBB, whereas in Type-2 Brugadapattern is rounded, wide and of relatively lowvoltage; (2) in incomplete RBBB the QRS durationin leads V1-V2 is identical to that observed in leadV5-V6, whereas in Type-2 Brugada pattern the QRSduration is longer in the right precordial leadsthan in leads V5-V6 because the terminal deflectionobserved in lead V1 (r’ wave) cannot be recordedby the lateral electrodes (Fig. 2). This phenomenonis known as mismatch.15
The typical characteristics of Type-2 BrugadaECG pattern or saddle-back pattern in leads V1-V2include the following (Figs. 6 and 12):
(1) High takeoff of r’ (that not necessary coincideswith J point) � 2 mm.
(2) Descending arm of r’ coincides with thebeginning of ST (sometimes is not well seen).
(3) Minimum ST-segment ascent � 0.5 mm.(4) T wave usually but not always positive in lead
V2 (T peak > ST minimum > 0) and of variablemorphology in lead V1 (mildly positive, flat ormildly negative).
(5) Angle between both arms of the r´ wave (ßangle) wider than in other cases with r´ in leadV1.12,16
(6) Base of triangle of r’ at 5 mm of high takeoff >
4mm12,13,15
(7) Mismatch between QRS duration in leads V1and V6 (longer in lead V1).15
Right Ventricular Enlargement
This concept encompasses hypertrophy and/ordilatation of all or part of the RV with the resultantdelayed activation of some regions of the RV.3
These cases include different pathologies withRV involvement (enlargement/delayed conduction;Fig. 7A–G), and also some cases with biventricularenlargement (Fig. 7H).
(1) Mitral valve disease with pulmonaryhypertension: Usually the P wave presents thetypical pattern of left atrial enlargement (LAE); (2)Congenital pulmonary stenosis16: The r’ may belower than r and the P wave does not show LAEcriteria; (3) Chronic obstructive pulmonarydisease: Usually the QRS in lead V1 is of lowvoltage, with rSr’ pattern and the P wave doesnot show a wide negative component; (4) Atrialseptal defect (ASD): The typical ECG in the adultwith an ASD shows an rSr’ or rsR’ configurationover the right precordial leads.17 This likely reflectsright ventricular overload and concomitant RVperipheral delay rather than a true conductiondelay in the right bundle branch.18 In ASD, the r´is often broad and somewhat slurred. A notch nearthe apex of the R wave in the inferior leads is alsofrequent in patients with ASD, with a prevalenceof 73.1%.19 Criteria for right atrial enlargementare found in one third of patients and right-axisdeviation is frequent in patients with associatedpulmonary hypertension20; (5) Arrhythmogenicright ventricular dysplasia (ARVD): The typicalECG in ARVD is characterized by localizedprolongation of the QRS complex (�110 ms) in

A.N.E. � January 2015 � Vol. 20, No. 1 � Baranchuk, et al. � ECG Algorithm for rSr’ Pattern � 13
Figure 9. A 20-year-old male with chronic renal failure on hemodialysis during the past 2 years. Severe systemichypertension (210/130 mmHg). Serum potassium levels of 6.4 mEq/1. Note the high and peaked T wave, as well asthe ST-segment elevation in leads V2 and V3. The QT interval duration is relatively long in leads I, II, and III at theexpense of the ST-segment due to the associated hypocalcemia.
the right precordial leads (V1-V3), often associatedwith an epsilon wave (terminal notch in the QRScomplex) and T-wave inversion. It may emulatean atypical rSr´ pattern because the epsilon wavesometimes is confused with an r´ wave. Howeverusually the epsilon wave is a little separated of theQRS complex21; (6) Ebstein disease: May show apattern of RBBB with R’ > r and often with veryabnormal P wave.
Ventricular Preexcitation(Wolf-Parkinson-White Syndrome)
The diagnosis is straightforward when a deltawave is clearly visible and the PR interval isshort, but differentiation may be more challengingwhit more subtle degrees of preexcitation (Fig. 8).In posteroseptal accessory pathways, the QRSis predominantly negative in the inferior leads,especially in leads III and aVF, with R orRS morphology in lead V1 or V2 and QRSaxis between −30° and −90°. Patients with leftlateral accessory pathways exhibit a predominantlynegative morphology in lateral leads (I, aVL) andusually a high R wave (RSr’) in leads V1 or V2, withright-axis deviation (QRS axis beyond +90° up to+150°).
Hyperkalemia
In hyperkalemia, the T wave in some leadsbecomes very tall, wide, and peaked, sometimeswith a striking elevation of the ST-segment. Withincreased severity, the QRS complex becomeswider and the P wave may disappear (Fig. 9).
CLINICAL APPROACH FOR THEDIFFERENTIAL DIAGNOSIS OF RSR’
(R’) PATTERN IN LEADS V1-V2
Confirmation of a correct lead placement ofthe precordial leads during the ECG recording ismandatory. Rerecording is needed when misplace-ment is suspected (e.g., if P wave is negative inlead V1). Proper anamnesis is of utmost importanceto give meaning to an ECG reading: a familyhistory of sudden death or a personal history ofrecurrent syncope should alert about the possibilityof Brugada syndrome or ARVD and eventuallyprompt further investigations. Physical examina-tion may reveal the typical thoracic deformityin patients with pectus excavatum or a systolicmurmur on cardiac auscultation compatible withan ASD mitral stenosis or pulmonary stenosis. Sericpotassium should be measured if hyperkalemiais suspected (renal dysfunction, use of ACE
14 � A.N.E. � January 2015 � Vol. 20, No. 1 � Baranchuk, et al. � ECG Algorithm for rSr’ Pattern
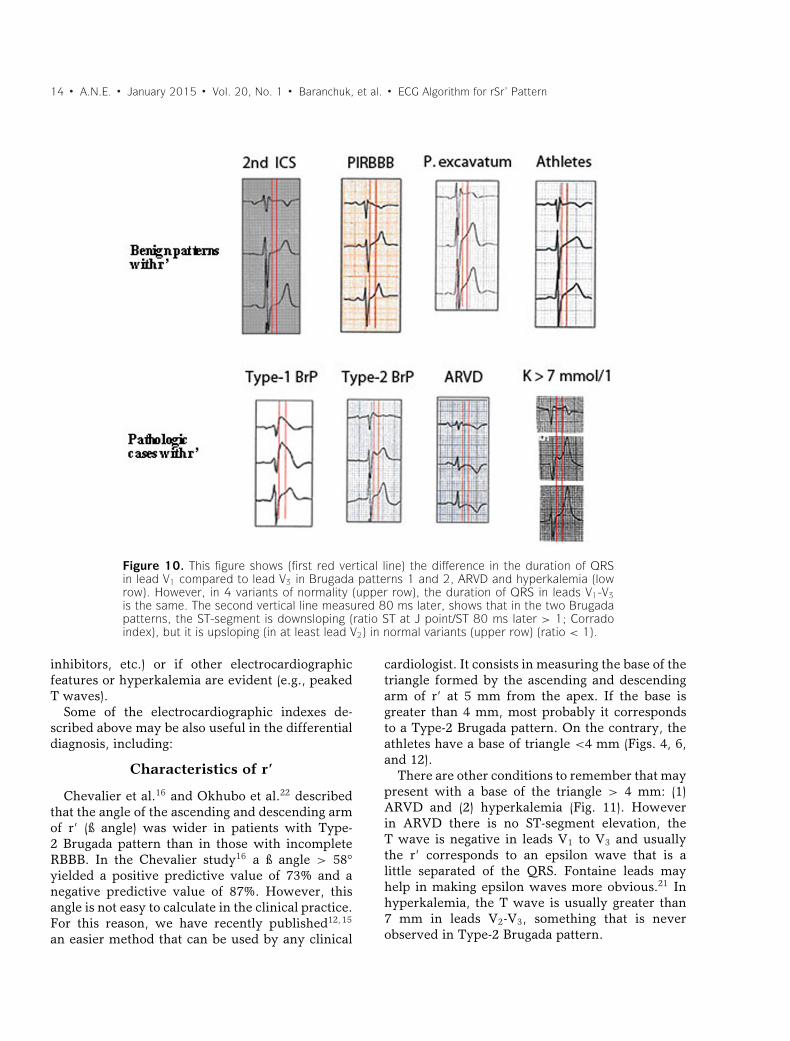
Figure 10. This figure shows (first red vertical line) the difference in the duration of QRSin lead V1 compared to lead V3 in Brugada patterns 1 and 2, ARVD and hyperkalemia (lowrow). However, in 4 variants of normality (upper row), the duration of QRS in leads V1-V3is the same. The second vertical line measured 80 ms later, shows that in the two Brugadapatterns, the ST-segment is downsloping (ratio ST at J point/ST 80 ms later > 1; Corradoindex), but it is upsloping (in at least lead V2) in normal variants (upper row) (ratio < 1).
inhibitors, etc.) or if other electrocardiographicfeatures or hyperkalemia are evident (e.g., peakedT waves).
Some of the electrocardiographic indexes de-scribed above may be also useful in the differentialdiagnosis, including:
Characteristics of r’
Chevalier et al.16 and Okhubo et al.22 describedthat the angle of the ascending and descending armof r’ (ß angle) was wider in patients with Type-2 Brugada pattern than in those with incompleteRBBB. In the Chevalier study16 a ß angle > 58°yielded a positive predictive value of 73% and anegative predictive value of 87%. However, thisangle is not easy to calculate in the clinical practice.For this reason, we have recently published12,15
an easier method that can be used by any clinical
cardiologist. It consists in measuring the base of thetriangle formed by the ascending and descendingarm of r’ at 5 mm from the apex. If the base isgreater than 4 mm, most probably it correspondsto a Type-2 Brugada pattern. On the contrary, theathletes have a base of triangle <4 mm (Figs. 4, 6,and 12).
There are other conditions to remember that maypresent with a base of the triangle > 4 mm: (1)ARVD and (2) hyperkalemia (Fig. 11). Howeverin ARVD there is no ST-segment elevation, theT wave is negative in leads V1 to V3 and usuallythe r’ corresponds to an epsilon wave that is alittle separated of the QRS. Fontaine leads mayhelp in making epsilon waves more obvious.21 Inhyperkalemia, the T wave is usually greater than7 mm in leads V2-V3, something that is neverobserved in Type-2 Brugada pattern.

A.N.E. � January 2015 � Vol. 20, No. 1 � Baranchuk, et al. � ECG Algorithm for rSr’ Pattern � 15
Figure 11. Proposed diagnostic algorithm in patients with r’ in leads V1-V2.
Figure 12. How to measure the ß angle (A) and the base of triangle of the r’ wave (B).
Index Ratio of “ST Elevation at HighTakeoff of QRS/ST Elevation at 80 ms”
(Corrado Index)
According to Corrado et al.11 the ratio is >1in type 1 Brugada pattern and <1 in athletes.Although this ratio usually allows to differentiatebetween Type-1 Brugada pattern (see Fig. 10), it isnot necessary true that the takeoff of QRS coincidesalways with the J point.12
Discrepancy between the QRS Durationin Leads V1-V2 and V5-V6 (Mismatch)
This is usually seen in Type-2 Brugada pattern,ARVD and hyperkalemia. However this is not easyto measure because the exact definition of thelocation of the J-point (end of the QRS) in leadsV1-V2, as we previously said, can be very difficultto determine in these conditions.15 The mismatchphenomenon needs to be investigated in a larger
16 � A.N.E. � January 2015 � Vol. 20, No. 1 � Baranchuk, et al. � ECG Algorithm for rSr’ Pattern
cohort of patients with type-2 Brugada pattern,using blind readers. This requires recording ofsimultaneous precordial leads.
Proposed Diagnostic Algorithm
In the presence of an rSr’ pattern in leadsV1-V2; we propose an algorithm to facilitate thedifferential diagnosis (Fig. 11). The algorithmfocuses in patients without apparent structuralheart disease. We excluded patients with ASD orother congenital heart diseases since the diagnosisusually is evident from physical examination andechocardiography.
The first step is to measure the base of thetriangle of r´ (Figs. 11 and 12).
(1) If the base of the triangle is >4 mm, it probablycorresponds to a Type-2 Brugada pattern, butstill ARVD and hyperkalemia need to be ruledout. In all 3 cases usually there is mismatchbetween leads V1-V2 and V5-V6. However, incases of ARVD T-wave inversion in leads V1-V3is frequently seen and there is no ST-segmentelevation. In addition, low voltages and epsilonwave are quite frequent.21 In hyperkalemia,ST-segment ascent can occur but always the Twave in leads V2-V3 is very tall (>7 mm) whatis not seen in Type-2 Brugada pattern.
(2) If the base of the triangle is <4 mm, it isunlikely to correspond to a type-2 Brugadapattern, there is no mismatch between leadsV1/V2-V5/V6 and the differential diagnosisinclude: (i) Incomplete RBBB (no ST-segmentascent); (ii) Athletes (the ST-segment ascentmay exist but the Corrado index is <1;Fig. 10); (iii) Pectus excavatum (Fig. 5) the Pwave is negative; (iv) Ventricular preexcitationsyndrome with left accessory pathway (a deltawave can be seen).
CONCLUSIONS
The presence of rSr’ pattern in leads V1-V2that was considered in the past as a benignpattern; may also be expression of dangerousconditions such as Brugada syndrome or ARVD.This new electrocardiographic algorithm, based onthe duration of the base of the triangle of r’, alongwith other criteria, may help on the diagnosis inthe vast majority of the cases.
REFERENCES1. Sodi Pallares D, Bisteni A, Medrano G. Electrocardiografia y
Vectorcardiografia Deductiva. Mexico DF, Mexico: La PrensaMedica Mexicana, 1967.
2. Durrer D, Van Dam R, Freud G, et al. Total excitation ofthe isolated human heart. Circulation 1970;41:899–912.
3. Bayes de Luna A. Textbook of Clinical ECG. Hoboken, NJ:Wiley-Blackwell, 2012.
4. Liao YL, Emidy LA, Dyer A, et al. Characteristics andprognosis of incomplete right bundle branch block: Anepidemiologic study. J Am Coll Cardiol 1986;7(3):492–499.
5. Lau EW, Ng GA, Griffith MJ. A new sign of an accessorypathway in sinus rhythm: Pseudo partial right bundlebranch block. Heart 1999;82:244–245.
6. Garcia Niebla J, Llontop-Garcia P, Valle J, et al. Technicalmistakes during the acquisition of the electrocardiogram.Ann Noninvasive Electrocardiol 2009;14:389–403.
7. Bussink BE, Holst AG, Jespersen L, et al. Right bundlebranch block: Prevalence, risk factors, and outcome inthe general population: Results from the Copenhagen CityHeart Study. Eur Heart J 2013;34(2):138–146.
8. Mauric AT, Samani NJ, de Bono DP. When should wediagnose incomplete right bundle branch block? Eur HeartJ 1993;14(5):602–608.
9. Rabkin SW, Mathewson FA, Tate RB. Long term followupof incomplete right bundle branch block: The risk ofdevelopment of complete right bundle branch block. JElectrocardiol 1981;14(4):379–386.
10. Schamroth L, Myburgh DP, Schamroth CL. The early signsof right bundle branch block. Chest 1985;87(2):180–185.
11. Corrado D, Pelliccia A, Heidbuchel H, et al.; Section ofSports Cardiology, European Association of CardiovascularPrevention and Rehabilitation. Recommendations for inter-pretation of 12-lead electrocardiogram in the athlete. EurHeart J 2010;31(2):243–259.
12. Serra G, Baranchuk A, Bayes-De-Luna A, et al. Newelectrocardiographic criteria to differentiate the Type-2Brugada pattern from electrocardiogram of healthy athleteswith r’-wave in leads V1/V2. Europace 2014;16:1639–1645.
13. Bayes de Luna A, Brugada J, Baranchuk A, et al. Currentelectrocardiographic criteria for diagnosis of Brugada pat-tern: A consensus report. J Electrocardiol 2012;45(5):433–442.
14. Awad SFM, Barbosa-Barros R, de Sousa Belem L, et al.Brugada Phenocopy in a patient with pectus excavatum:Systematic review of the ECG manifestations associatedwith pectus excavatum. Ann Noninv Eelctroacardiol2013;18(5):415–420.
15. Bayes de Luna A, Garcıa-Niebla J, Baranchuk A. Newelectrocardiograpphic features in Brugada syndrome. CurrCardiol Rev 2014;10(3):175–180.
16. Chevallier S, Forclaz A, Tenkorang J, et al. New electro-cardiographic criteria for discriminating between Brugadatypes 2 and 3 patterns and incomplete right bundle branchblock. J Am Coll Cardiol 2011;58:2290–2298.
17. Khairy P, Marelli AJ. Clinical use of electrocardiographyin adults with congenital heart disease. Circulation2007;116(23):2734–2746.
18. Sung RJ, Tamer DM, Agha AS, et al. Etiology of theelectrocardiographic pattern of “incomplete right bundlebranch block” in atrial septal defect: An electrophysiologicstudy. J Pediatr 1975;87(6 Pt 2):1182–1186.
19. Heller J, Hagege AA, Besse B, et al. “Crochetage” (notch)on R wave in inferior limb leads: A new independentelectrocardiographic sign of atrial septal defect. J Am CollCardiol 1996;27:877–882.

A.N.E. � January 2015 � Vol. 20, No. 1 � Baranchuk, et al. � ECG Algorithm for rSr’ Pattern � 17
20. Yamaki S, Horiuchi T, Miura M, et al. Pulmonaryvascular disease in secundum atrial septal defectwith pulmonary hypertension. Chest 1986;89:694–698.
21. Gottschalk B, Gysel M, Barbosa-Barros R, et al. Theuse of Fontaine leads in the diagnosis of arrhythmogenic
right ventricular dysplasia. Ann Noninv Electrocardiol2014;19(3):279–284.
22. Ohkubo K, Watanabe I, Okumura Y, et al. A newcriteria differentiating Type 2 and 3 Brugada patterns fromordinary incomplete right bundle branch block. Int Heart J2011;52(3):159–163.