Embed Size (px)
Citation preview

Differential Effectiveness
Report
Estimates All Years
Multi-Subject Estimate
Table
Multi-Subject Estimate
Graph
All Schools, Similar
Intake, Same District Report
Types of School Value-Added Reports

All Schools, Similar Intake &
Same District Comparisons Report

Distribution of schools’ value-added estimate shown by a box-and-whisker plot
School with the highest value-added
The box encloses the estimates of middle 50% of schools
School with the lowest value-added
75 percentile
25 percentile
median

This school has value-added slightly above 75% of all schools

This school has value-added well above 75% of similar intake schools
This school has value-added above average among schools from the same district

Differential Effectiveness Report
This School
All Schools
e.g. AAI
e.g. HKCEE

Pre-Test
Pos
t- T
est
Pre-Test
Pos
t- T
est
Figure 1
Pre-Test
Pos
t- T
est
Figure 2 Figure 3
Schools are different in their value-added performance, but have no significant difference in promoting the academic
performance of students of different abilities.
Types of Differential Effectiveness

Schools are different in their value-added performance but all are more effective in promoting the academic attainment of
more able students
Pre-Test
Pos
t- T
est
Pre-Test
Pos
t- T
est
Figure 4
Pre-Test
Pos
t- T
est
Figure 5 Figure 6
Types of Differential Effectiveness

Schools are different in their value-added performance but all are more effective in promoting the academic attainment
of less able students
Pre-Test
Pos
t- T
est
Pre-Test
Figure 7
Pre-Test
Pos
t- T
est
Pos
t- T
est
Figure 8 Figure 9
Types of Differential Effectiveness

Estimates
estimate
low
high
95% confidence interval

Estimates All Years Report
Enable comparison of value-added performance of a subject across the years
Data in tabular form
Name/Group Value-Added StanineLow Estimate High2000 -9.56 -7.08 -4.59 12001 -4.02 -1.87 0.28 42002 -1.49 1.24 3.97 6
Group of schools with similar value-
added
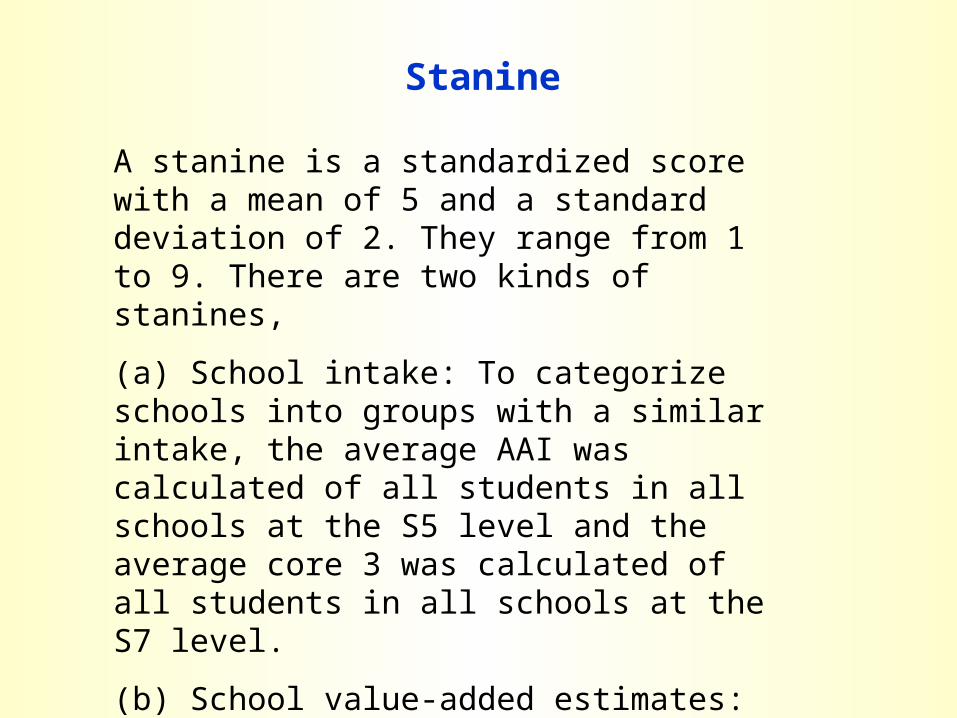
Stanine
A stanine is a standardized score with a mean of 5 and a standard deviation of 2. They range from 1 to 9. There are two kinds of stanines,
(a) School intake: To categorize schools into groups with a similar intake, the average AAI was calculated of all students in all schools at the S5 level and the average core 3 was calculated of all students in all schools at the S7 level.
(b) School value-added estimates: To categorize schools into groups with similar value-added

1 2 3 4 5 6 7 8 9
stanine = 7
Similar intake Group
× : stanine of a school
Normal distribution
(Converted from average AAI )

Multi-Subject Estimate Table
Multi-Subject Estimate Graph
Multi-Subject Report

Subject Low Value-added Estimate High
Additional Mathematics
-3.88 -0.69 2.51
Biology -5.22 -3.42 -1.61
Chemistry -7.1 -4.86 -2.62
Chinese History -8.78 -6.46 -4.13
Chinese Language -7.84 -5.59 -3.35
Computer Studies -4.02 -1.87 0.28
Economics -9.01 -6.59 -4.18
English Language (Syl B)
-3.77 -1.97 -0.17
Mathematics -6.57 -4.26 -1.95
Physics -5.04 -2.58 -0.13
Multi-Subject Estimate Table

Subject Group N Subjects OfferedN Subjects in Top
10% VAN Subjects in Top
50% VA
Chinese Language Education
1 0 0
English Language Education
1 0 0
Mathematics Education
2 1 1
Personal, Social and Humanities Education
2 0 0
Science Education 3 0 1
Technology Education
1 0 0
Multi-Subject Estimate Table

Multi-Subject Estimate Graph
Val
ue
Ad
ded
Sco
re
Add
itio
nal M
athe
mat
hics
Bes
t 6
Bio
logy
Che
mis
try
Chi
nese
His
tory
Chi
nese
Lan
guag
e
Chi
nese
Lit
erat
ure
Com
pute
r St
udie
s
Cor
e 3
Eng
lish
Lan
guag
e (S
yl B
)
Geo
grap
hy
His
tory
Mat
hem
atic
s
Phy
sics
Rel
igio
us S
tudi
es (
B, C
)

Both high and low estimates are positive
Above average value-added
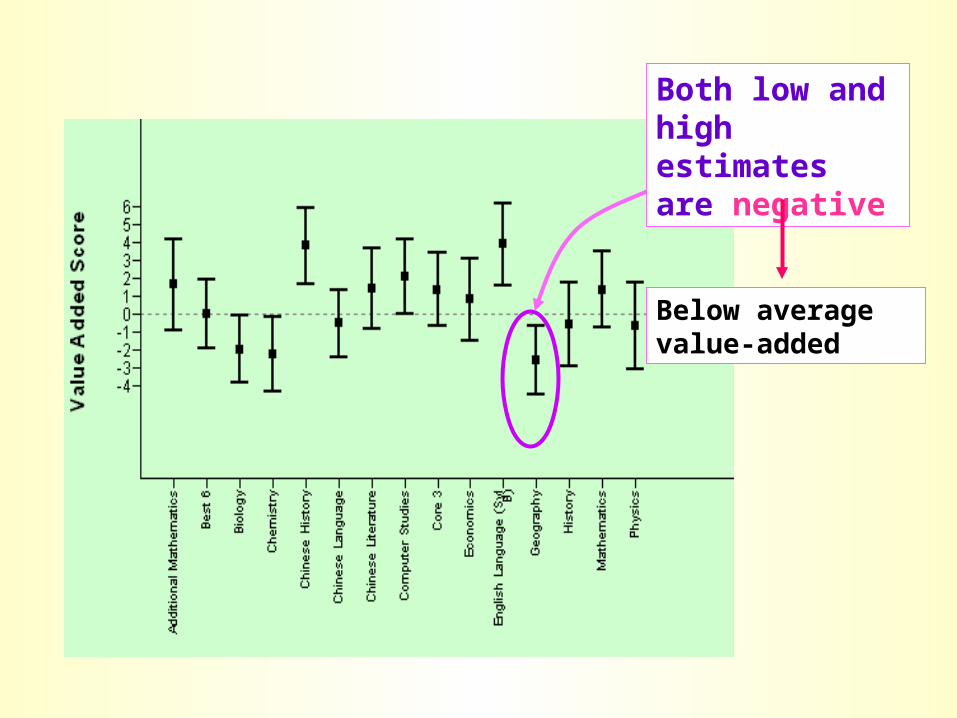
Both low and high estimates are negative
Below average value-added

Cannot conclude that value-added is above average

Cannot conclude that value-added is below average

Check value-added estimates listed in Multi-Subject Table

Both low and high estimates are positive
Above average value-added
Subject Low Estimate High
Additional Mathematics -0.84 1.67 4.18
Best 6 -1.88 0.02 1.93
Biology -3.82 -1.93 -0.04
Chemistry -4.33 -2.23 -0.13
Chinese History 1.67 3.83 6
Chinese Language -2.35 -0.47 1.41
Chinese Literature -0.81 1.43 3.67
Computer Studies 0.05 2.12 4.19
Core 3 -0.64 1.4 3.45
Economics -1.44 0.84 3.11
English Language 1.66 3.96 6.25
Geography -4.5 -2.55 -0.59
History -2.87 -0.56 1.75
Mathematics -0.74 1.39 3.52
Physics -3.06 -0.64 1.78
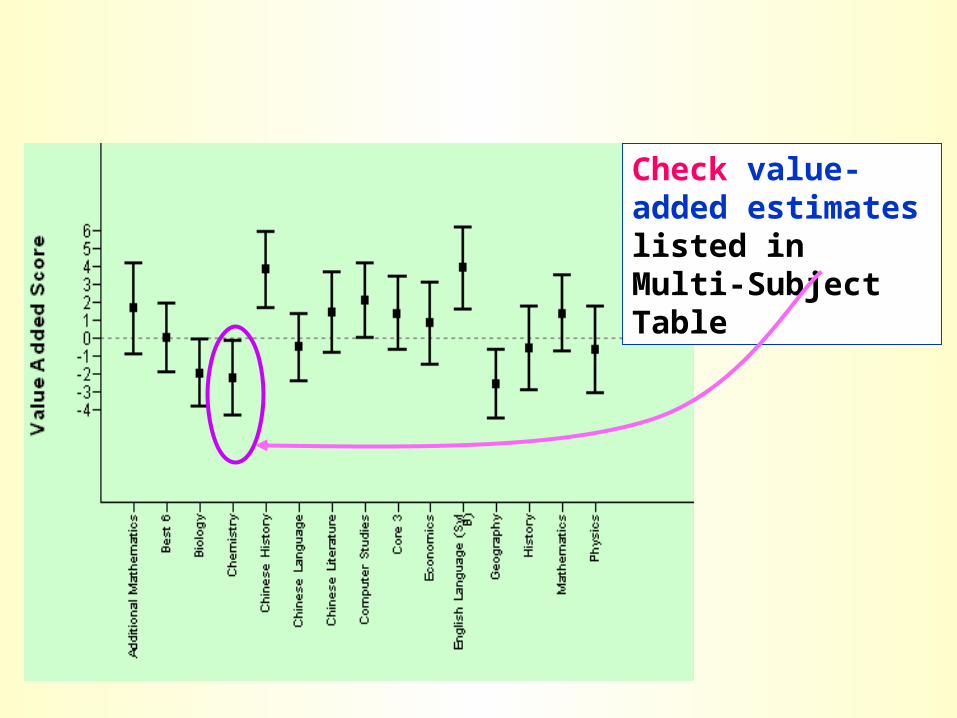
Check value-added estimates listed in Multi-Subject Table

Subject Low Estimate High
Additional Mathematics -0.84 1.67 4.18
Best 6 -1.88 0.02 1.93
Biology -3.82 -1.93 -0.04
Chemistry -4.33 -2.23 -0.13
Chinese History 1.67 3.83 6
Chinese Language -2.35 -0.47 1.41
Chinese Literature -0.81 1.43 3.67
Computer Studies 0.05 2.12 4.19
Core 3 -0.64 1.4 3.45
Economics -1.44 0.84 3.11
English Language 1.66 3.96 6.25
Geography -4.5 -2.55 -0.59
History -2.87 -0.56 1.75
Mathematics -0.74 1.39 3.52
Physics -3.06 -0.64 1.78
Both low and high estimates are negative
Below average value-added