Embed Size (px)
Citation preview
Differential Expression of Brn3 Transcription Factorsin Intrinsically Photosensitive Retinal GanglionCells in Mouse
Varsha Jain, Ethiraj Ravindran, and Narender K. Dhingra*
National Brain Research Centre, Manesar (Haryana) 122050, India
ABSTRACTSeveral subtypes of melanopsin-expressing, intrinsically
photosensitive retinal ganglion cells (ipRGCs) have been
reported. The M1 type of ipRGCs exhibit distinct prop-
erties compared with the remaining (non-M1) cells.
They differ not only in their soma size and dendritic
arbor, but also in their physiological properties, projec-
tion patterns, and functions. However, it is not known
how these differences arise. We tested the hypothesis
that M1 and non-M1 cells express Brn3 transcription
factors differentially. The Brn3 family of class IV POU-
domain transcription factors (Brn3a, Brn3b, and Brn3c)
is involved in the regulation of differentiation, dendritic
stratification, and axonal projection of retinal ganglion
cells during development. By using double immunofluo-
rescence for Brn3 transcription factors and melanopsin,
and with elaborate morphometric analyses, we show in
mouse retina that neither Brn3a nor Brn3c are
expressed in ipRGCs. However, Brn3b is expressed in a
subset of ipRGCs, particularly those with larger somas
and lower melanopsin levels, suggesting that Brn3b is
expressed preferentially in the non-M1 cells. By using
dendritic stratification to distinguish M1 from non-M1
cells, we found that whereas nearly all non-M1 cells
expressed Brn3b, a vast majority of the M1 cells were
negative for Brn3b. Interestingly, in the small proportion
of the M1 cells that did express Brn3b, the expression
level of Brn3b was significantly lower than in the non-M1
cells. These results provide insights about how expres-
sion of specific molecules in a ganglion cell could be
linked to its role in visual function. J. Comp. Neurol.
520:742–755, 2012.
VC 2011 Wiley Periodicals, Inc.
INDEXING TERMS: melanopsin; Brn3a; Brn3b; Brn3c
A subset of retinal ganglion cells (RGCs) expresses the
photopigment melanopsin, and is intrinsically photosensi-
tive (ipRGCs; Provencio et al., 2000, 2002; Berson et al.,
2002). These cells are involved in a range of visual func-
tions. At least five subtypes of ipRGCs have been
reported, denoted M1–M5; they differ in their morpholog-
ical and physiological characteristics (Hattar et al., 2002,
Viney et al., 2007; Baver et al., 2008, Schmidt et al.,
2008, Schmidt and Kofuji, 2009, 2010, 2011; Pires et al.,
2009; Berson et al., 2010; Ecker et al., 2010). Specifi-
cally, the properties of M1 cells are strikingly different
from those of the non-M1 cells. For example, M1 cells
stratify in the Off sublayer of the inner plexiform layer
(IPL), whereas non-M1 cells stratify in the On sublayer
(M3 cells stratify in both). Similarly, M1 cells have a
smaller soma and a simpler dendritic arbor, but higher
melanopsin levels, and therefore higher sensitivity and
faster response kinetics.
Until recently, ipRGCs were considered to mediate only
non-image-forming visual functions, such as circadian
photoentrainment and pupillary reflex (Gooley et al.,
2001; Berson et al., 2002; Hannibal et al., 2002; Hattar
et al., 2002; Panda et al., 2002; Hatori et al., 2008). How-
ever, the non-M1 types of ipRGCs have been shown
recently to additionally mediate image-forming vision
(Ecker et al., 2010). Consistent with this, M1 and non-M1
cells exhibit distinct patterns of projection to various
brain areas (Ecker et al., 2010). For example, the supra-
chiasmatic nucleus (SCN) and intergeniculate leaflet
Grant sponsor: Department of Biotechnology, Ministry of Science andTechnology, Government of India; Grant number: BT/PR6410/Med/14/801/2005 (to N.K.D.); Grant sponsor: National Brain Research Centre,India.
*CORRESPONDENCE TO: Narender K. Dhingra, National Brain ResearchCentre, Nainwal Road, NH-8, Manesar (Gurgaon) Haryana 122050, India.E-mail: [email protected]
VC 2011 Wiley Periodicals, Inc.
Received April 29, 2011; Revised June 23, 2011; Accepted September 7,2011
DOI 10.1002/cne.22765
Published online September 20, 2011 in Wiley Online Library(wileyonlinelibrary.com)
742 The Journal of Comparative Neurology |Research in Systems Neuroscience 520:742–755 (2012)
RESEARCH ARTICLE
(IGL) are innervated predominantly by the M1 cells,
whereas the superior colliculus and dorsal lateral genicu-
late nucleus receive their melanopsin cell input primarily
from the non-M1 cells. However, it is not known how
these differences between M1 and non-M1 cells are
generated.
One possibility is that these differences originate from
differential expression of specific molecules during devel-
opment. The Brn3 family of class IV POU-domain tran-
scription factors, (Brn3a, Brn3b, and Brn3c) is known to
regulate the differentiation, axonal pathfinding, and den-
dritic stratification of RGCs (Xiang et al., 1993; Gan et al.,
1996, 1999; Erkman et al., 2000; Wang et al., 2000,
2002; Badea et al., 2009). In mouse retina, Brn3b is the
first Brn3 transcription factor to appear during develop-
ment and is critically required for the survival and differ-
entiation of RGCs and in guiding their axonal projections
(Gan et al., 1996, 1999; Erkman et al., 1996, 2000; Wang
et al., 2000, 2002; Badea et al., 2009). Brn3a plays a role
in regulating patterns of dendritic stratification of RGCs
(Badea et al., 2009). Brn3c is expressed in fewer RGCs
and is involved in RGC differentiation and axonal out-
growth (Wang et al., 2002). We asked here whether Brn3
transcription factors are expressed differentially in M1
and non-M1 cells.
A part of this work was published as an abstract (Jain
et al., 2010).
MATERIALS AND METHODS
Animals and tissue preparationAll experiments reported here were approved by the
Institutional Animal Ethics Committee of the National
Brain Research Centre, India. Adult mice (C57BL/6J, 8–
12 weeks old, male) were maintained on a 12-hour light/
dark cycle with an average ambient daylight of approxi-
mately 200 lux (measured with an IL1400 photometer,
International Light Technologies, Peabody, MA). Nine reti-
nas from nine animals were used to quantify the number
of cells in the ganglion cell layer (GCL), including the num-
ber of RGCs and the number of Brn3a-, Brn3b-, Brn3c- or
melanopsin-expressing cells. To average the potential
daily oscillation in the number of immunodetectable mel-
anopsin cells (Gonzalez-Menendez et al., 2009), we sacri-
ficed one animal at Zeitgeber time (ZT) ¼ 3 (ZT ¼ 0 repre-
sents onset time of the day cycle), another at ZT ¼ 23,
and seven animals between ZT ¼ 4 and ZT ¼ 12.
Eyes were removed after cervical dislocation, and a
small incision was made near and perpendicular to lim-
bus. Eyes were then immersed in 4% paraformaldehyde
(PFA; pH 7.4) at 4�C for 10 minutes and hemisected, fol-
lowed by fixation of the posterior eyecup in 4% PFA for
45–60 minutes at 4�C. To prepare a whole-mount, the
retina was isolated from the posterior eyecup, incised
radially, and flattened on a membrane filter. The mem-
brane filter with the attached flattened retina was used
for further processing. To prepare retinal sections, the
posterior eyecup was immersed in 30% sucrose for 1–2
hours at 4�C and sectioned at 30- or 50-lm thickness on
a cryostat (model CM3050S; Leica Microsystems, Wet-
zlar, Germany). The sections were collected on 3-amino-
propyl, triethoxysilane (APES)-coated glass slides.
Characterization of primary antibodiesThe primary antibodies against Brn3a and Brn3c were
mouse monoclonal, whereas the Brn3b antibody was
goat polyclonal (Table 1; Santa Cruz Biotechnology, Santa
Cruz, CA; Wagner et al., 2002; Elshatory et al., 2007;
Poche et al., 2008; Kawano et al., 2008). The Brn3a and
Brn3c antibodies recognize in Western blot 47- and 37-
kDa bands, respectively (manufacturer’s specifications).
The specificity of the Brn3b antibody was confirmed by
preadsorption with a Brn3b blocking peptide (Santa Cruz
Biotechnology; #sc-6026P [not illustrated]). The Brn3b
blocking peptide sequence consisted of amino acids
397–410, as determined by matrix-assisted laser desorp-
tion/ionization time-of-flight (MALDI-TOF) and liquid
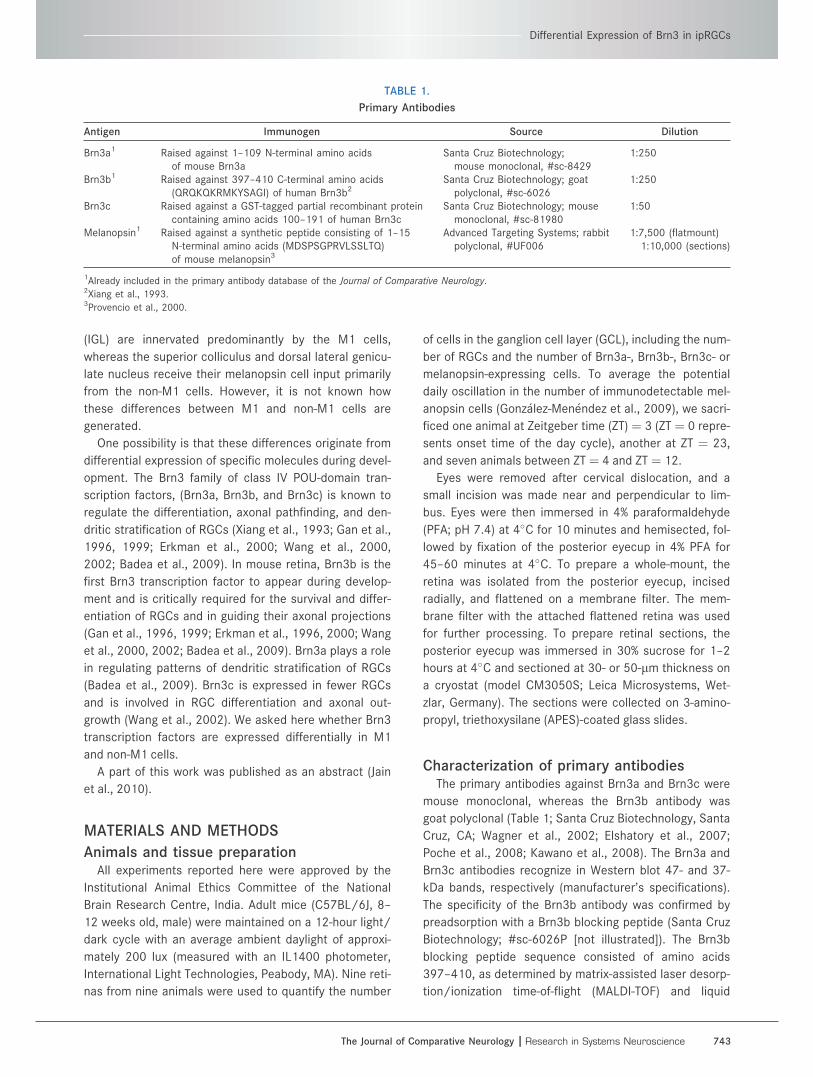
TABLE 1.
Primary Antibodies
Antigen Immunogen Source Dilution
Brn3a1 Raised against 1–109 N-terminal amino acidsof mouse Brn3a
Santa Cruz Biotechnology;mouse monoclonal, #sc-8429
1:250
Brn3b1 Raised against 397–410 C-terminal amino acids(QRQKQKRMKYSAGI) of human Brn3b2
Santa Cruz Biotechnology; goatpolyclonal, #sc-6026
1:250
Brn3c Raised against a GST-tagged partial recombinant proteincontaining amino acids 100–191 of human Brn3c
Santa Cruz Biotechnology; mousemonoclonal, #sc-81980
1:50
Melanopsin1 Raised against a synthetic peptide consisting of 1–15N-terminal amino acids (MDSPSGPRVLSSLTQ)of mouse melanopsin3
Advanced Targeting Systems; rabbitpolyclonal, #UF006
1:7,500 (flatmount)1:10,000 (sections)
1Already included in the primary antibody database of the Journal of Comparative Neurology.2Xiang et al., 1993.3Provencio et al., 2000.
Differential Expression of Brn3 in ipRGCs
The Journal of Comparative Neurology |Research in Systems Neuroscience 743
chromatography mass spectrometry (Poche et al., 2008).
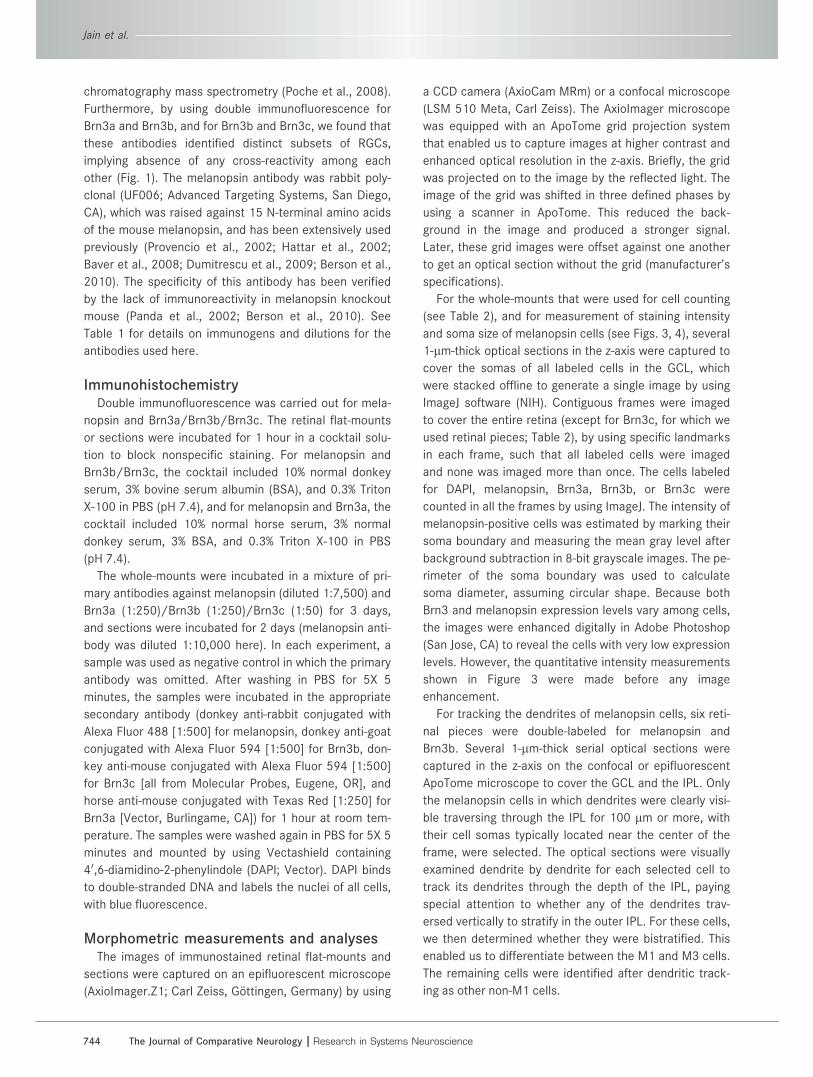
Furthermore, by using double immunofluorescence for
Brn3a and Brn3b, and for Brn3b and Brn3c, we found that
these antibodies identified distinct subsets of RGCs,
implying absence of any cross-reactivity among each
other (Fig. 1). The melanopsin antibody was rabbit poly-
clonal (UF006; Advanced Targeting Systems, San Diego,
CA), which was raised against 15 N-terminal amino acids
of the mouse melanopsin, and has been extensively used
previously (Provencio et al., 2002; Hattar et al., 2002;
Baver et al., 2008; Dumitrescu et al., 2009; Berson et al.,
2010). The specificity of this antibody has been verified
by the lack of immunoreactivity in melanopsin knockout
mouse (Panda et al., 2002; Berson et al., 2010). See
Table 1 for details on immunogens and dilutions for the
antibodies used here.
ImmunohistochemistryDouble immunofluorescence was carried out for mela-
nopsin and Brn3a/Brn3b/Brn3c. The retinal flat-mounts
or sections were incubated for 1 hour in a cocktail solu-
tion to block nonspecific staining. For melanopsin and
Brn3b/Brn3c, the cocktail included 10% normal donkey
serum, 3% bovine serum albumin (BSA), and 0.3% Triton
X-100 in PBS (pH 7.4), and for melanopsin and Brn3a, the
cocktail included 10% normal horse serum, 3% normal
donkey serum, 3% BSA, and 0.3% Triton X-100 in PBS
(pH 7.4).
The whole-mounts were incubated in a mixture of pri-
mary antibodies against melanopsin (diluted 1:7,500) and
Brn3a (1:250)/Brn3b (1:250)/Brn3c (1:50) for 3 days,
and sections were incubated for 2 days (melanopsin anti-
body was diluted 1:10,000 here). In each experiment, a
sample was used as negative control in which the primary
antibody was omitted. After washing in PBS for 5X 5
minutes, the samples were incubated in the appropriate
secondary antibody (donkey anti-rabbit conjugated with
Alexa Fluor 488 [1:500] for melanopsin, donkey anti-goat
conjugated with Alexa Fluor 594 [1:500] for Brn3b, don-
key anti-mouse conjugated with Alexa Fluor 594 [1:500]
for Brn3c [all from Molecular Probes, Eugene, OR], and
horse anti-mouse conjugated with Texas Red [1:250] for
Brn3a [Vector, Burlingame, CA]) for 1 hour at room tem-
perature. The samples were washed again in PBS for 5X 5
minutes and mounted by using Vectashield containing
40,6-diamidino-2-phenylindole (DAPI; Vector). DAPI binds
to double-stranded DNA and labels the nuclei of all cells,
with blue fluorescence.
Morphometric measurements and analysesThe images of immunostained retinal flat-mounts and
sections were captured on an epifluorescent microscope
(AxioImager.Z1; Carl Zeiss, Gottingen, Germany) by using
a CCD camera (AxioCam MRm) or a confocal microscope
(LSM 510 Meta, Carl Zeiss). The AxioImager microscope
was equipped with an ApoTome grid projection system
that enabled us to capture images at higher contrast and
enhanced optical resolution in the z-axis. Briefly, the grid
was projected on to the image by the reflected light. The
image of the grid was shifted in three defined phases by
using a scanner in ApoTome. This reduced the back-
ground in the image and produced a stronger signal.
Later, these grid images were offset against one another
to get an optical section without the grid (manufacturer’s
specifications).
For the whole-mounts that were used for cell counting
(see Table 2), and for measurement of staining intensity
and soma size of melanopsin cells (see Figs. 3, 4), several
1-lm-thick optical sections in the z-axis were captured to
cover the somas of all labeled cells in the GCL, which
were stacked offline to generate a single image by using
ImageJ software (NIH). Contiguous frames were imaged
to cover the entire retina (except for Brn3c, for which we
used retinal pieces; Table 2), by using specific landmarks
in each frame, such that all labeled cells were imaged
and none was imaged more than once. The cells labeled
for DAPI, melanopsin, Brn3a, Brn3b, or Brn3c were
counted in all the frames by using ImageJ. The intensity of
melanopsin-positive cells was estimated by marking their
soma boundary and measuring the mean gray level after
background subtraction in 8-bit grayscale images. The pe-
rimeter of the soma boundary was used to calculate
soma diameter, assuming circular shape. Because both
Brn3 and melanopsin expression levels vary among cells,
the images were enhanced digitally in Adobe Photoshop
(San Jose, CA) to reveal the cells with very low expression
levels. However, the quantitative intensity measurements
shown in Figure 3 were made before any image
enhancement.
For tracking the dendrites of melanopsin cells, six reti-
nal pieces were double-labeled for melanopsin and
Brn3b. Several 1-lm-thick serial optical sections were
captured in the z-axis on the confocal or epifluorescent
ApoTome microscope to cover the GCL and the IPL. Only
the melanopsin cells in which dendrites were clearly visi-
ble traversing through the IPL for 100 lm or more, with
their cell somas typically located near the center of the
frame, were selected. The optical sections were visually
examined dendrite by dendrite for each selected cell to
track its dendrites through the depth of the IPL, paying
special attention to whether any of the dendrites trav-
ersed vertically to stratify in the outer IPL. For these cells,
we then determined whether they were bistratified. This
enabled us to differentiate between the M1 and M3 cells.
The remaining cells were identified after dendritic track-
ing as other non-M1 cells.
Jain et al.
744 The Journal of Comparative Neurology |Research in Systems Neuroscience
Figure 1. Specificity of Brn3 antibodies in mouse retina. A: Representative field of a retinal whole-mount showing RGCs immunoreactive
for Brn3a (green) and Brn3b (red) (blue: DAPI). Some cells expressed both Brn3a and Brn3b (double arrow), and others expressed only
Brn3a (single arrow) or only Brn3b (arrowhead). This implied that the Brn3a and Brn3b antibodies were specific and did not cross-react. B:
Same field as in A, showing only Brn3a labeling. Note the absence of labeling in the cell expressing only Brn3b (arrowhead). C: Same field
as in A, showing only Brn3b labeling. Note the absence of labeling in the cell expressing only Brn3a (single arrow). D: Representative field
showing RGCs immunoreactive for Brn3b (red) and Brn3c (green) (blue: DAPI). Some cells expressed both Brn3b and Brn3c (double arrow),
and others expressed only Brn3b (arrowhead) or only Brn3c (single arrow). This implied that the Brn3b and Brn3c antibodies were specific
and did not cross-react. E: Same field as in D, showing only Brn3c labeling. Note the absence of labeling in the cell expressing only Brn3b
(arrowhead). F: Same field as in D, showing only Brn3b labeling. Note the absence of labeling in the cell expressing only Brn3c (single
arrow). Scale bar ¼ 20 lm in F (applies to A–F). [Color figure can be viewed in the online issue, which is available at
wileyonlinelibrary.com.]
Differential Expression of Brn3 in ipRGCs
The Journal of Comparative Neurology |Research in Systems Neuroscience 745
For more than one-fourth of the selected cells, we also
made 3D reconstructions of their dendrites, by using
Neuromantic software (Darren Myatt, www.reading.a-
c.uk/neuromantic; Freed and Liang, 2010; see Fig. 7).
Here, the dendrites were tracked by moving through all
optical sections one by one and were drawn from the
best focused optical section. In addition, for more than
one-third of the M1 cells (a different subset from the one
analyzed with Neuromantic), we generated 3D images
from the optical sections by using the Volume Viewer
plug-in in ImageJ (http://rsbweb.nih.gov/ij/plugins/
volume-viewer.html). The optical sections were opened in
Volume I display mode, and the intensity threshold and
other parameters were adjusted to get a clear view of the
dendritic tree. The 3D reconstructions or images were
rotated freely in all axes to get the best view of the
dendrites stratifying in the IPL (see Fig. 7).
The Brn3b staining intensity in the ipRGCs was meas-
ured by using a previously described method with slight
modifications (M. Bongard, http://naranja.umh.es/�atg/
tutorials/VGIV-MeasuringCellsImageJ.pdf; see Fig. 8).
Briefly, several 1-lm optical sections of the GCL contain-
ing Brn3b signals were merged by using ImageJ. After
background subtraction, the image contrast was
enhanced, which allowed detection of even the very
lightly labeled Brn3b cells. The contrast enhancement
was kept constant for all the frames. The image was
thresholded (incrementally when necessary), and all the
Brn3b-expressing cells were selected by using the Region
of Interest and Wand tools of imageJ. The intensity of
Brn3b staining was measured for each selected cell and
was also visualized by using the Interactive 3D Surface
Plot plug-in (see Fig. 8G).
RESULTS
Estimates of RGCs expressing melanopsinor Brn3 transcription factors
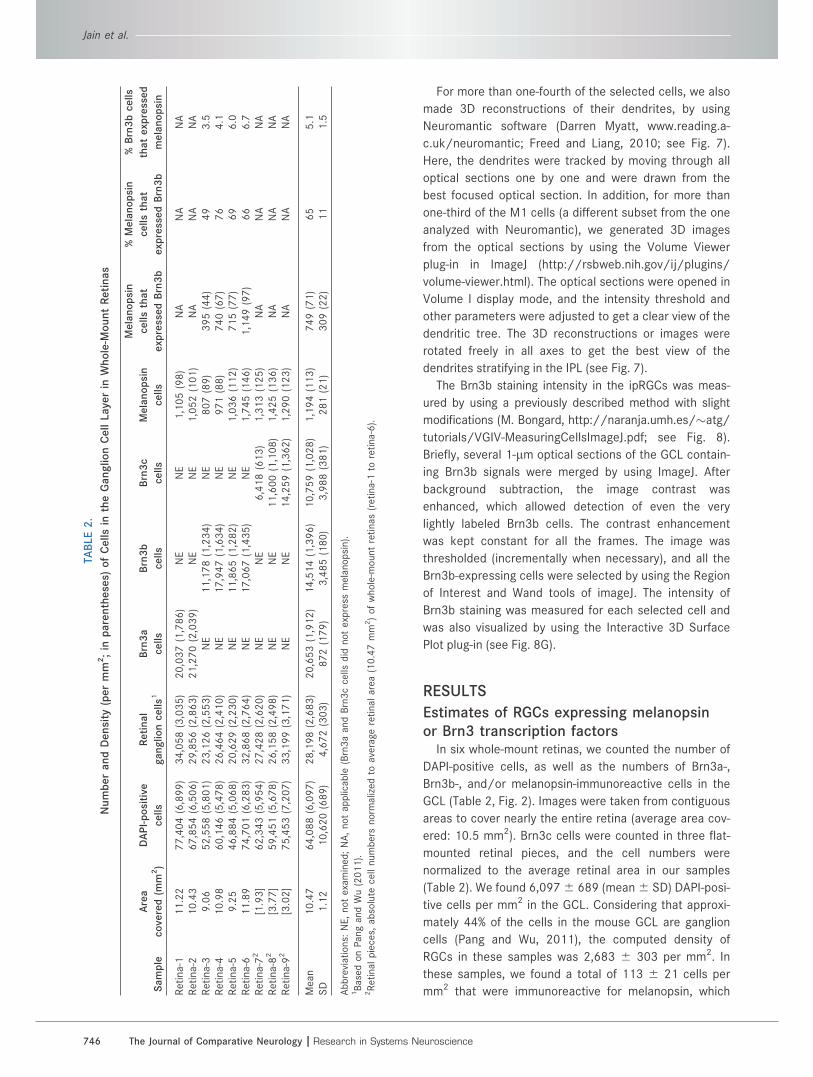
In six whole-mount retinas, we counted the number of
DAPI-positive cells, as well as the numbers of Brn3a-,
Brn3b-, and/or melanopsin-immunoreactive cells in the
GCL (Table 2, Fig. 2). Images were taken from contiguous
areas to cover nearly the entire retina (average area cov-
ered: 10.5 mm2). Brn3c cells were counted in three flat-
mounted retinal pieces, and the cell numbers were
normalized to the average retinal area in our samples
(Table 2). We found 6,0976 689 (mean6 SD) DAPI-posi-
tive cells per mm2 in the GCL. Considering that approxi-
mately 44% of the cells in the mouse GCL are ganglion
cells (Pang and Wu, 2011), the computed density of
RGCs in these samples was 2,683 6 303 per mm2. In
these samples, we found a total of 113 6 21 cells per
mm2 that were immunoreactive for melanopsin, which
TABLE2.
NumberandDensity
(permm
2;in
parentheses)
ofCells
intheGanglionCellLayerin
Whole-M
ountRetinas
Sample
Area
covered(m
m2)
DAPI-positive
cells
Retinal
ganglioncells
1
Brn3a
cells
Brn3b
cells
Brn3c
cells
Melanopsin
cells
Melanopsin
cells
that
expressedBrn3b
%Melanopsin
cells
that
expressedBrn3b
%Brn3bcells
thatexpressed
melanopsin
Retina-1
11.22
77,404(6,899)
34,058(3,035)
20,037(1,786)
NE
NE
1,105(98)
NA
NA
NA
Retina-2
10.43
67,854(6,506)
29,856(2,863)
21,270(2,039)
NE
NE
1,052(101)
NA
NA
NA
Retina-3
9.06
52,558(5,801)
23,126(2,553)
NE
11,178(1,234)
NE
807(89)
395(44)
49
3.5
Retina-4
10.98
60,146(5,478)
26,464(2,410)
NE
17,947(1,634)
NE
971(88)
740(67)
76
4.1
Retina-5
9.25
46,884(5,068)
20,629(2,230)
NE
11,865(1,282)
NE
1,036(112)
715(77)
69
6.0
Retina-6
11.89
74,701(6,283)
32,868(2,764)
NE
17,067(1,435)
NE
1,745(146)
1,149(97)
66
6.7
Retina-7
2[1.93]
62,343(5,954)
27,428(2,620)
NE
NE
6,418(613)
1,313(125)
NA
NA
NA
Retina-8
2[3.77]
59,451(5,678)
26,158(2,498)
NE
NE
11,600(1,108)
1,425(136)
NA
NA
NA
Retina-9
2[3.02]
75,453(7,207)
33,199(3,171)
NE
NE
14,259(1,362)
1,290(123)
NA
NA
NA
Mean
10.47
64,088(6,097)
28,198(2,683)
20,653(1,912)
14,514(1,396)
10,759(1,028)
1,194(113)
749(71)
65
5.1
SD
1.12
10,620(689)
4,672(303)
872(179)
3,485(180)
3,988(381)
281(21)
309(22)
11
1.5
Abbreviations:
NE,notexamined;NA,notapplicable
(Brn3aandBrn3ccells
did
notexpress
melanopsin).
1BasedonPangandWu(2011).
2Retinalpieces,
absolute
cellnumbers
norm
alizedto
averageretinalarea(10.47mm
2)ofwhole-m
ountretinas(retina-1
toretina-6).
Jain et al.
746 The Journal of Comparative Neurology |Research in Systems Neuroscience
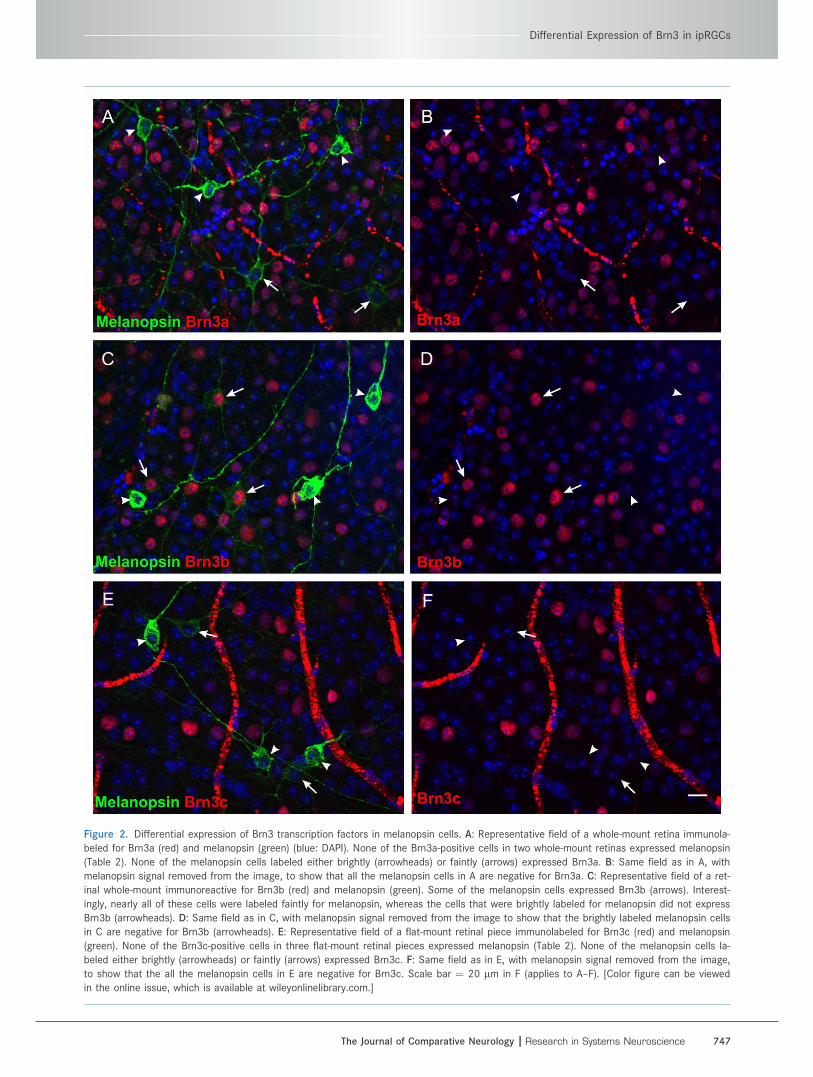
Figure 2. Differential expression of Brn3 transcription factors in melanopsin cells. A: Representative field of a whole-mount retina immunola-
beled for Brn3a (red) and melanopsin (green) (blue: DAPI). None of the Brn3a-positive cells in two whole-mount retinas expressed melanopsin
(Table 2). None of the melanopsin cells labeled either brightly (arrowheads) or faintly (arrows) expressed Brn3a. B: Same field as in A, with
melanopsin signal removed from the image, to show that all the melanopsin cells in A are negative for Brn3a. C: Representative field of a ret-
inal whole-mount immunoreactive for Brn3b (red) and melanopsin (green). Some of the melanopsin cells expressed Brn3b (arrows). Interest-
ingly, nearly all of these cells were labeled faintly for melanopsin, whereas the cells that were brightly labeled for melanopsin did not express
Brn3b (arrowheads). D: Same field as in C, with melanopsin signal removed from the image to show that the brightly labeled melanopsin cells
in C are negative for Brn3b (arrowheads). E: Representative field of a flat-mount retinal piece immunolabeled for Brn3c (red) and melanopsin
(green). None of the Brn3c-positive cells in three flat-mount retinal pieces expressed melanopsin (Table 2). None of the melanopsin cells la-
beled either brightly (arrowheads) or faintly (arrows) expressed Brn3c. F: Same field as in E, with melanopsin signal removed from the image,
to show that the all the melanopsin cells in E are negative for Brn3c. Scale bar ¼ 20 lm in F (applies to A–F). [Color figure can be viewed
in the online issue, which is available at wileyonlinelibrary.com.]
Differential Expression of Brn3 in ipRGCs
The Journal of Comparative Neurology |Research in Systems Neuroscience 747
represented approximately 4% of RGCs. In addition,
1,912 6 179 cells per mm2 (71% of RGCs) expressed
Brn3a (n ¼ 2 retinas), 1,3966 180 cells per mm2 (52% of
RGCs) expressed Brn3b (n ¼ 4 retinas), and 1,0286 381
cells per mm2 (38% of RGCs) expressed Brn3c (n ¼ 3 reti-
nal pieces; Table 2).
A subset of melanopsin cells expressedBrn3b, but none expressed Brn3a or Brn3c
Double immunofluorescence for melanopsin and
Brn3a/Brn3c revealed that none of the melanopsin cells
expressed either Brn3a or Brn3c (Table 2, Fig. 2). How-
ever, a subset of the melanopsin cells expressed Brn3b
(Fig. 2, Table 2). The number of these cells that co-
expressed melanopsin and Brn3b (716 22 per mm2) cor-
responded to approximately 3% of all RGCs, 5% of Brn3b
cells, and 65% of melanopsin cells (Table 2). Interestingly,
the melanopsin cells that co-expressed Brn3b were typi-
cally labeled faintly for melanopsin (Fig. 2C,D; arrows),
whereas the ones that did not express Brn3b were la-
beled brightly (Fig. 2C,D; arrowheads). Because M1 cells
express much higher levels of melanopsin than the other
subtypes (Schmidt and Kofuji, 2009; Berson et al., 2010;
Ecker et al., 2010), this observation indicated that the
cells that expressed Brn3b were non-M1 cells, whereas
those that did not express Brn3b were M1 cells. We
investigated this further by classifying the melanopsin
cells into M1 and non-M1 types based on three objective
criteria: level of melanopsin expression, soma size, and
dendritic stratification.
Brn3b expressed preferentially in cellswith lower levels of melanopsin
The M1 cells are more light-sensitive than the non-M1
cells, likely because they express much higher levels of
melanopsin (Schmidt and Kofuji, 2009; Ecker et al.,
2010). We measured the intensity of the melanopsin anti-
body staining as an indicator of the level of the protein
expression, and used these measurements to broadly dif-
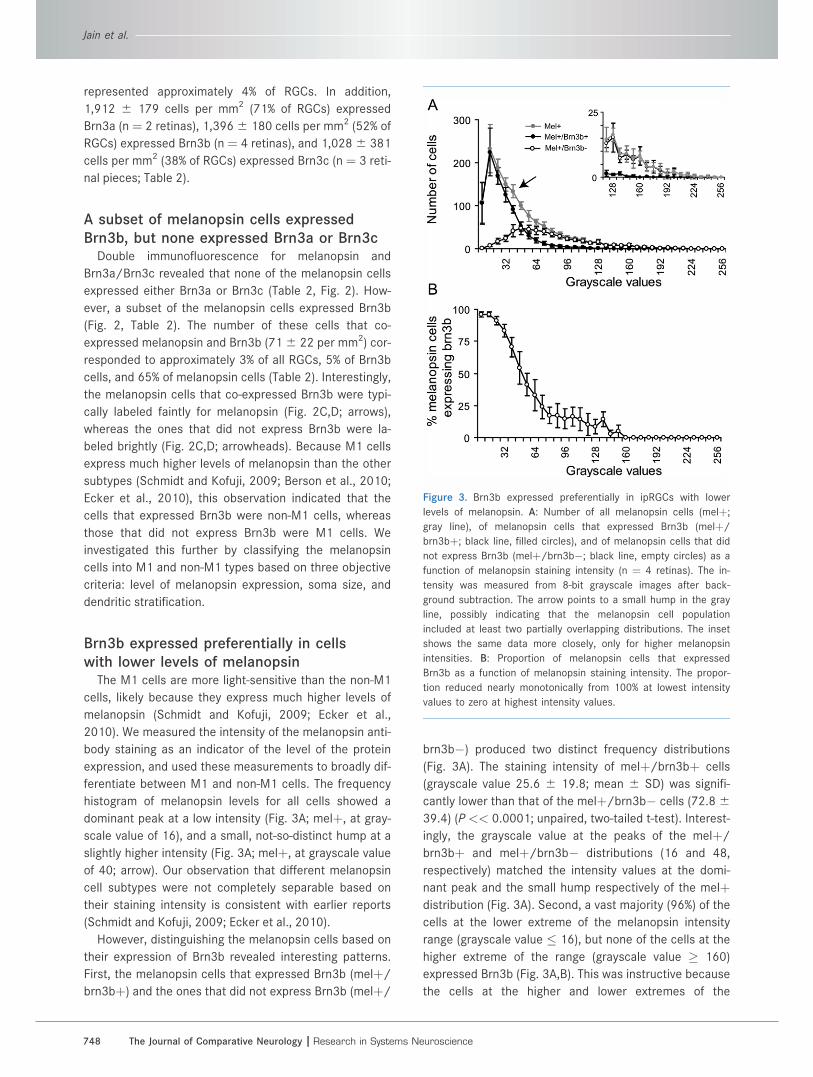
ferentiate between M1 and non-M1 cells. The frequency
histogram of melanopsin levels for all cells showed a
dominant peak at a low intensity (Fig. 3A; melþ, at gray-
scale value of 16), and a small, not-so-distinct hump at a
slightly higher intensity (Fig. 3A; melþ, at grayscale value
of 40; arrow). Our observation that different melanopsin
cell subtypes were not completely separable based on
their staining intensity is consistent with earlier reports
(Schmidt and Kofuji, 2009; Ecker et al., 2010).
However, distinguishing the melanopsin cells based on
their expression of Brn3b revealed interesting patterns.
First, the melanopsin cells that expressed Brn3b (melþ/
brn3bþ) and the ones that did not express Brn3b (melþ/
brn3b�) produced two distinct frequency distributions
(Fig. 3A). The staining intensity of melþ/brn3bþ cells
(grayscale value 25.6 6 19.8; mean 6 SD) was signifi-
cantly lower than that of the melþ/brn3b� cells (72.8 639.4) (P << 0.0001; unpaired, two-tailed t-test). Interest-
ingly, the grayscale value at the peaks of the melþ/
brn3bþ and melþ/brn3b� distributions (16 and 48,
respectively) matched the intensity values at the domi-
nant peak and the small hump respectively of the melþdistribution (Fig. 3A). Second, a vast majority (96%) of the
cells at the lower extreme of the melanopsin intensity
range (grayscale value � 16), but none of the cells at the
higher extreme of the range (grayscale value � 160)
expressed Brn3b (Fig. 3A,B). This was instructive because
the cells at the higher and lower extremes of the
Figure 3. Brn3b expressed preferentially in ipRGCs with lower
levels of melanopsin. A: Number of all melanopsin cells (melþ;
gray line), of melanopsin cells that expressed Brn3b (melþ/
brn3bþ; black line, filled circles), and of melanopsin cells that did
not express Brn3b (melþ/brn3b�; black line, empty circles) as a
function of melanopsin staining intensity (n ¼ 4 retinas). The in-
tensity was measured from 8-bit grayscale images after back-
ground subtraction. The arrow points to a small hump in the gray
line, possibly indicating that the melanopsin cell population
included at least two partially overlapping distributions. The inset
shows the same data more closely, only for higher melanopsin
intensities. B: Proportion of melanopsin cells that expressed
Brn3b as a function of melanopsin staining intensity. The propor-
tion reduced nearly monotonically from 100% at lowest intensity
values to zero at highest intensity values.
Jain et al.
748 The Journal of Comparative Neurology |Research in Systems Neuroscience
melanopsin level range must be M1 and non-M1 cells
respectively. Third, in the intermediate intensity range the
proportion of cells that expressed both Brn3b and mela-
nopsin decreased nearly monotonically with the intensity
of melanopsin staining (Fig. 3A,B). Together, these results
suggested that the melþ/brn3b� cells are M1 cells
whereas the melþ/brn3bþ cells are non-M1 cells, which
implied that the non-M1, but not the M1 type of melanop-
sin cells expressed Brn3b.
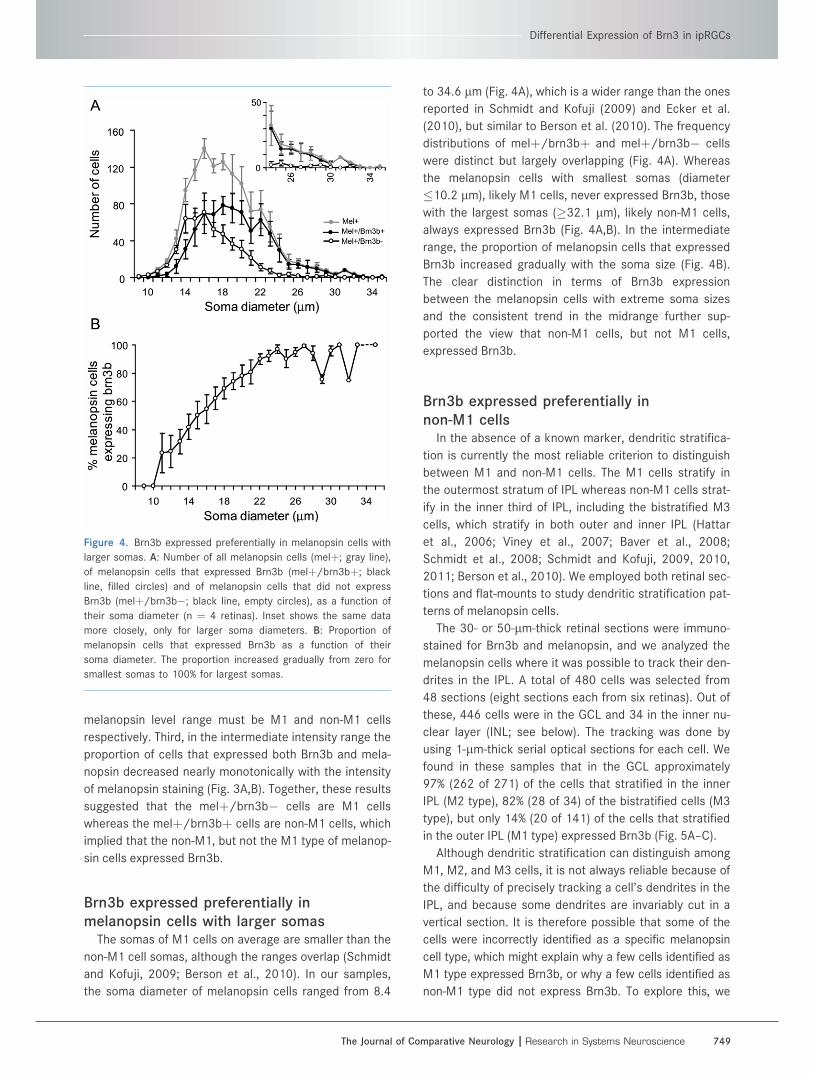
Brn3b expressed preferentially inmelanopsin cells with larger somas
The somas of M1 cells on average are smaller than the
non-M1 cell somas, although the ranges overlap (Schmidt
and Kofuji, 2009; Berson et al., 2010). In our samples,
the soma diameter of melanopsin cells ranged from 8.4
to 34.6 lm (Fig. 4A), which is a wider range than the ones
reported in Schmidt and Kofuji (2009) and Ecker et al.
(2010), but similar to Berson et al. (2010). The frequency
distributions of melþ/brn3bþ and melþ/brn3b� cells
were distinct but largely overlapping (Fig. 4A). Whereas
the melanopsin cells with smallest somas (diameter
�10.2 lm), likely M1 cells, never expressed Brn3b, those
with the largest somas (�32.1 lm), likely non-M1 cells,
always expressed Brn3b (Fig. 4A,B). In the intermediate
range, the proportion of melanopsin cells that expressed
Brn3b increased gradually with the soma size (Fig. 4B).
The clear distinction in terms of Brn3b expression
between the melanopsin cells with extreme soma sizes
and the consistent trend in the midrange further sup-
ported the view that non-M1 cells, but not M1 cells,
expressed Brn3b.
Brn3b expressed preferentially innon-M1 cells
In the absence of a known marker, dendritic stratifica-
tion is currently the most reliable criterion to distinguish
between M1 and non-M1 cells. The M1 cells stratify in
the outermost stratum of IPL whereas non-M1 cells strat-
ify in the inner third of IPL, including the bistratified M3
cells, which stratify in both outer and inner IPL (Hattar
et al., 2006; Viney et al., 2007; Baver et al., 2008;
Schmidt et al., 2008; Schmidt and Kofuji, 2009, 2010,
2011; Berson et al., 2010). We employed both retinal sec-
tions and flat-mounts to study dendritic stratification pat-
terns of melanopsin cells.
The 30- or 50-lm-thick retinal sections were immuno-
stained for Brn3b and melanopsin, and we analyzed the
melanopsin cells where it was possible to track their den-
drites in the IPL. A total of 480 cells was selected from
48 sections (eight sections each from six retinas). Out of
these, 446 cells were in the GCL and 34 in the inner nu-
clear layer (INL; see below). The tracking was done by
using 1-lm-thick serial optical sections for each cell. We
found in these samples that in the GCL approximately
97% (262 of 271) of the cells that stratified in the inner
IPL (M2 type), 82% (28 of 34) of the bistratified cells (M3
type), but only 14% (20 of 141) of the cells that stratified
in the outer IPL (M1 type) expressed Brn3b (Fig. 5A–C).
Although dendritic stratification can distinguish among
M1, M2, and M3 cells, it is not always reliable because of
the difficulty of precisely tracking a cell’s dendrites in the
IPL, and because some dendrites are invariably cut in a
vertical section. It is therefore possible that some of the
cells were incorrectly identified as a specific melanopsin
cell type, which might explain why a few cells identified as
M1 type expressed Brn3b, or why a few cells identified as
non-M1 type did not express Brn3b. To explore this, we
Figure 4. Brn3b expressed preferentially in melanopsin cells with
larger somas. A: Number of all melanopsin cells (melþ; gray line),
of melanopsin cells that expressed Brn3b (melþ/brn3bþ; black
line, filled circles) and of melanopsin cells that did not express
Brn3b (melþ/brn3b�; black line, empty circles), as a function of
their soma diameter (n ¼ 4 retinas). Inset shows the same data
more closely, only for larger soma diameters. B: Proportion of
melanopsin cells that expressed Brn3b as a function of their
soma diameter. The proportion increased gradually from zero for
smallest somas to 100% for largest somas.
Differential Expression of Brn3 in ipRGCs
The Journal of Comparative Neurology |Research in Systems Neuroscience 749
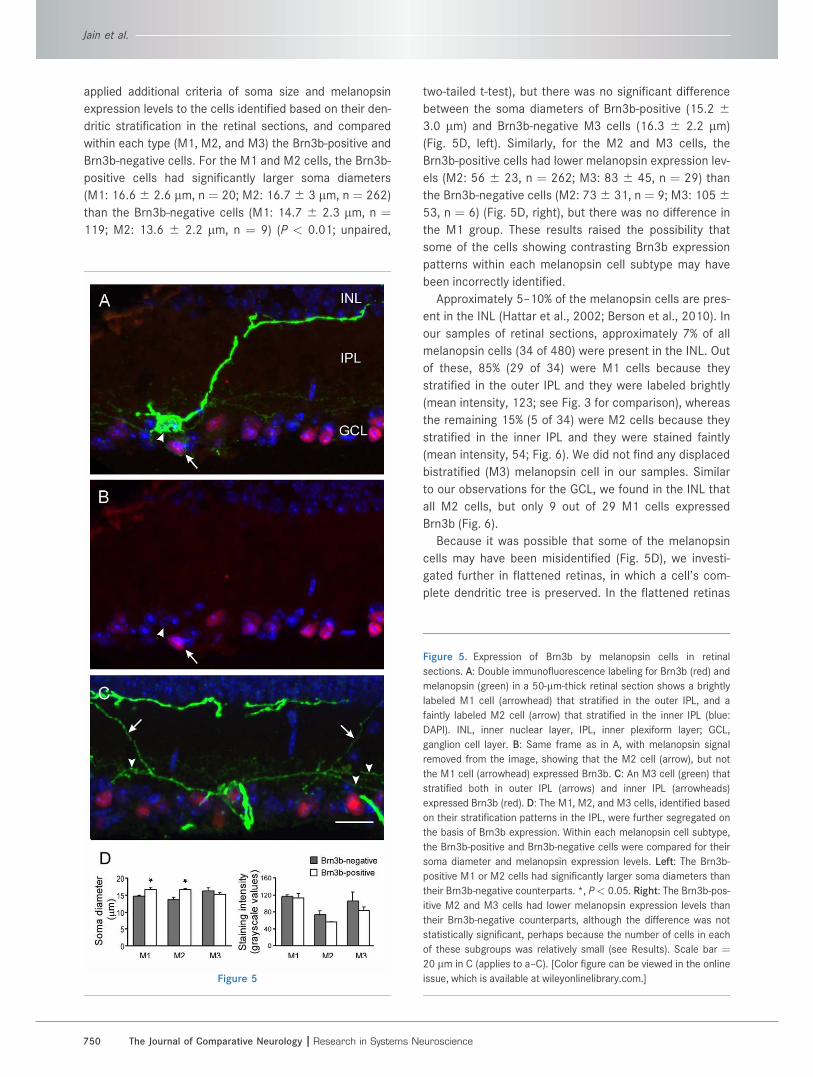
applied additional criteria of soma size and melanopsin
expression levels to the cells identified based on their den-
dritic stratification in the retinal sections, and compared
within each type (M1, M2, and M3) the Brn3b-positive and
Brn3b-negative cells. For the M1 and M2 cells, the Brn3b-
positive cells had significantly larger soma diameters
(M1: 16.66 2.6 lm, n ¼ 20; M2: 16.76 3 lm, n ¼ 262)
than the Brn3b-negative cells (M1: 14.7 6 2.3 lm, n ¼119; M2: 13.6 6 2.2 lm, n ¼ 9) (P < 0.01; unpaired,
two-tailed t-test), but there was no significant difference
between the soma diameters of Brn3b-positive (15.2 63.0 lm) and Brn3b-negative M3 cells (16.3 6 2.2 lm)
(Fig. 5D, left). Similarly, for the M2 and M3 cells, the
Brn3b-positive cells had lower melanopsin expression lev-
els (M2: 56 6 23, n ¼ 262; M3: 83 6 45, n ¼ 29) than
the Brn3b-negative cells (M2: 736 31, n ¼ 9; M3: 1056
53, n ¼ 6) (Fig. 5D, right), but there was no difference in
the M1 group. These results raised the possibility that
some of the cells showing contrasting Brn3b expression
patterns within each melanopsin cell subtype may have
been incorrectly identified.
Approximately 5–10% of the melanopsin cells are pres-
ent in the INL (Hattar et al., 2002; Berson et al., 2010). In
our samples of retinal sections, approximately 7% of all
melanopsin cells (34 of 480) were present in the INL. Out
of these, 85% (29 of 34) were M1 cells because they
stratified in the outer IPL and they were labeled brightly
(mean intensity, 123; see Fig. 3 for comparison), whereas
the remaining 15% (5 of 34) were M2 cells because they
stratified in the inner IPL and they were stained faintly
(mean intensity, 54; Fig. 6). We did not find any displaced
bistratified (M3) melanopsin cell in our samples. Similar
to our observations for the GCL, we found in the INL that
all M2 cells, but only 9 out of 29 M1 cells expressed
Brn3b (Fig. 6).
Because it was possible that some of the melanopsin
cells may have been misidentified (Fig. 5D), we investi-
gated further in flattened retinas, in which a cell’s com-
plete dendritic tree is preserved. In the flattened retinas
Figure 5
Figure 5. Expression of Brn3b by melanopsin cells in retinal
sections. A: Double immunofluorescence labeling for Brn3b (red) and
melanopsin (green) in a 50-lm-thick retinal section shows a brightly
labeled M1 cell (arrowhead) that stratified in the outer IPL, and a
faintly labeled M2 cell (arrow) that stratified in the inner IPL (blue:
DAPI). INL, inner nuclear layer, IPL, inner plexiform layer; GCL,
ganglion cell layer. B: Same frame as in A, with melanopsin signal
removed from the image, showing that the M2 cell (arrow), but not
the M1 cell (arrowhead) expressed Brn3b. C: An M3 cell (green) that
stratified both in outer IPL (arrows) and inner IPL (arrowheads)
expressed Brn3b (red). D: The M1, M2, and M3 cells, identified based
on their stratification patterns in the IPL, were further segregated on
the basis of Brn3b expression. Within each melanopsin cell subtype,
the Brn3b-positive and Brn3b-negative cells were compared for their
soma diameter and melanopsin expression levels. Left: The Brn3b-
positive M1 or M2 cells had significantly larger soma diameters than
their Brn3b-negative counterparts. *, P< 0.05. Right: The Brn3b-pos-
itive M2 and M3 cells had lower melanopsin expression levels than
their Brn3b-negative counterparts, although the difference was not
statistically significant, perhaps because the number of cells in each
of these subgroups was relatively small (see Results). Scale bar ¼20 lm in C (applies to a–C). [Color figure can be viewed in the online
issue, which is available at wileyonlinelibrary.com.]
Jain et al.
750 The Journal of Comparative Neurology |Research in Systems Neuroscience
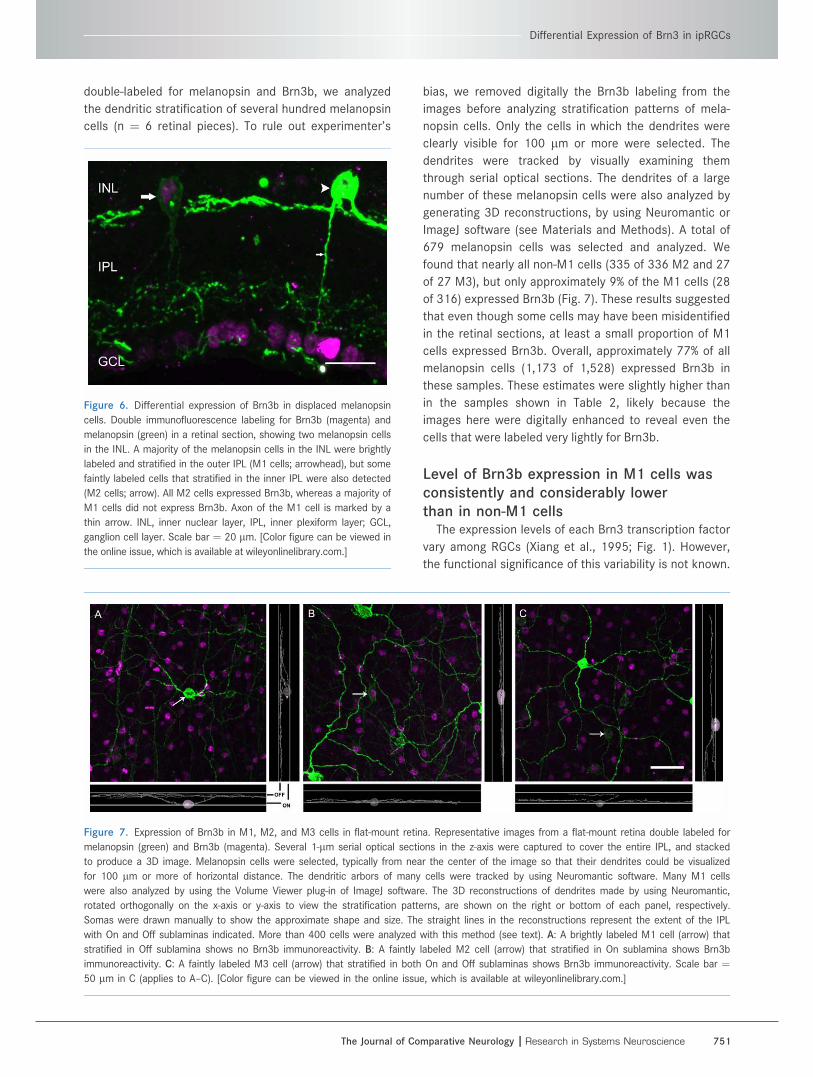
double-labeled for melanopsin and Brn3b, we analyzed
the dendritic stratification of several hundred melanopsin
cells (n ¼ 6 retinal pieces). To rule out experimenter’s
bias, we removed digitally the Brn3b labeling from the
images before analyzing stratification patterns of mela-
nopsin cells. Only the cells in which the dendrites were
clearly visible for 100 lm or more were selected. The
dendrites were tracked by visually examining them
through serial optical sections. The dendrites of a large
number of these melanopsin cells were also analyzed by
generating 3D reconstructions, by using Neuromantic or
ImageJ software (see Materials and Methods). A total of
679 melanopsin cells was selected and analyzed. We
found that nearly all non-M1 cells (335 of 336 M2 and 27
of 27 M3), but only approximately 9% of the M1 cells (28
of 316) expressed Brn3b (Fig. 7). These results suggested
that even though some cells may have been misidentified
in the retinal sections, at least a small proportion of M1
cells expressed Brn3b. Overall, approximately 77% of all
melanopsin cells (1,173 of 1,528) expressed Brn3b in
these samples. These estimates were slightly higher than
in the samples shown in Table 2, likely because the
images here were digitally enhanced to reveal even the
cells that were labeled very lightly for Brn3b.
Level of Brn3b expression in M1 cells wasconsistently and considerably lowerthan in non-M1 cells
The expression levels of each Brn3 transcription factor
vary among RGCs (Xiang et al., 1995; Fig. 1). However,
the functional significance of this variability is not known.
Figure 7. Expression of Brn3b in M1, M2, and M3 cells in flat-mount retina. Representative images from a flat-mount retina double labeled for
melanopsin (green) and Brn3b (magenta). Several 1-lm serial optical sections in the z-axis were captured to cover the entire IPL, and stacked
to produce a 3D image. Melanopsin cells were selected, typically from near the center of the image so that their dendrites could be visualized
for 100 lm or more of horizontal distance. The dendritic arbors of many cells were tracked by using Neuromantic software. Many M1 cells
were also analyzed by using the Volume Viewer plug-in of ImageJ software. The 3D reconstructions of dendrites made by using Neuromantic,
rotated orthogonally on the x-axis or y-axis to view the stratification patterns, are shown on the right or bottom of each panel, respectively.
Somas were drawn manually to show the approximate shape and size. The straight lines in the reconstructions represent the extent of the IPL
with On and Off sublaminas indicated. More than 400 cells were analyzed with this method (see text). A: A brightly labeled M1 cell (arrow) that
stratified in Off sublamina shows no Brn3b immunoreactivity. B: A faintly labeled M2 cell (arrow) that stratified in On sublamina shows Brn3b
immunoreactivity. C: A faintly labeled M3 cell (arrow) that stratified in both On and Off sublaminas shows Brn3b immunoreactivity. Scale bar ¼50 lm in C (applies to A–C). [Color figure can be viewed in the online issue, which is available at wileyonlinelibrary.com.]
Figure 6. Differential expression of Brn3b in displaced melanopsin
cells. Double immunofluorescence labeling for Brn3b (magenta) and
melanopsin (green) in a retinal section, showing two melanopsin cells
in the INL. A majority of the melanopsin cells in the INL were brightly
labeled and stratified in the outer IPL (M1 cells; arrowhead), but some
faintly labeled cells that stratified in the inner IPL were also detected
(M2 cells; arrow). All M2 cells expressed Brn3b, whereas a majority of
M1 cells did not express Brn3b. Axon of the M1 cell is marked by a
thin arrow. INL, inner nuclear layer, IPL, inner plexiform layer; GCL,
ganglion cell layer. Scale bar ¼ 20 lm. [Color figure can be viewed in
the online issue, which is available at wileyonlinelibrary.com.]
Differential Expression of Brn3 in ipRGCs
The Journal of Comparative Neurology |Research in Systems Neuroscience 751
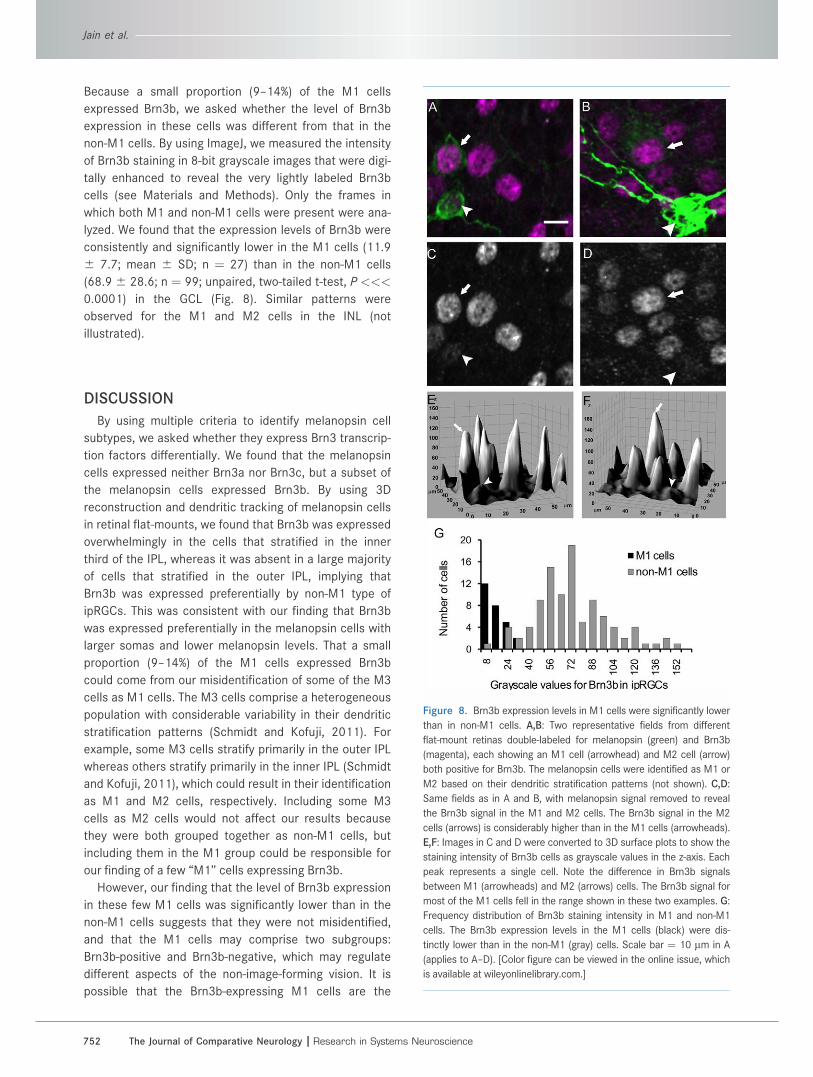
Because a small proportion (9–14%) of the M1 cells
expressed Brn3b, we asked whether the level of Brn3b
expression in these cells was different from that in the
non-M1 cells. By using ImageJ, we measured the intensity
of Brn3b staining in 8-bit grayscale images that were digi-
tally enhanced to reveal the very lightly labeled Brn3b
cells (see Materials and Methods). Only the frames in
which both M1 and non-M1 cells were present were ana-
lyzed. We found that the expression levels of Brn3b were
consistently and significantly lower in the M1 cells (11.9
6 7.7; mean 6 SD; n ¼ 27) than in the non-M1 cells
(68.9 6 28.6; n ¼ 99; unpaired, two-tailed t-test, P <<<
0.0001) in the GCL (Fig. 8). Similar patterns were
observed for the M1 and M2 cells in the INL (not
illustrated).
DISCUSSION
By using multiple criteria to identify melanopsin cell
subtypes, we asked whether they express Brn3 transcrip-
tion factors differentially. We found that the melanopsin
cells expressed neither Brn3a nor Brn3c, but a subset of
the melanopsin cells expressed Brn3b. By using 3D
reconstruction and dendritic tracking of melanopsin cells
in retinal flat-mounts, we found that Brn3b was expressed
overwhelmingly in the cells that stratified in the inner
third of the IPL, whereas it was absent in a large majority
of cells that stratified in the outer IPL, implying that
Brn3b was expressed preferentially by non-M1 type of
ipRGCs. This was consistent with our finding that Brn3b
was expressed preferentially in the melanopsin cells with
larger somas and lower melanopsin levels. That a small
proportion (9–14%) of the M1 cells expressed Brn3b
could come from our misidentification of some of the M3
cells as M1 cells. The M3 cells comprise a heterogeneous
population with considerable variability in their dendritic
stratification patterns (Schmidt and Kofuji, 2011). For
example, some M3 cells stratify primarily in the outer IPL
whereas others stratify primarily in the inner IPL (Schmidt
and Kofuji, 2011), which could result in their identification
as M1 and M2 cells, respectively. Including some M3
cells as M2 cells would not affect our results because
they were both grouped together as non-M1 cells, but
including them in the M1 group could be responsible for
our finding of a few ‘‘M1’’ cells expressing Brn3b.
However, our finding that the level of Brn3b expression
in these few M1 cells was significantly lower than in the
non-M1 cells suggests that they were not misidentified,
and that the M1 cells may comprise two subgroups:
Brn3b-positive and Brn3b-negative, which may regulate
different aspects of the non-image-forming vision. It is
possible that the Brn3b-expressing M1 cells are the
Figure 8. Brn3b expression levels in M1 cells were significantly lower
than in non-M1 cells. A,B: Two representative fields from different
flat-mount retinas double-labeled for melanopsin (green) and Brn3b
(magenta), each showing an M1 cell (arrowhead) and M2 cell (arrow)
both positive for Brn3b. The melanopsin cells were identified as M1 or
M2 based on their dendritic stratification patterns (not shown). C,D:
Same fields as in A and B, with melanopsin signal removed to reveal
the Brn3b signal in the M1 and M2 cells. The Brn3b signal in the M2
cells (arrows) is considerably higher than in the M1 cells (arrowheads).
E,F: Images in C and D were converted to 3D surface plots to show the
staining intensity of Brn3b cells as grayscale values in the z-axis. Each
peak represents a single cell. Note the difference in Brn3b signals
between M1 (arrowheads) and M2 (arrows) cells. The Brn3b signal for
most of the M1 cells fell in the range shown in these two examples. G:
Frequency distribution of Brn3b staining intensity in M1 and non-M1
cells. The Brn3b expression levels in the M1 cells (black) were dis-
tinctly lower than in the non-M1 (gray) cells. Scale bar ¼ 10 lm in A
(applies to A–D). [Color figure can be viewed in the online issue, which
is available at wileyonlinelibrary.com.]
Jain et al.
752 The Journal of Comparative Neurology |Research in Systems Neuroscience
atypical variants that have been reported to be physiolog-
ically similar to M2 cells (Schmidt and Kofuji, 2010).
After this article was submitted, and while it was in re-
vision, an article appeared showing that Brn3b-positive
and Brn3b-negative ipRGCs have distinct projection pat-
terns (Chen et al., 2011). These authors further showed
that selective ablation of Brn3b-positive ipRGCs severely
impaired pupillary reflex but not circadian photoentrain-
ment, implying that Brn3b-negative M1 cells are responsi-
ble for photoentrainment whereas pupillary reflex is pre-
dominantly regulated by Brn3b-positive ipRGCs.
However, it is not clear whether these Brn3b-positive
cells are M1 or non-M1, or both. We report here that all
non-M1 cells and some M1 cells express Brn3b, but the
level of Brn3b expression in the non-M1 cells is remark-
ably higher than in the M1 cells (Fig. 8G). It is possible
that these two types of Brn3b-positive ipRGCs mediate
different functions.
Currently there are no known molecular markers to dis-
tinguish between M1 and non-M1 types of ipRGCs. An
antibody against the C-terminal of melanopsin has been
claimed to label only M1 cells (Baver et al., 2008). How-
ever, we found in our samples that this antibody also
stained some non-M1 cells (not shown). Similarly, a trans-
genic mouse (Opn4tlacZ) has been claimed to have only
M1 cells labeled (Hattar et al., 2002, 2006). However,
because the labeled melanopsin cells in this mouse are
detected by the C-terminal antibody, it was possible that
even this mouse has some non-M1 cells labeled. In fact, a
recent report demonstrated the presence of M2 cells in
EGFP-Opn4þ/� mouse (Schmidt and Kofuji, 2010). Even
M3 cells may be labeled in the Opn4tlacZ mouse (Table 1
in Schmidt et al., 2011). Considering that the b-galactosi-dase reporter in the Opn4tlacZ mouse is linked to an axo-
nal protein, tau, it is possible that the low expression of
the reporter in the dendrites of non-M1 cells makes them
undetectable in the retina. Replacing b-galactosidasewith enhanced green fluorescent protein (EGFP), for
example, might have revealed the dendrites of even the
M2 cells (Schmidt and Kofuji, 2010). This would also
explain why Baver et al. (2008) found 56% of the mela-
nopsin cells labeled in the Opn4tlacZ mouse retina, which
is inconsistent with our observation and that of Berson
et al. (2010) that only 30–35% of the melanopsin cells are
of the M1 type. Our finding that Brn3b is expressed pref-
erentially in the non-M1 type of ipRGCs should allow one
to distinguish these cells from the M1 cells.
Estimates of Brn3-expressing andmelanopsin-expressing cells
The cell density in the GCL of C57BL/6J mouse in this
study (6,097 cells per mm2) was lower than previously
reported (Jeon et al., 1998; Pang and Wu, 2011). The
sampling area in the previous reports was much smaller
than in the present work, in which we sampled nearly the
entire retina (mean area covered per retina > 10 mm2).
Sampling a larger area should minimize the sampling
bias, although the differences could also have come from
genetic and environmental factors, or tissue shrinkage
from fixation (Williams et al., 1996; Jeon et al., 1998).
However, this should not affect our proportional esti-
mates for Brn3 cells or melanopsin cells counted in the
same samples.
We found that approximately 4% of RGCs in the GCL
were immunoreactive for melanopsin, which is similar to
previous estimates (Berson et al., 2010; Ecker et al.,
2010). We also found that approximately 70% of the RGCs
in the GCL expressed Brn3a, 50% expressed Brn3b, and
40% expressed Brn3c (Table 2), implying that a significant
number of RGCs express more than one type of Brn3 tran-
scription factors, which is consistent with earlier reports
(Xiang et al., 1995; Badea and Nathans, 2011). However,
unlike in Xiang et al. (1995), who reported that Brn3a and
Brn3b are expressed in similar number of RGCs, we find
considerably higher numbers of Brn3a cells.
Role of Brn3- and melanopsin-expressingRGCs in vision
Genetic manipulations to delete or label RGCs that
express specific Brn3 transcription factors have demon-
strated that these cells include a variety of RGC classes
(Xiang et al., 1995; Lin et al., 2004; Badea and Nathans,
2011), presumably involved in a variety of visual func-
tions. One possibility is that Brn3 transcription factors are
expressed specifically in RGCs that mediate image-form-
ing vision. Quina et al. (2005), using the Brn3atLacZ trans-
gene, showed that Brn3a cells project to thalamic and
collicular targets, but not to the accessory visual areas. A
later report (Badea et al., 2009) that used the Brn3aAP/þ
transgene, confirmed that Brn3a fibers do not project to
the SCN or IGL, but suggested that they may have minor
projections to the olivary pretectal nucleus and accessory
optic nuclei, which are involved in accessory visual func-
tions (Trejo and Cicerone 1984; Simpson, 1984; Clarke
and Ikeda, 1985). Here, we show that not only the Brn3a
cells but also Brn3c cells did not express melanopsin,
supporting the view that these cells are involved exclu-
sively in the image-forming vision.
Approximately 95% of the Brn3b-expressing cells also
did not express melanopsin (Table 2). The remaining 5%
that did express melanopsin were predominantly the non-
M1 type of ipRGCs. Interestingly, both Brn3b cells and
non-M1 cells have been separately shown to project to
both image-forming as well as non-image-forming areas,
Differential Expression of Brn3 in ipRGCs
The Journal of Comparative Neurology |Research in Systems Neuroscience 753
and that they are involved in both types of visual func-
tions (Badea et al., 2009; Ecker et al., 2010). Together,
these findings provide evidence that a small proportion of
RGCs that express both Brn3b and melanopsin are
involved in both image- and non-image-forming visual
functions. We propose that image-forming and non-
image-forming channels are characterized respectively by
their expression of Brn3 transcription factors or melanop-
sin, and that the cells that express both Brn3b and mela-
nopsin provide a platform for cross-talk between the two
visual channels.
ACKNOWLEDGMENTS
We thank Revathy Guruswamy for her assistance in
some of the analysis. We also thank Noga Vardi and Rob-
ert G. Smith for their helpful comments on an earlier ver-
sion of the manuscript.
LITERATURE CITEDBadea TC, Nathans J. 2011. Morphologies of mouse retinal
ganglion cells expressing transcription factors Brn3a,Brn3b, and Brn3c: analysis of wild type and mutant cellsusing genetically-directed sparse labeling. Vision Res 51:269–279.
Badea TC, Cahill H, Ecker J, Hattar S, Nathans J. 2009. Dis-tinct roles of transcription factors Brn3a and Brn3b in con-trolling the development, morphology and function ofretinal ganglion cells. Neuron 61:852–864.
Baver SB, Pickard GE, Sollars PJ. 2008. Two types of mela-nopsin retinal ganglion cell differentially innervate thehypothalamic suprachiasmatic nucleus and the olivary pre-tectal nucleus. Eur J Neurosci 27:1763–1770.
Berson DM, Dunn FA, Takao M. 2002. Phototransduction byretinal ganglion cells that set the circadian clock. Science295:1070–1073.
Berson DM, Castrucci AM, Provencio I. 2010. Morphology andmosaics of melanopsin-expressing retinal ganglion celltypes in mice. J Comp Neurol 518:2405–2422.
Chen SK, Badea TC, Hattar S. 2011. Photoentrainment andpupillary light reflex are mediated by distinct populationsof ipRGCs. Nature 476:92–95.
Clarke RJ, Ikeda H. 1985. Luminance and darkness detectorsin the olivary and posterior pretectal nuclei and their rela-tionship to the pupillary light reflex in the rat. I. Studieswith steady luminance levels. Exp Brain Res 57:224–232.
Dumitrescu ON, Pucci FG, Wong KY, Berson DM. 2009. Ec-topic retinal ON bipolar cell synapses in the OFF innerplexiform layer: contacts with dopaminergic amacrine cellsand melanopsin ganglion cells. J Comp Neurol 517:226–244.
Ecker JL, Dumitrescu ON, Wong KY, Alam NM, Chen SK, LeG-ates T, Renna JM, Prusky GT, Berson DM, Hatter S. 2010.Melanopsin-expressing retinal ganglion-cell photoreceptors:cellular diversity and role in pattern vision. Neuron 67:49–60.
Elshatory Y, Deng M, Xie X, Gan L. 2007. Expression of theLIM-homeodomain protein Isl1 in the developing andmature mouse retina. J Comp Neurol 503:182–197.
Erkman L, McEvilly RJ, Luo L, Ryan AK, Hooshmand F, O’Con-nell SM, Keithley EM, Rapaport DH, Ryan AF, RosenfeldMG. 1996. Role of transcription factors Brn-3.1 and Brn-3.2 in auditory and visual system development. Nature381:603–606.
Erkman L, Yates PA, McLaughlin T, McEvilly RJ, Whisenhunt T,O’Connell SM, Krones AI, Kirby MA, Rapaport DH, Berming-ham JR, O’Leary DDM, Rosenfeld MG. 2000. A POU do-main transcription factor–dependent program regulatesaxon pathfinding in the vertebrate visual system. Neuron28:779–792.
Freed MA, Liang Z. 2010. Reliability and frequency responseof excitatory signals transmitted to different types of reti-nal ganglion cell. J Neurophysiol 103:1508–1517.
Gan L, Xiang M, Zhou L, Wagner DS, Klein WH, Nathans J.1996. POU domain factor brn-3b is required for the devel-opment of a large set of retinal ganglion cells. Proc NatlAcad Sci U S A 93:3920–3925.
Gan L, Wang S, Huang Z, Klein W. 1999. POU domain factorbrn-3b is essential for retinal ganglion cell differentiationand survival but not for initial cell fate specification. DevBiol 210:469–480.
Gonzalez-Menendez I, Contreras F, Cernuda-Cernuda R, Garcıa-Fernandez JM. 2009. Daily rhythm of melanopsin-expressingcells in the mouse retina. Front Cell Neurosci 3:1–7.
Gooley JJ, Lu J, Chou TC, Scammell TE, Saper CB. 2001. Mela-nopsin in cells of origin of the retinohypothalamic tract.Nat Neurosci 4:1165.
Hannibal J, Hindersson P, Knudsen SM, Georg B, FahrenkrugJ. 2002. The photopigment melanopsin is exclusively pres-ent in PACAP containing retinal ganglion cells of the retino-hypothalamic tract. J Neurosci 22:1–7.
Hatori M, Le H, Vollmers C, Keding SR, Tanaka N, Buch T,Waisman A, Schmedt C, Jegla T, Panda S. 2008. Inducibleablation of melanopsin-expressing retinal ganglion cellsreveals their central role in non-image forming visualresponses. PLoS One 3:1–10.
Hattar S, Liao HW, Takao M, Berson DM, Yau KW. 2002.Melanopsin-containing retinal ganglion cells: architec-ture, projections, and intrinsic photosensitivity. Science295:1065–1070.
Hattar S, Kumar M, Park A, Tong P, Tung J, Yau KW, BersonDM. 2006. Central projections of melanopsin-expressingretinal ganglion cells in the mouse. J Comp Neurol 497:326–349.
Jain V, Ravindran E, Dhingra NK. 2010. M2-type, but not M1-type of intrinsically-photosensitive retinal ganglion cellsexpress Brn3 transcription factors. XIII Annual VisionResearch Conference, Retinal Ganglion Cells: Development,Function and Disease. p 20.
Jeon CJ, Strettoi E, Masland RH. 1998. The major cell popula-tions of the mouse retina. J Neurosci 18:8936–8946.
Kawano J, Tanizawa Y, Shinoda K. 2008. Wolfram syndrome 1(Wfs1) gene expression in the normal mouse visual sys-tem. J Comp Neurol 510:1–23.
Lin B, Wang S, Masland R. 2004. Retinal ganglion cell type,size, and spacing can be specified independent of homo-typic dendritic contacts. Neuron 43:475–485.
Panda S, Sato TK, Castrucci AM, Rollag MD, DeGrip WJ, Hoge-nesch JB, Provencio I, Kay SA. 2002. Melanopsin (Opn4)requirement for normal light-induced circadian phase shift-ing. Science 298:2213–2216.
Pang JJ, Wu SM. 2011. Morphology and immunoreactivity of ret-rogradely double-labeled ganglion cells in the mouse retina.Invest Ophthalmol Vis Sci 52:4886–4896.
Pires SS, Hughes S, Turton M, Melyan Z, Peirson SN, Zheng L,Kosmaoglou M, Bellingham J, Cheetham ME, Lucas RJ, FosterRG, Hankins MW, Halford S. 2009. Differential expression oftwo distinct functional isoforms of melanopsin (Opn4) in themammalian retina. J Neurosci 29:12332–12342.
Poche AR, Furuta Y, Chaboissier MC, Schedl A, Behringer RR.2008. Sox9 is expressed in mouse multipotent retinal pro-genitor cells and functions in Muller glial cell development.J Comp Neurol 510:237–250.
Jain et al.
754 The Journal of Comparative Neurology |Research in Systems Neuroscience
Provencio I, Rodriguez IR, Jiang G, Hayes WP, Moreira EF,Rollag MD. 2000. A novel human opsin in the inner retina.J Neurosci 20:600–605.
Provencio I, Rollag MD, Castrucci AM. 2002. Photoreceptivenet in the mammalian retina. This mesh of cells mayexplain how some blind mice can still tell day from night.Nature 415:493.
Quina L, Pak W, Lanier J, Banwait P, Gratwick K, Liu Y, Velas-quez T, O’Leary D, Goulding M, Turner E. 2005. Brn3a-expressing retinal ganglion cells project specifically to tha-lamocortical and collicular visual pathways. J Neurosci 25:11595–11604.
Schmidt TM, Kofuji P. 2009. Functional and morphological dif-ferences among intrinsically photosensitive retinal ganglioncells. J Neurosci 29:476–482.
Schmidt TM, Kofuji P. 2010. Differential cone pathway influ-ence on intrinsically photosensitive retinal ganglion cellsubtypes. J Neurosci 30:16262–16271.
Schmidt TM, Kofuji P. 2011. Structure and function of bistrati-fied intrinsically-photosensitive retinal ganglion cells in themouse. J Comp Neurol 519:1492–1504.
Schmidt TM, Taniguchi K, Kofuji P. 2008. Intrinsic and extrin-sic light responses in melanopsin-expressing ganglion cellsduring mouse development. J Neurophysiol 100:371–384.
Schmidt TM, Chen SK, Hattar S. 2011. Intrinsically photosen-sitive retinal ganglion cells: many subtypes, diverse func-tions. Trends Neurosci doi: 10.1016/j.tins.2011.07.001.
Simpson JI. 1984. The accessory optic system. Annu Rev Neu-rosci 7:13–41.
Trejo LJ, Cicerone CM. 1984. Cells in the pretectal olivary nu-cleus are in the pathway for the direct light reflex of thepupil in the rat. Brain Res 300:49–62.
Viney TJ, Balint K, Hillier D, Siegert S, Boldogkoi Z, EnquistLW, Meister M, Cepko CL, Roska B. 2007. Local retinal cir-cuits of melanopsin containing ganglion cells identified bytranssynaptic viral tracing. Curr Biol 17:981–988.
Wagner KD, Wagner N, Vidal VPI, Wilhelm D, Schedl A, Englert C,Scholz H. 2002. The Wilms’ tumor gene Wt1 is required fornormal development of the retina. EMBO J 21:1398–1405.
Wang S, Gan L, Martin S, Klein W. 2000. Abnormal polariza-tion and axon outgrowth in retinal ganglion cells lackingthe POU-domain transcription factor brn-3b. Mol Cell Neu-rosci 16:141–156.
Wang S, Mu X, Bowers W, Kim D, Plas D, Crair M, Federoff H,Gan L, Klein W. 2002. Brn3b/brn3c double knockout micereveal an unsuspected role for brn3c in retinal ganglioncell axon outgrowth. Development 129:467–477.
Williams RW, Strom RC, Rice DS, Goldowitz D. 1996. Geneticand environmental control of variation in retinal ganglioncell number in mice. J Neurosci 16:7193–7205.
Xiang M, Zhou L, Peng Y, Eddy R, Shows T, Nathans J. 1993.Brn-3b: a POU domain gene expressed in a subset of reti-nal ganglion cells. Neuron 11:689–701.
Xiang M, Zhou L, Macke J, Yoshioka T, Hendry S, Eddy R,Shows T, Nathans J. 1995. The Brn-3 family of POU-do-main factors: primary structure, binding specificity, andexpression in subsets of retinal ganglion cells and somato-sensory neurons. J Neurosci 15:4762–4785.
Differential Expression of Brn3 in ipRGCs
The Journal of Comparative Neurology |Research in Systems Neuroscience 755