Embed Size (px)
Citation preview
Differential metabolic networks unravel the effects ofsilent plant phenotypesWolfram Weckwerth*, Marcelo Ehlers Loureiro†, Kathrin Wenzel*, and Oliver Fiehn*‡
*Department of Molecular Physiology, Max Planck Institute of Molecular Plant Physiology, 14424 Potsdam, Germany; and †Departamento de BiologiaVegetal, Universidade Federal de Vicosa, 35670001, Vicosa, Brazil
Edited by Maarten Koornneef, Wageningen University and Research Centre, Wageningen, The Netherlands, and approved March 5, 2004 (received forreview June 5, 2003)
Current efforts aim to functionally characterize each gene in modelplants. Frequently, however, no morphological or biochemicalphenotype can be ascribed for antisense or knock-out plant geno-types. This is especially the case when gene suppression or knock-out is targeted to isoenzymes or gene families. Consequently,pleiotropic effects and gene redundancy are responsible for phe-notype resistance. Here, techniques are presented to detect unex-pected pleiotropic changes in such instances despite very subtlechanges in overall metabolism. The method consists of the relativequantitation of >1,000 compounds by GC�time-of-flight MS, fol-lowed by classical statistics and multivariate clustering. Comple-mentary to these tools, metabolic networks are constructed frompair-wise analysis of linear metabolic correlations. The topology ofsuch networks reflects the underlying regulatory pathway struc-ture. A differential analysis of network connectivity was appliedfor a silent potato plant line suppressed in expression of sucrosesynthase isoform II. Metabolic alterations could be assigned tocarbohydrate and amino acid metabolism even if no difference inaverage metabolite levels was found.
metabolomics � metabonomics � data mining � regulatory networks �functional genomics
S ilent phenotypes are genetically modified organisms that do notshow obvious changes in morphology, yield, growth rates, or
related parameters when compared with parental lines under givenphysiological conditions (1). This phenomenon is especially aston-ishing when genes are altered that are known to play pivotal rolesin overall plant fitness (2). It is thought that such organisms mighthave found ways to circumvent the deleterious effects of themutated genes or that redundancy in gene families (3) couldprevent injurious outcomes. The most apparent form of generedundancy is the frequent coexpression of enzyme isoformsinvolved in various metabolic pathways (4–6). In most cases,enzyme isoforms cannot be distinguished on the basis of enzymeactivities. Here, techniques like metabolomics might aid functionalcharacterization (7), assuming that the primary alteration of en-zyme-encoding genes pleiotropically affects biochemical pathways.The working hypothesis is that a network of metabolic associationsrepresents a snapshot response of the underlying biochemicalnetwork at a given biological situation, which then can be used toobserve changes between different genotypes (8, 9). This view istheoretically supported by the concept of ‘‘metabolic control anal-ysis’’ (10) and the concept of maximal connectivity in a biochemicalnetwork (11). Specifically, the effects on metabolite pool concen-trations may be higher than the alteration in enzymatic flux controlor enzyme activities. Recently, silent yeast phenotypes were dis-criminated from WT strains by using multivariate statistics appliedto NMR (12) or MS (13) based metabolic fingerprints, with theobjective to cluster genotypes together that were defective in geneswith similar functions. However, resolution of the NMR and MSdata prohibited the actual determination of individual metabolitesto underpin the biochemical basis of the clustering results.
Here, we present an approach to the study of silent plantphenotypes. We propose to use unbiased metabolite detection
concomitant with differential topology analysis of metabolic cor-relation networks as complementary tools to classical univariateand multivariate statistical tests. As a test case for a silent plantphenotype, an antisense potato plant line was used that wasconstitutively reduced in gene expression encoding for the sucrosesynthase isoform II (SS2) under the control of the 35S promoter.The primary biochemical action of sucrose synthase is sucrosecleavage to UDP-glucose and fructose, which may also workbidirectionally in vivo in tubers (14). In general, several isoforms ofsucrose synthase are known to play pivotal roles in plant develop-ment, carbon partitioning, phloem unloading, and sink strength(15–19). However, it is difficult to allocate specific functions ofparticular isoforms. When two genes encoding sucrose synthase areexpressed in the same cell, the proteins form homo- or heterotet-ramers (20–22), suggesting that the isozymes are interchangeable inat least some cellular roles. This gene redundancy might lead tosilent phenotypes if specific isoforms have decreased activities usingthe antisense approach. Specifically, no change in total enzymeactivity can be anticipated. The objective of this study was now toinvestigate with metabolomic and statistical tools whether (i) thesilent SS2 antisense genotype can be discriminated from theparental line and whether (ii) biochemical effects on primarymetabolism can be found as an important classifier in discrimina-tion.
Experimental ProtocolThirty to 40 individual SS2 antisense plants were compared with theDesiree cv. background line. Northern blot RNA analysis wasperformed from 1 g fresh weight (FW) of leaf tissue by using a KpnIfragment of SuSy 2 clone as probe. Plants were grown in controlledgreenhouse conditions in a randomized plot. One-hundred-milligram FW tuber slices (5 mm i.d.) were harvested 3 mm belowthe peels, perpendicular to the main tuber axis. For leaves, 300 mgFW disks were sampled. Samples were extracted and fractionatedinto a polar and a lipophilic fraction as given in ref. 23. GC-time-of-flight (TOF) analysis was performed on an HP 5890 gas chro-matograph with standard liners containing glass wool in split mode(1:25) at 230°C injector temperature, with a liner exchange for every50 samples. The GC was operated at constant flow of 1 ml�minhelium on a 40-m, 0.25-mm i.d., 0.25-�m RTX-5 column with 10-mintegrated precolumn, a start temperature of 80°C, 2 min isother-mal, temperature ramping by 15°C�min to 330°C, 6 min isothermal.Data were acquired on a Pegasus II TOF mass spectrometer(LECO, St. Joseph, MI) and CHROMATOF software (Fig. 6, whichis published as supporting information on the PNAS web site) at 20s�1 from m�z 85–500, R � 1, 70 kV electron impact (EI), andautotuning with reference gas CF43. Samples were comparedagainst reference chromatograms that had a maximum of detect-able peaks at S�n � 20. For identification and alignment, peaks
This paper was submitted directly (Track II) to the PNAS office.
Abbreviations: SS2, sucrose synthase isoform II; GC-TOF, GC�time-of-flight; DFA, discrimi-nant function analysis; SPS, sucrose-6-phosphate synthase; GABA, �-aminobutyric acid.
‡To whom correspondence should be addressed. E-mail: [email protected].
© 2004 by The National Academy of Sciences of the USA
www.pnas.org�cgi�doi�10.1073�pnas.0303415101 PNAS � May 18, 2004 � vol. 101 � no. 20 � 7809–7814
PLA
NT
BIO
LOG
Y
were matched against a customized reference spectrum database,based on retention indices and mass spectral similarities. Relativequantification was performed on ion traces chosen by optimalselectivity from coeluting compounds. Tables on quantitative re-sults were exported in ASCII format. Artifact peaks such as columnbleeding, phtalates, and polysiloxanes were removed. All data werenormalized to plant mg FW and to internal references (ribitol andnonadecanoic acid methyl ester). For all statistical tests, data werelog-transformed, resulting in more Gaussian-type distributions(Fig. 7, which is published as supporting information on the PNASweb site). Significance levels for Pearson correlations r were com-puted depending on the number of metabolite pairs n found in thechromatograms by using t � r�(n � 2)0,5�(1 � r2)0,5 and controlledfor a potential impact of outliers by robust fit assessments inMATLAB 6.5.0 (Mathworks, Natick, MA). Univariate ANOVA forproduction of box-whisker plots and F-statistics probabilities werealso carried out in MATLAB. For multivariate statistics, empty cellswere replaced by genotype means. The statistical package SAS�STAT8.01 (SAS Institute, Cary, NC) was used to perform a normal kerneldiscriminant function analysis (DFA) method with equal band-width to estimate the group-specific probability density with R �0.4. Principle component analysis was performed by using PIROU-ETTE 2.0 (Infometrix, Woodinville, WA) with mean-centering andunit variance scaling. Graphical visualization using the Fruchter-mann-Reingold 2D layout algorithm was done by the PAJEK soft-ware package (http:��vlado.fmf.uni-lj.si�pub�networks�pajek).For calculation of metabolite connectivity and changes in metab-olite�metabolite ratios, lipophilic (secondary) metabolites weredisregarded because biological regulatory mechanisms and turn-over rates are known to be quite different compared with polar(primary) metabolites (24).
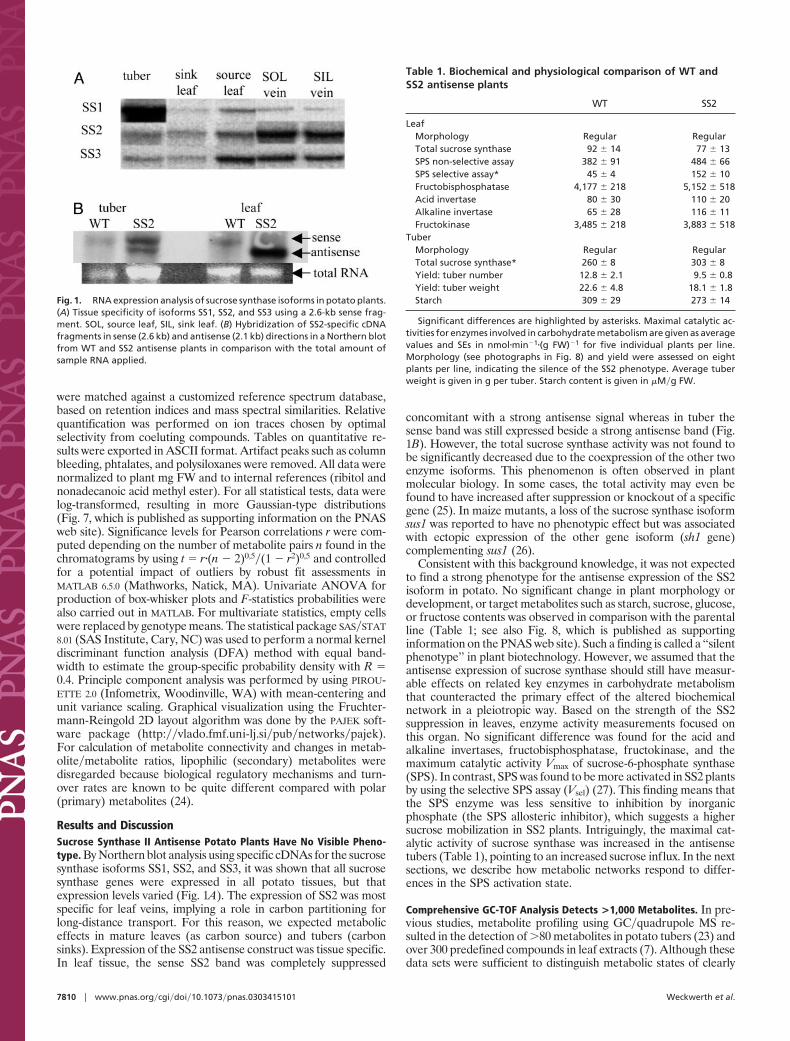
Results and DiscussionSucrose Synthase II Antisense Potato Plants Have No Visible Pheno-type. By Northern blot analysis using specific cDNAs for the sucrosesynthase isoforms SS1, SS2, and SS3, it was shown that all sucrosesynthase genes were expressed in all potato tissues, but thatexpression levels varied (Fig. 1A). The expression of SS2 was mostspecific for leaf veins, implying a role in carbon partitioning forlong-distance transport. For this reason, we expected metaboliceffects in mature leaves (as carbon source) and tubers (carbonsinks). Expression of the SS2 antisense construct was tissue specific.In leaf tissue, the sense SS2 band was completely suppressed
concomitant with a strong antisense signal whereas in tuber thesense band was still expressed beside a strong antisense band (Fig.1B). However, the total sucrose synthase activity was not found tobe significantly decreased due to the coexpression of the other twoenzyme isoforms. This phenomenon is often observed in plantmolecular biology. In some cases, the total activity may even befound to have increased after suppression or knockout of a specificgene (25). In maize mutants, a loss of the sucrose synthase isoformsus1 was reported to have no phenotypic effect but was associatedwith ectopic expression of the other gene isoform (sh1 gene)complementing sus1 (26).
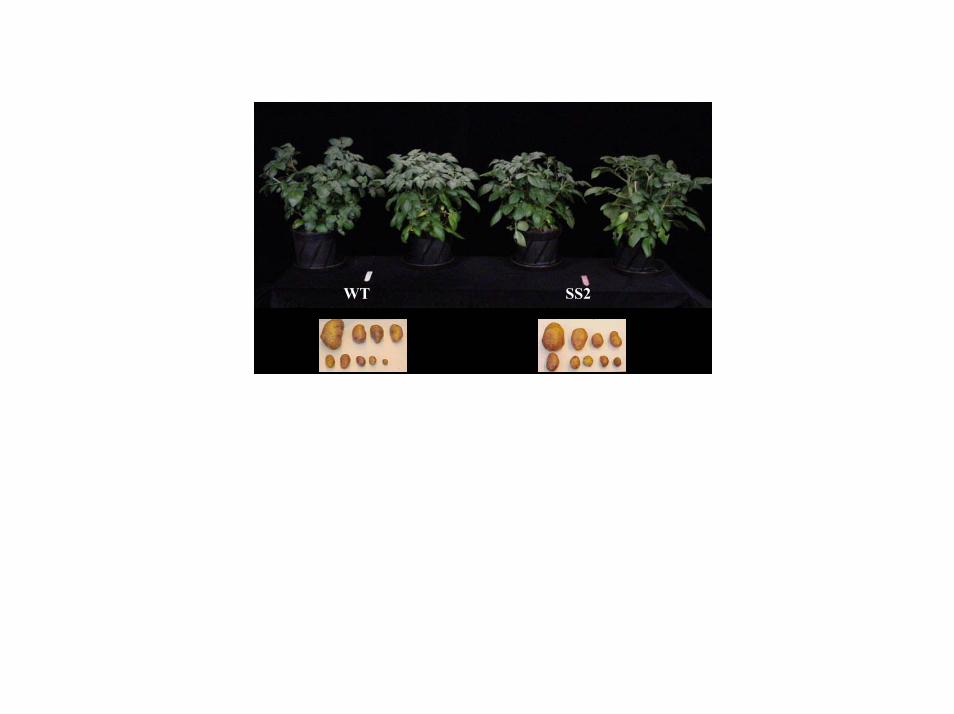
Consistent with this background knowledge, it was not expectedto find a strong phenotype for the antisense expression of the SS2isoform in potato. No significant change in plant morphology ordevelopment, or target metabolites such as starch, sucrose, glucose,or fructose contents was observed in comparison with the parentalline (Table 1; see also Fig. 8, which is published as supportinginformation on the PNAS web site). Such a finding is called a ‘‘silentphenotype’’ in plant biotechnology. However, we assumed that theantisense expression of sucrose synthase should still have measur-able effects on related key enzymes in carbohydrate metabolismthat counteracted the primary effect of the altered biochemicalnetwork in a pleiotropic way. Based on the strength of the SS2suppression in leaves, enzyme activity measurements focused onthis organ. No significant difference was found for the acid andalkaline invertases, fructobisphosphatase, fructokinase, and themaximum catalytic activity Vmax of sucrose-6-phosphate synthase(SPS). In contrast, SPS was found to be more activated in SS2 plantsby using the selective SPS assay (Vsel) (27). This finding means thatthe SPS enzyme was less sensitive to inhibition by inorganicphosphate (the SPS allosteric inhibitor), which suggests a highersucrose mobilization in SS2 plants. Intriguingly, the maximal cat-alytic activity of sucrose synthase was increased in the antisensetubers (Table 1), pointing to an increased sucrose influx. In the nextsections, we describe how metabolic networks respond to differ-ences in the SPS activation state.
Comprehensive GC-TOF Analysis Detects >1,000 Metabolites. In pre-vious studies, metabolite profiling using GC�quadrupole MS re-sulted in the detection of �80 metabolites in potato tubers (23) andover 300 predefined compounds in leaf extracts (7). Although thesedata sets were sufficient to distinguish metabolic states of clearly
Fig. 1. RNA expression analysis of sucrose synthase isoforms in potato plants.(A) Tissue specificity of isoforms SS1, SS2, and SS3 using a 2.6-kb sense frag-ment. SOL, source leaf, SIL, sink leaf. (B) Hybridization of SS2-specific cDNAfragments in sense (2.6 kb) and antisense (2.1 kb) directions in a Northern blotfrom WT and SS2 antisense plants in comparison with the total amount ofsample RNA applied.
Table 1. Biochemical and physiological comparison of WT andSS2 antisense plants
WT SS2
LeafMorphology Regular RegularTotal sucrose synthase 92 � 14 77 � 13SPS non-selective assay 382 � 91 484 � 66SPS selective assay* 45 � 4 152 � 10Fructobisphosphatase 4,177 � 218 5,152 � 518Acid invertase 80 � 30 110 � 20Alkaline invertase 65 � 28 116 � 11Fructokinase 3,485 � 218 3,883 � 518
TuberMorphology Regular RegularTotal sucrose synthase* 260 � 8 303 � 8Yield: tuber number 12.8 � 2.1 9.5 � 0.8Yield: tuber weight 22.6 � 4.8 18.1 � 1.8Starch 309 � 29 273 � 14
Significant differences are highlighted by asterisks. Maximal catalytic ac-tivities for enzymes involved in carbohydrate metabolism are given as averagevalues and SEs in nmol�min�1�(g FW)�1 for five individual plants per line.Morphology (see photographs in Fig. 8) and yield were assessed on eightplants per line, indicating the silence of the SS2 phenotype. Average tuberweight is given in g per tuber. Starch content is given in �M�g FW.
7810 � www.pnas.org�cgi�doi�10.1073�pnas.0303415101 Weckwerth et al.
different plant genotypes, they did not extract the full informationcontained in these chromatograms. To increase the efficiency ofinformation extraction, GC�TOF MS (28) was applied concomi-tant with automated mass spectral deconvolution, identification,and export of metabolite peaks. Compared with quadrupole MS,GC-TOF data acquisition has the great advantage that far morespectra can be acquired across a chromatographic peak. Addition-ally, relative ion intensities in mass spectra remain constant over thechromatographic elution profile. Both properties largely enhancethe suitability of (i) finding peaks in a completely unbiased manner,even for low abundant trace compounds, and (ii) deconvolutingcoeluting mass spectra in complex chromatograms, in which veryoften more than two side peaks overlap with any specific metab-olite. This MS deconvolution facilitates correct peak annotation byspectra purification.
When Solanum tuberosum plants were analyzed by GC-TOF andmass spectral deconvolution, over 1,200 peaks were found from thetwo fractions of a single leaf extract, and �600 peaks were detectedin a typical potato tuber. Considering method artifacts and doublepeaks known to be formed for some metabolites, �1,000 leafmetabolites and 500 tuber metabolites can be estimated to bedetectable by this method. The deconvolution power is demon-strated by detection of low abundant hexose isomers like psicose,tagatose, and allose (Fig. 2). Limits of mass spectral deconvolutionwere found for trace compounds that coeluted with 1,000-fold moreconcentrated peaks as given for the example of allose and fructose(Fig. 6), where allose reached a match factor of only 67% identityto the pure reference compound. On average, peaks with signal�noise ratio �100 resulted in 89% match factor for identification.Low abundant peaks with signal�noise ratio �25 had an averagematch factor of 66%.
Difference in Metabolite Mean Levels and Variances Were Too Smallfor Deriving Functional Information from Genotype Clustering. Tofind subtle differences in SS2 antisense plants in comparison withtheir parental background, �30 individual plants per line wereanalyzed, according to the central limit theorem (29). Averagelevels of 262 of 1,216 leaf metabolites were found to be different ata t test significance level of P � 0.05 (Table 2; see also Fig. 9, whichis published as supporting information on the PNAS web site),ranging from 1.1- to 4.6-fold differences between the silent trans-genic and its parental genotype. Intriguingly, no metabolite with
known chemical structure changed �2-fold in SS2�WT compari-sons. Only 15 metabolites had a Pleaf
� � 0.000041, when significancethresholds were lowered for reduced risks of false positive findingsto an overall probability of 95% by Bonferroni estimation. Amongthese compounds, the only metabolite that could be identified wasgalactonic acid. The other 14 were therefore primary candidates forde novo structural elucidation; 7 of these were classified as sugar-related compounds by their corresponding mass spectra. Only one
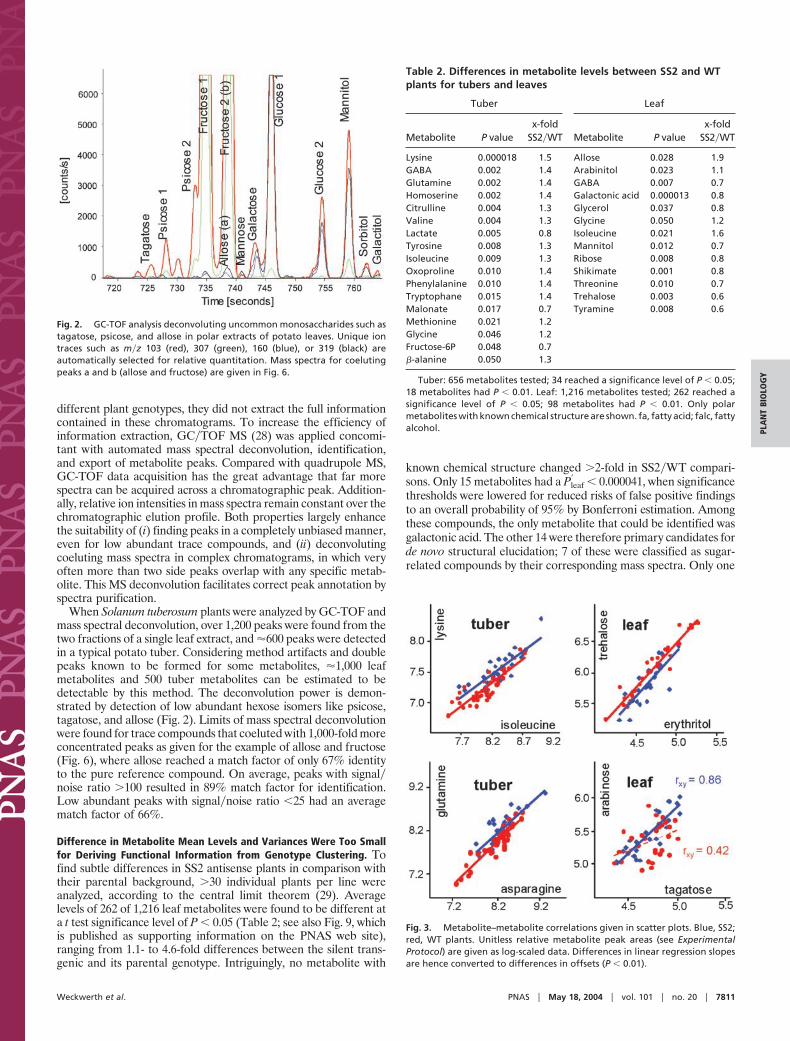
Fig. 3. Metabolite–metabolite correlations given in scatter plots. Blue, SS2;red, WT plants. Unitless relative metabolite peak areas (see ExperimentalProtocol) are given as log-scaled data. Differences in linear regression slopesare hence converted to differences in offsets (P � 0.01).
Fig. 2. GC-TOF analysis deconvoluting uncommon monosaccharides such astagatose, psicose, and allose in polar extracts of potato leaves. Unique iontraces such as m�z 103 (red), 307 (green), 160 (blue), or 319 (black) areautomatically selected for relative quantitation. Mass spectra for coelutingpeaks a and b (allose and fructose) are given in Fig. 6.
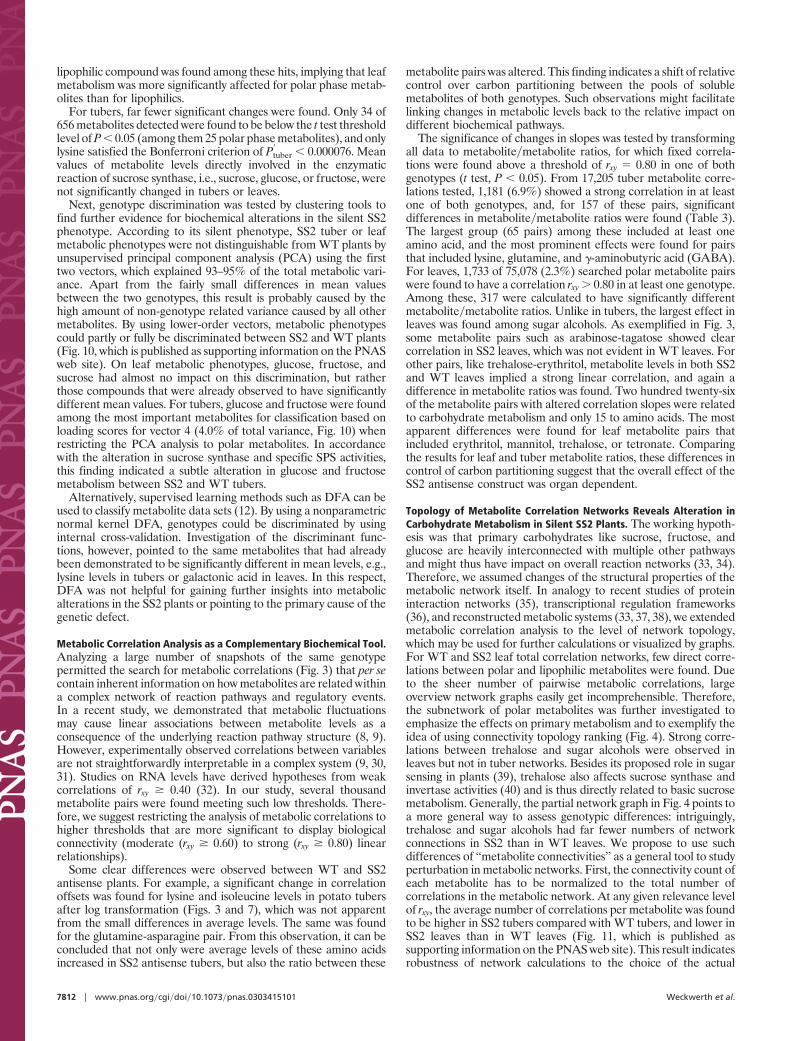
Table 2. Differences in metabolite levels between SS2 and WTplants for tubers and leaves
Tuber Leaf
Metabolite P valuex-fold
SS2�WT Metabolite P valuex-fold
SS2�WT
Lysine 0.000018 1.5 Allose 0.028 1.9GABA 0.002 1.4 Arabinitol 0.023 1.1Glutamine 0.002 1.4 GABA 0.007 0.7Homoserine 0.002 1.4 Galactonic acid 0.000013 0.8Citrulline 0.004 1.3 Glycerol 0.037 0.8Valine 0.004 1.3 Glycine 0.050 1.2Lactate 0.005 0.8 Isoleucine 0.021 1.6Tyrosine 0.008 1.3 Mannitol 0.012 0.7Isoleucine 0.009 1.3 Ribose 0.008 0.8Oxoproline 0.010 1.4 Shikimate 0.001 0.8Phenylalanine 0.010 1.4 Threonine 0.010 0.7Tryptophane 0.015 1.4 Trehalose 0.003 0.6Malonate 0.017 0.7 Tyramine 0.008 0.6Methionine 0.021 1.2Glycine 0.046 1.2Fructose-6P 0.048 0.7�-alanine 0.050 1.3
Tuber: 656 metabolites tested; 34 reached a significance level of P � 0.05;18 metabolites had P � 0.01. Leaf: 1,216 metabolites tested; 262 reached asignificance level of P � 0.05; 98 metabolites had P � 0.01. Only polarmetabolites with known chemical structure are shown. fa, fatty acid; falc, fattyalcohol.
Weckwerth et al. PNAS � May 18, 2004 � vol. 101 � no. 20 � 7811
PLA
NT
BIO
LOG
Y
lipophilic compound was found among these hits, implying that leafmetabolism was more significantly affected for polar phase metab-olites than for lipophilics.
For tubers, far fewer significant changes were found. Only 34 of656 metabolites detected were found to be below the t test thresholdlevel of P � 0.05 (among them 25 polar phase metabolites), and onlylysine satisfied the Bonferroni criterion of Ptuber
� � 0.000076. Meanvalues of metabolite levels directly involved in the enzymaticreaction of sucrose synthase, i.e., sucrose, glucose, or fructose, werenot significantly changed in tubers or leaves.
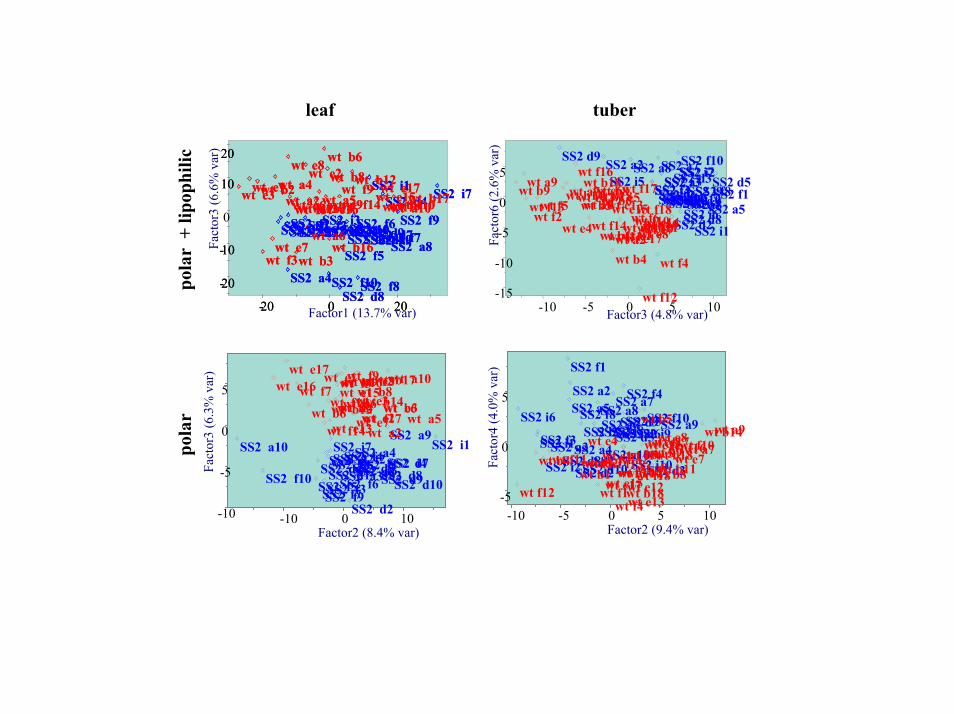
Next, genotype discrimination was tested by clustering tools tofind further evidence for biochemical alterations in the silent SS2phenotype. According to its silent phenotype, SS2 tuber or leafmetabolic phenotypes were not distinguishable from WT plants byunsupervised principal component analysis (PCA) using the firsttwo vectors, which explained 93–95% of the total metabolic vari-ance. Apart from the fairly small differences in mean valuesbetween the two genotypes, this result is probably caused by thehigh amount of non-genotype related variance caused by all othermetabolites. By using lower-order vectors, metabolic phenotypescould partly or fully be discriminated between SS2 and WT plants(Fig. 10, which is published as supporting information on the PNASweb site). On leaf metabolic phenotypes, glucose, fructose, andsucrose had almost no impact on this discrimination, but ratherthose compounds that were already observed to have significantlydifferent mean values. For tubers, glucose and fructose were foundamong the most important metabolites for classification based onloading scores for vector 4 (4.0% of total variance, Fig. 10) whenrestricting the PCA analysis to polar metabolites. In accordancewith the alteration in sucrose synthase and specific SPS activities,this finding indicated a subtle alteration in glucose and fructosemetabolism between SS2 and WT tubers.
Alternatively, supervised learning methods such as DFA can beused to classify metabolite data sets (12). By using a nonparametricnormal kernel DFA, genotypes could be discriminated by usinginternal cross-validation. Investigation of the discriminant func-tions, however, pointed to the same metabolites that had alreadybeen demonstrated to be significantly different in mean levels, e.g.,lysine levels in tubers or galactonic acid in leaves. In this respect,DFA was not helpful for gaining further insights into metabolicalterations in the SS2 plants or pointing to the primary cause of thegenetic defect.
Metabolic Correlation Analysis as a Complementary Biochemical Tool.Analyzing a large number of snapshots of the same genotypepermitted the search for metabolic correlations (Fig. 3) that per secontain inherent information on how metabolites are related withina complex network of reaction pathways and regulatory events.In a recent study, we demonstrated that metabolic fluctuationsmay cause linear associations between metabolite levels as aconsequence of the underlying reaction pathway structure (8, 9).However, experimentally observed correlations between variablesare not straightforwardly interpretable in a complex system (9, 30,31). Studies on RNA levels have derived hypotheses from weakcorrelations of rxy � 0.40 (32). In our study, several thousandmetabolite pairs were found meeting such low thresholds. There-fore, we suggest restricting the analysis of metabolic correlations tohigher thresholds that are more significant to display biologicalconnectivity (moderate (rxy � 0.60) to strong (rxy � 0.80) linearrelationships).
Some clear differences were observed between WT and SS2antisense plants. For example, a significant change in correlationoffsets was found for lysine and isoleucine levels in potato tubersafter log transformation (Figs. 3 and 7), which was not apparentfrom the small differences in average levels. The same was foundfor the glutamine-asparagine pair. From this observation, it can beconcluded that not only were average levels of these amino acidsincreased in SS2 antisense tubers, but also the ratio between these
metabolite pairs was altered. This finding indicates a shift of relativecontrol over carbon partitioning between the pools of solublemetabolites of both genotypes. Such observations might facilitatelinking changes in metabolic levels back to the relative impact ondifferent biochemical pathways.
The significance of changes in slopes was tested by transformingall data to metabolite�metabolite ratios, for which fixed correla-tions were found above a threshold of rxy � 0.80 in one of bothgenotypes (t test, P � 0.05). From 17,205 tuber metabolite corre-lations tested, 1,181 (6.9%) showed a strong correlation in at leastone of both genotypes, and, for 157 of these pairs, significantdifferences in metabolite�metabolite ratios were found (Table 3).The largest group (65 pairs) among these included at least oneamino acid, and the most prominent effects were found for pairsthat included lysine, glutamine, and �-aminobutyric acid (GABA).For leaves, 1,733 of 75,078 (2.3%) searched polar metabolite pairswere found to have a correlation rxy � 0.80 in at least one genotype.Among these, 317 were calculated to have significantly differentmetabolite�metabolite ratios. Unlike in tubers, the largest effect inleaves was found among sugar alcohols. As exemplified in Fig. 3,some metabolite pairs such as arabinose-tagatose showed clearcorrelation in SS2 leaves, which was not evident in WT leaves. Forother pairs, like trehalose-erythritol, metabolite levels in both SS2and WT leaves implied a strong linear correlation, and again adifference in metabolite ratios was found. Two hundred twenty-sixof the metabolite pairs with altered correlation slopes were relatedto carbohydrate metabolism and only 15 to amino acids. The mostapparent differences were found for leaf metabolite pairs thatincluded erythritol, mannitol, trehalose, or tetronate. Comparingthe results for leaf and tuber metabolite ratios, these differences incontrol of carbon partitioning suggest that the overall effect of theSS2 antisense construct was organ dependent.
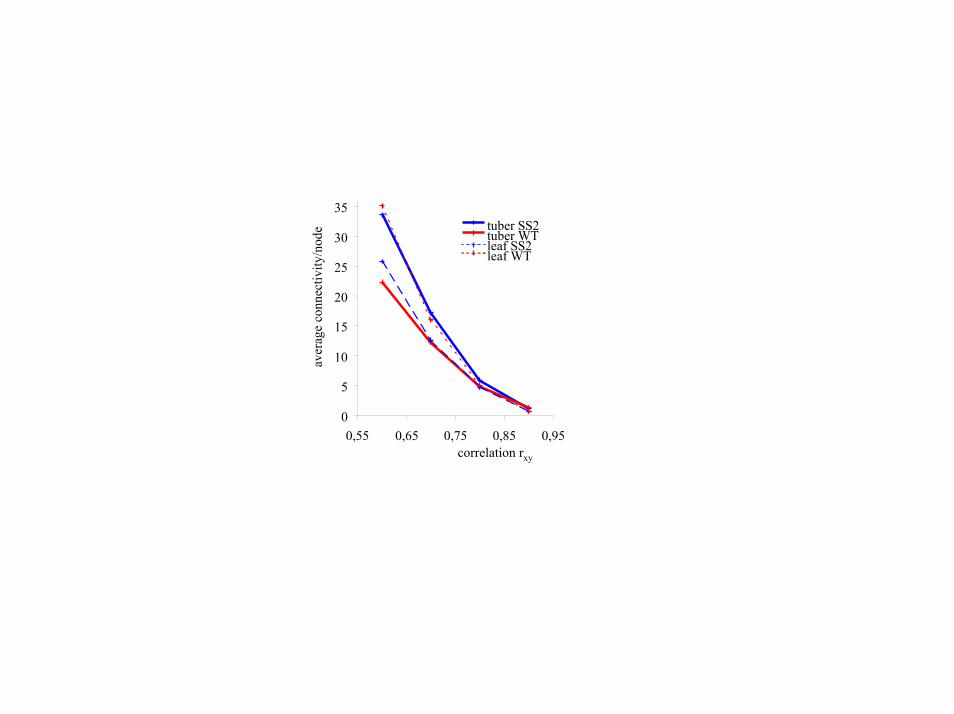
Topology of Metabolite Correlation Networks Reveals Alteration inCarbohydrate Metabolism in Silent SS2 Plants. The working hypoth-esis was that primary carbohydrates like sucrose, fructose, andglucose are heavily interconnected with multiple other pathwaysand might thus have impact on overall reaction networks (33, 34).Therefore, we assumed changes of the structural properties of themetabolic network itself. In analogy to recent studies of proteininteraction networks (35), transcriptional regulation frameworks(36), and reconstructed metabolic systems (33, 37, 38), we extendedmetabolic correlation analysis to the level of network topology,which may be used for further calculations or visualized by graphs.For WT and SS2 leaf total correlation networks, few direct corre-lations between polar and lipophilic metabolites were found. Dueto the sheer number of pairwise metabolic correlations, largeoverview network graphs easily get incomprehensible. Therefore,the subnetwork of polar metabolites was further investigated toemphasize the effects on primary metabolism and to exemplify theidea of using connectivity topology ranking (Fig. 4). Strong corre-lations between trehalose and sugar alcohols were observed inleaves but not in tuber networks. Besides its proposed role in sugarsensing in plants (39), trehalose also affects sucrose synthase andinvertase activities (40) and is thus directly related to basic sucrosemetabolism. Generally, the partial network graph in Fig. 4 points toa more general way to assess genotypic differences: intriguingly,trehalose and sugar alcohols had far fewer numbers of networkconnections in SS2 than in WT leaves. We propose to use suchdifferences of ‘‘metabolite connectivities’’ as a general tool to studyperturbation in metabolic networks. First, the connectivity count ofeach metabolite has to be normalized to the total number ofcorrelations in the metabolic network. At any given relevance levelof rxy, the average number of correlations per metabolite was foundto be higher in SS2 tubers compared with WT tubers, and lower inSS2 leaves than in WT leaves (Fig. 11, which is published assupporting information on the PNAS web site). This result indicatesrobustness of network calculations to the choice of the actual
7812 � www.pnas.org�cgi�doi�10.1073�pnas.0303415101 Weckwerth et al.
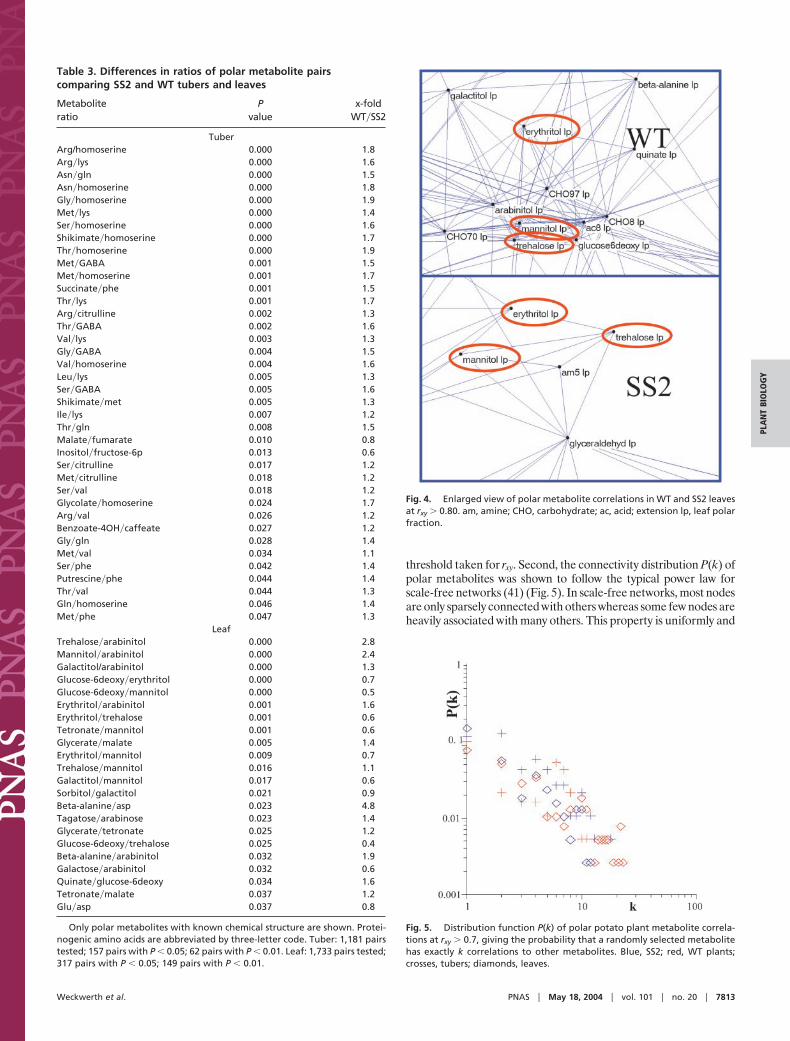
threshold taken for rxy. Second, the connectivity distribution P(k) ofpolar metabolites was shown to follow the typical power law forscale-free networks (41) (Fig. 5). In scale-free networks, most nodesare only sparsely connected with others whereas some few nodes areheavily associated with many others. This property is uniformly and
Table 3. Differences in ratios of polar metabolite pairscomparing SS2 and WT tubers and leaves
Metaboliteratio
Pvalue
x-foldWT�SS2
TuberArg/homoserine 0.000 1.8Arg�lys 0.000 1.6Asn�gln 0.000 1.5Asn�homoserine 0.000 1.8Gly�homoserine 0.000 1.9Met�lys 0.000 1.4Ser�homoserine 0.000 1.6Shikimate�homoserine 0.000 1.7Thr�homoserine 0.000 1.9Met�GABA 0.001 1.5Met�homoserine 0.001 1.7Succinate�phe 0.001 1.5Thr�lys 0.001 1.7Arg�citrulline 0.002 1.3Thr�GABA 0.002 1.6Val�lys 0.003 1.3Gly�GABA 0.004 1.5Val�homoserine 0.004 1.6Leu�lys 0.005 1.3Ser�GABA 0.005 1.6Shikimate�met 0.005 1.3Ile�lys 0.007 1.2Thr�gln 0.008 1.5Malate�fumarate 0.010 0.8Inositol�fructose-6p 0.013 0.6Ser�citrulline 0.017 1.2Met�citrulline 0.018 1.2Ser�val 0.018 1.2Glycolate�homoserine 0.024 1.7Arg�val 0.026 1.2Benzoate-4OH�caffeate 0.027 1.2Gly�gln 0.028 1.4Met�val 0.034 1.1Ser�phe 0.042 1.4Putrescine�phe 0.044 1.4Thr�val 0.044 1.3Gln�homoserine 0.046 1.4Met�phe 0.047 1.3
LeafTrehalose�arabinitol 0.000 2.8Mannitol�arabinitol 0.000 2.4Galactitol/arabinitol 0.000 1.3Glucose-6deoxy�erythritol 0.000 0.7Glucose-6deoxy�mannitol 0.000 0.5Erythritol�arabinitol 0.001 1.6Erythritol�trehalose 0.001 0.6Tetronate�mannitol 0.001 0.6Glycerate�malate 0.005 1.4Erythritol�mannitol 0.009 0.7Trehalose�mannitol 0.016 1.1Galactitol�mannitol 0.017 0.6Sorbitol�galactitol 0.021 0.9Beta-alanine�asp 0.023 4.8Tagatose�arabinose 0.023 1.4Glycerate�tetronate 0.025 1.2Glucose-6deoxy�trehalose 0.025 0.4Beta-alanine�arabinitol 0.032 1.9Galactose�arabinitol 0.032 0.6Quinate�glucose-6deoxy 0.034 1.6Tetronate�malate 0.037 1.2Glu�asp 0.037 0.8
Only polar metabolites with known chemical structure are shown. Protei-nogenic amino acids are abbreviated by three-letter code. Tuber: 1,181 pairstested; 157 pairs with P � 0.05; 62 pairs with P � 0.01. Leaf: 1,733 pairs tested;317 pairs with P � 0.05; 149 pairs with P � 0.01.
Fig. 4. Enlarged view of polar metabolite correlations in WT and SS2 leavesat rxy � 0.80. am, amine; CHO, carbohydrate; ac, acid; extension lp, leaf polarfraction.
Fig. 5. Distribution function P(k) of polar potato plant metabolite correla-tions at rxy � 0.7, giving the probability that a randomly selected metabolitehas exactly k correlations to other metabolites. Blue, SS2; red, WT plants;crosses, tubers; diamonds, leaves.
Weckwerth et al. PNAS � May 18, 2004 � vol. 101 � no. 20 � 7813
PLA
NT
BIO
LOG
Y
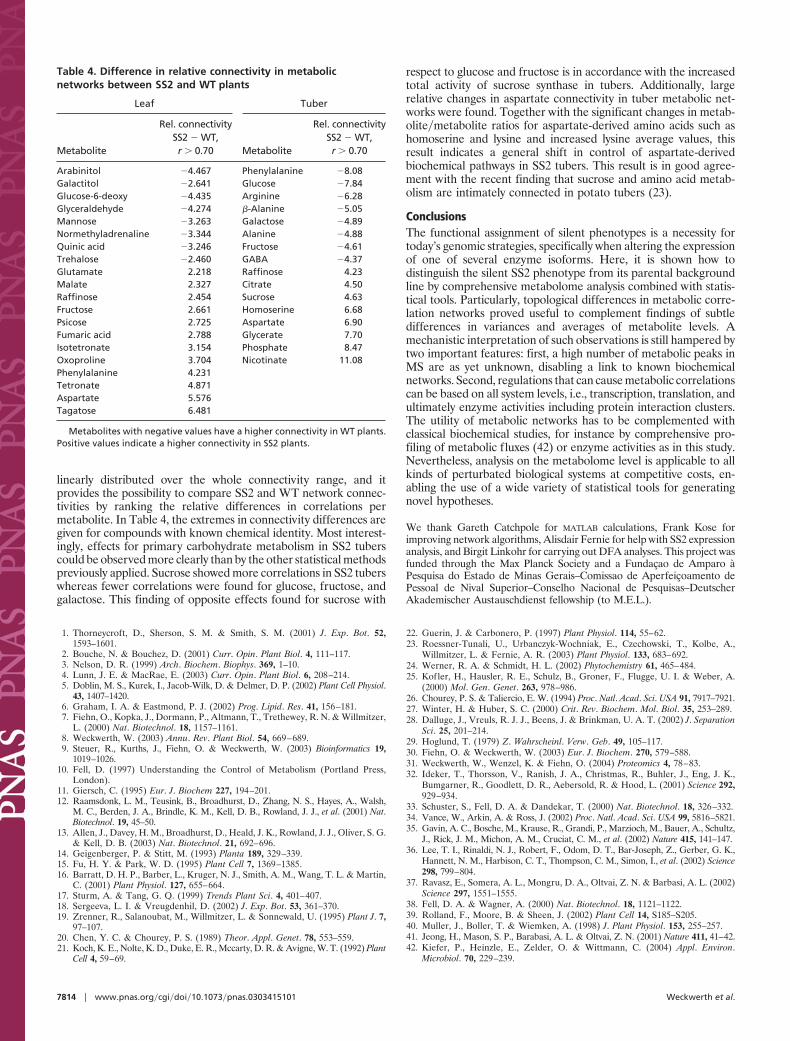
linearly distributed over the whole connectivity range, and itprovides the possibility to compare SS2 and WT network connec-tivities by ranking the relative differences in correlations permetabolite. In Table 4, the extremes in connectivity differences aregiven for compounds with known chemical identity. Most interest-ingly, effects for primary carbohydrate metabolism in SS2 tuberscould be observed more clearly than by the other statistical methodspreviously applied. Sucrose showed more correlations in SS2 tuberswhereas fewer correlations were found for glucose, fructose, andgalactose. This finding of opposite effects found for sucrose with
respect to glucose and fructose is in accordance with the increasedtotal activity of sucrose synthase in tubers. Additionally, largerelative changes in aspartate connectivity in tuber metabolic net-works were found. Together with the significant changes in metab-olite�metabolite ratios for aspartate-derived amino acids such ashomoserine and lysine and increased lysine average values, thisresult indicates a general shift in control of aspartate-derivedbiochemical pathways in SS2 tubers. This result is in good agree-ment with the recent finding that sucrose and amino acid metab-olism are intimately connected in potato tubers (23).
ConclusionsThe functional assignment of silent phenotypes is a necessity fortoday’s genomic strategies, specifically when altering the expressionof one of several enzyme isoforms. Here, it is shown how todistinguish the silent SS2 phenotype from its parental backgroundline by comprehensive metabolome analysis combined with statis-tical tools. Particularly, topological differences in metabolic corre-lation networks proved useful to complement findings of subtledifferences in variances and averages of metabolite levels. Amechanistic interpretation of such observations is still hampered bytwo important features: first, a high number of metabolic peaks inMS are as yet unknown, disabling a link to known biochemicalnetworks. Second, regulations that can cause metabolic correlationscan be based on all system levels, i.e., transcription, translation, andultimately enzyme activities including protein interaction clusters.The utility of metabolic networks has to be complemented withclassical biochemical studies, for instance by comprehensive pro-filing of metabolic fluxes (42) or enzyme activities as in this study.Nevertheless, analysis on the metabolome level is applicable to allkinds of perturbated biological systems at competitive costs, en-abling the use of a wide variety of statistical tools for generatingnovel hypotheses.
We thank Gareth Catchpole for MATLAB calculations, Frank Kose forimproving network algorithms, Alisdair Fernie for help with SS2 expressionanalysis, and Birgit Linkohr for carrying out DFA analyses. This project wasfunded through the Max Planck Society and a Fundacao de Amparo aPesquisa do Estado de Minas Gerais–Comissao de Aperfeicoamento dePessoal de Nival Superior–Conselho Nacional de Pesquisas–DeutscherAkademischer Austauschdienst fellowship (to M.E.L.).
1. Thorneycroft, D., Sherson, S. M. & Smith, S. M. (2001) J. Exp. Bot. 52,1593–1601.
2. Bouche, N. & Bouchez, D. (2001) Curr. Opin. Plant Biol. 4, 111–117.3. Nelson, D. R. (1999) Arch. Biochem. Biophys. 369, 1–10.4. Lunn, J. E. & MacRae, E. (2003) Curr. Opin. Plant Biol. 6, 208–214.5. Doblin, M. S., Kurek, I., Jacob-Wilk, D. & Delmer, D. P. (2002) Plant Cell Physiol.
43, 1407–1420.6. Graham, I. A. & Eastmond, P. J. (2002) Prog. Lipid. Res. 41, 156–181.7. Fiehn, O., Kopka, J., Dormann, P., Altmann, T., Trethewey, R. N. & Willmitzer,
L. (2000) Nat. Biotechnol. 18, 1157–1161.8. Weckwerth, W. (2003) Annu. Rev. Plant Biol. 54, 669–689.9. Steuer, R., Kurths, J., Fiehn, O. & Weckwerth, W. (2003) Bioinformatics 19,
1019–1026.10. Fell, D. (1997) Understanding the Control of Metabolism (Portland Press,
London).11. Giersch, C. (1995) Eur. J. Biochem 227, 194–201.12. Raamsdonk, L. M., Teusink, B., Broadhurst, D., Zhang, N. S., Hayes, A., Walsh,
M. C., Berden, J. A., Brindle, K. M., Kell, D. B., Rowland, J. J., et al. (2001) Nat.Biotechnol. 19, 45–50.
13. Allen, J., Davey, H. M., Broadhurst, D., Heald, J. K., Rowland, J. J., Oliver, S. G.& Kell, D. B. (2003) Nat. Biotechnol. 21, 692–696.
14. Geigenberger, P. & Stitt, M. (1993) Planta 189, 329–339.15. Fu, H. Y. & Park, W. D. (1995) Plant Cell 7, 1369–1385.16. Barratt, D. H. P., Barber, L., Kruger, N. J., Smith, A. M., Wang, T. L. & Martin,
C. (2001) Plant Physiol. 127, 655–664.17. Sturm, A. & Tang, G. Q. (1999) Trends Plant Sci. 4, 401–407.18. Sergeeva, L. I. & Vreugdenhil, D. (2002) J. Exp. Bot. 53, 361–370.19. Zrenner, R., Salanoubat, M., Willmitzer, L. & Sonnewald, U. (1995) Plant J. 7,
97–107.20. Chen, Y. C. & Chourey, P. S. (1989) Theor. Appl. Genet. 78, 553–559.21. Koch, K. E., Nolte, K. D., Duke, E. R., Mccarty, D. R. & Avigne, W. T. (1992) Plant
Cell 4, 59–69.
22. Guerin, J. & Carbonero, P. (1997) Plant Physiol. 114, 55–62.23. Roessner-Tunali, U., Urbanczyk-Wochniak, E., Czechowski, T., Kolbe, A.,
Willmitzer, L. & Fernie, A. R. (2003) Plant Physiol. 133, 683–692.24. Werner, R. A. & Schmidt, H. L. (2002) Phytochemistry 61, 465–484.25. Kofler, H., Hausler, R. E., Schulz, B., Groner, F., Flugge, U. I. & Weber, A.
(2000) Mol. Gen. Genet. 263, 978–986.26. Chourey, P. S. & Taliercio, E. W. (1994) Proc. Natl. Acad. Sci. USA 91, 7917–7921.27. Winter, H. & Huber, S. C. (2000) Crit. Rev. Biochem. Mol. Biol. 35, 253–289.28. Dalluge, J., Vreuls, R. J. J., Beens, J. & Brinkman, U. A. T. (2002) J. Separation
Sci. 25, 201–214.29. Hoglund, T. (1979) Z. Wahrscheinl. Verw. Geb. 49, 105–117.30. Fiehn, O. & Weckwerth, W. (2003) Eur. J. Biochem. 270, 579–588.31. Weckwerth, W., Wenzel, K. & Fiehn, O. (2004) Proteomics 4, 78–83.32. Ideker, T., Thorsson, V., Ranish, J. A., Christmas, R., Buhler, J., Eng, J. K.,
Bumgarner, R., Goodlett, D. R., Aebersold, R. & Hood, L. (2001) Science 292,929–934.
33. Schuster, S., Fell, D. A. & Dandekar, T. (2000) Nat. Biotechnol. 18, 326–332.34. Vance, W., Arkin, A. & Ross, J. (2002) Proc. Natl. Acad. Sci. USA 99, 5816–5821.35. Gavin, A. C., Bosche, M., Krause, R., Grandi, P., Marzioch, M., Bauer, A., Schultz,
J., Rick, J. M., Michon, A. M., Cruciat, C. M., et al. (2002) Nature 415, 141–147.36. Lee, T. I., Rinaldi, N. J., Robert, F., Odom, D. T., Bar-Joseph, Z., Gerber, G. K.,
Hannett, N. M., Harbison, C. T., Thompson, C. M., Simon, I., et al. (2002) Science298, 799–804.
37. Ravasz, E., Somera, A. L., Mongru, D. A., Oltvai, Z. N. & Barbasi, A. L. (2002)Science 297, 1551–1555.
38. Fell, D. A. & Wagner, A. (2000) Nat. Biotechnol. 18, 1121–1122.39. Rolland, F., Moore, B. & Sheen, J. (2002) Plant Cell 14, S185–S205.40. Muller, J., Boller, T. & Wiemken, A. (1998) J. Plant Physiol. 153, 255–257.41. Jeong, H., Mason, S. P., Barabasi, A. L. & Oltvai, Z. N. (2001) Nature 411, 41–42.42. Kiefer, P., Heinzle, E., Zelder, O. & Wittmann, C. (2004) Appl. Environ.
Microbiol. 70, 229–239.
Table 4. Difference in relative connectivity in metabolicnetworks between SS2 and WT plants
Leaf Tuber
Metabolite
Rel. connectivitySS2 � WT,r � 0.70 Metabolite
Rel. connectivitySS2 � WT,r � 0.70
Arabinitol �4.467 Phenylalanine �8.08Galactitol �2.641 Glucose �7.84Glucose-6-deoxy �4.435 Arginine �6.28Glyceraldehyde �4.274 �-Alanine �5.05Mannose �3.263 Galactose �4.89Normethyladrenaline �3.344 Alanine �4.88Quinic acid �3.246 Fructose �4.61Trehalose �2.460 GABA �4.37Glutamate 2.218 Raffinose 4.23Malate 2.327 Citrate 4.50Raffinose 2.454 Sucrose 4.63Fructose 2.661 Homoserine 6.68Psicose 2.725 Aspartate 6.90Fumaric acid 2.788 Glycerate 7.70Isotetronate 3.154 Phosphate 8.47Oxoproline 3.704 Nicotinate 11.08Phenylalanine 4.231Tetronate 4.871Aspartate 5.576Tagatose 6.481
Metabolites with negative values have a higher connectivity in WT plants.Positive values indicate a higher connectivity in SS2 plants.
7814 � www.pnas.org�cgi�doi�10.1073�pnas.0303415101 Weckwerth et al.
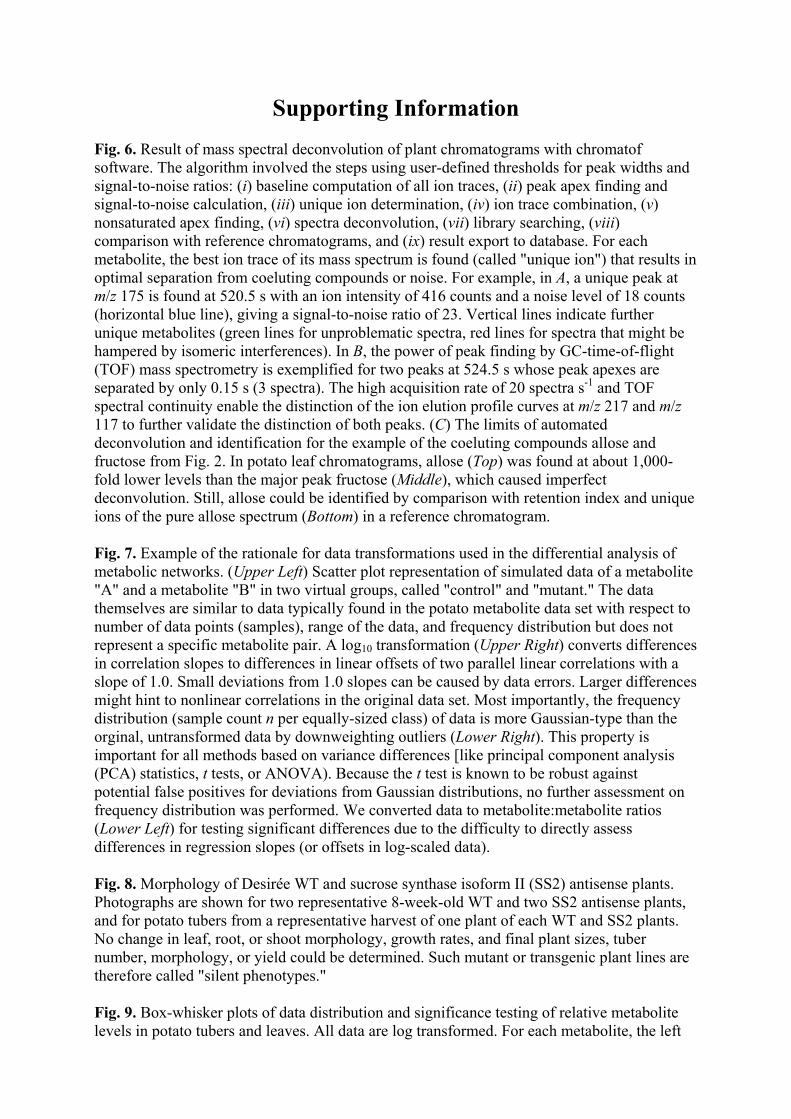
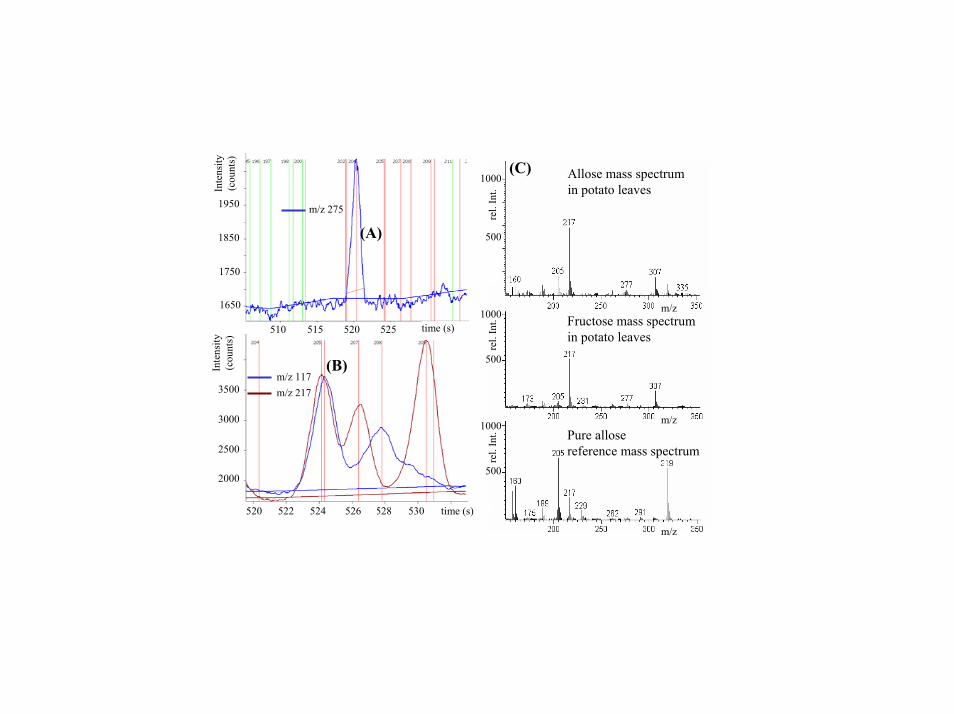
Supporting Information Fig. 6. Result of mass spectral deconvolution of plant chromatograms with chromatof software. The algorithm involved the steps using user-defined thresholds for peak widths and signal-to-noise ratios: (i) baseline computation of all ion traces, (ii) peak apex finding and signal-to-noise calculation, (iii) unique ion determination, (iv) ion trace combination, (v) nonsaturated apex finding, (vi) spectra deconvolution, (vii) library searching, (viii) comparison with reference chromatograms, and (ix) result export to database. For each metabolite, the best ion trace of its mass spectrum is found (called "unique ion") that results in optimal separation from coeluting compounds or noise. For example, in A, a unique peak at m/z 175 is found at 520.5 s with an ion intensity of 416 counts and a noise level of 18 counts (horizontal blue line), giving a signal-to-noise ratio of 23. Vertical lines indicate further unique metabolites (green lines for unproblematic spectra, red lines for spectra that might be hampered by isomeric interferences). In B, the power of peak finding by GC-time-of-flight (TOF) mass spectrometry is exemplified for two peaks at 524.5 s whose peak apexes are separated by only 0.15 s (3 spectra). The high acquisition rate of 20 spectra s-1 and TOF spectral continuity enable the distinction of the ion elution profile curves at m/z 217 and m/z 117 to further validate the distinction of both peaks. (C) The limits of automated deconvolution and identification for the example of the coeluting compounds allose and fructose from Fig. 2. In potato leaf chromatograms, allose (Top) was found at about 1,000-fold lower levels than the major peak fructose (Middle), which caused imperfect deconvolution. Still, allose could be identified by comparison with retention index and unique ions of the pure allose spectrum (Bottom) in a reference chromatogram.
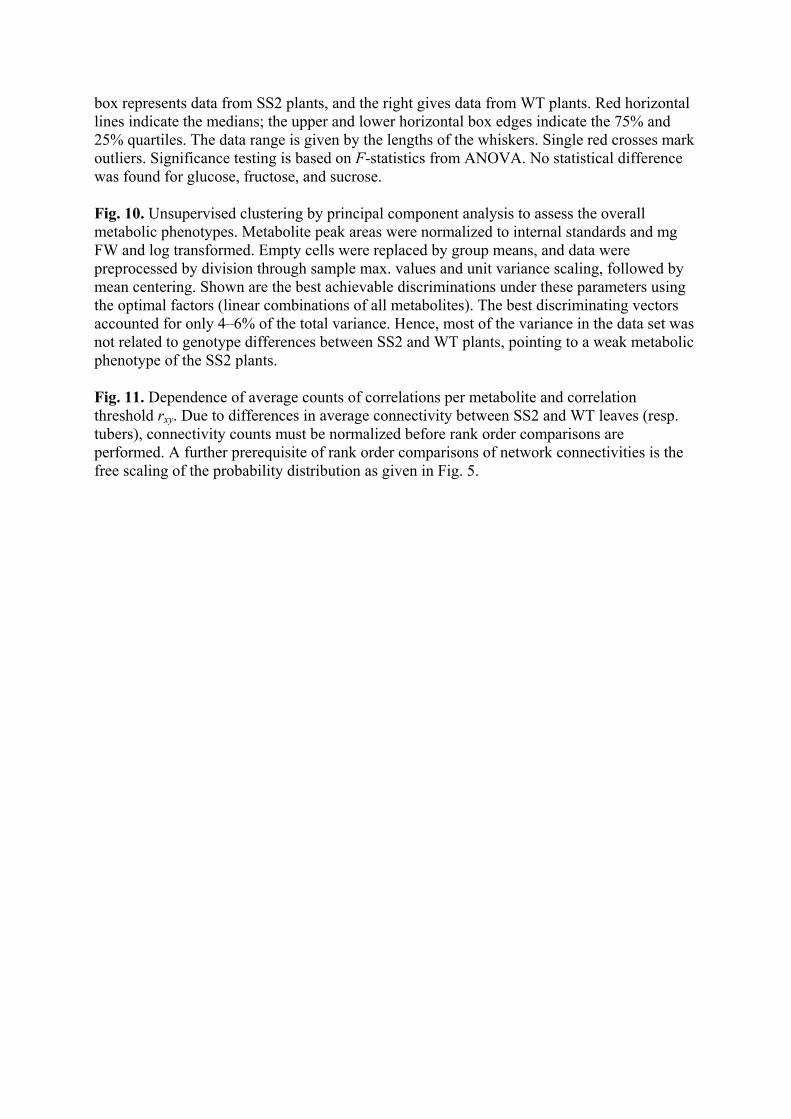
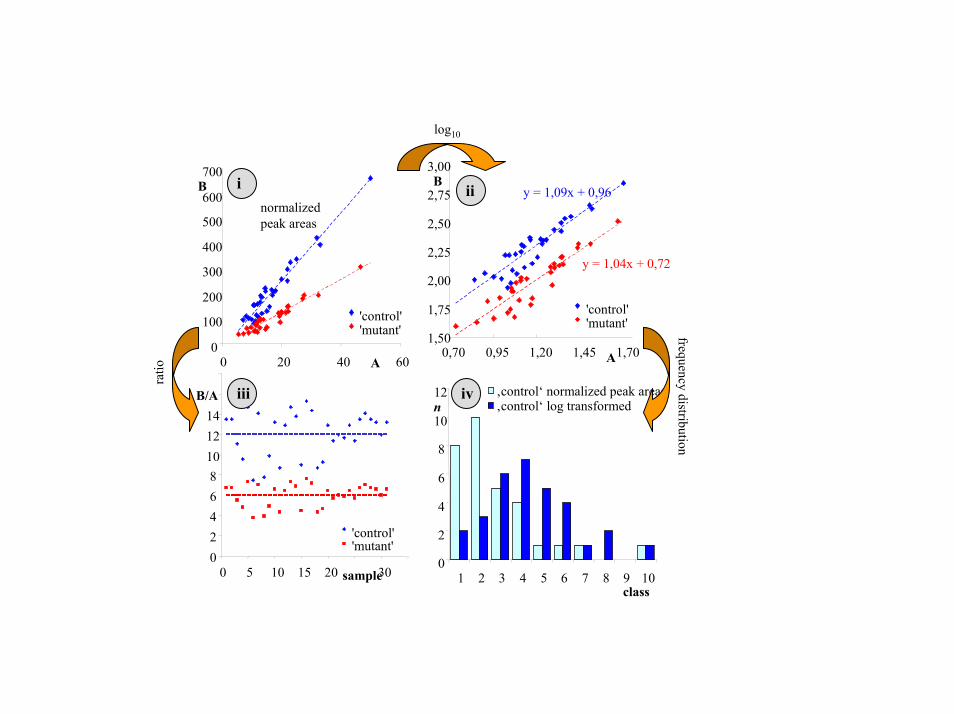
Fig. 7. Example of the rationale for data transformations used in the differential analysis of metabolic networks. (Upper Left) Scatter plot representation of simulated data of a metabolite "A" and a metabolite "B" in two virtual groups, called "control" and "mutant." The data themselves are similar to data typically found in the potato metabolite data set with respect to number of data points (samples), range of the data, and frequency distribution but does not represent a specific metabolite pair. A log10 transformation (Upper Right) converts differences in correlation slopes to differences in linear offsets of two parallel linear correlations with a slope of 1.0. Small deviations from 1.0 slopes can be caused by data errors. Larger differences might hint to nonlinear correlations in the original data set. Most importantly, the frequency distribution (sample count n per equally-sized class) of data is more Gaussian-type than the orginal, untransformed data by downweighting outliers (Lower Right). This property is important for all methods based on variance differences [like principal component analysis (PCA) statistics, t tests, or ANOVA). Because the t test is known to be robust against potential false positives for deviations from Gaussian distributions, no further assessment on frequency distribution was performed. We converted data to metabolite:metabolite ratios (Lower Left) for testing significant differences due to the difficulty to directly assess differences in regression slopes (or offsets in log-scaled data).
Fig. 8. Morphology of Desirée WT and sucrose synthase isoform II (SS2) antisense plants. Photographs are shown for two representative 8-week-old WT and two SS2 antisense plants, and for potato tubers from a representative harvest of one plant of each WT and SS2 plants. No change in leaf, root, or shoot morphology, growth rates, and final plant sizes, tuber number, morphology, or yield could be determined. Such mutant or transgenic plant lines are therefore called "silent phenotypes."
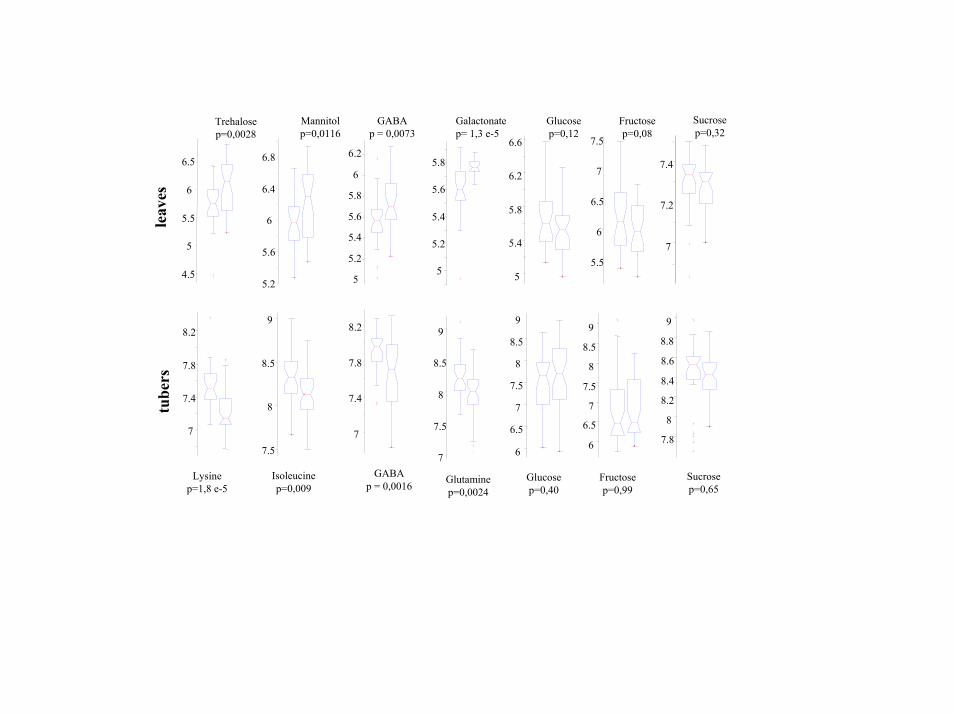
Fig. 9. Box-whisker plots of data distribution and significance testing of relative metabolite levels in potato tubers and leaves. All data are log transformed. For each metabolite, the left
box represents data from SS2 plants, and the right gives data from WT plants. Red horizontal lines indicate the medians; the upper and lower horizontal box edges indicate the 75% and 25% quartiles. The data range is given by the lengths of the whiskers. Single red crosses mark outliers. Significance testing is based on F-statistics from ANOVA. No statistical difference was found for glucose, fructose, and sucrose.
Fig. 10. Unsupervised clustering by principal component analysis to assess the overall metabolic phenotypes. Metabolite peak areas were normalized to internal standards and mg FW and log transformed. Empty cells were replaced by group means, and data were preprocessed by division through sample max. values and unit variance scaling, followed by mean centering. Shown are the best achievable discriminations under these parameters using the optimal factors (linear combinations of all metabolites). The best discriminating vectors accounted for only 4–6% of the total variance. Hence, most of the variance in the data set was not related to genotype differences between SS2 and WT plants, pointing to a weak metabolic phenotype of the SS2 plants.
Fig. 11. Dependence of average counts of correlations per metabolite and correlation threshold rxy. Due to differences in average connectivity between SS2 and WT leaves (resp. tubers), connectivity counts must be normalized before rank order comparisons are performed. A further prerequisite of rank order comparisons of network connectivities is the free scaling of the probability distribution as given in Fig. 5.
(B)
(A)
(C)
Fructose mass spectrumin potato leaves
Allose mass spectrumin potato leaves
Pure allosereference mass spectrum2500
3000
3500
Inte
nsity
(cou
nts)
1650
1750
1850
1950In
tens
ity(c
ount
s)
525520515510 time (s)
1000
500
1000
500
1000
500
rel.
Int.
rel.
Int.
rel.
Int.
m/z
m/z
m/z 275
m/z 117m/z 217
time (s)530528526524522520
2000
m/z
0
100
200
300
400
500
600
700
0 20 40 60
'control''mutant'
B
A
y = 1,04x + 0,72
y = 1,09x + 0,96
1,50
1,75
2,00
2,25
2,50
2,75
3,00
0,70 0,95 1,20 1,45 1,70
'control''mutant'
B
A
log10
normalizedpeak areas
02468
101214B/A
0 5 10 15 20 sample30
'control''mutant'
ratio
0
2
4
6
8
10
12
1 2 3 4 5 6 7 8 9 10
‚control‘ normalized peak areas‚control‘ log transformedn
class
frequencydistribution
i ii
iviii
WT SS2
7
7.4
7.8
8.2
Lysinep=1,8 e-5
Glutaminep=0,0024
7
7.5
8
8.5
9
Isoleucinep=0,009
7.5
8
8.5
9
GABAp = 0,0016
7
7.4
7.8
8.2
tubers
4.5
5
5.5
6
6.5
5.2
5.6
6
6.4
6.8
Trehalosep=0,0028
Mannitolp=0,0116
5
5.2
5.4
5.6
5.8
6
6.2
GABAp = 0,0073
5
5.2
5.4
5.6
5.8
Galactonatep= 1,3 e-5
leaves
Glucosep=0,12
Fructosep=0,08
Sucrosep=0,32
5
5.4
5.8
6.2
6.6
7
7.2
7.4
5.5
6
6.5
7
7.5
Glucosep=0,40
Fructosep=0,99
Sucrosep=0,65
6
6.5
7
7.5
8
8.5
9
6
6.5
7
7.5
8
8.5
9
7.8
8
8.2
8.4
8.6
8.8
9
-10 0 10-10
-5
0
5
Fact
or3
(6.3
% v
ar)
SS2 a10SS2 a2
SS2 a3
SS2 a4SS2 a6SS2 a8
SS2 a9
SS2 d1SS2 d10
SS2 d2
SS2 d4SS2 d5SS2 d7SS2 d8SS2 d9
SS2 f1SS2 f10
SS2 f2
SS2 f3
SS2 f4
SS2 f5SS2 f6SS2 f7
SS2 f8
SS2 f9
SS2 i1SS2 i3 SS2 i4SS2 i7
wt a10
wt a2
wt a4wt a5
wt a6wt a9
wt b12wt b14wt b16wt b17wt b2
wt b3wt b6wt b8
wt e1
wt e13
wt e15wt e16wt e17
wt e2wt e3wt e6wt e7
wt e8wt f10
wt f14wt f17
wt f3wt f7wt f8
wt f9
Factor2 (8.4% var)
-20 0 20
-20
-10
0
10
20
SS2 a10SS2 a2SS2 a3
SS2 a4
SS2 a6 SS2 a8SS2 a9SS2 d1
SS2 d10SS2 d2
SS2 d4
SS2 d5 SS2 d7
SS2 d8
SS2 d9SS2 f1
SS2 f10
SS2 f2SS2 f3SS2 f4
SS2 f5
SS2 f6SS2 f7
SS2 f8
SS2 f9
SS2 i1
SS2 i3SS2 i4
SS2 i7wt a10wt a2
wt a4wt a5
wt a6
wt a9
wt b12
wt b14
wt b16
wt b17wt b2
wt b3
wt b6wt b8
wt e1wt e13
wt e15wt e16
wt e17wt e2
wt e3wt e6
wt e7
wt e8
wt f10wt f14wt f17
wt f3
wt f7wt f8wt f9
-20 0 20Factor1 (13.7% var)
-20
-10
10
20
Fact
or3
(6.6
%va
r)SS2 a10SS2 a2SS2 a3
SS2 a4
SS2 a6 SS2 a8SS2 a9SS2 d1
SS2 d10SS2 d2
SS2 d4
SS2 d5 SS2 d7
SS2 d8
SS2 d9SS2 f1
SS2 f10
SS2 f2SS2 f3SS2 f4
SS2 f5
SS2 f6SS2 f7
SS2 f8
SS2 f9
SS2 i1
SS2 i3SS2 i4
SS2 i7wt a10wt a2
wt a4wt a5
wt a6
wt a9
wt b12
wt b14
wt b16
wt b17wt b2
wt b3
wt b6wt b8
wt e1wt e13
wt e15wt e16
wt e17wt e2
wt e3wt e6
wt e7
wt e8
wt f10wt f14wt f17
wt f3
wt f7wt f8wt f9
pola
r +
lipo
phili
c
leaf
pola
r
tuber
-10 -5 0 5 10-15
-10
-5
0
5
SS2 a10
SS2 a2SS2 a3
SS2 a4SS2 a5SS2 a6
SS2 a7SS2 a8
SS2 a9SS2 d10SS2 d2
SS2 d3SS2 d5SS2 d6
SS2 d8
SS2 d9
SS2 f1
SS2 f10
SS2 f2SS2 f3SS2 f4SS2 f5
SS2 f8
SS2 i1
SS2 i10
SS2 i2SS2 i3SS2 i5
SS2 i6
SS2 i7
SS2 i8SS2 i9
wt a2wt a6
wt a7wt a8
wt a9
wt b1 wt b11
wt b14wt b18
wt b18
wt b4
wt b5wt b6wt b8wt b9
wt e1wt e10wt e11
wt e12wt e13wt e14
wt e15
wt e17wt e4
wt e5wt e6
wt e7wt e8wt f1wt f10wt f11
wt f12
wt f13wt f14
wt f16wt f17
wt f18wt f2
wt f4
wt f5wt f6
Factor3 (4.8% var)
Fact
or6
(2.6
% v
ar)
-10 -5 0 5 10Factor2 (9.4% var)
-5
0
5
Fact
or4
(4.0
% v
ar)
SS2 a10
SS2 a2
SS2 a3SS2 a4
SS2 a5SS2 a6
SS2 a7SS2 a8
SS2 a9
SS2 d10SS2 d2 SS2 d3
SS2 d5SS2 d6
SS2 d8
SS2 d9
SS2 f1
SS2 f10SS2 f2SS2 f3
SS2 f4
SS2 f5SS2 f8
SS2 i1SS2 i10SS2 i2
SS2 i3SS2 i5SS2 i6
SS2 i7
SS2 i8SS2 i9
wt a2wt a6wt a7
wt a8
wt a9
wt b1 wt b11
wt b14
wt b18
wt b18
wt b4
wt b5
wt b6wt b8
wt b9wt e1wt e10
wt e11
wt e12wt e13
wt e14wt e15wt e17
wt e4wt e5wt e6
wt e7wt e8
wt f1
wt f10wt f11
wt f12
wt f13wt f14 wt f16wt f17
wt f18wt f2
wt f4
wt f5wt f6
0
5
10
15
20
25
30
35
0,55 0,65 0,75 0,85 0,95
tuber SS2tuber WTleaf SS2leaf WT
correlation rxy
aver
age
conn
ectiv
ity/n
ode