Embed Size (px)
Citation preview
The Regents of the University of Colorado, a body corporate, contracting on behalfof the University of Colorado at Boulder for the benefit of INSTAAR
Differential Regional Treeline Dynamics in the Scandes MountainsAuthor(s): Linda Dalen and Annika HofgaardSource: Arctic, Antarctic, and Alpine Research, Vol. 37, No. 3 (Aug., 2005), pp. 284-296Published by: INSTAAR, University of ColoradoStable URL: http://www.jstor.org/stable/4095889 .
Accessed: 16/06/2014 07:17
Your use of the JSTOR archive indicates your acceptance of the Terms & Conditions of Use, available at .http://www.jstor.org/page/info/about/policies/terms.jsp
.JSTOR is a not-for-profit service that helps scholars, researchers, and students discover, use, and build upon a wide range ofcontent in a trusted digital archive. We use information technology and tools to increase productivity and facilitate new formsof scholarship. For more information about JSTOR, please contact [email protected].
.
INSTAAR, University of Colorado and The Regents of the University of Colorado, a body corporate,contracting on behalf of the University of Colorado at Boulder for the benefit of INSTAAR are collaboratingwith JSTOR to digitize, preserve and extend access to Arctic, Antarctic, and Alpine Research.
http://www.jstor.org
This content downloaded from 195.78.108.107 on Mon, 16 Jun 2014 07:17:59 AMAll use subject to JSTOR Terms and Conditions
Arctic, Antarctic, and Alpine Research, Vol. 37, No. 3, 2005, pp. 284-296
Differential Regional Treeline Dynamics in the Scandes Mountains
Linda Dalen* and Annika Hofgaardt *Department of Biology, Norwegian University of Science and Technology, N-7491 Trondheim, Norway. [email protected] tNorwegian Institute for Nature Research, Tungasletta 2, N-7485 Trondheim, Norway. [email protected]
Abstract Age structure, tree characteristics, and environmental data were used to analyze the status of the birch treeline in three regions along the Scandes Mountains from 62o10'N to 69050'N. Aspect and estimated relative radiation explained most of the treeline altitude across studied regions, but not all variation. Main tree establishment occurred during the 1940s in the southern and northernmost regions, and during the 1960s in the middle
region. Age distribution patterns at 2 m (tree size), however, showed stable or possibly progressive treelines in the southern and middle regions but recent recession in the north. Growth rates varied through time and between regions, with an apparent decrease in the north since the 1940s. Weak negative correlations between altitude and age in the south indicate recent changes favoring tree growth or increased turnover at higher, more exposed altitudes. Although Scandinavian treelines are expected to advance in response to climate
warming, this was not evident as a general pattern for all regions. Seasonally different climate patterns, browsing, and abrasion are mechanisms involved in this. These regionally different patterns have to be taken into account in predictions of future responses to avoid overestimation of, e.g., ecosystem change, carbon uptake capacity, and feedbacks to climate systems.
Introduction The position of the forest-tundra boundary and its dynamics are
key issues within global change ecology. The boundary has, through its circumpolar distribution, significance in subarctic and alpine regions and importance at regional to global scale for its contribution to land- atmosphere interactions and biodiversity patterns (Callaghan et al., 2002; Douglas, 2002). The treeline is a key variable within this boundary, demarcating the change from tree-covered ground to treeless ground. This change has its strongest significance during winter due to the dramatic shift in albedo across the boundary (Harding et al., 2002) and influence on snow distribution (Hiemstra et al., 2002), with consequences for species and ecosystem distribution (Hofgaard and Wilmann, 2002; Williams et al., 2002). There is a strong general link between climate parameters and treeline position (cf. review by Korner, 1998). Consequently, treelines are assumed to be sensitive to changes in the climate and thus useful as indicators of climate change (Slatyer and Noble, 1992; Lavoie and Payette, 1994; Kullman, 1998; Grace et al., 2002). Evidence of advancing arctic and alpine treelines in response to recent climate warming is reported from several areas (e.g., Lescop-Sinclair and Payette, 1995; Luckman and Kavanagh, 2000; Kullman, 2001a); however, concomitantly contradicting or insignifi- cant treeline responses to climate warming have been reported (Kullman, 1993; Hittenschwiler and Korner, 1995; Paulsen et al., 2000; Lloyd and Fastie, 2002). Due to this inconsistency between or within regions, questions about the sensitivity to climate and the role of alternative mechanisms such as inertia, stabilizing factors, and feedback systems arises (Hofgaard, 1997a; Sveinbjirnsson et al., 2002). Factors like physical effects of wind and snow, and physiological effects through carbon limitation or nutrient limitation also have strong controlling effects (cf. Grace et al., 1989; Stevens and Fox, 1991; Sveinbj6rnsson et al., 1992; Karlsson and Nordell, 1996; Kirner, 1998), and variation in aspect, slope, microtopography, snow
cover, ground moisture, oceanicity, competition, disturbance, and land use also affect treeline position (Slatyer and Noble, 1992; Brown, 1994; Kjillgren and Kullman, 1998; Moir et al., 1999; Sveinbjmrnsson, 2000; Sveinbjmrnsson et al., 2002; Crawford et al., 2003). Although it is often assumed that treelines are in equilibrium with the current climate (e.g., Kullman, 1998), this might not be the case due to previous disturbances (e.g., insect outbreak, fire, avalanches, land use) and subsequent time for recovery which varies through time and space (cf. Sprugel, 1991; Hofgaard, 1997a). For example, individual established trees might persist through adverse climatic conditions and thus show strong resistance to climate change, forming relict positions related to past climate regimes (Kullman, 1993; Paulsen et al., 2000).
On a local scale, the variation in treeline altitude could be determined by either temperature or other environmental factors that might or might not be correlated with temperature or a combination. Consequently, it is not obvious how treelines will respond to future climatic change (cf. IPCC, 2001), as the strength in the influence of temperature vs. other controlling factors will vary depending on the
preceding history of individual treeline areas. Age structure analyses of treeline tree communities reveal recruitment status and survival at the treeline, and can so unravel responses to recent or former environ- mental changes depending on longevity of the species in focus (e.g., Lavoie and Payette, 1992; Kullman, 1993; Villalba and Veblen, 1997). Thus, the degree of stability or range adjustments at the treeline can be elucidated.
In Scandinavia, mountain birch (Betula pubescens Ehrh. ssp. czerepanovii [Orlova] Himet-Ahti) is the dominate treeline species. Previous investigations have shown both evidence of climatically raised treelines (Aas, 1969; Kullman, 2001a) and stable or retreating treelines in the last century (Kullman, 1993). However, there has been little focus on the spatial variation on a larger scale along the Scandinavian mountain chain. This is needed for conclusions of
284 / ARCTIC, ANTARCTIC, AND ALPINE RESEARCH ? 2005 Regents of the University of Colorado 1523-0430/05 $7.00
This content downloaded from 195.78.108.107 on Mon, 16 Jun 2014 07:17:59 AMAll use subject to JSTOR Terms and Conditions
150E
North-Atlantic Ocean
2
Arctc Circle -
Sweden
I- -
60N kNorway
** 5Wkm
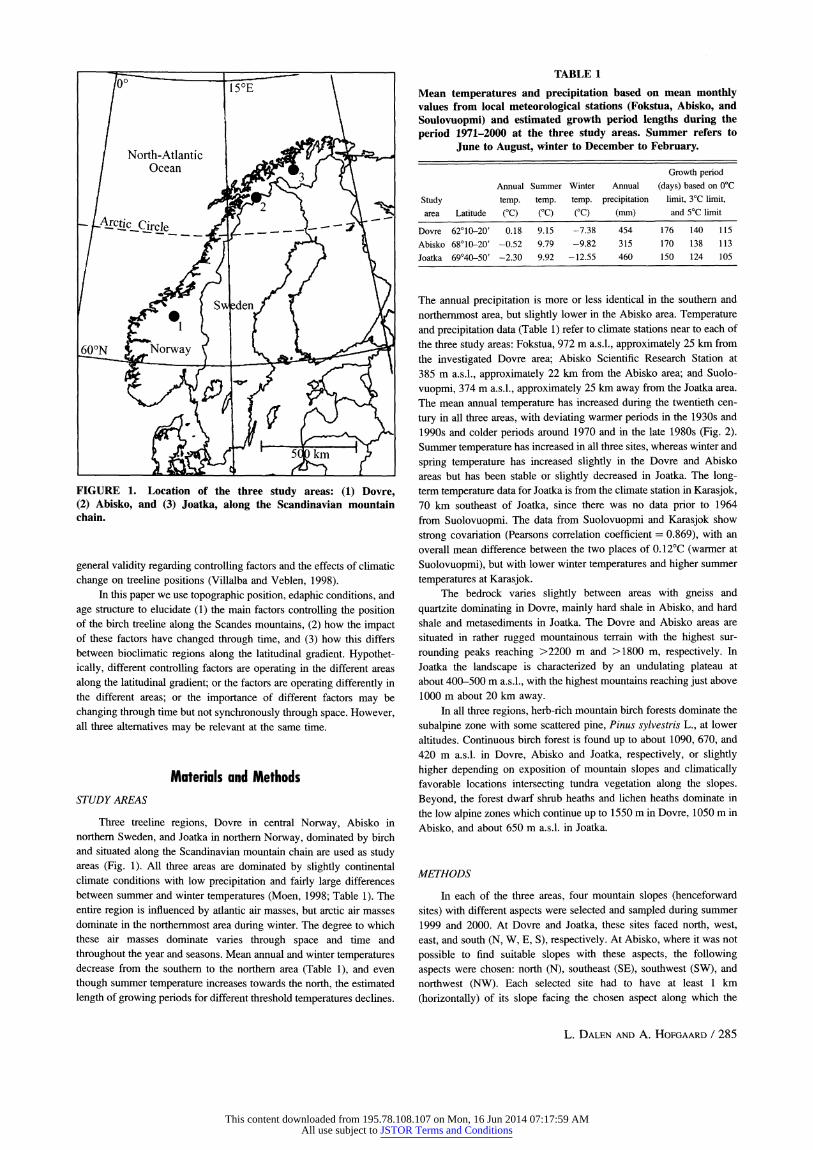
FIGURE 1. Location of the three study areas: (1) Dovre, (2) Abisko, and (3) Joatka, along the Scandinavian mountain chain.
general validity regarding controlling factors and the effects of climatic
change on treeline positions (Villalba and Veblen, 1998). In this paper we use topographic position, edaphic conditions, and
age structure to elucidate (1) the main factors controlling the position of the birch treeline along the Scandes mountains, (2) how the impact of these factors have changed through time, and (3) how this differs between bioclimatic regions along the latitudinal gradient. Hypothet- ically, different controlling factors are operating in the different areas
along the latitudinal gradient; or the factors are operating differently in the different areas; or the importance of different factors may be
changing through time but not synchronously through space. However, all three alternatives may be relevant at the same time.
Materials and Methods STUDY AREAS
Three treeline regions, Dovre in central Norway, Abisko in northern Sweden, and Joatka in northern Norway, dominated by birch and situated along the Scandinavian mountain chain are used as study areas (Fig. 1). All three areas are dominated by slightly continental climate conditions with low precipitation and fairly large differences between summer and winter temperatures (Moen, 1998; Table 1). The entire region is influenced by atlantic air masses, but arctic air masses dominate in the northernmost area during winter. The degree to which these air masses dominate varies through space and time and
throughout the year and seasons. Mean annual and winter temperatures decrease from the southern to the northern area (Table 1), and even
though summer temperature increases towards the north, the estimated
length of growing periods for different threshold temperatures declines.
TABLE 1
Mean temperatures and precipitation based on mean monthly values from local meteorological stations (Fokstua, Abisko, and Soulovuopmi) and estimated growth period lengths during the period 1971-2000 at the three study areas. Summer refers to
June to August, winter to December to February.
Growth period Annual Summer Winter Annual (days) based on 0C
Study temp. temp. temp. precipitation limit, 30C limit, area Latitude (oC) (oC) (oC) (mm) and 5?C limit
Dovre 62010-20' 0.18 9.15 -7.38 454 176 140 115 Abisko 68010-20' -0.52 9.79 -9.82 315 170 138 113 Joatka 69040-50' -2.30 9.92 -12.55 460 150 124 105
The annual precipitation is more or less identical in the southern and
northernmost area, but slightly lower in the Abisko area. Temperature and precipitation data (Table 1) refer to climate stations near to each of
the three study areas: Fokstua, 972 m a.s.l., approximately 25 km from
the investigated Dovre area; Abisko Scientific Research Station at
385 m a.s.l., approximately 22 km from the Abisko area; and Suolo-
vuopmi, 374 m a.s.l., approximately 25 km away from the Joatka area.
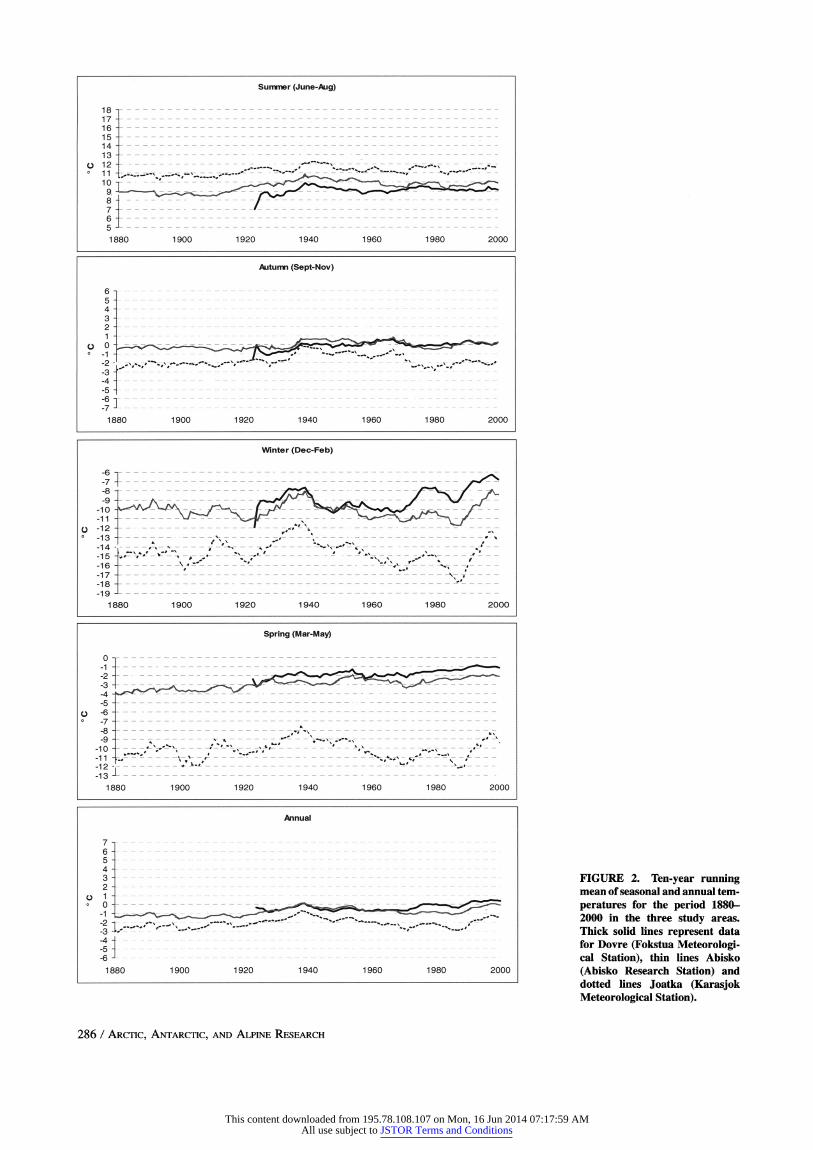
The mean annual temperature has increased during the twentieth cen-
tury in all three areas, with deviating warmer periods in the 1930s and
1990s and colder periods around 1970 and in the late 1980s (Fig. 2). Summer temperature has increased in all three sites, whereas winter and
spring temperature has increased slightly in the Dovre and Abisko
areas but has been stable or slightly decreased in Joatka. The long- term temperature data for Joatka is from the climate station in Karasjok, 70 km southeast of Joatka, since there was no data prior to 1964
from Suolovuopmi. The data from Suolovuopmi and Karasjok show
strong covariation (Pearsons correlation coefficient = 0.869), with an
overall mean difference between the two places of 0.12'C (warmer at
Suolovuopmi), but with lower winter temperatures and higher summer
temperatures at Karasjok. The bedrock varies slightly between areas with gneiss and
quartzite dominating in Dovre, mainly hard shale in Abisko, and hard
shale and metasediments in Joatka. The Dovre and Abisko areas are
situated in rather rugged mountainous terrain with the highest sur-
rounding peaks reaching >2200 m and >1800 m, respectively. In
Joatka the landscape is characterized by an undulating plateau at
about 400-500 m a.s.l., with the highest mountains reaching just above
1000 m about 20 km away. In all three regions, herb-rich mountain birch forests dominate the
subalpine zone with some scattered pine, Pinus sylvestris L., at lower
altitudes. Continuous birch forest is found up to about 1090, 670, and
420 m a.s.l. in Dovre, Abisko and Joatka, respectively, or slightly
higher depending on exposition of mountain slopes and climatically favorable locations intersecting tundra vegetation along the slopes.
Beyond, the forest dwarf shrub heaths and lichen heaths dominate in
the low alpine zones which continue up to 1550 m in Dovre, 1050 m in
Abisko, and about 650 m a.s.l. in Joatka.
METHODS
In each of the three areas, four mountain slopes (henceforward
sites) with different aspects were selected and sampled during summer
1999 and 2000. At Dovre and Joatka, these sites faced north, west,
east, and south (N, W, E, S), respectively. At Abisko, where it was not
possible to find suitable slopes with these aspects, the following
aspects were chosen: north (N), southeast (SE), southwest (SW), and northwest (NW). Each selected site had to have at least 1 km
(horizontally) of its slope facing the chosen aspect along which the
L. DALEN AND A. HOFGAARD / 285
This content downloaded from 195.78.108.107 on Mon, 16 Jun 2014 07:17:59 AMAll use subject to JSTOR Terms and Conditions
Sunmner (June-Aug)
18 17 16 15 14 13 S12 ------ - - - - - - - -----
10 6
5
1880 1900 1920 1940 1960 1980 2000
Autumn (Sept-Nov)
6 -- ----1 - --- -- -- -- -- -- -- -- -- -- -- -- -- ----- --- --- - - --- - - - - -- - -- -- -
2
3
-4
-5
-6z~ 1880 1900 1920 1940 1960 1980 2000
Winter (Dec-Feb)
-6 -
o -12 - 2 -.---.--
-13
-15 --
-17 - - -- --- ---------- --- ----------- --- ---- ---------A -
-18 -- - - ---- ----------- --- -- -
-19
-5
? 7
-9
-180 - - 119 -11 - - -14 -15
-16
1880 1900 1920 1940 1960 1980 2000
6- 5- 4-
-4 - - - - - - - - - - -
- - - ' - - - -
10 - -19
- - - - -- - - - - - - - - - - - - - -
-1 R i - - - - - - - - - - - - - - - - - -
FIGURE 2. Ten-year running mean of seasonal and annual tem- peratures for the period 1880- 2000 in the three study areas. Thick solid lines represent data for Dovre (Fokstua Meteorologi- cal Station), thin lines Abisko (Abisko Research Station) and dotted lines Joatka (Karasjok Meteorological Station).
286 / ARCTIC, ANTARCTIC, AND ALPINE RESEARCH
This content downloaded from 195.78.108.107 on Mon, 16 Jun 2014 07:17:59 AMAll use subject to JSTOR Terms and Conditions
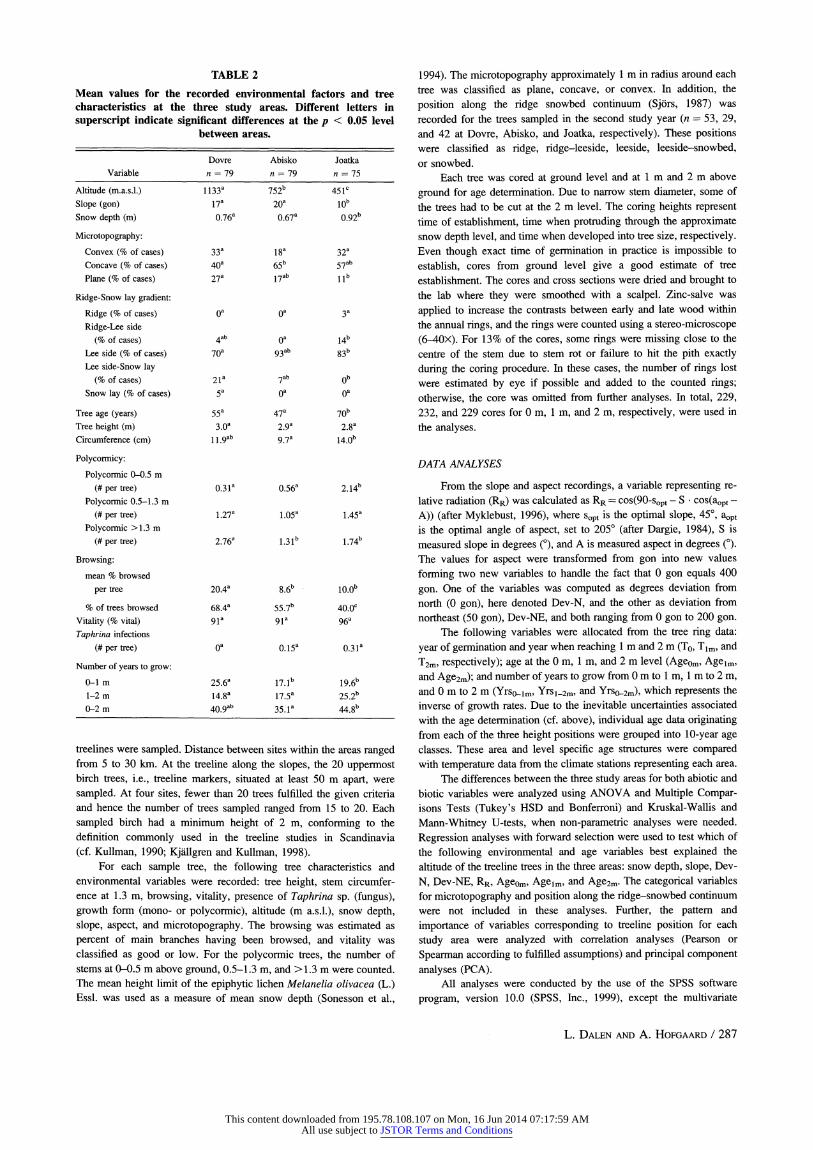
TABLE 2
Mean values for the recorded environmental factors and tree characteristics at the three study areas. Different letters in superscript indicate significant differences at the p < 0.05 level
between areas.
Dovre Abisko Joatka Variable n = 79 n = 79 n = 75
Altitude (m.a.s.1.) 1133a 752b 451c Slope (gon) 17a 20a 10b Snow depth (m) 0.76a 0.67a 0.92b
Microtopography: Convex (% of cases) 33a 18a 32a
Concave (% of cases) 40a 65b 57ab
Plane (% of cases) 27a 17ab Ilb
Ridge-Snow lay gradient:
Ridge (% of cases) a0 0a 3a Ridge-Lee side
(% of cases) 4ab 0a 14b
Lee side (% of cases) 70a 93ab 83b
Lee side-Snow lay (% of cases) 21a 7ab Ob
Snow lay (% of cases) 5" 0" 0a
Tree age (years) 55a 47a 70b Tree height (m) 3.0a 2.9a 2.8a Circumference (cm) 11.9ab 9.7a 14.0b
Polycormicy:
Polycormic 0-0.5 m (# per tree) 0.31a 0.56a 2.14b
Polycormic 0.5-1.3 m (# per tree) 1.27a 1.05a 1.45a
Polycormic >1.3 m (# per tree) 2.76a 1.31b 1.74b
Browsing: mean % browsed
per tree 20.4a 8.6b 10.0b
% of trees browsed 68.4a 55.7b 40.0c Vitality (% vital) 91a 91a 96a Taphrina infections
(# per tree) 0a 0.15" 0.31a
Number of years to grow: 0-1 m 25.6a 17.1b 19.6b 1-2 m 14.8a 17.5a 25.2b 0-2 m 40.9ab 35.1" 44.8b
treelines were sampled. Distance between sites within the areas ranged from 5 to 30 km. At the treeline along the slopes, the 20 uppermost birch trees, i.e., treeline markers, situated at least 50 m apart, were sampled. At four sites, fewer than 20 trees fulfilled the given criteria and hence the number of trees sampled ranged from 15 to 20. Each sampled birch had a minimum height of 2 m, conforming to the definition commonly used in the treeline studies in Scandinavia (cf. Kullman, 1990; Kjiillgren and Kullman, 1998).
For each sample tree, the following tree characteristics and environmental variables were recorded: tree height, stem circumfer- ence at 1.3 m, browsing, vitality, presence of Taphrina sp. (fungus), growth form (mono- or polycormic), altitude (m a.s.l.), snow depth, slope, aspect, and microtopography. The browsing was estimated as percent of main branches having been browsed, and vitality was classified as good or low. For the polycormic trees, the number of stems at 0-0.5 m above ground, 0.5-1.3 m, and >1.3 m were counted. The mean height limit of the epiphytic lichen Melanelia olivacea (L.) Essl. was used as a measure of mean snow depth (Sonesson et al.,
1994). The microtopography approximately 1 m in radius around each tree was classified as plane, concave, or convex. In addition, the
position along the ridge snowbed continuum (Sj5rs, 1987) was recorded for the trees sampled in the second study year (n = 53, 29, and 42 at Dovre, Abisko, and Joatka, respectively). These positions were classified as ridge, ridge-leeside, leeside, leeside-snowbed, or snowbed.
Each tree was cored at ground level and at 1 m and 2 m above
ground for age determination. Due to narrow stem diameter, some of the trees had to be cut at the 2 m level. The coring heights represent time of establishment, time when protruding through the approximate snow depth level, and time when developed into tree size, respectively. Even though exact time of germination in practice is impossible to establish, cores from ground level give a good estimate of tree establishment. The cores and cross sections were dried and brought to the lab where they were smoothed with a scalpel. Zinc-salve was
applied to increase the contrasts between early and late wood within the annual rings, and the rings were counted using a stereo-microscope (6-40x). For 13% of the cores, some rings were missing close to the centre of the stem due to stem rot or failure to hit the pith exactly during the coring procedure. In these cases, the number of rings lost were estimated by eye if possible and added to the counted rings; otherwise, the core was omitted from further analyses. In total, 229, 232, and 229 cores for 0 m, 1 m, and 2 m, respectively, were used in the analyses.
DATA ANALYSES
From the slope and aspect recordings, a variable representing re- lative radiation (RR) was calculated as RR = COs(90-Sopt - S - cos(aopt -
A)) (after Myklebust, 1996), where Sopt is the optimal slope, 450, aopt is the optimal angle of aspect, set to 2050 (after Dargie, 1984), S is measured slope in degrees (?), and A is measured aspect in degrees (o). The values for aspect were transformed from gon into new values
forming two new variables to handle the fact that 0 gon equals 400
gon. One of the variables was computed as degrees deviation from north (0 gon), here denoted Dev-N, and the other as deviation from northeast (50 gon), Dev-NE, and both ranging from 0 gon to 200 gon.
The following variables were allocated from the tree ring data:
year of germination and year when reaching 1 m and 2 m (To, Tim, and
T2m, respectively); age at the 0 m, 1 m, and 2 m level (Ageom, Agelm, and Age2m); and number of years to grow from 0 m to 1 m, 1 m to 2 m, and 0 m to 2 m (Yrso-Im, Yrsl-2m, and
Yrso-2m), which represents the
inverse of growth rates. Due to the inevitable uncertainties associated with the age determination (cf. above), individual age data originating from each of the three height positions were grouped into 10-year age classes. These area and level specific age structures were compared with temperature data from the climate stations representing each area.
The differences between the three study areas for both abiotic and biotic variables were analyzed using ANOVA and Multiple Compar- isons Tests (Tukey's HSD and Bonferroni) and Kruskal-Wallis and Mann-Whitney U-tests, when non-parametric analyses were needed. Regression analyses with forward selection were used to test which of the following environmental and age variables best explained the altitude of the treeline trees in the three areas: snow depth, slope, Dev- N, Dev-NE, RR, Ageom, Agelrm, and Age2m. The categorical variables for microtopography and position along the ridge-snowbed continuum were not included in these analyses. Further, the pattern and importance of variables corresponding to treeline position for each study area were analyzed with correlation analyses (Pearson or Spearman according to fulfilled assumptions) and principal component analyses (PCA).
All analyses were conducted by the use of the SPSS software program, version 10.0 (SPSS, Inc., 1999), except the multivariate
L. DALEN AND A. HOFGAARD / 287
This content downloaded from 195.78.108.107 on Mon, 16 Jun 2014 07:17:59 AMAll use subject to JSTOR Terms and Conditions
TABLE 3
Mean treeline altitude, standard deviation of altitude, mean slope inclination (0), and calculated relative radiation (RR) for slopes of different aspects at the three study areas. Letters in superscript indicate significant differences at the p < 0.05 level in altitude
between the slopes within an area.
Aspect Mean altitude (m.a.s.l.) S.D. of altitude Slope RR
Dovre
N 1114a 37.0 10.8 0.581 E 1121a 16.4 20.3 0.715 S 1156" 12.1 24.3 0.888 W 1140b 19.8 13.6 0.768
Abisko
N 698a 23.9 16.0 0.537 SE 740b 9.1 23.5 0.744 SW 772c 7.3 10.8 0.883 NW 791d 19.6 18.7 0.645
Joatka
N 423a 19.6 4.1 0.669 E 460b 17.8 14.3 0.642 S 490c 12.7 15.4 0.840 W 429a 12.9 4.1 0.733
procedures, for which CANOCO for Windows, version 4.5 (ter Braak and Smilauer, 2002) was used. We used 0.05 as the cut-off significance level in the analyses.
Results SPATIAL DISTRIBUTION
The mean altitudes of the treeline positions at Dovre, Abisko, and Joatka were 1133, 752, and 451 m a.s.l., respectively (Table 2). This means that between latitudes 62?N and 680N treeline altitude declined on average 63 m per degree north, whereas between latitudes 680 and ca 70'N the mean decline was 200 m per degree north. There was no
regional difference in preferred microtopography position of sampled trees. Most trees were found in concave places and in lee sides, whereas only a few were found on ridges and in snowbeds (Table 2). In accordance with the general difference in landscape-scale topography (cf. above), treeline trees in the Dovre and Abisko areas showed
stronger correspondence with steep slopes compared to the Joatka area. A significantly thicker mean snow cover characterized local growing positions in the northernmost area compared to further south (Table 2). Further, mean browsing per tree was significantly higher in the south, and the number of trees affected by browsing decreased toward the north (Table 2).
Slope aspect influenced the altitudinal position of the trees
throughout studied areas with, in general, the most advanced positions at S-facing sites and the lowest on N-facing ones (Table 3, Fig. 3). However, in Abisko the NW-facing site had the most advanced treeline
position. The maximum difference in mean altitude of the treeline between the aspects varied from 93 m between the NW-facing and the
N-facing sites in the Abisko area, to 42 m between the N-facing and
S-facing sites in Dovre. There was no significant difference between the N- and E-facing sites or the S- and W-facing sites in Dovre, or between the N- and W-facing sites in Joatka. The variation in the altitude of tree positions within slopes differed between the different
slopes in the three areas, and was in general, negatively related to the mean relative radiation (RR) of the sites (Table 3).
200 N Joatka
W E lOo
200 1 0go0 100 200
100
200 S
200 N
Abisko AL
W E
200 100 200
100
200 S
200 N Dovre
AA
100
100
200
FIGURE 3. Polar diagram showing the aspect position of the trees and their altitudinal position downward from the uppermost tree (origo) in each area. The two axes represent altitudinal meters and indicate north, south, east, and west. Different shapes of markers indicate different mountain slopes.
The variables that best explained the altitude of the treeline trees differed slightly between areas. In Dovre, relative radiation and Ageom were the only factors after forward selection in the regression analyses that significantly predicted the altitude (R2 0.266 for RR alone and
288 / ARCTIC, ANTARCTIC, AND ALPINE RESEARCH
This content downloaded from 195.78.108.107 on Mon, 16 Jun 2014 07:17:59 AMAll use subject to JSTOR Terms and Conditions
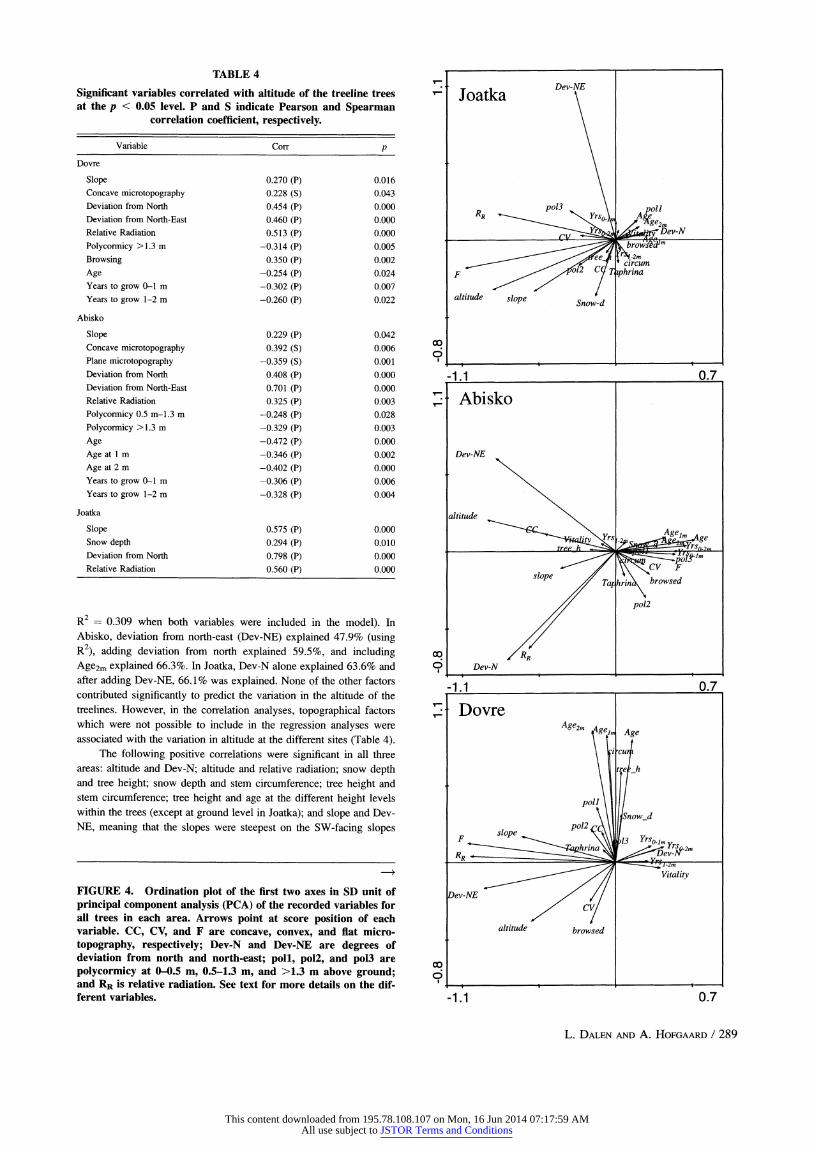
TABLE 4
Significant variables correlated with altitude of the treeline trees at the p < 0.05 level. P and S indicate Pearson and Spearman
correlation coefficient, respectively.
Variable Corr p Dovre
Slope 0.270 (P) 0.016 Concave microtopography 0.228 (S) 0.043 Deviation from North 0.454 (P) 0.000 Deviation from North-East 0.460 (P) 0.000 Relative Radiation 0.513 (P) 0.000 Polycormicy >1.3 m -0.314 (P) 0.005 Browsing 0.350 (P) 0.002 Age -0.254 (P) 0.024 Years to grow 0-1 m -0.302 (P) 0.007 Years to grow 1-2 m -0.260 (P) 0.022
Abisko
Slope 0.229 (P) 0.042 Concave microtopography 0.392 (S) 0.006 Plane microtopography -0.359 (S) 0.001 Deviation from North 0.408 (P) 0.000 Deviation from North-East 0.701 (P) 0.000 Relative Radiation 0.325 (P) 0.003 Polycormicy 0.5 m-1.3 m -0.248 (P) 0.028 Polycormicy >1.3 m -0.329 (P) 0.003 Age -0.472 (P) 0.000 Age at 1 m -0.346 (P) 0.002 Age at 2 m -0.402 (P) 0.000 Years to grow 0-1 m -0.306 (P) 0.006 Years to grow 1-2 m -0.328 (P) 0.004
Joatka
Slope 0.575 (P) 0.000 Snow depth 0.294 (P) 0.010 Deviation from North 0.798 (P) 0.000 Relative Radiation 0.560 (P) 0.000
R2 = 0.309 when both variables were included in the model). In Abisko, deviation from north-east (Dev-NE) explained 47.9% (using R2), adding deviation from north explained 59.5%, and including Age2m explained 66.3%. In Joatka, Dev-N alone explained 63.6% and after adding Dev-NE, 66.1% was explained. None of the other factors contributed significantly to predict the variation in the altitude of the treelines. However, in the correlation analyses, topographical factors which were not possible to include in the regression analyses were associated with the variation in altitude at the different sites (Table 4).
The following positive correlations were significant in all three areas: altitude and Dev-N; altitude and relative radiation; snow depth and tree height; snow depth and stem circumference; tree height and stem circumference; tree height and age at the different height levels within the trees (except at ground level in Joatka); and slope and Dev- NE, meaning that the slopes were steepest on the SW-facing slopes
FIGURE 4. Ordination plot of the first two axes in SD unit of principal component analysis (PCA) of the recorded variables for all trees in each area. Arrows point at score position of each variable. CC, CV, and F are concave, convex, and flat micro- topography, respectively; Dev-N and Dev-NE are degrees of deviation from north and north-east; poll, pol2, and pol3 are polycormicy at 0-0.5 m, 0.5-1.3 m, and >1.3 m above ground; and RR is relative radiation. See text for more details on the dif- ferent variables.
Dev-NE " Joatka
RR
pol3 poll RR Yrso Asge
CL r WDev-N
ee .2m Scircum F o12 C T phrina
Co
altitude slope Snow-d
00
-1.1 0.7
-- Abisko
Dev-NE
altitude
,s
Agelm r ge
" " YrSYrsr,
Im
CV
slope Tahrin browsed
pol2
00 RR o Dev-N
-1.1 0.7
7 Dovre
Age2m, Age
gel Age
eicu
tre R-h
altitude browsed
-1.1 0.7
L. DALEN AND A. HOFGAARD / 289
This content downloaded from 195.78.108.107 on Mon, 16 Jun 2014 07:17:59 AMAll use subject to JSTOR Terms and Conditions
Dovre Abisko Joatka 40C 40 40
n = 77 n = 77 n = 75
30 30 30
o
2m 20 20 20
Z 10 10 10
0 - . o0 0 1860 1880 1900 1920 1940 1960 1980 2000 1860 1880 1900 1920 1940 1960 1980 2000 1860 1880 1900 1920 1940 1960 1980 2000
50 50 50
n= 78 n =79 n = 75 S4000 40
m 0 330 30
0•
n = 77 n = 77 n = 75
20 20 20
z
Om 0- o
1860 1880 1900 1920 1940 1960 1980 2000 1860 1880 1900 1920 1940 1960 1980 2000 1860 1880 1900 1920 1940 1960 1980 2000 1860 1880 1900 1920 1940 1960 1980 2000 1860 1880 1900 1920 1940 1960 1980 2000 1860 1890 1900 1920 1940 1960 1990 2000
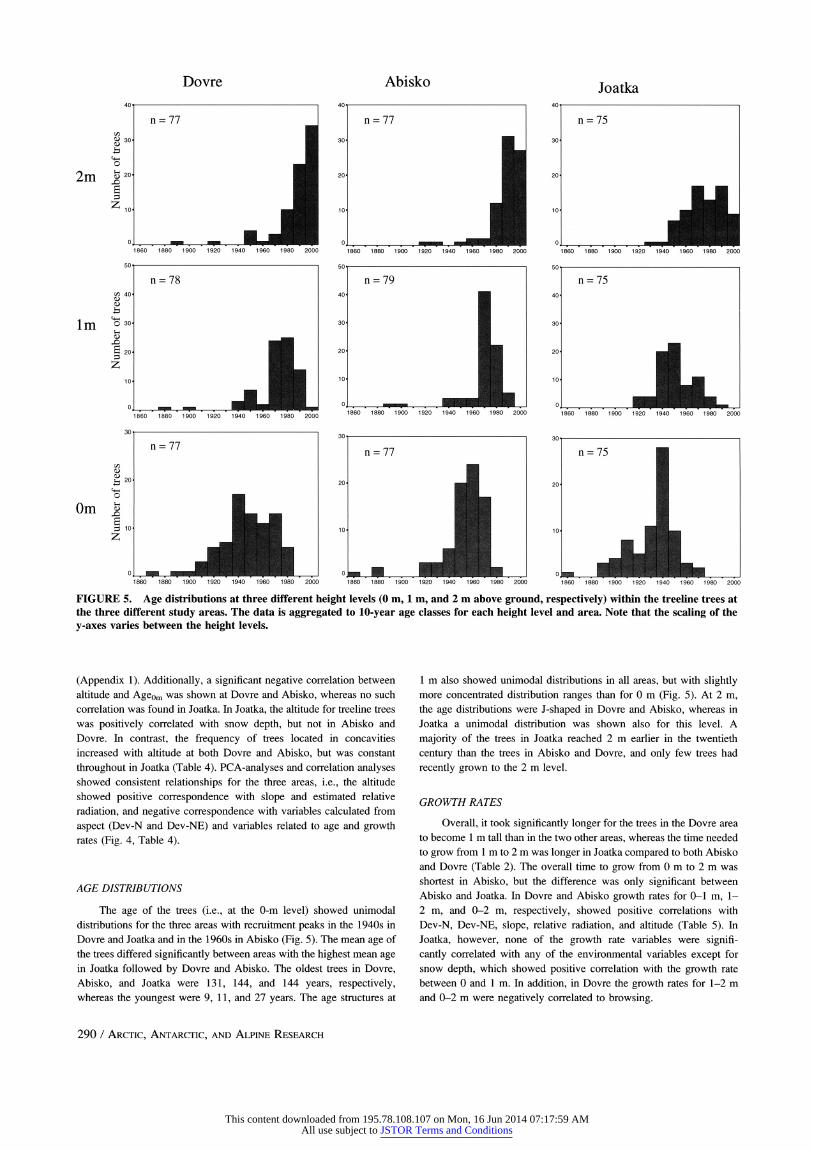
FIGURE 5. Age distributions at three different height levels (0 m, 1 m, and 2 m above ground, respectively) within the treeline trees at the three different study areas. The data is aggregated to 10-year age classes for each height level and area. Note that the scaling of the y-axes varies between the height levels.
(Appendix 1). Additionally, a significant negative correlation between altitude and Ageom was shown at Dovre and Abisko, whereas no such correlation was found in Joatka. In Joatka, the altitude for treeline trees was positively correlated with snow depth, but not in Abisko and Dovre. In contrast, the frequency of trees located in concavities increased with altitude at both Dovre and Abisko, but was constant
throughout in Joatka (Table 4). PCA-analyses and correlation analyses showed consistent relationships for the three areas, i.e., the altitude showed positive correspondence with slope and estimated relative
radiation, and negative correspondence with variables calculated from
aspect (Dev-N and Dev-NE) and variables related to age and growth rates (Fig. 4, Table 4).
AGE DISTRIBUTIONS
The age of the trees (i.e., at the 0-m level) showed unimodal distributions for the three areas with recruitment peaks in the 1940s in Dovre and Joatka and in the 1960s in Abisko (Fig. 5). The mean age of the trees differed significantly between areas with the highest mean age in Joatka followed by Dovre and Abisko. The oldest trees in Dovre, Abisko, and Joatka were 131, 144, and 144 years, respectively, whereas the youngest were 9, 11, and 27 years. The age structures at
1 m also showed unimodal distributions in all areas, but with slightly more concentrated distribution ranges than for 0 m (Fig. 5). At 2 m, the age distributions were J-shaped in Dovre and Abisko, whereas in Joatka a unimodal distribution was shown also for this level. A
majority of the trees in Joatka reached 2 m earlier in the twentieth
century than the trees in Abisko and Dovre, and only few trees had
recently grown to the 2 m level.
GROWTH RATES
Overall, it took significantly longer for the trees in the Dovre area to become 1 m tall than in the two other areas, whereas the time needed to grow from 1 m to 2 m was longer in Joatka compared to both Abisko and Dovre (Table 2). The overall time to grow from 0 m to 2 m was shortest in Abisko, but the difference was only significant between Abisko and Joatka. In Dovre and Abisko growth rates for 0-1 m, 1- 2 m, and 0-2 m, respectively, showed positive correlations with
Dev-N, Dev-NE, slope, relative radiation, and altitude (Table 5). In
Joatka, however, none of the growth rate variables were signifi- cantly correlated with any of the environmental variables except for snow depth, which showed positive correlation with the growth rate between 0 and 1 m. In addition, in Dovre the growth rates for 1-2 m and 0-2 m were negatively correlated to browsing.
290 / ARCTIC, ANTARCTIC, AND ALPINE RESEARCH
This content downloaded from 195.78.108.107 on Mon, 16 Jun 2014 07:17:59 AMAll use subject to JSTOR Terms and Conditions
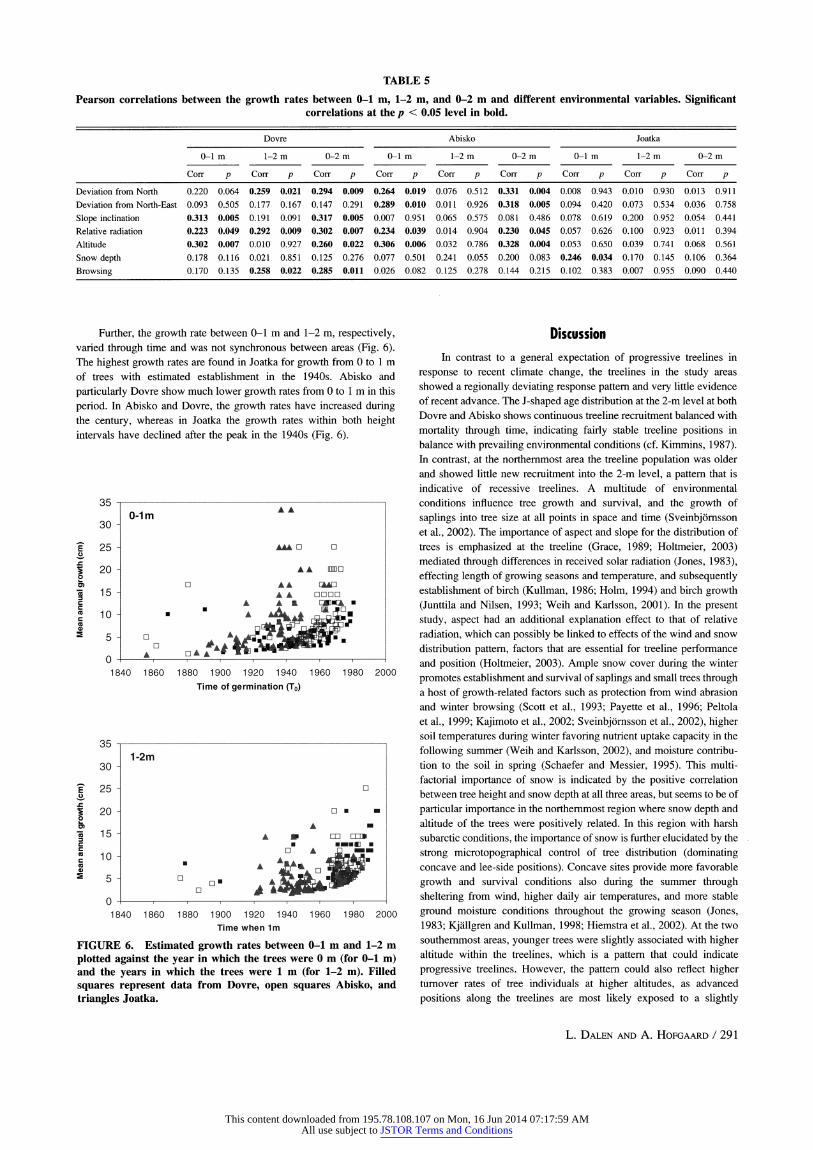
TABLE 5
Pearson correlations between the growth rates between 0-1 m, 1-2 m, and 0-2 m and different environmental variables. Significant correlations at the p < 0.05 level in bold.
Dovre Abisko Joatka
0-1 m 1-2 m 0-2 m 0-1 m 1-2 m 0-2 m 0-1 m 1-2 m 0-2 m
Corr p Corr p Corr p Corr p Corr p Corr p Corr p Corr p Corr p
Deviation from North 0.220 0.064 0.259 0.021 0.294 0.009 0.264 0.019 0.076 0.512 0.331 0.004 0.008 0.943 0.010 0.930 0.013 0.911 Deviation from North-East 0.093 0.505 0.177 0.167 0.147 0.291 0.289 0.010 0.011 0.926 0.318 0.005 0.094 0.420 0.073 0.534 0.036 0.758
Slope inclination 0.313 0.005 0.191 0.091 0.317 0.005 0.007 0.951 0.065 0.575 0.081 0.486 0.078 0.619 0.200 0.952 0.054 0.441
Relative radiation 0.223 0.049 0.292 0.009 0.302 0.007 0.234 0.039 0.014 0.904 0.230 0.045 0.057 0.626 0.100 0.923 0.011 0.394
Altitude 0.302 0.007 0.010 0.927 0.260 0.022 0.306 0.006 0.032 0.786 0.328 0.004 0.053 0.650 0.039 0.741 0.068 0.561
Snow depth 0.178 0.116 0.021 0.851 0.125 0.276 0.077 0.501 0.241 0.055 0.200 0.083 0.246 0.034 0.170 0.145 0.106 0.364
Browsing 0.170 0.135 0.258 0.022 0.285 0.011 0.026 0.082 0.125 0.278 0.144 0.215 0.102 0.383 0.007 0.955 0.090 0.440
Further, the growth rate between 0-1 m and 1-2 m, respectively, varied through time and was not synchronous between areas (Fig. 6). The highest growth rates are found in Joatka for growth from 0 to 1 m of trees with estimated establishment in the 1940s. Abisko and
particularly Dovre show much lower growth rates from 0 to 1 m in this
period. In Abisko and Dovre, the growth rates have increased during the century, whereas in Joatka the growth rates within both height intervals have declined after the peak in the 1940s (Fig. 6).
35 0-1m AA 30
E 25 -A" 0 0
20 - AA lMn
15- AA 0000 C ?A A A Ema
10- A A
0 :
1840 1860 1880 1900 1920 1940 1960 1980 2000 Time of germination (To)
35 1-2m
30
E 25 -
V 20- 0 - A -
5 10 - A A IL ]
5- 0 a= 0 0
1840 1860 1880 1900 1920 1940 1960 1980 2000 Time when Im
FIGURE 6. Estimated growth rates between 0-1 m and 1-2 m plotted against the year in which the trees were 0 m (for 0-1 m) and the years in which the trees were 1 m (for 1-2 m). Filled squares represent data from Dovre, open squares Abisko, and triangles Joatka.
Discussion In contrast to a general expectation of progressive treelines in
response to recent climate change, the treelines in the study areas showed a regionally deviating response pattern and very little evidence of recent advance. The J-shaped age distribution at the 2-m level at both Dovre and Abisko shows continuous treeline recruitment balanced with
mortality through time, indicating fairly stable treeline positions in balance with prevailing environmental conditions (cf. Kimmins, 1987). In contrast, at the northernmost area the treeline population was older and showed little new recruitment into the 2-m level, a pattern that is indicative of recessive treelines. A multitude of environmental conditions influence tree growth and survival, and the growth of
saplings into tree size at all points in space and time (Sveinbj6rnsson et al., 2002). The importance of aspect and slope for the distribution of trees is emphasized at the treeline (Grace, 1989; Holtmeier, 2003) mediated through differences in received solar radiation (Jones, 1983), effecting length of growing seasons and temperature, and subsequently establishment of birch (Kullman, 1986; Holm, 1994) and birch growth (Junttila and Nilsen, 1993; Weih and Karlsson, 2001). In the present study, aspect had an additional explanation effect to that of relative
radiation, which can possibly be linked to effects of the wind and snow distribution pattern, factors that are essential for treeline performance and position (Holtmeier, 2003). Ample snow cover during the winter
promotes establishment and survival of saplings and small trees through a host of growth-related factors such as protection from wind abrasion and winter browsing (Scott et al., 1993; Payette et al., 1996; Peltola et al., 1999; Kajimoto et al., 2002; Sveinbj6rnsson et al., 2002), higher soil temperatures during winter favoring nutrient uptake capacity in the
following summer (Weih and Karlsson, 2002), and moisture contribu- tion to the soil in spring (Schaefer and Messier, 1995). This multi- factorial importance of snow is indicated by the positive correlation between tree height and snow depth at all three areas, but seems to be of
particular importance in the northernmost region where snow depth and altitude of the trees were positively related. In this region with harsh subarctic conditions, the importance of snow is further elucidated by the
strong microtopographical control of tree distribution (dominating concave and lee-side positions). Concave sites provide more favorable
growth and survival conditions also during the summer through sheltering from wind, higher daily air temperatures, and more stable
ground moisture conditions throughout the growing season (Jones, 1983; Kjillgren and Kullman, 1998; Hiemstra et al., 2002). At the two
southernmost areas, younger trees were slightly associated with higher altitude within the treelines, which is a pattern that could indicate
progressive treelines. However, the pattern could also reflect higher turnover rates of tree individuals at higher altitudes, as advanced
positions along the treelines are most likely exposed to a slightly
L. DALEN AND A. HOFGAARD / 291
This content downloaded from 195.78.108.107 on Mon, 16 Jun 2014 07:17:59 AMAll use subject to JSTOR Terms and Conditions
harsher environment, enhancing stem mortality rates (cf. Scott et al., 1993; Payette et al., 1996).
Area specific establishment and growth pattern along the Scandes mountains points towards different space and time compartments for
controlling abiotic and biotic factors. In the 1930s-1940s Scandinavia
experienced a period of climate improvement which was particularly pronounced in the north (Hanssen-Bauer and Nordli, 1998). The recruitment peaks at Dovre and Joatka and the highest growth rates
generally coincide with this warm period, which is a common pattern for birch, spruce, and pine in northern Scandinavia (Akerhielm, 1940; Steijlen and Zackrisson, 1987; Kullman, 1991, 2001b; Hofgaard et al., 1991; Hofgaard, 1993). However, even though the climatic conditions in the 1930s-1940s were favorable and similar throughout the studied latitudinal gradient, the Abisko region showed a deviating recruitment
pattern. In 1954-1955 the Abisko area was struck by a large autumnal moth (Epirrita autumnata) outbreak which completely defoliated the mountain birch forest (Tenow and Bylund, 2000). This insect outbreak
drastically affected the stand structure and probably accounts for the recruitment pattern of the treeline trees in the area. Herbivory by insects, mammals, and birds is an important biotic factor controlling tree performance and growth at the treeline, affecting growth of apical shoots, twigs, buds, and leaves. During the growing season, mountain birch to some extent compensates for herbivory by increased long- shoot growth, but heavy browsing is still a limiting factor (Karlsson et al., 1996; Danell et al., 1997).
In addition to deviating establishment periods (0 m), age structures at the snow-air interface (1 m) and tree size (2 m) levels, respectively, varied among regions. According to these age structures, stable or
possibly progressive treelines characterize the southernmost region and
maybe also the middle region, but recessive treelines characterize the northernmost region. These deviating patterns have a combined abiotic and biotic background. The Scandes mountains are characterized by regionally different climate systems with a strong influence of arctic air masses in the north and warmer atlantic air masses in the southern region (Hanssen-Bauer and F0rland, 2000). In the north, temperatures have
generally declined compared to the 1930s-1940s (Hanssen-Bauer and Nordli, 1998) which implies delayed start of the growing season. Further, the length of the growing season has decreased since the
beginning of the 1980s as a result of snowfall increase during winter
(Hogda et al., 2001). Concomitantly, the number of reindeer has increased (Ims and Kosmo, 2001). Although, reindeer herds only pass through the area twice a year on their way to and from summer pastures on the Norwegian coast, their browsing together with climatic restrictions may act as an important factor limiting birch establishment, growth and survival into tree size (cf. Lehtonen and Heikkinen, 1995; Oksanen et al., 1995; Engelmark et al., 1998). In the southernmost region where temperatures have increased slightly since the mid-twentieth
century (Hanssen-Bauer and Nordli, 1998), and thus climate is less
restricting, browsing is significantly related to treeline position. Browsing, mainly by sheep, in this region is consequently likely to be responsible for the slow height growth between 0 and 1 m. In addition to summer browsing, winter browsing above the snow (dominated by hares) can have profound effects on height development. This is emphasized in the northernmost region, where snow depth is the strongest determinant to growth, and deep snow conditions act as protection up to the snow-air interface.
Seed dispersal, seed quality, and germination are sometimes quoted as limiting factors for tree establishment at the treeline. However, birch saplings are generally present and common above the treeline (Hofgaard, 1997b; Kullman, 2002) and were present at all three studied areas (Dalen, unpublished). In addition, high dispers- ability of birch seeds (Elven and Ryvarden, 1975; Molau and Larson, 2000) renders these rather unlikely causes of treeline control in the studied regions.
Concluding Remarks Regional differences in age structure and growth rates imply
different environmental factors as focal predictors for treeline response. Whereas snow is a main controlling factor in the northern region,
temperature and herbivory are emphasized in the middle and southern
regions. Consequently, any future change of these parameters will have a strong and discriminating impact on tree performance and recruitment. However, focal predictors may change both through time and space (e.g., Solberg et al., 2002), and effects of non-climatic factors can regionally and temporally override responses to changes in the climate (e.g., Shankman and Daly, 1988; Hofgaard, 1997b). This
may be misinterpreted as responses to a changed climate (Hofgaard, 1997b) at the same time as lack of observable response due to
counteracting factors may be misinterpreted as insensitivity to climate
change. More knowledge is needed on space and time specific response
patterns to evaluate the climatic validity of observed treeline changes (cf. Skre et al. 2002). Ultimately and importantly, counteracting mechanisms have to be included in models for future responses of the forest-tundra boundary to avoid overestimation of responses at the
ecosystem level and consequences for, e.g., carbon uptake capacity and feedbacks to the biotic and abiotic environment at the regional to global scale.
Acknowledgments We are grateful for assistance in the field by Eva Romell, Erik
Heiman, Anna Sjostedt, Heidi Myklebust, and Frode Morken. We also thank HAkan Hytteborn for kindly commenting on the manuscript in addition to helping in the field, and we thank Carolyn Baggerud for the help with Figure 1 and for improving the English language. We would like to thank the Norwegian Meteorological Station, in particular
Oyvind Nordli, and the Kongsvoll, Abisko, and Joatka research stations. The project was funded by the European Commission through the DART project (ENV4-CT97-0586).
References Cited Aas, B., 1969: Climatically raised birch lines in southeastern Norway
1918-1968. Norsk Geografisk Tidsskrift, 23: 119-130.
A•kerhielm, L., 1940: Tallens sekundira hojdtillviixt. Svenska Skog-
vdrdsforeningens Tidskrift, 38: 196-238. Brown, D. G., 1994: Predicting vegetation types at treeline using
topography and biophysical disturbance variables. Journal of Vegetation Science, 5: 641-656.
Callaghan, T. V., Werkman, B. R., and Crawford, R. M. M., 2002: The tundra-taiga interface and its dynamics: concepts and applications. Ambio Special Report, 12: 6-14.
Crawford, R. M. M., Jeffree, C. E., and Rees, W. G., 2003: Paludification and forest retreat in northern oceanic environments. Annals ofBotany, 91: 213-226.
Danell, K., Haukioja, E., and HussDanell, K., 1997: Morphological and chemical responses of mountain birch leaves and shoots to winter browsing along a gradient of plant productivity. Ecoscience, 4: 296-303.
Dargie, T. C. D., 1984: On the integrated interpretation of indirect site ordinations: a case study using semi-arid vegetation in southeastern Spain. Vegetatio, 55: 37-55.
Douglas, I., 2002: Causes and consequences of global environmental change. Chichester: Wiley, 753 pp.
Elven, R., and Ryvarden, L., 1975: Dispersal and primary establish- ment of vegetation. In: Wielgolaski, F. E. (ed.), Fennoscandian tundra ecosystems, Part I: Plants and microorganisms. New York: Berlin-Heidelberg, 82-85.
Engelmark, O., Hofgaard, A., and Arnborg, T., 1998: Successional trends 219 years after fire in an old Pinus sylvestris stand in northern Sweden. Journal of Vegetation Science, 9: 583-592.
292 / ARCTIC, ANTARCTIC, AND ALPINE RESEARCH
This content downloaded from 195.78.108.107 on Mon, 16 Jun 2014 07:17:59 AMAll use subject to JSTOR Terms and Conditions
Grace, J., 1989: Tree lines. Philosophical Transactions of the Royal Society of London Series B: Biological Sciences, 324: 233-245.
Grace, J., Allen, S. J., and Wilson, C., 1989: Climate and the meristem temperatures of plant communities near the tree-line. Oecologia, 79: 198-204.
Grace, J., Berninger, F., and Nagy, L., 2002: Impacts of climate change on the tree line. Annals of Botany, 90: 537-544.
Hanssen-Bauer, I., and F0rland, E., 2000: Temperature and pre- cipitation variations in Norway 1900-1994 and their links to atmospheric circulation. International Journal of Climatology, 20: 1693-1708.
Hanssen-Bauer, I., and Nordli, 0., 1998: Annual and seasonal temperature variations in Norway 1876-1997. DNMI report Klima 25. Oslo: Norwegian Meteorological Institute, 29 pp.
Harding, R., Kuhry, P., Christensen, T. R., Sykes, M. T., Dankers, R., and van der Linden, S., 2002: Climate feedbacks at the tundra-taiga interface. Ambio, 12: 47-55.
Haittenschwiler, S., and Krner, C., 1995: Responses to recent climate warming of Pinus sylvestris and Pinus cembra within their montane transition zone in the Swiss Alps. Journal of Vegetation Science, 6: 357-368.
Hiemstra, C. A. A., Liston, G. E., and Reiners, W. A., 2002: Snow redistribution by wind and interactions with vegetation at upper treeline in the Medicine Bow Mountains, Wyoming, USA. Arctic, Antarctic, and Alpine Research, 34: 262-273.
Hofgaard, A., 1993: Structure and regeneration patterns in a virgin Picea abies forest in northern Sweden. Journal of Vegetation Science, 4: 601-608.
Hofgaard, A., 1997a: Inter-relationships between treeline position, species diversity, land use and climate changes in the central Scandes Mountains of Norway. Global Ecology and Biogeography Letters, 6: 419-429.
Hofgaard, A., 1997b: Structural changes in the forest-tundra ecotone: A dynamic process. In: Huntley, B., Cramer, W., Morgan, A. V., Prentice, H. C., and Allen, J. R. M. (eds.), Past and future rapid environmental changes: The spatial and evolutionary responses of terrestrial biota. Berlin and Heidelberg: Springer Verlag, 255-263.
Hofgaard, A., Kullman, L., and Alexandersson, H., 1991: Response of old-growth montane Picea abies L. Karst. forest to climatic variability in northern Sweden. New Phytologist, 119: 585-594.
Hofgaard, A., and Wilmann, B., 2002: Plant distribution pattern across the forest-tundra ecotone: the importance of treeline position. Ecoscience, 9: 375-385.
HOgda, K. A., Karlsen, S. R., and Solheim, I., 2001: Climatic change impact on growing season in Fennoscandia studied by a time series of NOAA AVHRR NDVI data. Proceedings of IGARSS 2001. Sydney, Australia 9-13 July 2001, 1338-1340.
Holm, S.-O., 1994: Reproductive patterns of Betula pendula and B. pubescens coll. along a regional altitudinal gradient in northern Sweden. Ecography, 17: 60-72.
Holtmeier, F.-K., 2003: Mountain timberlines: ecology, patchiness, and dynamics. Dordrecht: Kluwer Academic Publishers, 369 pp.
Ims, A. A., and Kosmo, A. J., 2001: H~yeste reintall for distriktene i Vest-Finnmark. Alta: Reindriftsforvaltningen, 153 pp.
IPCC, 2001: Climate Change 2001: The Scientific Basis. Cambridge and New York: Cambridge University Press, 881 pp.
Jones, H. G., 1983: Plants and microclimate. Cambridge, U.K.: Cambridge University Press, 323 pp.
Junttila, O., and Nilsen, J., 1993: Growth and development of northern forest trees as affected by temperature and light. In: Alden, J., Mastrantonio, J. L., and Odum, S. (eds.), Forest development in cold climates. New York: Plenum Press, 43-57.
Kajimoto, T., Seki, T., Ikeda, S., Daimaru, H., Okamoto, T., and Onodera, H., 2002: Effects of snowfall fluctuation on tree growth and establishment of subalpine Abies mariesii near upper forest-limit of Mt. Yumori, northern Japan. Arctic, Antarctic, and Alpine Research, 34: 191-200.
Karlsson, P. S., and Nordell, K. O., 1996: Effects of soil temperature on the nitrogen economy and growth of mountain birch seedlings
near its presumed low temperature distribution limit. Ecoscience, 3: 183-189.
Karlsson, P. S., Olsson, L., and Hellstrim, K., 1996: Trade-offs among investments in different long-shoot functions-variation among mountain birch individuals. Journal of Ecology, 84: 915-921.
Kimmins, J. P., 1987: Forest ecology. New York: Macmillan, 531 pp. Kjallgren, L., and Kullman, L., 1998: Spatial patterns and structure of
the mountain birch tree-limit in the southern Swedish Scandes- a regional perspective. Geografiska annaler Series A--Physical Geography, 80: 1-16.
Kirner, C., 1998: A re-assessment of high elevation treeline positions and their explanation. Oecologia, 115: 445-459.
Kullman, L., 1986: Demography of Betula pubescens ssp. tortuosa sown in contrasting habitats close to the birch tree-limit in central Sweden. Vegetatio, 65: 13-20.
Kullman, L., 1990: Dynamics of altitudinal tree-limits in Sweden: a review. Norsk Geografisk Tidsskrift, 44: 103-116.
Kullman, L., 1991: Structural change in a subalpine birch woodland in north Sweden during the past century. Journal ofBiogeography, 18: 53-62.
Kullman, L., 1993: Tree limit dynamics of Betula pubescens ssp. tortuosa in relation to climate variability-evidence from central Sweden. Journal of Vegetation Science, 4: 765-772.
Kullman, L., 1998: Tree-limits and montane forests in the Swedish Scandes: Sensitive biomonitors of climate change and variability. Ambio, 27: 312-321.
Kullman, L., 2001a: 20th century climate warming and tree-limit rise in the Southern Scandes of Sweden. Ambio, 30: 72-80.
Kullman, L., 2001b: Immigration of Picea abies into north-central Sweden. New evidence of regional expansion and tree-limit evolution. Nordic Journal of Botany, 21: 39-54.
Kullman, L., 2002: Rapid recent range-margin rise of tree and shrub species in the Swedish Scandes. Journal of Ecology, 90: 68-77.
Lavoie, C., and Payette, S., 1992: Black spruce growth forms as a record of a changing winter environment at "treeline, Quebec, Canada. Arctic and Alpine Research, 24: 40-49.
Lavoie, C., and Payette, S., 1994: The arctic tree line as a record of past and recent climatic changes. Environmental Reviews, 4: 78-90.
Lehtonen, J., and Heikkinen, R. K., 1995: On the recovery of mountain birch after Epirrita damage in Finnish Lapland, with a particular emphasis on reindeer grazing. Ecoscience, 2: 349-356.
Lescop-Sinclair, K., and Payette, S., 1995: Recent advance of the arctic treeline along the eastern coast of Hudson Bay. Journal of Ecology, 83: 929-936.
Lloyd, A. H., and Fastie, C. L., 2002: Spatial and temporal variability in the growth and climate response of treeline trees in Alaska. Climatic Change, 52: 481-509.
Luckman, B., and Kavanagh, T., 2000: Impact of climate fluctuations on mountain environments in the Canadian Rockies. Ambio, 29: 371-380.
Moen, A., 1998: National atlas of Norway: Vegetation. Honefoss:
Norwegian Mapping Authority, 199 pp. Moir, W. H., Rochelle, S. G., and Schoettle, A. W., 1999: Microscale
patterns of tree establishment near upper treeline, Snowy Range, Wyoming, U.S.A. Arctic, Antarctic, and Alpine Research, 31: 379-388.
Molau, U., and Larsson, E. L., 2000: Seed rain and seed bank along an alpine altitudinal gradient in Swedish Lapland. Canadian Journal of Botany, 78: 728-747.
Myklebust, H. E., 1996: En popluasjonspkologisk underspkelse av Pedicularis oederi L. (Gullmyrklegg) i Gr~dalen, M0re og Romsdal. M.Sc. thesis. Trondheim: NTNU, 83 pp.
Oksanen, L., Moen, J., and Helle, T., 1995: Timberline patterns in northernmost Fennoscandia. Relative importance of climate and grazing. Acta Botanica Fennica, 153: 93-105.
Paulsen, J., Weber, U. M., and Korner, C., 2000: Tree growth near treeline: Abrupt or gradual reduction with altitude? Arctic, Antarctic, and Alpine Research, 32: 14-20.
Payette, S., Delwaide, A., Morneau, C., and Lavoie, C., 1996: Patterns of tree stem decline along a snow-drift gradient at treeline: A
L. DALEN AND A. HOFGAARD / 293
This content downloaded from 195.78.108.107 on Mon, 16 Jun 2014 07:17:59 AMAll use subject to JSTOR Terms and Conditions
case study using stem analysis. Canadian Journal of Botany, 74: 1671-1683.
Peltola, H., Kellomaki, S., Vaisanen, H., and Ikonen, V. P., 1999: A mechanistic model for assessing the risk of wind and snow damage to single trees and stands of Scots pine, Norway spruce, and birch. Canadian Journal of Forest Research, 29: 647-661.
Schaefer, J. A., and Messier, F., 1995: Scale-dependent correlations of arctic vegetation and snow cover. Arctic and Alpine Research, 27: 38-43.
Scott, P. A., Hansell, R. I. C., and Erickson, W. R., 1993: Influences of wind and snow on northern tree-line environments at Churchill, Manitoba, Canada. Arctic, 46: 316-323.
Shankman, D., and Daly, C., 1988: Forest regeneration above tree limit depressed by fire in the Colorado Front Range USA. Bulletin of the Torrey Botanical Club, 115: 272-279.
Sj6rs, H., 1987: Biogeography of Norden. In: Varjo, U., and Tietze, W. (eds.), Norden: man and environment. Berlin: Borntraeger, 129-143.
Skre, O., Baxter, R., Crawford, R. M. M., Callaghan, T. V., and Fedorkov, A., 2002: How will the tundra-taiga interface respond to climate change? Ambio Special Report, 12: 37-46.
Slatyer, R. 0., and Noble, I. R., 1992: Dynamics of montane treelines. In: di Castri, F., and Hansen, A. J. (eds.), Landscape boundaries. Consequences for biotic diversity and ecological flows. New York: Springer-Verlag, 346-359.
Solberg, B. O., Hofgaard, A., and Hytteborn, H., 2002: Shifts in radial growth responses of coastal Picea abies induced by climatic change during the 20th century, central Norway. Ecoscience, 9: 79-88.
Sonesson, M., Osborne, C., and Sandberg, G., 1994: Epiphytic lichens as indicators of snow depth. Arctic and Alpine Research, 26: 159-165.
Sprugel, D. G., 1991: Disturbance, equilibrium, and environmental variability-what is natural vegetation in a changing environment? Biological Conservation, 58: 1-18.
SPSS Inc., 1999: SPSS Advanced statistics 10.0. Chicago: SPSS Inc., 333 pp.
Steijlen, I., and Zackrisson, 0., 1987: Long-term regeneration dynamics and successional trends in a northern Swedish coniferous forest stand. Canadian Journal of Botany, 65: 839-848.
Stevens, G. C., and Fox, J. F., 1991: Causes of treeline. Annual Review of Ecology and Systematics, 22: 177-191.
Sveinbjornsson, B., 2000: North American and European treelines: External forces and internal processes controlling position. Ambio, 29: 388-395.
Sveinbjirnsson, B., Nordell, 0., and Kauhanen, H., 1992: Nutrient relations of mountain birch growth at and below the elevational tree- line in Swedish Lapland. Functional Ecology, 6: 213-220.
Sveinbjtrnsson, J., Hofgaard, A., and Lloyd, A., 2002: Natural causes of the tundra-taiga boundary. Ambio Special Report, 12: 23-29.
Tenow, 0., and Bylund, H., 2000: Recovery of a Betula pubescens forest in northern Sweden after severe defoliation by Epirrita autumnata. Journal of Vegetation Science, 11: 855-862.
ter Braak, C. J. F., and Smilauer, 0., 2002: CANOCO Reference Manual and CanoDraw for Windows User's guide: Software for Canonical Community Ordination (version 4.5). Ithaca, New York: Microcomputer Power, 500 pp.
Villalba, R., and Veblen, T. T., 1997: Regional patterns of tree population age structures in northern Patagonia: climatic and dis- turbance influences. Journal of Ecology, 85: 113-124.
Villalba, R., and Veblen, T. T., 1998: Influences of large-scale climatic variability on episodic tree mortality in northern Patagonia. Ecology, 79: 2624-2640.
Weih, M., and Karlsson, P. S., 2001: Growth response of mountain birch to air and soil temperature: is increasing leaf-nitrogen content an acclimation to lower air temperature? New Phytologist, 150: 147-155.
Weih, M., and Karlsson, P. S., 2002: Low winter and soil temperature affects summertime nutrient uptake capacity and growth rate of mountain birch seedlings in the subarctic, Swedish Lapland. Arctic, Antarctic, and Alpine Research, 34: 434-439.
Williams, M. W., Losleben, M. V., and Hamann, H. B., 2002: Alpine areas in the Colorado Front Range as monitors of climate change and ecosystem response. The Geographical Review, 92: 180-191.
Revised ms submitted December 2004
294 / ARCTIC, ANTARCTIC, AND ALPINE RESEARCH
This content downloaded from 195.78.108.107 on Mon, 16 Jun 2014 07:17:59 AMAll use subject to JSTOR Terms and Conditions
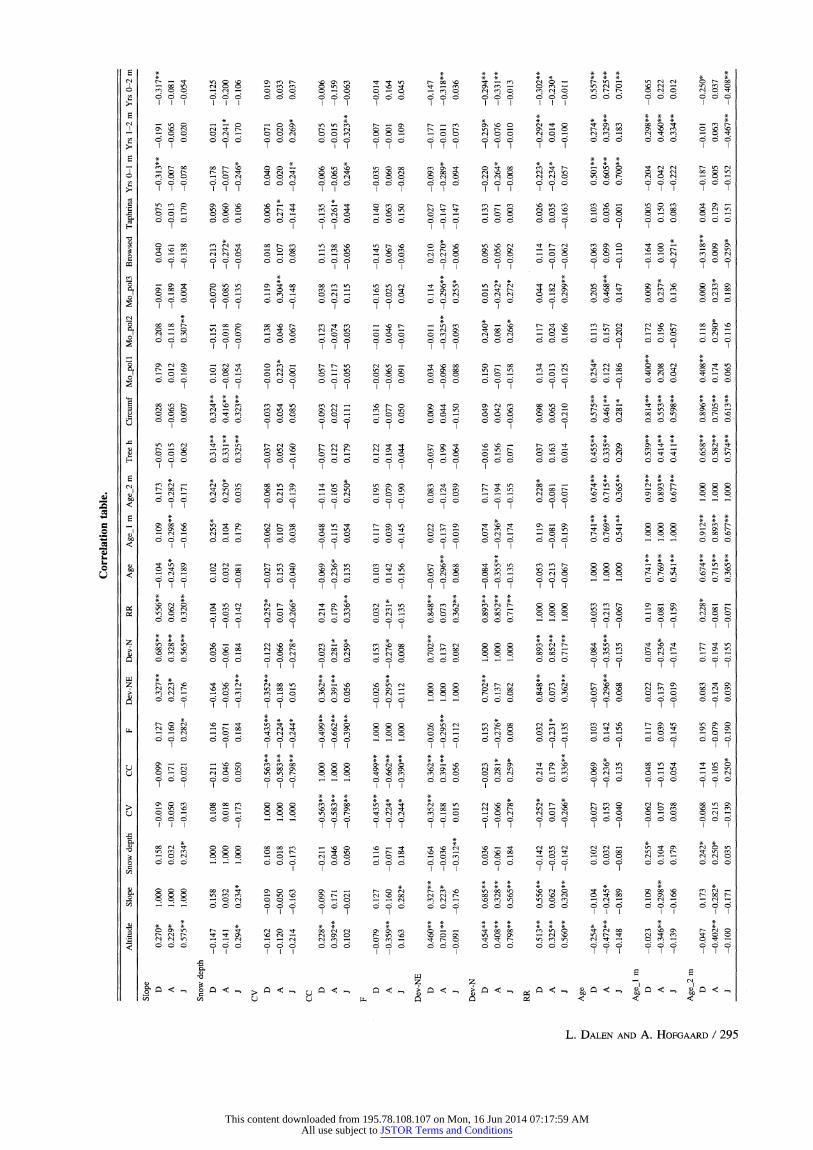
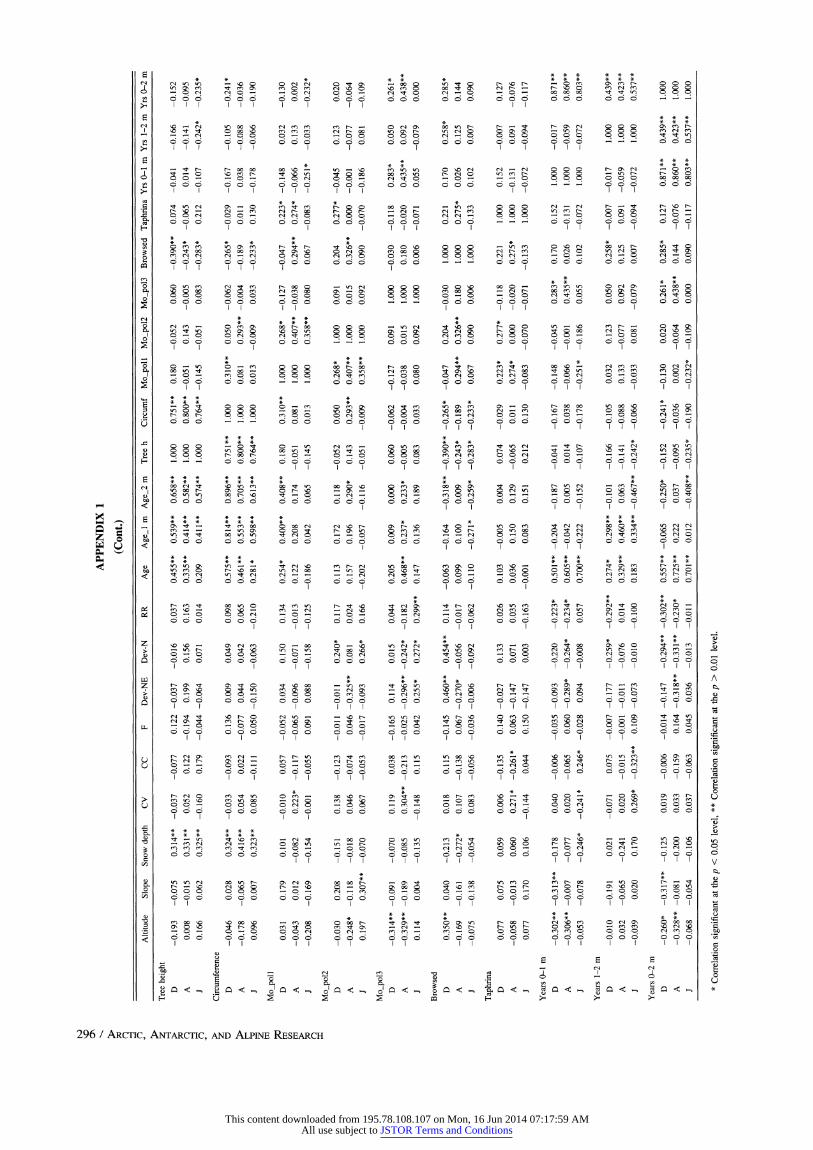
Correlation table.
Altitude Slope Snow depth CV CC F Dev-NE Dev-N RR Age Age_l m Age_2 m Tree h Circumf Mo_poll Mo_pol2 Mo_pol3 Browsed Taphrina Yrs 0-1 m Yrs 1-2 m Yrs 0-2 m
Slope D 0.270* 1.000 0.158 -0.019 -0.099 0.127 0.327** 0.685** 0.556** -0.104 0.109 0.173 -0.075 0.028 0.179 0.208 -0.091 0.040 0.075 -0.313** -0.191 -0.317"*
A 0.229* 1.000 0.032 -0.050 0.171 -0.160 0.223* 0.328** 0.062 -0.245* -0.298** -0.282* -0.015 -0.065 0.012 -0.118 -0.189 -0.161 -0.013 -0.007 -0.065 -0.081
J 0.575** 1.000 0.234* -0.163 -0.021 0.282* -0.176 0.565** 0.320** -0.189 -0.166 -0.171 0.062 0.007 -0.169 0.307** 0.004 -0.138 0.170 -0.078 0.020 -0.054
Snow depth D -0.147 0.158 1.000 0.108 -0.211 0.116 -0.164 0.036 -0.104 0.102 0.255* 0.242* 0.314** 0.324** 0.101 -0.151 -0.070 -0.213 0.059 -0.178 0.021 -0.125
A -0.141 0.032 1.000 0.018 0.046 -0.071 -0.036 -0.061 -0.035 0.032 0.104 0.250* 0.331** 0.416** -0.082 -0.018 -0.085 -0.272* 0.060 -0.077 -0.241" -0.200
J 0.294* 0.234* 1.000 -0.173 0.050 0.184 -0.312** 0.184 -0.142 -0.081 0.179 0.035 0.325** 0.323** -0.154 -0.070 -0.135 -0.054 0.106 -0.246* 0.170 -0.106
CV
D -0.162 -0.019 0.108 1.000 -0.563** -0.435** -0.352** -0.122 -0.252* -0.027 -0.062 -0.068 -0.037 -0.033 -0.010 0.138 0.119 0.018 0.006 0.040 -0.071 0.019 A -0.120 -0.050 0.018 1.000 -0.583** -0.224* -0.188 -0.066 0.017 0.153 0.107 0.215 0.052 0.054 0.223* 0.046 0.304** 0.107 0.271* 0.020 0.020 0.033 J -0.214 -0.163 -0.173 1.000 -0.798** -0.244* 0.015 -0.278* -0.266* -0.040 0.038 -0.139 -0.160 0.085 -0.001 0.067 -0.148 0.083 -0.144 -0.241" 0.269* 0.037
CC
D 0.228* -0.099 -0.211 -0.563** 1.000 -0.499** 0.362** -0.023 0.214 -0.069 -0.048 -0.114 -0.077 -0.093 0.057 -0.123 0.038 0.115 -0.135 -0.006 0.075 -0.006
A 0.392** 0.171 0.046 -0.583** 1.000 -0.662** 0.391** 0.281" 0.179 -0.236* -0.115 -0.105 0.122 0.022 -0.117 -0.074 -0.213 -0.138 -0.261" -0.065 -0.015 -0.159
J 0.102 -0.021 0.050 -0.798** 1.000 -0.390** 0.056 0.259* 0.336** 0.135 0.054 0.250* 0.179 -0.111 -0.055 -0.053 0.115 -0.056 0.044 0.246* -0.323** -0.063
F
D -0.079 0.127 0.116 -0.435** -0.499** 1.000 -0.026 0.153 0.032 0.103 0.117 0.195 0.122 0.136 -0.052 -0.011 -0.165 -0.145 0.140 -0.035 -0.007 -0.014
A -0.359** -0.160 -0.071 -0.224* -0.662** 1.000 -0.295** -0.276* -0.231* 0.142 0.039 -0.079 -0.194 -0.077 -0.065 0.046 -0.025 0.067 0.063 0.060 -0.001 0.164
J 0.163 0.282* 0.184 -0.244* -0.390** 1.000 -0.112 0.008 -0.135 -0.156 -0.145 -0.190 -0.044 0.050 0.091 -0.017 0.042 -0.036 0.150 -0.028 0.109 0.045
Dev-NE D 0.460** 0.327** -0.164 -0.352** 0.362** -0.026 1.000 0.702** 0.848** -0.057 0.022 0.083 -0.037 0.009 0.034 -0.011 0.114 0.210 -0.027 -0.093 -0.177 -0.147
A 0.701** 0.223* -0.036 -0.188 0.391** -0.295** 1.000 0.137 0.073 -0.296** -0.137 -0.124 0.199 0.044 -0.096 -0.325** -0.296** -0.270* -0.147 -0.289* -0.011 -0.318**
J -0.091 -0.176 -0.312** 0.015 0.056 -0.112 1.000 0.082 0.362** 0.068 -0.019 0.039 -0.064 -0.150 0.088 -0.093 0.255* -0.006 -0.147 0.094 -0.073 0.036
Dev-N D 0.454** 0.685** 0.036 -0.122 -0.023 0.153 0.702** 1.000 0.893** -0.084 0.074 0.177 -0.016 0.049 0.150 0.240* 0.015 0.095 0.133 -0.220 -0.259* -0.294**
A 0.408** 0.328** -0.061 -0.066 0.281* -0.276* 0.137 1.000 0.852** -0.355** -0.236* -0.194 0.156 0.042 -0.071 0.081 -0.242* -0.056 0.071 -0.264* -0.076 -0.331"* J 0.798** 0.565** 0.184 -0.278* 0.259* 0.008 0.082 1.000 0.717** -0.135 -0.174 -0.155 0.071 -0.063 -0.158 0.266* 0.272* -0.092 0.003 -0.008 -0.010 -0.013
RR D 0.513** 0.556** -0.142 -0.252* 0.214 0.032 0.848** 0.893** 1.000 -0.053 0.119 0.228* 0.037 0.098 0.134 0.117 0.044 0.114 0.026 -0.223* -0.292** -0.302** A 0.325** 0.062 -0.035 0.017 0.179 -0.231" 0.073 0.852** 1.000 -0.213 -0.081 -0.081 0.163 0.065 -0.013 0.024 -0.182 -0.017 0.035 -0.234* 0.014 -0.230* J 0.560** 0.320** -0.142 -0.266* 0.336** -0.135 0.362** 0.717** 1.000 -0.067 -0.159 -0.071 0.014 -0.210 -0.125 0.166 0.299** -0.062 -0.163 0.057 -0.100 -0.011
Age D -0.254* -0.104 0.102 -0.027 -0.069 0.103 -0.057 -0.084 -0.053 1.000 0.741** 0.674** 0.455** 0.575** 0.254* 0.113 0.205 -0.063 0.103 0.501** 0.274* 0.557**
A -0.472** -0.245* 0.032 0.153 -0.236* 0.142 -0.296** -0.355** -0.213 1.000 0.769** 0.715** 0.335** 0.461** 0.122 0.157 0.468** 0.099 0.036 0.605** 0.329** 0.725** J -0.148 -0.189 -0.081 -0.040 0.135 -0.156 0.068 -0.135 -0.067 1.000 0.541** 0.365** 0.209 0.281* -0.186 -0.202 0.147 -0.110 -0.001 0.700** 0.183 0.701"*
Age_l m D -0.023 0.109 0.255* -0.062 -0.048 0.117 0.022 0.074 0.119 0.741** 1.000 0.912** 0.539** 0.814** 0.400** 0.172 0.009 -0.164 -0.005 -0.204 0.298** -0.065 A -0.346** -0.298** 0.104 0.107 -0.115 0.039 -0.137 -0.236* -0.081 0.769** 1.000 0.893** 0.414** 0.553** 0.208 0.196 0.237* 0.100 0.150 -0.042 0.460** 0.222 J -0.139 -0.166 0.179 0.038 0.054 -0.145 -0.019 -0.174 -0.159 0.541** 1.000 0.677** 0.411** 0.598** 0.042 -0.057 0.136 -0.271" 0.083 -0.222 0.334** 0.012
Age_2 m D -0.047 0.173 0.242* -0.068 -0.114 0.195 0.083 0.177 0.228* 0.674** 0.912** 1.000 0.658** 0.896** 0.408** 0.118 0.000 -0.318** 0.004 -0.187 -0.101 -0.250* A -0.402** -0.282* 0.250* 0.215 -0.105 -0.079 -0.124 -0.194 -0.081 0.715** 0.893** 1.000 0.582** 0.705** 0.174 0.290* 0.233* 0.009 0.129 0.005 0.063 0.037 J -0.100 -0.171 0.035 -0.139 0.250* -0.190 0.039 -0.155 -0.071 0.365** 0.677** 1.000 0.574** 0.613** 0.065 -0.116 0.189 -0.259* 0.151 -0.152 -0.467** -0.408**
110
t-
z
> t"~ t'l
This content downloaded from 195.78.108.107 on Mon, 16 Jun 2014 07:17:59 AMAll use subject to JSTOR Terms and Conditions
)8 -0.015 0.331"* 0.052 0.122 -0.194 0.199 0.156 0.163 0.335** 0.414"* 0.582** 1.000 0.800** -0.051 0.143 -0.005 -0.243* -0.065 0.014 -0.141 -0.095
56 0.062 0.325** -0.160 0.179 -0.044 -0.064 0.071 0.014 0.209 0.411** 0.574** 1.000 0.764** -0.145 -0.051 0.083 -0.283* 0.212 -0.107 -0.242* -0.235*
16 0.028 0.324** -0.033 -0.093 0.136 0.009 0.049 0.098 0.575** 0.814** 0.896** 0.751** 1.000 0.310** 0.050 -0.062 -0.265* -0.029 -0.167 -0.105 -0.241*
78 -0.065 0.416** 0.054 0.022 -0.077 0.044 0.042 0.065 0.461** 0.553** 0.705** 0.800** 1.000 0.081 0.293** -0.004 -0.189 0.011 0.038 -0.088 -0.036
)6 0.007 0.323** 0.085 -0.111 0.050 -0.150 -0.063 -0.210 0.281* 0.598** 0.613** 0.764** 1.000 0.013 -0.009 0.033 -0.233* 0.130 -0.178 -0.066 -0.190
I1 0.179 0.101 -0.010 0.057 -0.052 0.034 0.150 0.134 0.254* 0.400** 0.408** 0.180 0.310** 1.000 0.268* -0.127 -0.047 0.223* -0.148 0.032 -0.130
43 0.012 -0.082 0.223* -0.117 -0.065 -0.096 -0.071 -0.013 0.122 0.208 0.174 -0.051 0.081 1.000 0.407** -0.038 0.294** 0.274* -0.066 0.133 0.002
)8 -0.169 -0.154 -0.001 -0.055 0.091 0.088 -0.158 -0.125 -0.186 0.042 0.065 -0.145 0.013 1.000 0.358** 0.080 0.067 -0.083 -0.251* -0.033 -0.232*
10 0.208 -0.151 0.138 -0.123 -0.011 -0.011 0.240* 0.117 0.113 0.172 0.118 -0.052 0.050 0.268* 1.000 0.091 0.204 0.277* -0.045 0.123 0.020
18* -0.118 -0.018 0.046 -0.074 0.046 -0.325** 0.081 0.024 0.157 0.196 0.290* 0.143 0.293** 0.407** 1.000 0.015 0.326** 0.000 -0.001 -0.077 -0.064 17 0.307** -0.070 0.067 -0.053 -0.017 -0.093 0.266* 0.166 -0.202 -0.057 -0.116 -0.051 -0.009 0.358** 1.000 0.092 0.090 -0.070 -0.186 0.081 -0.109
14** -0.091 -0.070 0.119 0.038 -0.165 0.114 0.015 0.044 0.205 0.009 0.000 0.060 -0.062 -0.127 0.091 1.000 -0.030 -0.118 0.283* 0.050 0.261"
!9** -0.189 -0.085 0.304** -0.213 -0.025 -0.296** -0.242* -0.182 0.468** 0.237* 0.233* -0.005 -0.004 -0.038 0.015 1.000 0.180 -0.020 0.435** 0.092 0.438**
14 0.004 -0.135 -0.148 0.115 0.042 0.255* 0.272* 0.299** 0.147 0.136 0.189 0.083 0.033 0.080 0.092 1.000 0.006 -0.071 0.055 -0.079 0.000
O0** 0.040 -0.213 0.018 0.115 -0.145 0.460** 0.454** 0.114 -0.063 -0.164 -0.318** -0.390** -0.265* -0.047 0.204 -0.030 1.000 0.221 0.170 0.258* 0.285*
i9 -0.161 -0.272* 0.107 -0.138 0.067 -0.270* -0.056 -0.017 0.099 0.100 0.009 -0.243* -0.189 0.294** 0.326** 0.180 1.000 0.275* 0.026 0.125 0.144
75 -0.138 -0.054 0.083 -0.056 -0.036 -0.006 -0.092 -0.062 -0.110 -0.271* -0.259* -0.283* -0.233* 0.067 0.090 0.006 1.000 -0.133 0.102 0.007 0.090
77 0.075 0.059 0.006 -0.135 0.140 -0.027 0.133 0.026 0.103 -0.005 0.004 0.074 -0.029 0.223* 0.277* -0.118 0.221 1.000 0.152 -0.007 0.127
58 -0.013 0.060 0.271* -0.261* 0.063 -0.147 0.071 0.035 0.036 0.150 0.129 -0.065 0.011 0.274* 0.000 -0.020 0.275* 1.000 -0.131 0.091 -0.076
77 0.170 0.106 -0.144 0.044 0.150 -0.147 0.003 -0.163 -0.001 0.083 0.151 0.212 0.130 -0.083 -0.070 -0.071 -0.133 1.000 -0.072 -0.094 -0.117
)2** -0.313** -0.178 0.040 -0.006 -0.035 -0.093 -0.220 -0.223* 0.501"** -0.204 -0.187 -0.041 -0.167 -0.148 -0.045 0.283* 0.170 0.152 1.000 -0.017 0.871**
)6** -0.007 -0.077 0.020 -0.065 0.060 -0.289* -0.264* -0.234* 0.605** -0.042 0.005 0.014 0.038 -0.066 -0.001 0.435** 0.026 -0.131 1.000 -0.059 0.860**
53 -0.078 -0.246* -0.241* 0.246* -0.028 0.094 -0.008 0.057 0.700** -0.222 -0.152 -0.107 -0.178 -0.251* -0.186 0.055 0.102 -0.072 1.000 -0.072 0.803**
10 -0.191 0.021 -0.071 0.075 -0.007 -0.177 -0.259* -0.292** 0.274* 0.298** -0.101 -0.166 -0.105 0.032 0.123 0.050 0.258* -0.007 -0.017 1.000 0.439**
32 -0.065 -0.241 0.020 -0.015 -0.001 -0.011 -0.076 0.014 0.329** 0.460** 0.063 -0.141 -0.088 0.133 -0.077 0.092 0.125 0.091 -0.059 1.000 0.423**
39 0.020 0.170 0.269* -0.323** 0.109 -0.073 -0.010 -0.100 0.183 0.334** -0.467** -0.242* -0.066 -0.033 0.081 -0.079 0.007 -0.094 -0.072 1.000 0.537**
50* -0.317** -0.125 0.019 -0.006 -0.014 -0.147 -0.294** -0.302** 0.557** -0.065 -0.250* -0.152 -0.241" -0.130 0.020 0.261" 0.285* 0.127 0.871** 0.439** 1.000
28** -0.081 -0.200 0.033 -0.159 0.164 -0.318** -0.331** -0.230* 0.725** 0.222 0.037 -0.095 -0.036 0.002 -0.064 0.438** 0.144 -0.076 0.860** 0.423** 1.000
58 -0.054 -0.106 0.037 -0.063 0.045 0.036 -0.013 -0.011 0.701** 0.012 -0.408** -0.235* -0.190 -0.232* -0.109 0.000 0.090 -0.117 0.803** 0.537** 1.000
nificant at the p < 0.05 level, ** Correlation significant at the p > 0.01 level.
-0 0 0
nce -0 -0
0
0 -0 -0
-0 -0
0
-0 -0
0.
This content downloaded from 195.78.108.107 on Mon, 16 Jun 2014 07:17:59 AMAll use subject to JSTOR Terms and Conditions