Embed Size (px)
Citation preview

1
Differentiated audio-tactile correspondences in sighted and blind individuals
Ophelia Deroy1, Irène Fasiello2, Vincent Hayward2, & Malika Auvray2
Affiliations 1. Centre for the Study of the Senses, School of Advanced Study, University of London,Senate House, Malet Street, WC1E 7HU London, UK. 2. Sorbonne Universités, UPMC Univ Paris 06, UMR 7222, ISIR, F-75005, Paris, France
Running head: Audio-tactile crossmodal correspondences
Corresponding author Ophelia Deroy Centre for the study of the senses, School of Advanced Study, University of London Senate House, Malet Street, London WC1E 7HU United Kingdom E-mail: [email protected]
Number of figures: 6 Number of tables: 1
Manuscript
Journal of Experimental Psychology: Human Perception and Performance. 42(8):1204-1214, 2016
2
I. Introduction
We commonly use vertical elevation to refer to auditory variations: Increases in perceived pitch are experienced and reported as ‘rising’, while decreases in pitch are considered to ‘descend’ or to ‘fall’. This spatial mapping does not strictly depend on language (Doldsheid et al., 2012; Parkinson et al., 2012) and can affect experience and behaviour in a consistent way, from the perception of sound location (Pratt, 1930; Roffler & Butler, 1968), speeded discrimination experiments (Ben-Artzi & Marks, 1995; Bernstein & Edelstein, 1971; Melara & O’Brien, 1987) and audio-visual interactions (Parise & Spence, 2008, 2009) to the orientation of attention and the perception of ambiguous visual movements (Maeda et al., 2004). In most cases, the spatial mapping of pitch has been assessed in reference to the location of visual targets or the direction of visual movement (see Occelli et al., 2009, for an exception and a review). In stimulus-response compatibility effects in which participants are shown to be faster at responding to a high pitch sound with the upper key rather than the lower one (Rusconi et al., 2006), vision might also play a role as participants can perceive or imagine the visual organisation of the two response buttons. In the study reported here, we investigated whether the spatial mapping of pitch was intimately tied to vision. Would the perception of a change of pitch interfere with the tactile direction of movement experienced at one’s fingertips, as it does with the visual direction of movement? If the tendency to match or map pitch and gestures seem to be grounded in musical practices, the learning of a similar correspondence between pitch and passive movement, if any, would seem less easy to explain. What’s more, given the many differences in auditory, tactile, and audio-tactile perception which are introduced by visual experience (see Heller & Gentaz, 2013; Hötting & Röder, 2009 for reviews), the existence of a correspondence between pitch and tactile movement should be assessed both in blind and sighted individuals.
Besides its intrinsic interest, evidencing a correspondence between pitch and tactile movement (Deroy & Spence, 2013; Spence, 2011) could help differentiate between the different hypotheses offered to explain the pitch-elevation correspondence documented through audio-visual paradigms. According to the spatial theory of magnitude, differences in pitch are represented as ‘high’ or ‘low’ in an amodal mental space, like differences in brightness or numerical quantities (Rusconi et al., 2005, 2006; see also Gevers et al., 2003; Kadosh et al., 2008 for discussion). If this is indeed the case, we would expect pitch to be commonly represented in a similar spatial way, independently of the modality used to evidence this representation. By contrast, if the mapping between pitch and movement is primarily learned through audio-visual associations, it may differ once tested in the tactile modality. Parise et al. (2014) have recently showed that the natural statistics of sounds were compatible with high-pitched sounds coming from higher in space, and low-pitched sounds from lower in space. It might therefore be the case that when we hear high-pitched sounds, we associate them to the higher sources of the sounds we look at, and vice-versa for low-pitched sounds. In this case, vision would be necessary for spatial mapping to-be-learned, and we would not expect to find a similar mapping in congenitally blind individuals. More generally, the lack of a correspondence between changes in pitch and direction of tactile movements would reinforce the idea that vision plays a role in the acquisition of the correspondence, as posited by other hypotheses (e.g. Deroy et al., 2013). According to the transitivity hypotheses, other regular associations between sounds and visual objects can explain the pitch-elevation correspondence. For instance, an increased distance in the vertical (or even horizontal) direction correlates with a decrease in visual size: the further or the higher an object gets, the smaller it becomes. Another environmental regularity is that the smaller an object becomes, the higher the pitch it emits
Journal of Experimental Psychology: Human Perception and Performance. 42(8):1204-1214, 2016

3
(Evans & Treisman, 2010; Fernández-Prieto et al., 2015). The transitivity of associative learning from higher in space to smaller in size and from smaller in size to higher in pitch could then explain how the correspondence between higher in space and higher in pitch is formed through regularities and transitive learning (Spence & Deroy, 2012). Crucially, the mediation of a change in size can only be provided by vision: A change in localisation on one’s body is not associated to a change in size, which seems to block the transition via ‘getting smaller’. A specific prediction of the transitive hypothesis therefore is that the correspondence between movement and change in pitch should not exist in congenitally blind individuals. The experiments conducted here were designed to test for the existence of an audio-tactile correspondence between pitch and tactile movements, similar to the well documented audio-visual correspondence between pitch and visual movements. Further experiments tested whether the correspondence could depend on bodily position and on visual experience. The broader goal was to understand the mapping between pitch and elevation. Given the importance of attention in crossmodal congruency effects (see Spence & Deroy, 2013 for review), two different methods were used to investigate the existence of an audio-tactile correspondence between tactile movements felt on one’s finger and changes in pitch. These two methods focus on different attentional processing levels, one that occurs at early stages and the other at later ones, during response selection. The first method, used in many studies (e.g. Evans & Treisman, 2010; Ludwig et al., 2011; see Marks, 2004 and Spence, 2011 for reviews), uses a speeded classification paradigm. Participants are presented with two different stimuli in different sensory modalities, and are asked to respond to one type of stimulus (for instance, high or low visual targets) while ignoring the stimulus presented in another sensory modality (for instance, high or low pitched sounds). The prediction is that participants will be faster to respond to the attended feature when the unattended feature is congruent with it. In other words, the prediction is that people find it harder (i.e., they are slower) to classify a target stimulus presented in one sensory modality (e.g., audition) when the distractor stimulus presented in a task-irrelevant modality (e.g., touch) varies along a dimension that shares a relation of correspondence with the target dimension (an effect which has similarities with the crossmodal Stroop test, e.g. Cowan & Barron, 1997; MacLeod, 1991; Walker & Smith, 1994). A second method, which has more recently been tested, builds on the Implicit Association Test (IAT) which is meant to measure participants’ automatic associations. In this task, participants are required to rapidly categorize two kinds of target stimuli whose values are associated to two response buttons, in both a congruent and an incongruent way. For instance, in the first IAT (see Greenwald et al., 1998; see Glashouwer et al., 2013, Teige-Mocigemba et al., 2010, for reviews) targeting the implicit association between skin colour and valence, participants would be asked to respond to either positive words or names typical of white people with the same response key (predicted to be a congruent combination) and then asked to respond either to positive words or to names typical of black people on the same response key (predicted to be an incongruent combination). The difference in response time between the congruent and incongruent conditions reveals the strength of the implicit association. Variants of the IAT have been successfully adapted to proposed to non-social stimuli and used to test crossmodal correspondences between odours and touch (Dematte et al., 2007), audition and touch (Occelli et al., 2009), taste and pitch (Crisinel & Spence, 2010) and audition and vision (Parise & Spence, 2012). The task always requires sorting four kinds of stimuli using only two response buttons, each of which refers to two of the four stimuli. For instance, for a IAT testing pitch and size, participants have to respond to high or low pitch, and large or small visual targets by pressing one of two keys, associated to either congruent (high-small, low-big) or incongruent combinations (high-big, low-small). The prediction is that people find it easier (i.e. are overall
Journal of Experimental Psychology: Human Perception and Performance. 42(8):1204-1214, 2016
4
faster) when the two stimuli that share a response are strongly associated than when they are weakly associated. The two methods were tested in our study in order to determine whether they would give the same results for the tactile and auditory features that were selected. In the first experiment, participants had to respond to either tactile or auditory stimuli, while ignoring the simultaneous presentation of congruent or incongruent stimuli in the other sensory modality. In the second experiment, participants had to respond to either a tactile or an auditory feature presented one after the other in blocks and with congruent or incongruent responses that were associated to the same response key. In a third experiment, we tested whether the audio-tactile correspondence would depend on the hand position, and thereby if it took place within a hand-centred frame of reference. To do so, the participants completed the experiment with the arm placed in two directions: in the vertical and horizontal planes. Finally, in order to investigate the role of vision, a fourth experiment looked at the existence of audio-tactile crossmodal correspondences in early and late blind participants. II. Experiment 1. Speeded classification protocol A first experiment looked for a crossmodal congruency effect between pitch and tactile movements by means of a speeded classification paradigm. Participants had to categorize auditory stimuli while ignoring simultaneously presented tactile stimuli and vice-versa.
II.1. Methods Participants Sixteen sighted participants (eleven men and five women) took part in this experiment1. Their ages ranged from nineteen to fourty years (mean: twenty nine years). All of the participants were naive to the purpose of the experiment and reported normal auditory and tactile perception. They received six euros in return for their participation. The experiment took approximately fourty-five minutes to complete. The four experiments reported in this article were performed in accordance with the ethical standards laid down in the 1991 declaration of Helsinki. Apparatus and stimuli The tactile stimuli were delivered by a distributed tactile stimulator (Latero, Wang & Hayward, 2010) from Tactile Lab Inc. This device induces lateral tractions on the skin’s surface by means of a matrix of miniature piezoelectric bending actuators (64 actuators in an 8 by 8 matrix). The active area of the tactile display is 1.0 cm2. The Latero was controlled by a 3.40GHz i7 2600 PC equipped with a dedicated Ethernet interface running under the User Datagram Protocol (UDP). The software ran in the Xenomai Real-Time Framework on Linux (Ubuntu), guaranteeing a stable rate for the control loop at high frequency. The refresh rate of the display was 1 kHz. Both the tactile and auditory stimuli were run from the same computer.
1 Note that two participants performed at chance level in the unimodal tactile baseline condition, which means that they were not able, owing to the novelty of the task, to discriminate the tactile stimuli. These participants did not complete the rest of the experiment and were not counted among the participants reported here. Similar inabilities to discriminate tactile stimuli were found in the subsequent experiments, thus two participants were excluded from Experiment 2, five participants were excluded from Experiment 3, none in Experiment 4.
Journal of Experimental Psychology: Human Perception and Performance. 42(8):1204-1214, 2016

5
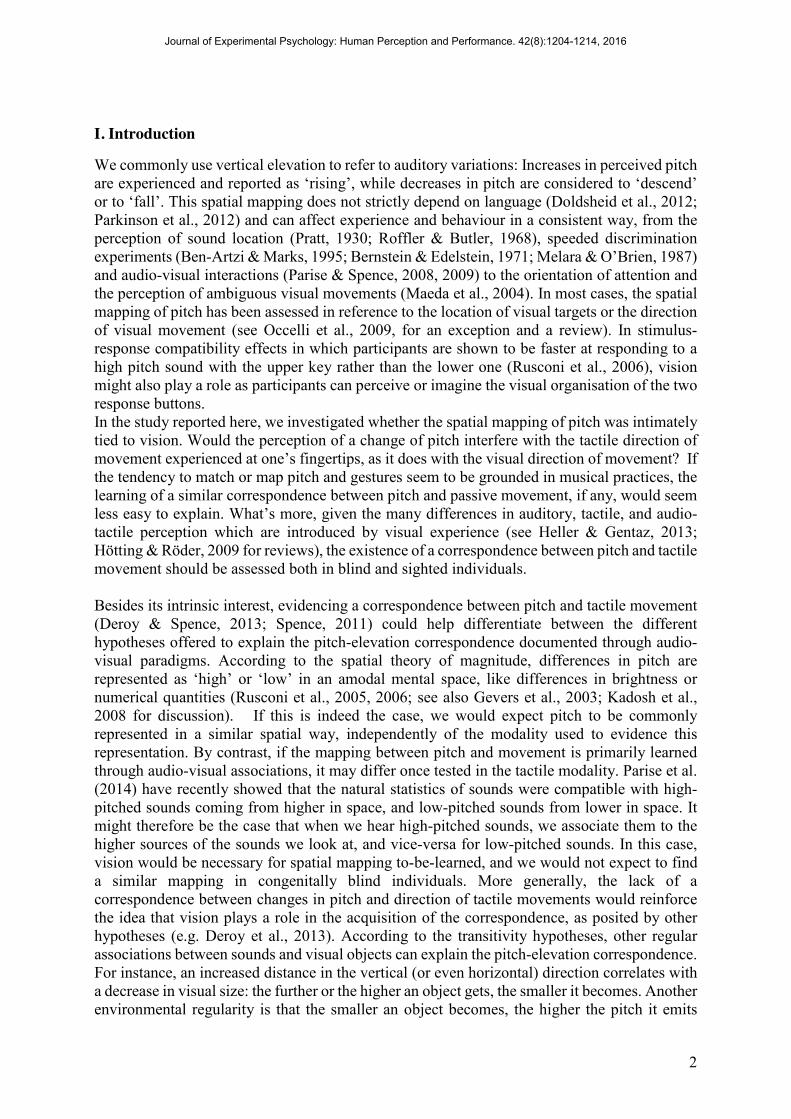
For the tactile stimuli, a virtual bar was simulated by the tactile display by locally inducing oscillatory strains in the skin of the fingertip at a rate of 80 Hz. The simulated bar was orthogonal to the finger’s principal axis (see Figure 1). To minimize positional cues at the start of the stimulation, the tactile stimuli started from the central rows of the 9.6 mm long matrix, and then moved either toward the tip of the finger or toward the palm. From now on, we refer to these movements as outward and inward movements respectively. The stimulus duration was 250 ms, thus giving rise to a bar moving at a speed of 19.2 mm/s. The neutral stimulation consisted in a random activation of the four central rows of the tactile matrix. The auditory stimuli were presented through a loudspeaker which was located just behind the tactile display in order to ensure a spatial coincidence between tactile and auditory stimuli. The stimuli consisted in three pure tones of linearly increasing (700 to 1200 Hz), linearly decreasing (700 to 200 Hz), or constant (700 Hz) pitch. The duration of each of the auditory stimuli was 250 ms.
FIGURE 1 ABOUT HERE
Procedure The experiment was run in a dark, anechoic chamber. The participants sat in front of a table which also supported the tactile device and the loudspeaker, located approximately twenty five cm from the participant. Participants completed two main sessions, one where they had to respond to the tactile stimuli, and one where they had to respond to the auditory ones. The order of presentation of these sessions was counterbalanced across participants. Each session was made of a block of training trials, followed by a unimodal block of trials, then a bimodal block of trials.
During the training block, participants learned the mapping between the stimuli and the relevant response keys. They were required to press the left or right button of the mouse in order to listen to the associated auditory stimulus (during the auditory session) or to experience the tactile stimulation (during the tactile session). In all blocks, the mouse buttons were therefore orthogonal to the direction of tactile movement. During this training, only unimodal stimuli were presented, and no verbal label was assigned to them. The stimuli were prompted by the participant: For instance, the participant heard a sound increasing in pitch when pressing the right button of the mouse and a sound decreasing in pitch when pressing the left button of the mouse (and vice versa for half of the participants). Similarly, during the auditory session, the participant had to place either his index or major finger on the tactile display (choosing the one he felt the most comfortable with). He would experience an inward or outward tactile direction of movement when pressing the right or the left key of the mouse. Participants were encouraged to listen to the auditory and experience the tactile stimuli until they were sure that they had learnt the mapping. They were first given twenty practice trials. Those participants who felt they had not learnt the stimulus-response mapping were given additional trials until they reported the mapping without errors. Following a successful practice block, participants underwent one unimodal block of trials. As in the training block, only two kinds of tactile and auditory stimuli were used: inward or outward tactile stimulation (during the tactile session) and sounds of increasing or decreasing pitch (during the auditory session). Each stimulus was presented ten times, resulting in a total of twenty unimodal trials for each modality (and fourty for the two modalities).
Journal of Experimental Psychology: Human Perception and Performance. 42(8):1204-1214, 2016
6
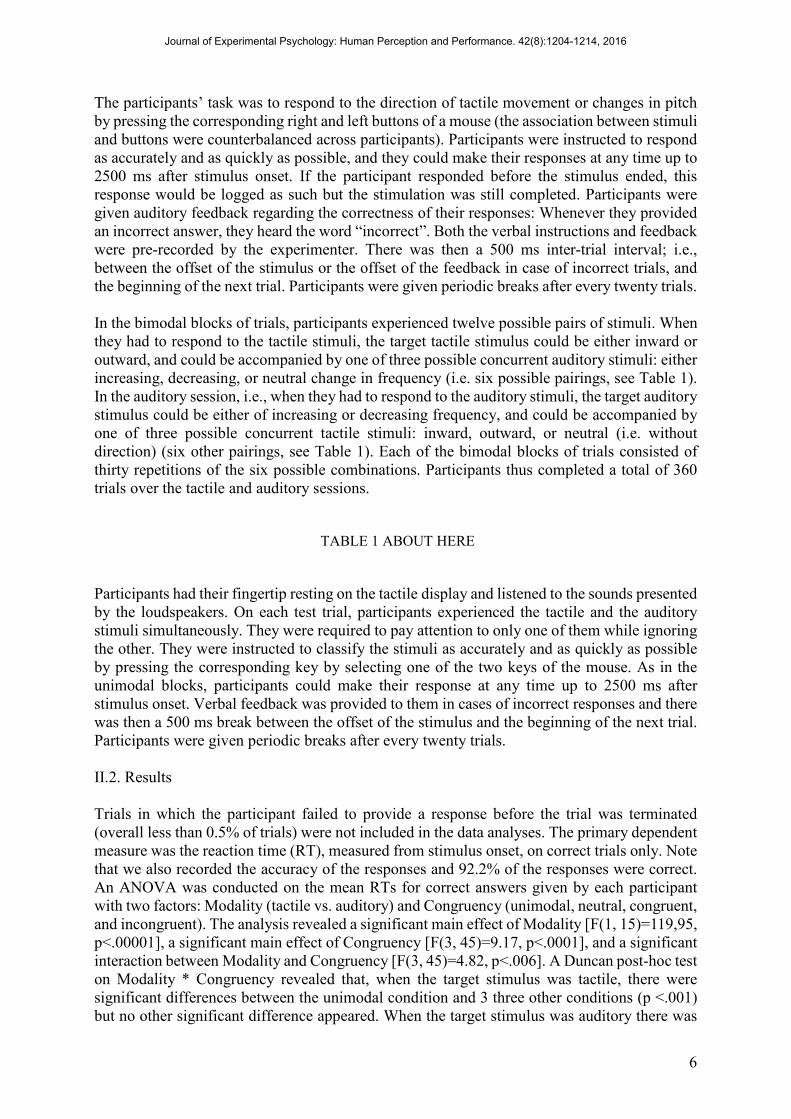
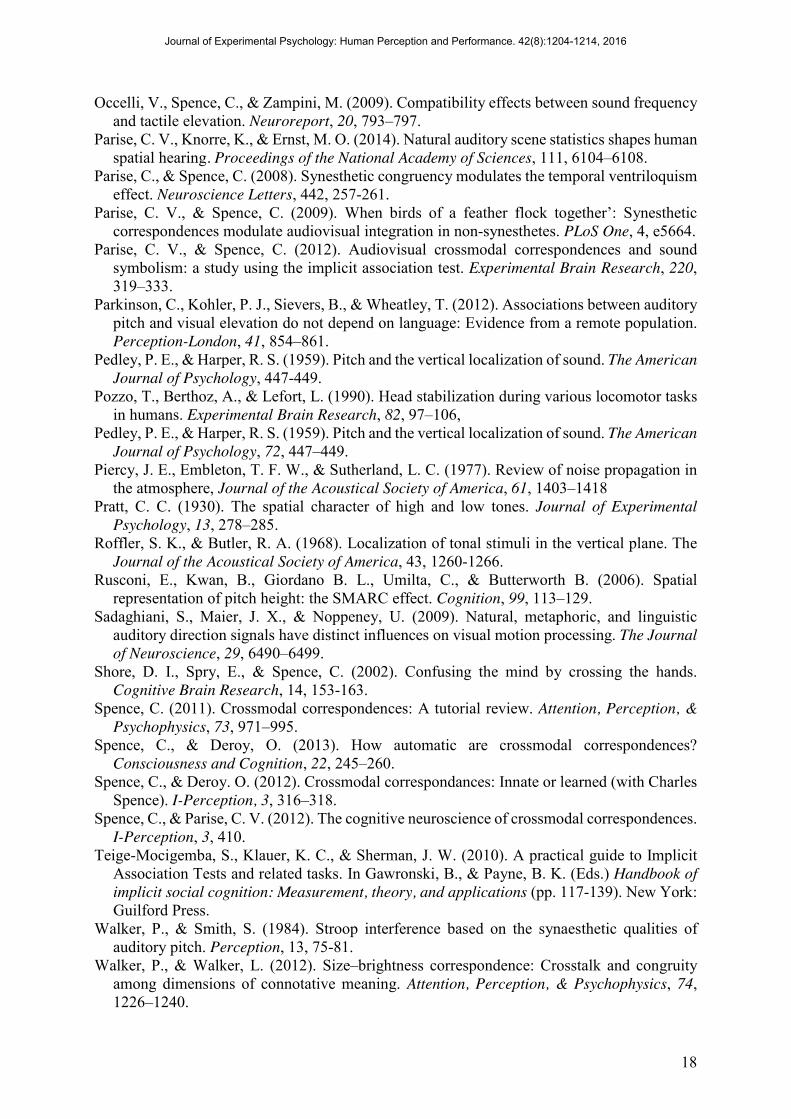
The participants’ task was to respond to the direction of tactile movement or changes in pitch by pressing the corresponding right and left buttons of a mouse (the association between stimuli and buttons were counterbalanced across participants). Participants were instructed to respond as accurately and as quickly as possible, and they could make their responses at any time up to 2500 ms after stimulus onset. If the participant responded before the stimulus ended, this response would be logged as such but the stimulation was still completed. Participants were given auditory feedback regarding the correctness of their responses: Whenever they provided an incorrect answer, they heard the word “incorrect”. Both the verbal instructions and feedback were pre-recorded by the experimenter. There was then a 500 ms inter-trial interval; i.e., between the offset of the stimulus or the offset of the feedback in case of incorrect trials, and the beginning of the next trial. Participants were given periodic breaks after every twenty trials. In the bimodal blocks of trials, participants experienced twelve possible pairs of stimuli. When they had to respond to the tactile stimuli, the target tactile stimulus could be either inward or outward, and could be accompanied by one of three possible concurrent auditory stimuli: either increasing, decreasing, or neutral change in frequency (i.e. six possible pairings, see Table 1). In the auditory session, i.e., when they had to respond to the auditory stimuli, the target auditory stimulus could be either of increasing or decreasing frequency, and could be accompanied by one of three possible concurrent tactile stimuli: inward, outward, or neutral (i.e. without direction) (six other pairings, see Table 1). Each of the bimodal blocks of trials consisted of thirty repetitions of the six possible combinations. Participants thus completed a total of 360 trials over the tactile and auditory sessions.
TABLE 1 ABOUT HERE
Participants had their fingertip resting on the tactile display and listened to the sounds presented by the loudspeakers. On each test trial, participants experienced the tactile and the auditory stimuli simultaneously. They were required to pay attention to only one of them while ignoring the other. They were instructed to classify the stimuli as accurately and as quickly as possible by pressing the corresponding key by selecting one of the two keys of the mouse. As in the unimodal blocks, participants could make their response at any time up to 2500 ms after stimulus onset. Verbal feedback was provided to them in cases of incorrect responses and there was then a 500 ms break between the offset of the stimulus and the beginning of the next trial. Participants were given periodic breaks after every twenty trials. II.2. Results Trials in which the participant failed to provide a response before the trial was terminated (overall less than 0.5% of trials) were not included in the data analyses. The primary dependent measure was the reaction time (RT), measured from stimulus onset, on correct trials only. Note that we also recorded the accuracy of the responses and 92.2% of the responses were correct. An ANOVA was conducted on the mean RTs for correct answers given by each participant with two factors: Modality (tactile vs. auditory) and Congruency (unimodal, neutral, congruent, and incongruent). The analysis revealed a significant main effect of Modality [F(1, 15)=119,95, p<.00001], a significant main effect of Congruency [F(3, 45)=9.17, p<.0001], and a significant interaction between Modality and Congruency [F(3, 45)=4.82, p<.006]. A Duncan post-hoc test on Modality * Congruency revealed that, when the target stimulus was tactile, there were significant differences between the unimodal condition and 3 three other conditions (p <.001) but no other significant difference appeared. When the target stimulus was auditory there was
Journal of Experimental Psychology: Human Perception and Performance. 42(8):1204-1214, 2016

7
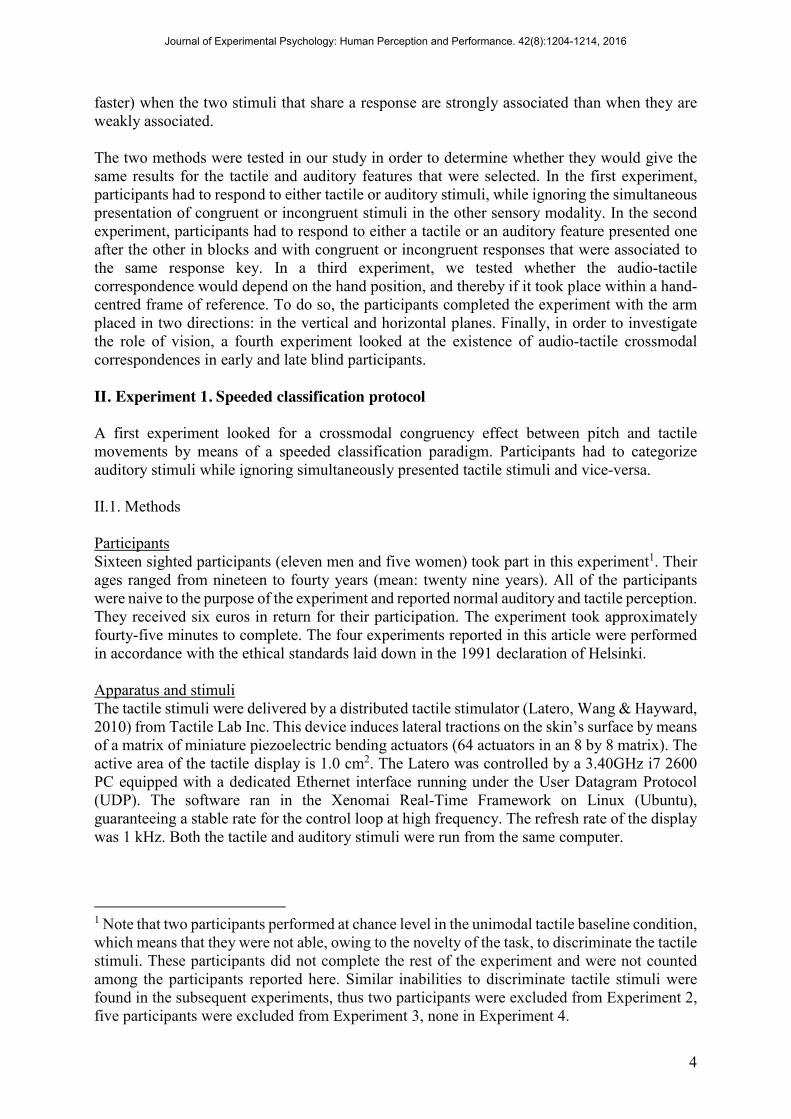
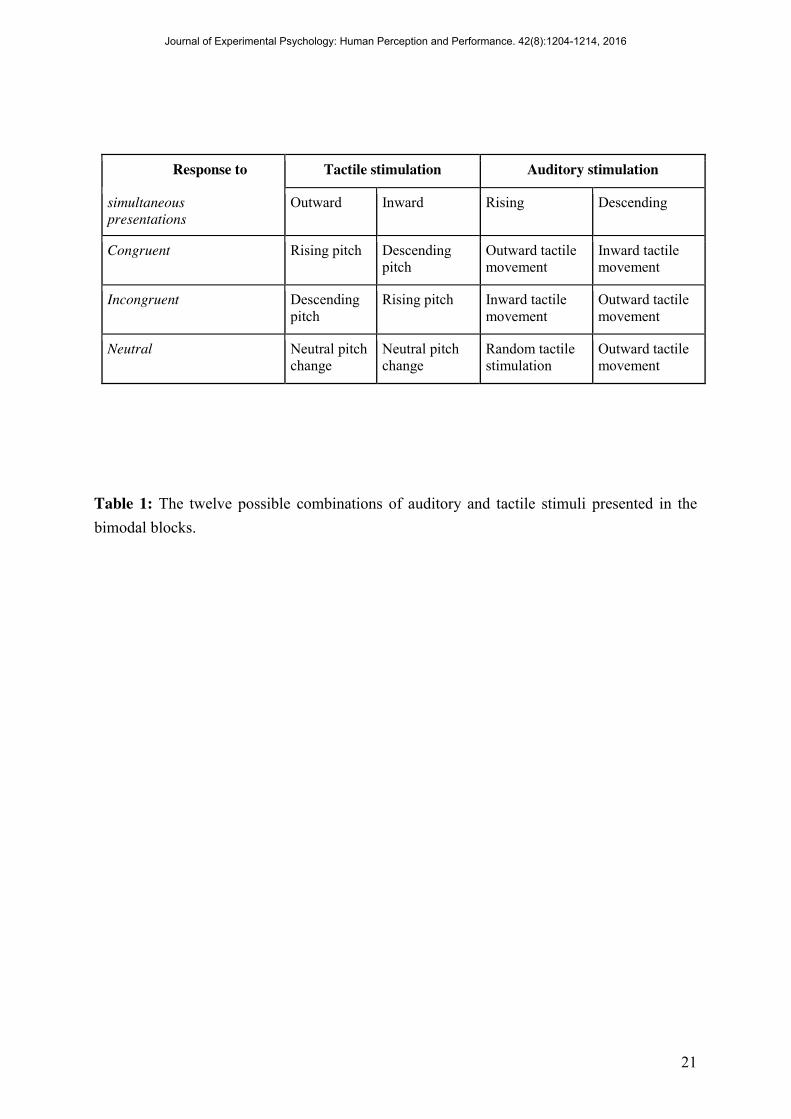
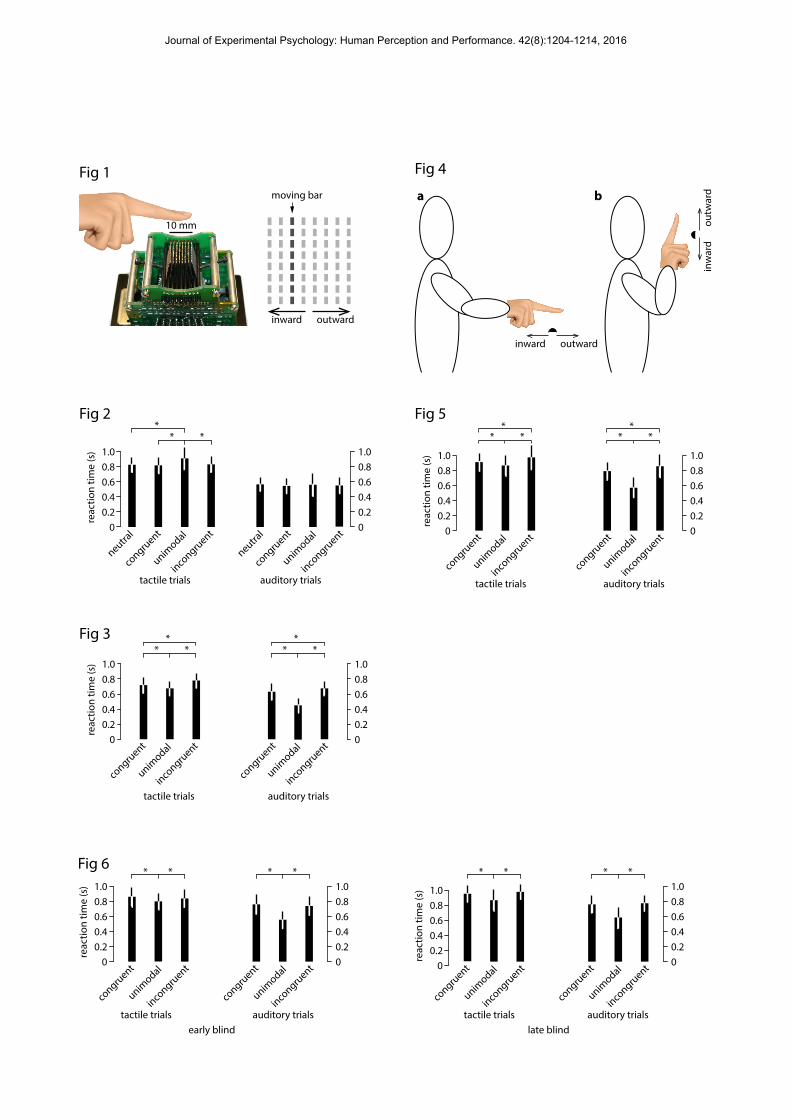
no significant difference between the levels of the congruency factor. Participants were faster overall in the auditory conditions (mean: 54. 87 ± SD of 7.63 ms) compared with the tactile (mean: 83.06 ± 10.47 ms) condition. To summarize the results, a significant difference between the unimodal and the bimodal sessions was evidenced, but the difference between the congruent and the incongruent conditions did not reach significance either for the tactile or the auditory condition. In other words, this experiment failed to reveal a crossmodal congruency effect (see Figure 2).
FIGURE 2 ABOUT HERE II.3. Interim discussion The results did not reveal a congruency effect between direction of pitch and direction of tactile movement although the method used here was similar to other studies which obtained positive congruency effects between direction of pitch and visual movement (Evans & Treisman, 2010). One problem with the joint presentation of stimuli though comes from a lack of control of selective attention. Indeed, nothing guarantees that participants’ attention was focused on the targeted sensory modality only, and that the results do not reflect a failure of selective attention (e.g. Parise & Spence, 2012, for a discussion; see also Melara & O’Brien, 1987). As no significant difference between tones of increasing or decreasing frequency was observed when participants were asked to respond to touch, we can infer that participants did not merely base their answers on the perceived direction of pitch. The second experiment, resting on the successive presentation of stimuli and relying on their association with different response buttons, offers an alternative way to control for the role of attention. III. Experiment 2. Implicit association task The second experiment investigated the crossmodal correspondence between auditory changes in pitch and tactile direction of movement by means of an implicit association test. Participants were presented with either a sound or a tactile stimulus and they had to categorize the stimulation (ascending versus descending pitch, inward versus outward tactile direction). They first had to learn the association between the four possible stimuli and the two response buttons that could be either congruent (i.e., the same button for increasing pitch and outward direction of movement, the other one for decreasing pitch and inward tactile direction of movement) or incongruent (the same button for increasing pitch and inward tactile direction of movement; the other one for decreasing pitch and outward tactile direction of movement). If there is a crossmodal correspondence between pitch and tactile direction of movement, participants are expected to be more accurate and faster in the congruent condition than in the incongruent one. III.1. Methods Participants Fourteen sighted participants (seven men and seven women) took part in this experiment. Their ages ranged from twenty to thirty-two years (mean: twenty six years). All the participants were naive to the purpose of the experiment and reported normal auditory and tactile perception. They received twelve euros in return for their participation in this experiment which took approximately ninety minutes to complete. Procedure
Journal of Experimental Psychology: Human Perception and Performance. 42(8):1204-1214, 2016

8
The materials (i.e., the tactile device and auditory display) were similar to those reported for Experiment 1. The arm on which the tactile stimuli were presented remained in a horizontal position. The tactile and auditory stimuli had the same durations as in Experiment 1. The tasks and procedure were different: this time an implicit association test was used (see below). Participants went through a training session and then completed a unimodal session made up of one tactile block and one auditory block (whose order was counterbalanced across participants). After the unimodal session, participants completed a bimodal session. The training was similar to Experiment 1 in that participants had to learn the mapping between the stimuli and the relevant response keys, without explicit verbal labels. In the unimodal tactile bock, the participants experienced inward and outward tactile stimulation. Their task was to respond to each stimulus by pressing one of the two mouse buttons. In the unimodal auditory block, the task was the same but participants experienced sounds increasing and decreasing in frequency. Each type of stimulus was repeated ten times, for a total of fourty unimodal trials across the tactile and auditory modalities. In the bimodal sessions, participants first learned the association between the four possible stimuli and the two response buttons on the computer mouse. The associations were planned so as to be either congruent (i.e., increasing pitch and outward tactile direction of movement on the same button, decreasing pitch and inward tactile direction of movement on the other button) or incongruent (increasing pitch and inward tactile direction of movement on the same button, decreasing pitch and outward direction of movement on the other). These labels were not provided to the participants, who were just trained to respond to the stimuli. Participants completed the two possible associations in separate blocks, with half of the cohort starting with the congruent condition and half with the incongruent one. On each trial, participants experienced either a tactile or an auditory stimulus and were required to identify them as accurately and as quickly as possible. When the stimulus was auditory, they had to press one of the two mouse buttons depending on whether the sound was increasing or decreasing in pitch. When the stimulus was tactile, they had to press one of the mouse buttons depending on whether the direction of movement was going inward or outward. Each session consisted of thirty repetitions of each of the two tactile stimuli and auditory stimuli presented in a random order. Participants completed 120 trials for each congruent and incongruent session (i.e., 240 in total). III.2. Results Trials in which participants failed to provide a response before the trial was terminated (overall less than 0.4% of trials) were not included in the data analyses. The primary dependent measure was the reaction time (RT), measured from stimulus onset, on correct trials only (Figure 3). The accuracy of the responses was also recorded and reached 93.88% of correct answers. An ANOVA conducted on the mean RTs on the correct answers for each participant with two factors: Modality (tactile vs. auditory) and Congruency (unimodal, congruent, and incongruent) revealed a significant main effect of Modality [F(1, 13)=8.62, p<.00001], a significant main effect of Congruency [F(2, 26)=62.90, p<.00001], and a significant interaction between Modality and Congruency [F(2, 26)=35.62, p<.00001]. A Duncan post-hoc test on Modality * Congruency revealed that, except between auditory unimodal and tactile incongruent, all the other interactions were significant (all ps<.01). In particular, there was a significant difference for tactile stimuli between the congruent and incongruent conditions (p=.0002); and for auditory stimuli as well (p=.0013), with participants being faster in the congruent conditions
Journal of Experimental Psychology: Human Perception and Performance. 42(8):1204-1214, 2016

9
than in the incongruent ones. Overall, participants were faster in the auditory (68.84 ± 7.98 ms) than in the tactile (mean: 85.84 ± 10.89 ms) condition. They were faster in the unimodal (67.02 ± 7.15 ms) followed by the congruent (80.35 ± 11.04 ms) and then the incongruent condition (86.90 ± 10.40 ms).
FIGURE 3 ABOUT HERE III.3. Interim discussion In this variant of the IAT, participants were required to focus on one stimulus at a time. While the association was only at the level of response buttons. The results revealed a significant congruency effect between changes in pitch and changes in direction of tactile movement. Participants were for instance faster in responding to a tone increasing in pitch when the response button was shared with the outward tactile movement than when it was shared with the inward tactile movement. This result suggests that an association between tactile movement and direction of pitch operates at the implicit level. Besides the role of attention, this protocol avoids the comparison or direct mapping required by the speeded classification task used in the first experiment. When presented together, the assumption is that a decrease in pitch should correspond to a downward tactile movement, and an increase in pitch to an upward tactile movement. As the primary sensory organs of vision and audition are rigidly attached to the head together with the vestibular system, and as the head is typically maintained in a vertical position, ‘upward’ and ‘downward’ for vision and audition seem to correspond to the vertical - i.e. to the head orientation. In contrast, touch is distributed throughout the entire body: as tactile receptive surfaces are permanently reoriented in space, it is not clear how the direction of tactile movement is encoded. To develop this hypothesis further, we conducted a third experiment, using the successful method used in the second experiment. IV. Experiment 3. Implicit association test: Horizontal versus vertical arm position The third experiment investigated the influence of arm position on the crossmodal correspondence between change in auditory pitch and change in tactile direction of movement. The position of the arm on which participants received the tactile stimuli was placed, in two separate conditions, either vertically or horizontally (see Figure 4). If a greater correspondence effect is obtained in the vertical condition, this would suggest that the most natural spatial mapping of pitch corresponds to the vertical plane, as it is the case for the audio-visual correspondence between pitch and vertical elevation in visual space (e.g. Chiou & Rich, 2012; Rusconi et al., 2006, for comparisons between different spatial mappings of pitch). On the other hand, if a similar effect is obtained across the two conditions, the congruency would be effective both in the horizontal and vertical plane. This could mean that, with respect to touch, the bodily reference frame (the hand) is determinant for the correspondence and that the tip of the finger corresponds to ‘up’, independently of the actual hand position. Alternatively, it could also be the case that there are two different correspondences at stake: one between pitch and the vertical plane, and the other between pitch and the horizontal plane. .
FIGURE 4 ABOUT HERE IV.1. Methods Participants
Journal of Experimental Psychology: Human Perception and Performance. 42(8):1204-1214, 2016
10
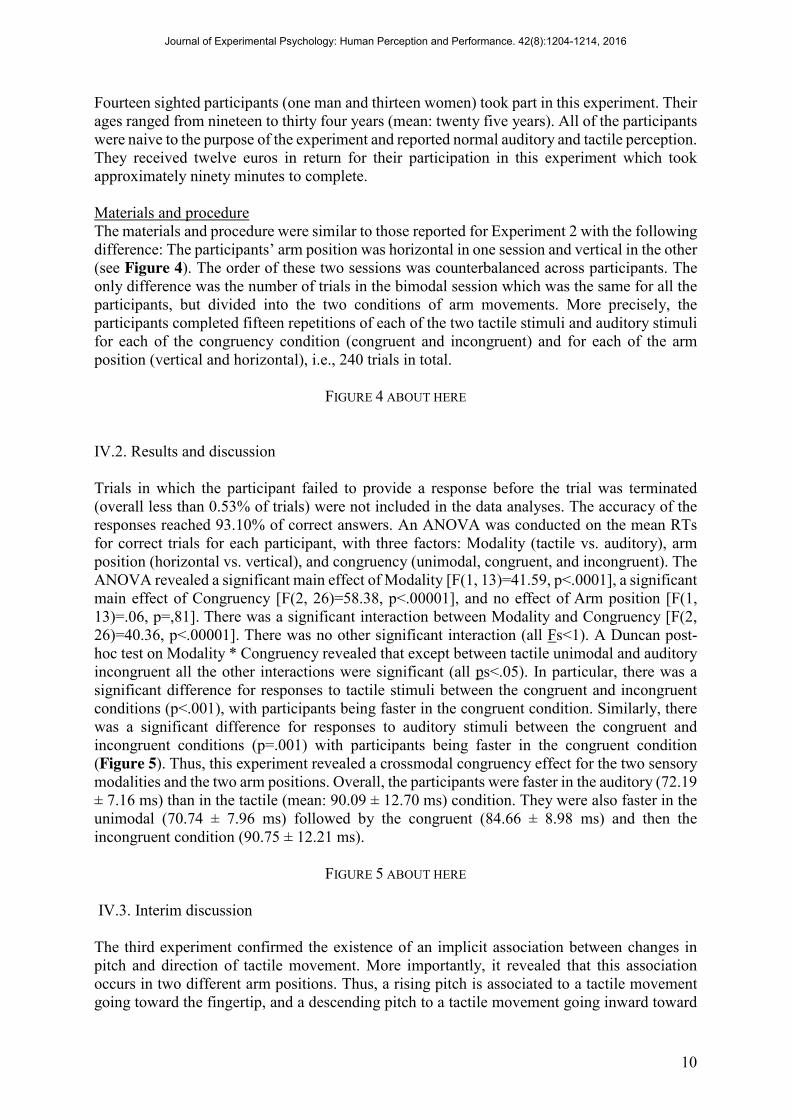
Fourteen sighted participants (one man and thirteen women) took part in this experiment. Their ages ranged from nineteen to thirty four years (mean: twenty five years). All of the participants were naive to the purpose of the experiment and reported normal auditory and tactile perception. They received twelve euros in return for their participation in this experiment which took approximately ninety minutes to complete. Materials and procedure The materials and procedure were similar to those reported for Experiment 2 with the following difference: The participants’ arm position was horizontal in one session and vertical in the other (see Figure 4). The order of these two sessions was counterbalanced across participants. The only difference was the number of trials in the bimodal session which was the same for all the participants, but divided into the two conditions of arm movements. More precisely, the participants completed fifteen repetitions of each of the two tactile stimuli and auditory stimuli for each of the congruency condition (congruent and incongruent) and for each of the arm position (vertical and horizontal), i.e., 240 trials in total.
FIGURE 4 ABOUT HERE
IV.2. Results and discussion Trials in which the participant failed to provide a response before the trial was terminated (overall less than 0.53% of trials) were not included in the data analyses. The accuracy of the responses reached 93.10% of correct answers. An ANOVA was conducted on the mean RTs for correct trials for each participant, with three factors: Modality (tactile vs. auditory), arm position (horizontal vs. vertical), and congruency (unimodal, congruent, and incongruent). The ANOVA revealed a significant main effect of Modality [F(1, 13)=41.59, p<.0001], a significant main effect of Congruency [F(2, 26)=58.38, p<.00001], and no effect of Arm position [F(1, 13)=.06, p=,81]. There was a significant interaction between Modality and Congruency [F(2, 26)=40.36, p<.00001]. There was no other significant interaction (all Fs<1). A Duncan post-hoc test on Modality * Congruency revealed that except between tactile unimodal and auditory incongruent all the other interactions were significant (all ps<.05). In particular, there was a significant difference for responses to tactile stimuli between the congruent and incongruent conditions (p<.001), with participants being faster in the congruent condition. Similarly, there was a significant difference for responses to auditory stimuli between the congruent and incongruent conditions (p=.001) with participants being faster in the congruent condition (Figure 5). Thus, this experiment revealed a crossmodal congruency effect for the two sensory modalities and the two arm positions. Overall, the participants were faster in the auditory (72.19 ± 7.16 ms) than in the tactile (mean: 90.09 ± 12.70 ms) condition. They were also faster in the unimodal (70.74 ± 7.96 ms) followed by the congruent (84.66 ± 8.98 ms) and then the incongruent condition (90.75 ± 12.21 ms).
FIGURE 5 ABOUT HERE IV.3. Interim discussion The third experiment confirmed the existence of an implicit association between changes in pitch and direction of tactile movement. More importantly, it revealed that this association occurs in two different arm positions. Thus, a rising pitch is associated to a tactile movement going toward the fingertip, and a descending pitch to a tactile movement going inward toward
Journal of Experimental Psychology: Human Perception and Performance. 42(8):1204-1214, 2016
11
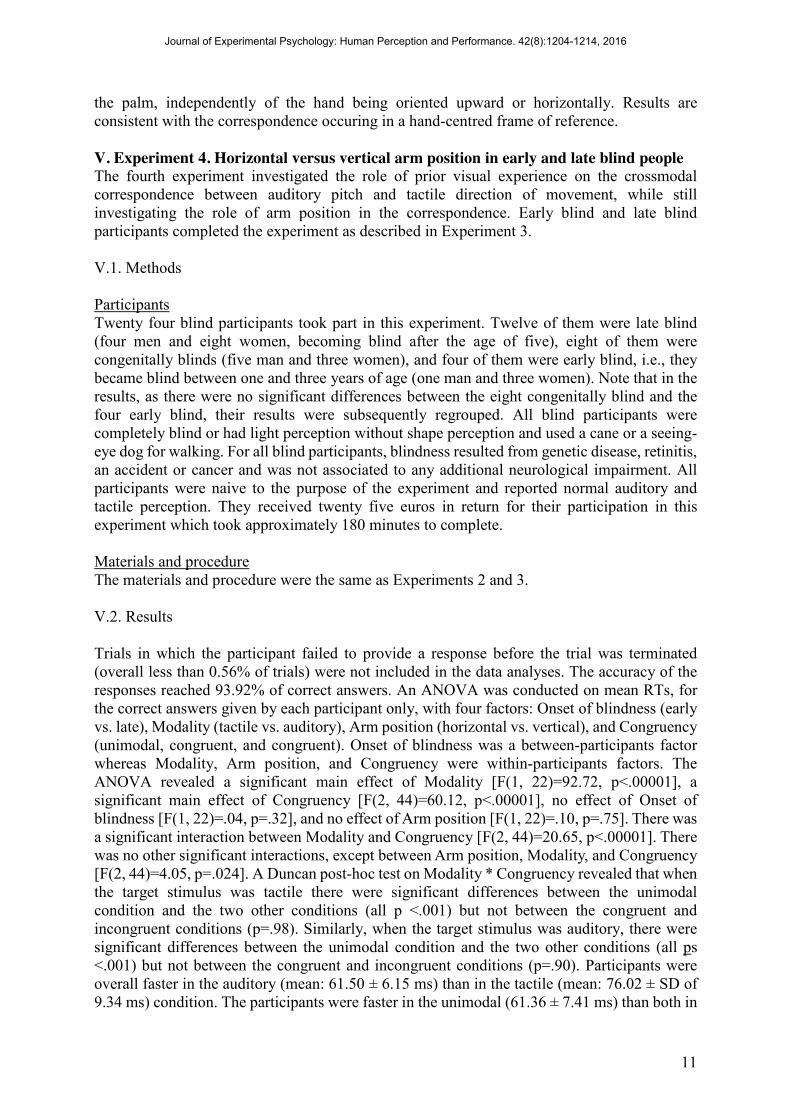
the palm, independently of the hand being oriented upward or horizontally. Results are consistent with the correspondence occuring in a hand-centred frame of reference. V. Experiment 4. Horizontal versus vertical arm position in early and late blind people The fourth experiment investigated the role of prior visual experience on the crossmodal correspondence between auditory pitch and tactile direction of movement, while still investigating the role of arm position in the correspondence. Early blind and late blind participants completed the experiment as described in Experiment 3. V.1. Methods Participants Twenty four blind participants took part in this experiment. Twelve of them were late blind (four men and eight women, becoming blind after the age of five), eight of them were congenitally blinds (five man and three women), and four of them were early blind, i.e., they became blind between one and three years of age (one man and three women). Note that in the results, as there were no significant differences between the eight congenitally blind and the four early blind, their results were subsequently regrouped. All blind participants were completely blind or had light perception without shape perception and used a cane or a seeing-eye dog for walking. For all blind participants, blindness resulted from genetic disease, retinitis, an accident or cancer and was not associated to any additional neurological impairment. All participants were naive to the purpose of the experiment and reported normal auditory and tactile perception. They received twenty five euros in return for their participation in this experiment which took approximately 180 minutes to complete. Materials and procedure The materials and procedure were the same as Experiments 2 and 3. V.2. Results Trials in which the participant failed to provide a response before the trial was terminated (overall less than 0.56% of trials) were not included in the data analyses. The accuracy of the responses reached 93.92% of correct answers. An ANOVA was conducted on mean RTs, for the correct answers given by each participant only, with four factors: Onset of blindness (early vs. late), Modality (tactile vs. auditory), Arm position (horizontal vs. vertical), and Congruency (unimodal, congruent, and congruent). Onset of blindness was a between-participants factor whereas Modality, Arm position, and Congruency were within-participants factors. The ANOVA revealed a significant main effect of Modality [F(1, 22)=92.72, p<.00001], a significant main effect of Congruency [F(2, 44)=60.12, p<.00001], no effect of Onset of blindness [F(1, 22)=.04, p=.32], and no effect of Arm position [F(1, 22)=.10, p=.75]. There was a significant interaction between Modality and Congruency [F(2, 44)=20.65, p<.00001]. There was no other significant interactions, except between Arm position, Modality, and Congruency [F(2, 44)=4.05, p=.024]. A Duncan post-hoc test on Modality * Congruency revealed that when the target stimulus was tactile there were significant differences between the unimodal condition and the two other conditions (all p <.001) but not between the congruent and incongruent conditions (p=.98). Similarly, when the target stimulus was auditory, there were significant differences between the unimodal condition and the two other conditions (all ps <.001) but not between the congruent and incongruent conditions (p=.90). Participants were overall faster in the auditory (mean: 61.50 ± 6.15 ms) than in the tactile (mean: 76.02 ± SD of 9.34 ms) condition. The participants were faster in the unimodal (61.36 ± 7.41 ms) than both in
Journal of Experimental Psychology: Human Perception and Performance. 42(8):1204-1214, 2016
12
the congruent (73.23 ± 8.96 ms) and the incongruent (73.11 ± 7.76 ms) conditions. In summary, although the results revealed a significant effect of congruency there were no significant differences between the congruent and incongruent condition in either of the two modalities. Thus there was no crossmodal congruency effect for both early and late blind participants (see Figure 6). Correlations were also conducted and no correlation was found between the amount of previous visual experience and the size of the effect (congruent-incongruent) in the blind participant group (r(22)=.32, p=.12). No correlation was found for the participants of the late blind group only (r(10)=.13, p=.69).
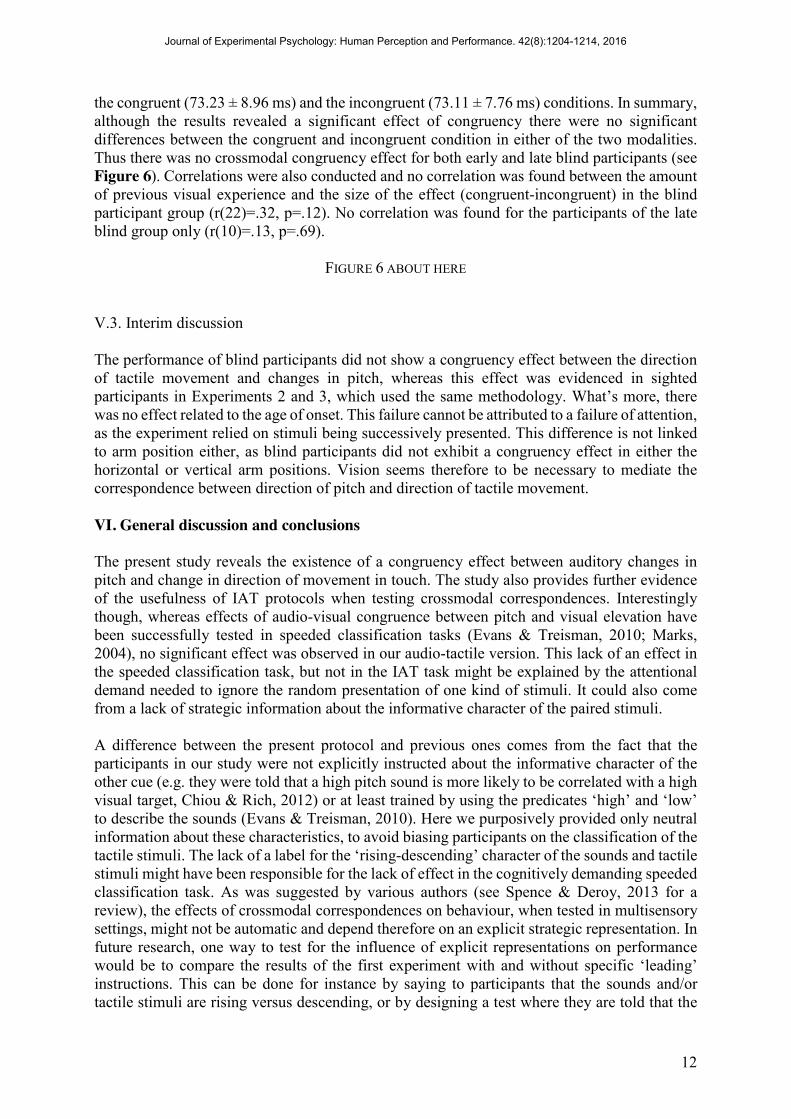
FIGURE 6 ABOUT HERE V.3. Interim discussion The performance of blind participants did not show a congruency effect between the direction of tactile movement and changes in pitch, whereas this effect was evidenced in sighted participants in Experiments 2 and 3, which used the same methodology. What’s more, there was no effect related to the age of onset. This failure cannot be attributed to a failure of attention, as the experiment relied on stimuli being successively presented. This difference is not linked to arm position either, as blind participants did not exhibit a congruency effect in either the horizontal or vertical arm positions. Vision seems therefore to be necessary to mediate the correspondence between direction of pitch and direction of tactile movement. VI. General discussion and conclusions The present study reveals the existence of a congruency effect between auditory changes in pitch and change in direction of movement in touch. The study also provides further evidence of the usefulness of IAT protocols when testing crossmodal correspondences. Interestingly though, whereas effects of audio-visual congruence between pitch and visual elevation have been successfully tested in speeded classification tasks (Evans & Treisman, 2010; Marks, 2004), no significant effect was observed in our audio-tactile version. This lack of an effect in the speeded classification task, but not in the IAT task might be explained by the attentional demand needed to ignore the random presentation of one kind of stimuli. It could also come from a lack of strategic information about the informative character of the paired stimuli. A difference between the present protocol and previous ones comes from the fact that the participants in our study were not explicitly instructed about the informative character of the other cue (e.g. they were told that a high pitch sound is more likely to be correlated with a high visual target, Chiou & Rich, 2012) or at least trained by using the predicates ‘high’ and ‘low’ to describe the sounds (Evans & Treisman, 2010). Here we purposively provided only neutral information about these characteristics, to avoid biasing participants on the classification of the tactile stimuli. The lack of a label for the ‘rising-descending’ character of the sounds and tactile stimuli might have been responsible for the lack of effect in the cognitively demanding speeded classification task. As was suggested by various authors (see Spence & Deroy, 2013 for a review), the effects of crossmodal correspondences on behaviour, when tested in multisensory settings, might not be automatic and depend therefore on an explicit strategic representation. In future research, one way to test for the influence of explicit representations on performance would be to compare the results of the first experiment with and without specific ‘leading’ instructions. This can be done for instance by saying to participants that the sounds and/or tactile stimuli are rising versus descending, or by designing a test where they are told that the
Journal of Experimental Psychology: Human Perception and Performance. 42(8):1204-1214, 2016

13
correspondence between sounds and direction of inward and outward movements is informative. The results obtained in the IAT experiment extend the results obtained by Occelli et al. (2009) regarding the correspondence between pitch height and tactile elevation. They reveal the existence of a congruency effect between the dynamic changes in pitch and the direction of tactile movement. The results obtained in our study also go further in terms of explaining the origin of the spatial mapping of pitch which underlies a well-documented series of effects (e.g. Evans & Treisman, 2010; Patching & Quinlan, 2002; Rusconi et al., 2006). They challenge the idea of a general, amodal spatial representation of pitch shared across all modalities, along with other spatial representations of magnitudes (e.g. Lourenco & Longo, 2011). This does not mean that tasks involving linguistic labels might not show a general spatial representation of pitch (e.g. see Bottini et al. (2015) for the role of language on the spatial representations of time in the blind). The present results strongly suggest the need to investigate whether other spatial mappings of magnitudes, documented with vision, also hold for touch. The present results are difficult to reconcile with the semantic hypothesis pushed by Martino and Marks (1999) and by Walker and Walker (2012) to explain the presence of crossmodal correspondences. According to this hypothesis, correspondences come from the fact that different stimuli evoke similar concepts, or fall within the same part of a conceptual dichotomy (e.g. passive/active; pleasant/ unpleasant). Blind participants, who refer to changes in pitch in terms of ‘rising’ and ‘descending’, have no reason not to fail to apply similar concepts to the two stimuli presented here and to map these directions of pitch and direction of tactile movement. Further evidence of the role of semantic mapping is needed, and could be obtained by testing this audio-tactile correspondence in sighted participants whose language does not describe pitch in spatial terms (see for instance Parkinson, 2012, for a test with the audiovisual correspondence). The difference between crossmodal correspondence and semantic associations suggested here adds to the results obtained by Sadhagiani et al. (2009) who found that crossmodal associations between pitch and height were mediated by different neurological processes than metaphorical descriptors such as ‘high pitch’ and ‘low pitch’. Importantly, the absence of an effect in blind participants suggests that visual mediation plays a necessary role in the acquisition and persistence of the pitch-elevation correspondence. Our results add evidence to the role of vision in space-magnitude interactions (on the absence of SNARC effect in early blind individuals, see Crollen et al.,2013). In line with the present suggestion, Alink et al. (2011) have also found that auditory directional information was transferred to high-level visual cortex in healthy adults. Making sense of the role of vision in the pitch-direction correspondence opens several hypotheses. As mentioned in the introduction, vision might be necessary to associate higher pitched sounds to the higher locations in space in which they most regularly originate (Parise et al., 2014). In this sense, the extraction of information from auditory scene statistics would require a crossmodal collaboration. Alternatively, vision might be necessary to mediate a transitive association between objects getting higher and therefore smaller, and emitting higher pitch as they get smaller. It is only in vision, and not in touch, that moving objects are associated to a change in objects’ size, and change in size is in turn associated to a change in pitch (see Eitan et al., 2011 for a recent study). However, if the absence of association mediated by vision might then explain why congenitally blind participants did not acquire the correspondence between tactile direction and change in pitch, the absence of an association in late blind also suggests a role of visual exposure in the persistence of the association. Due to the presence of visual imagery in the late blind, it could be interesting to test the transitive hypothesis by training them with the two associations
Journal of Experimental Psychology: Human Perception and Performance. 42(8):1204-1214, 2016

14
[direction of tactile movement - change in (imagined) visual size] and [change in imagined visual size-change in pitch] to investigate whether this might lead to different results. It could also be the case that the mental notion of verticality for blind people is determined by the direction of the gravity load due to hand-held objects whereas sighted people it is driven by the visual aspect of standing structures. As such they do not refer to identical notions. Here the findings should be related to Mossbridge et al. (2011), who measured the influence of auditory frequency changes on visuo–spatial attention. The influence disappeared when participants’ head axis was tilted by 90°, and no longer aligned with the body axis, which led the author to conclude that ‘because this cross-modal cueing is dependent on the alignment of head-centred and environmental axes, it may develop through associative learning during waking upright experience’ (Mossbridge et al., 2011, p. 133). As was noted earlier, hands occupy many different positions in space. They are not constrained by vestibular inputs that enable us to orient our heads vertically when walking, looking, and listening (Pozzo et al., 1990; Berthoz, 1991). Hands and fingertips, instead, are completely mobile; they operate independently from gravity and are subject only to proprioceptive relationships. Whereas there is good evidence that, in sighted and in late blind individuals, touch is encoded in a visual frame of reference (e.g. Azanon et al., 2010; Harrar & Harris, 2010), this fact seems insufficient to explain the presence of an effect in sighted individuals when the hand is horizontal, and the absence of an effect in both hand positions for late blinds. As such, the fact that sighted people seem to associate a movement going from the inner palm to the tip of the finger to an upward movement (and at least to a rising pitch) for two different hand positions opens an interesting question regarding the implicit directionality of hands in the body schema: Whereas vision modulates implicit hand maps when it comes to size and shape (Longo, 2014), and the crossing of two hands has well documented effects on crossmodal tasks (Shore et al., 2002), little has been done to test whether a default position or direction of one single hand is used in speeded responses. A further study could be performed to test whether these correspondences are maintained when the hands point in various directions and are located in various relationships with the body. Alternatively, given that the weighing of skin-based, anatomical coordinates and external spatiotopic coordinates is task-dependent (Badde et al., in press), it cannot be excluded that the reference frame observed here was triggered by the task, rather than a default one. To conclude, the present results reveal differences in the audio-visual congruency exhibited by blind and sighted people. Other differences have recently been shown in the classical sound symbolic ‘Bouba-Kiki’ task (Fryer et al., 2014) as well as in SNARC effects (Crollen et al., 2013). The present study should help to develop user-centred methodologies, accounting for a diversity of potential users (e.g. Deroy & Auvray, 2012). Several devices dedicated to assisting blind individuals (e.g. the vOICe, Meijer, 1992; Vibe, Hanneton et al., 2010) or navigation in the absence of vision (e.g. the Flybar, see Pedley & Harper, 1959) have been designed by using the correspondence between direction of pitch and direction of movement (higher-higher; lower-lower) but without testing whether this correspondence, intuitive for the designers and well-documented in audio-visual contexts for sighted individuals, was also relevant for blind people. Here the relevance of this coding is questioned given that this correspondence does not exist in blind people. A better understanding of visual impairment shows that there is not a single abstract profile, but rather a continuum of cases ranging across individuals and situations: defects or accidents, total or partial, stable or progressive, constant or variable depending on the situation, with or without other deficits. The IAT test of crossmodal correspondences might be an interesting tool to pre-test the relevance of certain codings or combinations of auditory and tactile cues, to tailor them more specifically to their users. Our study also raise interesting
Journal of Experimental Psychology: Human Perception and Performance. 42(8):1204-1214, 2016

15
questions as to the multiplicity of spatial frames in which changes of pitch sounds can be mapped.
Acknowledgements
We wish to thank Merle Fairhurst, Matthew Longo, Elena Azanon and Jess Hartcher-O’Brien for their helpful comments on a previous version of this article. The study was funded by a grant from from the CNRS DEFISENS 2012 program (Def002-Sens). OD is supported by the AHRC- RTS grant AH-L007053/1.
Journal of Experimental Psychology: Human Perception and Performance. 42(8):1204-1214, 2016
16
References Alink, A., Euler, F., Kriegeskorte, N., Singer, W., & Kohler, A. (2012). Auditory motion
direction encoding in auditory cortex and high level visual cortex. Human brain mapping, 33, 969–978.
Azañón, E., Longo, M. R., Soto-Faraco, S., & Haggard, P. (2010). The posterior parietal cortex remaps touch into external space. Current Biology, 20, 1304-1309.
Badde, S., Röder, B., & Heed, T. (in press). Flexibly weighted integration of tactile reference frames. Neuropsychologia.
Ben-Artzi, E., & Marks, L. E. (1995). Visual-auditory interaction in speeded classification: Role of stimulus difference. Perception & Psychophysics, 57, 1151–1162.
Bernstein, I. H., & Edelstein, B. A. (1971). Effects of some variations in auditory input upon visual choice reaction time. Journal of Experimental Psychology, 87, 241–247.
Berthoz, A. (1991). Reference frames for the perception and control of movement. In Paillard, J. (Ed.), Brain and space (pp. 81–111). New York: Oxford University Press.
Bottini, R., Crepaldi, D., Casasanto, D., Crollen, V., & Collignon, O. (2015). Space and time in the sighted and blind. Cognition, 141, 67-72.
Chiou, R., & Rich, A. N. (2012). Cross-modality correspondence between pitch and spatial location modulates attentional orienting. Perception, 41, 339–353.
Cohen Kadosh, R., Lammertyn, J., & Izard, V. (2008). Are numbers special? An overview of chronometric, neuroimaging, developmental and comparative studies of magnitude representation. Progress in neurobiology, 84, 132-147.
Cowan, N., & Barron, A. (1987). Cross-modal, auditory–visual Stroop interference and possible implications for speech memory. Perception & Psychophysics, 41, 393–401.
Crisinel, A. S., & Spence, C. (2010). A sweet sound? Food names reveal implicit associations between taste and pitch. Perception, 39, 417.
Crollen, V., Dormal, G., Seron, X., Lepore, F., & Collignon, O. (2013). Embodied numbers: The role of vision in the development of number–space interactions. Cortex, 49, 276-283.
Dematté, M. L., Sanabria, D., & Spence, C. (2007). Olfactory-tactile compatibility effects demonstrated using a variation of the Implicit Association Test. Acta Psychologica, 124, 332–343.
Deroy, O., & Auvray, M. (2012). Reading the world through the skin and ears: a new perspective on sensory substitution. Frontiers in psychology, 3.
Deroy, O., Crisinel, A. S., & Spence, C. (2013). Crossmodal correspondences between odors and contingent features: Odors, musical notes, and geometrical shapes. Psychonomic Bulletin & Review, 20, 878–896.
Deroy, O., & Spence, C. (2013). Why we are not all synesthetes (not even weakly so). Psychonomic Bulletin & Review, 20, 643–664.
Dolscheid, S., Hunnius, S., Casasanto, D., & Majid, A. (2012). The sound of thickness: Prelinguistic infants' associations of space and pitch. In CogSci 2012: The 34th annual meeting of the Cognitive Science Society (pp. 306-311). Cognitive Science Society.
Eitan, Z., Schupak, A., Gotler, A., & Marks, L. E. (2011). Lower pitch is larger, yet falling pitches shrink: Interaction of pitch change and size change in speeded discrimination. Proceedings of Fechner Day, 27, 81–88.
Journal of Experimental Psychology: Human Perception and Performance. 42(8):1204-1214, 2016
17
Evans, K. K., & Treisman, A. (2010). Natural cross-modal mappings between visual and auditory features. Journal of Vision, 10, 1–12.
Fernández-Prieto, I., Navarra, J., & Pons, F. (2015). How big is this sound? Crossmodal association between pitch and size in infants. Infant Behavior and Development, 38, 77-81.
Fryer, L., Freeman, J., & Pring, L. (2014). Touching words is not enough: How visual experience influences haptic–auditory associations in the “Bouba–Kiki” effect. Cognition, 132, 164-173.
Gevers, W., Reynvoet, B., & Fias, W. (2003). The mental representation of ordinal sequences is spatially organized. Cognition, 87, 87-95.
Glashouwer, K. A., Smulders, F. T., de Jong, P. J., Roefs, A., & Wiers, R. W. (2013). Measuring automatic associations: Validation of algorithms for the Implicit Association Test (IAT) in a laboratory setting. Journal of Behavior Therapy and Experimental Psychiatry, 44, 105–113.
Greenwald A. G., McGhee D. E., & Schwartz J. L. (1998). Measuring individual differences in implicit cognition: the implicit association test. Journal of Personality and Social Psychology, 74, 1464–1480.
Hanneton, S., Auvray, M., & Durette, B. (2010). The Vibe: A versatile vision-to-audition sensory substitution device. Applied Bionics and Biomechanics, 7, 269-276.
Harrar, V., & Harris, L. R. (2010). Touch used to guide action is partially coded in a visual reference frame. Experimental brain research, 203, 615-620.
Heller, M., & Gentaz, E. (2013). The psychology of touch and blindness. New York: Taylor & Francis.
Hötting, K., & Röder, B. (2009). Auditory and auditory-tactile processing in congenitally blind humans. Hearing research, 258, 165-174.
Longo, M. R. (2014). The effects of immediate vision on implicit hand maps. Experimental brain research, 232, 1241-1247.
Lourenco, S. F., & Longo, M. R. (2011). Origins and development of generalized magnitude representation. In S. Dehaene & E. M. Brannon (Eds.), Space, time and number in the brain: Searching for the foundations of mathematical thought (pp. 225-244). London: Academic.
Ludwig, V. U., Adachi, I., & Matsuzawa, T. (2011). Visuoauditory mappings between high luminance and high pitch are shared by chimpanzees (Pan troglodytes) and humans. Proceedings of the National Academy of Sciences, 108, 20661–20665.
Maeda, F., Kanai, R., & Shimojo, S. (2004). Changing pitch induced visual motion illusion. Current Biology, 14, R990–R991.
Martino, G., & Marks, L. E. (1999). Perceptual and linguistic interactions in speeded classification: Tests of the semantic coding hypothesis. Perception, 28, 903-924.
MacLeod, C. M. (1991). Half a century of research on the Stroop effect: An integrative review. Psychological Bulletin, 109, 163–203.
Maeda, F., Kanai, R., & Shimojo, S. (2004). Changing pitch induced visual motion illusion. Current Biology, 14, R990-R991.
Marks, L. E. (2004). Cross-modal interactions in speeded classification. In G. A. Calvert, C. Spence, & B. E. Stein (Eds.), Handbook of multisensory processes (pp. 85-105). Cambridge, MA: MIT Press.
Meijer, P. B. L. (1992). An experimental system for auditory image representations. IEEE Transactions on Biomedical Engineering, 39, 112–121.
Melara, R. D., & O'Brien, T. P. (1987). Interaction between synesthetically corresponding dimensions. Journal of Experimental Psychology: General, 116, 323-336.
Mossbridge, J. A., Grabowecky, M., & Suzuki, S. (2011). Changes in auditory frequency guide visual–spatial attention. Cognition, 121, 133–139.
Journal of Experimental Psychology: Human Perception and Performance. 42(8):1204-1214, 2016
18
Occelli, V., Spence, C., & Zampini, M. (2009). Compatibility effects between sound frequency and tactile elevation. Neuroreport, 20, 793–797.
Parise, C. V., Knorre, K., & Ernst, M. O. (2014). Natural auditory scene statistics shapes human spatial hearing. Proceedings of the National Academy of Sciences, 111, 6104–6108.
Parise, C., & Spence, C. (2008). Synesthetic congruency modulates the temporal ventriloquism effect. Neuroscience Letters, 442, 257-261.
Parise, C. V., & Spence, C. (2009). When birds of a feather flock together’: Synesthetic correspondences modulate audiovisual integration in non-synesthetes. PLoS One, 4, e5664.
Parise, C. V., & Spence, C. (2012). Audiovisual crossmodal correspondences and sound symbolism: a study using the implicit association test. Experimental Brain Research, 220, 319–333.
Parkinson, C., Kohler, P. J., Sievers, B., & Wheatley, T. (2012). Associations between auditory pitch and visual elevation do not depend on language: Evidence from a remote population. Perception-London, 41, 854–861.
Pedley, P. E., & Harper, R. S. (1959). Pitch and the vertical localization of sound. The American Journal of Psychology, 447-449.
Pozzo, T., Berthoz, A., & Lefort, L. (1990). Head stabilization during various locomotor tasks in humans. Experimental Brain Research, 82, 97–106,
Pedley, P. E., & Harper, R. S. (1959). Pitch and the vertical localization of sound. The American Journal of Psychology, 72, 447–449.
Piercy, J. E., Embleton, T. F. W., & Sutherland, L. C. (1977). Review of noise propagation in the atmosphere, Journal of the Acoustical Society of America, 61, 1403–1418
Pratt, C. C. (1930). The spatial character of high and low tones. Journal of Experimental Psychology, 13, 278–285.
Roffler, S. K., & Butler, R. A. (1968). Localization of tonal stimuli in the vertical plane. The Journal of the Acoustical Society of America, 43, 1260-1266.
Rusconi, E., Kwan, B., Giordano B. L., Umilta, C., & Butterworth B. (2006). Spatial representation of pitch height: the SMARC effect. Cognition, 99, 113–129.
Sadaghiani, S., Maier, J. X., & Noppeney, U. (2009). Natural, metaphoric, and linguistic auditory direction signals have distinct influences on visual motion processing. The Journal of Neuroscience, 29, 6490–6499.
Shore, D. I., Spry, E., & Spence, C. (2002). Confusing the mind by crossing the hands. Cognitive Brain Research, 14, 153-163.
Spence, C. (2011). Crossmodal correspondences: A tutorial review. Attention, Perception, & Psychophysics, 73, 971–995.
Spence, C., & Deroy, O. (2013). How automatic are crossmodal correspondences? Consciousness and Cognition, 22, 245–260.
Spence, C., & Deroy. O. (2012). Crossmodal correspondances: Innate or learned (with Charles Spence). I-Perception, 3, 316–318.
Spence, C., & Parise, C. V. (2012). The cognitive neuroscience of crossmodal correspondences. I-Perception, 3, 410.
Teige-Mocigemba, S., Klauer, K. C., & Sherman, J. W. (2010). A practical guide to Implicit Association Tests and related tasks. In Gawronski, B., & Payne, B. K. (Eds.) Handbook of implicit social cognition: Measurement, theory, and applications (pp. 117-139). New York: Guilford Press.
Walker, P., & Smith, S. (1984). Stroop interference based on the synaesthetic qualities of auditory pitch. Perception, 13, 75-81.
Walker, P., & Walker, L. (2012). Size–brightness correspondence: Crosstalk and congruity among dimensions of connotative meaning. Attention, Perception, & Psychophysics, 74, 1226–1240.
Journal of Experimental Psychology: Human Perception and Performance. 42(8):1204-1214, 2016

19
Wang Q., & Hayward V. (2010). Biomechanically optimized distributed tactile transducer based on lateral skin deformation. International Journal of Robotics Research, 29, 323–335.
Journal of Experimental Psychology: Human Perception and Performance. 42(8):1204-1214, 2016

20
Figure captions Figure 1. Tactile stimulator device and representation of the tactile stimulus.
Figure 2. Participants’ mean Reaction Times for the two conditions of stimulus presentation:
tactile and auditory; for the four congruency conditions: congruent (upward tactile and rising
pitch; downward tactile and descending pitch), unimodal (tactile only; auditory only),
incongruent (upward tactile and descending pitch ; downward tactile and rising pitch) and
neutral (upward tactile and neutral pitch ; downward tactile and neutral pitch in the tactile block;
neutral tactile and rising pitch; neutral tactile and descending pitch in the auditory block). Error
bars represent the standard errors of the means.
Figure 3. Participants’ mean Reaction Times for the two conditions of stimulus presentation:
tactile and auditory; for the 3 congruency conditions: congruent (upward tactile and rising pitch;
downward tactile and descending pitch associated to the same response key), unimodal (upward
tactile and downward tactile associated to two response keys; rising pitch and descending pitch
associated to two response keys) and incongruent (upward tactile and descending pitch;
downward tactile and rising pitch associated to the same response key). Error bars represent the
standard errors of the means.
Figure 4. The two arm positions used in Experiments 3 and 4: vertical and horizontal.
Figure 5. Participants’ mean Reaction Times for the two conditions of stimulus presentation:
tactile and auditory; for the three congruency conditions: congruent, unimodal, and incongruent
(as in Experiment 2). Error bars represent the standard errors of the means. Note that, as there
was no effect of arm position, in the graph, horizontal and vertical arm positions were collapsed.
Figure 6. Participants’ mean Reaction Times for the two conditions of stimulus presentation:
Tactile and auditory; for the three congruency conditions: congruent, unimodal, and
incongruent (as in Experiment 2 and 3); and for the two onsets of blindness: early and late.
Error bars represent the standard errors of the means. Note that, as there was no effect of arm
position, in the graph, horizontal and vertical arm positions were collapsed.
Journal of Experimental Psychology: Human Perception and Performance. 42(8):1204-1214, 2016
21
Response to Tactile stimulation Auditory stimulation
simultaneous presentations
Outward Inward Rising Descending
Congruent Rising pitch Descending pitch
Outward tactile movement
Inward tactile movement
Incongruent Descending pitch
Rising pitch Inward tactile movement
Outward tactile movement
Neutral Neutral pitch change
Neutral pitch change
Random tactile stimulation
Outward tactile movement
Table 1: The twelve possible combinations of auditory and tactile stimuli presented in the bimodal blocks.
Journal of Experimental Psychology: Human Perception and Performance. 42(8):1204-1214, 2016
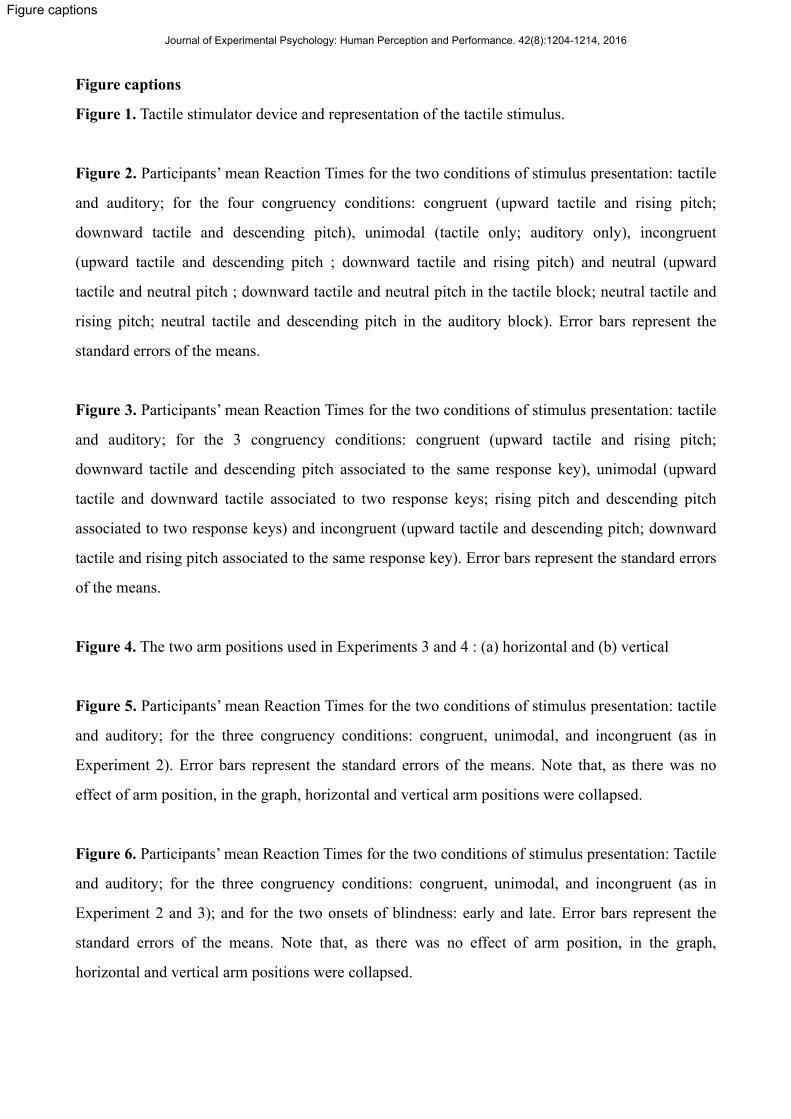
Figure captions
Figure 1. Tactile stimulator device and representation of the tactile stimulus.
Figure 2. Participants’ mean Reaction Times for the two conditions of stimulus presentation: tactile
and auditory; for the four congruency conditions: congruent (upward tactile and rising pitch;
downward tactile and descending pitch), unimodal (tactile only; auditory only), incongruent
(upward tactile and descending pitch ; downward tactile and rising pitch) and neutral (upward
tactile and neutral pitch ; downward tactile and neutral pitch in the tactile block; neutral tactile and
rising pitch; neutral tactile and descending pitch in the auditory block). Error bars represent the
standard errors of the means.
Figure 3. Participants’ mean Reaction Times for the two conditions of stimulus presentation: tactile
and auditory; for the 3 congruency conditions: congruent (upward tactile and rising pitch;
downward tactile and descending pitch associated to the same response key), unimodal (upward
tactile and downward tactile associated to two response keys; rising pitch and descending pitch
associated to two response keys) and incongruent (upward tactile and descending pitch; downward
tactile and rising pitch associated to the same response key). Error bars represent the standard errors
of the means.
Figure 4. The two arm positions used in Experiments 3 and 4 : (a) horizontal and (b) vertical
Figure 5. Participants’ mean Reaction Times for the two conditions of stimulus presentation: tactile
and auditory; for the three congruency conditions: congruent, unimodal, and incongruent (as in
Experiment 2). Error bars represent the standard errors of the means. Note that, as there was no
effect of arm position, in the graph, horizontal and vertical arm positions were collapsed.
Figure 6. Participants’ mean Reaction Times for the two conditions of stimulus presentation: Tactile
and auditory; for the three congruency conditions: congruent, unimodal, and incongruent (as in
Experiment 2 and 3); and for the two onsets of blindness: early and late. Error bars represent the
standard errors of the means. Note that, as there was no effect of arm position, in the graph,
horizontal and vertical arm positions were collapsed.
Figure captions
Journal of Experimental Psychology: Human Perception and Performance. 42(8):1204-1214, 2016
moving bar
outwardinward
10 mm
neutral
congru
ent
unimodal
incongru
ent
1.00.80.60.40.2
0
reac
tion
time
(s) 1.0
0.80.60.40.20
** *
tactile trials auditory trials
neutral
congru
ent
unimodal
incongru
ent
congru
ent
unimodal
incongru
ent
1.00.80.60.40.2
0
reac
tion
time
(s) 1.0
0.80.60.40.20
** *
tactile trials auditory trials
congru
ent
unimodal
incongru
ent
** *
congru
ent
unimodal
incongru
ent
1.00.80.60.40.2
0
reac
tion
time
(s) 1.0
0.80.60.40.20
** *
tactile trials auditory trials
congru
ent
unimodal
incongru
ent
** *
outwardinward
outw
ard
inw
ard
a b
1.00.80.60.40.2
0
congru
ent
unimodal
incongru
ent
reac
tion
time
(s) 1.0
0.80.60.40.20
* *
tactile trials auditory trials
congru
ent
unimodal
incongru
ent
early blind
* *
1.00.80.60.40.2
0
reac
tion
time
(s) 1.0
0.80.60.40.20
congru
ent
unimodal
incongru
ent
congru
ent
unimodal
incongru
ent
late blindtactile trials auditory trials
* * * *
Fig 1 Fig 4
Fig 2 Fig 5
Fig 6
Fig 3
Journal of Experimental Psychology: Human Perception and Performance. 42(8):1204-1214, 2016