Embed Size (px)
Citation preview

Journal of Technomaterial Physics Vol. 1, No. 2, 2019 | 139 – 147
JoTP Journal of Technomaterial Physics
*Corresponding author at: Jl. Prof. Muchtar Luthfi Pekanbaru, 28293, Indonesia
E-mail address: [email protected]
Copyright © 2019 Published by Talenta Publisher, ISSN: 2656-0747 e-ISSN: 2656-0755
Journal Homepage: https://talenta.usu.ac.id/index.php/JoTP
Diffraction Pattern Simulation of Crystal Structure
towards the Ionic Radius Changes Via Vesta Program
Ari Sulistyo Rini1 and Sundami Restiana2
1,2 Department of Physics, Faculty of Mathematics and Natural Sciences, Universitas Riau
Abstract. The Simulations of X-ray diffraction patterns of MgO, BaO and ZnS ceramics
were successfully performed by VESTA program, based on the crystal structures
visualization. The aim of this research was to obtain the relationship between ionic radius to
the diffraction pattern. The X-ray diffraction pattern was generated from visualization of
the crystal structure. The crystal structure information was obtained from JCPDS data
which contained lattice parameter, atomic coordinate and the space group. The X-ray
diffraction pattern parameters which are taken into account in this research are diffraction
angle of 2 Theta and Intensity. The results indicated that the peak position and intensity of
the diffraction pattern are influenced by ionic radius of the cations. Structural
transformation was also detected from this simulation.
Keyword: Visualization, Simulation, X-ray diffraction, and VESTA
Received 16 April 2019 | Revised [17 July 2019] | Accepted [31 August 2019]
1 Introduction
The structure of a crystal plays an important role in material characterization. Knowledge of the
crystal structure of a material can indirectly provide information about the properties of
materials [1-3]. XRD is the most basic and most widely used material structure characterization
method for analyzing the structure of solid crystals. This technique can identify the crystalline
phase of the material, the crystal structure and the microstructure phase [4-7]. The information
needed in determining the crystal structure is the lattice constant, and the space group adopted.
Both of these information can be used to determine the position of an atom in a unit cell of a
crystalline material.
Determining the structure using XRD applies the scattering principle that meets the Bragg Law
which will give the position of the diffraction peak angle. According to Bragg, constructive
interference occurs when the length of the path taken by scattering rays is parallel or the
difference in the light trace must be an integer multiple of the wavelength (λ) which can be
written in the following equation [8-11].
Journal of Technomaterial Physics Vol. 1, No. 2, 2019 | 139 – 147 140
nλ = 2 dhkl sin θ (1)
In simple cube crystals with miller index (hkl) and lattice length, the distance between dhkl
fields can be written as follows [12-13]:
dhkl =
√ (2)
All atoms in the lattice contribute to scattering based on the position (x, y, z) of each constituent
atom which is defined as a structural factor by the following formula:
F = ∑ ̂ ̂ ̂ (3)
Where the intensity is I I~ |F|2. Diffraction beam intensity does not only depend on the structure
factor |F|2, but there are other factors, namely multiplicity (P), Lorentz polarization factor (L),
and temperature factor ( .
) (4)
The effect of ionic radius of cations has different responses to the intensity of each diffraction
peak angle. This is due to several factors that influence the intensity of diffraction, namely
multiplicity (multiplying factor), Lorentz polarization factors, temperature factors and absorbs.
The multiplier comes from repeating the number of identical fields, the absorption factor
depends on the geometry and diffraction method used, while the Lorentz polarization factor (L
=
) is a function of θ whose value varies greatly with the angle Bragg. The value of the
Lorentz polarization factor considers certain geometric factors related to the orientation of the
reflecting plane in the crystal which also affects the diffraction intensity [14]
The diffraction peaks of a material often shift from standard data. In this study, VESTA
software was used to determine the lattice parameters of a material through visualizing the
structure of the material. VESTA uses the C ++ programming language based on OpenGL
technology with the ability to analyze the structure and electronic properties of a material [15-
17].
Another factor that affects the intensity of a diffraction pattern is the difference in the number of
lattices in one cluster which has implications for the difference in the size of the reference
sample crystallite with simulation data, so that it can explain the difference in the intensity of
each diffraction pattern of the same compound.
The VESTA software is commonly used to visualize crystal structures based on lattice
parameter data and constituent atomic coordinates. Crystal structure visualization is increasingly
Journal of Technomaterial Physics Vol. 1, No. 2, 2019 | 139 – 147 141
popularly to explain electrical phenomena from a material, and the description of structural
transformation [18-19] and [20]. The zeolite mineral visualization has also been carried out
using the VESTA program to increase the understanding of the composition of the mineral
content. In this research, the VESTA program was used to simulate X-ray diffraction patterns of
several ceramics such as MgO, BaO and ZnS through visualization of their structure by varying
their ionic cation radius (Mn +). The purpose of this research was to obtain a relationship
between the displacement of the diffraction peak angle and its lattice parameters which had
previously been validated.
2 Materials and Methods
The research was conducted by simulating the diffraction pattern of BaO, MgO and ZnS
ceramics with ionic radius variations of cations. The ceramic data used was obtained from the
JCPDS (Joint Committee on Powder Diffraction Standard) database of the MATCH!3 software
which has been validated and can be traced to the origin of the data. The JCPDS data contains
lattice parameter data, space groups, diffraction patterns and atomic coordinates in the grid.
Crystal structure data used in this simulation are shown in Table 1.
Table 1. Ionic radius and lattice parameter of crystal structure
Ceramics Cation
radius (Mn+
)
Anion
radius (An-
)
Lattice
parameter,
a (Å)
Space
group
No. JCPDS
MgO 0.72 1.40 a= 4.144 Fm3m 96-901-3196
BaO 1.42 1.40 a = 4.397
c = 3.196
P4/nmm 96-152-7736
ZnS 0.74 1.84 a =5.345 Fm3m 96-500-0089
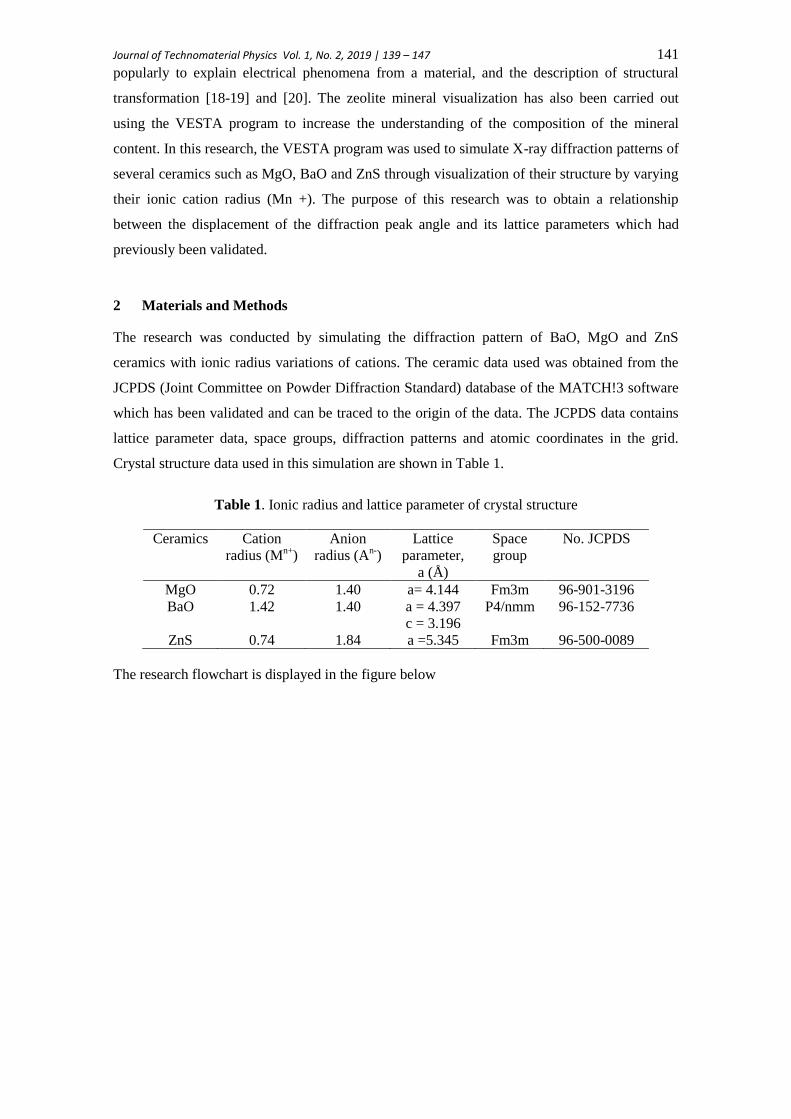
The research flowchart is displayed in the figure below
Journal of Technomaterial Physics Vol. 1, No. 2, 2019 | 139 – 147 142
0
20
40
60
80
100
120
140
160
20 30 40 50 60 70 80 90 100
Inte
nsi
tas,
a.u
2 Theta, o
(-) 0.1
standar
(+) 0.1(111)
(200)
(202)
(311)(222)
(400)
[ 96-901-3196] Mg O Periclase
Figure 1. Research Flowchart
The X-ray diffraction patterns were obtained after visualization of the crystal structure was
performed. Validation of crystal structure accuracy was conducted by comparing the diffraction
patterns of the simulation results with the standard JCPDS data.
The simulation phase is as follows:
1. Composite atomic input, and lattice parameter
2. The constituent atomic coordinates in the grid input
3. Space group input
4. Visualization
5. “Powder Diffraction Pattern”
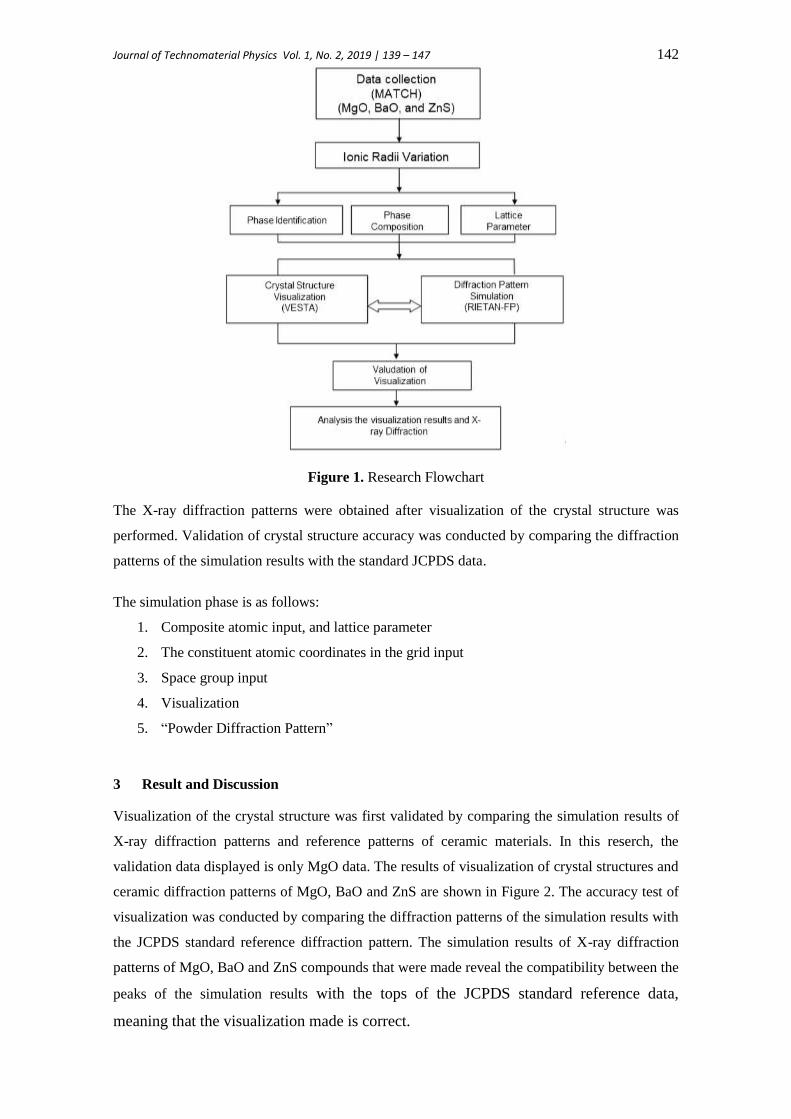
3 Result and Discussion
Visualization of the crystal structure was first validated by comparing the simulation results of
X-ray diffraction patterns and reference patterns of ceramic materials. In this reserch, the
validation data displayed is only MgO data. The results of visualization of crystal structures and
ceramic diffraction patterns of MgO, BaO and ZnS are shown in Figure 2. The accuracy test of
visualization was conducted by comparing the diffraction patterns of the simulation results with
the JCPDS standard reference diffraction pattern. The simulation results of X-ray diffraction
patterns of MgO, BaO and ZnS compounds that were made reveal the compatibility between the
peaks of the simulation results with the tops of the JCPDS standard reference data,
meaning that the visualization made is correct.

Journal of Technomaterial Physics Vol. 1, No. 2, 2019 | 139 – 147 143
(a)
(b)
(c)
Figure 2. The crystal structure visualization and diffraction patterns of (a) MgO, (b) BaO, (c)
ZnS
0
10
20
30
40
50
60
70
80
90
100
110
120
130
140
150
160
170
180
190
200
210
20 30 40 50 60 70 80 90 100
Inte
nsita
s, a.
u.
2Theta, o
match
vesta
[ 96-901-3196] Mg O Periclase
111)
(200)
(202)
(311)
(222)(400)
0
10
20
30
40
50
60
70
80
90
100
110
120
130
140
150
160
170
180
190
200
210
20 30 40 50 60 70 80 90 100
Inte
nsit
as, a
.u.
2Theta, o
match
vesta
[ 96-152-7736] Ba O BaO
(001)
(110)
(011)
(021)(121)
(020)
(221)
(031)
(111)
((002)
(220) (012)
(112)
(231)
(222)(040)
(022)
(122)
0
10
20
30
40
50
60
70
80
90
100
110
120
130
140
150
160
170
180
190
200
210
20 30 40 50 60 70 80 90 100
Inte
nsit
as, a
.u.
2Theta, o
match
vesta
[ 96-500-0089] SZn sulfide (Sphalerite)
(020)
(202)
(311)
(222)(040)
(313)
(402)
(242)(333)
(111)
Journal of Technomaterial Physics Vol. 1, No. 2, 2019 | 139 – 147 144
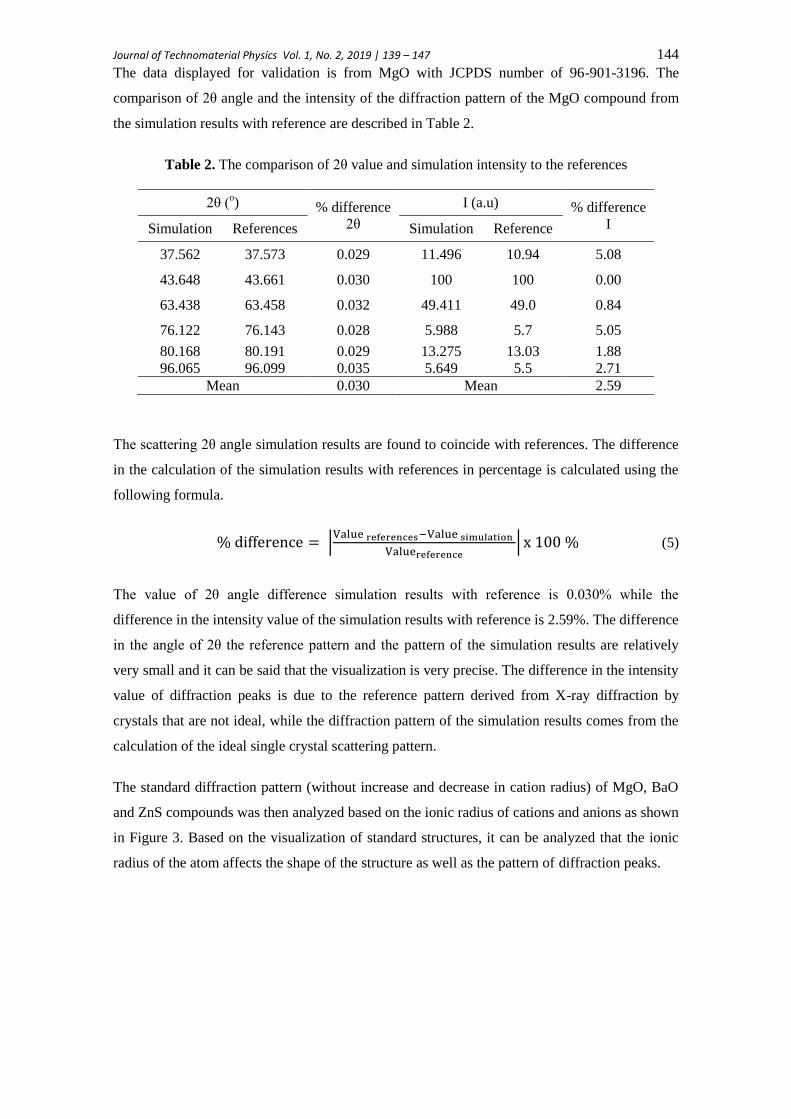
The data displayed for validation is from MgO with JCPDS number of 96-901-3196. The
comparison of 2θ angle and the intensity of the diffraction pattern of the MgO compound from
the simulation results with reference are described in Table 2.
Table 2. The comparison of 2θ value and simulation intensity to the references
2θ (o) % difference
2θ
I (a.u) % difference
I Simulation References Simulation Reference
37.562 37.573 0.029 11.496 10.94 5.08
43.648 43.661 0.030 100 100 0.00
63.438 63.458 0.032 49.411 49.0 0.84
76.122 76.143 0.028 5.988 5.7 5.05
80.168 80.191 0.029 13.275 13.03 1.88
96.065 96.099 0.035 5.649 5.5 2.71
Mean 0.030 Mean 2.59
The scattering 2θ angle simulation results are found to coincide with references. The difference
in the calculation of the simulation results with references in percentage is calculated using the
following formula.
|
| (5)
The value of 2θ angle difference simulation results with reference is 0.030% while the
difference in the intensity value of the simulation results with reference is 2.59%. The difference
in the angle of 2θ the reference pattern and the pattern of the simulation results are relatively
very small and it can be said that the visualization is very precise. The difference in the intensity
value of diffraction peaks is due to the reference pattern derived from X-ray diffraction by
crystals that are not ideal, while the diffraction pattern of the simulation results comes from the
calculation of the ideal single crystal scattering pattern.
The standard diffraction pattern (without increase and decrease in cation radius) of MgO, BaO
and ZnS compounds was then analyzed based on the ionic radius of cations and anions as shown
in Figure 3. Based on the visualization of standard structures, it can be analyzed that the ionic
radius of the atom affects the shape of the structure as well as the pattern of diffraction peaks.

Journal of Technomaterial Physics Vol. 1, No. 2, 2019 | 139 – 147 145
(a)
(b)
(c)
Figure 3. The graph of X-ray diffraction pattern simulation with ionic radius of (a) MgO, (b)
BaO and (c) ZnS.
MgO has a cubic structure with lattice parameters of a = 4.144 Å and Fm3m space group, while
BaO has a tetragonal structure (a = b ≠ c) by adopting a space group P4 nmm. The ionic radius
of cation (Mg2+
) is smaller than the ionic radius of anion (O2-
), while the ionic radius of cation
0
20
40
60
80
100
120
140
160
20 30 40 50 60 70 80 90 100
Inte
nsi
tas,
a.u
2 Theta, o
(-) 0.1
standar
(+) 0.1(111)
(200)
(202)
(311)(222)
(400)
[ 96-901-3196] Mg O Periclase
0
20
40
60
80
100
120
140
160
20 30 40 50 60 70 80 90 100
Inte
nsi
tas,
a.u
2 Theta, o
(-) 0.1
standar
(+) 0.1
(22
1)
(13
1)
(11
0)
(01
1)
(11
1)
(02
1)
(12
1)
(22
0) (01
2)
(03
1)
(12
2)
(23
1)
(03
2)
(04
0)
0
20
40
60
80
100
120
140
160
20 30 40 50 60 70 80 90 100
Inte
nsi
tas,
a.u
2 Theta, o
(-) 0.1
standar
(+) 0.1
(111)
(020)
(202)
(311)
(040)
(222)
(313)
(402)
(242)

Journal of Technomaterial Physics Vol. 1, No. 2, 2019 | 139 – 147 146
(Ba2+
) is greater than the ionic radius of (Mg2+
) and is almost the same as the anion radius (O2-
).
Changes to the cation radius cause the transformation of the structure from Cubic (a = b = c) to
Tetragonal (a = b ≠ c). This structural change in BaO occurs because when ionic radii of cations
and anions are almost the same then atoms tend to be arranged to form the structure with the
largest density that can be formed, so BaO tends to have a tetragonal structure like a diamond
structure. Similarly, ZnS has a cubic crystal system with ionic radius of Zn2+
cation that is quite
different from the ionic radius of the S2-
anion atom.
Changes in the diffraction pattern in Figure 3 were then analyzed based on changes in the ionic
radius of cation. The simulation graph of the pattern of diffraction peaks of the three compounds
after being varied by the ionic radius of the atom is distinguished (+/-) by 0.1 Å from the
standard size.
In general, changes in the size of the ionic radius of an atom cause the 2θ angle shift and a
change in diffraction intensity. The effect of adding ionic radii causes 2θ angle shift towards the
left (decreases) and the reduction in ionic radius causes a 2θ angle shift to the right (enlarged).
This is in accordance with Bragg’s Law which states that the angle value θ will be inversely
proportional to the lattice parameter, where the lattice parameter is proportional to the ionic
radius.
4 Conclusion
Simulation of the diffraction pattern of MgO, BaO and ZnS ceramic structures has been
successfully conducted based on the results of the visualization. In dual atomic crystals, the size
of the ionic fingers of the constituent atoms affects the shape of the structure possessed by a
crystal. The effect of changes in ionic radius of constituent atoms causes changes in intensity
and angular shifts of 2θ. The addition of ionic radii causes a 2θ angle shift to the left
(shrinking). Moreover, the correlation of intensity with ionic radius cation does not have a
uniform relationship due to the factors that affect X-ray scattering in crystals, namely
multiplicity, Lorentz polarization factor, temperature and absorption factors.
REFERENCES
[1] T. Surdia and S. Saito, Pengetahuan Bahan Teknik, Jakarta: Pradnya Paramita, 2005.
[2] J. P. Glusker and K. N. Trueblood, Crystal Structure Analysis: A Primer Third Edition,
United State: Oxford University Press Inc., 2010.
[3] S. J. L. Billinge and I. Levin, "The Problem with Determining Atomic Structure at The
Nanoscale," Science, vol. 316, no. 5824, pp. 561-565, 2007.
[4] E. J. Mittemeijer and P. Scardi, Diffraction Analysis of The Microstructure of Materials,
Germany: Springer-Verlag Berlin Heidelberg, 2004.
[5] K. Thamaphat, P. Limsuwan and B. Ngotawornchai, "Phase Characterization of TiO2
Powder by XRD and TEM," Kasetsart J.(Nat. Sci.), vol. 42, no. 5, pp. 357-361, 2008.
[6] A, Monshi, M. R. Foroughi and M. R. Monshi, "Modified Scherrer Equation to Estimate

Journal of Technomaterial Physics Vol. 1, No. 2, 2019 | 139 – 147 147
More Accurately Nano-Crystallite Size Using XRD," World Journal of Nano Science and
Engineering, vol. 2, no. 3, pp. 154-160, 2012.
[7] V. A. Drits, J. Środoń and D. D. Eberl, "XRD Measurement of Mean Crystallite Thickness
of Illite and Illite/Smectite: Reappraisal of The Kubler Index and The Scherrer
Equation," Clays and clay minerals vol. 45, no. 3, pp. 461-475, 1997.
[8] A. Beiser, Fisika Modern, Jakarta: Erlangga, 1995.
[9] A. Guinier and G. Fournet, Small-Angle Scattering of X-rays, New York: John Wiley and
Sons, Inc, 1955.
[10] J. Epp, 4-X-Ray Diffraction (XRD) Techniques for Materials Characterization,
In Materials Characterization Using Nondestructive Evaluation (NDE) Methods, pp. 81-
124. Woodhead Publishing, 2016.
[11] A. Chauhan and P. Chauhan. "Powder XRD Technique and Its Applications in Science and
Technology." Journal of Analytical and Bioanalytical Techniques, vol. 5, no. 5, 212, pp. 1-
5, 2014.
[12] C. Kittel, Introduction to Solid State 7th ed., New York: John Willey and Sons Inc., 1986.
[13] M. Ermrich and D. Opper. "XRD for The Analyst Getting Acquainted with The Principles
2nd
Edition, Nurnberger: PANalytical GmbH, 2013.
[14] C. Suryanarayana and M. G. Norton, X-Ray Diffraction A Practical Approach, New York:
Springer, 1998.
[15] K. Momma and F. Izumi, "VESTA: A Three-Dimensional Visualization System for
Electronic and Structural Analysis," Journal of Applied Crystallography, vol. 41, no. 3, pp.
653-658, 2008.
[16] E. Angel and D. Shreiner, Interactive Computer Graphics: A Top-Down Approach With
Shader-Based Opengl 6th Edition, Boston: Addison-Wesley, 2012.
[17] K. Momma and F. Izumi, "VESTA 3 for Three-Dimensional Visualization of Crystal,
Volumetric and Morphology Data," Journal of Applied Crystallography, vol. 44, no. 6, pp.
1272-1276, 2011.
[18] S. G. E. T. Escher, T. Lazauskas, M. A. Zwijnenburg and S. M. Woodley, "Structure
Prediction of (BaO)n Nanoclusters for Using an Evolutionary Algorithm,"
Computational and Theoretical Chemistry, vol. 1107, pp. 74–81, 2017.
[19] A. Kouchi, Y. Furukawa and T. Kuroda, "X-Ray Diffraction Pattern of Quasi-Liquid Layer
on Ice Crystal Surface," Journal de Physique Colloques, vol. 48, pp. C1-675-c1-677,
(1987).
[20] S. S. Lobanov, Q. Zhu, N. Holtgrewe, C. Prescher, V. B. Prakapenka, A. R. Oganov and A.
F. Goncharov, "Stable Magnesium Peroxide at High Pressure," Scientific Reports, vol. 5,
13582, pp. 1–8, 2015.