Embed Size (px)
Citation preview
MT.9
X-ray single crystal and powder diffraction: possibilities and applications
Mercè Font-Bardia and Xavier Alcobé
Unitat de Difracció de Raigs X, CCiTUB, Universitat de Barcelona. Lluís Solé i Sabarís, 1-3. 08028 Barcelona. Spain.
email: [email protected]; [email protected]
Abstract. In this article the main possibilities of single crystal and powder diffraction analysis using conventional laboratory x-ray sources are introduced. Several examples of applications with different solid samples and in different fields of applications are shown illustrating the multidisciplinary capabilities of
both techniques.
Handbook of instrumental techniques from CCiTUB
X-ray single crystal and powder diffraction
1
MT.9
1. 1. 1. 1. IntroductionIntroductionIntroductionIntroduction
Diffraction experiments using x-rays or particles in motion, such as neutrons and electrons, enable the study of the structural properties of materials. Diffraction using electron, neutron or brilliant synchrotron x-rays will not be considered. Only conventional laboratory x-ray sources produced by sealed x-ray tubes are taken into account. The wavelengths of the x-rays used in laboratory diffraction experiments (ranging from 0.5 to 2.5 Å) are of the same order than the shortest interatomic distances. When the material is irradiated with a controlled x-ray beam a diffraction pattern can be obtained. If the material is a crystal, the diffraction pattern is a transformation into reciprocal space of its ordered atomic structure. The direct image of the crystal, i.e. the three dimensional distribution of the atoms in the lattice, can be restored only after the diffraction pattern has been transformed back into direct space. The transformation is governed by the theory of diffraction. Comprehensive derivation of the theory of x-rays as well as detailed descriptions of the production and detection of x-rays and the processes of interaction of x-rays with matter can be found in several excellent books and reviews [1-4, for example].
In principle an x-ray diffraction (XRD) analysis can be performed in any kind of material. Nevertheless in most of the cases the materials are solid samples. Only in some quite specific applications the samples are liquid and in very special cases gases. Depending on the characteristics of the solid sample being analysed the possibilities and the kind of information that can be obtained from an XRD experiment change and are multiple and diverse. In a first level of distinction, and closely related to the kind of experimental devices, single-crystal samples in one side and polycrystalline samples on the other can be considered. A sample is a single crystal or monocrystalline if the lattice is continuous and unbroken on the entire sample and it is optically clear and with no grain boundaries. Furthermore in single crystal XRD, as an additional distinction, the size of the single crystal should be small, preferably in the range from 0.1 to 0.2 millimetres. Polycrystalline samples will include nearly all the other solid samples. Nevertheless there is no chance to characterize a no single crystal sample by XRD if the amount of crystallites constituting the sample is not large enough. Ideally an infinite number of crystallites of sizes no higher than some micrometers are needed. But practically the restrictions are no strictly exclusive and there are e.g. several applications carried out on samples with a finite, limited number of crystallites. Although other kind of polycrystalline samples should not be excluded, such as metallic or bulk ceramic or thin film samples, we will refer here to the analysis with samples other than single crystals as x-ray powder diffraction (XRPD) analysis.
From single-crystal XRD data it is possible to solve and refine the crystalline structure of a new material. It is a non destructive analysis and the possibilities of success are very high and have radically increased over the last 15 years with the improvement of the experimental devices and the continuous progress in crystal-structure solution and refinement methodologies [5, 6]. Knowledge of the crystal structure is of crucial relevance for a proper understanding of the material properties.
As it will be shown, XRPD analysis has a wide range of applications [7, 8]. From the basic distinction between amorphous and crystalline materials through phase analysis to full profile analysis (with possibilities of microstructural characterization and refinement and solution of crystalline structures), the analysis are always not destructive and cover a great variety of scientific disciplines.
In this article, possibilities and examples of applications of both single-crystal XRD and XRPD are presented.
2. 2. 2. 2. SSSSingle crystalingle crystalingle crystalingle crystal xxxx----ray diffraction ray diffraction ray diffraction ray diffraction (single crystal XRD)(single crystal XRD)(single crystal XRD)(single crystal XRD)
2.1. Samples, instrumentation and data collection The samples are unfracturated and optically clear single crystals. Their size should be between 0.1 and 0.2 millimetres in the three directions of space. They are normally selected using an optical microscope (x40) equipped with a polarizing attachment and observing if light extinguishes regularly every 90º when turning the stage of the microscope.

X-ray single crystal and powder diffraction
2
MT.9
A selected crystal is fixed on the tip of a thin glass fibre using epoxy or cement, or in a loop including specific oil, which fits into the goniometer head in the diffractometer. The crystal is then aligned along the beam direction.
It is necessary to know the stability properties of the crystals. Crystals can be sensitive to light, air or moisture, or susceptible to loss of crystallisation solvent. If so, a special treatment is required. For example, they can be mounted inside sealed glass capillaries or the data collection can be performed at low temperature.
Figure 1 depicts the x-ray single crystal diffractometer MAR345 at the CCiTUB. It works with the usual monochromatic Mo Kα radiation (λ=0.7108 Å) and it is equipped with a 2D Image Plate detector. Figure 2 shows a detail of the sample location, being visible the goniometer head and the low-temperature attachment.
Figure 1: Single crystal x-ray diffractometer MAR345 at the CCiTUB.
Figure 2: Detail of the goniometer and low temperature system in the MAR345 single
crystal diffractometer at the CCiTUB
Once the crystal is mounted on the diffractometer, the appropriate parameters for each measurement such as the distance to the detector and the space of the Ewald sphere are selected, and the intensity data is collected. Data are typically obtained between 3 º and 30 º2θ when using molybdenum radiation. Generally, a complete data collection may require between 3 to 12 hours, depending on the specimen and the diffractometer. Some of the measured intensities enable the calculation of the unit cell parameters. Then all the intensities are indexed and a list of observed hkl reflections is obtained (see below)
2.2. Structure determination methodology The intensity of x-rays in a diffraction pattern depending only upon the crystal structure is referred to as called the structure factor:
])(2[exp[)(1
jjj
N
jj lzkyhxifhklF ++=∑
=π (1)
where h, k and l are the indices of the diffraction planes (Bragg reflections), N is the number of atoms in the cell and (xj ,yj , zj) are the fractional coordinates of the jth atom with scattering factor fj. Each structure factor represents a diffracted beam which has an amplitude F(hkl) and a relative phase φ(hkl).
The crystal structure can be obtained from the diffraction pattern if the electron density function is calculated at every point in a single unit cell:
])(])(2cos[exp[)(1
),,( hkllzkyhxhklFV
zyxh k l
jjj φπρ −++= ∑∑∑ (2)
where the summation is over all values of h, k and l and V is the volume of the unit cell. Since x-rays are diffracted from the whole crystal, the calculation yields the contents of the unit cell averaged over the whole crystal. In practice, the calculation of the electron density produces maps. The maxima on these maps represent the position of the atoms in the cell.

X-ray single crystal and powder diffraction
3
MT.9
The structure factors are reciprocal space vectors whereas the electron density is from the real space. The diffraction pattern is the Fourier transform of the electron density and the electron density is the inverse Fourier transform of the diffraction pattern. The measured intensities of a diffraction pattern enable the determination of only the structure factor amplitudes but not their phases. The calculation of the electron density is not then obtained directly from experimental measurements and the phases must be obtained by other methods. This is the so called phase problem. The most usual methods to overcome the phase problem are direct methods and methods based on the Patterson function. The former are the most important in chemical crystallography and the latter are currently applied when some heavy atoms are present. The phases are obtained approximately and have to be improved. With the calculated phases and structure factors amplitudes, a first electron density map is calculated, also approximate, from which the atomic positions will be obtained.
The next step is the completion of the structure by Fourier synthesis and refinement of the structural parameters to optimise the fitting between the observed and calculated intensities in the diffraction pattern. The refinement cycles include positional atomic parameters and anisotropic vibration parameters. Finally, the hydrogen atom positions, if present, are determined or calculated. The structural refinement is evaluated from the agreement between the calculated and the measured structure factors. The refinement is considered finished when the following essential conditions are fulfilled:
- The agreement factors are small enough. - The structural model is chemically appropriate - The estimated standard deviations of all geometrical parameters are as small as possible - The peaks remaining in the electron density map are as small as possible. Once the structure is determined and refined several geometrical parameters such as bond
lengths, bond angles, torsion angles, π-stakings and hydrogen-bond are evaluated and appropriate tables and graphics representing the structure are prepared. A standard file (CIF: crystal information file) containing all the information of the structure is created and can be used to evaluate their quality and possible problems.
2.3 Examples of applications The determination of the crystal structure is crucial in many different applications. The knowledge of the atomic, three dimensional distributions influences and enables to understand properties of molecules and materials. Three different fields of applications that include crystal structures solved at the CCiTUB are illustrated.
2.3.1. Magneto-structural correlations in molecular materials Current trends in the research field of molecular magnetism mainly involve activities in three classes of molecular materials, namely, multifunctional magnetic materials, nanostructured magnetic materials, and molecular nanomagnets. As far as molecular nanomagnets are concerned, the past few years have witnessed an explosive growth in the interest in single-molecule magnets (SMMs) due to their potential interest as information storage materials, quantum-bits in quantum computation or bioinorganic/biomedical applications. Magneto-structural correlations, often including discrete Fourier transform (DFT) calculations based on structural parameters are one of the main targets in molecular magnetism and the determination of the crystalline structures is the fundamental tool in this kind of research by two main reasons: it is the only technique able to give unambiguously the nuclearity and the intermetallic bridges which determine the magnetic properties and on the other hand, at molecular level the character of the magnetic interactions (ferro-, antiferro- or ferromagnetic response) and its magnitude, is strongly dependent on the overlap of molecular orbitals which are directly related to the magnitude of bond distances, angles or torsions.
X-ray single crystal and powder diffraction
4
MT.9
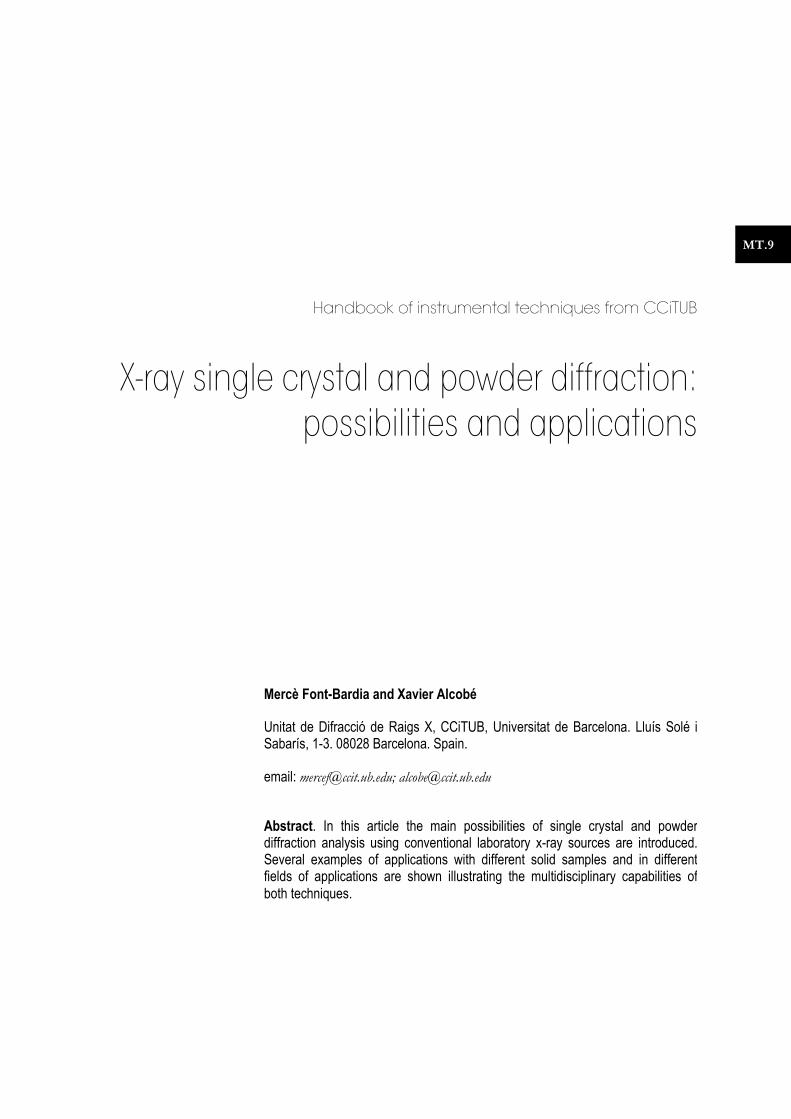
Figure 3: Molecular structure (top) and
labelled core (bottom) of [Mn6O2(OMe)2(dapdoH)4]
(NO3)2· 2(Et)2·2MeOH
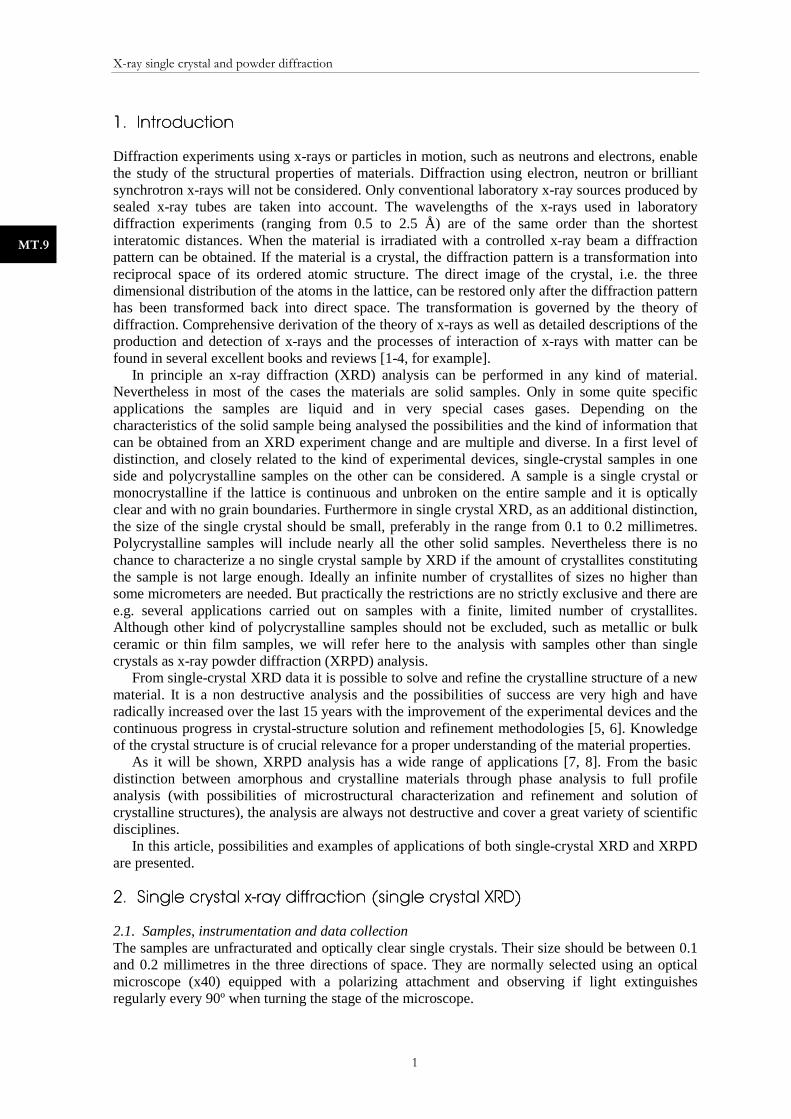
Figure 4: Possible spin arrangements for compounds of
[Mn6O2(OMe)2
(dapdoH)4](NO3)2·2(Et)2·2MeOH
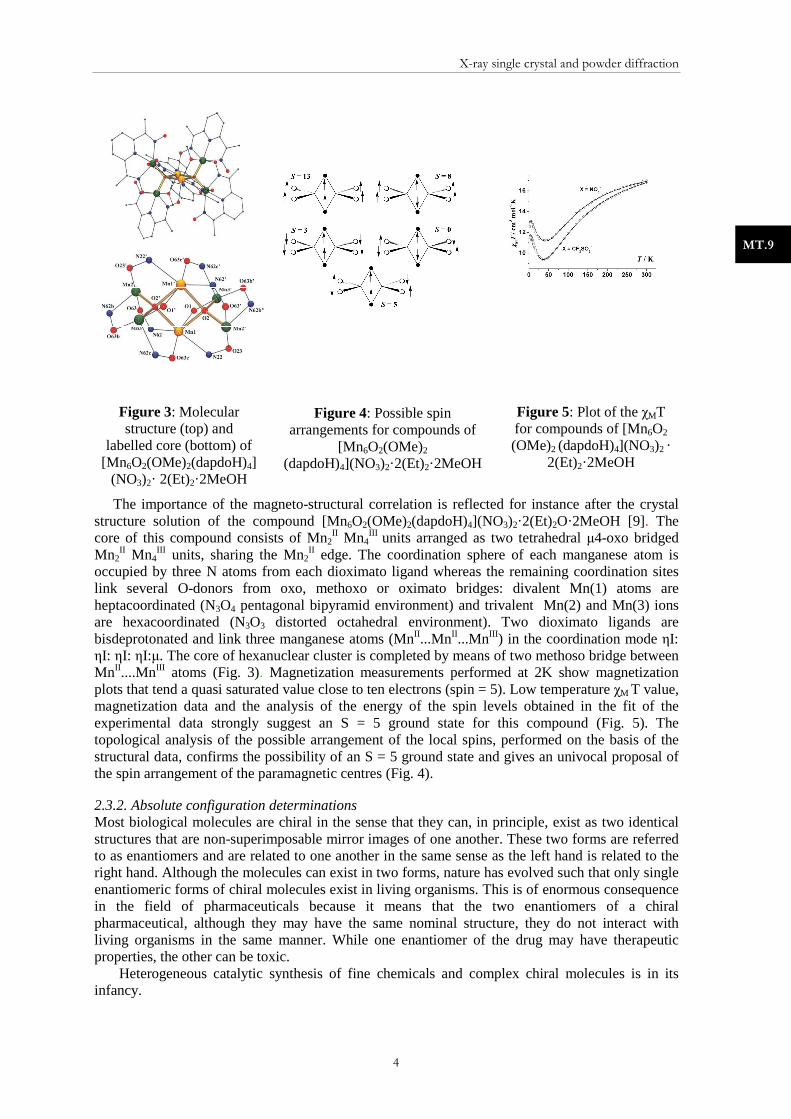
Figure 5: Plot of the χMT for compounds of [Mn6O2
(OMe)2 (dapdoH)4](NO3)2 · 2(Et)2·2MeOH
The importance of the magneto-structural correlation is reflected for instance after the crystal structure solution of the compound [Mn6O2(OMe)2(dapdoH)4](NO3)2·2(Et)2O·2MeOH [9]. The core of this compound consists of Mn2
II Mn4III units arranged as two tetrahedral µ4-oxo bridged
Mn2II Mn4
III units, sharing the Mn2II edge. The coordination sphere of each manganese atom is
occupied by three N atoms from each dioximato ligand whereas the remaining coordination sites link several O-donors from oxo, methoxo or oximato bridges: divalent Mn(1) atoms are heptacoordinated (N3O4 pentagonal bipyramid environment) and trivalent Mn(2) and Mn(3) ions are hexacoordinated (N3O3 distorted octahedral environment). Two dioximato ligands are bisdeprotonated and link three manganese atoms (MnII...MnII...MnIII ) in the coordination mode ηI: ηI: ηI: ηI:µ. The core of hexanuclear cluster is completed by means of two methoso bridge between MnII....MnIII atoms (Fig. 3). Magnetization measurements performed at 2K show magnetization plots that tend a quasi saturated value close to ten electrons (spin = 5). Low temperature χM T value, magnetization data and the analysis of the energy of the spin levels obtained in the fit of the experimental data strongly suggest an S = 5 ground state for this compound (Fig. 5). The topological analysis of the possible arrangement of the local spins, performed on the basis of the structural data, confirms the possibility of an S = 5 ground state and gives an univocal proposal of the spin arrangement of the paramagnetic centres (Fig. 4).
2.3.2. Absolute configuration determinations Most biological molecules are chiral in the sense that they can, in principle, exist as two identical structures that are non-superimposable mirror images of one another. These two forms are referred to as enantiomers and are related to one another in the same sense as the left hand is related to the right hand. Although the molecules can exist in two forms, nature has evolved such that only single enantiomeric forms of chiral molecules exist in living organisms. This is of enormous consequence in the field of pharmaceuticals because it means that the two enantiomers of a chiral pharmaceutical, although they may have the same nominal structure, they do not interact with living organisms in the same manner. While one enantiomer of the drug may have therapeutic properties, the other can be toxic.
Heterogeneous catalytic synthesis of fine chemicals and complex chiral molecules is in its infancy.
X-ray single crystal and powder diffraction
5
MT.9
The enantioselective synthesis of such molecules requires environments that are themselves chiral and of a single handedness. This has generated a great deal of interest in the preparation of chiral materials and surfaces for use as heterogeneous catalysts. The most widely pursued approach to the preparation of enantioselective heterogeneous catalysts has been the use of chiral organic templates which bind to the surface of a catalyst and create a chiral environment in which catalytic reactions can occur [10].
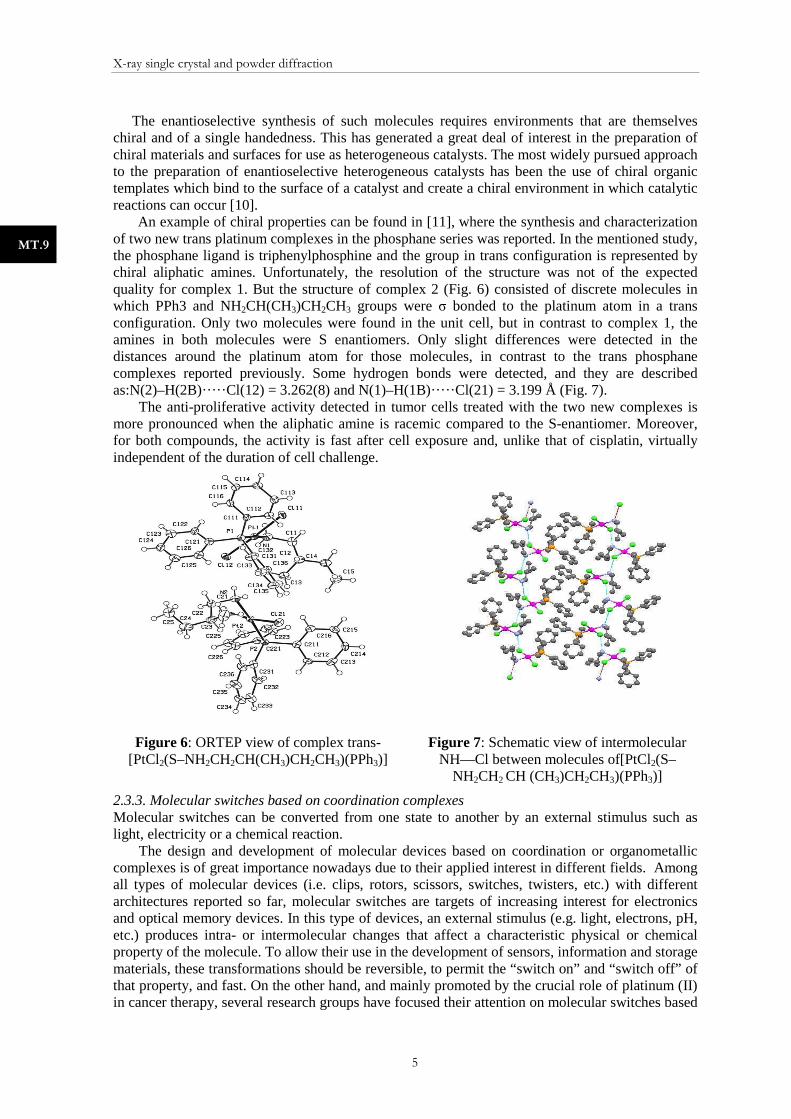
An example of chiral properties can be found in [11], where the synthesis and characterization of two new trans platinum complexes in the phosphane series was reported. In the mentioned study, the phosphane ligand is triphenylphosphine and the group in trans configuration is represented by chiral aliphatic amines. Unfortunately, the resolution of the structure was not of the expected quality for complex 1. But the structure of complex 2 (Fig. 6) consisted of discrete molecules in which PPh3 and NH2CH(CH3)CH2CH3 groups were σ bonded to the platinum atom in a trans configuration. Only two molecules were found in the unit cell, but in contrast to complex 1, the amines in both molecules were S enantiomers. Only slight differences were detected in the distances around the platinum atom for those molecules, in contrast to the trans phosphane complexes reported previously. Some hydrogen bonds were detected, and they are described as:N(2)–H(2B)·····Cl(12) = 3.262(8) and N(1)–H(1B)·····Cl(21) = 3.199 Å (Fig. 7).
The anti-proliferative activity detected in tumor cells treated with the two new complexes is more pronounced when the aliphatic amine is racemic compared to the S-enantiomer. Moreover, for both compounds, the activity is fast after cell exposure and, unlike that of cisplatin, virtually independent of the duration of cell challenge.
Figure 6: ORTEP view of complex trans-[PtCl2(S–NH2CH2CH(CH3)CH2CH3)(PPh3)]
Figure 7: Schematic view of intermolecular NH—Cl between molecules of[PtCl2(S–
NH2CH2 CH (CH3)CH2CH3)(PPh3)]
2.3.3. Molecular switches based on coordination complexes Molecular switches can be converted from one state to another by an external stimulus such as light, electricity or a chemical reaction.
The design and development of molecular devices based on coordination or organometallic complexes is of great importance nowadays due to their applied interest in different fields. Among all types of molecular devices (i.e. clips, rotors, scissors, switches, twisters, etc.) with different architectures reported so far, molecular switches are targets of increasing interest for electronics and optical memory devices. In this type of devices, an external stimulus (e.g. light, electrons, pH, etc.) produces intra- or intermolecular changes that affect a characteristic physical or chemical property of the molecule. To allow their use in the development of sensors, information and storage materials, these transformations should be reversible, to permit the “switch on” and “switch off” of that property, and fast. On the other hand, and mainly promoted by the crucial role of platinum (II) in cancer therapy, several research groups have focused their attention on molecular switches based
X-ray single crystal and powder diffraction
6
MT.9
on platinum (II) complexes. A few articles showing the utility of such compounds as sensors for amino acids and proteins have been published recently, but examples of acid/base-based molecular switches are scarce. In addition, ferrocene and its derivatives contain a redox-active centre, and this property, which is specially interesting in view of their applications in different areas including bio-organometallic chemistry, bio-technology and medicine, has also been used to prepare electrochemical devices for gene sensors and glucose detection as well as molecular switches for non-linear optical properties (NLO) or for the fluorescence of ferrocene derivatives.
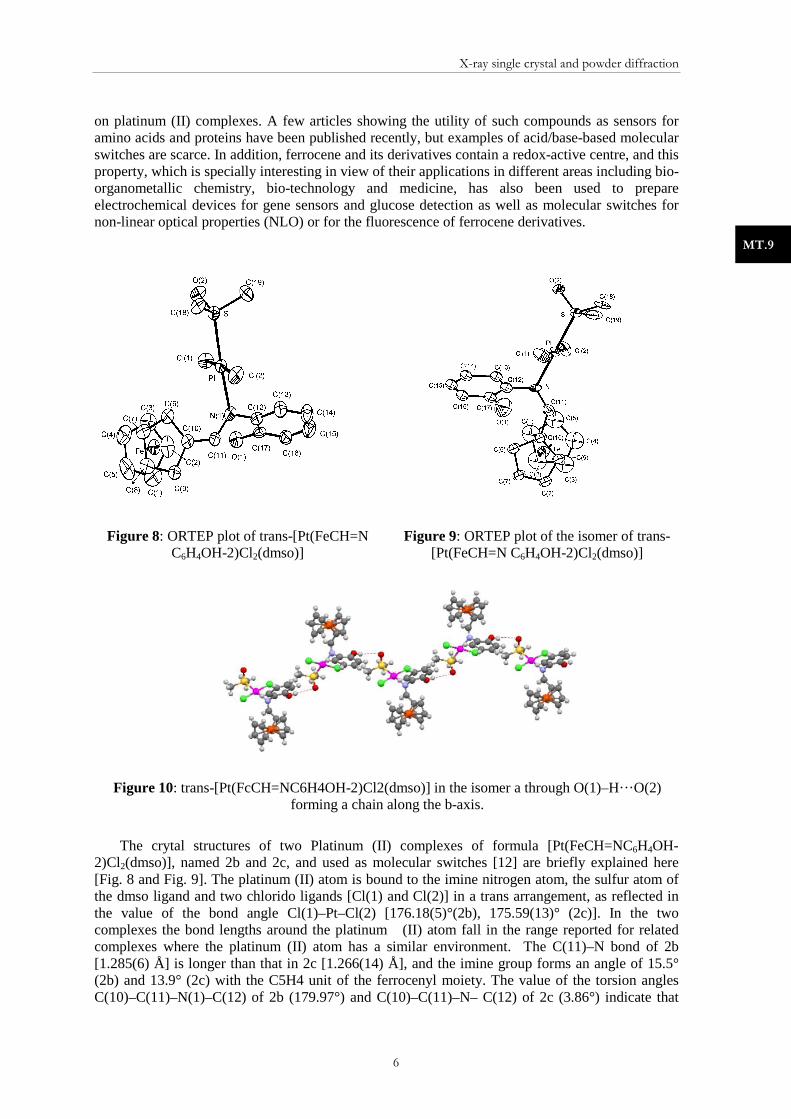
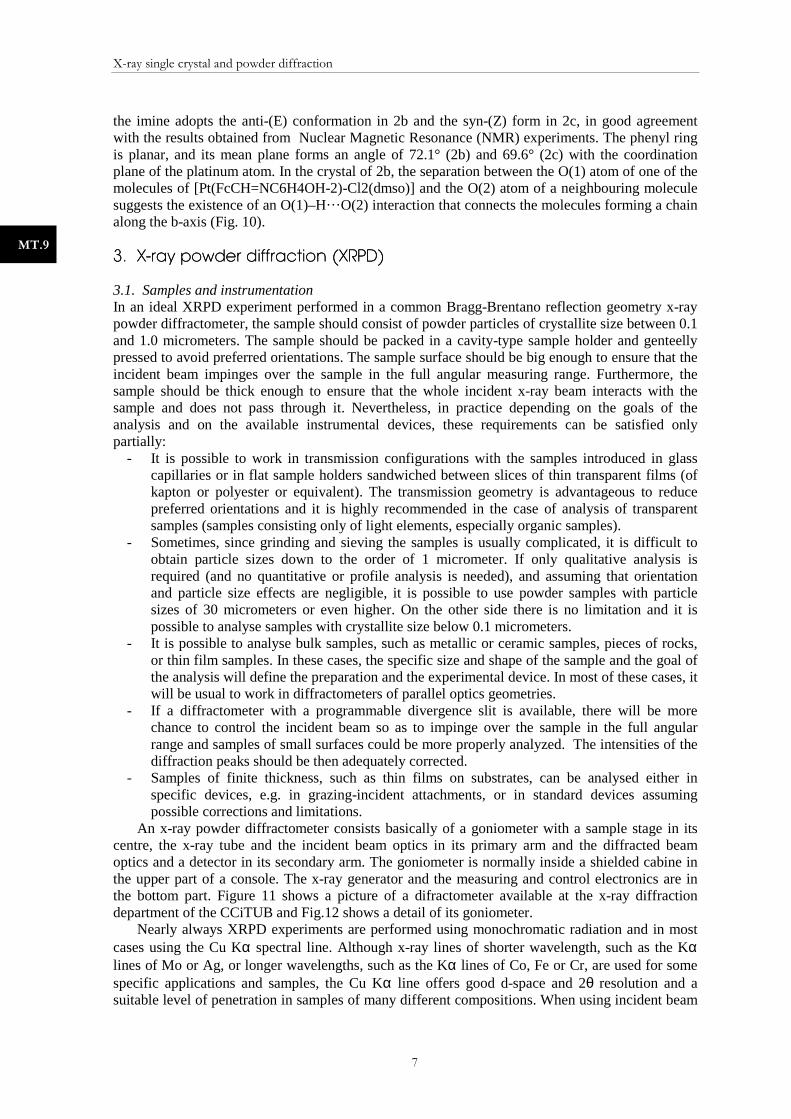
Figure 8: ORTEP plot of trans-[Pt(FeCH=N C6H4OH-2)Cl2(dmso)]
Figure 9: ORTEP plot of the isomer of trans-[Pt(FeCH=N C6H4OH-2)Cl2(dmso)]
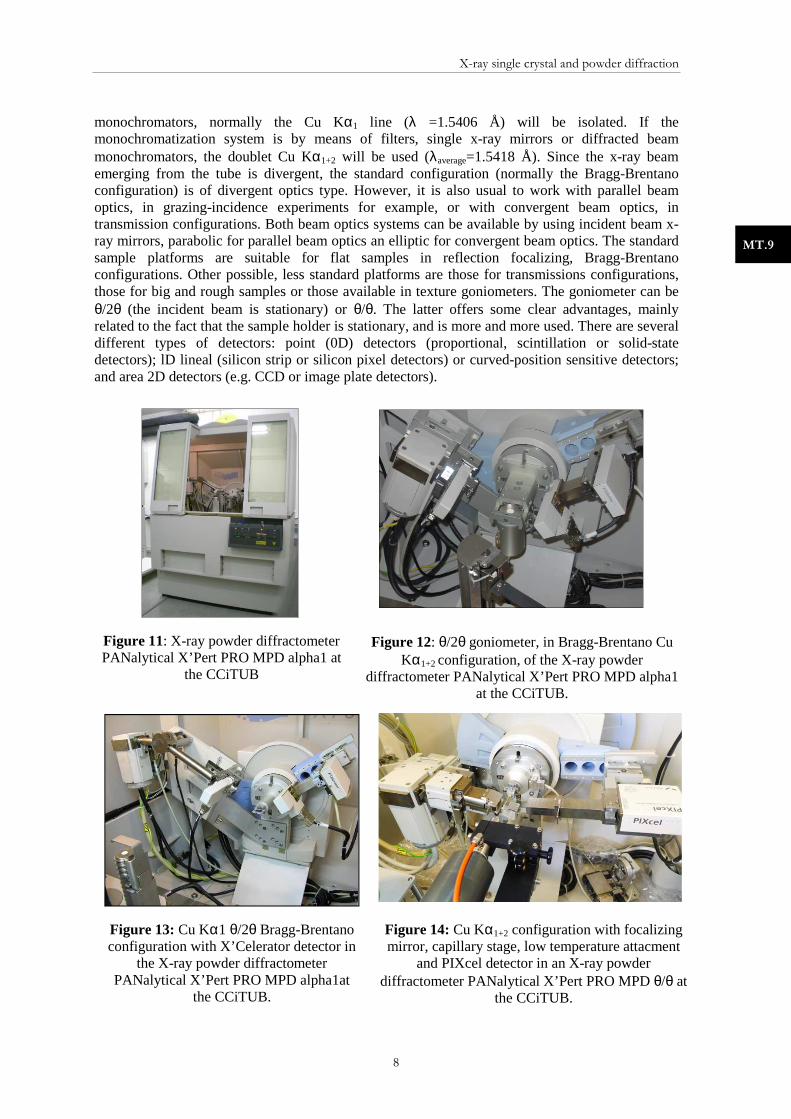
Figure 10: trans-[Pt(FcCH=NC6H4OH-2)Cl2(dmso)] in the isomer a through O(1)–H···O(2) forming a chain along the b-axis.
The crytal structures of two Platinum (II) complexes of formula [Pt(FeCH=NC6H4OH-2)Cl2(dmso)], named 2b and 2c, and used as molecular switches [12] are briefly explained here [Fig. 8 and Fig. 9]. The platinum (II) atom is bound to the imine nitrogen atom, the sulfur atom of the dmso ligand and two chlorido ligands [Cl(1) and Cl(2)] in a trans arrangement, as reflected in the value of the bond angle Cl(1)–Pt–Cl(2) [176.18(5)°(2b), 175.59(13)° (2c)]. In the two complexes the bond lengths around the platinum (II) atom fall in the range reported for related complexes where the platinum (II) atom has a similar environment. The C(11)–N bond of 2b [1.285(6) Å] is longer than that in 2c [1.266(14) Å], and the imine group forms an angle of 15.5° (2b) and 13.9° (2c) with the C5H4 unit of the ferrocenyl moiety. The value of the torsion angles C(10)–C(11)–N(1)–C(12) of 2b (179.97°) and C(10)–C(11)–N– C(12) of 2c (3.86°) indicate that
X-ray single crystal and powder diffraction
7
MT.9
the imine adopts the anti-(E) conformation in 2b and the syn-(Z) form in 2c, in good agreement with the results obtained from Nuclear Magnetic Resonance (NMR) experiments. The phenyl ring is planar, and its mean plane forms an angle of 72.1° (2b) and 69.6° (2c) with the coordination plane of the platinum atom. In the crystal of 2b, the separation between the O(1) atom of one of the molecules of [Pt(FcCH=NC6H4OH-2)-Cl2(dmso)] and the O(2) atom of a neighbouring molecule suggests the existence of an O(1)–H···O(2) interaction that connects the molecules forming a chain along the b-axis (Fig. 10).
3. 3. 3. 3. XXXX----ray powder diffraction (XRPD)ray powder diffraction (XRPD)ray powder diffraction (XRPD)ray powder diffraction (XRPD)
3.1. Samples and instrumentation In an ideal XRPD experiment performed in a common Bragg-Brentano reflection geometry x-ray powder diffractometer, the sample should consist of powder particles of crystallite size between 0.1 and 1.0 micrometers. The sample should be packed in a cavity-type sample holder and genteelly pressed to avoid preferred orientations. The sample surface should be big enough to ensure that the incident beam impinges over the sample in the full angular measuring range. Furthermore, the sample should be thick enough to ensure that the whole incident x-ray beam interacts with the sample and does not pass through it. Nevertheless, in practice depending on the goals of the analysis and on the available instrumental devices, these requirements can be satisfied only partially:
- It is possible to work in transmission configurations with the samples introduced in glass capillaries or in flat sample holders sandwiched between slices of thin transparent films (of kapton or polyester or equivalent). The transmission geometry is advantageous to reduce preferred orientations and it is highly recommended in the case of analysis of transparent samples (samples consisting only of light elements, especially organic samples).
- Sometimes, since grinding and sieving the samples is usually complicated, it is difficult to obtain particle sizes down to the order of 1 micrometer. If only qualitative analysis is required (and no quantitative or profile analysis is needed), and assuming that orientation and particle size effects are negligible, it is possible to use powder samples with particle sizes of 30 micrometers or even higher. On the other side there is no limitation and it is possible to analyse samples with crystallite size below 0.1 micrometers.
- It is possible to analyse bulk samples, such as metallic or ceramic samples, pieces of rocks, or thin film samples. In these cases, the specific size and shape of the sample and the goal of the analysis will define the preparation and the experimental device. In most of these cases, it will be usual to work in diffractometers of parallel optics geometries.
- If a diffractometer with a programmable divergence slit is available, there will be more chance to control the incident beam so as to impinge over the sample in the full angular range and samples of small surfaces could be more properly analyzed. The intensities of the diffraction peaks should be then adequately corrected.
- Samples of finite thickness, such as thin films on substrates, can be analysed either in specific devices, e.g. in grazing-incident attachments, or in standard devices assuming possible corrections and limitations.
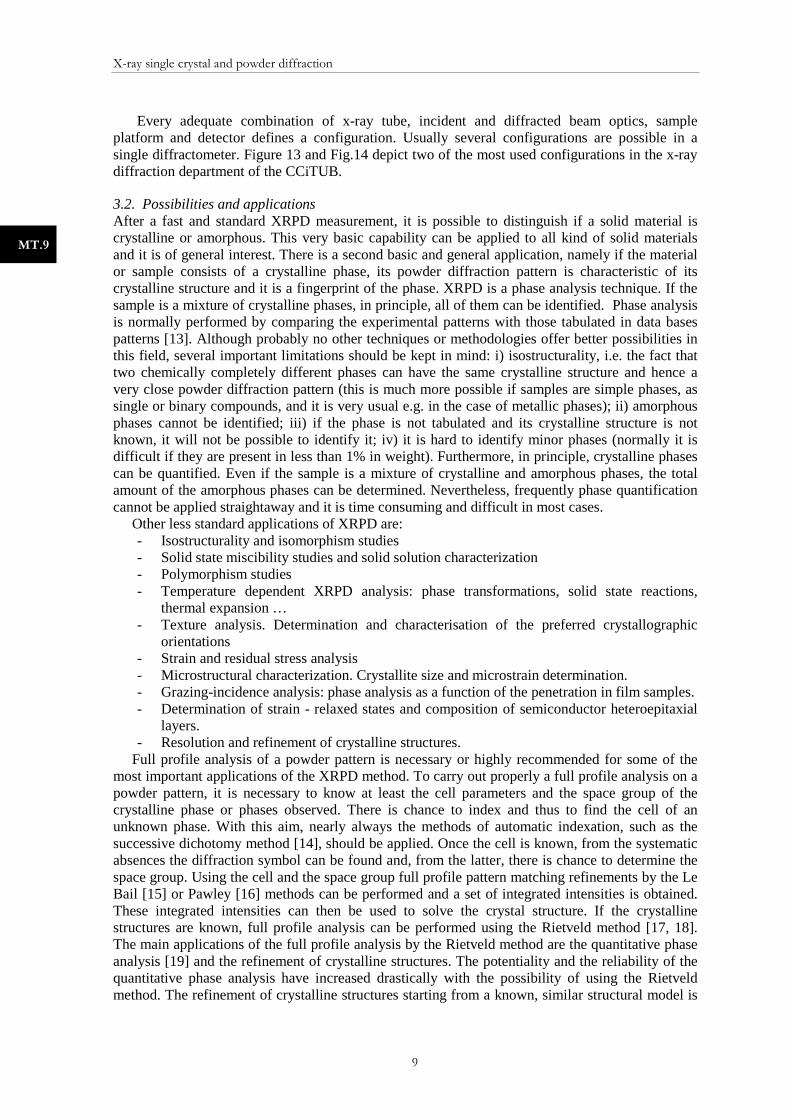
An x-ray powder diffractometer consists basically of a goniometer with a sample stage in its centre, the x-ray tube and the incident beam optics in its primary arm and the diffracted beam optics and a detector in its secondary arm. The goniometer is normally inside a shielded cabine in the upper part of a console. The x-ray generator and the measuring and control electronics are in the bottom part. Figure 11 shows a picture of a difractometer available at the x-ray diffraction department of the CCiTUB and Fig.12 shows a detail of its goniometer.
Nearly always XRPD experiments are performed using monochromatic radiation and in most cases using the Cu Kα spectral line. Although x-ray lines of shorter wavelength, such as the Kα lines of Mo or Ag, or longer wavelengths, such as the Kα lines of Co, Fe or Cr, are used for some specific applications and samples, the Cu Kα line offers good d-space and 2θ resolution and a suitable level of penetration in samples of many different compositions. When using incident beam
X-ray single crystal and powder diffraction
8
MT.9
monochromators, normally the Cu Kα1 line (λ =1.5406 Å) will be isolated. If the monochromatization system is by means of filters, single x-ray mirrors or diffracted beam monochromators, the doublet Cu Kα1+2 will be used (λaverage=1.5418 Å). Since the x-ray beam emerging from the tube is divergent, the standard configuration (normally the Bragg-Brentano configuration) is of divergent optics type. However, it is also usual to work with parallel beam optics, in grazing-incidence experiments for example, or with convergent beam optics, in transmission configurations. Both beam optics systems can be available by using incident beam x-ray mirrors, parabolic for parallel beam optics an elliptic for convergent beam optics. The standard sample platforms are suitable for flat samples in reflection focalizing, Bragg-Brentano configurations. Other possible, less standard platforms are those for transmissions configurations, those for big and rough samples or those available in texture goniometers. The goniometer can be θ/2θ (the incident beam is stationary) or θ/θ. The latter offers some clear advantages, mainly related to the fact that the sample holder is stationary, and is more and more used. There are several different types of detectors: point (0D) detectors (proportional, scintillation or solid-state detectors); lD lineal (silicon strip or silicon pixel detectors) or curved-position sensitive detectors; and area 2D detectors (e.g. CCD or image plate detectors).
Figure 11: X-ray powder diffractometer PANalytical X’Pert PRO MPD alpha1 at
the CCiTUB
Figure 12: θ/2θ goniometer, in Bragg-Brentano Cu Kα1+2 configuration, of the X-ray powder
diffractometer PANalytical X’Pert PRO MPD alpha1 at the CCiTUB.
Figure 13: Cu Kα1 θ/2θ Bragg-Brentano configuration with X’Celerator detector in
the X-ray powder diffractometer PANalytical X’Pert PRO MPD alpha1at
the CCiTUB.
Figure 14: Cu Kα1+2 configuration with focalizing mirror, capillary stage, low temperature attacment
and PIXcel detector in an X-ray powder diffractometer PANalytical X’Pert PRO MPD θ/θ at
the CCiTUB.
X-ray single crystal and powder diffraction
9
MT.9
Every adequate combination of x-ray tube, incident and diffracted beam optics, sample platform and detector defines a configuration. Usually several configurations are possible in a single diffractometer. Figure 13 and Fig.14 depict two of the most used configurations in the x-ray diffraction department of the CCiTUB.
3.2. Possibilities and applications After a fast and standard XRPD measurement, it is possible to distinguish if a solid material is crystalline or amorphous. This very basic capability can be applied to all kind of solid materials and it is of general interest. There is a second basic and general application, namely if the material or sample consists of a crystalline phase, its powder diffraction pattern is characteristic of its crystalline structure and it is a fingerprint of the phase. XRPD is a phase analysis technique. If the sample is a mixture of crystalline phases, in principle, all of them can be identified. Phase analysis is normally performed by comparing the experimental patterns with those tabulated in data bases patterns [13]. Although probably no other techniques or methodologies offer better possibilities in this field, several important limitations should be kept in mind: i) isostructurality, i.e. the fact that two chemically completely different phases can have the same crystalline structure and hence a very close powder diffraction pattern (this is much more possible if samples are simple phases, as single or binary compounds, and it is very usual e.g. in the case of metallic phases); ii) amorphous phases cannot be identified; iii) if the phase is not tabulated and its crystalline structure is not known, it will not be possible to identify it; iv) it is hard to identify minor phases (normally it is difficult if they are present in less than 1% in weight). Furthermore, in principle, crystalline phases can be quantified. Even if the sample is a mixture of crystalline and amorphous phases, the total amount of the amorphous phases can be determined. Nevertheless, frequently phase quantification cannot be applied straightaway and it is time consuming and difficult in most cases.
Other less standard applications of XRPD are: - Isostructurality and isomorphism studies - Solid state miscibility studies and solid solution characterization - Polymorphism studies - Temperature dependent XRPD analysis: phase transformations, solid state reactions,
thermal expansion … - Texture analysis. Determination and characterisation of the preferred crystallographic
orientations - Strain and residual stress analysis - Microstructural characterization. Crystallite size and microstrain determination. - Grazing-incidence analysis: phase analysis as a function of the penetration in film samples. - Determination of strain - relaxed states and composition of semiconductor heteroepitaxial
layers. - Resolution and refinement of crystalline structures.
Full profile analysis of a powder pattern is necessary or highly recommended for some of the most important applications of the XRPD method. To carry out properly a full profile analysis on a powder pattern, it is necessary to know at least the cell parameters and the space group of the crystalline phase or phases observed. There is chance to index and thus to find the cell of an unknown phase. With this aim, nearly always the methods of automatic indexation, such as the successive dichotomy method [14], should be applied. Once the cell is known, from the systematic absences the diffraction symbol can be found and, from the latter, there is chance to determine the space group. Using the cell and the space group full profile pattern matching refinements by the Le Bail [15] or Pawley [16] methods can be performed and a set of integrated intensities is obtained. These integrated intensities can then be used to solve the crystal structure. If the crystalline structures are known, full profile analysis can be performed using the Rietveld method [17, 18]. The main applications of the full profile analysis by the Rietveld method are the quantitative phase analysis [19] and the refinement of crystalline structures. The potentiality and the reliability of the quantitative phase analysis have increased drastically with the possibility of using the Rietveld method. The refinement of crystalline structures starting from a known, similar structural model is
X-ray single crystal and powder diffraction
10
MT.9
the first application of the Rietveld method. Furthermore, at present, the method is applied extensively to refine structures solved ab initio from XRPD data. In addition, full profile analysis either with the pattern matching or with the Rietveld method can be applied for microstructural characterization.
3.3. Examples of applications In this section, four examples of different XRPD applications using four different kind of samples analysed at the CCiTUB are presented.
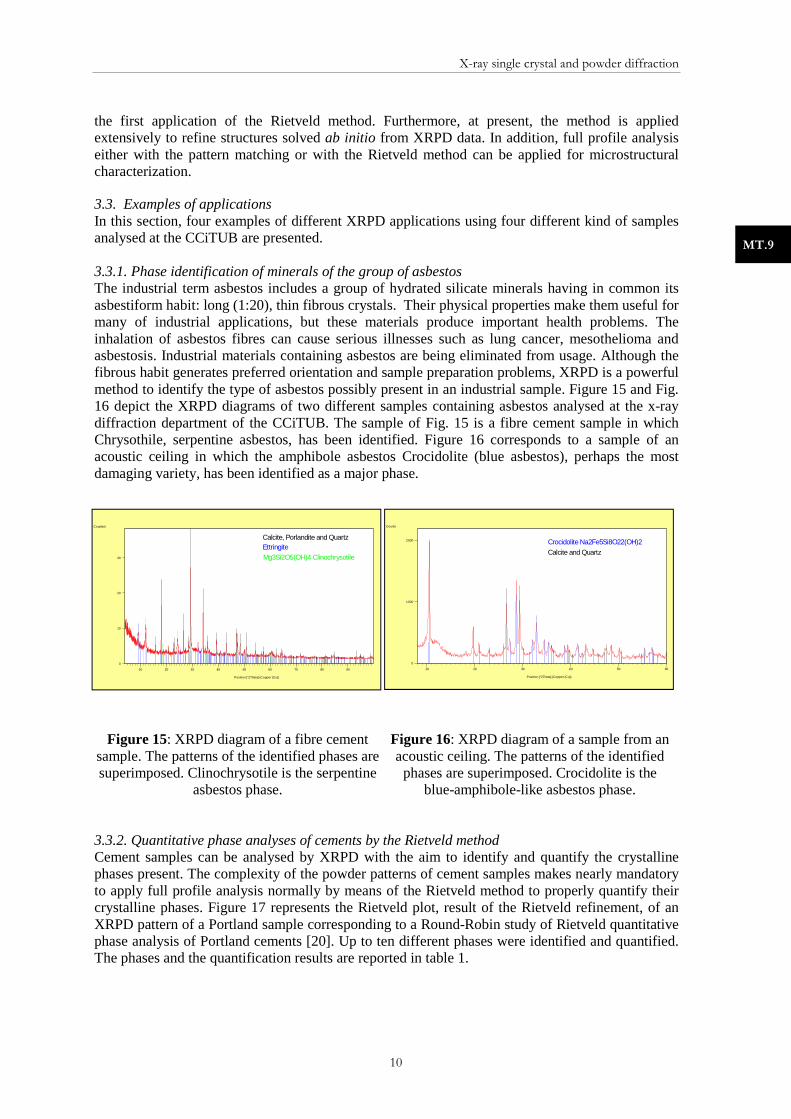
3.3.1. Phase identification of minerals of the group of asbestos The industrial term asbestos includes a group of hydrated silicate minerals having in common its asbestiform habit: long (1:20), thin fibrous crystals. Their physical properties make them useful for many of industrial applications, but these materials produce important health problems. The inhalation of asbestos fibres can cause serious illnesses such as lung cancer, mesothelioma and asbestosis. Industrial materials containing asbestos are being eliminated from usage. Although the fibrous habit generates preferred orientation and sample preparation problems, XRPD is a powerful method to identify the type of asbestos possibly present in an industrial sample. Figure 15 and Fig. 16 depict the XRPD diagrams of two different samples containing asbestos analysed at the x-ray diffraction department of the CCiTUB. The sample of Fig. 15 is a fibre cement sample in which Chrysothile, serpentine asbestos, has been identified. Figure 16 corresponds to a sample of an acoustic ceiling in which the amphibole asbestos Crocidolite (blue asbestos), perhaps the most damaging variety, has been identified as a major phase.
Figure 15: XRPD diagram of a fibre cement sample. The patterns of the identified phases are superimposed. Clinochrysotile is the serpentine
asbestos phase.
Figure 16: XRPD diagram of a sample from an acoustic ceiling. The patterns of the identified phases are superimposed. Crocidolite is the
blue-amphibole-like asbestos phase.
3.3.2. Quantitative phase analyses of cements by the Rietveld method Cement samples can be analysed by XRPD with the aim to identify and quantify the crystalline phases present. The complexity of the powder patterns of cement samples makes nearly mandatory to apply full profile analysis normally by means of the Rietveld method to properly quantify their crystalline phases. Figure 17 represents the Rietveld plot, result of the Rietveld refinement, of an XRPD pattern of a Portland sample corresponding to a Round-Robin study of Rietveld quantitative phase analysis of Portland cements [20]. Up to ten different phases were identified and quantified. The phases and the quantification results are reported in table 1.
Position [°2Theta] (Copper (Cu))
10 20 30 40 50 60
Counts
0
1000
2000 Crocidolite Na2Fe5Si8O22(OH)2
Calcite and Quartz
Position [°2Theta] (Copper (Cu))
10 20 30 40 50 60 70 80 90
Counts/s
0
10
20
30
Calcite, Porlandite and Quartz
Mg3Si2O5(OH)4 ClinochrysotileEttringite

X-ray single crystal and powder diffraction
11
MT.9
Figure 17: Rietveld plot of a grey Porland cement sample. Ten phases were considered and quantified
Table 1: Results of the quantification by the Rietveld method of a grey Porland cement sample.
Phase Quantitative phase analysis results
(weight fraction) C3S, Ca3SiO5 61.9 (1.5) % C2S, Ca2SiO4 10.9 (1.0) %
C4AF, Ca2AlFeO5 9.2 (0.5) % CaCO3 Calcite 5.3 (0.6) % C3A, Ca3Al 2O6 4.4 (0.4) %
CaSO4·0.5H2O Bassanite 3.5 (0.6) % Aphthitalite K3Na(SO4)2 1.8 (0.3) %
MgO Periclase 1.3 (0.3) % CaSO4·2H2O Gypsum 1.2 (0.4) %
SiO2 Quartz 0.5 (0.2) %
3.3.3. Isotropic microstructural analysis of SnO2 samples by the Rietveld method The possible broadening of XRPD peaks due to sample effects can be treated by full profile analysis if the instrumental broadening is considered. The characteristics determining the sample broadening are usually referred to as microstructural effects. In many cases, the main microestructrual effects are the size of the diffracting domains (the crystallites) and the microstrain. Small crystallites of size below 0.1 micrometers broaden the XRPD peaks. On the other hand, if there is microstrain, there will be crystal lattice distortions that will also produce peak broadening. The size and microstrain contributions can be separated and determined by performing profile analysis. If the profile analysis is carried out over the full diffraction angle (2θ) range, these size and microstrain determinations will be more reliable and the possible anisotropy could be evaluated. Furthermore, if the full profile microstructural analysis is achieved by the Rietveld method, it will be consistent with the crystal structure of the analysed material.
Figure 18 represents the Rietveld plot of an isotropic microstructural analysis based on pseudo-Voigt profile fittings and using the methodology described in [21] of a Sb doped SnO2 powder sample. Figure 19 compares the powder pattern of this Sb doped SnO2 powder sample with that of the LaB6 (NIST SRM-660a) sample used to determine the instrumental broadening (the instrumental resolution function). The huge difference between the widths of the peaks of the problem sample (Sb doped SnO2) and those of the instrumental calibration standard (LaB6) is consequence of the important microstructural effects affecting the problem sample. The values obtained for size and microstrain are reported in figure 18.

Figure 18: Rieveld plot and microstructural results of a Sb doped SnO
3.3.4. Structure solution of an organic molecular XRPD plays an important role in the crystal structure determination of new materials which are not available as single crystals. In the last 20 yearspowder diffraction has increased considerably. The methods used to solve crystal powder diffraction can be divided in two groupsmethods, generally direct methods in an analogous way than with singlestrong limitations mainly related to the from the peak intensities due to strong peak overlapcase of molecular compounds and only success increase. In the second group of methodsmethods do not require the extraction of the structure factorspolyhedra, …) are located in the unit cell using global simulated annealing or genetic algorithmobserved diagrams in order to find respect to the reciprocal-space methods a molecular compound with laboratory XRPD data.
Figure 20 shows the crystal structure of the molecular compound, solved by directusing laboratory XRPD data obtainedtransmission geometry. Figure 2structure performed with FullProf [24
Figure 20: Crystal structure and Hirshfeld’s surface of form α of Vorinostat solved by XRPD
showing H-bonding contacts
SIZE = 50 ÅMICROSTRAIN = 0.44
X-ray single crystal and powder diffraction
12
: Rieveld plot and microstructural
a Sb doped SnO2 sample. Figure 19: Comparison of the XRPD diagrams
of the Sb doped SnO2 and LaB660a samples.
of an organic molecular compound from powder diffraction dataXRPD plays an important role in the crystal structure determination of new materials which are not available as single crystals. In the last 20 years, the number of structure determinations using
increased considerably. The methods used to solve crystal can be divided in two groups. In the first group there are the reciprocaldirect methods in an analogous way than with single-crystal data
strong limitations mainly related to the difficulties of extracting the factor structure amplitudes strong peak overlapping. These limitations are much
case of molecular compounds and only if x-ray synchrotron data are available, the possibilities increase. In the second group of methods, there are the direct-space methods. These
methods do not require the extraction of the structure factors, and building units (molecules, re located in the unit cell using global optimization methods (such as Monte Carlo
simulated annealing or genetic algorithms). The calculated XRPD diagrams are compared with the in order to find the best agreement. The possibilities of success
methods and it is possible and quite usual e.g. to solve a structure of a molecular compound with laboratory XRPD data.
shows the crystal structure of the α form of Vorinostat [22], a pharmolecular compound, solved by direct-space methods by means of the FOX software
data obtained with a PANalytical X`Pert MPD diffractometer in a capillary 21 depicts the Rietveld plot of the final refinement
ture performed with FullProf [24].
ucture and Hirshfeld’s of Vorinostat solved by XRPD
bonding contacts
Figure 21: Rietveld plot of the final refinement of the crystal structure of form
Å MICROSTRAIN = 0.44 %
20 30 40 50 60 70 800
2500
10000
22500
40000
62500
Inte
nsity
(co
unts
)
ray single crystal and powder diffraction
MT.9
the XRPD diagrams and LaB6 NIST SRM-
660a samples.
compound from powder diffraction data XRPD plays an important role in the crystal structure determination of new materials which are not
the number of structure determinations using increased considerably. The methods used to solve crystal structures by
. In the first group there are the reciprocal-space crystal data, but with
the factor structure amplitudes limitations are much stronger in the
the possibilities of space methods. These
and building units (molecules, methods (such as Monte Carlo,
compared with the of success increase with
e.g. to solve a structure of
, a pharmaceutical software [23] and
a PANalytical X`Pert MPD diffractometer in a capillary l refinement of this crystal
Rietveld plot of the final refinement
of form α of Vorinostat.
90 100 110 1202Theta (°)

X-ray single crystal and powder diffraction
13
MT.9
ReferencesReferencesReferencesReferences
[1] Shmueli, U. Ed. 2001 International Tables for Crystallography, vol. B, Second Edition, Kluwer Academic Publishers, Boston/Dordrecht/London
[2] Wilson, A.J.C., Prince E., Ed. 1999 International Tables for Crystallography, vol. C, Second Edition, Kluwer Academic Publishers, Boston/Dordrecht/London
[3] Cullity, B.D. 1978 Elements of X-ray Diffraction, 2nd ed. Reading, Massachusetts, Addison-Wesley publishing company inc.
[4] Klug, H.P. Alexander, L.E.S 1974 X-ray Diffraction Procedures. For Policrystalline and Amorphous Materials, 2nd ed., New York, John Willey and Sons
[5] Clegg, W., Blake, A.J., Gould, R.O., Maint, P. 2001 Crystal structure analysis. Principles and Practice, Oxford University Press.
[6] Müller, P., Herbst-Irmer, R., Spek, A.L., T.R. Schneider, M. Sawaya 2005 Crystal Structure Refinement, Oxford University Press
[7] Bish, D.L., POST, J.E. 1989 Modern Powder Diffraction, Washington D.C., The Mineralogical Society of America (Reviews in Mineralogy)
[8] Pecharsky, V.K., Zavalij, P.Y. 2003 Fundamentals of Powder Diffraction and Structural Characterization of Materials. New York: Springer
[9] Escuer, A., Cordero, B., Font-Bardia, M., Calvet, T., Roubeau, O., Teat, S.J., Fedi, S., Fabrizzi de Biani, F. 2010, Dalton Transactions 39 4817
[10] Gellman, A.J., Horvatha, J.D., Buelowa, M.T. 2001, Journal of Molecular Catalysis A: Chemical 167, 1-2, 3
[11] A.G. Quiroga, A.G., Ramos-Lima, F.J., Alvarez-Valdés, A., Font-Bardia, M., Bergamo, A., Sava, G., Navarro-Ranninger, C. 2011 Polyhedron 30 1646
[12] S. Pérez, S. López, C., Caubet, A., Solans, X, Font-Bardia, M. 2008, Eur. J. Inorg. Chem. 1599
[13] PDF-2; PDF-4 Powder Diffraction File 2010, International Centre for Diffraction Data (ICDD) 20, 12 Campus Boulevard., Newton Square, Pennsylvania 19073-3273, USA. <http://www.icdd.com>
[14] A. Boultif, A., Louër, D. 2004 J. Appl. Cryst., 37, 724 [15] Le Bail, A., Duroy, H., Fourquet, J.L. 1998, Mat. Res. Bull. 23, 447-452. [16] Pawley, G.S. 1981, J. Appl. Cryst. 14, 357 [17] Rietveld, H.M. 1969, J. Appl. Cryst. 2 65 [18] Young, R.A., ed. 1993, The Rietveld Method, Oxford: IUCr, Oxford University Press,
(Monographs on Crystallography; number 5) [19] Bish, D.L., Howard, S.A. 1988 J. Appl. Cryst. 21 86 [20] Leon Reina, L, De la Torre, A.G, Porras-Vazques, J.M., Cruz M., Ordonez, L.M., Alcobé,
X., Gispert-Guirado, F., Larrañaga-Varga, A., Paul, M., Fuellman, T, Schmidt, R., Aranda, M.A.G. 2009 J. Appl. Cryst. 42, 906
[21] Rodríguez-Carvajal, J., Rosinel, T. 2004, Materials Science Forum, 443, 123 [22] Puigjaner, C., Barbas, R., Portell, A., Alcobé, X., Font-Bardia, M., Prohens, R. 2011 (in
press) [23] Favre-Nicolin, V., Cerny, R. 2002 J. Appl. Cryst. 35, 734-743 [24] Rodriguez-Carvajal, J., 1993 Physica B. 192, 55