Embed Size (px)
Citation preview
12860 | Phys. Chem. Chem. Phys., 2016, 18, 12860--12876 This journal is© the Owner Societies 2016
Cite this:Phys.Chem.Chem.Phys.,
2016, 18, 12860
Diffusion of macromolecules in a polymerhydrogel: from microscopic to macroscopicscales†
D. Sandrin,‡a D. Wagner,‡b C. E. Sitta,‡c R. Thoma,d S. Felekyan,a H. E. Hermes,b
C. Janiak,d N. de Sousa Amadeu,d R. Kuhnemuth,*a H. Lowen,*c S. U. Egelhaaf*b
and C. A. M. Seidel*a
To gain insight into the fundamental processes determining the motion of macromolecules in polymeric
matrices, the dynamical hindrance of polymeric dextran molecules diffusing as probe through a poly-
acrylamide hydrogel is systematically explored. Three complementary experimental methods combined
with Brownian dynamics simulations are used to study a broad range of dextran molecular weights and
salt concentrations. While multi-parameter fluorescence image spectroscopy (MFIS) is applied to investigate
the local diffusion of single molecules on a microscopic length scale inside the hydrogel, a macroscopic
transmission imaging (MTI) fluorescence technique and nuclear magnetic resonance (NMR) are used to
study the collective motion of dextrans on the macroscopic scale. These fundamentally different
experimental methods, probing different length scales of the system, yield long-time diffusion coefficients
for the dextran molecules which agree quantitatively. The measured diffusion coefficients decay markedly
with increasing molecular weight of the dextran and fall onto a master curve. The observed trends of the
hindrance factors are consistent with Brownian dynamics simulations. The simulations also allow us to
estimate the mean pore size for the herein investigated experimental conditions. In addition to the diffusing
molecules, MFIS detects temporarily trapped molecules inside the matrix with diffusion times above 10 ms,
which is also confirmed by anisotropy analysis. The fraction of bound molecules depends on the ionic
strength of the solution and the charge of the dye. Using fluorescence intensity analysis, also MTI confirms
the observation of the interaction of dextrans with the hydrogel. Moreover, pixelwise analysis permits to
show significant heterogeneity of the gel on the microscopic scale.
1. Introduction
The motion of macromolecules through disordered matrices isof great importance in analytical and preparatory techniques(chromatography,1 expansion microscopy,2 genomics,3 biofilms4)as well as in biomedical (imbibition,5 controlled drug delivery,6–9
flow control,10 implantable devices,9 contact lenses,11 cellular and
tissue engineering12,13) and technical applications (enhancedoil recovery14,15). From a fundamental point of view, precisemeasurements for model systems are needed to reveal theunderlying transport principles.16–19 It is known that the pre-sence of obstacles slows down the transport and that this ismore pronounced for larger molecules. However, the basicunderlying mechanisms and their effects are not yet completelyunderstood. In particular, the motion of particles through a gelmatrix represents an intricate problem as the gel matrix canrespond to the particle motion. A nontrivial dependence of thediffusion behavior on both the host and the guest, i.e. the geland the diffusing particles, is expected. The behavior of thehost is mainly characterized by a typical pore size. However,topological constraints resulting from the nontrivial anddynamically changing connectivity of the pores20 also have animpact on the diffusion of the guest molecules. This connec-tivity is expected to result in a wide spread in the translocationrate of the individual particles. The translational rate is alsoinfluenced by the structural properties of the guest molecules
a Institut fur Physikalische Chemie II, Molekulare Physikalische Chemie,
Heinrich-Heine-Universitat, Universitatsstr. 1, 40225 Dusseldorf, Germany.
E-mail: [email protected], [email protected] Institut fur Experimentelle Physik der Kondensierten Materie,
Heinrich-Heine-Universitat, Universitatsstr. 1, 40225 Dusseldorf, Germany.
E-mail: [email protected] Institut fur Theoretische Physik II: Weiche Materie, Heinrich-Heine-Universitat,
Universitatsstr. 1, 40225 Dusseldorf, Germany. E-mail: [email protected] Institut fur Anorganische Chemie und Strukturchemie, Heinrich-Heine-Universitat,
Universitatsstr. 1, 40225 Dusseldorf, Germany
† Electronic supplementary information (ESI) available. See DOI: 10.1039/c5cp07781h‡ These authors have contributed equally to this work.
Received 16th December 2015,Accepted 17th March 2016
DOI: 10.1039/c5cp07781h
www.rsc.org/pccp
PCCP
PAPER
Publ
ishe
d on
18
Mar
ch 2
016.
Dow
nloa
ded
by H
einr
ich
Hei
ne U
nive
rsity
of
Due
ssel
dorf
on
15/0
6/20
16 1
3:20
:42.
View Article OnlineView Journal | View Issue
This journal is© the Owner Societies 2016 Phys. Chem. Chem. Phys., 2016, 18, 12860--12876 | 12861
such as hydrodynamic radius, shape, molecular weight orcharge distribution. The significance of sieving, entanglements,(chemical) interactions, partitioning, oscillation of pores etc. isstill controversially discussed.21–27 In addition, the average sizeof the pores is also under debate.23,28–34
It is accepted that the mesh sizes in polymer hydrogelsdepend on the specific gel preparation such as (I) the massconcentration of polymeric material in the reaction solution,[T], and (II) the weight fraction of cross-linker, CR, but theabsolute average size of the pores is subject to debate.23,28–34
Considering hydrogels (0.035 g ml�1 r [T] r 0.065 g ml�1,0.02 r CR r 0.05) with similar compositions to the one studiedhere ([T] = 0.04 g ml�1, CR = 0.035), different methods givevery different results for the pore sizes (please note that thenumbers given for [T] and CR, multiplied by 100, correspond tothe parameters %T and %C, respectively, which were used inthe above publications). The reported pore sizes range from2.00–2.25 nm (chromatography28) through 5–9 nm (electro-phoresis studies in the 1960s and 1980s29,30) and 60–156 nm(electrophoresis studies in 199123,31) up to values of 2–20 mm(for the largest pores found by scanning electron microscopy32–34).This also complicates any systematic study of particle diffusion ina well-characterized model system, which however is important tounderstand the principles of translocation and to test theoreticalapproaches.
Here we study polymeric dextran molecules diffusing througha polyacrylamide hydrogel without interfering with the sampleduring the measurements. We use dextrans as tracer particles,because they have a good water solubility, low toxicity, relativeinertness and are flexible polymers. Moreover, they are commer-cially available over a broad range of molecular weights andhence sizes. Most dextrans can be also obtained as derivativeslabelled with fluorescent dyes (fluorescein sodium salt (FLU),Alexa Fluor 488 (A488), tetramethylrhodamine (TMR)). Themolecular weight of the dextrans is varied between Mw = 3 kDato 2000 kDa. For comparison the diffusion of free dyes, FLU,A488 and TMR is studied in our hydrogel, too. To investigate theinteractions of the particles with the hydrogel in more detail,we study the influence of solution conditions like pH-value, saltand tracer particle concentrations. Using three complementarymethods, multiparameter fluorescence image spectroscopy(MFIS), macroscopic transmission imaging (MTI) with fluores-cence detection and nuclear magnetic resonance (NMR), wemeasure the long-time diffusion coefficient of the fluorescentlylabelled and unlabelled probe particles, respectively. MFIS alsoallows us to detect the heterogeneity of the gel. The data arecompared to a model by Ogston35 which predicts the dynamicalhindrance in a network of randomly distributed fibers due togeometric confinement. The Ogston model provides a simpleanalytical formula for the particle dynamics via an effectiveexcluded volume. Another theoretical approach is to performcomputer simulations. As modeling a hydrogel on an atomic basisover huge length- and timescales is computational unaffordable,various different model assumptions including different degreesof molecular details have been used in the past.36–48 The mostdetailed model for the gel matrix was used by Linse and
coworkers36–39 and Holm and coworkers40–42 who resolved themonomers of the polymer chains connecting the nodes expli-citly within a bead-spring model. Within their approach theswelling behavior of the gels was explored but the diffusion oftracer particles within the gel network was not addressed. In amore coarse-grained approach, the matrix was described byeither a static network of points,43 rods,43,44 or chains45 or asfluctuating network of spheres46,47 which indeed allows for thecomputation of tracer diffusion. Following the latter coarsegrained approach of Zhou and Chen,47 we perform Browniandynamics (BD) simulations representing three different levelsof complexity to resolve the different physical effects that areoperating in the hydrogel. Our simulation study provides asimple and systematic framework, taking into account theflexibility of the matrix particles, the effective dextran–matrixexcluded volume and finding strong indications for effectiveattractive interactions. Our combined results provide a consis-tent picture of polymers diffusing through a hydrogel matrix andmay serve to test more quantitative theories and other experi-mental approaches.
2. Materials and methods2.1. Samples
2.1.1. Hydrogel: a polymer matrix in an aqueous environ-ment. The polyacrylamide (PAAm) hydrogels were formed bycopolymerization of acrylamide (AAm, monomer) with thetetrafunctional cross-linking agent N,N0-methylenebis(acryl-amide) (BIS), using ammonium peroxodisulphate (APDS) andtetramethylethylenediamine (TEMED) as redox initiators. Themonomer and cross-linker were both purchased from Sigma-Aldrich, APDS from Roth and TEMED from Merck. All compo-nents were used without further purification. AAm, BIS andAPDS were separately dissolved in deionized and filtered waterand cooled to 4 1C. The individual solutions were then mixed ata low temperature. The reaction mixture contained 75 mg ofAAm, 2.71 mg of BIS, 6 mg of APDS and 10 ml of TEMED in atotal volume of 2 ml which corresponds to a molar ratio ofcross-linker to monomer of 1 : 60. The total monomer concen-tration, defined as the mass concentration of AAm and BIS in thetotal reaction volume, is [T] = 0.04 g ml�1 and the weight fractionof cross-linker with respect to the total mass of the polymericmaterial (AAm and BIS) is CR = 0.035.
After mixing, the solution was transferred to Teflon moldsand allowed to warm up and react at room temperature. Afterone to two hours, polymerization was complete and the hydro-gel was transferred into a larger container filled with deionizedwater. The gel was left for five days to ensure that the hydrogelswells to equilibrium. The excess water was exchanged dailyto wash out residual chemicals that had not reacted in thegelation process.49
Discs with a radius Rd E 0.3 cm were cut from the hydrogelsusing a simple stamp. In corresponding MTI and MFIS experi-ments, samples cut from one gel block were used. For the NMRmeasurements, the gelation process was carried out in cylindrical
Paper PCCP
Publ
ishe
d on
18
Mar
ch 2
016.
Dow
nloa
ded
by H
einr
ich
Hei
ne U
nive
rsity
of
Due
ssel
dorf
on
15/0
6/20
16 1
3:20
:42.
View Article Online
12862 | Phys. Chem. Chem. Phys., 2016, 18, 12860--12876 This journal is© the Owner Societies 2016
Teflon molds (Rd E 0.5 cm, height 5 cm). The hydrogels werethen transferred into a container filled with deuterium oxide.
The hydrogel was characterized by determining the polymervolume fraction in the fully swollen state, j, the average mole-cular weight between cross-linking points, Mc, and the mesh size,x. The polymer volume fraction of the hydrogel in the swollenstate j was calculated directly from eqn (1):50,51
j ¼ Vp
Vgel¼
mprH2O
mprH2OþmH2Orp
(1)
where Vp is the volume of the dry polymer (PAAm), Vgel is thevolume of the hydrogel after equilibrium swelling, mp is themass of the polymer, mH2O is the mass of water in the swollengel and rp and rH2O are the densities of polymer and water,respectively.
The mass of the fully swollen hydrogel was measured afterremoving the liquid on the surface of the hydrogel with apipette. It was then dried at 40 1C under vacuum for at least6 h until constant weight was reached to determine mp. Theexperiment was repeated for different pieces of hydrogel, andthe mass fraction was converted into volume fraction using theknown polymer density (rp = 1.3 g cm�3).52
The theoretical molecular weight of the polymer between cross-links Mc is related to the degree of cross-linking in the hydrogel,X (i.e., the molar ratio of cross-linker to monomer) and the mole-cular weight of the repeating units (Mr,AAm = 71.1 g mol�1):51,53
Mc ¼Mr
2X(2)
The mesh size, x, which characterizes the space between macro-molecular chains can be calculated using:50,54,55
x ¼ j�1=3zCn2Mc
Mr
� �1=2
(3)
where Cn is Flory’s characteristic ratio (Cn,AAm = 2.72) and z isthe carbon–carbon bond length (z = 0.154 nm).56 This calcula-tion assumes ideal solvent quality, homogeneous cross-linkingdensities and Gaussian distribution of chain lengths.
We characterized the polyacrylamide hydrogels as used inthese experiments, i.e. in water and in a 20 mM potassiumcarbonate buffer at pH 10. The results are shown in Table 1.
2.1.2. Diffusing polymeric guest molecules. The dextrans(Table 2) and free dyes were purchased from Invitrogen. Forthe NMR experiments, unlabelled dextrans were dissolved indeuterium oxide with a purity of 99.9% from Deutero GmbH.For the remaining experiments, dextrans conjugated with Alexa
Fluor 488 (A488) or tetramethylrhodamine (TMR) were dissolvedin deionized water. To exclude fluorescence blinking due toprotonation–deprotonation dynamics, dextrans labelled withfluorescein (FLU) were prepared in potassium carbonate bufferat pH = 10, (20 mM) and the fluorescence measurements wereconducted after addition of 100 mM Trolox (Sigma-Aldrich) toavoid photobleaching of the dye.
To investigate the local environment and possible probe–polymer interactions inside the gel matrix, we measured themost polar dye attached to one of the smaller dextrans, A488-D10 under five different conditions: (i) H2O, (ii) aqueous KClO4
solution (10 mM, 20 mM, 40 mM, and 60 mM), (iii) aqueousKCl solution (20 mM), (iv) aqueous potassium carbonate buffer(20 mM) at pH = 7, and (v) at pH = 10.
2.1.3. Addition of polymeric guest molecules to the hydro-gel. For MFIS experiments, each hydrogel disc was placed in achambered cover glass (Lab-Tekt, Thermo Fisher Scientific,USA), incubated with guest molecule solution (400 ml in total)and allowed to reach equilibrium before the measurement wasstarted (2 to 7 days depending on dextran size). When electro-lyte solutions were used, the solution was exchanged approxi-mately every 12 h during the incubation period to ensuredefined concentrations.
In the MTI experiments, the initial particle concentration inthe hydrogel was 0 and the concentration in the surroundingsolution was varied between 0.1 and 10 mM. The hydrogelmatrix was contacted with the particle (dye or dextran) solutionat the beginning of the experiments and the diffusion of guestmolecules from the solution into the hydrogel was studied.
For NMR measurements, the hydrogel cylinders were incu-bated with concentrated amino dextran solution in deuteriumoxide for at least 48 h. The samples were then carefully trans-ferred into NMR tubes ensuring that the gel texture was notdestroyed. Concentrations below 1 mM were used in order toavoid aggregation. Bubbles were successfully avoided.
2.2. Measurement methods
2.2.1. Multiparameter fluorescence image spectroscopy(MFIS). All measurements were conducted on a confocal fluores-cence microscope (FV1000 Olympus, Hamburg, Germany),
Table 1 Polymer volume fraction in the swollen state (j), molecularweight of the polymer between cross-links (Mc) and mesh size (x) for thePAAm hydrogel in water and in potassium carbonate buffer 20 mM at pH 10.The errors are the standard errors of repeated measurements of the polymervolume fraction
PAAm in water PAAm pH 10
j 0.0390 � 0.0004 0.0150 � 0.0001Mc [g mol�1] 2141 2141x [nm] 5.7 � 0.1 7.8 � 0.1
Table 2 Overview of dyes and dextrans of different molecular weights,Mw, as obtained from manufacturer (for labelled dextrans already includingthe dye) and their naming convention. The dextrans were either unlabelledor conjugated with one of three different dyes: Alexa Fluor 488, tetra-methylrhodamine and fluorescein. For more detailed information see S1.1and S1.2 (ESI)
Mw
[kDa] UnlabelledAlexafluor 488 Tetramethylrhodamine Fluorescein
0.33 FLU0.39 TMR0.53 A4883 D3 A488-D3 TMR-D3 FLU-D310 D10 A488-D10 TMR-D10 FLU-D1040 D40 TMR-D40 FLU-D4070 TMR-D70500 FLU-D5002000 TMR-D2000
PCCP Paper
Publ
ishe
d on
18
Mar
ch 2
016.
Dow
nloa
ded
by H
einr
ich
Hei
ne U
nive
rsity
of
Due
ssel
dorf
on
15/0
6/20
16 1
3:20
:42.
View Article Online
This journal is© the Owner Societies 2016 Phys. Chem. Chem. Phys., 2016, 18, 12860--12876 | 12863
which had been modified to allow time-resolved experiments.57,58
A488 and FLU were excited using a polarized pulsed diode-laser(LDH-D-C-485, PicoQuant, Berlin, Germany) at 485 nm, while forTMR a supercontinuum laser (SuperK Extreme, NKT Photonics,Birkerød, Denmark) at 555 nm was employed. Laser light wasdirected into a 60� water immersion objective (NA = 1.2) by adichroic beam splitter and focused into the sample close to thediffraction limit. The light emitted was collected by the sameobjective and separated into two polarizations (parallel andperpendicular) relative to the excitation beam. The fluorescencesignal was further divided into two spectral ranges (BS 560, AHF,Tubingen, Germany). Bandpass filters for A488/FLU and TMRfluorescence (HC 520/35 and HC 607/70, AHF), were placed infront of the detectors. The signal from single photon sensitivedetectors (PDM50-CTC, Micro Photon Devices, Bolzano, Italyand HPMC-100-40, Becker&Hickl, Berlin, Germany, respectively)was recorded photon-by-photon with picosecond accuracy(HydraHarp400, PicoQuant) and analyzed using custom software(LabVIEW based). The temperature during all measurementswas 22.5 � 0.5 1C and the concentration of the dextrans wasadjusted between 0.05 and 3 nM, depending on their differentdegree of labelling.
The sample was mounted on a piezo-controlled x–y scanner(P-733.2CL, Physik Instrumente, Karlsruhe, Germany) and movedperpendicular to the optical axis. It was moved in a stepwisemanner to permit multiparameter fluorescence detection atdefined locations. The pixel size is defined by the step size ofthe scan (in our experiments 10.00 mm) while photons are collectedfrom the confocal detection volume only (Vdet = 0.55 fl). Theintegration time per pixel was 30 min and the complete imagecontains 18 pixels (probed spots).
2.2.2. Macroscopic transmission imaging (MTI). Themacroscopic transmission imaging experiments were per-formed using a custom-built imaging apparatus similar tothat described previously.59 The sample was illuminated by aparallel beam of light from an LED lamp (CoolLED, centerwavelength of 490 nm) whose wavelength was chosen to excitethe fluorescent particles in the sample. Using a dichroic mirrorthat transmits wavelengths above and reflects wavelengthsbelow 502 nm, the transmitted light was split into excitationlight (bright-field transmission image) and emitted light fromthe fluorophores (fluorescence image). The images were thenfocused onto separate CCD cameras. Additional fluorescencefilters (excitation filter: 480/25, emission filter: longpass LP 520)were applied. The hydrogel discs were placed between twohorizontally held glass plates with a fixed distance betweenthe plates of 1.5 mm using aluminum spacers. This distancewas chosen to ensure that the gels were compressed as littleas possible but still in contact with both glass plates. Theparticle solution was added around the gel discs and allowedto diffuse into the gel matrix. The image collection time wasvaried between 5 s at the beginning and up to 300 s at theend of a measurement. Images were collected for 3 to 72 h.The sample cells were sealed to ensure that the solvent didnot evaporate and measurements were performed at roomtemperature (23 1C).
2.2.3. Nuclear magnetic resonance (NMR). A Bruker AVANCEDRX-500 NMR spectrometer operating at 500 MHz for 1H wasused. The spectrometer was equipped with a Bruker Great 1/10gradient amplifier and a Bruker selective inverse (SEI) probe withz-gradient coils. The gradient amplitudes were calibrated usingdodecane, 1-pentanol and water as standard samples.60 Thetemperature sensor was calibrated using methanol as describedby van Geet.61 All diffusion measurements were acquired by usingstimulated echo with bipolar gradient pulses (pulse programname STEBPGP).62,63 This sequence was also followed by aWATERGATE sequence to suppress the water signal.64,65
In each experiment, the magnetic field gradient strength ofthe bipolar pulses was linearly arrayed along 16 values from 10to 60 G cm�1 while all other parameters were kept constant.The gradient pulse length, d and the diffusion delay, DN, werechosen such that the echo signal was suppressed considerably.
The diffusion coefficients of unlabelled aminodextrans inhydrogels and in deuterium oxide were measured at 23 1C inNMR sample tubes of 5 mm diameter. Dextran concentrationsdepended on the dextran’s molecular weight and varied from3.0 M for the 3 kDa dextran to 0.3 M for the 40 kDa dextran toavoid agglomeration in solution. We performed several diffu-sion measurements with each sample, varying the key para-meters d and DN. Our experience showed that this is a goodpractice which helps identifying artifacts affecting the experi-ments or errors in the processing routines. The diffusiondelays, DN were chosen between 0.1 and 2.0 s and the gradientpulse widths, d were between 600 and 1400 ms. Several combi-nations of DN and d were applied within those ranges. Laterexamination revealed high agreement among all those measure-ments, indicating good reproducibility.
2.3. Analysis methods
2.3.1. Multiparameter fluorescence image spectroscopy(MFIS). The recorded MFIS data can be correlated to yieldcorrelation curves (fluorescence correlation spectroscopy, FCS,is part of the MFIS). Those fluorescence correlation curves thatwere measured inside the hydrogel usually exhibited multipleoverlapping bunching terms in the time regime of the diffusionprocess. To establish the number of independent species, M,needed in the model function to reproduce the data, we fitted adistribution of diffusion coefficients applying the maximumentropy method (MEMFCS).66 Having determined M we thenfitted a model function containing M diffusion terms (eqn (4)):
G tcð Þ ¼ 1þ 1
N
XMi¼1
xi 1þ tc
td;i
� � ffiffiffiffiffiffiffiffiffiffiffiffiffiffiffiffiffiffiffiffiffiffiffiffiffiffiffiffiffiffiffiffiffi1þ tc
z0=o0ð Þ2�td;i
s !�1
� 1� AT þ AT � e�tctT
� �with
XMi¼1
xi ¼ 1
(4)
For species with identical brightness, xi represents their truemolecular fractions. In this case, N is the number of moleculesin the singlet state in the detection volume element and tc isthe correlation time. The model assumes a three-dimensionalGaussian-shaped volume element with spatial distribution of
Paper PCCP
Publ
ishe
d on
18
Mar
ch 2
016.
Dow
nloa
ded
by H
einr
ich
Hei
ne U
nive
rsity
of
Due
ssel
dorf
on
15/0
6/20
16 1
3:20
:42.
View Article Online
12864 | Phys. Chem. Chem. Phys., 2016, 18, 12860--12876 This journal is© the Owner Societies 2016
the detection probabilities w(x,y,z) = exp(�2(x2 + y2)/o02)
exp(�2z2/z02). The 1/e2 radii in x and y or in z direction are
denoted by o0 or z0, respectively. The characteristic diffusiontime is td = o0
2/4D, with the translational diffusion coefficientD. The confocal detection volume, Vdet is calculated as follows:Vdet = p3/2z0o0
2.Basic photophysical processes such as triplet transitions
which result in temporary dark states are accounted for by anadditional bunching term. Here AT and tT represent the tripletpopulation and the triplet relaxation time.
The correlation curves for A488- and TMR-dextrans in waterand most FLU-dextrans in carbonate buffer were fitted pixelby pixel, the remaining samples image-integrated. At meanirradiances in the focus of 1.2 kW cm�2, A488- and TMR-samplesdid not exhibit noticeable triplet populations (AT o 0.01), onlyfluorescein showed fluorescence bunching in the ms regime ateven lower irradiances of 0.4 kW cm�2. For pixelwise analysis,error bars for td (and equivalently for D) were calculated asstandard error of the mean while for single point (i.e. solution)or image integrated measurements a bootstrapping procedurewas applied.
Diffusion coefficients can be derived from the extracteddiffusion times (td) provided that the size and shape of theconfocal detection volume element are characterized. In prac-tice, a photostable reference dye with known diffusion proper-ties is used to calibrate the system. In the present case, wechose rhodamine 110 (Rh110). Thus all presented diffusioncoefficients derived from FCS are based on the reported value ofDRh110 = (4.3 � 0.3) � 10�6 cm2 s�1 at 295.65 K in diluteaqueous solutions.67 The characteristic diffusion time of Rh110in deionized water was td = 30 ms with day-to-day variations ofless than 5%. Due to increased aberrations with changes in therefractive index upon addition of salt, a systematic increase oftd was observed (e.g. td = 33 ms for Rh110 in 20 mM potassiumcarbonate buffer at pH 7 and pH 10, respectively). The longerwavelength required for the TMR experiments caused an increasein focus area po0
2 = td4pD and thus of td of about 30%, asexpected from the changed diffraction limit.
A variety of possible artifacts have been reported that couldcause uncertainties in translational diffusion measurementsby FCS.68 In particular optical saturation effects are knownto distort the detection volume element and thus alter theobserved average dwell times of the fluorophores. These effectshave been minimized by keeping the excitation power low andby performing reference measurements under identical condi-tions. Low excitation power also diminishes the probability ofphotobleaching. Successful minimization of this effect is con-firmed by the observation of extremely slow diffusing moleculeswith dwell times of up to 1 s.
A further possible artifact, focal distortions due to a refrac-tive index mismatch (below 0.01, see S1.6, ESI†) is estimated toresult in a small corresponding error in D (below 1%69). This issupported by the good agreement of the FCS data with theindependent MTI and NMR results (see below). Additionally,the possible refractive index mismatch between solution andhydrogel was checked using FCS and found to be negligible.
No readjustment of the correction collar setting on the objec-tive was required after switching the sample from pure water tohydrogel (see S1.6, ESI†).
The steady state anisotropy, r, which is another parameterdetected by MFIS is defined via the intensities of the fluorescencesignal polarized parallel (FJ) and perpendicular (F>) with respectto the excitation polarization. As described by Koshioka et al.,70
the fluorescence signal recorded with a confocal microscope isslightly depolarized by the objective due to its high numericalaperture. To account for this experimental artifact, correctionfactors l1 and l2 have been introduced:70
r ¼GFk � F?
1� 3l2ð ÞGFk þ 2� 3l1ð Þ2F?(5)
The correction factors l1 and l2 as well as the factor G, thatcompensates for the slightly different detection efficiencies of thetwo detection channels, were determined experimentally usingthe reference dyes enhanced green fluorescent protein (EGFP)58
or rhodamine 110 and TMR, respectively, (l1 = 0.0308, l2 = 0.0368,G = 0.99). In detail, the G-factor is defined as the ratio of thedetection efficiencies between perpendicular and parallel polarizedfluorescence light. The fluorescence signal F is obtained fromthe detected signal by subtracting the appropriate background(scattering) measured in clean water or an unloaded gel.
2.3.2. Macroscopic transmission imaging (MTI). We found alinear relation between fluorescence intensity and concentration inthe concentration range of 0.1 to 10 mM for all samples. Thus, wecan directly determine the relative change in concentration fromthe image intensity. Especially for the larger dextran molecules,equilibration between the hydrogel and the surrounding solutiontakes several days. However, for most samples, it was found thatmeasurement times of about 24 h were sufficient to allow diffusioncoefficients to be extracted from the data. Some additional longermeasurements were performed to capture the long time behavior.Even though the dyes used were relatively photostable and theincident intensity was reduced as much as possible, some photo-bleaching could be seen for these long measurement times. Thus,a photobleaching correction as described in ref. 71 and 72 wasapplied: the change in the normalized intensity F of an area inthe solvent far outside the hydrogel, where no significant changein the concentration is expected, could be fitted with a doubleexponential function:
FðtÞFðt ¼ 0Þ ¼ Pe�pt þQe�qt (6)
The intensity of the region of interest in the gel of every imagewas then corrected by dividing the original value by the oneextracted from the bleach curve.
The hydrogel discs had a quasi-two-dimensional geometryand homogeneous radial diffusion was observed. Thus, byazimuthally averaging all pixels that are a certain distance awayfrom the gel–reservoir interface, a concentration profile forevery time step could be determined. Comparison of theconcentration profiles with diffusion equations, includingappropriate boundary conditions, yields diffusion coefficients(see Section 3.2.1).
PCCP Paper
Publ
ishe
d on
18
Mar
ch 2
016.
Dow
nloa
ded
by H
einr
ich
Hei
ne U
nive
rsity
of
Due
ssel
dorf
on
15/0
6/20
16 1
3:20
:42.
View Article Online
This journal is© the Owner Societies 2016 Phys. Chem. Chem. Phys., 2016, 18, 12860--12876 | 12865
The hydrogels were fully swollen and in equilibrium beforethe measurements and no change in the hydrogel size wasexpected. However, for some samples we observed a decreasinggel radius of up to 6% within the first hours of the experimentsin the bright-field transmission images and the change inradius was taken into account in the analysis. The reason forthis is not clear. A change in temperature or an expansion of thesample cell and with that a slight increase in sample thicknessmight play a role.73
2.3.3. Nuclear magnetic resonance (NMR). As is usualpractice, the diffusion coefficients D were obtained by fitting theecho amplitudes (integral of the signals between 2.8 and 4.4 ppm)to the following equation:74,75
Ei
E0¼ exp �D ggidð Þ2 DN �
d3� tN
2
� �� �(7)
where Ei and E0 are the echo intensities at increment i and withzero gradient applied, g is the gyromagnetic ratio, gi is thegradient amplitude at increment i, d is the gradient pulse width,DN is the diffusion delay and tN is the delay between the twomagnetic field gradient pulses laying at one side of the echo pulsesequence. For the purpose of comparison, the diffusion coeffi-cients measured in D2O were recalculated for H2O using theknown viscosities of both solvents.76
2.4. Models for Brownian dynamics simulations
Brownian dynamics simulations were used to calculate thediffusion coefficients of dextran particles within the polymernetwork. Inspired by previous investigations,46,47 we consideredsimple models of effective spheres for the matrix particles andthe dextrans. For this, we used a microscopic model resolvingthe matrix explicitly and coarse-graining the diffusing polymercoil as an effective soft sphere. There are further underlyingmodel assumptions: (i) the polymer matrix is not resolved onthe monomer level, (ii) the matrix structure is derived from aperiodic structure, and (iii) explicit hydrodynamic interactionscaused by the solvent are ignored.
In order to obtain a systematic insight, the flexibility of thepolymer matrix and the softness of the dextran–matrix inter-action were modeled on three different levels. A schematicillustration of the models is shown in the Results section (seeSection 3.2.2 and Fig. 9). On the first level (also referred to asmodel 1 in the following), the matrix particles were fixed on aperiodic simple-cubic lattice with lattice constant a providingstatic steric obstacles for the diffusing dextran molecules. Forsimplicity, the latter were modeled as effective spheres. On thiscrude level any fluctuations in the pore sizes were neglected.The repulsive steric interaction between an obstacle i at position-si and another particle j (either tracer or obstacle) at position -
sj,separated by the distance sij, was modeled as in ref. 47 with atruncated and shifted repulsive Lennard Jones potential (alsoknown as WCA-potential):
Us sij� �
¼ 4essijsij
� �12
� sijsij
� �6
þ 1
4
" #(8)
where es = 1kBT (B4.05 � 10�21 J at 20 1C) and the additivediameter sij = 2Robst for the obstacle–obstacle-interaction andsij = Robst + Rh for the interaction between a matrix obstacle and atracer of radius Rh. The cutoff was set at the potential’s minimumat lij = 21/6sij.
For the second level (model 2), we introduced fluctuatingmatrix particles. The network connectivity was ensured bycoupling neighboring matrix particles by harmonic springs.For the harmonic spring potentials, we used Hooke’s law:
Usp(sij) = 0.5k(sij � s0,ij)2 (9)
for two matrix particles i and j with their distance at rest s0,ij.Setting k = 2kBT/(2Rh,D3)2 (B0.6 mJ m�2) allowed the dextran D3to push a gap of its own diameter 2Rh,D3 through two neighboringmatrix particles in rest positions when overcoming an energy of1kBT. This parameter is kept fixed in all simulations. Moreoverthe matrix particles were exposed to thermal fluctuations andrepelled each other and the dextran particles via steric inter-actions as in model 1 (eqn (8)). To broaden the pore sizedistribution, the matrix particles were randomly shifted up tohalf the lattice constant a in each direction with respect to theirinitial positions before attaching undistorted springs betweenneighboring matrix particles.
At a third level of modeling, two different extensions weretested by changing the dextran–matrix interactions. In model3a, we replaced the WCA potential for the steric interactionswith a softer effective Gaussian potential which is a good modelfor penetrating polymer coils of different architecture:77–79
UG sij� �
¼ eG exp � sij2
2b2
� �(10)
with b2 = (Ri + Rj)2/(2ln(eG/(kBT))). This relation keeps the
potential at sij = Ri + Rj for 1kBT. We used eG = 12kBT (for moredetails see S11, ESI†).
In model 3b, an attractive shell with the size of a typicalfluorescent dye’s radius (RD0 = 0.55 nm) was added to thesteric repulsion to account for a possible weak sticking of thedextrans to the matrix using a cosine function for a smoothtransition:
Usp sij� �
¼
4essijsij
� �12
� sijsij
� �6
þ14
" #� ea sij � lij
�ea2
cosp sij � lij� �RD0
� �þ 1
� �lij o sij � lij þ RD0
0 lij þ RD0 � sij
8>>>>>>>><>>>>>>>>:
(11)
We obtained ea = 3.0 � 0.3 kBT as fitted value in bothinvestigated systems. This value seems reasonable as it shouldcause a significant slowdown of the dextrans’ motion while stillallowing a thermal escape out of the shells.
By tracking the tracer’s trajectories, the mean square dis-placements can be calculated as:
Ds2(t) = h(-s(t0 + t) � -s(t0))2i (12)
Paper PCCP
Publ
ishe
d on
18
Mar
ch 2
016.
Dow
nloa
ded
by H
einr
ich
Hei
ne U
nive
rsity
of
Due
ssel
dorf
on
15/0
6/20
16 1
3:20
:42.
View Article Online
12866 | Phys. Chem. Chem. Phys., 2016, 18, 12860--12876 This journal is© the Owner Societies 2016
For a given sufficiently large elapsed time t, the long-timediffusion coefficients could then be extracted as:80,81
D ¼ limt!1
1
6
d
dtDs2ðtÞ (13)
such that the hindrance factors are D/D0.For a given value of a, which sets the mean pore size, the
hindrance factors for all tracer particles were calculated andthis set of simulation data was compared to the experimentaldata. An optimal value for a was found by the best fit, usinga as the single fitting parameter. Only in model 3b, ea wasused as a second fitting parameter. For more technical details,see S11 (ESI†).
3. Results and discussion
The different experimental techniques used here allowed us toestimate the precision of the measurements in different ways.In MTI and NMR, the experiments are conducted by averagingover one gel, calculating therefore the dispersion of the databetween different gels.
In MFIS we are able to detect two kinds of dispersion ofthe data: (i) we measured different spots within the same gel(pixelwise analysis) and (ii) we executed measurements betweendifferent gels (different data points in Fig. 12b).
It is known that the hydrogels in practice always exhibit aninhomogeneous cross-link density distribution, causing spatialheterogeneity.82,83 The scattering of experimental data fromvarious independent measurements, beyond the shot noiselimits of the single measurements, indicates the heterogeneityin the gel structure. Spatial heterogeneity on the macroscopicscale is detected by pixelwise analysis. Different locations withinthe same gel display slightly different results. These feature werevisible in all MFIS studies reported below.
3.1. Several populations of guest molecules detected by MFIS
FCS. In contrast to the single diffusion times observed insolution, for most of the gel samples we have observed that upto three independent diffusion times are needed to fit the
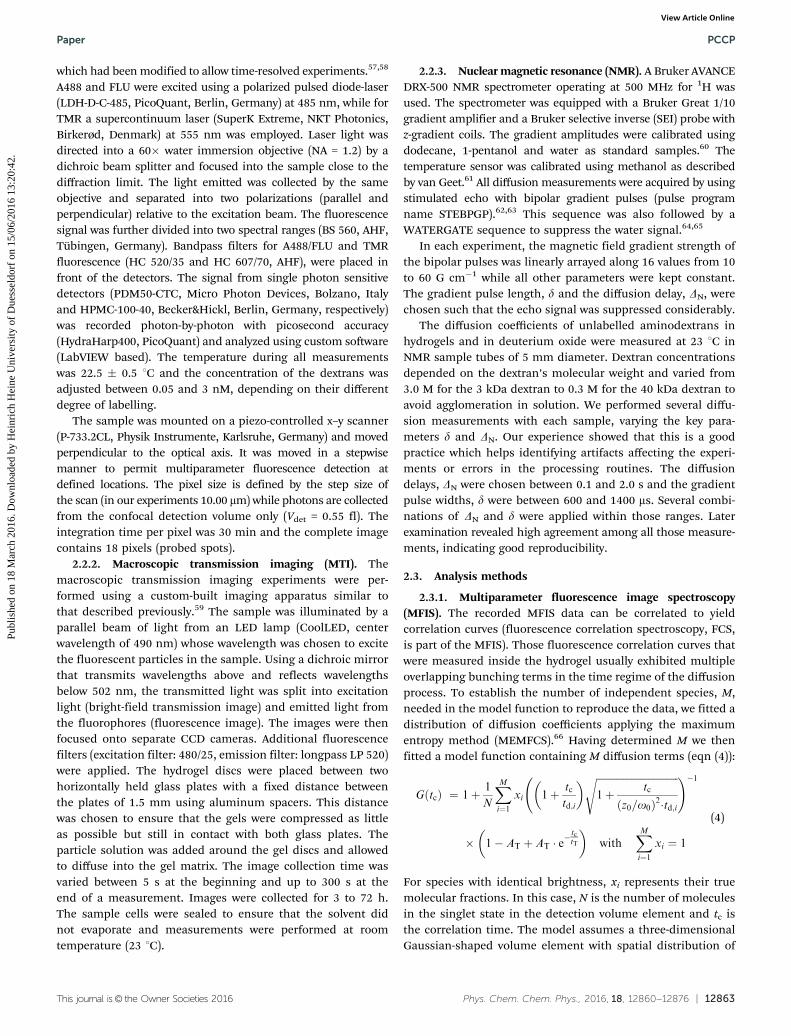
FCS curves. Differently diffusing species, extending from freemolecules just hindered by the limiting pore size (td B 410 ms)up to temporarily trapped particles (td 4 10 ms) were found(SI2–4, ESI†). Fig. 1a displays a set of image-integrated correla-tion curves for A488-D10 at different electrolyte conditionswhich reveal the decreasing fraction of slowly diffusing tem-porarily trapped particles for increasing salt concentration.Temporary sticking and accumulation of the probe moleculesin the hydrogel are indicated by time trace analysis (Fig. 4a). Suchtracer–hydrogel interactions already have been studied in thepast, showing different effects depending on the chemical struc-ture of the gel, the solvent and the nature of the tracer.21,25,27
Interestingly, Vagias and coworkers21 also found interactionsbetween the hydrogel and different tracers when employing FCS.Although they used another hydrogel than in our study, thedifferent fluorescence intensity between gel and solution is clearlyshown by them.
A simple binding model was applied to describe the observedequilibrium fractions of mobile and trapped probe molecules(xbound), where ffree is the activity coefficient for free moleculesand Kd
0 the effective binding constant (see S1.7, ESI†):
xbound ¼ffreeKd
0
1þ ffreeKd0 (14a)
It was assumed that the activity of the freely diffusing (mobile)species is most affected by the ionic strength of the solvent.The Debye–Huckel equation84 describes the dependency of theactivity coefficient, ffree, on the charge, Zi, the effective radius ofthe ion, Ri, and the ionic strength, I, in the limit of low saltconcentrations:
ffree ¼ 10� AZi
2ffiffiIp
1þBRi
ffiffiIp
(14b)
with tabulated values84 for the constants A = 0.507 mol�1/2 dm3/2
and B = 3.28 nm�1 mol�1/2 dm3/2 for aqueous solution at 22.5 1C.A combination of eqn (14a) and (14b) can be fit to the equili-brium fraction of trapped molecules as a function of theionic strength. The fit shown in Fig. 1b yields Zi E 3, whichis in good agreement with the estimated mean number of
Fig. 1 (a) Image-integrated normalized correlation curves for A488-D10 in hydrogels at different salt conditions, (b) decreasing fraction of slow,temporarily bound molecules for A488-D10 in the hydrogel with increasing ionic strength I. A fit of eqn (14) yields Zi = 3.0 � 0.4; Kd
0 = 0.42 � 0.03;Ri = (0.7 � 0.5) nm. The inset shows one possible mesomeric structure and charge distribution of Alexa488.
PCCP Paper
Publ
ishe
d on
18
Mar
ch 2
016.
Dow
nloa
ded
by H
einr
ich
Hei
ne U
nive
rsity
of
Due
ssel
dorf
on
15/0
6/20
16 1
3:20
:42.
View Article Online
This journal is© the Owner Societies 2016 Phys. Chem. Chem. Phys., 2016, 18, 12860--12876 | 12867
charges per labelled dextran, estimated as follows. D10 sampleshave B5 labelling sites per molecule. The specified meandegree of labelling (DoLav) of the investigated A488-D10samples is 1, if the unlabelled dextran molecules are alsoconsidered. However, considering only labelled dextrans in afirst approximation of random labelling, we can expect around1.5 dyes per labelled and thus detected dextran (for more detailsof this calculation, see S1.3, ESI†), which corresponds to a meancharge Zi(A488-D10) E 3. For the higher salt concentrations, theDebye length k�1 is of the order of the macromolecule’s dimen-sion (k�1 E 1.4 nm for I = 0.05 M), producing conditions beyondsome of the approximations made to derive eqn (14b). Never-theless, the fit shown in Fig. 1b describes the experimental datasufficiently well.
The analysis reveals that mainly the presence or screening ofcharges determine the sticking behavior of the probe moleculesand not the kind of anion as suggested by the Hofmeisterseries.85,86 In particular, perchlorate, chloride or hydrogencarbonate ions at the same ionic strength had a comparableinfluence on the diffusion properties of the studied samples(see Fig. 1b).
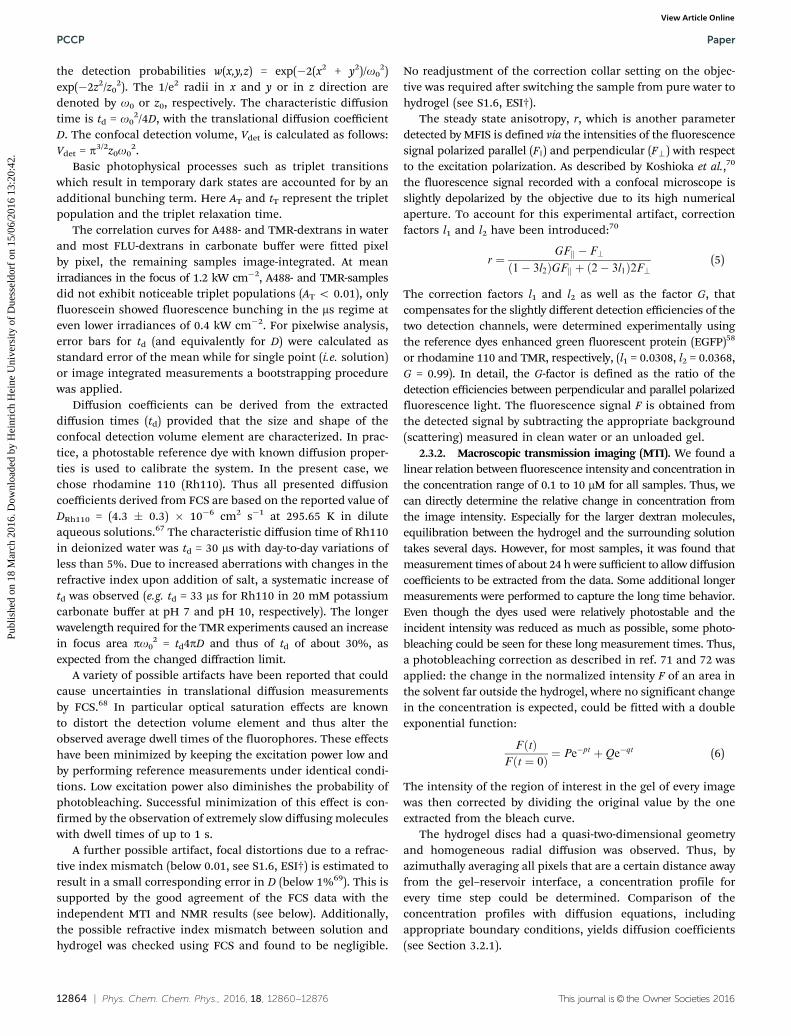
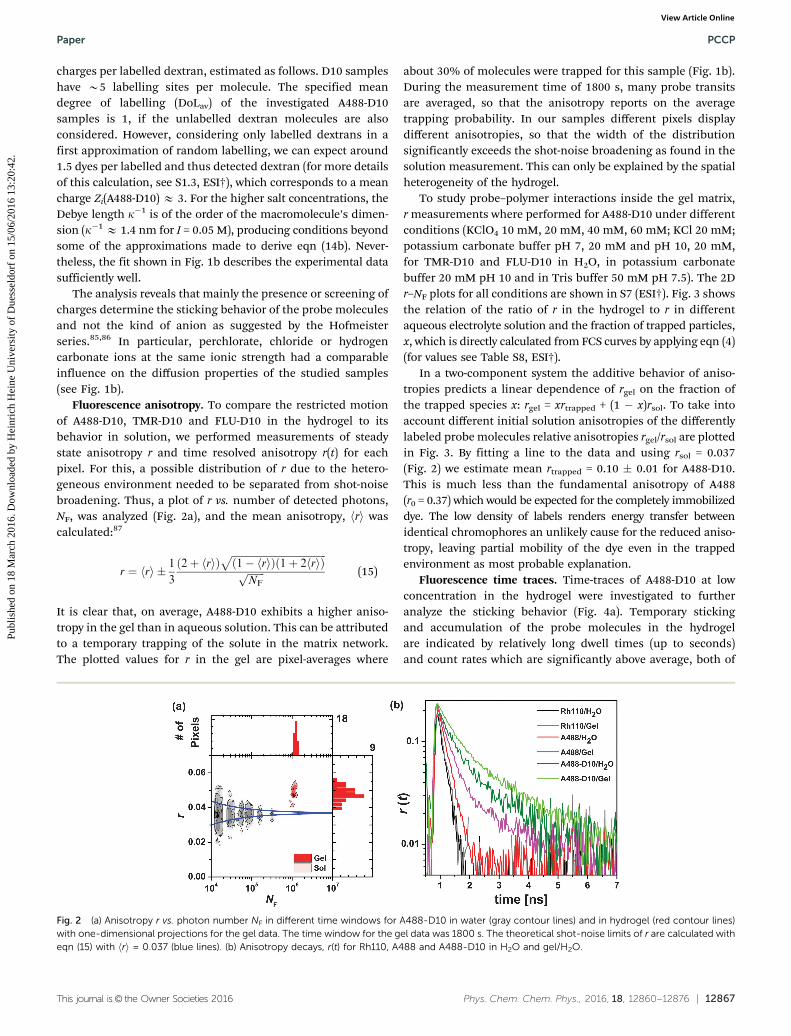
Fluorescence anisotropy. To compare the restricted motionof A488-D10, TMR-D10 and FLU-D10 in the hydrogel to itsbehavior in solution, we performed measurements of steadystate anisotropy r and time resolved anisotropy r(t) for eachpixel. For this, a possible distribution of r due to the hetero-geneous environment needed to be separated from shot-noisebroadening. Thus, a plot of r vs. number of detected photons,NF, was analyzed (Fig. 2a), and the mean anisotropy, hri wascalculated:87
r ¼ rh i � 1
3
2þ rh ið Þffiffiffiffiffiffiffiffiffiffiffiffiffiffiffiffiffiffiffiffiffiffiffiffiffiffiffiffiffiffiffiffiffiffiffiffiffiffi1� rh ið Þ 1þ 2 rh ið Þ
pffiffiffiffiffiffiffiNF
p (15)
It is clear that, on average, A488-D10 exhibits a higher aniso-tropy in the gel than in aqueous solution. This can be attributedto a temporary trapping of the solute in the matrix network.The plotted values for r in the gel are pixel-averages where
about 30% of molecules were trapped for this sample (Fig. 1b).During the measurement time of 1800 s, many probe transitsare averaged, so that the anisotropy reports on the averagetrapping probability. In our samples different pixels displaydifferent anisotropies, so that the width of the distributionsignificantly exceeds the shot-noise broadening as found in thesolution measurement. This can only be explained by the spatialheterogeneity of the hydrogel.
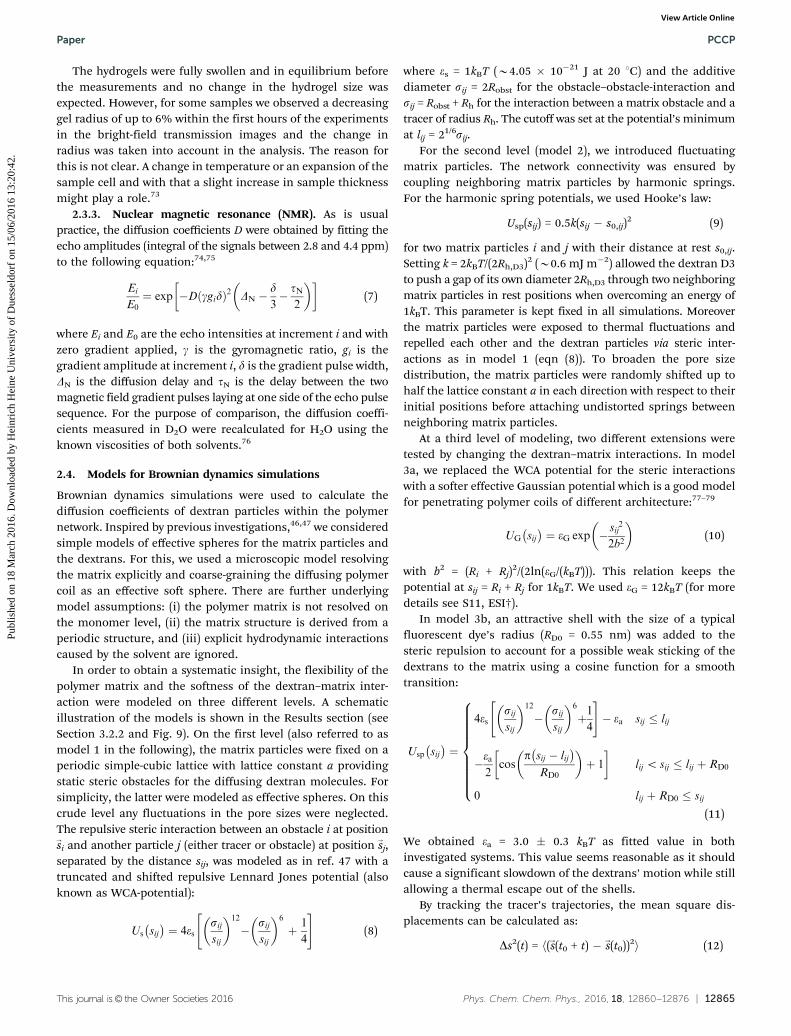
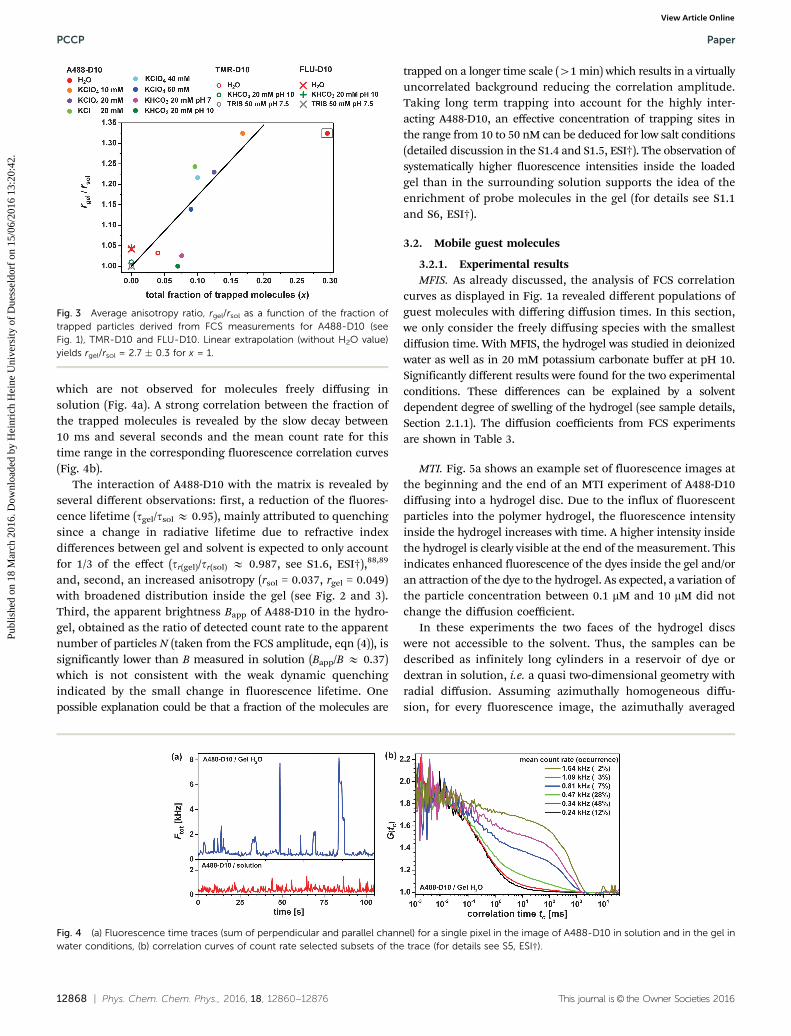
To study probe–polymer interactions inside the gel matrix,r measurements where performed for A488-D10 under differentconditions (KClO4 10 mM, 20 mM, 40 mM, 60 mM; KCl 20 mM;potassium carbonate buffer pH 7, 20 mM and pH 10, 20 mM,for TMR-D10 and FLU-D10 in H2O, in potassium carbonatebuffer 20 mM pH 10 and in Tris buffer 50 mM pH 7.5). The 2Dr–NF plots for all conditions are shown in S7 (ESI†). Fig. 3 showsthe relation of the ratio of r in the hydrogel to r in differentaqueous electrolyte solution and the fraction of trapped particles,x, which is directly calculated from FCS curves by applying eqn (4)(for values see Table S8, ESI†).
In a two-component system the additive behavior of aniso-tropies predicts a linear dependence of rgel on the fraction ofthe trapped species x: rgel = xrtrapped + (1 � x)rsol. To take intoaccount different initial solution anisotropies of the differentlylabeled probe molecules relative anisotropies rgel/rsol are plottedin Fig. 3. By fitting a line to the data and using rsol = 0.037(Fig. 2) we estimate mean rtrapped = 0.10 � 0.01 for A488-D10.This is much less than the fundamental anisotropy of A488(r0 = 0.37) which would be expected for the completely immobilizeddye. The low density of labels renders energy transfer betweenidentical chromophores an unlikely cause for the reduced aniso-tropy, leaving partial mobility of the dye even in the trappedenvironment as most probable explanation.
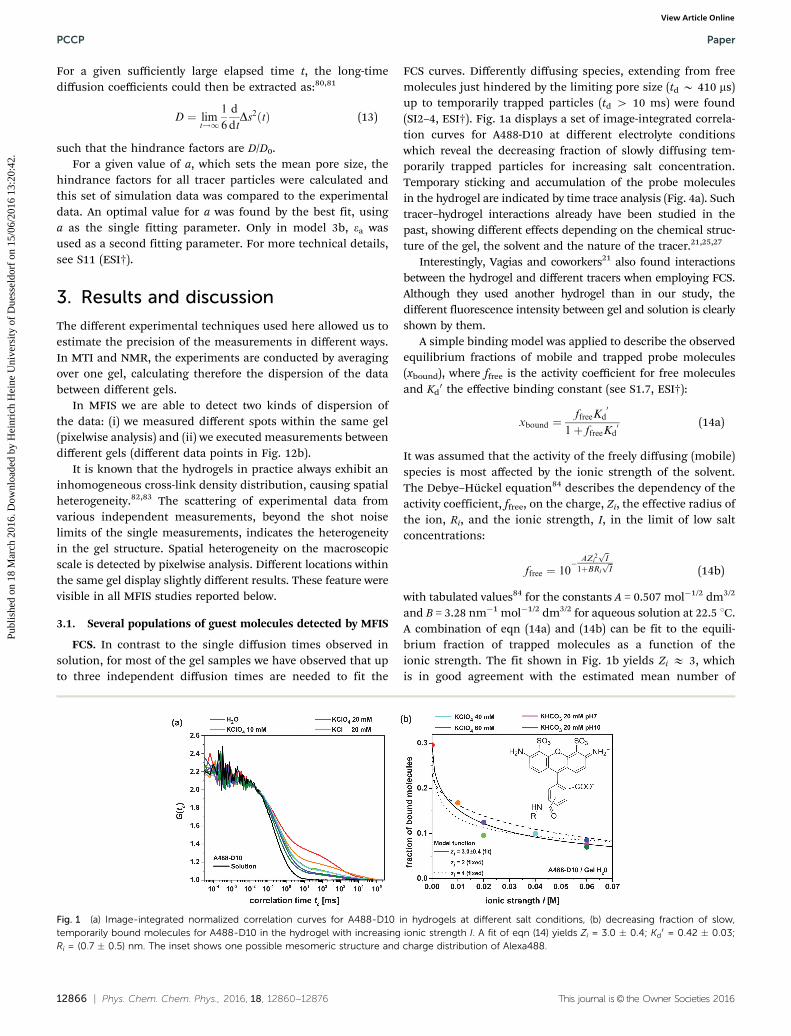
Fluorescence time traces. Time-traces of A488-D10 at lowconcentration in the hydrogel were investigated to furtheranalyze the sticking behavior (Fig. 4a). Temporary stickingand accumulation of the probe molecules in the hydrogelare indicated by relatively long dwell times (up to seconds)and count rates which are significantly above average, both of
Fig. 2 (a) Anisotropy r vs. photon number NF in different time windows for A488-D10 in water (gray contour lines) and in hydrogel (red contour lines)with one-dimensional projections for the gel data. The time window for the gel data was 1800 s. The theoretical shot-noise limits of r are calculated witheqn (15) with hri = 0.037 (blue lines). (b) Anisotropy decays, r(t) for Rh110, A488 and A488-D10 in H2O and gel/H2O.
Paper PCCP
Publ
ishe
d on
18
Mar
ch 2
016.
Dow
nloa
ded
by H
einr
ich
Hei
ne U
nive
rsity
of
Due
ssel
dorf
on
15/0
6/20
16 1
3:20
:42.
View Article Online
12868 | Phys. Chem. Chem. Phys., 2016, 18, 12860--12876 This journal is© the Owner Societies 2016
which are not observed for molecules freely diffusing insolution (Fig. 4a). A strong correlation between the fraction ofthe trapped molecules is revealed by the slow decay between10 ms and several seconds and the mean count rate for thistime range in the corresponding fluorescence correlation curves(Fig. 4b).
The interaction of A488-D10 with the matrix is revealed byseveral different observations: first, a reduction of the fluores-cence lifetime (tgel/tsol E 0.95), mainly attributed to quenchingsince a change in radiative lifetime due to refractive indexdifferences between gel and solvent is expected to only accountfor 1/3 of the effect (tr(gel)/tr(sol) E 0.987, see S1.6, ESI†),88,89
and, second, an increased anisotropy (rsol = 0.037, rgel = 0.049)with broadened distribution inside the gel (see Fig. 2 and 3).Third, the apparent brightness Bapp of A488-D10 in the hydro-gel, obtained as the ratio of detected count rate to the apparentnumber of particles N (taken from the FCS amplitude, eqn (4)), issignificantly lower than B measured in solution (Bapp/B E 0.37)which is not consistent with the weak dynamic quenchingindicated by the small change in fluorescence lifetime. Onepossible explanation could be that a fraction of the molecules are
trapped on a longer time scale (41 min) which results in a virtuallyuncorrelated background reducing the correlation amplitude.Taking long term trapping into account for the highly inter-acting A488-D10, an effective concentration of trapping sites inthe range from 10 to 50 nM can be deduced for low salt conditions(detailed discussion in the S1.4 and S1.5, ESI†). The observation ofsystematically higher fluorescence intensities inside the loadedgel than in the surrounding solution supports the idea of theenrichment of probe molecules in the gel (for details see S1.1and S6, ESI†).
3.2. Mobile guest molecules
3.2.1. Experimental resultsMFIS. As already discussed, the analysis of FCS correlation
curves as displayed in Fig. 1a revealed different populations ofguest molecules with differing diffusion times. In this section,we only consider the freely diffusing species with the smallestdiffusion time. With MFIS, the hydrogel was studied in deionizedwater as well as in 20 mM potassium carbonate buffer at pH 10.Significantly different results were found for the two experimentalconditions. These differences can be explained by a solventdependent degree of swelling of the hydrogel (see sample details,Section 2.1.1). The diffusion coefficients from FCS experimentsare shown in Table 3.
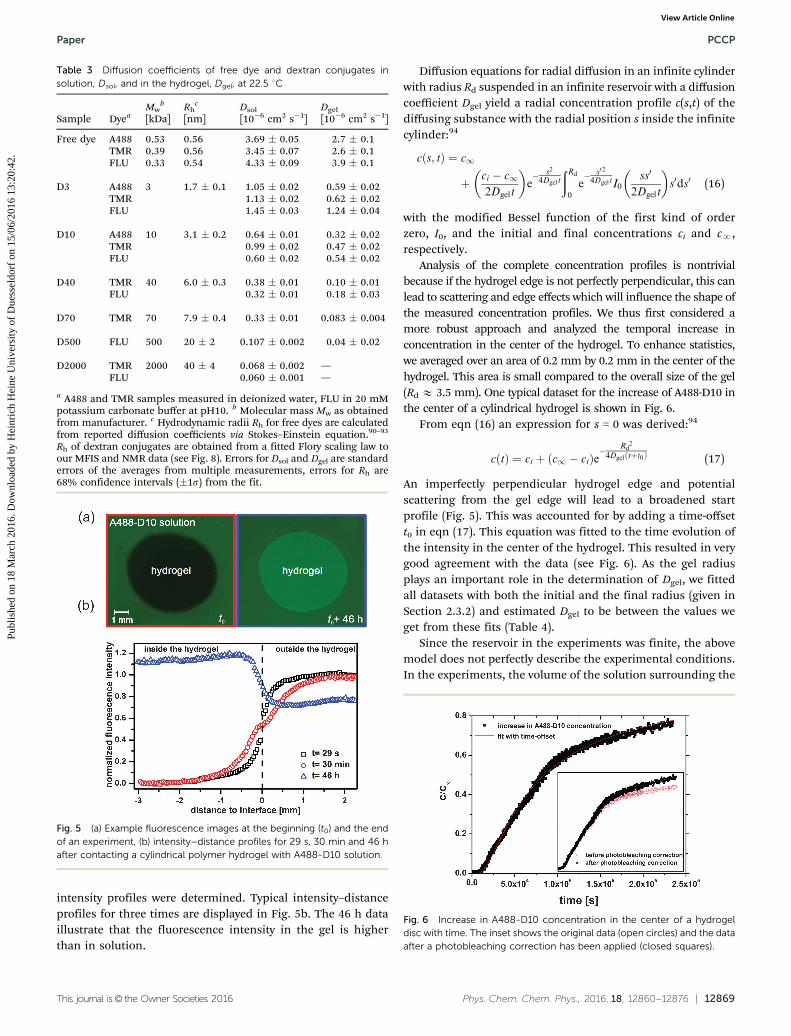
MTI. Fig. 5a shows an example set of fluorescence images atthe beginning and the end of an MTI experiment of A488-D10diffusing into a hydrogel disc. Due to the influx of fluorescentparticles into the polymer hydrogel, the fluorescence intensityinside the hydrogel increases with time. A higher intensity insidethe hydrogel is clearly visible at the end of the measurement. Thisindicates enhanced fluorescence of the dyes inside the gel and/oran attraction of the dye to the hydrogel. As expected, a variation ofthe particle concentration between 0.1 mM and 10 mM did notchange the diffusion coefficient.
In these experiments the two faces of the hydrogel discswere not accessible to the solvent. Thus, the samples can bedescribed as infinitely long cylinders in a reservoir of dye ordextran in solution, i.e. a quasi two-dimensional geometry withradial diffusion. Assuming azimuthally homogeneous diffu-sion, for every fluorescence image, the azimuthally averaged
Fig. 3 Average anisotropy ratio, rgel/rsol as a function of the fraction oftrapped particles derived from FCS measurements for A488-D10 (seeFig. 1), TMR-D10 and FLU-D10. Linear extrapolation (without H2O value)yields rgel/rsol = 2.7 � 0.3 for x = 1.
Fig. 4 (a) Fluorescence time traces (sum of perpendicular and parallel channel) for a single pixel in the image of A488-D10 in solution and in the gel inwater conditions, (b) correlation curves of count rate selected subsets of the trace (for details see S5, ESI†).
PCCP Paper
Publ
ishe
d on
18
Mar
ch 2
016.
Dow
nloa
ded
by H
einr
ich
Hei
ne U
nive
rsity
of
Due
ssel
dorf
on
15/0
6/20
16 1
3:20
:42.
View Article Online
This journal is© the Owner Societies 2016 Phys. Chem. Chem. Phys., 2016, 18, 12860--12876 | 12869
intensity profiles were determined. Typical intensity–distanceprofiles for three times are displayed in Fig. 5b. The 46 h dataillustrate that the fluorescence intensity in the gel is higherthan in solution.
Diffusion equations for radial diffusion in an infinite cylinderwith radius Rd suspended in an infinite reservoir with a diffusioncoefficient Dgel yield a radial concentration profile c(s,t) of thediffusing substance with the radial position s inside the infinitecylinder:94
cðs; tÞ ¼ c1
þ ci � c12Dgelt
� �e� s2
4Dgelt
ðRd
0
e� s024DgeltI0
ss0
2Dgelt
� �s0ds0 (16)
with the modified Bessel function of the first kind of orderzero, I0, and the initial and final concentrations ci and cN,respectively.
Analysis of the complete concentration profiles is nontrivialbecause if the hydrogel edge is not perfectly perpendicular, this canlead to scattering and edge effects which will influence the shape ofthe measured concentration profiles. We thus first considered amore robust approach and analyzed the temporal increase inconcentration in the center of the hydrogel. To enhance statistics,we averaged over an area of 0.2 mm by 0.2 mm in the center of thehydrogel. This area is small compared to the overall size of the gel(Rd E 3.5 mm). One typical dataset for the increase of A488-D10 inthe center of a cylindrical hydrogel is shown in Fig. 6.
From eqn (16) an expression for s = 0 was derived:94
cðtÞ ¼ ci þ c1 � cið Þe�Rd
2
4Dgel tþt0ð Þ (17)
An imperfectly perpendicular hydrogel edge and potentialscattering from the gel edge will lead to a broadened startprofile (Fig. 5). This was accounted for by adding a time-offsett0 in eqn (17). This equation was fitted to the time evolution ofthe intensity in the center of the hydrogel. This resulted in verygood agreement with the data (see Fig. 6). As the gel radiusplays an important role in the determination of Dgel, we fittedall datasets with both the initial and the final radius (given inSection 2.3.2) and estimated Dgel to be between the values weget from these fits (Table 4).
Since the reservoir in the experiments was finite, the abovemodel does not perfectly describe the experimental conditions.In the experiments, the volume of the solution surrounding the
Table 3 Diffusion coefficients of free dye and dextran conjugates insolution, Dsol, and in the hydrogel, Dgel, at 22.5 1C
Sample DyeaMw
b
[kDa]Rh
c
[nm]Dsol
[10�6 cm2 s�1]Dgel
[10�6 cm2 s�1]
Free dye A488 0.53 0.56 3.69 � 0.05 2.7 � 0.1TMR 0.39 0.56 3.45 � 0.07 2.6 � 0.1FLU 0.33 0.54 4.33 � 0.09 3.9 � 0.1
D3 A488 3 1.7 � 0.1 1.05 � 0.02 0.59 � 0.02TMR 1.13 � 0.02 0.62 � 0.02FLU 1.45 � 0.03 1.24 � 0.04
D10 A488 10 3.1 � 0.2 0.64 � 0.01 0.32 � 0.02TMR 0.99 � 0.02 0.47 � 0.02FLU 0.60 � 0.02 0.54 � 0.02
D40 TMR 40 6.0 � 0.3 0.38 � 0.01 0.10 � 0.01FLU 0.32 � 0.01 0.18 � 0.03
D70 TMR 70 7.9 � 0.4 0.33 � 0.01 0.083 � 0.004
D500 FLU 500 20 � 2 0.107 � 0.002 0.04 � 0.02
D2000 TMR 2000 40 � 4 0.068 � 0.002 —FLU 0.060 � 0.001 —
a A488 and TMR samples measured in deionized water, FLU in 20 mMpotassium carbonate buffer at pH10. b Molecular mass Mw as obtainedfrom manufacturer. c Hydrodynamic radii Rh for free dyes are calculatedfrom reported diffusion coefficients via Stokes–Einstein equation.90–93
Rh of dextran conjugates are obtained from a fitted Flory scaling law toour MFIS and NMR data (see Fig. 8). Errors for Dsol and Dgel are standarderrors of the averages from multiple measurements, errors for Rh are68% confidence intervals (�1s) from the fit.
Fig. 5 (a) Example fluorescence images at the beginning (t0) and the endof an experiment, (b) intensity–distance profiles for 29 s, 30 min and 46 hafter contacting a cylindrical polymer hydrogel with A488-D10 solution.
Fig. 6 Increase in A488-D10 concentration in the center of a hydrogeldisc with time. The inset shows the original data (open circles) and the dataafter a photobleaching correction has been applied (closed squares).
Paper PCCP
Publ
ishe
d on
18
Mar
ch 2
016.
Dow
nloa
ded
by H
einr
ich
Hei
ne U
nive
rsity
of
Due
ssel
dorf
on
15/0
6/20
16 1
3:20
:42.
View Article Online
12870 | Phys. Chem. Chem. Phys., 2016, 18, 12860--12876 This journal is© the Owner Societies 2016
gel was about 11 times the cylinder volume. This should resultin a homogeneous final dye concentration cN E 0.92ci in boththe gel and reservoir. This has not been observed (Fig. 5). Thus weconsidered a second model; diffusion into a cylinder from a stirredsolution of limited volume.94 The fitting results from this modelwere compared to those from the above model (eqn (16)). Thesecond model was found to describe the data for short and inter-mediate measurement times, but failed to describe the long timebehavior. The model suggests that saturation between cylinder andreservoir should be achieved much faster than seen in the experi-ments. This discrepancy could be due to an attractive interactionbetween the hydrogel and the diffusing molecules as indicated bythe MFIS experiments. In line with this idea is the observation thatfor all measurements with Alexa-labelled particles, the fluorescenceintensity of the hydrogel was higher than that of the surroundingsolution at the end of the measurement (Fig. 5). If the particles areattracted to the hydrogel, they will preferentially diffuse into the geleven after the concentration difference between gel and reservoir isbalanced. This corresponds to a larger effective reservoir asdescribed by eqn (16), which is based on an infinite reservoir.
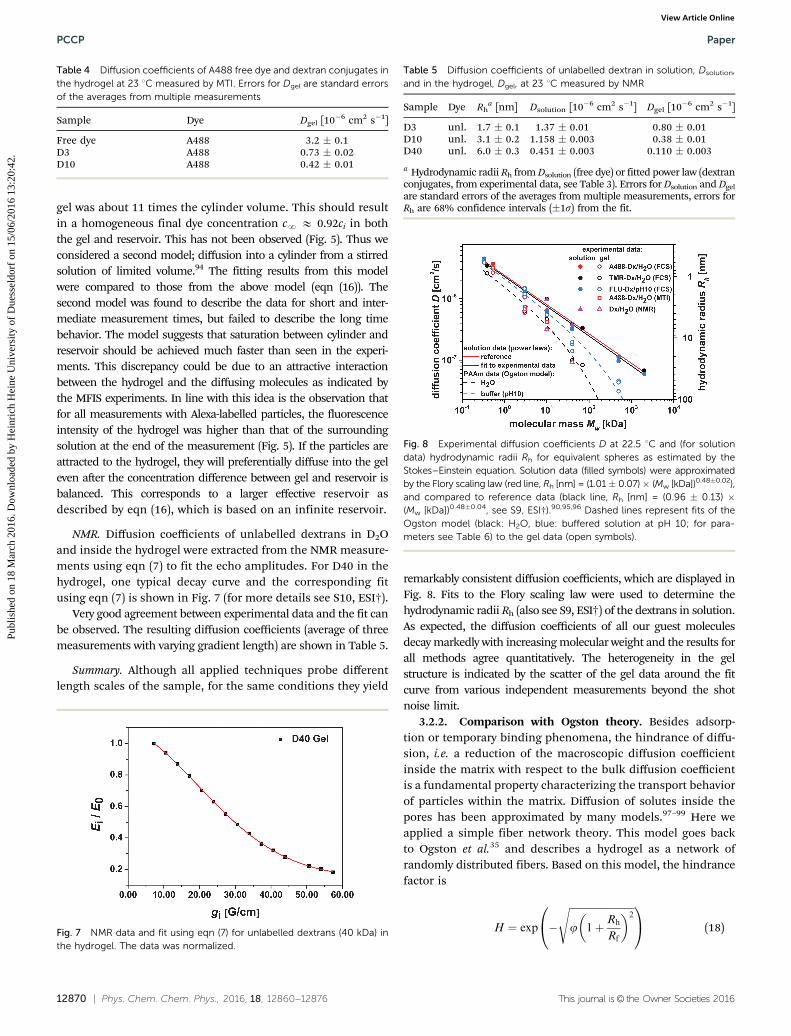
NMR. Diffusion coefficients of unlabelled dextrans in D2Oand inside the hydrogel were extracted from the NMR measure-ments using eqn (7) to fit the echo amplitudes. For D40 in thehydrogel, one typical decay curve and the corresponding fitusing eqn (7) is shown in Fig. 7 (for more details see S10, ESI†).
Very good agreement between experimental data and the fit canbe observed. The resulting diffusion coefficients (average of threemeasurements with varying gradient length) are shown in Table 5.
Summary. Although all applied techniques probe differentlength scales of the sample, for the same conditions they yield
remarkably consistent diffusion coefficients, which are displayed inFig. 8. Fits to the Flory scaling law were used to determine thehydrodynamic radii Rh (also see S9, ESI†) of the dextrans in solution.As expected, the diffusion coefficients of all our guest moleculesdecay markedly with increasing molecular weight and the results forall methods agree quantitatively. The heterogeneity in the gelstructure is indicated by the scatter of the gel data around the fitcurve from various independent measurements beyond the shotnoise limit.
3.2.2. Comparison with Ogston theory. Besides adsorp-tion or temporary binding phenomena, the hindrance of diffu-sion, i.e. a reduction of the macroscopic diffusion coefficientinside the matrix with respect to the bulk diffusion coefficientis a fundamental property characterizing the transport behaviorof particles within the matrix. Diffusion of solutes inside thepores has been approximated by many models.97–99 Here weapplied a simple fiber network theory. This model goes backto Ogston et al.35 and describes a hydrogel as a network ofrandomly distributed fibers. Based on this model, the hindrancefactor is
H ¼ exp �
ffiffiffiffiffiffiffiffiffiffiffiffiffiffiffiffiffiffiffiffiffiffiffiffiffiffij 1þ Rh
Rf
� �2s0
@1A (18)
Table 4 Diffusion coefficients of A488 free dye and dextran conjugates inthe hydrogel at 23 1C measured by MTI. Errors for Dgel are standard errorsof the averages from multiple measurements
Sample Dye Dgel [10�6 cm2 s�1]
Free dye A488 3.2 � 0.1D3 A488 0.73 � 0.02D10 A488 0.42 � 0.01
Fig. 7 NMR data and fit using eqn (7) for unlabelled dextrans (40 kDa) inthe hydrogel. The data was normalized.
Table 5 Diffusion coefficients of unlabelled dextran in solution, Dsolution,and in the hydrogel, Dgel, at 23 1C measured by NMR
Sample Dye Rha [nm] Dsolution [10�6 cm2 s�1] Dgel [10�6 cm2 s�1]
D3 unl. 1.7 � 0.1 1.37 � 0.01 0.80 � 0.01D10 unl. 3.1 � 0.2 1.158 � 0.003 0.38 � 0.01D40 unl. 6.0 � 0.3 0.451 � 0.003 0.110 � 0.003
a Hydrodynamic radii Rh from Dsolution (free dye) or fitted power law (dextranconjugates, from experimental data, see Table 3). Errors for Dsolution and Dgel
are standard errors of the averages from multiple measurements, errors forRh are 68% confidence intervals (�1s) from the fit.
Fig. 8 Experimental diffusion coefficients D at 22.5 1C and (for solutiondata) hydrodynamic radii Rh for equivalent spheres as estimated by theStokes–Einstein equation. Solution data (filled symbols) were approximatedby the Flory scaling law (red line, Rh [nm] = (1.01� 0.07)� (Mw [kDa])0.48�0.02),and compared to reference data (black line, Rh [nm] = (0.96 � 0.13) �(Mw [kDa])0.48�0.04, see S9, ESI†).90,95,96 Dashed lines represent fits of theOgston model (black: H2O, blue: buffered solution at pH 10; for para-meters see Table 6) to the gel data (open symbols).
PCCP Paper
Publ
ishe
d on
18
Mar
ch 2
016.
Dow
nloa
ded
by H
einr
ich
Hei
ne U
nive
rsity
of
Due
ssel
dorf
on
15/0
6/20
16 1
3:20
:42.
View Article Online
This journal is© the Owner Societies 2016 Phys. Chem. Chem. Phys., 2016, 18, 12860--12876 | 12871
where Rf is the radius and j the volume fraction of the fibers inthe gel and Rh the hydrodynamic radius of the diffusing species.
The important assumptions behind this model are known:(i) the solute/fiber interaction is purely hard-sphere in nature,(ii) the fibers are infinitely long and were placed randomly inthe matrix, and (iii) the solute concentration is very low, so thatsolute–solute interactions are negligible in both phases. It isclear that such approach can only be a crude approximation ofthe real physical effects that are governing the translocation inthe matrix in our system. Nevertheless, Ogston’s model yields aconvenient and simple analytic expression to analyze funda-mental trends. Moreover, such approach implies the use ofeffective parameters, permitting in terms of the volume fraction(j), to obtain reasonable results in comparison to the experi-mental values as estimated from analysis of the swelling behavior(see Section 2.1.1).
As expected and shown in Fig. 8, the diffusion coefficientD decreases with dextran size, with the decrease being morepronounced in the gel. Thus, the hindrance factor, H = Dgel/Dsol,will also decrease with increasing hydrodynamic radius Rh ofthe dextrans (see Fig. 12).
Dashed lines in Fig. 8 represent the curves calculated with theOgston model (eqn (18)) using the fit parameters listed in Table 6.
The agreement with our data is already very good. Using newer,comparable models (such as the Amsden-model97) did notnoticeably improve agreement with our data (thus not shownin Fig. 8).
3.2.3. Comparison with Brownian dynamics simulations.While the Ogston model provides a simple analytical formula todescribe the trends for the dextran dynamics with an effectiveexcluded volume, we now apply our Brownian dynamics simu-lations (see Section 2.4) for a more detailed modeling approach.Different approaches to model a hydrogel have been used inprevious works. When investigating the swelling behavior of a gel,Linse and coworkers36–39 and Holm and coworkers40–42 resolved theindividual monomers of the gel network. However the dynamics oftracer particles through the network was not performed within thislevel of modelling. Addressing tracer motion within monomer-resolved modelling requires much more computational resourcesin particular for long-time diffusion. Also the fitting procedurewould require several sets of runs. Therefore we leave monomerresolved studies to future work. Instead we decided to follow themore coarse-grained approach by Zhou and Chen.47 This type ofmodeling provides a simple and systematic framework in whichto include different physical effects, namely the mobility of thematrix particles (i.e. fluctuations in the matrix structure), theeffective dextran–matrix excluded volume, and sticky attractions.The matrix-dextran interactions are expected to play a key role inspreading the delay times of the diffusive process of the dextranmolecules through the matrix. Fig. 9 shows schematic two-dimensional representations of the three-dimensional simula-tions on the three different levels that were used to explain theexperimental data.
In qualitative terms, one would expect increasing agreementbetween the simulation and experimental data as we increase
Table 6 Results from fitted model function with standard errors and theexperimentally determined polymer volume fraction (j in the swollenhydrogel)
TMR-Dx/H2O FLU-Dx/pH 10
j (exp.) 0.0390 � 0.0004 0.0150 � 0.0001Fiber networkmodel (eqn (18))
j 0.06 � 0.03 0.005 � 0.007Rf [nm] 1.4 � 0.5 1.3 � 1.1
Fig. 9 Four models for the dextran–matrix system. Model 1: fixed gel matrix (steric interaction, eqn (8)), model 2: flexible gel matrix (steric interaction,eqn (8)), model 3a: flexible gel matrix (soft interaction, eqn (10)) and model 3b: flexible gel matrix (steric interaction and attractive shell, eqn (11)). Thesketches illustrate two-dimensional representations of the three-dimensional models used for the simulations.
Paper PCCP
Publ
ishe
d on
18
Mar
ch 2
016.
Dow
nloa
ded
by H
einr
ich
Hei
ne U
nive
rsity
of
Due
ssel
dorf
on
15/0
6/20
16 1
3:20
:42.
View Article Online
12872 | Phys. Chem. Chem. Phys., 2016, 18, 12860--12876 This journal is© the Owner Societies 2016
the level of complexity. This is indeed what is observed anddisplayed in Fig. 10, where the different simulation results arecompared to FCS data. In model 1, hard matrix particles arefixed on simple cubic lattice sites, providing a uniform matrixwith just one pore size. This results in a very sharp drop in thehindrance factor when the dextran’s size is increased to thispore size. Introducing elastically connected matrix particles(model 2) broadens the pore size distribution and leads to aslower decrease of the hindrance factors with dextran size, asexpected. However, this decrease is still too sharp compared tothe experimental data. Softening the interactions by changingthe interaction potentials from WCA to a Gaussian potential(model 3a) shows an even lower, yet still too distinct decrease, ofthe hindrance factor with increasing dextran size. The agreementis still unsatisfactory. Especially the hindrance of the smallerdextrans is too weak in the previous approaches. When thesesmall dextrans collide with matrix particles, they can easily findanother way to pass due to their small size.
The introduction of an attractive contribution in the matrix-guest interaction (model 3b) is found to be crucial to describe theobserved slow decay with increasing dextran sizes. If the smallerdextrans collide with matrix particles in this model, they can stillfind another path to pass. However, they are more likely to firstbecome stuck resulting in a slowdown even for small dextrans.
Model 3b is the only one which includes a repulsive inter-action and an attractive shell and it is the best representation ofour experimental data. Additional simulations performed withinmodel 3b using a Gaussian softened core showed a similar fitquality as that with a WCA-core. The results show that, withinthe framework of the model classes considered here, an effectiveattraction is needed to describe the spreading of the dynamicscorrectly given the statistical uncertainties of the experimentaldata. The origin of this attraction still needs to be resolved. Forspecific simulation parameters see the Table S11 (ESI†).
3.3. Estimation of the average pore size
The theoretical study permits an estimation of the average poresize of the investigated hydrogel in the two experimental environ-ments. We optimized for the a priori unknown average pore size byfitting the simulated hindrance factors to the experimental data.Since the positions of all matrix particles in the BD-simulation
are known, one can estimate the size of a specific pore in the gel asthe center-to-center distance of two neighboring matrix-particlesminus the matrix-particle-diameter. The decision which matrixparticle pairs have to be counted as ‘neighbors’, is subject to acertain degree of arbitrariness. We chose to consider all particlepairs that are connected with springs, therefore possibly over-estimating the correct value by neglecting close, but unconnected,matrix particle-pairs. Fig. 11 shows this distribution for bothinvestigated conditions calculated using model 3b.
We obtained an average value of 11 � 1 nm for gels in waterand 38 � 3 nm for gels in buffer at pH 10 for the final set ofparameters after the fit. While this average pore size is anoutput from fitting the simulated hindrance factors to theexperimental data, the shape of the distribution is rather aninput as the width of this distribution (standard deviations = 5 nm for water, s = 16 nm for pH 10 in Fig. 11) scales withthe average value as defined in the models. The average valuesare in the same order of magnitude as calculated from swellingexperiments, where we estimated 5.7 nm and 7.8 nm, respectively,assuming ideal solvent quality, homogeneous cross-linking densitiesand Gaussian distribution of chain lengths (see Section 2.1.1). InH2O both results differ by less than a factor of 2.
Fig. 10 Comparison between FCS experimental data and Brownian dynamic simulations with 4 different models for TMR-dextran in water conditions (a)and FLU-dextran in 20 mM potassium carbonate buffer at pH 10 (b).
Fig. 11 The distribution of the free space between connected matrixparticles (dots) in the BD simulation and the average pore size (bars) ofthe polymer matrix in both experimental conditions. It is based on the finalset of parameters after the fit within the applied model 3b. Black dotscorrespond to H2O, blue dots to 20 mM potassium carbonate buffer atpH 10 (for details see text).
PCCP Paper
Publ
ishe
d on
18
Mar
ch 2
016.
Dow
nloa
ded
by H
einr
ich
Hei
ne U
nive
rsity
of
Due
ssel
dorf
on
15/0
6/20
16 1
3:20
:42.
View Article Online
This journal is© the Owner Societies 2016 Phys. Chem. Chem. Phys., 2016, 18, 12860--12876 | 12873
We now compare the results of our gel ([T] = 0.04 g ml�1,CR = 0.035), obtained in water conditions, with literature valuesfor gels with similar composition. Significant discrepancy betweenpore size values resulting from scanning electron microscopy SEM(10–20 mm)32–34 and swelling analysis (2.0 nm) was reported.33
When using SEM, the structure of the gel may become damagedduring the freeze-drying processes, resulting in systematically toolarge pore sizes. In our study, we measured under native condi-tions without disturbing the gel matrix structure thus circumvent-ing this problem.
In gel electrophoresis with DNA as a cylindrical tracer mole-cule,23,30,31 pore sizes between 5.9 and 133 nm are reported for gelswith similar composition to ours. The hydrodynamic radius of theDNA was not measured directly but calculated using differentmodels which is known to be an intrinsic problem. ApproximatingDNA by a sphere becomes more reasonable for shorter DNAmolecules. Therefore it is notable, that the electrophoresis studyusing the shortest DNA30 matches our result the best.
Very early work of polyacrylamide gels, using electrophoresisof proteins29 in phosphate buffer, pH 7 ([T] = 0.06 g ml�1,CR = 0.05) and chromatography of proteins28 in water ([T] =0.065 g ml�1, CR = 0.02) agree well with our results, yielding8.5 nm and 2.25 nm, respectively. In addition, recent studies96
based on dynamic light scattering revealed mesh sizes of thesame order of magnitude for polyacrylamide hydrogels of about15 nm and for poly(N-isopropylacrylamide) of about 19 nm.
4. Combined results and conclusions
All data for the hindrance factor H obtained from the threedifferent and independent methods we have applied are displayedand compared to Brownian dynamics simulations performed withmodel 3b in Fig. 12. For the MTI measurements, the averagevalues of Dsol from NMR and MFIS were used to scale the data, asthey could not be measured with this technique.
We have shown that the long time diffusion coefficients ofdextran molecules moving in solution and in a polyacrylamide gel
matrix determined on different length scales by using multipara-meter fluorescence image spectroscopy (MFIS), macroscopic trans-mission imaging (MTI) and nuclear magnetic resonance (NMR)are consistent. The measured diffusion coefficients decrease withincreasing molecular weight and fall on a master curve. Thissupports the reliability of our data set, which might thus serveas possible calibration data for future experiments and theories.
In addition, although our results could be described by theOgston model (Fig. 12), a more realistic model of a flexible gelmatrix was applied to describe the experimental data and toestimate the average pore size in the gel. The simulated averagepore sizes of 11 nm (water) and 38 nm (pH 10) agree reasonablywell with estimations from swelling theory of 5.7 nm and7.8 nm, respectively. Within the experimental error bars andthe limitations of the applied models, our results for the gelequilibrated in water are in good agreement with publishedstudies employing comparable globular macromolecular probes(2.25 nm28 or 8.5 nm29) as well as with light scattering investiga-tions (15 nm)96 in native gels with similar composition.
Combining experiments and simulations enabled us toachieve a better understanding of the effects determining thediffusion of molecules in the gel network. Moreover, using theMFIS method, a significant interaction between hydrogel andmacromolecules was observed, in particular for A488 samples.The MTI results support the idea of the attractive interaction ofAlexa-labelled particles and the gel, showing that the fluorescenceintensity in the hydrogel was higher than that of the surroundingsolution at the end of the measurements. This suggests to useuncharged dyes or, in case of charged dyes, to add a sufficientlyhigh salt concentration for future investigations.
The heterogeneity inside a single hydrogel sample was probed ona length scale of 10 mm in anisotropy experiments by comparingdifferent pixels and hence different positions in the hydrogel (Fig. 2).Furthermore, for the experiments at pH 10, the scattering of datafrom various independent samples in Fig. 12b was significantlybeyond shot noise limits (or other experimental uncertainties),revealing a heterogeneity, which persisted over the completemeasurement times.82,83
Fig. 12 Hindrance factors H = Dgel/Dsol of dextrans in hydrogel. A488 (red), TMR (black) and unlabelled samples (magenta) measured in deionized water(a), FLU labelled samples (blue) measured in 20 mM potassium carbonate buffer at pH 10 (b). Experimental data: FCS (filled circles); MTI (open squares);NMR (open triangles); fitted model function: fiber network (eqn (18), dashed black and blue lines, parameters Table 6) and Brownian dynamics simulation(green points). The errors are the standard errors of repeat measurements.
Paper PCCP
Publ
ishe
d on
18
Mar
ch 2
016.
Dow
nloa
ded
by H
einr
ich
Hei
ne U
nive
rsity
of
Due
ssel
dorf
on
15/0
6/20
16 1
3:20
:42.
View Article Online
12874 | Phys. Chem. Chem. Phys., 2016, 18, 12860--12876 This journal is© the Owner Societies 2016
Despite our application of a wide range of methods and thegeneral consistency of the results we have obtained, open ques-tions remain. For example, while the hindrance factor in the limitof small tracer particle sizes tends to 1 in our FLU/pH 10 system, itseems to approach B0.8 in our TMR/H2O system (Fig. 12). A valueclose to 1 might still be approached for smaller tracer particles inour H2O system, but we could not investigate these in our studydue to experimental limitations. If one assumes that there really isa difference for smaller tracer molecules, the question whetherthis is due to different swelling in different environments orcaused by different interactions of the matrix with different dyescannot be answered with certainty yet.
For future studies, the diffusion of the same dextran moleculeswith the same dyes in differently crosslinked matrices should beexplored systematically in order to distinguish between differentmodes governing the translocation.
Abbreviations
Mass concentration of polymeric material [T]in total volumeWeight fraction of cross-linker with respect to CR
the total mass of the polymeric materialDiffusion time td
Gel disk radius Rd
Volume dry polymer Vp
Volume gel after swelling Vgel
Mass mWater density rH2O
Polymer density rp
Polymer volume fraction in the swollen state jMolecular weight of the polymer between Mc
cross-links pointsMolecular weight of the repeating units Mr
Polymer mesh size xCross-linking degree in the hydrogel XCarbon–carbon bond length zFlory characteristic ratio Cn
Numerical aperture NADetection volume in MFIS Vdet
Temperature TDiffusion coefficient DGradient pulse width dDiffusion delay DN
FCS fit model function G(tc)Triplet time tT
Triplet amplitude AT
Correlation time tc
Confocal volume radius in x and y o0
Confocal volume radius in z z0
Detection probability w(x,y,z)Number of molecules NMolecular fraction xi
Position coordinates x, y, zFluorescence intensity F, FJ, F>
Polarization correction factors l1, l2
Fluorescence anisotropy of species i ri
G-Factor GIntensity fit parameters in MTI P, p, Q, qEcho intensities Ei, E0
Gyromagnetic ratio gGradient amplitude at increment i gi
Delay between pulses tN
Boltzmann constant kB
Lattice constant aDistance in simulations models si,j
Radius RHydrodynamic radius Rh
Matrix particle radius Robst
Position of particles in simulations models -s
Mean square displacement Ds2
Time, reference time t, t0
Potential between i and j particles Ui,j
Energy steric constant es
Energy Gaussian constant eG
Energy attractive constant ea
Constant in simulations models bAdditive diameter si,j
Position of minimum in simulations models li,j
Hindrance factor HCharge Zi
Effective binding constant Kd0
Ionic strength IEffective ion radius Ri
Activity ai
Concentration ci
Activity coefficient fi
Debye–Huckel constants A, BDebye length k�1
Photon number NF
Fluorescence lifetime of species i ti
Radiative lifetime of species i tr,i
Bessel function I0
Radial position inside an infinity cylinder for MTI fit s, s0
Fiber radius Rf
Acknowledgements
C. J., H. L., S. U. E., and C. A. M. S. gratefully acknowledge partialfinancial support from the Strategic Research Fund of the HHU.Additional funding was given to D. W. by BioSoft and to C. E. S.and H. L. by the ERC Advanced Grant INTERCOCOS (grantagreement 267499).
References
1 S. T. Balke, A. E. Hamielec, B. P. LeClair and S. L. Pearce,Ind. Eng. Chem. Prod. Res. Dev., 1969, 8, 54–57.
2 F. Chen, P. Tillberg and E. Boyden, Science, 2015, 347,543–548.
PCCP Paper
Publ
ishe
d on
18
Mar
ch 2
016.
Dow
nloa
ded
by H
einr
ich
Hei
ne U
nive
rsity
of
Due
ssel
dorf
on
15/0
6/20
16 1
3:20
:42.
View Article Online
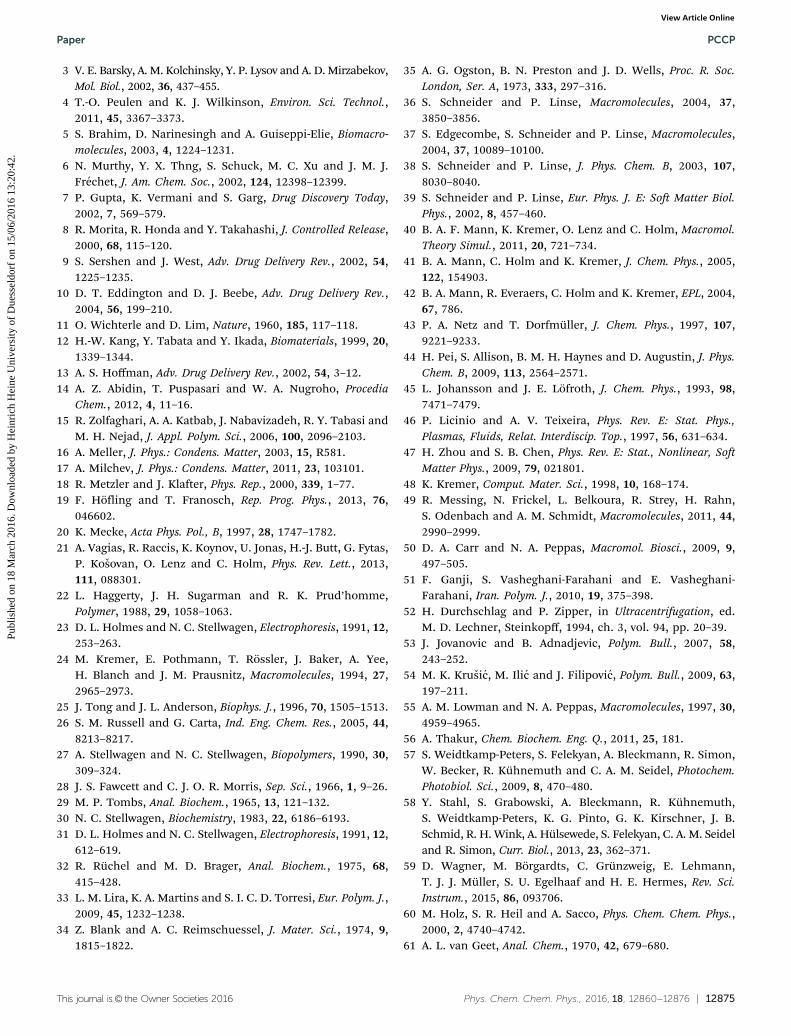
This journal is© the Owner Societies 2016 Phys. Chem. Chem. Phys., 2016, 18, 12860--12876 | 12875
3 V. E. Barsky, A. M. Kolchinsky, Y. P. Lysov and A. D. Mirzabekov,Mol. Biol., 2002, 36, 437–455.
4 T.-O. Peulen and K. J. Wilkinson, Environ. Sci. Technol.,2011, 45, 3367–3373.
5 S. Brahim, D. Narinesingh and A. Guiseppi-Elie, Biomacro-molecules, 2003, 4, 1224–1231.
6 N. Murthy, Y. X. Thng, S. Schuck, M. C. Xu and J. M. J.Frechet, J. Am. Chem. Soc., 2002, 124, 12398–12399.
7 P. Gupta, K. Vermani and S. Garg, Drug Discovery Today,2002, 7, 569–579.
8 R. Morita, R. Honda and Y. Takahashi, J. Controlled Release,2000, 68, 115–120.
9 S. Sershen and J. West, Adv. Drug Delivery Rev., 2002, 54,1225–1235.
10 D. T. Eddington and D. J. Beebe, Adv. Drug Delivery Rev.,2004, 56, 199–210.
11 O. Wichterle and D. Lim, Nature, 1960, 185, 117–118.12 H.-W. Kang, Y. Tabata and Y. Ikada, Biomaterials, 1999, 20,
1339–1344.13 A. S. Hoffman, Adv. Drug Delivery Rev., 2002, 54, 3–12.14 A. Z. Abidin, T. Puspasari and W. A. Nugroho, Procedia
Chem., 2012, 4, 11–16.15 R. Zolfaghari, A. A. Katbab, J. Nabavizadeh, R. Y. Tabasi and
M. H. Nejad, J. Appl. Polym. Sci., 2006, 100, 2096–2103.16 A. Meller, J. Phys.: Condens. Matter, 2003, 15, R581.17 A. Milchev, J. Phys.: Condens. Matter, 2011, 23, 103101.18 R. Metzler and J. Klafter, Phys. Rep., 2000, 339, 1–77.19 F. Hofling and T. Franosch, Rep. Prog. Phys., 2013, 76,
046602.20 K. Mecke, Acta Phys. Pol., B, 1997, 28, 1747–1782.21 A. Vagias, R. Raccis, K. Koynov, U. Jonas, H.-J. Butt, G. Fytas,
P. Kosovan, O. Lenz and C. Holm, Phys. Rev. Lett., 2013,111, 088301.
22 L. Haggerty, J. H. Sugarman and R. K. Prud’homme,Polymer, 1988, 29, 1058–1063.
23 D. L. Holmes and N. C. Stellwagen, Electrophoresis, 1991, 12,253–263.
24 M. Kremer, E. Pothmann, T. Rossler, J. Baker, A. Yee,H. Blanch and J. M. Prausnitz, Macromolecules, 1994, 27,2965–2973.
25 J. Tong and J. L. Anderson, Biophys. J., 1996, 70, 1505–1513.26 S. M. Russell and G. Carta, Ind. Eng. Chem. Res., 2005, 44,
8213–8217.27 A. Stellwagen and N. C. Stellwagen, Biopolymers, 1990, 30,
309–324.28 J. S. Fawcett and C. J. O. R. Morris, Sep. Sci., 1966, 1, 9–26.29 M. P. Tombs, Anal. Biochem., 1965, 13, 121–132.30 N. C. Stellwagen, Biochemistry, 1983, 22, 6186–6193.31 D. L. Holmes and N. C. Stellwagen, Electrophoresis, 1991, 12,
612–619.32 R. Ruchel and M. D. Brager, Anal. Biochem., 1975, 68,
415–428.33 L. M. Lira, K. A. Martins and S. I. C. D. Torresi, Eur. Polym. J.,
2009, 45, 1232–1238.34 Z. Blank and A. C. Reimschuessel, J. Mater. Sci., 1974, 9,
1815–1822.
35 A. G. Ogston, B. N. Preston and J. D. Wells, Proc. R. Soc.London, Ser. A, 1973, 333, 297–316.
36 S. Schneider and P. Linse, Macromolecules, 2004, 37,3850–3856.
37 S. Edgecombe, S. Schneider and P. Linse, Macromolecules,2004, 37, 10089–10100.
38 S. Schneider and P. Linse, J. Phys. Chem. B, 2003, 107,8030–8040.
39 S. Schneider and P. Linse, Eur. Phys. J. E: Soft Matter Biol.Phys., 2002, 8, 457–460.
40 B. A. F. Mann, K. Kremer, O. Lenz and C. Holm, Macromol.Theory Simul., 2011, 20, 721–734.
41 B. A. Mann, C. Holm and K. Kremer, J. Chem. Phys., 2005,122, 154903.
42 B. A. Mann, R. Everaers, C. Holm and K. Kremer, EPL, 2004,67, 786.
43 P. A. Netz and T. Dorfmuller, J. Chem. Phys., 1997, 107,9221–9233.
44 H. Pei, S. Allison, B. M. H. Haynes and D. Augustin, J. Phys.Chem. B, 2009, 113, 2564–2571.
45 L. Johansson and J. E. Lofroth, J. Chem. Phys., 1993, 98,7471–7479.
46 P. Licinio and A. V. Teixeira, Phys. Rev. E: Stat. Phys.,Plasmas, Fluids, Relat. Interdiscip. Top., 1997, 56, 631–634.
47 H. Zhou and S. B. Chen, Phys. Rev. E: Stat., Nonlinear, SoftMatter Phys., 2009, 79, 021801.
48 K. Kremer, Comput. Mater. Sci., 1998, 10, 168–174.49 R. Messing, N. Frickel, L. Belkoura, R. Strey, H. Rahn,
S. Odenbach and A. M. Schmidt, Macromolecules, 2011, 44,2990–2999.
50 D. A. Carr and N. A. Peppas, Macromol. Biosci., 2009, 9,497–505.
51 F. Ganji, S. Vasheghani-Farahani and E. Vasheghani-Farahani, Iran. Polym. J., 2010, 19, 375–398.
52 H. Durchschlag and P. Zipper, in Ultracentrifugation, ed.M. D. Lechner, Steinkopff, 1994, ch. 3, vol. 94, pp. 20–39.
53 J. Jovanovic and B. Adnadjevic, Polym. Bull., 2007, 58,243–252.
54 M. K. Krusic, M. Ilic and J. Filipovic, Polym. Bull., 2009, 63,197–211.
55 A. M. Lowman and N. A. Peppas, Macromolecules, 1997, 30,4959–4965.
56 A. Thakur, Chem. Biochem. Eng. Q., 2011, 25, 181.57 S. Weidtkamp-Peters, S. Felekyan, A. Bleckmann, R. Simon,
W. Becker, R. Kuhnemuth and C. A. M. Seidel, Photochem.Photobiol. Sci., 2009, 8, 470–480.
58 Y. Stahl, S. Grabowski, A. Bleckmann, R. Kuhnemuth,S. Weidtkamp-Peters, K. G. Pinto, G. K. Kirschner, J. B.Schmid, R. H. Wink, A. Hulsewede, S. Felekyan, C. A. M. Seideland R. Simon, Curr. Biol., 2013, 23, 362–371.
59 D. Wagner, M. Borgardts, C. Grunzweig, E. Lehmann,T. J. J. Muller, S. U. Egelhaaf and H. E. Hermes, Rev. Sci.Instrum., 2015, 86, 093706.
60 M. Holz, S. R. Heil and A. Sacco, Phys. Chem. Chem. Phys.,2000, 2, 4740–4742.
61 A. L. van Geet, Anal. Chem., 1970, 42, 679–680.
Paper PCCP
Publ
ishe
d on
18
Mar
ch 2
016.
Dow
nloa
ded
by H
einr
ich
Hei
ne U
nive
rsity
of
Due
ssel
dorf
on
15/0
6/20
16 1
3:20
:42.
View Article Online
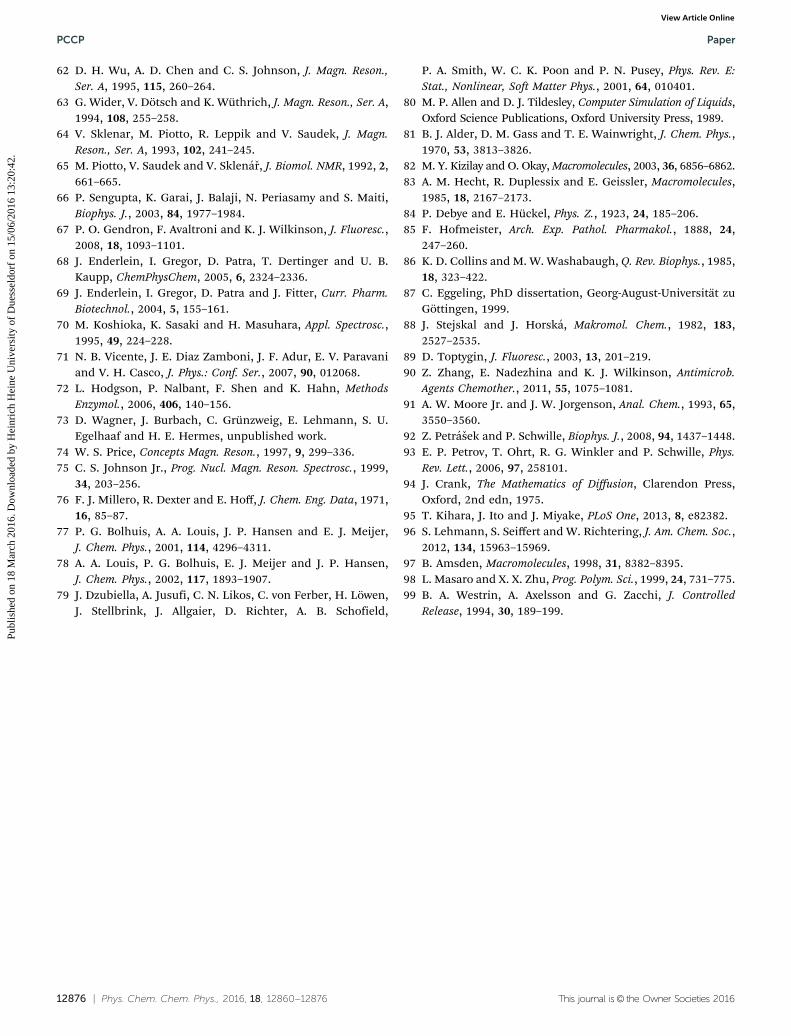
12876 | Phys. Chem. Chem. Phys., 2016, 18, 12860--12876 This journal is© the Owner Societies 2016
62 D. H. Wu, A. D. Chen and C. S. Johnson, J. Magn. Reson.,Ser. A, 1995, 115, 260–264.
63 G. Wider, V. Dotsch and K. Wuthrich, J. Magn. Reson., Ser. A,1994, 108, 255–258.
64 V. Sklenar, M. Piotto, R. Leppik and V. Saudek, J. Magn.Reson., Ser. A, 1993, 102, 241–245.
65 M. Piotto, V. Saudek and V. Sklenar, J. Biomol. NMR, 1992, 2,661–665.
66 P. Sengupta, K. Garai, J. Balaji, N. Periasamy and S. Maiti,Biophys. J., 2003, 84, 1977–1984.
67 P. O. Gendron, F. Avaltroni and K. J. Wilkinson, J. Fluoresc.,2008, 18, 1093–1101.
68 J. Enderlein, I. Gregor, D. Patra, T. Dertinger and U. B.Kaupp, ChemPhysChem, 2005, 6, 2324–2336.
69 J. Enderlein, I. Gregor, D. Patra and J. Fitter, Curr. Pharm.Biotechnol., 2004, 5, 155–161.
70 M. Koshioka, K. Sasaki and H. Masuhara, Appl. Spectrosc.,1995, 49, 224–228.
71 N. B. Vicente, J. E. Diaz Zamboni, J. F. Adur, E. V. Paravaniand V. H. Casco, J. Phys.: Conf. Ser., 2007, 90, 012068.
72 L. Hodgson, P. Nalbant, F. Shen and K. Hahn, MethodsEnzymol., 2006, 406, 140–156.
73 D. Wagner, J. Burbach, C. Grunzweig, E. Lehmann, S. U.Egelhaaf and H. E. Hermes, unpublished work.
74 W. S. Price, Concepts Magn. Reson., 1997, 9, 299–336.75 C. S. Johnson Jr., Prog. Nucl. Magn. Reson. Spectrosc., 1999,
34, 203–256.76 F. J. Millero, R. Dexter and E. Hoff, J. Chem. Eng. Data, 1971,
16, 85–87.77 P. G. Bolhuis, A. A. Louis, J. P. Hansen and E. J. Meijer,
J. Chem. Phys., 2001, 114, 4296–4311.78 A. A. Louis, P. G. Bolhuis, E. J. Meijer and J. P. Hansen,
J. Chem. Phys., 2002, 117, 1893–1907.79 J. Dzubiella, A. Jusufi, C. N. Likos, C. von Ferber, H. Lowen,
J. Stellbrink, J. Allgaier, D. Richter, A. B. Schofield,
P. A. Smith, W. C. K. Poon and P. N. Pusey, Phys. Rev. E:Stat., Nonlinear, Soft Matter Phys., 2001, 64, 010401.
80 M. P. Allen and D. J. Tildesley, Computer Simulation of Liquids,Oxford Science Publications, Oxford University Press, 1989.
81 B. J. Alder, D. M. Gass and T. E. Wainwright, J. Chem. Phys.,1970, 53, 3813–3826.
82 M. Y. Kizilay and O. Okay, Macromolecules, 2003, 36, 6856–6862.83 A. M. Hecht, R. Duplessix and E. Geissler, Macromolecules,
1985, 18, 2167–2173.84 P. Debye and E. Huckel, Phys. Z., 1923, 24, 185–206.85 F. Hofmeister, Arch. Exp. Pathol. Pharmakol., 1888, 24,
247–260.86 K. D. Collins and M. W. Washabaugh, Q. Rev. Biophys., 1985,
18, 323–422.87 C. Eggeling, PhD dissertation, Georg-August-Universitat zu
Gottingen, 1999.88 J. Stejskal and J. Horska, Makromol. Chem., 1982, 183,
2527–2535.89 D. Toptygin, J. Fluoresc., 2003, 13, 201–219.90 Z. Zhang, E. Nadezhina and K. J. Wilkinson, Antimicrob.
Agents Chemother., 2011, 55, 1075–1081.91 A. W. Moore Jr. and J. W. Jorgenson, Anal. Chem., 1993, 65,
3550–3560.92 Z. Petrasek and P. Schwille, Biophys. J., 2008, 94, 1437–1448.93 E. P. Petrov, T. Ohrt, R. G. Winkler and P. Schwille, Phys.
Rev. Lett., 2006, 97, 258101.94 J. Crank, The Mathematics of Diffusion, Clarendon Press,
Oxford, 2nd edn, 1975.95 T. Kihara, J. Ito and J. Miyake, PLoS One, 2013, 8, e82382.96 S. Lehmann, S. Seiffert and W. Richtering, J. Am. Chem. Soc.,
2012, 134, 15963–15969.97 B. Amsden, Macromolecules, 1998, 31, 8382–8395.98 L. Masaro and X. X. Zhu, Prog. Polym. Sci., 1999, 24, 731–775.99 B. A. Westrin, A. Axelsson and G. Zacchi, J. Controlled
Release, 1994, 30, 189–199.
PCCP Paper
Publ
ishe
d on
18
Mar
ch 2
016.
Dow
nloa
ded
by H
einr
ich
Hei
ne U
nive
rsity
of
Due
ssel
dorf
on
15/0
6/20
16 1
3:20
:42.
View Article Online