Embed Size (px)
Citation preview

Digital Geological Map of the Southern and Central Puna Plateau,
NW Argentina
W. Schnurr1,3, A. Risse2, R.B. Trumbull2, K. Munier3
1 Erich-Klausener-Str. 22, 15827 Blankenfelde, Germany 2 GeoForschungsZentrum Potsdam, Telegrafenberg, 14473 Potsdam, Germany 3 Institut für Geologie, Freie Universität Berlin, Malteserstr. 74-100, 12249 Berlin, Germany
Contents: Background ........................................................................................................................ 2 Geographic limits of the map ............................................................................................. 2 Sources and versions of map data ...................................................................................... 2 Coordinate system used:..................................................................................................... 3 GIS procedures and user instructions................................................................................. 4
Software basis: ............................................................................................................... 4 Using the map with ArcGis............................................................................................ 4 Start a project with the geological map:......................................................................... 4 Geological units and tectonic data ................................................................................. 5 Assignment table for IDs used for the lithologic and structural units on the map......... 6 Customizing the lithologic units .................................................................................... 6 Problems and Remarks................................................................................................. 14
1

Background The digital geological map of the southern Puna covers an area of about 60,000 km2 in the provinces of Salta und Catamarca, NW Argentina. The map is based on published maps of the Servicio Geológico Minero Argentino (SEGEMAR), augmented by satellite interpretation and unpublished results of field studies from the SFB-267 programme. The GIS map was produced as an aid for documentation and interpretation of research in the SFB-267 projects. Because many of these projects were dealing with volcanic rocks, either as petrologic-geochemical applications or geochronologic-tectonic applications, one emphasis in lithologic attributes for the digital map was on Cenozoic volcanic units.
Geographic limits of the map N: 24°S and the national border to Chile S: 27°S E: 67° 15’W W: 68° 30’W and the national border to Chile
Sources and versions of map data Satellite images Landsat 5 Thematic Mapper Satellite, scenes 19-25 and 19-20, processed and geo-referenced by the SFB-267 remote sensing group, Free University of Berlin. Geological Maps and reports 1:500,000 maps:
Martínez L (1995) Mapa Geológico de la Provincia de Catamarca, Escala 1:500,000. Servicio Geológico Minero de Argentina SEGEMAR, Buenos Aires.
Salfity JA, Monaldi CR (1998) Mapa Geológico de la Provincia de Salta, Escala 1:500.000. Servicio Geológico Minero de Argentina SEGEMAR, Buenos Aires.
1:250,000 maps: Blasco G, Zappettini E, Hongn F (1996) Hoja Geológica 2566-I (1:250,000) San
Antonio de los Cobres, provincias de Salta y Jujuy. Servicio Geológico Minero de Argentina, SEGEMAR, Buenos Aires, Boletín 217
Hongn FD, Monaldi CR, Alonso RN, Gonzalez RE, Seggiaro RE (1998) Hoja Geológica 2566-III-Cachi. Provincias de Salta y Catamarca. Servicio Geológico Minero de Argentina, SEGEMAR, Buenos Aires, Boletín 248 Hoja geológica Antofalla (2569-IV), preliminary version, 1999
Seggiaro R, Hongn F, Castillo A, Pereira F, Villegas D, Martinez L (2000) Hoja Geológica 2769-II Paso de San Francisco, Escala 1:250,000, Servicio Geológico Minero de Argentina SEGEMAR, Buenos Aires, Boletin 294.
Seggiaro RE, Becchio R, Schnurr W, Adelmann D, Erpenstein K (2004) Hoja 2569-IV, Antofalla, Escala 1:250,000. Servicio Geológico Minero de Argentina SEGEMAR, Buenos Aires, Boletin 343.
Geo-referencing the source maps: The geological maps were scanned and then georeferenced and fit to the satellite images using
the ArcMap program.
2

Internal reports and theses from the SFB-267 programme: Adelmann D (2001) Känozoische Beckenentwicklung des zentralandinen Puna-Plateaus
(NW-Argentinien). Das Gebiet um den Salar de Antofalla und ein Vergleich zur nördlichen Puna. Dissertation, Free University of Berlin. Berliner Geowissenschaftliche Abhandlungen, Reihe A Band 210, 142pp.
Erpenstein K, Görler K, Heim B, Kraemer B, Prokoph A, Voss R (1996) Sedimentation, Tektonik und Vulkanismus im Gebiet des Salar de Antofalla, südliche Puna (NW-Argentinien). Unpublished report, SFB-267 project D1b, Berlin, p. 755-808.
Kraemer B, Adelmann D, Alten M, Schnurr W, Erpenstein K, Kiefer E, van den Bogaard P, Görler K (1999) Incorporation of the Paleogene foreland into the Neogene Puna Plateau; the Salar de Antofalla area, NW Argentina. Journal of South American Earth Sciences, 12: 157-182.
Schnurr W (2001) Zur Geochemie und Genese neogener und quartärer felsicher Vulkanite in den südlichen Zentralanden (25°-27°S und 67°-69°W). Dissertation, Free University of Berlin. Berliner Geowissenschaftliche Abhandlungen, Reihe A Band 211, 152pp.
Voss R (2000) Die Geologie der Region um den südlichen Salar de Antofalla (NW-Argentinien). Dissertation, Free University of Berlin. Berliner Geowissenschaftliche Abhandlungen, Reihe A Band 208, 201pp.
Coordinate system used: Horizontal coordinate system GCS_WGS_1984
Projection datum: WGS_1984_UTM_Zone_19S Alternative WGS_1984_UTM_Zone_19N
Details Grid: Universal Transverse Mercator
UTM Zone Number: -19 Alternative 19
Transverse Mercator Projektion Scale Factor at Central Meridian: 0.999600 Longitude of Central Meridian: -69.000000 Latitude of Projection Origin: 0.000000 False Easting: 500000.000000 False Northing: 10000000.000000
Alternative 0.000000
Planar Distance Units: meters Coordinate Encoding Method: Rows and Columns
Alternative coordinate pairs
Geodetic model Horizontal Datum Name: D_WGS_1984 Ellipsoid Name: WGS_1984 Semi-major Axis: 6378137.000000 Denominator of Flattening Ratio: 298.257224
3

GIS procedures and user instructions
Software basis: ArcGIS 8.3 The symbol attributes in the shape files (geology_puna_GFZ.shp, faults_puna_GFZ.shp, etc) are saved as layer files (*.lyr) under the same names. For ArcView users, the symbol attributes were saved in: geology_GFZ_noFills.avl
Using the map with ArcGis
Start a project with the geological map: Call up the file Puna_GFZ_V01.mdx
Data are organized as follows (disregard directory names)
The format set for symbols is stored in the folder \GFZ_CD\Symbols\.
4

Geological units and tectonic data The GIS geological map of the Southern and Central Puna Plateau was constructed on the basis of a previous GIS project completed in the SFB-267: Geological Map from the Salar de Antofalla Area (Erpenstein et al., 1996). The previous map has been extended in the present project to the N, S, E and W, while maintaining the same lithologic and tectonic data structure, as outlined below: (geology_puna_GFZ.shp, faults_puna_GFZ.shp).
GEOL- SYM QS QA1 QA2 QT T3 T2 T1 T QbA bA An Rd Rh I Hy mV Pt Pal Gr Gs
ID 1 2 3 4 5 6 7 8 10 11 13 1 2 4 5 33 31 30 34 40 47 41 42 43 44 45 46 20 50 60 61
5
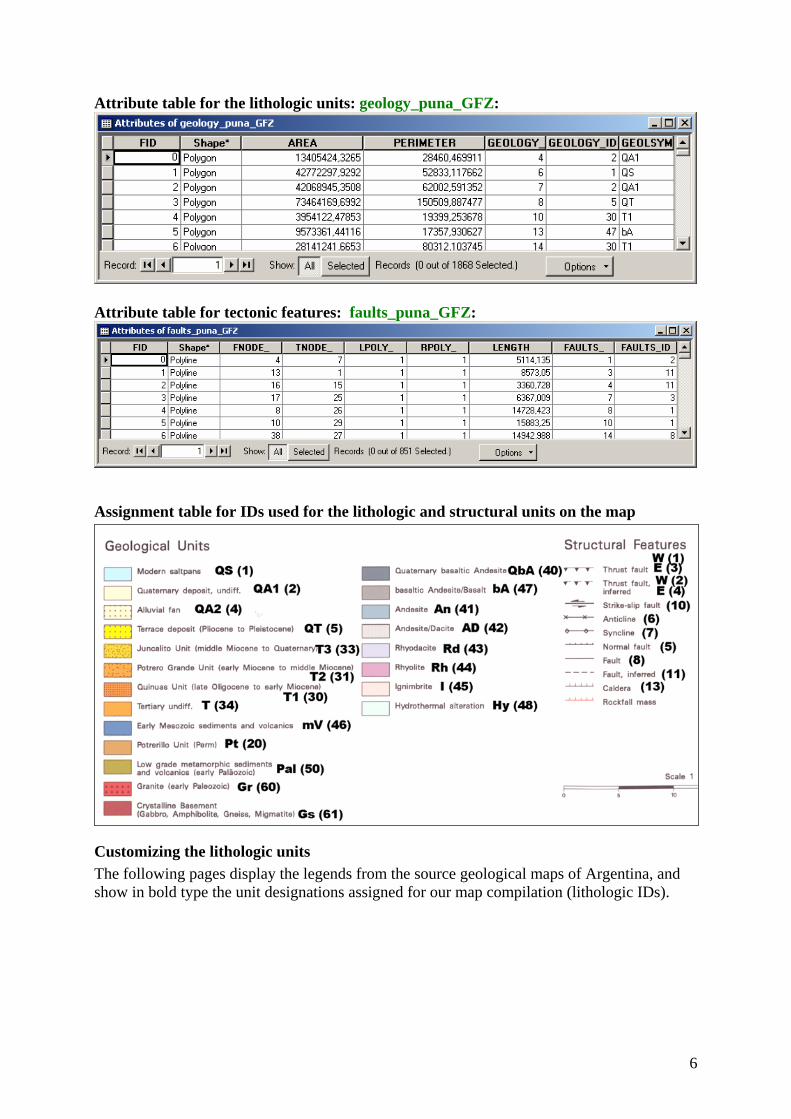
Attribute table for the lithologic units: geology_puna_GFZ:
Attribute table for tectonic features: faults_puna_GFZ:
Assignment table for IDs used for the lithologic and structural units on the map
Customizing the lithologic units The following pages display the legends from the source geological maps of Argentina, and show in bold type the unit designations assigned for our map compilation (lithologic IDs).
6

1:500,000 Salta map
7

1:500,000 Catamarca map
8

1:250,000 Antofalla map
9

1:250,000 Paso San Francisco map
10

11

1:250,000 San Antonio de los Cobres map
12

1:250,000 Cachi map
13

Problems and Remarks In our new digital map compilation, as in its predecessor Antofalla GIS map, it was decided to distinguish volcanic units according to their composition. This causes a problem because the source geological maps maps of Argentina distinguish the volcanic units in a stratigraphic sense by age, and there are some cases where no compositional data were specified. In these cases we assigned the units to the most abundant compositional class in this region, namely Andesite/Dacite (AD, ID: 42).
There is considerable uncertainty in the new geological map for the region covered by the topographic sheet Santa María (2766-I). For this region, there is no 1:250,000 geological map yet available, and our only information is from the Catamarca (1:500,000) map, which is rather indiscriminate and not in all cases conformable with what can be seen from satellite images.
The tectonic features distinguished in the new digital map were taken from the Antofalla GIS map, and supplemented where possible from the national Argentina geological maps. However, to reach a consistent set of attributes, some tectonic details from the source maps were not included (for example, overturned anticlines or synclines were classed as anticlines and synclines).
Finally, there is some disagreement in the Sierra de Calalaste region between the new GIS map and the Argentina SEGEMAR maps Cachi and Antofalla. The main point of disagreement is in the interpretation of faults as normal or reverse. Our interpretation is based on field observations and satellite image interpretations from the SFB-267 programme (see reports and theses sources above), and we suggest it would be useful to check and possibly revise the tectonic interpretations in future editions of SEGEMAR maps.
14

List of Data Files: RasterDataset1: NAME TYPE rectifyhoja antofalla Raster Dataset rectifyhoja_sanantoniocobres Raster Dataset rectify_hoja_sanfrancisco_auschnitt Raster Dataset rectifyhojageologica_cachi Raster Dataset rectifyhojygeologica_pasosanfrancisco Raster Dataset rectifymapgeol_salta_2v2x Raster Dataset RasterDataset2: NAME TYPE rectifymapageol_catamarca Raster Dataset s-19-20_loc Raster Dataset s-19-25_loc Raster Dataset
Symbols: NAME TYPE faults_puna_GFZ Layer faults_puna_GFZ_Black Layer geology_puna_GFZ_noFills Layer GFZ_Puna_SpatRef Coordinate System towns_puna_GFZ Layer Volcanoes_puna_GFZ Layer
VectorDataset: NAME TYPE faults_puna_GFZ Shapefile geology_puna_GFZ Shapefile lineaments_puna Shapefile towns_puna_GFZ Shapefile volcanoes_puna_GFZ Shapefile
15