Embed Size (px)
Citation preview
Digital in-line holographic microscopy
Jorge Garcia-Sucerquia, Wenbo Xu, Stephan K. Jericho, Peter Klages,Manfred H. Jericho, and H. Jürgen Kreuzer
We first briefly review the state of the art of digital in-line holographic microscopy (DIHM) with numericalreconstruction and then discuss some technical issues, such as lateral and depth resolution, depth of field,twin image, four-dimensional tracking, and reconstruction algorithm. We then present a host of examplesfrom microfluidics and biology of tracking the motion of spheres, algae, and bacteria. Finally, we intro-duce an underwater version of DIHM that is suitable for in situ studies in an ocean environment thatshow the motion of various plankton species. © 2006 Optical Society of America
OCIS codes: 090.0090, 090.1760, 180.6900, 110.0180, 100.2000, 100.6640.
1. Introduction
Over 50 years ago, Gabor1 proposed a new principle ofmicroscopy to overcome the limitations of lenses, par-ticularly those of electric and magnetic lenses in elec-tron microscopy. In-line holography with sphericalwaves, as originally proposed by Gabor, is the simplestrealization of the holographic method, workingwithout lenses. Its applications have been limited,however, until recently owing to the fact that recon-struction of the object image with another wave (lightor electron) is not practical. To avoid this problem,researchers have developed various schemes of off-lineholography.2–6 Another option, which was already con-templated by Gabor, is numerical reconstruction.7–12
In-line holography with electrons was revived in thelate 1980s by Fink,13,14 Stocker et al.,15 and Fink etal.16,17 when they managed to make stable field-emission tips that ended in a single atom, thus creat-ing an intense point source for coherent electrons inthe energy range from roughly 10 to 300 eV, i.e., forwavelengths from 2 to 0.5 Å. High-resolution holo-grams were recorded digitally by using a CCD camera,and a theory was developed for the numerical recon-struction of these holograms.18,19 These must be con-
sidered the first successes of digital in-line holographywith electrons.20–23 Although the reconstructionalgorithm was originally designed for electron holog-raphy, its transfer to optical holography is straight-forward.24–27
The feasibility and advantages of numerical recon-struction of digitally recorded holograms gave rise toseveral new holographic techniques to study micro-meter-sized three-dimensional (3-D) phenomena. Bytaking advantage of the phase information, one candetermine the contour of the nanometric structures.28
Using a combination of different wavelengths allowsone to enlarge the range of application of the phase-based methods.29 Applying phase-shifting techniquesmakes it possible to get rid of the twin-image noisepresent in many holographic reconstructions of mac-rosized and microsized objects.30–32 Another powerfultechnique to enhance 3-D resolution is optical scan-ning holography, a method that can also be adapted tocryptography.33–37 All these techniques require sophis-ticated optical setups far beyond the simplicity of thein-line geometry.
Digital in-line holographic microscopy (DIHM) wasrecently developed as a new tool that yields 3-D imagesof objects with micrometer resolution, such as micro-spheres,27,38 cells, plankton, and other biological spec-imens.39 In addition, a technique was designed thatallows the study of moving objects, giving images oftheir 3-D trajectories that represent the flow in mi-crofluidics, the motion of plankton in water, the motionof bacteria in cells, and much more.40–45 Because thein-line holographic microscope is so simple and sosturdy, an underwater version has been developedthat has produced images of swimming plankton in theocean environment.
This paper is organized as follows. In Section 2 we
J. Garcia-Sucerquia ([email protected]), W. Xu, S. K.Jericho, P. Klages, M. H. Jericho, and H. J. Kreuzer are with theDepartment of Physics and Atmospheric Science, Dalhousie Uni-versity, Halifax, Nova Scotia B3H 3J5, Canada. J. Garcia-Sucerquia is also with the Physics School, Universidad Nacional deColombia Sede Medellin, Apartado Aéreo 3840. Medellin, Colom-bia.
Received 16 May 2005; revised 16 August 2005; accepted 16August 2005.
0003-6935/06/050836-15$15.00/0© 2006 Optical Society of America
836 APPLIED OPTICS � Vol. 45, No. 5 � 10 February 2006
begin with some technical details about DIHM, partic-ularly about the reconstruction algorithm, four-dimensional �4-D� tracking, resolution, and depth offield. We derive criteria for the lateral and depth res-olution limits in DIHM, which we validate with nu-merical modeling and experimental results. Thoseresults show without ambiguity that a resolution of theorder of a wavelength can be easily reached withDIHM. We also provide experimental evidence thatthe twin image is not a problem in DIHM. In Section 3we present a host of applications of DIHM in microflu-idics, cell biology, and marine biology, with the latterobtained with an underwater version of DIHM. Thepaper concludes with a summary and a look to thefuture.
2. Digital In-Line Holographic Microscopy:Technical Details
A. Contrast Image and Reconstruction
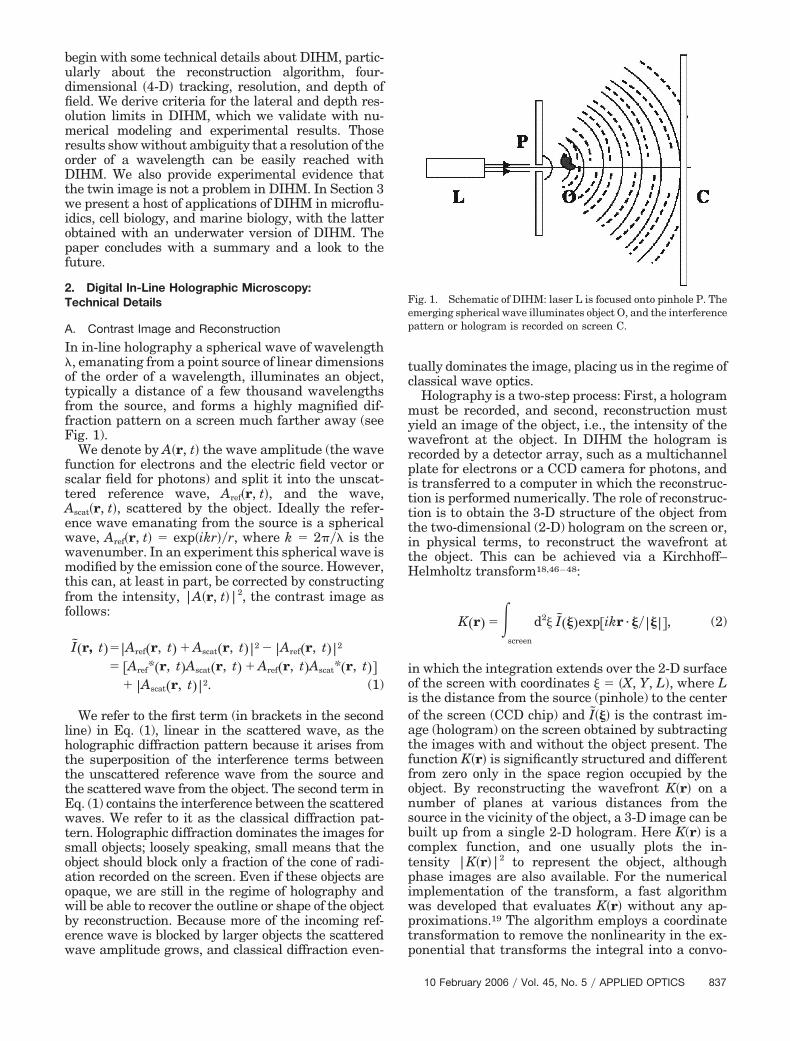
In in-line holography a spherical wave of wavelength�, emanating from a point source of linear dimensionsof the order of a wavelength, illuminates an object,typically a distance of a few thousand wavelengthsfrom the source, and forms a highly magnified dif-fraction pattern on a screen much farther away (seeFig. 1).
We denote by A�r, t� the wave amplitude (the wavefunction for electrons and the electric field vector orscalar field for photons) and split it into the unscat-tered reference wave, Aref�r, t�, and the wave,Ascat�r, t�, scattered by the object. Ideally the refer-ence wave emanating from the source is a sphericalwave, Aref�r, t� � exp�ikr��r, where k � 2��� is thewavenumber. In an experiment this spherical wave ismodified by the emission cone of the source. However,this can, at least in part, be corrected by constructingfrom the intensity, |A�r, t�|2, the contrast image asfollows:
I�r, t���Aref�r, t� � Ascat�r, t��2 � �Aref�r, t��2
� �Aref*�r, t�Ascat�r, t� � Aref�r, t�Ascat*�r, t��� �Ascat�r, t��2. (1)
We refer to the first term (in brackets in the secondline) in Eq. (1), linear in the scattered wave, as theholographic diffraction pattern because it arises fromthe superposition of the interference terms betweenthe unscattered reference wave from the source andthe scattered wave from the object. The second term inEq. (1) contains the interference between the scatteredwaves. We refer to it as the classical diffraction pat-tern. Holographic diffraction dominates the images forsmall objects; loosely speaking, small means that theobject should block only a fraction of the cone of radi-ation recorded on the screen. Even if these objects areopaque, we are still in the regime of holography andwill be able to recover the outline or shape of the objectby reconstruction. Because more of the incoming ref-erence wave is blocked by larger objects the scatteredwave amplitude grows, and classical diffraction even-
tually dominates the image, placing us in the regime ofclassical wave optics.
Holography is a two-step process: First, a hologrammust be recorded, and second, reconstruction mustyield an image of the object, i.e., the intensity of thewavefront at the object. In DIHM the hologram isrecorded by a detector array, such as a multichannelplate for electrons or a CCD camera for photons, andis transferred to a computer in which the reconstruc-tion is performed numerically. The role of reconstruc-tion is to obtain the 3-D structure of the object fromthe two-dimensional (2-D) hologram on the screen or,in physical terms, to reconstruct the wavefront atthe object. This can be achieved via a Kirchhoff–Helmholtz transform18,46–48:
K�r� ��screen
d2� I���exp�ikr · ������, (2)
in which the integration extends over the 2-D surfaceof the screen with coordinates � � �X, Y, L�, where Lis the distance from the source (pinhole) to the centerof the screen (CCD chip) and I��� is the contrast im-age (hologram) on the screen obtained by subtractingthe images with and without the object present. Thefunction K�r� is significantly structured and differentfrom zero only in the space region occupied by theobject. By reconstructing the wavefront K�r� on anumber of planes at various distances from thesource in the vicinity of the object, a 3-D image can bebuilt up from a single 2-D hologram. Here K(r) is acomplex function, and one usually plots the in-tensity |K�r�|2 to represent the object, althoughphase images are also available. For the numericalimplementation of the transform, a fast algorithmwas developed that evaluates K�r� without any ap-proximations.19 The algorithm employs a coordinatetransformation to remove the nonlinearity in the ex-ponential that transforms the integral into a convo-
Fig. 1. Schematic of DIHM: laser L is focused onto pinhole P. Theemerging spherical wave illuminates object O, and the interferencepattern or hologram is recorded on screen C.
10 February 2006 � Vol. 45, No. 5 � APPLIED OPTICS 837
lution, which is solved by three consecutive 2-D fastFourier transforms (FFT), providing a choice of thesize of the reconstructed image so that one can mag-nify different parts of the object at will. We shouldstress that simplifying the Helmholtz–Kirchhofftransform by an on-axis approximation, � � �X2
� Y2 � L2�1�2 � L, and solving it by a single 2-D FFTeliminates this choice because it automatically fixesthe linear size of the pixel in the reconstructed imageto be � � �L��N� in terms of the wavelength �,distance L from the point source to the screen, andthe dimension of the recording screen (CCD chip),N N. Although it is widely used,49–51 the on-axisapproximation is valid only for small numerical ap-ertures, which in itself of course limits the resolutionof the microscope. Moreover, compared with the on-axis approximation, our fast algorithm is numericallyas expedient and yields much superior images, as wedemonstrate below.
In holography the term reconstruction is used toobtain the function K�r� from the hologram. The plotof |K�r�|2 on a 2-D plane, which we call a 2-D holo-graphic reconstruction, is equivalent to one in-focusimage taken in a conventional compound microscope.In DIHM one can generate a stack of 2-D holographicreconstructions from a single hologram. Combiningsuch a stack will result in a 3-D image of the object;this latter step is usually referred to as 3-D recon-struction or 3-D rendering.
As an aside, we should briefly comment on theintensities in DIHM reconstructions. In a bright fieldimage of a compound microscope, in which the back-ground is light, transparent objects are bright andopaque objects are dark. In contrast, the backgroundin the holographic reconstruction is dark because weused a contrast hologram from which the bright back-ground is subtracted. Any objects, transparent oropaque, are lighter than the background becauseboth are the origin of scattered waves that we havetraced back from the hologram in the reconstruction.After all, the contrast image from which the recon-struction is obtained is identically zero in the absenceof an object leading to a uniformly black recon-structed image. Because an opaque sphere absorbsmore of the incoming light, it is less bright than atransparent sphere.
The experimental setup for DIHM, following theschematic of Fig. 1, is simple: A laser is directed ontoa pinhole of a diameter of the order of a wavelength,which acts as the point source from which a sphericalwave of wavelength � emanates. The wave illumi-nates an object (in our setup located a few millimetresfrom the pinhole) and forms a geometrically magni-fied diffraction pattern on a screen, in our case a CCDchip, about a centimeter away. The hologram isstored as a digital image in a computer for reconstruc-tion.
B. Four-Dimensional Imaging
The efficient recording of the trajectories of objectsthat are moving throughout a 3-D space has been a
big problem in several branches of science such ascolloidal suspensions, the motion of algae or larvae inwater, the motion of bacteria around and in cells, andthe characterization of marine particulates. Becauseof its large depth of field, DIHM is ideally suited forcapturing the 3-D motion of many objects (algae,plankton, beads, etc.) with temporal and spatial res-olution at the subsecond and micrometer level.
To obtain high-resolution DIHM reconstruction im-ages of the trajectories of the objects in a tank, weproposed the following procedure42:
(i) A sequence of holograms �hi� is recorded by aCCD camera with a sufficiently high capture rate andis transferred to a computer.
(ii) The undesired background effects are eliminatedby subtracting consecutive hologram pairs, pixel by pixel,to generate new holograms, i.e., �h1 – h2�, �h3 – h4�, etc.
(iii) The resultant difference pictures are summed(a few hundred holograms could be combined) into asingle file, which now contains all holograms (albeitwith alternate sign), yet it has the same size as anysingle original hologram. Subtracting alternate holo-grams ensures that the dynamic range is not ex-ceeded and that only the object-related information(moving algae, for example) is retained.
(iv) The combined file, called the difference holo-gram, is then reconstructed with the Kirchhoff–Helmholtz transform [Eq. (2)] to obtain images atdifferent depth planes in the sample volume. A stackof such images shows the sequential positions at suc-cessive recording times of the objects contained in thesample volume, and the vectors connecting two suc-cessive positions define the velocity field; this is par-ticularly impressive in a 3-D rendering.
We emphasize the efficiency of the data collectionin our procedure. The removal of background effectsand the construction of summed holograms are eas-ily accomplished so that high-resolution 4-D track-ing of many particles from just a single hologramdata set can be performed. Since resolutions of theorder of a wavelength of light were achieved withDIHM, tracking organisms as small as bacteria ispossible, as would be the motion of plankton inwater or, at lower resolution, the aerial trajectoriesof flying insects. Outside biology, applications of4-D DIHM are possible in particle velocimetry, i.e.,tracking the motion of particles in a liquid or in gasflows, visualization of structures in convective or tur-bulent flow and in colloidal suspensions, remote sens-ing and environmental monitoring, and investigationof bacterial attachment to surfaces and biofilm forma-tion to name but a few.
C. Resolution and Depth of Field in Digital In-LineHolographic Microscopy
Resolution in DIHM depends on several controlla-ble factors or parameters: (1) pinhole size, control-ling spatial coherence and illumination cone; (2)numerical aperture, given by the size and position-ing of the recording CCD chip; (3) pixel density and
838 APPLIED OPTICS � Vol. 45, No. 5 � 10 February 2006
dynamic range, controlling fringe resolution andnoise level in the hologram; and (4) wavelength. Wepresent a detailed study of the individual andcombined effects of these factors by conducting ananalytical analysis coupled with numerical simula-tions of holograms and their reconstruction. Theresult of this analysis is a set of criteria that can beused for the optimum design of the DIHM setup. Wealso present a series of experimental results thattest and confirm our theoretical analysis. The ulti-mate resolution to date is the imaging of the motionof spheres, bubbles, and bacteria that are �1 �m insize, a few micrometers apart, and moving at speedsof �100 �m�s.
1. Model CalculationsTo study the problem of resolution in DIHM, we usea model that is tailored to suit the Rayleigh andSparrow criteria52–54 for resolution, which state(Rayleigh) that two point sources are just resolvedwhen the principal intensity maximum of one coin-cides with the first intensity minimum of the otheror (Sparrow) for unequal source intensities whenthe first and second derivatives of the intensity withrespect to the line connecting the two points vanish.In the case of DIHM, these criteria are applicable tothe reconstructed images, and the question remainsof what kind of conditions they impose on the un-derlying holograms from which the reconstructionswere performed. Simply put, we need to know howmany interference fringes must be captured and inwhat detail to ensure that the Rayleigh and Spar-row criteria are met in reconstruction.
The model for DIHM consists of an ideal point sourcethat emits a spherical wave Aref�r� � A0r
�1 exp�ikr�with wavenumber k � 2���. In addition, we have twoobjects, also modeled as point sources, at positions r1and r2, from which scattered spherical waves emerge.The total wave field is thus
A�r� � A0
exp�ikr�r � A1
exp�ik�r � r1���r � r1�
� A2
exp�ik�r � r2���r � r2�
. (3)
The intensity of the contrast image then becomes
I�r� � I�r� �A0
2
r2
�A1
2
�r � r1�2 �A2
2
�r � r2�2
� 2A1A2
�r1 � r2�2 cos�k��r � r1� � �r � r2���
� �2A0A1
r�r � r1�cos�k�r � �r � r1���
� 2A0A2
r�r � r2�cos�k�r � �r � r2���. (4)
The first two terms account for scattering fromisolated objects and are smoothly varying back-grounds. The third term represents classical interfer-ence from the two objects, whereas the terms in curlybrackets are due to interference between the sourceand each object and represent holographic interfer-ence. Note that for holography to work, amplitudes A1and A2 of the scattered waves must be much smallerthan that of the reference wave, makingthe classical interference term, quadratic in the scat-tered waves, negligible. Because the vectors |r� r1| and |r � r2| are of comparable length in atypical DIHM setup, the spatial frequency of the clas-sical interference pattern will be much smaller thanthat of the contribution from the holographic terms.Thus recording the fine spatial details of a hologramis a prerequisite to high-resolution reconstruction.Obtaining optimal sampling in the hologram thusdemands proper positioning of the recording screenfrom the source for a given pixel size. Also note thatfor small objects their scattering amplitude is smallcompared with the amplitude of the reference wave,A1, A2 �� A0, ensuring that the holographic termswill be more prominent in the hologram by amplitudeas well. Finally, a trivial point: The wavelength itselfof course controls the spatial frequencies of our inter-ferogram, so that it will be an important factor inestablishing the maximal resolution obtainable inDIHM or in any other type of microscopy.
2. Lateral ResolutionIn this section we first derive a criterion for lateralresolution in terms of the geometric parameters ofDIHM; this criterion is then demonstrated with nu-merical simulations. For simplicity, we assume thatthe experimental setup has the recording screen per-pendicular to the optical axis that connects the sourcewith the center of the screen. The object consists oftwo point sources positioned symmetrically from theoptical axis and on a line parallel to the screen sothat|r1| � |r2|. Then the holographic term in Eq. (4)can be rewritten as
I�r� � 4A0A1
r�r � r1�cos�k�2r � �r � r1� � �r � r2���2�
cos�k��r � r1� � �r � r2���2�. (5)
The second cosine term produces the modulation ofthe holographic interference pattern and has maximawhen its argument is 2�n. To recover the necessaryinformation from this term, we must ensure that atleast the zero-order and first-order maxima are re-corded on the screen. Hence it follows that two pointscan be resolved laterally if their lateral separationsatisfies
�r2 � r1� ��
2NA, (6)
where the numerical aperture of the microscope is
10 February 2006 � Vol. 45, No. 5 � APPLIED OPTICS 839
given by NA � sin m � �W�2���W�2�2 � D2�1�2 with Wbeing the screen width and D the distance form thepoint source to the screen. Not surprisingly, this isthe same criterion as that of classical optics, althoughits origin is quite different. To be more specific toholography, we recall from early research on electronholography26 that the Kirchhoff–Helmholtz trans-form, yielding the reconstructed amplitude, can beobtained analytically and reads, when restricted tos-wave scattering as appropriate for electromagneticradiation, as follows:
K�r� � Ai
n�0
�
��1�n�2anPn� z � zi
�r � ri�� jn�k�r � ri��.
(7)
The point objects (atoms in the case of electronholography) are located at positions ri; Pn and jn areLegendre polynomials and spherical Bessel func-tions, respectively. The coefficient A is proportional tothe scattering probability, and
an � �n � 1�2��cos m
1
Pn�t�dt (8)
accounts for the numerical aperture, cos2 m � 1 ��NA�2. Recall that only the spherical Bessel functionof the zero order has a maximum at the zero argu-ment so that only the n � 0 term peaks at the originalpositions of the objects. With the intensity of the re-constructed image given by I � |K�r�|2, we set itsfirst and second derivatives with respect to the lineconnecting two point objects (this is easy in the abovegeometry) equal to zero to establish the modifiedSparrow criterion for resolution.
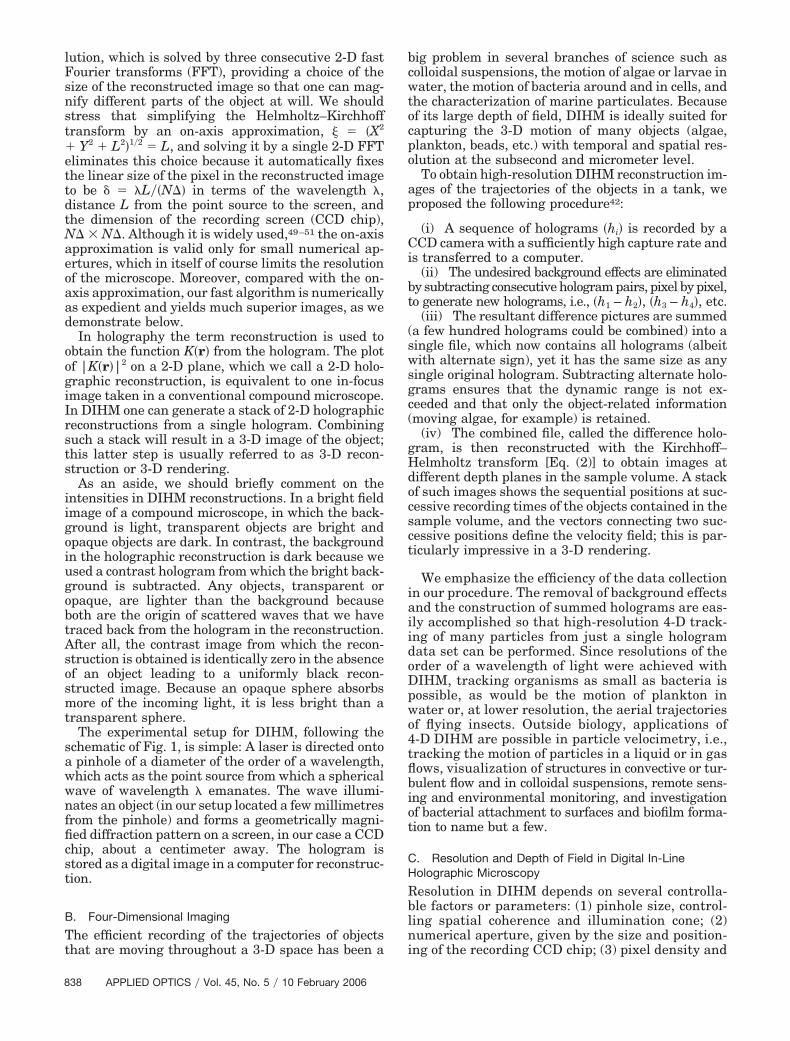
As an example, we show in Fig. 2A a simulatedhologram of two points separated by 0.8 �m takenwith blue light and a numerical aperture of 0.5. Thisshould, in reconstruction, yield a clear separation ofthe two objects, as is indeed seen in Fig. 2B. Note thatthe points themselves are smeared out and that theirshape is controlled by the square of a spherical Bessel
function of zero order, i.e., �sin�k�����2, where � is theradial distance from the center of a point. If we reducethe numerical aperture by taking only the innersquare of Fig. 2A with half the length of its sides, thenumerical aperture is reduced to 0.28, and microme-ter resolution is no longer achievable, as confirmed inFig. 2C.
3. Depth ResolutionWe next address the issue of depth resolution. Simi-lar to the discussion of lateral resolution, here we findthat two points can be resolved in depth if
�r2 � r1� ��
2�NA�2. (9)
Clearly, depth resolution in holographic recon-struction is harder to achieve, and only when thehologram is recorded on a large screen can optimalresolution be achieved both laterally and in depth. Weillustrate this point in Fig. 3. The problem of poordepth resolution was also encountered in photo-electron and low-energy electron diffraction (LEED)holography, and a remedy was suggested and success-fully implemented by using the superposition of recon-structed images for several wavelengths.48,55
4. Pinhole SizeFor the pinhole to act as a point source for a coherentspherical wave, its size must be of the order of awavelength. A larger pinhole has two effects: (1) Itleads to a reduction of the spatial coherence, and (2)it narrows the zero-order emission cone used to formthe holographic interference pattern of emitted light.When the pinhole is illuminated with a laser, it isactually the second effect that affects the quality ofholograms more. We can obtain the numerical aper-ture of the emission cone of a pinhole by numericallyevaluating the Fresnel integral for a circular pinholeof diameter dp. Here 84% of the diffracted light iscontained within the zero-order diffraction maxi-mum, i.e., within a half-angle p to the first zero.
For dp � � and 4� the numerical aperture of theemission cone is 0.77 and 0.29, respectively. Ideally
Fig. 2. Test of lateral resolution. A, Simulated hologram of two points close to the optical axis and 0.8 �m apart, taken with a blue laserwith � � 4730 Å and a numerical aperture of 0.5 (0.28 for the inner square). B, Reconstruction from the full hologram, with the intensityprofile showing submicrometer resolution. C, Same as B but for the smaller hologram, showing a loss of resolution.
840 APPLIED OPTICS � Vol. 45, No. 5 � 10 February 2006

one would like to have this angle be larger than thatformed by the recording screen; i.e., for the numericalaperture, one should minimize the decline ofthe intensity of the reference wave over the samplevolume.
To demonstrate the effect of the pinhole size onreconstruction, we show reconstructed images of apositive USAF 1951 test target for pinholes with di-ameters of 2 and 0.5 �m. With the smaller pinhole,about twice the area of the test target is illuminated(compare panels A and B with D and E in Fig. 4).Whereas, not surprisingly, with the smaller pinhole,the smallest structures �228 lp�mm� are clearly re-solved (see Fig. 4C); this is not the case with thelarger pinhole (Fig. 4F).
5. Depth of FieldOne of the most amazing advantages of holographicmicroscopy, and in particular of DIHM, is the factthat a single 2-D hologram produces in reconstruc-tion a 3-D image of the object without loss of re-solution. This is in sharp contrast to compoundmicroscopy in which the depth of field reducessharply with improved resolution, necessitating refo-cusing to map out a larger volume. To show thisadvantage, we embedded 1 �m latex beads in gela-tine on a cover slide (to immobilize them), took onehologram, and made five reconstructions at differentdepths ranging from 300 �m to 3 mm from the coverslide (see Fig. 5). Panel A shows the hologram, andpanels B and C the reconstructions at 3 and 2 mm,
Fig. 3. Depth resolution: two point particles placed along the optical axis, 380 �m from the point source. Numerical aperture of the screenis 0.5 (512 � 512 pixels). Cuts along the optical axis for a particle separation of A, 4 �m; B, 3.5 �m; and C, 3 �m.
Fig. 4. Pinhole size effect: A, Hologram of a positive USAF 1951 test target taken with a 0.5 �m pinhole; B, reconstruction (afterbackground subtraction); C, central section (groups 6 and 7) only; D–F, same but for a 2 �m pinhole. Laser wavelength of 408 nm andnumerical aperture of NA � 0.208.
10 February 2006 � Vol. 45, No. 5 � APPLIED OPTICS 841
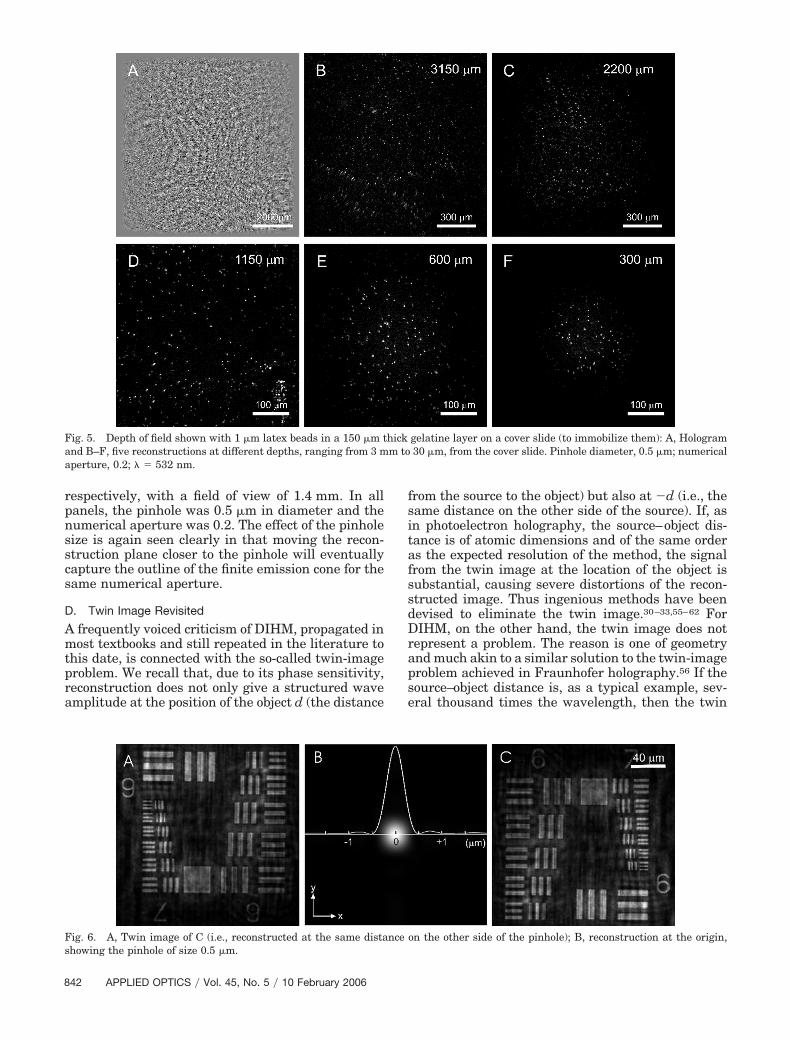
respectively, with a field of view of 1.4 mm. In allpanels, the pinhole was 0.5 �m in diameter and thenumerical aperture was 0.2. The effect of the pinholesize is again seen clearly in that moving the recon-struction plane closer to the pinhole will eventuallycapture the outline of the finite emission cone for thesame numerical aperture.
D. Twin Image Revisited
A frequently voiced criticism of DIHM, propagated inmost textbooks and still repeated in the literature tothis date, is connected with the so-called twin-imageproblem. We recall that, due to its phase sensitivity,reconstruction does not only give a structured waveamplitude at the position of the object d (the distance
from the source to the object) but also at �d (i.e., thesame distance on the other side of the source). If, asin photoelectron holography, the source–object dis-tance is of atomic dimensions and of the same orderas the expected resolution of the method, the signalfrom the twin image at the location of the object issubstantial, causing severe distortions of the recon-structed image. Thus ingenious methods have beendevised to eliminate the twin image.30–33,55–62 ForDIHM, on the other hand, the twin image does notrepresent a problem. The reason is one of geometryand much akin to a similar solution to the twin-imageproblem achieved in Fraunhofer holography.56 If thesource–object distance is, as a typical example, sev-eral thousand times the wavelength, then the twin
Fig. 5. Depth of field shown with 1 �m latex beads in a 150 �m thick gelatine layer on a cover slide (to immobilize them): A, Hologramand B–F, five reconstructions at different depths, ranging from 3 mm to 30 �m, from the cover slide. Pinhole diameter, 0.5 �m; numericalaperture, 0.2; � � 532 nm.
Fig. 6. A, Twin image of C (i.e., reconstructed at the same distance on the other side of the pinhole); B, reconstruction at the origin,showing the pinhole of size 0.5 �m.
842 APPLIED OPTICS � Vol. 45, No. 5 � 10 February 2006
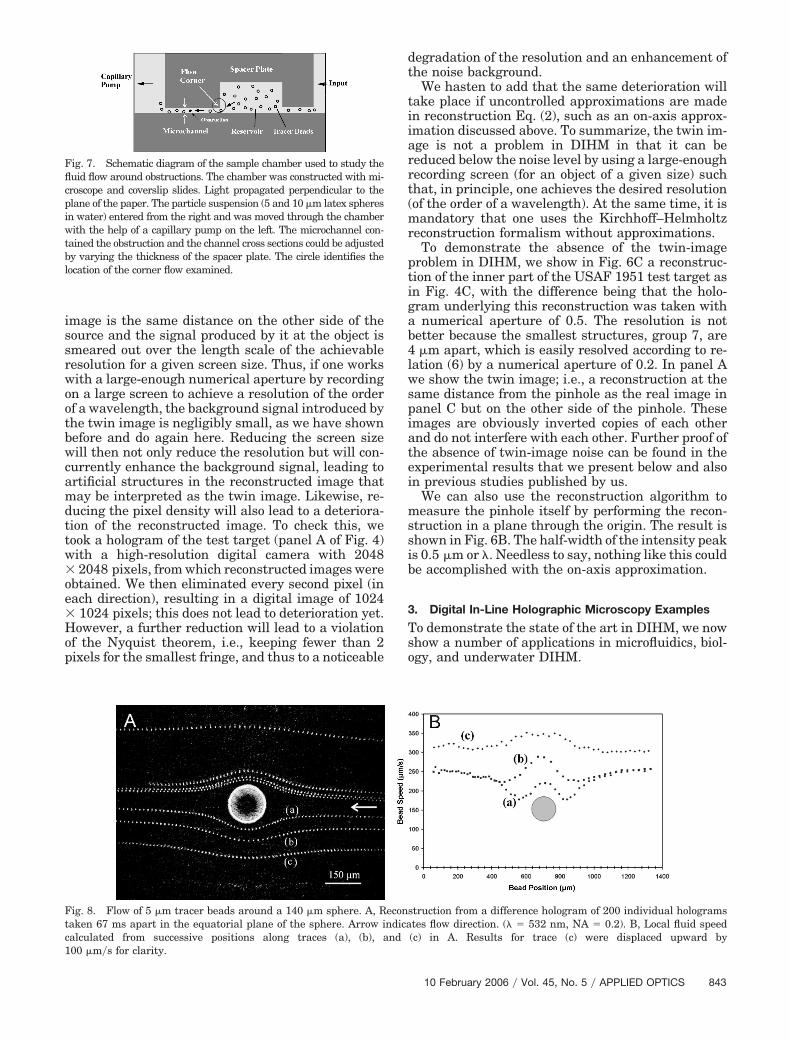
image is the same distance on the other side of thesource and the signal produced by it at the object issmeared out over the length scale of the achievableresolution for a given screen size. Thus, if one workswith a large-enough numerical aperture by recordingon a large screen to achieve a resolution of the orderof a wavelength, the background signal introduced bythe twin image is negligibly small, as we have shownbefore and do again here. Reducing the screen sizewill then not only reduce the resolution but will con-currently enhance the background signal, leading toartificial structures in the reconstructed image thatmay be interpreted as the twin image. Likewise, re-ducing the pixel density will also lead to a deteriora-tion of the reconstructed image. To check this, wetook a hologram of the test target (panel A of Fig. 4)with a high-resolution digital camera with 2048 2048 pixels, from which reconstructed images wereobtained. We then eliminated every second pixel (ineach direction), resulting in a digital image of 1024 1024 pixels; this does not lead to deterioration yet.However, a further reduction will lead to a violationof the Nyquist theorem, i.e., keeping fewer than 2pixels for the smallest fringe, and thus to a noticeable
degradation of the resolution and an enhancement ofthe noise background.
We hasten to add that the same deterioration willtake place if uncontrolled approximations are madein reconstruction Eq. (2), such as an on-axis approx-imation discussed above. To summarize, the twin im-age is not a problem in DIHM in that it can bereduced below the noise level by using a large-enoughrecording screen (for an object of a given size) suchthat, in principle, one achieves the desired resolution(of the order of a wavelength). At the same time, it ismandatory that one uses the Kirchhoff–Helmholtzreconstruction formalism without approximations.
To demonstrate the absence of the twin-imageproblem in DIHM, we show in Fig. 6C a reconstruc-tion of the inner part of the USAF 1951 test target asin Fig. 4C, with the difference being that the holo-gram underlying this reconstruction was taken witha numerical aperture of 0.5. The resolution is notbetter because the smallest structures, group 7, are4 �m apart, which is easily resolved according to re-lation (6) by a numerical aperture of 0.2. In panel Awe show the twin image; i.e., a reconstruction at thesame distance from the pinhole as the real image inpanel C but on the other side of the pinhole. Theseimages are obviously inverted copies of each otherand do not interfere with each other. Further proof ofthe absence of twin-image noise can be found in theexperimental results that we present below and alsoin previous studies published by us.
We can also use the reconstruction algorithm tomeasure the pinhole itself by performing the recon-struction in a plane through the origin. The result isshown in Fig. 6B. The half-width of the intensity peakis 0.5 �m or �. Needless to say, nothing like this couldbe accomplished with the on-axis approximation.
3. Digital In-Line Holographic Microscopy Examples
To demonstrate the state of the art in DIHM, we nowshow a number of applications in microfluidics, biol-ogy, and underwater DIHM.
Fig. 7. Schematic diagram of the sample chamber used to study thefluid flow around obstructions. The chamber was constructed with mi-croscope and coverslip slides. Light propagated perpendicular to theplane of the paper. The particle suspension (5 and 10 �m latex spheresin water) entered from the right and was moved through the chamberwith the help of a capillary pump on the left. The microchannel con-tained the obstruction and the channel cross sections could be adjustedby varying the thickness of the spacer plate. The circle identifies thelocation of the corner flow examined.
Fig. 8. Flow of 5 �m tracer beads around a 140 �m sphere. A, Reconstruction from a difference hologram of 200 individual hologramstaken 67 ms apart in the equatorial plane of the sphere. Arrow indicates flow direction. (� � 532 nm, NA � 0.2). B, Local fluid speedcalculated from successive positions along traces (a), (b), and (c) in A. Results for trace (c) were displaced upward by100 �m�s for clarity.
10 February 2006 � Vol. 45, No. 5 � APPLIED OPTICS 843
A. Microfluidics
Understanding the flow of fluids through micrometer-sized channels is of great importance in many areas ofscience and engineering. The flow may be influencedby complex boundary effects, it may not follow simpleNewtonian rules, or it may be influenced by suspendedparticles such that numerical modeling of the flow be-comes difficult or impossible.
Modern micromachining methods have allowedthe construction of microfluidic devices that havehad a particularly significant effect on the develop-ment of novel biomedical instrumentation. Some ofthese involve the motion of macromolecules, vesi-cles, or even whole cells through narrow channels,and the flow can also be accompanied by biochem-ical processes between suspended components orwith the channel walls. Other device applicationsinvolve the separation of cells in fluid channels withthe help of electrophoretic or dielectrophoreticforces.63–65 Other microelectromechanical systems(MEMS) devices have been developed to facilitatethe mixing of two fluids on a microfluid scale. Sincemicrofluid flow is generally a low-Reynolds-numberflow, vortex mixing in microchannels does not occurand it is important to capture experimentally theeffectiveness of methods that may be devised toproduce mixing. Another important microfluidicsarea is the study of fluid flow induced by the loco-motion of micro-organisms such as algae andvarious plankton species. This is a particularlychallenging field since it is difficult with standardmicroscopic methods to simultaneously follow themotion of the organism as well as that of tracerparticles that may be in its vicinity but are suffi-ciently removed to be out of focus. We describe herean application of DIHM that can capture fluid flowwith a depth of field not achievable with conven-tional optical microscopy.
To record the stream lines for fluid moving aroundobstructions, the fluid was seeded with 5 or 10 �mdiameter latex beads, and several hundred holo-grams of the fluid motion were recorded over a periodof several minutes. Difference holograms were thenconstructed, and these were summed to give the finalhologram data set. If holograms are collected over anextended time period, then hologram summation im-plies that mapping of the flow field can be performedwith a low concentration of tracer beads.
For the observation of flow around obstructions, weused flow chambers constructed with microscope
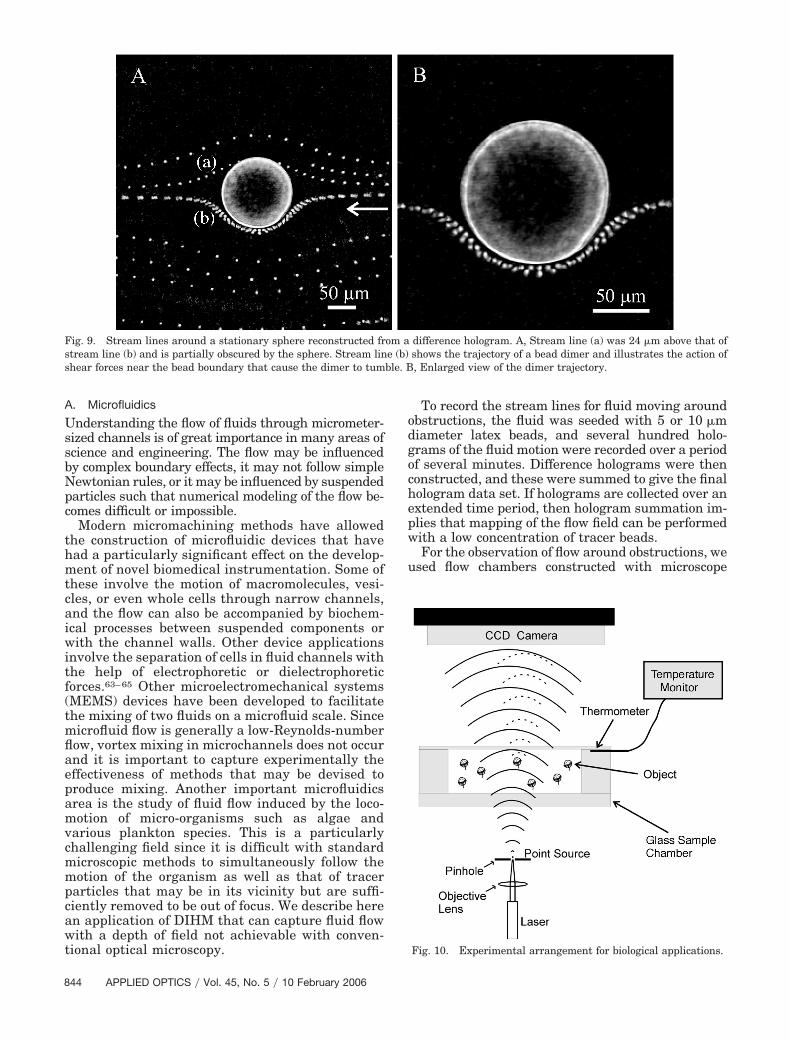
Fig. 9. Stream lines around a stationary sphere reconstructed from a difference hologram. A, Stream line (a) was 24 �m above that ofstream line (b) and is partially obscured by the sphere. Stream line (b) shows the trajectory of a bead dimer and illustrates the action ofshear forces near the bead boundary that cause the dimer to tumble. B, Enlarged view of the dimer trajectory.
Fig. 10. Experimental arrangement for biological applications.
844 APPLIED OPTICS � Vol. 45, No. 5 � 10 February 2006
slides and coverslips as shown in Fig. 7. The particlesuspension was added on the right and was movedthrough the channel through a capillary pump on theleft. For the observation of flow past a sphericallyshaped obstruction, single metal spheres were at-tached to the bottom center of the flow channel. Thespheres ranged in diameter from 80 to 150 �m. Thechannel size for these experiments was 2 mm inwidth and 0.3 mm in depth. Observations of fluidmotion induced by a moving sphere were performedin a drop chamber with a cross section of 15 mm 1 mm and a height of 20 mm. Spheres were placednear the center of the chamber opening before re-lease.
The experiments were performed with either green�� � 532 nm� or blue �� � 473 nm� laser light, andthe holograms were recorded with a CCD camera(Megaplus Es 1.0�MV; 1008 � 1018 pixels; pixelsize of 9 �m 9 �m). The camera could record im-ages at 15 frames�s with a minimum shutter speed of
0.8 ms. All experiments were performed with a 1 �mdiameter pinhole. The position resolution in DIHM oflatex particles was investigated in detail previouslyby Xu et al.38 Under favourable conditions, the coor-dinates of beads could be determined to �50 nm. Inmost of our studies the data-acquisition time was ofthe order of a few seconds and diffusion distances ofthe tracer beads were much less than the bead diam-eters and could be neglected. All hologram recon-structions were performed in planes that wereperpendicular to the line joining the pinhole with thecenter of the CCD chip.
Consider an example of a difference hologram(from 200 individual holograms) for fluid flowingaround a 140 �m diameter metal sphere attached tothe bottom of a 300 �m deep channel. A reconstruc-tion of this hologram in a lateral plane that passesthrough the center of the metal sphere is displayed inFig. 8A. The expected laminar flow around the sphereis clearly visible. The tracer particles in some of the
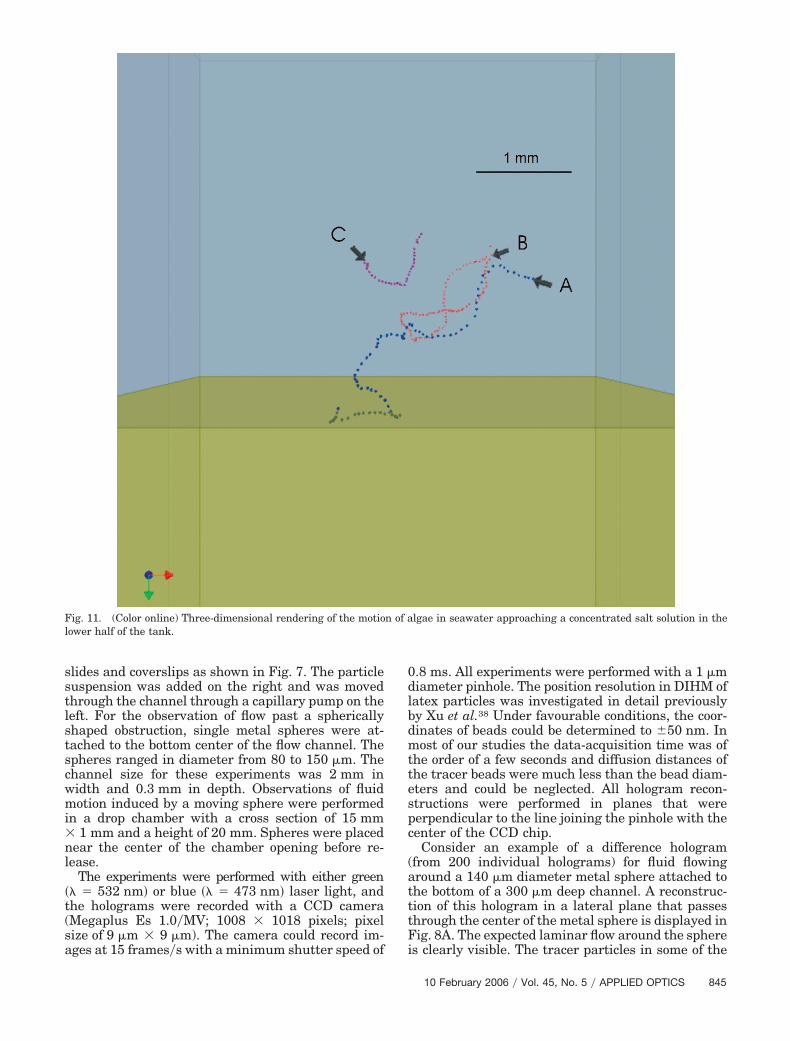
Fig. 11. (Color online) Three-dimensional rendering of the motion of algae in seawater approaching a concentrated salt solution in thelower half of the tank.
10 February 2006 � Vol. 45, No. 5 � APPLIED OPTICS 845
stream lines in Fig. 8A appear somewhat blurredbecause the corresponding stream lines lie outsidethe particular reconstruction plane chosen. By ad-justing the reconstruction depth appropriately, theseout-of-focus particles can be brought into focus, andtheir Z position in the fluid channel can be deter-mined. In this way flow information about the wholefluid volume can be extracted. The vector connectingtwo subsequent positions of a particle along itsstream line gives its local velocity. We can also de-termine the spatial coordinates of the tracer beadalong its stream line and from these calculate thelocal speed of the fluid. The speed variations alongthree stream lines in Fig. 8A are shown in Fig. 8B.
The fact that the fluid velocity has not assumed aconstant value at a distance of 700 �m upstream anddownstream from the sphere is a manifestation of thelong-range effect of the sphere in Stokes flow. Thevelocity gradient near the surface of the metal sphereis particularly well captured by the movement of abead dimer in Fig. 9. Far away from the metal sphere,the dimer axis is parallel to the stream line. As thedimer approaches the sphere, fluid shear causes thedimer to tumble. It aligns itself again with the streamline after leaving the sphere behind.
B. Biology
For applications of DIHM in biology, we used theexperimental arrangement shown in Fig. 10. It hasbeen used to study the swimming behavior of algaeAlexandrium as a function of temperature, demon-strating, for instance, that at elevated temperatures�21 °C� their normal behavior to swim in more or lessstraight lines changes dramatically to exclusively cir-cular motion owing to the loss of posterior flagellae.44
Here we present results regarding the effect of in-creased salinity. To this effect, we used a pipette to
introduce saturated salt water below a layer of sea-water. Figure 11 shows a 3-D rendering of the tra-jectories of algae obtained from a stack of 50reconstructions. Trajectory A was taken immediatelyafter the saltwater was introduced, implying a sharpinterface. The alga does not sense any danger until itcrosses the interface and gets poisoned. Half an hourlater the saltwater has diffused upward and the alga(B) are warned and turn around. Another half-hourlater, warning occurs even farther away from theinterface at trajectory C.
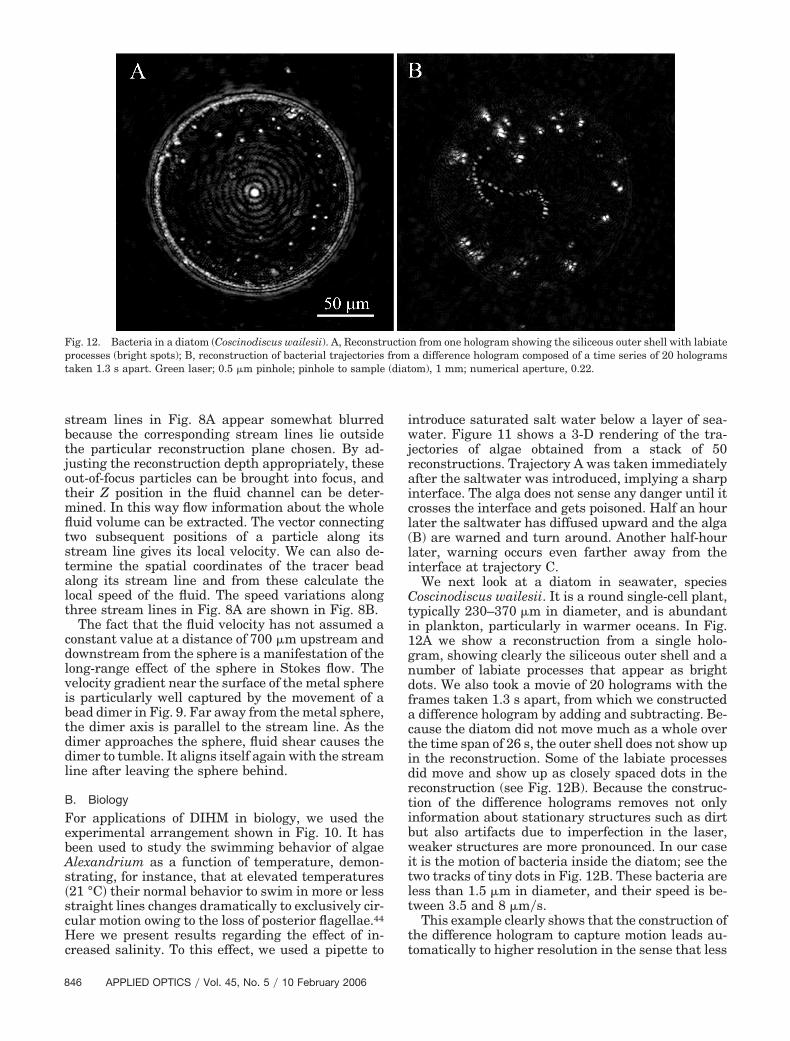
We next look at a diatom in seawater, speciesCoscinodiscus wailesii. It is a round single-cell plant,typically 230–370 �m in diameter, and is abundantin plankton, particularly in warmer oceans. In Fig.12A we show a reconstruction from a single holo-gram, showing clearly the siliceous outer shell and anumber of labiate processes that appear as brightdots. We also took a movie of 20 holograms with theframes taken 1.3 s apart, from which we constructeda difference hologram by adding and subtracting. Be-cause the diatom did not move much as a whole overthe time span of 26 s, the outer shell does not show upin the reconstruction. Some of the labiate processesdid move and show up as closely spaced dots in thereconstruction (see Fig. 12B). Because the construc-tion of the difference holograms removes not onlyinformation about stationary structures such as dirtbut also artifacts due to imperfection in the laser,weaker structures are more pronounced. In our caseit is the motion of bacteria inside the diatom; see thetwo tracks of tiny dots in Fig. 12B. These bacteria areless than 1.5 �m in diameter, and their speed is be-tween 3.5 and 8 �m�s.
This example clearly shows that the construction ofthe difference hologram to capture motion leads au-tomatically to higher resolution in the sense that less
Fig. 12. Bacteria in a diatom (Coscinodiscus wailesii). A, Reconstruction from one hologram showing the siliceous outer shell with labiateprocesses (bright spots); B, reconstruction of bacterial trajectories from a difference hologram composed of a time series of 20 hologramstaken 1.3 s apart. Green laser; 0.5 �m pinhole; pinhole to sample (diatom), 1 mm; numerical aperture, 0.22.
846 APPLIED OPTICS � Vol. 45, No. 5 � 10 February 2006

prominent features, i.e., much smaller and thusweaker scatterers, can be made visible. One can hopethat with this procedure microscopic processes, suchas the attachment of algae to cell walls or nuclei andcell division, can be studied as well. Again, the capa-bility of the scalable convolution algorithm for recon-struction19 is crucial to this procedure’s success.
C. Underwater Digital In-Line Holographic Microscopy
To allow for observations with DIHM in ocean or lakeenvironments, we constructed an underwater micro-scope. Its schematic is shown in Fig. 13. The micro-scope consists of two pressure chambers, one of whichcontains the laser and the other the CCD camera(plus power supply). The two chambers are kept at afixed distance from each other to allow water to freely
circulate between them. In the center of the chamberplates facing each other are small windows, with theone on the laser chamber having the pinhole. Thesignal from the CCD camera is transmitted via anunderwater USB cable to a buoy or a boat above, fromwhere a satellite link can be established for datatransmission to a laboratory. Depending on the de-sign of the pressure chamber, water depths of severalhundred meters should easily be possible; our proto-type has operated at a 15 m depth and has given thesame performance as far as resolution is concerned asthe desktop version of DIHM.
In Fig. 14 we show a few species swimming throughthe observation channel of the underwater DIHM. Inpanel A we show the reconstructed image of Para-mecium (length, 320 �m; width, 46.8 �m). Panels
Fig. 13. Underwater DIHM.
Fig. 14. Images taken with the underwater DIHM. A, Paramecium (length, 320 �m; width, 46.8 �m). B–D, Trajectories of various speciesswimming through the observation window, with a frame rate of 10 frames�s. B, Ciliate (length, 25 �m; width, 13 �m); C, Didinium(length, 133 �m; width, 77 �m); D, Rotifer (length, 200 �m; width, 100 �m).
10 February 2006 � Vol. 45, No. 5 � APPLIED OPTICS 847
B–D show the trajectories of various species, recon-structed from a difference hologram of hologramstaken at a rate of 10 frames�s. In panel B we show thetrajectory of a Ciliate (length, 25 �m; width, 13 �m)swimming at a speed of 450 �m�s. Panel C shows aDidinium (length, 133 �m; width, 77 �m) swimmingat a speed of 2.1 �m�s. Panel D shows a Rotifer(length, 200 �m; width, 100 �m) swimming at aspeed of 2.5 �m�s.
4. Summary and Outlook
We want to conclude by underlining some remarkablecharacteristics of DIHM and the underwater DIHM:
1. Simplicity of the microscope: DIHM, as well asunderwater DIHM, is microscopy without objectivelenses. The hardware required for the desktop ver-sion is a laser, a pinhole, and a CCD camera. For theunderwater DIHM version, we need the same ele-ments contained in a submersible hermetic shell.
2. Maximum information: A single hologram con-tains all the information about the 3-D structure ofthe object. A set of multiple holograms can be prop-erly added to provide information about 4-D trajecto-ries of samples.
3. Maximum resolution: Optimal resolution, ofthe order of a wavelength of the laser, can be obtainedeasily with both versions.
4. Simplicity of sample preparation: This is par-ticularly true for biological samples in which no sec-tioning or staining are required, so that living cellsand specimens can be viewed. Indeed, for the under-water DIHM, there is no sample preparation at all,and real-time information of living organisms can beretrieved.
5. Speed: The kinetics of the sample, such as par-ticle motion or metabolic changes in a biological spec-imen, can ultimately be followed at the capture rateof the image-acquisition system.
6. Four-dimensional tracking: A large number ofparticles can be tracked simultaneously in 3-D as afunction of time.
Regarding 4-D tracking, which is feasible in bothversions of the DIHM, we emphasize the efficiency indata collection in our procedure. Removal ofbackground effects and construction of summed ho-lograms are easily accomplished so that high-resolution tracking of many particles in 4-D can beobtained from just one difference hologram. Sinceresolutions of the order of a wavelength of light havebeen achieved with DIHM, tracking of organisms assmall as bacteria is possible, as would be the motionof plankton in water or, at lower resolution, the aerialtrajectories of flying insects. DIHM can also be usedsuccessfully on macroscopic biological specimens,prepared by standard histological procedures, as for ahistological section of the head of the fruit fly, Dro-sophila melanogaster. Such images reveal the struc-ture of the pigmented compound eye and differentneuropile regions of the brain within the head cuticle,
including the optic neuropiles underlying the com-pound eye.39
Outside biology, applications of 4-D DIHM havebeen demonstrated in microfluidics for particle ve-locimetry, i.e., tracking of the motion of particles in aliquid or gas flows, and gas evolution in electrolysisand in the visualization of structures in convective orturbulent flow. Further applications will deal withcolloidal suspensions, remote sensing, environmentalmonitoring, investigation of bacterial attachment tosurfaces and biofilm formation, and many more.DIHM, with its inherent capability of obtaining mag-nified images of objects (unlike conventional off-axisholography), is therefore a powerful new tool for alarge range of research fields. Films on 4-D trackingand more examples can be viewed at http://www.physics.dal.ca/�kreuzer.
This research was supported through grants from theNatural Sciences and Research Council of Canada andthe Office of Naval Research in Washington, D.C.
References1. D. Gabor, “A new microscopic principle,” Nature 161, 777–778
(1948).2. E. N. Leith and J. Upatnieks, “Reconstructed wavefronts and
communication theory,” J. Opt. Soc. Am. 52, 1123–1130 (1962).3. E. N. Leith and J. Upatnieks, “Wavefront reconstruction with
continuous-tone objects,” J. Opt. Soc. Am. 53, 1377–1381 (1963).4. E. N. Leith and J. Upatnieks, “Wavefront reconstruction with
diffused illumination and three-dimensional objects,” J. Opt.Soc. Am. 54, 1295–1301.
5. P. Hariharan, Optical Holography (Cambridge U. Press, 1996).6. T. Kreis, Holographic Interferometry (Akademie Verlag,
1996).7. Y. Aoki, “Optical and numerical reconstruction of images from
sound-wave holograms,” IEEE Trans. Acoust. Speech AU-18,258–267 (1970).
8. M. A. Kronrod, L. P. Yaroslavski, and N. S. Merzlyakov, “Com-puter synthesis of transparency holograms,” Sov. Phys. Tech.Phys. 17, 329–332 (1972).
9. T. H. Demetrakopoulos and R. Mittra, “Digital and opticalreconstruction of images from suboptical diffraction patterns,”Appl. Opt. 13, 665–670 (1974).
10. L. Onural and P. D. Scott, “Digital decoding of in-line holo-grams,” Opt. Eng. 26, 1124–1132 (1987).
11. G. Liu and P. D. Scott, “Phase retrieval and twin-image elemi-nation for in-line Fresnel holograms,” J. Opt. Soc. Am. A 4,159–165 (1987).
12. L. Onural and M. T. Oezgen, “Extraction of three-dimensionalobject-location information directly from in-line holograms us-ing Wigner analysis,” J. Opt. Soc. Am. A 9, 252–260 (1992).
13. H.-W. Fink, “Point source for electrons and ions,” IBM J. Res.Dev. 30, 460–463 (1986).
14. H.-W. Fink, “Point source for electrons and ions,” Phys. Scr. 38,260–263 (1988).
15. W. Stocker, H.-W. Fink, and R. Morin, “Low-energy electronand ion projection microscopy,” Ultramicroscopy 31, 379–384(1989).
16. H.-W. Fink, W. Stocker, and H. Schmid, “Holography withlow-energy electrons,” Phys. Rev. Lett. 65, 1204–1206 (1990).
17. H.-W. Fink, H. Schmid, H. J. Kreuzer, and A. Wierzbicki,“Atomic resolution in lens-less low-energy electron hologra-phy,” Phys. Rev. Lett. 67, 1543–1546 (1991).
18. H. J. Kreuzer, K. Nakamura, A. Wierzbicki, H.-W. Fink, and
848 APPLIED OPTICS � Vol. 45, No. 5 � 10 February 2006
H. Schmid, “Theory of the point source electron microscope,”Ultramicroscopy 45, 381–403 (1992).
19. H. J. Kreuzer and R. P. Pawlitzek, LEEPS, Version 1.2: asoftware package for the simulation and reconstruction of lowenergy electron point source images and other holograms, (He-lix Science Applications, Halifax, Nova Scotia, Canada, 1993–1998).
20. S. Horch and R. Morin, “Field emission from atomic sizesources,” J. Appl. Phys. 74, 3652–3657 (1993).
21. H.-W. Fink, H. Schmid, and H. J. Kreuzer, “State of the art oflow-energy electron holography,” in Electron Holography, A.Tonomura, L. F. Allard, D. C. Pozzi, D. C. Joy, and Y. A. Ono,eds. (Elsevier Science B.V., 1995).
22. H.-W. Fink, H. Schmid, E. Ermantraut, and T. Schulz, “Elec-tron holography of individual DNA molecules,” J. Opt. Soc.Am. A 14, 2168–2172 (1997).
23. A. Gölzhäuser, B. Völkel, B. Jäger, M. Zhamikov, H. J. Kreu-zer, and M. Grunze, “Holographic imaging of macromolecules,”J. Vac. Sci. Technol. A 16, 3025–3028 (1998).
24. H. Schmid, H.-W. Fink, and H. J. Kreuzer, “In-line holographyusing low-energy electrons and photons: applications for ma-nipulation on a nanometer scale,” J. Vac. Sci. Technol. B 13,2428–2431 (1995).
25. H. J. Kreuzer, H.-W. Fink, H. Schmid, and S. Bonev, “Holo-graphy of holes, with electrons and photons,” J. Microsc. 178,191–197 (1995).
26. H. J. Kreuzer, “Low energy electron point source microscopy,”Micron 26, 503–509 (1995).
27. H. J. Kreuzer, N. Pomerleau, K. Blagrave, and M. H. Jericho,“Digital in-line holography with numerical reconstruction,” inInterferometry ’99: Techniques and Technologies, M. Kujawin-ska and M. Takeda, eds., Proc. SPIE 3744, 65–74 (1999).
28. P. Marquet, B. Rappaz, P. Magistretti, E. Cuche, Y. Emery, T.Colomb, and C. Depeursinge, “Digital holographic microscopy:a noninvasive contrast imaging technique allowing quantita-tive visualization of living cells with subwavelength axial ac-curacy,” Opt. Lett. 30, 468–470 (2005).
29. M. K. Kim, “Wavelength-scanning digital interference holographyfor optical sectioning imaging,” Opt. Lett. 24, 1693–1695 (1999).
30. I. Yamaguchi and T. Zhang, “Phase-shifting digital hologra-phy,” Opt. Lett. 22, 1268–1270 (1997).
31. T. Zhang and I. Yamaguchi, “Three-dimensional micros-copy with phase-shifting digital holography,” Opt. Lett. 23,1221–1223 (1998).
32. I. Yamaguchi, J. Kato, S. Ohta, and J. Mizuno, “Image forma-tion in phase-shifting digital holography and applications tomicroscopy,” Appl. Opt. 40, 6177–6186 (2001).
33. T.-C. Poon, “Recent progress in optical scanning holography,”J. Holography Speckle 1, 6–25 (2004).
34. T.-C. Poon, K. Doh, B. Schilling, M. Wu, K. Shinoda, and Y.Suzuki, “Three-dimensional microscopy by optical scanningholography,” Opt. Eng. 34, 1338–1344 (1995).
35. B. W. Schilling, T.-C. Poon, G. Indebetouw, B. Storrie, K. Shi-noda, Y. Suzuki, and M. Wu, “Three-dimensional holographicfluorescence microscopy,” Opt. Lett. 22, 1506–1508 (1997).
36. G. Indebetouw, P. Klysubun, T. Kim, and T.-C. Poon, “Imagingproperties of scanning holographic microscopy,” J. Opt. Soc.Am. A 17, 380–390 (2000).
37. J. Swoger, M. Martinez-Corral, J. Huisken, and E. Stelzer,“Optical scanning holography as a technique for high-resolution three-dimensional biological microscopy,” J. Opt.Soc. Am. A 19, 1910–1918 (2002).
38. W. Xu, M. H. Jericho, I. A. Meinertzhagen, and H. J. Kreuzer,“Digital in-line holography of microspheres,” Appl. Opt. 41,5367–5375 (2002).
39. W. Xu, M. H. Jericho, I. A. Meinertzhagen, and H. J. Kreuzer,“Digital in-line holography for biological applications,” Proc.Natl. Acad. Sci. USA 98, 11,301–11,305 (2001).
40. H. J. Kreuzer, M. H. Jericho, I. A. Meinertzhagen, and W. Xu,“Digital in-line holography with photons and electrons,” J.Phys. Condens. Matter 13, 10,729–10,741 (2001).
41. H. J. Kreuzer, M. H. Jericho, and W. Xu, “Digital in-line ho-lography with numerical reconstruction: three-dimensionalparticle tracking,” in Recent Developments in Traceable Di-mensional Measurements, J. E. Decker and N. Brown, eds.,Proc. SPIE 4401, 234–244 (2001).
42. W. Xu, M. H. Jericho, I. A. Meinertzhagen, and H. J. Kreuzer,“Tracking particles in 4-D with in-line holographic micros-copy,” Opt. Lett. 28, 164–166 (2003).
43. H. J. Kreuzer, M. H. Jericho, I. A. Meinertzhagen, and W. Xu,“Digital in-line holography with numerical reconstruction: 4Dtracking of microstructures and organisms,” in Proc. SPIE5005, 299–306 (2003).
44. N. I. Lewis, A. D. Cemballa, W. Xu, M. H. Jericho, and H. J.Kreuzer, “Effect of temperature in motility of three species of themarine dinoflagellate Alexandrium,” in Proceedings of theEighth Canadian Workshop on Harmful Marine Algae, S. S.Bates, ed., Can. Tech. Rep. Fish. Aquat. Sci. 2498, 80–87 (2003).
45. W. Xu, M. H. Jericho, and H. J. Kreuzer, “Digital in-line ho-lographic microscopy,” Optik (to be published).
46. D. Gabor, “Microscopy by reconstructed wavefronts,” Proc. R.Soc. London Ser. A 197, 454–487 (1949).
47. J. J. Barton, “Photoelectron holography,” Phys. Rev. Lett. 61,1356–1359 (1988).
48. K. Heinz, U. Starke, and J. Bernardt, “Surface holographywith LEED electrons,” Prog. Surf. Sci. 64, 163–178 (2000).
49. U. Schnars and W. Jüptner, “Digital recording and numerical re-construction of holograms,” Meas. Sci. Technol. 13, R85–R101(2002).
50. L. P. Yaroslavskii and N. S. Merzlyakov, Methods of DigitalHolography (translated from Russian by D. Parsons, Consult-ants Bureau, New York, 1989).
51. L. P. Yaroslavsky, Digital Holography and Digital Image Pro-cessing: Principles, Methods, Algorithms (Kluwer, 2003).
52. L. Rayleigh, Collected Papers (Cambridge U. Press, 1902), pp.3, 84.
53. M. Born and E. Wolf, Principles of Optics, 6th ed. (Pergamon,1993).
54. T. Asakura, “Resolution of two unequally bright points withpartially coherent light,” Nouv. Rev. Opt. 5, 169–177 (1974).
55. J. J. Barton, “Removing multiple scattering and twin imagesfrom hologaphic images,” Phys. Rev. Lett. 67, 3106–3109 (1991).
56. J. B. DeVelis, G. Parrent, and B. J. Thompson, “Image recon-struction with Fraunhofer holograms,” J. Opt. Soc. Am. 56,423–1427 (1996).
57. K. Doh, T.-C. Poon, and G. Indebetouw, “Twin-image noise inoptical scanning holography,” Opt. Eng. 35, 1550–1555 (1996).
58. P. Sun and J.-H. Xie, “Method for reduction of backgroundartifacts of images in scanning holography with a Fresnel-zone-plate coded aperture,” Appl. Opt. 43, 4214–4218 (2004).
59. S.-G. Kim, B. Lee, and E.-S. Kim, “Removal of bias and theconjugate image in incoherent on-axis triangular holographyand real-time reconstruction of the complex hologram,” Appl.Opt. 36, 4784–4791 (1997).
60. T.-C. Poon, T. Kim, G. Indebetouw, M. H. Wu, K. Shinoda, andY. Suzuki, “Twin-image elimination experiments for three-dimensional images in optical scanning holography,” Opt.Lett. 25, 215–217 (2000).
61. Y. Takaki, H. Kawai, and H. Ohzu, “Hybrid holographic mi-croscopy free of conjugate and zero-order images,” Appl. Opt.38, 4990–4996 (1999).
62. P. Korecki, G. Materlik, and J. Korecki, “Complex gamma-rayhologram: solution to twin images problem in atomic resolu-tion imaging,” Phys. Rev. Lett. 86, 1534–1537 (2001).
10 February 2006 � Vol. 45, No. 5 � APPLIED OPTICS 849

63. J. P. Brody, P. Yager, R. E. Goldstein, and R. H. Austin, “Bio-technology at low Reynolds numbers,” Biophys. J. 71,3430–3441 (1996).
64. J. Yang, Y. Huang, X. B. Wang, F. F. Becker, and P. R. C.Gascoyne, “Cell separation on microfabricated electrodes using
dielectrophoretic�gravitational field flow fractionation,” Anal.Chem. 71, 911–918 (1999).
65. A. Hatch, A. E. Kamholz, K. R. Hawkins, M. S. Munson, E. A.Schilling, B. H. Weigl, and P. Yager, “A rapid diffusion immu-noassay in a T-sensor,” Nat. Biotechnol. 19, 461–465 (2001).
850 APPLIED OPTICS � Vol. 45, No. 5 � 10 February 2006