Embed Size (px)
Citation preview
University of South FloridaScholar Commons
Theses and Dissertations
6-1-2010
Total internal reflection holographic microscopy(TIRHM) for quantitative phase characterizationof cell-substrate adhesionWilliam Mason AshUniversity of South Florida
This Dissertation is brought to you for free and open access by Scholar Commons. It has been accepted for inclusion in Theses and Dissertations by anauthorized administrator of Scholar Commons. For more information, please contact [email protected].
Scholar Commons CitationAsh, William Mason, "Total internal reflection holographic microscopy (TIRHM) for quantitative phase characterization of cell-substrate adhesion" (2010). Theses and Dissertations. Paper 1564.http://scholarcommons.usf.edu/etd/1564
Total Internal Reflection Holographic Microscopy (TIRHM) for
Quantitative Phase Characterization of Cell-Substrate Adhesion
by
William Mason Ash, III
A dissertation submitted in partial fulfillment of the requirements for the degree of
Doctor of Philosophy Department of Physics
College of Arts and Sciences University of South Florida
Major Professor: Myung K. Kim, Ph.D. Donald Hilbelink, Ph.D. Dennis Killinger, Ph.D. Chun-Min Lo, Ph.D.
Garrett Matthews, Ph.D.
Date of Approval: March 30, 2010
Keywords: Near-Field, Evanescent, Digital Holography, Membrane, Psuedopod, Motility
© Copyright 2010, William Mason Ash, III

To friends and family everywhere
ACKNOWLEDGEMENTS
I personally wish to convey to the scientific community and academia at large the
kind and thoughtful brilliance of Paul Kim, without whose guidance and genius, none of
this would have been possible. I would also like to thank our co-investigators, Dr. Chun-
Min Lo for his generous help with the 3T3 fibroblasts and SKOV-3 samples, and David
Clark for his capable competence with the phase movie production software. We are also
greatly indebted to the skilled craftsmanship of our Machinist, Mr. Robert Harrington, for
his world-class manufacture of our TIR prism and beamcube holder.
Special thanks also to Digital Holography and Microscopy Laboratory (DHML)
members, both present and past, especially Nilanthi Warnasooriya, Mariana Potcoava
and Leo Krzewina, the folks at IGERT and the USF Center for Entrepreneurship, and
also Dr. Johnson and our dedicated Physics Department staff, particularly Mary Ann,
Daisy, Kimberly and Phil, who all, in their own way, helped sustain this effort through
some of its toughest times. While I have already dedicated the totality of this work to our
family and friends, particularly special thanks is long overdue to my wife Lisa, our sons
Stephen and Sean, and my brother Michael, for their patience, love, support,
understanding and forbearance. This research was supported in part by National Science
Foundation grant CBET BISH 0755705 and NSF IGERT Traineeship award DGE
0221681.
TABLE OF CONTENTS
LIST OF TABLES iii
LIST OF FIGURES iv
ABSTRACT vii
CHAPTER 1. INTRODUCTION 1
1.1 Optical Microscopy 3
1.1.1 Phase Contrast Microscopy (PCM) 8
1.1.2 Interference Reflection Microscopy (IRM) 10
1.1.3 Total Internal Reflection Fluorescence Microscopy (TIRFM) 15
1.2 Holography 19
1.2.1 Digital Holography 19
1.3 Sample Cells 23
1.4 Dissertation Overview 36
CHAPTER 2. THEORY 31
2.1 Total Internal Reflection (TIR) 31
2.2 Principle of digital holography (DH) 43
2.3 Digital holography on to an inclined plane 46
i
CHAPTER 3. EXPERIMENTAL SETUP 51
3.1 TIR Prism 51
3.2 Interferometer 53
3.3 Camera and Image Acquisition 61
3.4 Computer and Programs Overview 61
3.5 Sample Preparation 66
CHAPTER 4. EXPERIMENT 72
4.1 Early efforts; EX-1A through EX-3 72
4.2 System II Operation / Calibration Run 11-19-09 74
4.3 Water droplets and Lens Experiments 84
4.4 TIRHM of cells 91
Amoeba Proteus 91
Dictyostelium Discoideum 93
SKOV-3 Ovarian Cancer 93
3T3 Fibroblast 99
4.5 TIRHM of cell motion 103
CHAPTER 5. DISCUSSION 106
CHAPTER 6. CONCLUSIONS 111
REFERENCES 116
BIBLIOGRAPHY 125
PAPERS AND CONFERENCES 127
ABOUT THE AUTHOR End Page
ii
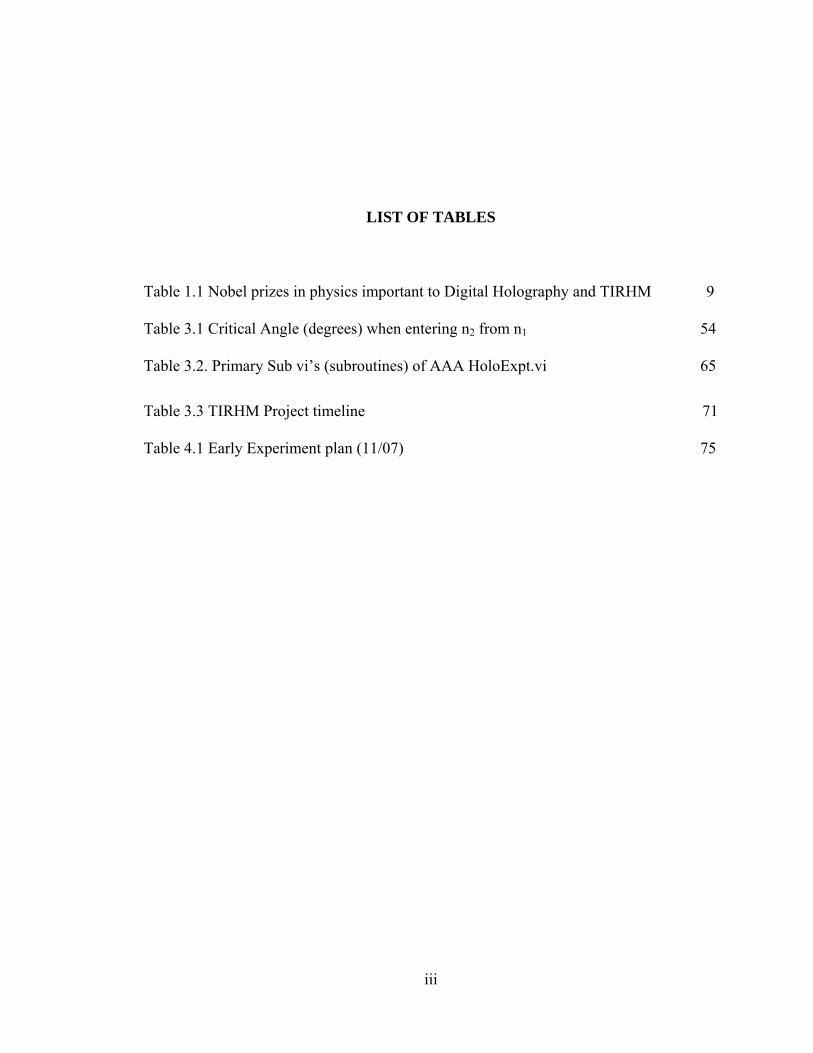
LIST OF TABLES
Table 1.1 Nobel prizes in physics important to Digital Holography and TIRHM 9
Table 3.1 Critical Angle (degrees) when entering n2 from n1 54
Table 3.2. Primary Sub vi’s (subroutines) of AAA HoloExpt.vi 65
Table 3.3 TIRHM Project timeline 71
Table 4.1 Early Experiment plan (11/07) 75
iii
LIST OF FIGURES
Figure 1.1 Amoeba Proteus psuedopod adhesion. 2
Figure 1.2 Optical Microscopy. 4
Figure 1.3 Compound microscope schematic. 6
Figure 1.4 Phase Contrast of SKOV-3 Ovarian cancer cell. 11
Figure 1.5 Phase Contrast Microscopy 12
Figure 1.6 Phase Plate. 13
Figure 1.7 Interference Reflection Microscopy (IRM). 14
Figure 1.8 Total Internal Refraction (TIR) from Snell’s Law. 16
Figure 1.9 Total Internal Reflection Fluorescence Microscopy (TIRFM) 18
Figure 1.10 The Principle of Holography 20
Figure 1.11. Digital Holography. 22
Figure 1.12 The life cycles of Dictyostelium discoideum. 25
Figure 1.13. Non-confluent SKOV-3 cells. 27
Figure 1.14. Fibroblasts. 28
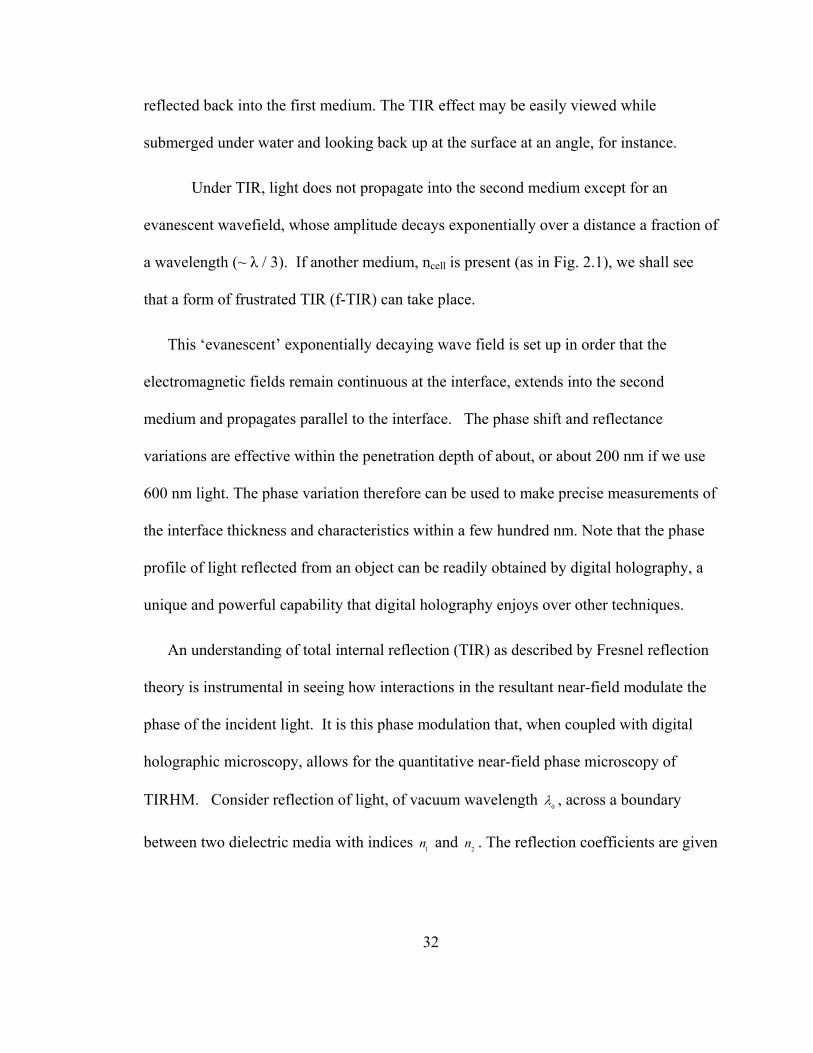
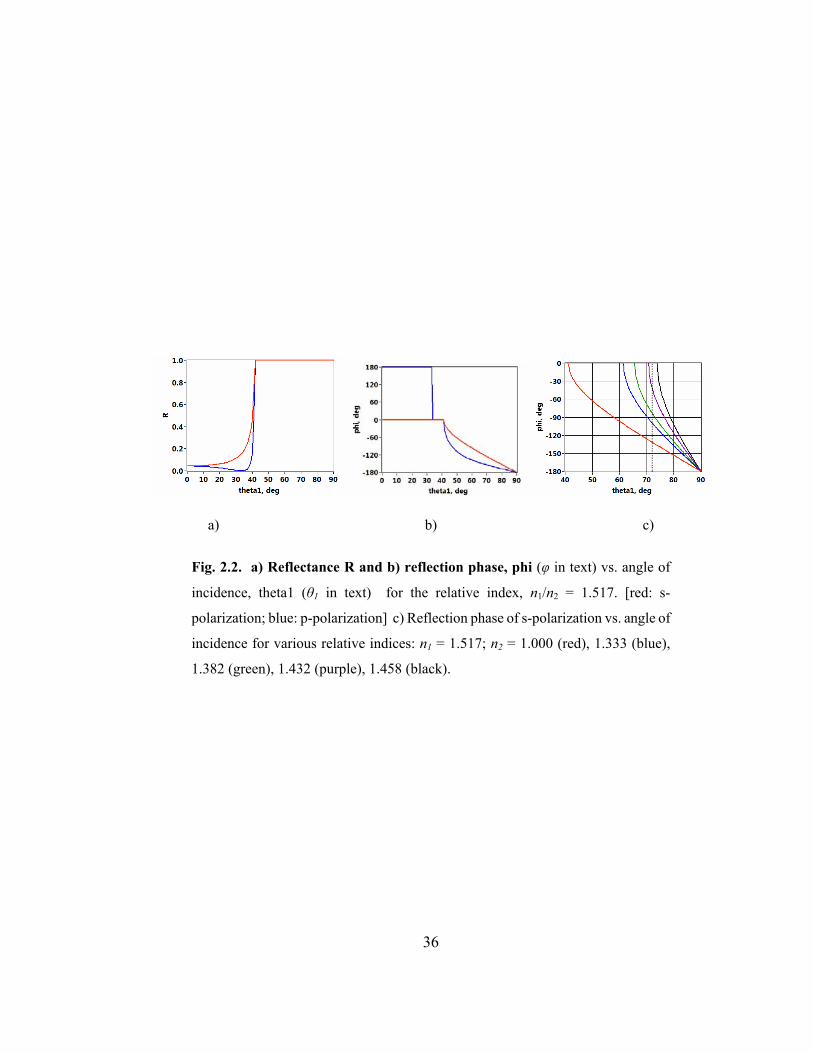
Fig. 2.1 Geometry of TIR evanescent wave surface sensing. 33
Fig. 2.2. Reflectance R and reflection phase, phi 36
Fig. 2.3 Geometry of frustrated TIR (fTIR). 38
iv
Fig. 2.4 Reflectance and reflection phase in fTIR. 40
Figure 2.5. TIR Phase shift, φ, 42
Figure 2.6 TIRHM prism Geometry. 48
Figure 2.7. Geometry of holography over an inclined plane 50
Figure 3.1 TIR Prism 52
Figure 3.2 Michelson interferometer. 56
Figure 3.3 Ex2 layout - Resolution target tilt 58
Figure 3.4 Mach-Zehnder TIRHM topology showing lens experiment 59
Figure 3.5 Original system. (System I) 60
Figure 3.6 System Upgrade (System II) 62
Figure 3.7. The process of digital holographic microscopy 67
Figure 3.8 AS Holodiffract.vi 68
Figure 3.9 Adjustment of Angular Spectrum 69
Figure 4.1 USAF 1951 1X Resolution Target 73
Figure 4.2 AS HoloDiffract Operator’s screen; Exp-1A with Michelson unit 76
Figure 4.3 EX2 RT Tilt experiment 77
Figure 4.4 TIR camera MAX image of RT chip 79
Figure 4.5 Lookdown camera MAX image of RT chip 81
Figure 4.6 Camera Setup (ieee).vi routine 83
Figure 4.7 AS HoloDiffract.vi RT calibration run 85
Fig. 4.8 Water droplet Experiment. 87
Figure 4.9 Lens Experiment geometry example 89
Fig. 4.10 Lens Experiment Results 90
v
Fig. 4.11. Cross-section of phase profile across the contact spot 92
Figure 4.12. Amoeba Proteus sample 94
Figure 4.13. Amoeba Proteus sample 95
Figure 4.14. Proteus Sample 96
Figure 4.15. Dictyostelium Discoideum. 97
Figure 4.16. Dictyostelium Discoideum TIRHM. 97
Figure 4.17. TIR holographic microscopy: Dictyostelium Discoideum. 98
Figure 4.18. SKOV-3 ovarian cancer cell 100
Figure 4.19 Second run of SKOV-3 cultured on SFL11 prism 101
Figure 4.20. 3T3 Fibroblast cell 102
Figure 4.21 Unidentified circular object. 104
Figure 4.22 Amoeba Proteus under lens flat. 105
vi
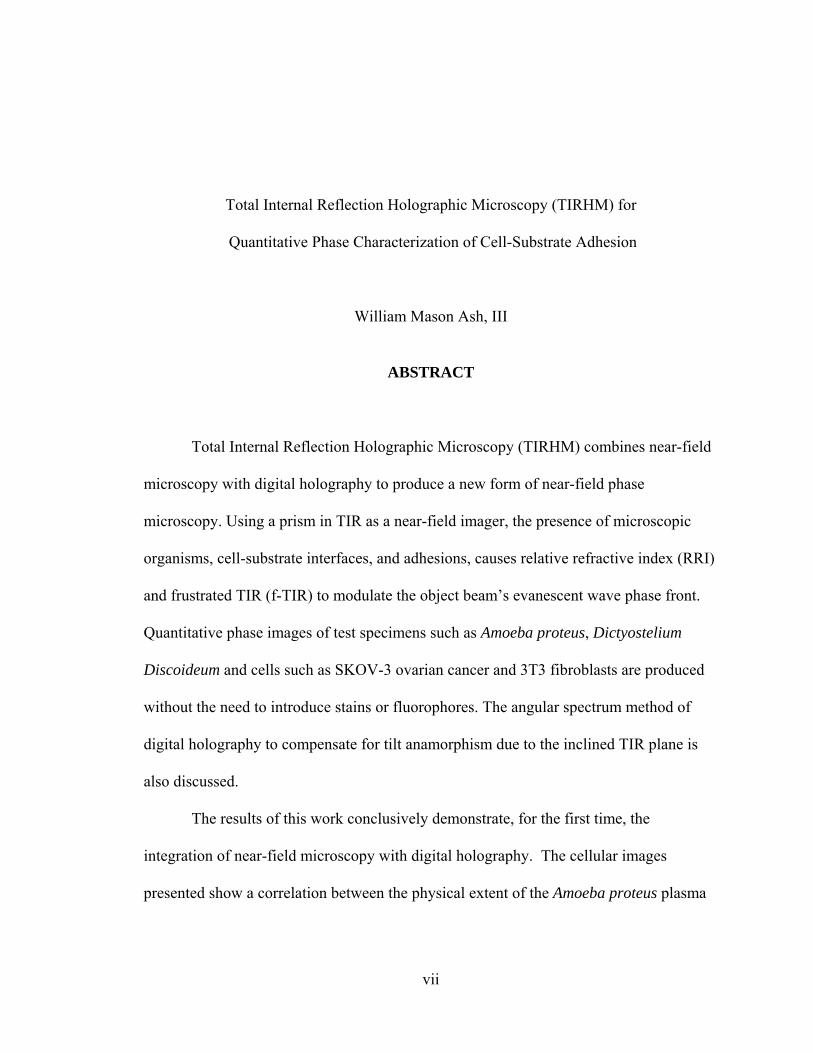
Total Internal Reflection Holographic Microscopy (TIRHM) for
Quantitative Phase Characterization of Cell-Substrate Adhesion
William Mason Ash, III
ABSTRACT
Total Internal Reflection Holographic Microscopy (TIRHM) combines near-field
microscopy with digital holography to produce a new form of near-field phase
microscopy. Using a prism in TIR as a near-field imager, the presence of microscopic
organisms, cell-substrate interfaces, and adhesions, causes relative refractive index (RRI)
and frustrated TIR (f-TIR) to modulate the object beam’s evanescent wave phase front.
Quantitative phase images of test specimens such as Amoeba proteus, Dictyostelium
Discoideum and cells such as SKOV-3 ovarian cancer and 3T3 fibroblasts are produced
without the need to introduce stains or fluorophores. The angular spectrum method of
digital holography to compensate for tilt anamorphism due to the inclined TIR plane is
also discussed.
The results of this work conclusively demonstrate, for the first time, the
integration of near-field microscopy with digital holography. The cellular images
presented show a correlation between the physical extent of the Amoeba proteus plasma
vii
membrane and the adhesions that are quantitatively profiled by phase cross-sectioning of
the holographic images obtained by digital holography. With its ability to quantitatively
characterise cellular adhesion and motility, it is anticipated that TIRHM can be a tool for
characterizing and combating cancer metastasis, as well as improving our understanding
of morphogenesis and embryogenesis itself.
viii
CHAPTER 1
INTRODUCTION
Optics being the wonderful special case of electromagnetism that it is, photonics
could easily be to this century what electronics has been to the previous one. Digital
holography enjoys elements of both. Firmly grounded, as we shall see, in basic physical
principles, this research presented here combines digital holography with near-field
microscopy to produce a form of phase microscopy motivated by biophysical
applications of cellular mechanics, namely, the characterization of cellular adhesion.
Biological systems make for an interesting set of physics. Understanding how
cells get to where they go, and what they do when they get there, has been a keen interest
in many fields since Leeuwenhoek first observed protozoa (Figure 1.1). More recently,
cellular adhesion and its chemo-mechanics (i.e., cadherin dynamics) have been an area of
significant research for quite some time and are key to understanding interactive motility
and signaling processes such as morphogenesis [1-3] and even metastasis [4].
Many cells move by crawling over surfaces. Axons grow over long distances,
macrophages and neutrophils crawl to sites of infection, fibroblasts migrate through
connective tissues and cancer cells metastasize. This is accomplished by a set of
coordinated events, namely, the protrusion of lamellipodia, the adhesion of focal
1
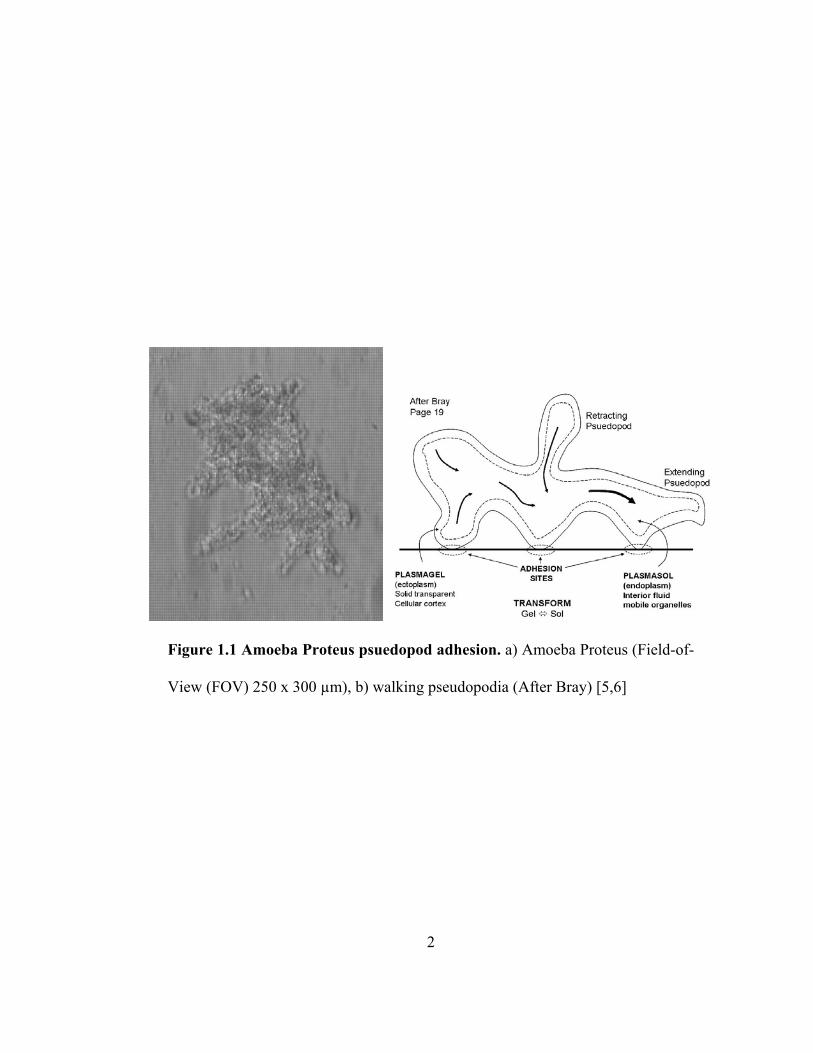
Figure 1.1 Amoeba Proteus psuedopod adhesion. a) Amoeba Proteus (Field-of-
View (FOV) 250 x 300 µm), b) walking pseudopodia (After Bray) [5,6]
2
contacts, the establishment of traction and the release of old adhesions. Therefore, the
ability to generate accurate, quantitative surface profiles of live cellular adhesion to help
better understand the important process of cellular motion, adhesion and transduction
gains increasing emphasis.
1.1 Optical Microscopy
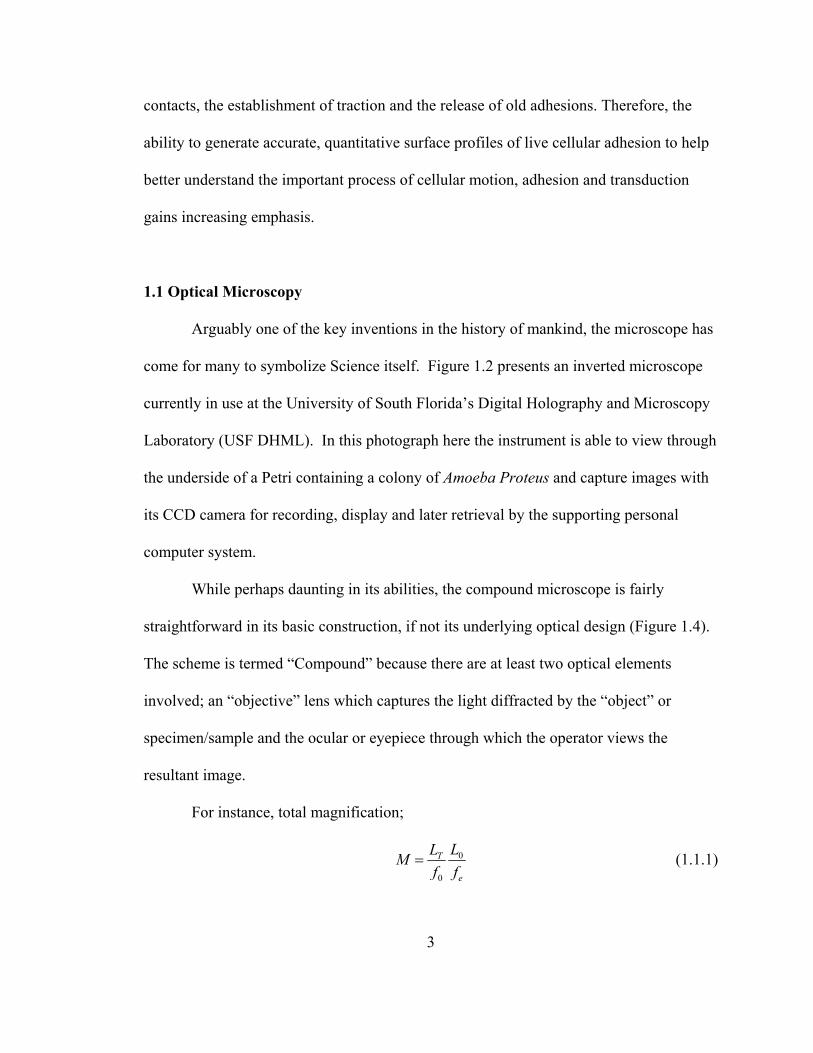
Arguably one of the key inventions in the history of mankind, the microscope has
come for many to symbolize Science itself. Figure 1.2 presents an inverted microscope
currently in use at the University of South Florida’s Digital Holography and Microscopy
Laboratory (USF DHML). In this photograph here the instrument is able to view through
the underside of a Petri containing a colony of Amoeba Proteus and capture images with
its CCD camera for recording, display and later retrieval by the supporting personal
computer system.
While perhaps daunting in its abilities, the compound microscope is fairly
straightforward in its basic construction, if not its underlying optical design (Figure 1.4).
The scheme is termed “Compound” because there are at least two optical elements
involved; an “objective” lens which captures the light diffracted by the “object” or
specimen/sample and the ocular or eyepiece through which the operator views the
resultant image.
For instance, total magnification;
0
0
T
e
LLMf f
= (1.1.1)
3
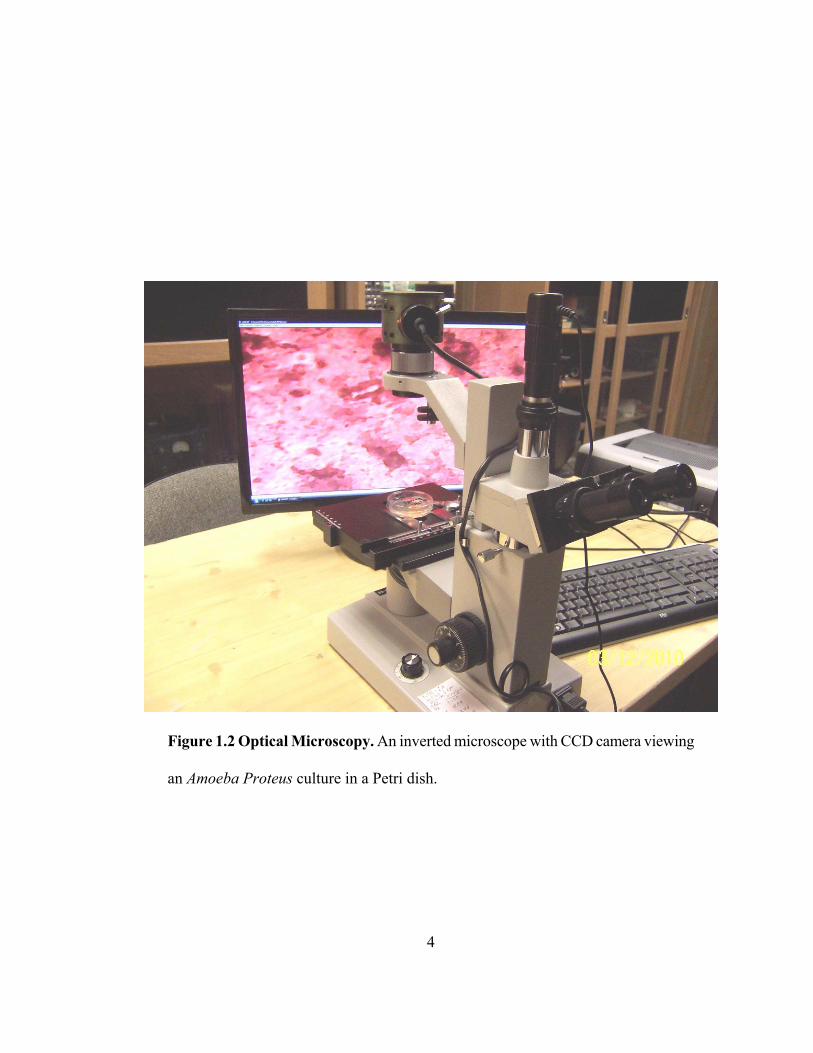
Figure 1.2 Optical Microscopy. An inverted microscope with CCD camera viewing
an Amoeba Proteus culture in a Petri dish.
4
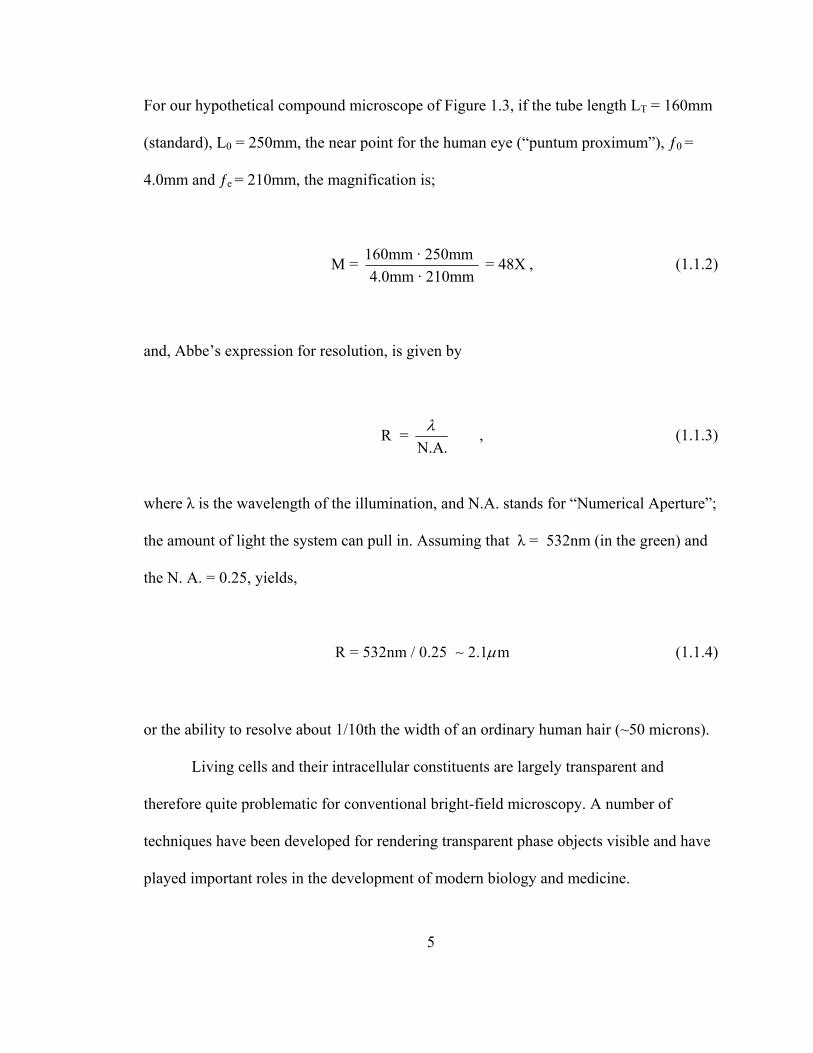
For our hypothetical compound microscope of Figure 1.3, if the tube length LT = 160mm
(standard), L0 = 250mm, the near point for the human eye (“puntum proximum”), ƒ0 =
4.0mm and ƒe = 210mm, the magnification is;
160mm · 250mm M = = 48X4.0mm · 210mm
, (1.1.2)
and, Abbe’s expression for resolution, is given by
R = N.A.λ , (1.1.3)
where λ is the wavelength of the illumination, and N.A. stands for “Numerical Aperture”;
the amount of light the system can pull in. Assuming that λ = 532nm (in the green) and
the N. A. = 0.25, yields,
R = 532nm / 0.25 2.1 m μ∼ (1.1.4)
or the ability to resolve about 1/10th the width of an ordinary human hair (~50 microns).
Living cells and their intracellular constituents are largely transparent and
therefore quite problematic for conventional bright-field microscopy. A number of
techniques have been developed for rendering transparent phase objects visible and have
played important roles in the development of modern biology and medicine.
5
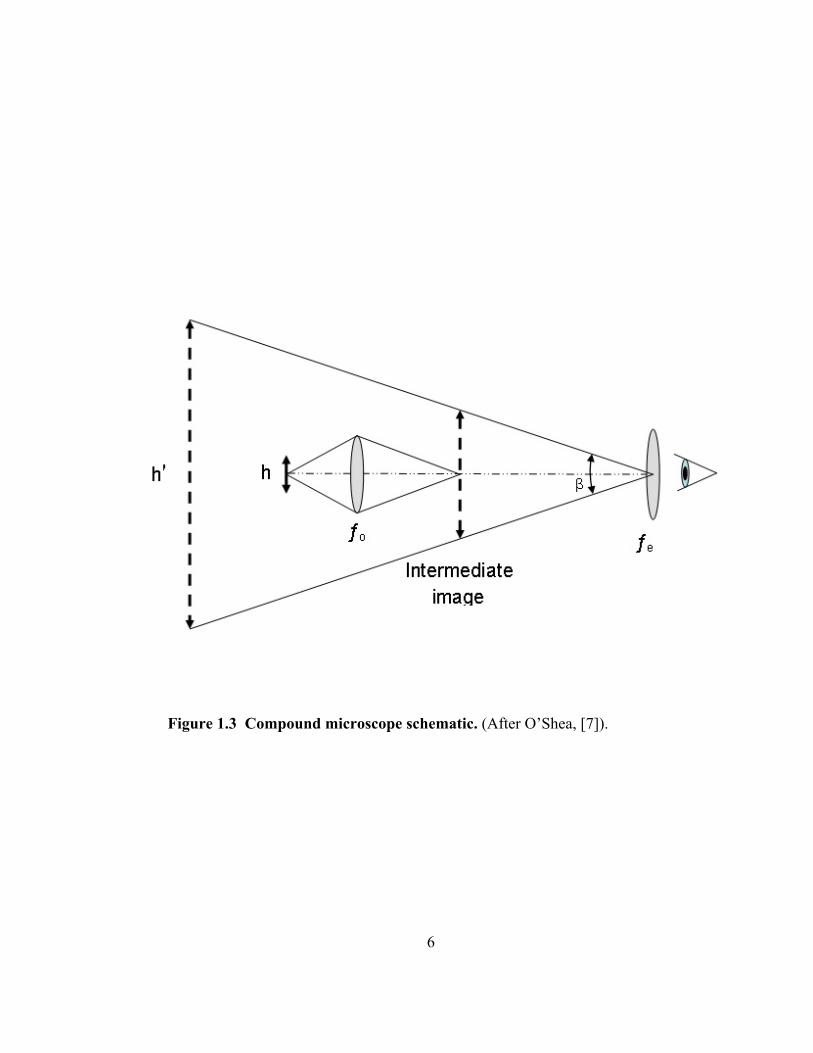
Figure 1.3 Compound microscope schematic. (After O’Shea, [7]).
6
7
For example, in dark-field microscopy, only the scattering centers and boundaries
contribute to the image signal against a zero background [8]. In Zernike Phase Contrast
Microscopy, phase variation is converted into amplitude variation by the use of a phase
plate and spatial filtering [9]. Interference microscopy, using a Michelson objective for
example, produces fringes of equal thickness for a transparent object [10]. Although
these techniques are very effective in making transparent objects visible, the phase to
amplitude conversion is nonlinear and there are significant artifacts in the images; such
as the halo in Zernike phase contrast or the disappearance of contrast along the direction
perpendicular to shear in differential interference contrast (DIC) microscopy.
Unfortunately, while useful, these techniques do not produce entirely quantitative phase
images.
The optical phase of the light transmitted through transparent objects generally
conveys quantitative information about the object, such as the physical thickness and the
index of refraction [11], which in turn are functions of the physical density or properties
of the chemical concentration. High precision measurements of optical phase can thus
reveal subtle changes in these parameters that accompany the cellular processes of
interest. As an example, in order to obtain quantitative phase images, one can perform
interferometric measurement of a focused beam of light on an object, and scan the beam
in a raster fashion. Alternatively, as in phase-shifting interference microscopy [12], the
quantitative phase image is obtained from a combination of multiple interferograms.
The microscopy of cellular adhesion is important for a deeper understanding of
cellular motion and morphogenesis. Cell-substrate interactions, including attachment,
8
spreading, morphology changes, and migration, require a complex series of events to
occur in a regulated and integrated manner. An orchestrated set of activities takes place
that includes, the protrusion of pseudopodia, the formation of new adhesions, and the
development of traction, followed by the subsequent release of previous adhesions in
order to produce movement. To date, the primary tools for imaging and studying these
surface processes have been total internal reflection fluorescence microscopy (TIRFM)
and interference reflection microscopy (IRM). The techniques in optical microscopy that
we are most interested in here are Phase Contrast Microscopy, Interference Reflection
Microscopy and TIR Fluorescence Microscopy.
1.1.1 Phase Contrast Microscopy (PCM)
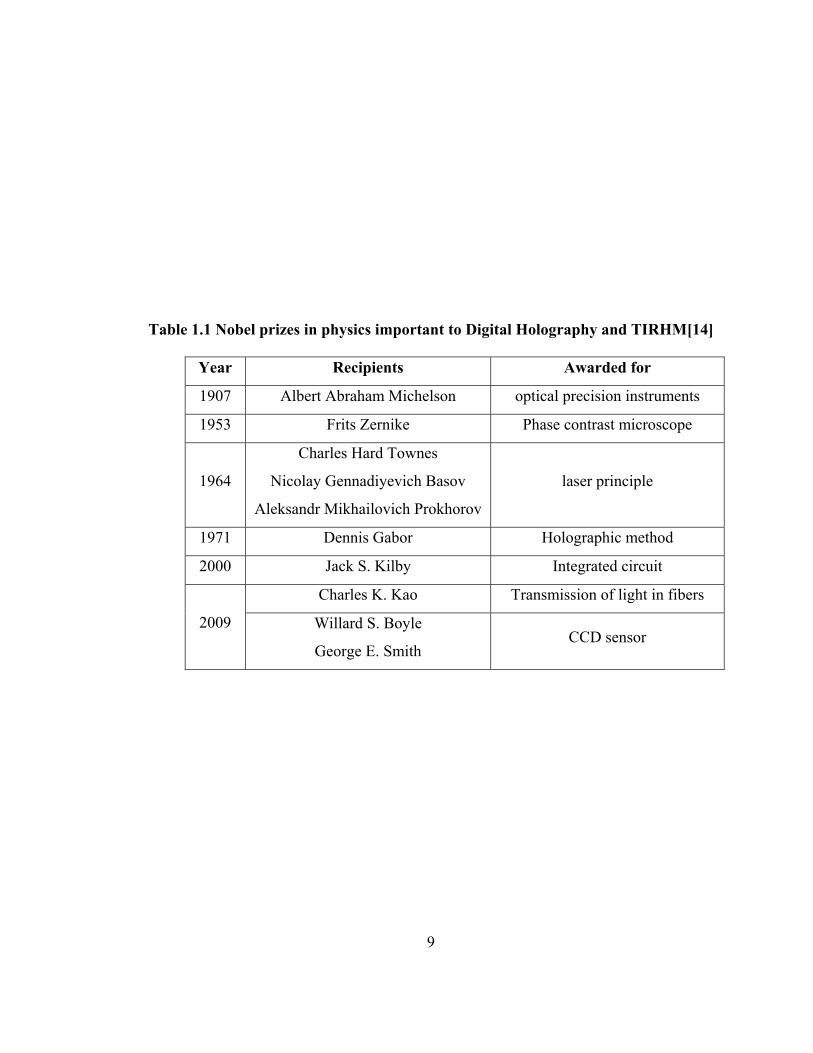
Invented by Frits Zernike, for which he won the 1953 Nobel Prize in Physics
(Table 1.1) [13], Phase Contrast Microscopy was an early technique for rendering
transparent “phase-objects” visible without the use of stains that result in cell death. In
the Zernike phase contrast microscope, the phase variation is converted into amplitude
variation, by use of a phase plate (and perhaps spatial filtering). While quite successful
and still in use today, PCM has a drawback in that it’s conversion of phase information to
amplitude also produces a spurious halo effect. PCM is also important here because
TIRHM is also a form of phase microscopy.
As we shall soon see, also worthy of note is PCM’s resemblance to holography,
in that, PCM uses a type of “reference beam” in its undiffracted illumination path (called
the Surround beam “S”) that is recombined with the information carrying diffracted
9
Table 1.1 Nobel prizes in physics important to Digital Holography and TIRHM[14]
Year Recipients Awarded for
1907 Albert Abraham Michelson optical precision instruments
1953 Frits Zernike Phase contrast microscope
1964
Charles Hard Townes
Nicolay Gennadiyevich Basov
Aleksandr Mikhailovich Prokhorov
laser principle
1971 Dennis Gabor Holographic method
2000 Jack S. Kilby Integrated circuit
Charles K. Kao Transmission of light in fibers
2009 Willard S. Boyle
George E. Smith CCD sensor
10
beam. Figure 1.4 presents phase contrast imagery of a SKOV-3 ovarian cancer cell while
Figures 1.5 and 1.6 depict the workings of the technique.
1.1.2 Interference Reflection Microscopy (IRM)
In the IRM technique, developed by Curtis in 1964 [15], light waves reflected
from the two surfaces at the cell-substrate interface produce interference fringes.
Certainly an older technique that does not enjoy nearly the widespread popularity of
TIRFM, IRM does allow for estimation of interface thickness profile. When proteins
associated with the focal contacts are analyzed utilizing immunofluorescence, the
contacts themselves may be viewed using IRM. However, in this instance, the
interference image of the interface is usually complicated by the reflection image of the
cell body and its contents, thus allowing only a qualitative interpretation of the surface
profile. Confocal adaptation of IRM can reduce the spurious reflection signal, but raster
scanning of such system imposes significant speed limitations.
Figure 1.7 is Verschueren’s apparatus [16] for Interference Reflection
Microscopy (IRM) which he describes as “Monochromatic green light is linearly
polarized and directed into the objective lens. The light reflected by the object passes
through the quarter-wavelength plate on its way to the object and is circularly polarized.
On its way back it is linearly polarized again but with a 90° difference in the direction of
polarization, and therefore passes through the analyzer. Stray light from reflections at the
lens surfaces, with unaffected polarization, is extinguished by the crossed analyzer. Stray
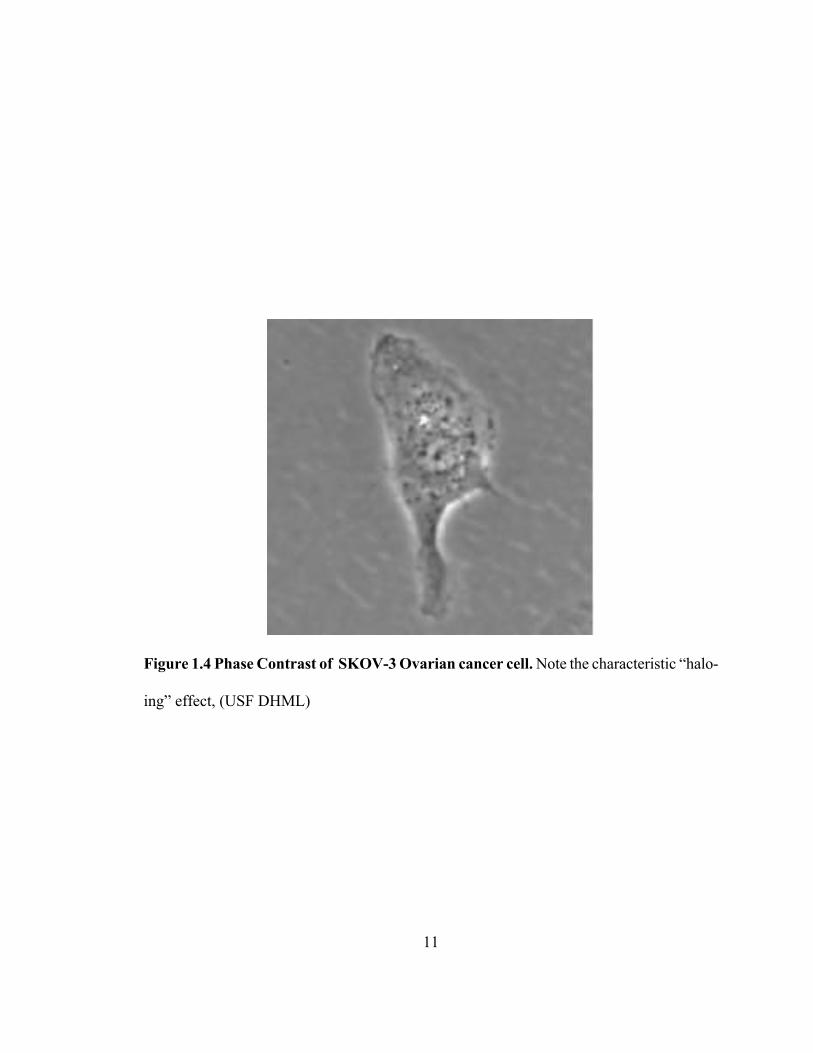
Figure 1.4 Phase Contrast of SKOV-3 Ovarian cancer cell. Note the characteristic “halo-
ing” effect, (USF DHML)
11
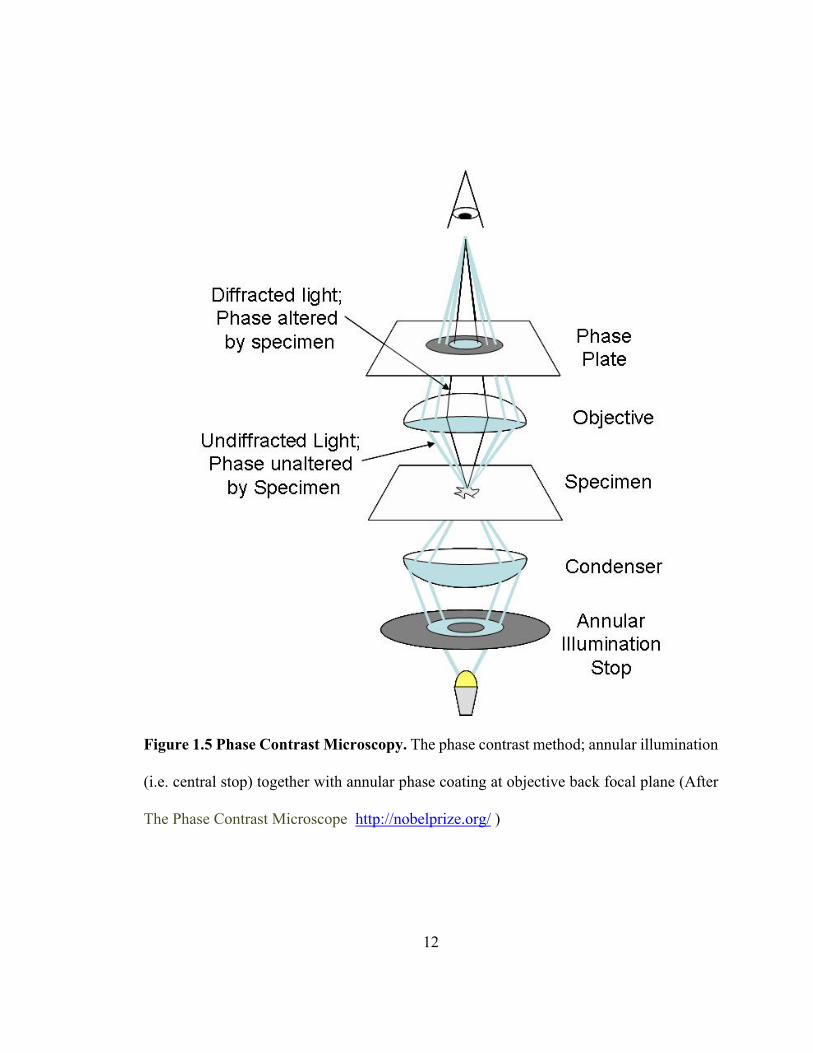
Figure 1.5 Phase Contrast Microscopy. The phase contrast method; annular illumination
(i.e. central stop) together with annular phase coating at objective back focal plane (After
The Phase Contrast Microscope http://nobelprize.org/ )
12
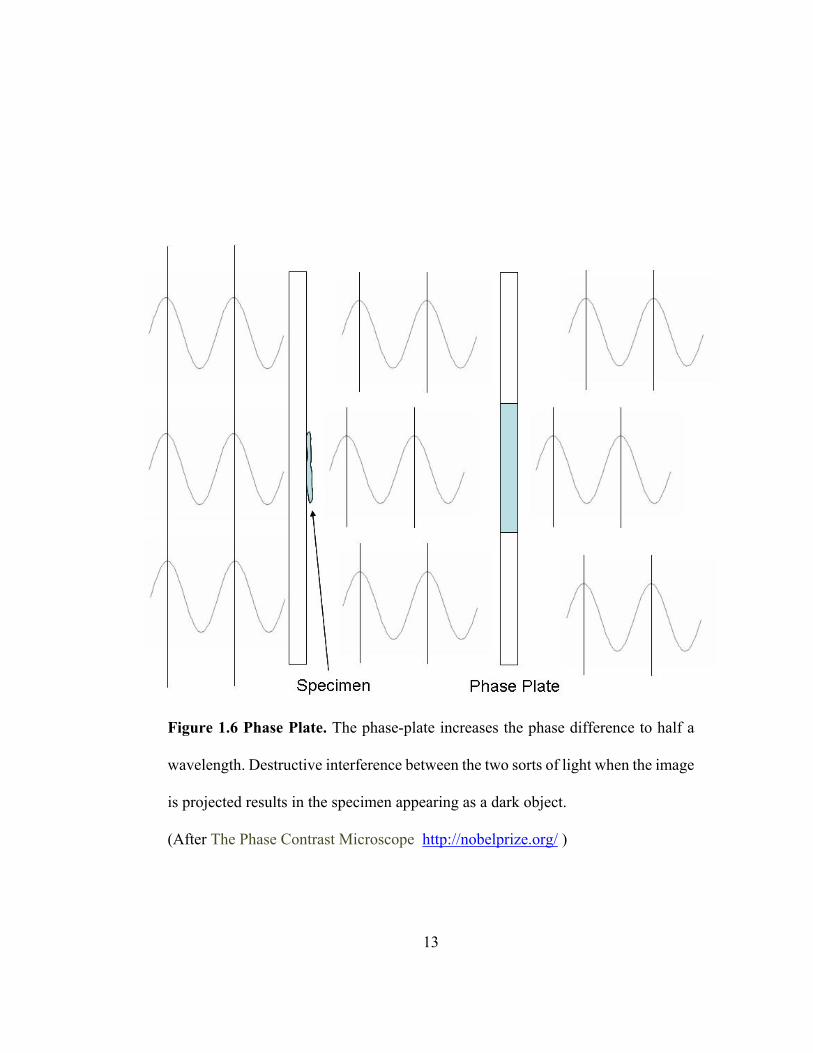
Figure 1.6 Phase Plate. The phase-plate increases the phase difference to half a
wavelength. Destructive interference between the two sorts of light when the image
is projected results in the specimen appearing as a dark object.
(After The Phase Contrast Microscope http://nobelprize.org/ )
13
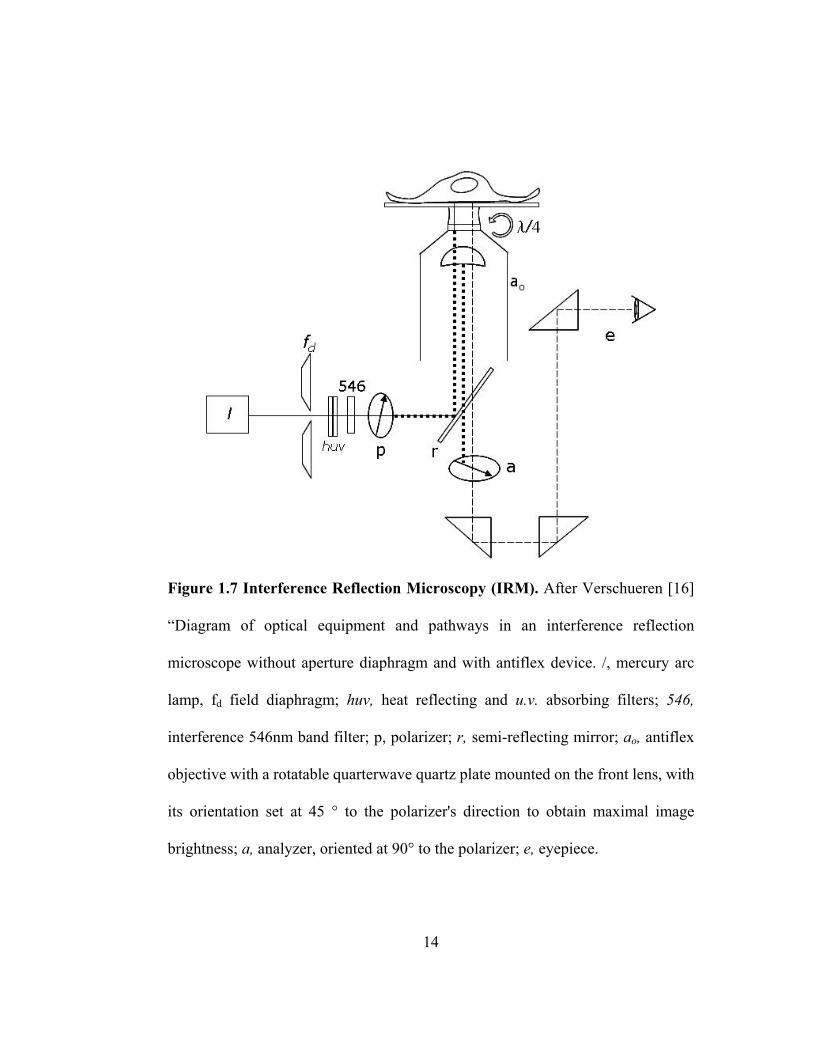
Figure 1.7 Interference Reflection Microscopy (IRM). After Verschueren [16]
“Diagram of optical equipment and pathways in an interference reflection
microscope without aperture diaphragm and with antiflex device. /, mercury arc
lamp, fd field diaphragm; huv, heat reflecting and u.v. absorbing filters; 546,
interference 546nm band filter; p, polarizer; r, semi-reflecting mirror; ao, antiflex
objective with a rotatable quarterwave quartz plate mounted on the front lens, with
its orientation set at 45 ° to the polarizer's direction to obtain maximal image
brightness; a, analyzer, oriented at 90° to the polarizer; e, eyepiece.
14
15
light from reflections within the object but from outside the field of interest is eliminated
by encircling a small area with the field diagram. In the absence of an aperture iris, the
illuminating numerical aperture is at its maximum value for the objective used.”
On the other hand, in interference reflection microscopy (IRM), light waves
reflected from two surfaces of the cell-substrate interface produces interference fringes,
thus allowing estimation of the interface thickness profile [17,18]. However, with IRM
the interference image of the interface is usually complicated by the reflection image of
the cell body and its contents, thus allowing only a qualitative interpretation of the
surface profile. Confocal adaptation of IRM can reduce the spurious reflection signal, but
raster scanning of such a system imposes significant speed limitations.
1.1.3 Total Internal Reflection Fluorescence Microscopy (TIRFM)
In 1981, D. Axelrod [19,20] demonstrated total internal reflection fluorescence
microscopy (TIRFM) to be an effective technique to study cell-substrate contact. When
light is incident from inside of a higher-index n1 medium into a lower-index one n2, with
the angle of incidence greater than the critical angle given by qc = sin-1(n2/n1), all of the
incident light is reflected back to the first medium (Figure 1.8). There is no propagating
field in the second medium, except for the evanescent wave, whose amplitude decays
exponentially over a distance of a fraction of a wavelength. Although the evanescent field
is non-propagating, it can modulate the phase of the reflected n1 wave either through
inhomogeneous refractive indices in the n2 medium, frustrated TIR (fTIR) geometries, or,
if suitable dye molecules are placed in the evanescent field, they can absorb energy from
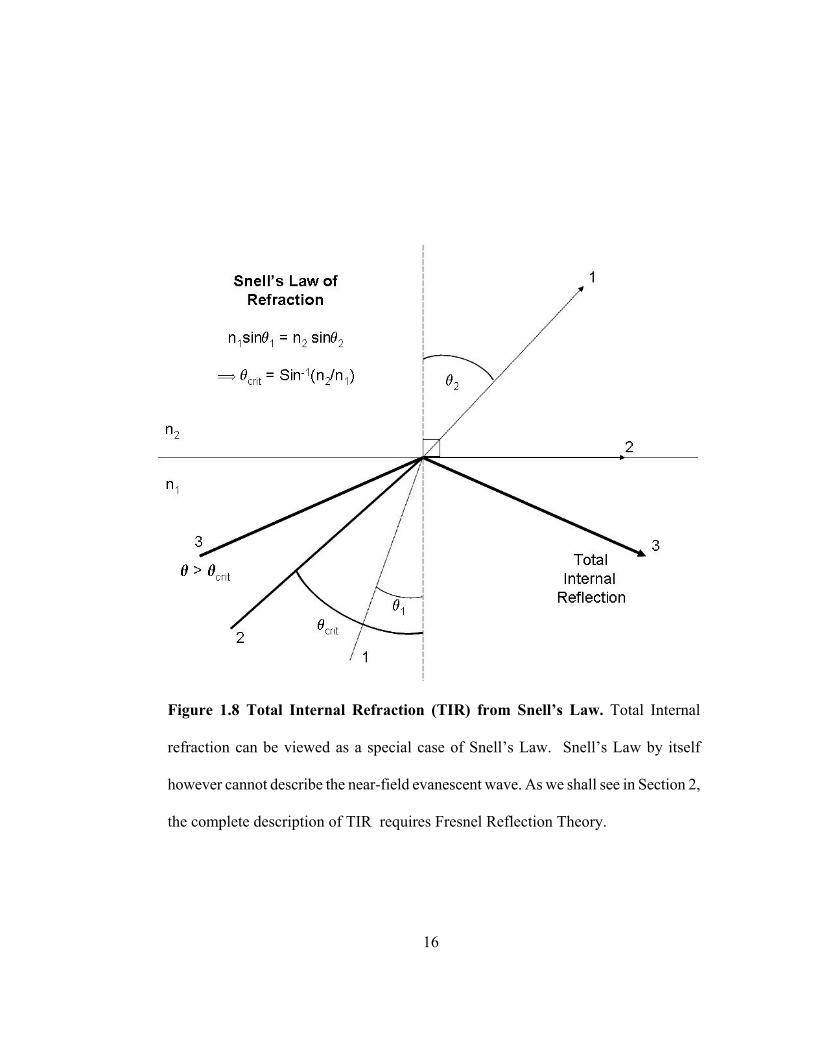
Figure 1.8 Total Internal Refraction (TIR) from Snell’s Law. Total Internal
refraction can be viewed as a special case of Snell’s Law. Snell’s Law by itself
however cannot describe the near-field evanescent wave. As we shall see in Section 2,
the complete description of TIR requires Fresnel Reflection Theory.
16
17
the field and fluoresce. All these processes can be used for near-field microscopy.
Fluorescence microscopy, or TIRFM, reveals localization of fusion protein in cell focal
adhesions at the substrate interface in dramatic contrast to the blur produced by out-of-
plane fluorescence in the epi-illumination image. While this provides for excellent
functional imaging, on the other hand, information on the morphology of the cellular
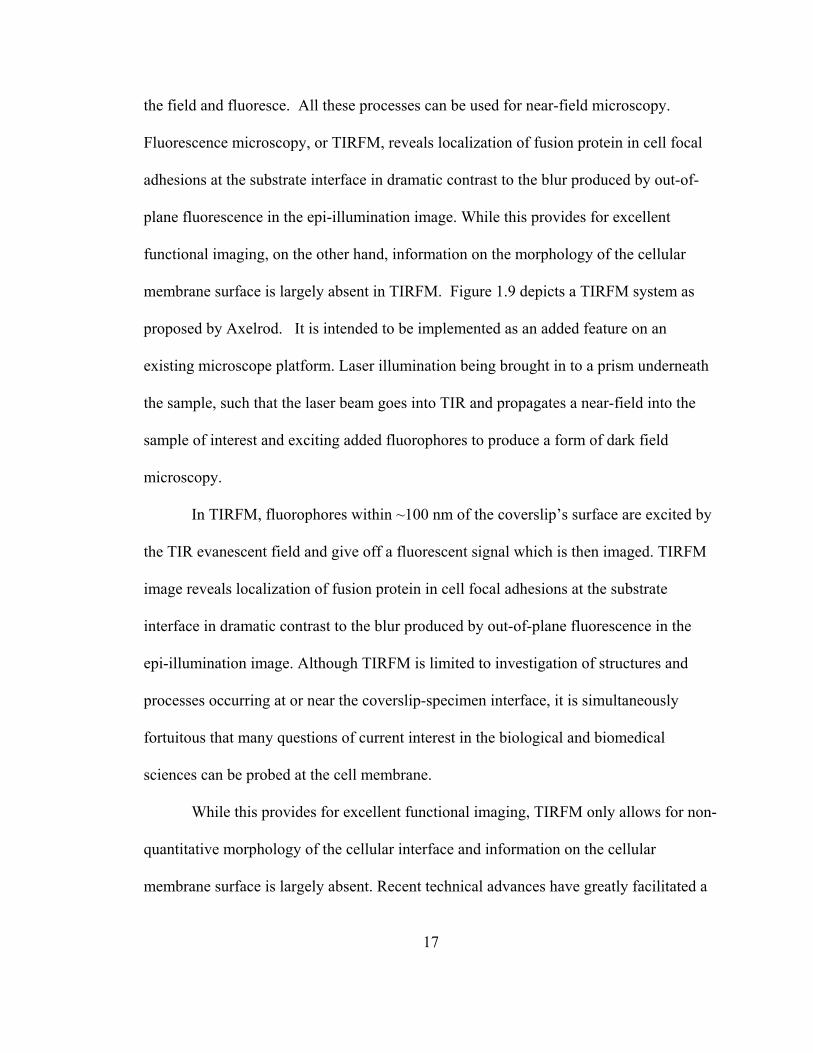
membrane surface is largely absent in TIRFM. Figure 1.9 depicts a TIRFM system as
proposed by Axelrod. It is intended to be implemented as an added feature on an
existing microscope platform. Laser illumination being brought in to a prism underneath
the sample, such that the laser beam goes into TIR and propagates a near-field into the
sample of interest and exciting added fluorophores to produce a form of dark field
microscopy.
In TIRFM, fluorophores within ~100 nm of the coverslip’s surface are excited by
the TIR evanescent field and give off a fluorescent signal which is then imaged. TIRFM
image reveals localization of fusion protein in cell focal adhesions at the substrate
interface in dramatic contrast to the blur produced by out-of-plane fluorescence in the
epi-illumination image. Although TIRFM is limited to investigation of structures and
processes occurring at or near the coverslip-specimen interface, it is simultaneously
fortuitous that many questions of current interest in the biological and biomedical
sciences can be probed at the cell membrane.
While this provides for excellent functional imaging, TIRFM only allows for non-
quantitative morphology of the cellular interface and information on the cellular
membrane surface is largely absent. Recent technical advances have greatly facilitated a
Figure 1.9 Total Internal Reflection Fluorescence Microscopy (TIRFM). A laser source illuminates a TIR prism sets up a near-field through the sample that excites fluorophore tags. (After Axelrod [21]).
18
19
wider range of applications of TIR microscopy. TIRFM imagery reveals localization of
fusion protein in cell focal adhesions at the substrate interface in dramatic contrast to the
blur produced by out-of-plane fluorescence in the epi-illumination image.
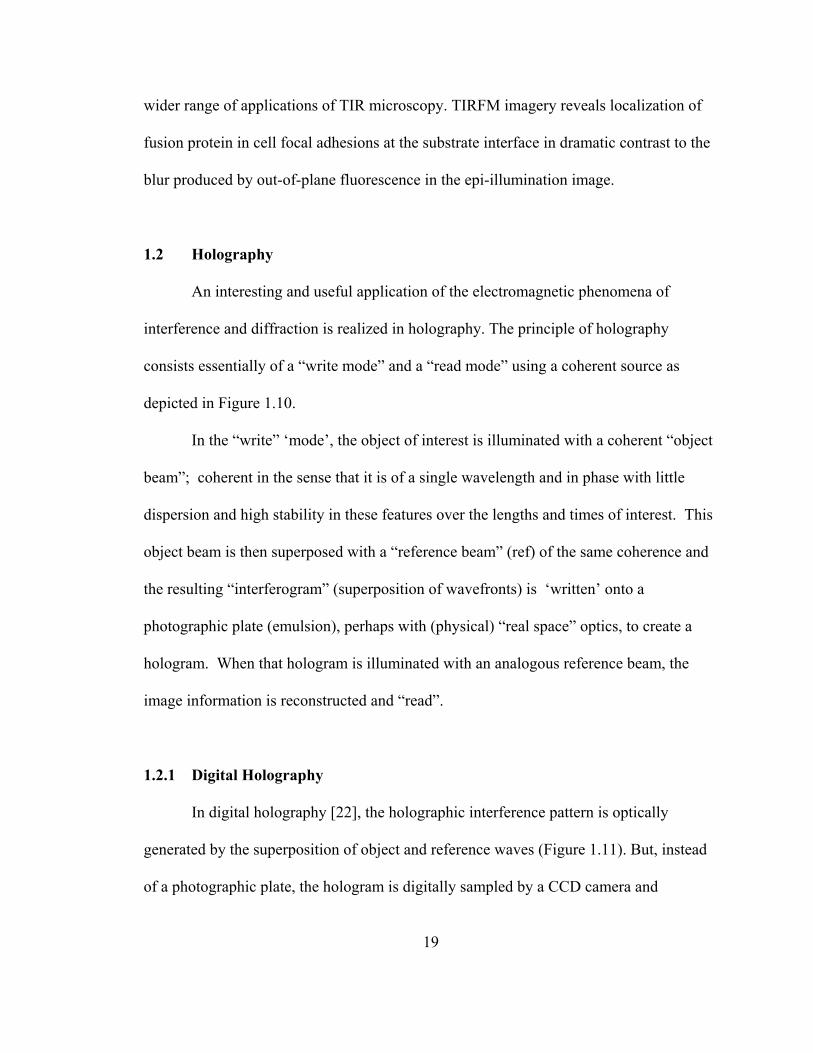
1.2 Holography
An interesting and useful application of the electromagnetic phenomena of
interference and diffraction is realized in holography. The principle of holography
consists essentially of a “write mode” and a “read mode” using a coherent source as
depicted in Figure 1.10.
In the “write” ‘mode’, the object of interest is illuminated with a coherent “object
beam”; coherent in the sense that it is of a single wavelength and in phase with little
dispersion and high stability in these features over the lengths and times of interest. This
object beam is then superposed with a “reference beam” (ref) of the same coherence and
the resulting “interferogram” (superposition of wavefronts) is ‘written’ onto a
photographic plate (emulsion), perhaps with (physical) “real space” optics, to create a
hologram. When that hologram is illuminated with an analogous reference beam, the
image information is reconstructed and “read”.
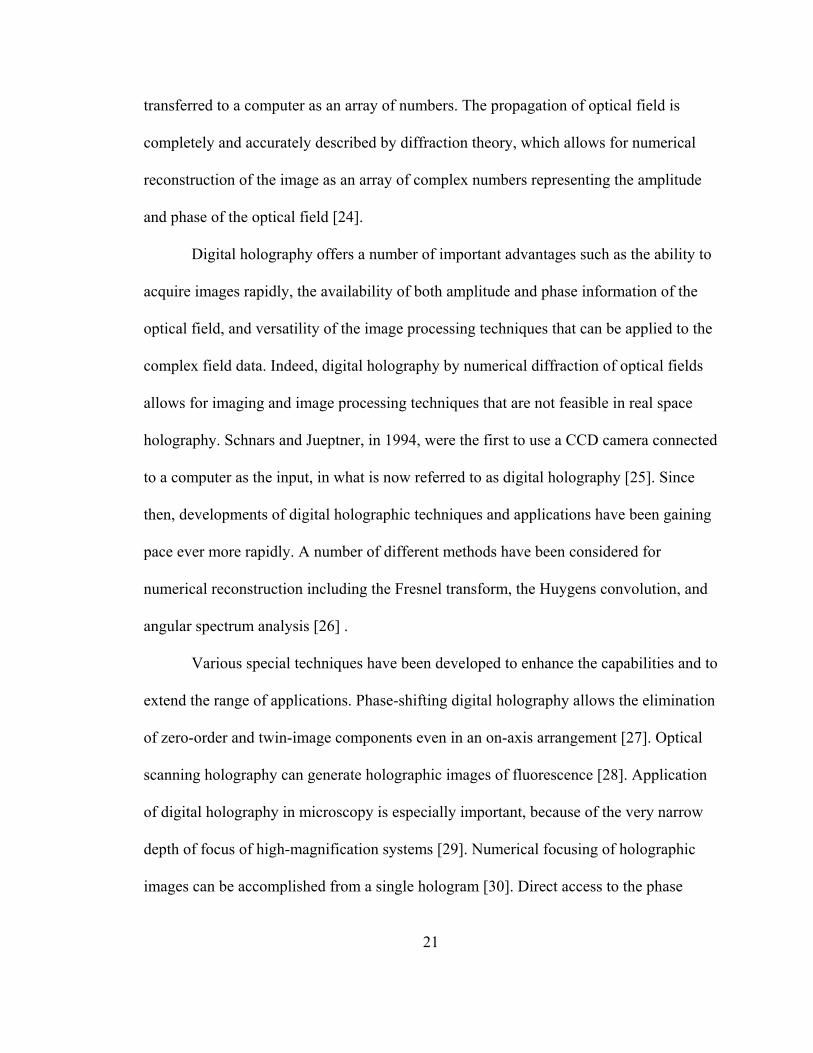
1.2.1 Digital Holography
In digital holography [22], the holographic interference pattern is optically
generated by the superposition of object and reference waves (Figure 1.11). But, instead
of a photographic plate, the hologram is digitally sampled by a CCD camera and
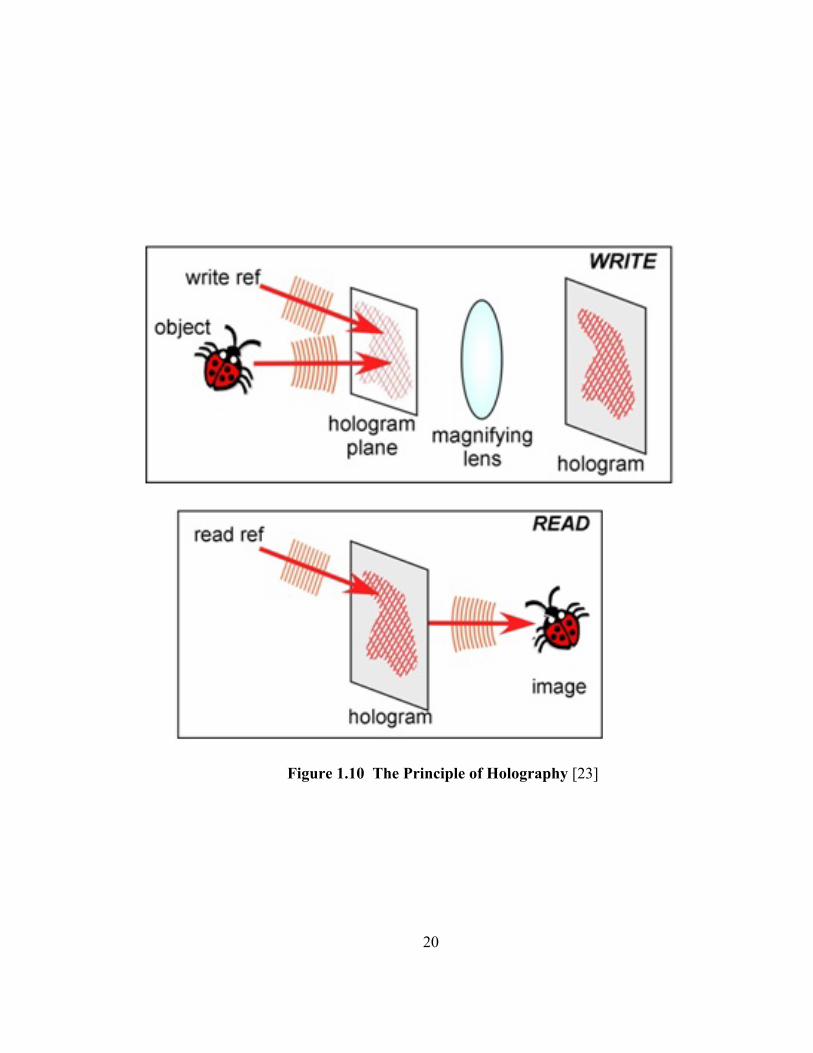
Figure 1.10 The Principle of Holography [23]
20
21
transferred to a computer as an array of numbers. The propagation of optical field is
completely and accurately described by diffraction theory, which allows for numerical
reconstruction of the image as an array of complex numbers representing the amplitude
and phase of the optical field [24].
Digital holography offers a number of important advantages such as the ability to
acquire images rapidly, the availability of both amplitude and phase information of the
optical field, and versatility of the image processing techniques that can be applied to the
complex field data. Indeed, digital holography by numerical diffraction of optical fields
allows for imaging and image processing techniques that are not feasible in real space
holography. Schnars and Jueptner, in 1994, were the first to use a CCD camera connected
to a computer as the input, in what is now referred to as digital holography [25]. Since
then, developments of digital holographic techniques and applications have been gaining
pace ever more rapidly. A number of different methods have been considered for
numerical reconstruction including the Fresnel transform, the Huygens convolution, and
angular spectrum analysis [26] .
Various special techniques have been developed to enhance the capabilities and to
extend the range of applications. Phase-shifting digital holography allows the elimination
of zero-order and twin-image components even in an on-axis arrangement [27]. Optical
scanning holography can generate holographic images of fluorescence [28]. Application
of digital holography in microscopy is especially important, because of the very narrow
depth of focus of high-magnification systems [29]. Numerical focusing of holographic
images can be accomplished from a single hologram [30]. Direct access to the phase
Figure 1.11. Digital Holography. I ª Interference wave, R ª Reference wave, O ª
Object wave, * ª complex conjugate
22
23
information facilitates numerical correction of various aberrations of the optical system,
such as field curvature and anamorphism [31].
Digital holography has been particularly useful in metrology, deformation
measurement, particle analysis, and vibrational analysis [32,33]. Applications of digital
holography for biological microscopy are being actively pursued [34-37]. Low-coherence
digital holography allows tomographic imaging [38]. Our University of South Florida
Digital Holography and Microscopy Laboratory (USF DHML) has developed digital
interference holography for optical tomographic imaging [39,40] as well as
multiwavelength phase contrast digital holography for high resolution microscopy [41-
43].
1.3 Sample cells
The sample cells used in this research are Amoeba Proteus (Figure 1.1A) [ 44
45], Dictyostelium Discoideum (myx)amoeba (Figure 1.12) [46-48], SKOV-3 ovarian
cancer (Figure 1.13) [49] and 3T3 fibroblast samples (figure 1.14) [50] and were chosen
based upon their availability, suitability, relative ease of use and, especially in the
instance of SKOV-3 and fibroblast, their importance to the field. The reader is
recommended to the references for methods of preparation.
Amoeba Proteus have been used for developmental characterization because of
their relative ease of use, their inherent interaction with the substrate and the time scale
of their motion. A drawback however, to the proteus amoeba is their size and constantly
changing aspect. While some are only a couple hundred microns in extent, some are
24
physically larger (~ 900µm) than the 10X field-of-view (FOV) that we are dealing with
here. A. Proteus are easily kept in the lab environment in cultures consisting essentially
of “pond-water” and fed with Chilomonas grown in-situ on bacteria colonies that seem to
do well with some daily aeration, but subsisting largely on “studied neglect” in low light
conditions.
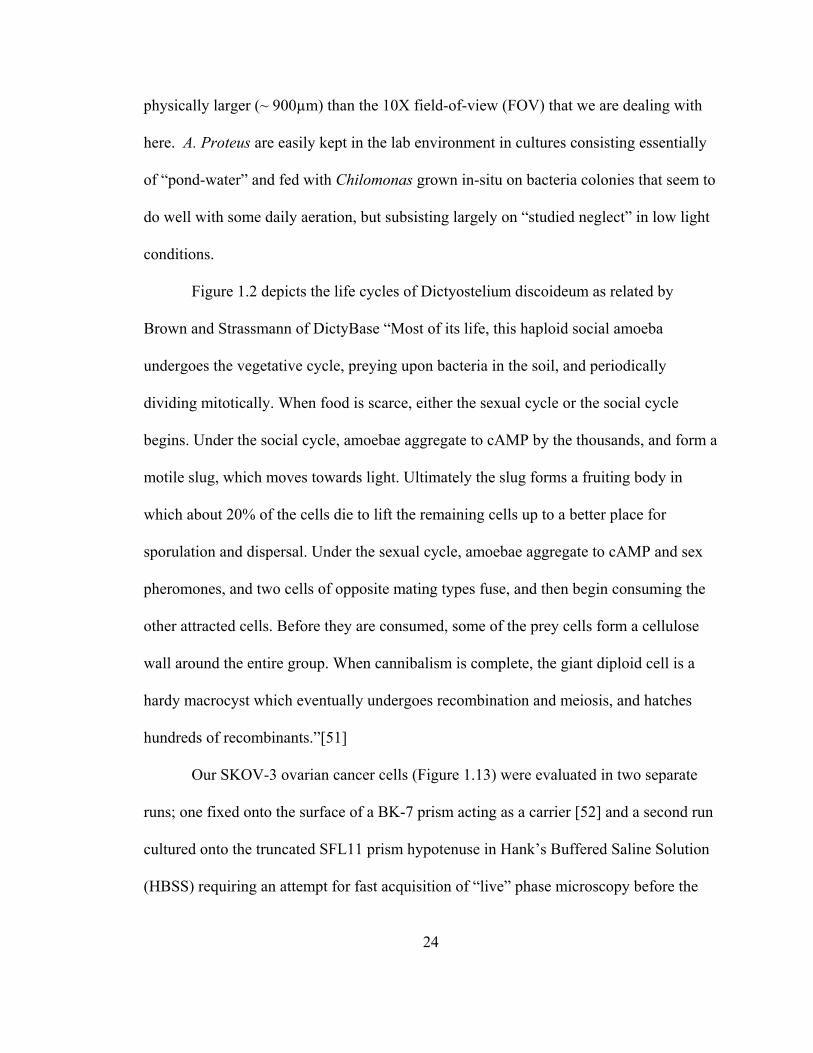
Figure 1.2 depicts the life cycles of Dictyostelium discoideum as related by
Brown and Strassmann of DictyBase “Most of its life, this haploid social amoeba
undergoes the vegetative cycle, preying upon bacteria in the soil, and periodically
dividing mitotically. When food is scarce, either the sexual cycle or the social cycle
begins. Under the social cycle, amoebae aggregate to cAMP by the thousands, and form a
motile slug, which moves towards light. Ultimately the slug forms a fruiting body in
which about 20% of the cells die to lift the remaining cells up to a better place for
sporulation and dispersal. Under the sexual cycle, amoebae aggregate to cAMP and sex
pheromones, and two cells of opposite mating types fuse, and then begin consuming the
other attracted cells. Before they are consumed, some of the prey cells form a cellulose
wall around the entire group. When cannibalism is complete, the giant diploid cell is a
hardy macrocyst which eventually undergoes recombination and meiosis, and hatches
hundreds of recombinants.”[51]
Our SKOV-3 ovarian cancer cells (Figure 1.13) were evaluated in two separate
runs; one fixed onto the surface of a BK-7 prism acting as a carrier [52] and a second run
cultured onto the truncated SFL11 prism hypotenuse in Hank’s Buffered Saline Solution
(HBSS) requiring an attempt for fast acquisition of “live” phase microscopy before the
Figure 1.12 The life cycles of Dictyostelium discoideum. (After Brown and
Strassmann)[51] Not drawn to scale.
25
26
cancer cells succumbed after cooling to room temperature from their preferred 37°C
incubation temperature. In Figure 1.13a) , please note the Zernike phase contrast image
provided for comparison to the digital holography images.
Our 3T3 fibroblast cells had a handling situation similar to the SKOV-3 in that
they were cultured live onto a BK7 prism as a carrier with phase microscopy attempted
before the sample cooled from incubation temperature (37°C) to the laboratory
environment (25°C) the 3T3 being even less robust than the SKOV-3 cells. Figure 1.11 is
an image captured by the author at the University of Illinois GEM4 workshop
1.5 Dissertation Overview
This work may be understood as integrating near-field microscopy with digital
holography to produce a new form of phase contrast microscopy intended to help
understand how cells adhere, how they travel, and what they do, (chemo)mechanically
speaking, when they arrive at their destination. This dissertation presents all of the basic
theory and principles of TIRHM as they relate to near field phase microscopy and digital
holography, how the angular spectrum is implemented, and the physics involved.
Herein, I present the near field of Fresnel reflection theory and the angular
spectrum method (ASM) of digital holography. Phase shifts from relative refractive index
(RRI) and frustrated TIR (f-TIR) resulting from the presence of focal adhesions and cell-
substrate interfaces on the prism’s sensing face modulate the object beam’s evanescent
wave phase front. As will be demonstrated, it is these phase shift properties that we make
use of in TIRHM to make it a form of quantitative surface imagery derived from
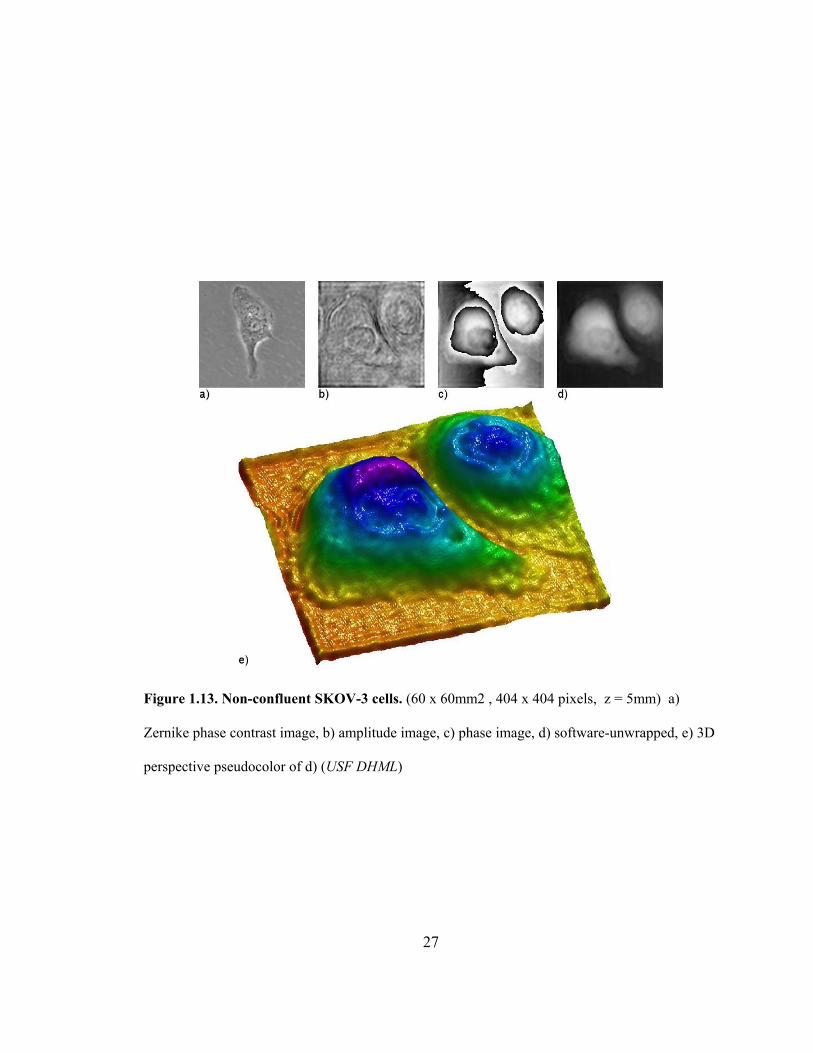
Figure 1.13. Non-confluent SKOV-3 cells. (60 x 60mm2 , 404 x 404 pixels, z = 5mm) a)
Zernike phase contrast image, b) amplitude image, c) phase image, d) software-unwrapped, e) 3D
perspective pseudocolor of d) (USF DHML)
27
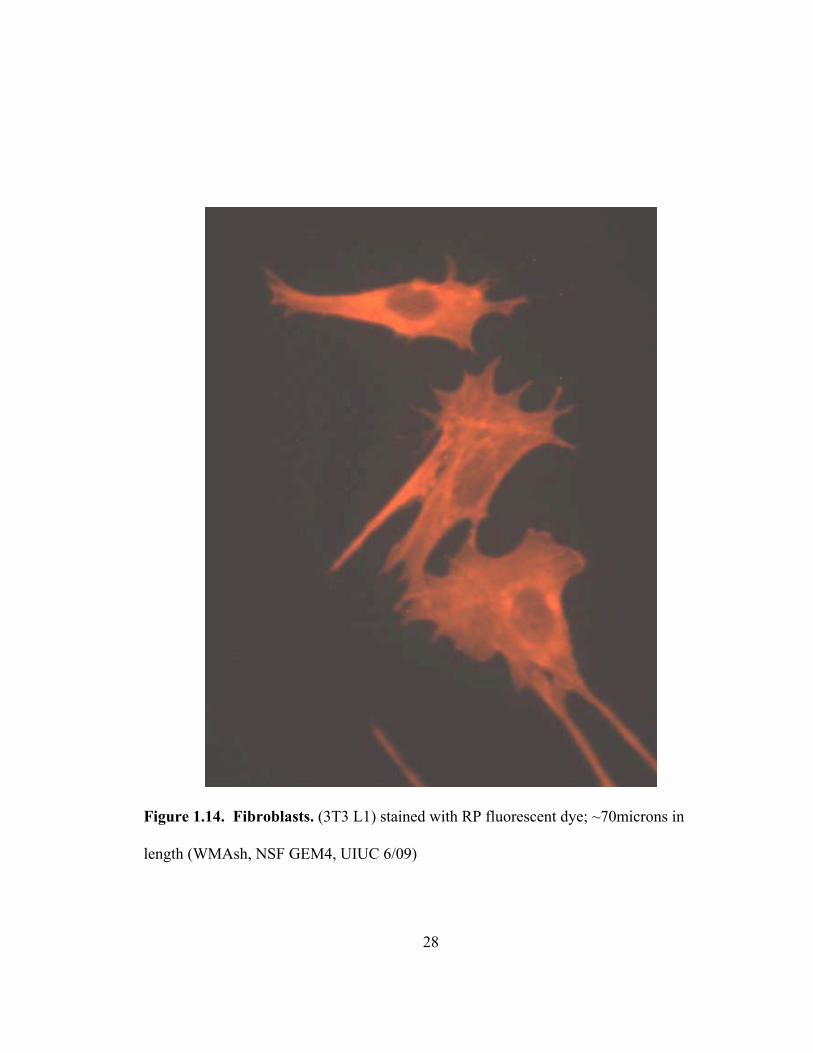
Figure 1.14. Fibroblasts. (3T3 L1) stained with RP fluorescent dye; ~70microns in
length (WMAsh, NSF GEM4, UIUC 6/09)
28
29
evanescent wave phase shift holography. Subsequent processing by digital holography
allows for quantitative phase imaging and measurement of the sample features’ surface
profile based on assumptions of the objects structure and composition.
TIRHM imaging makes use of the ‘total’ internal reflection, meaning that
essentially all of the input photons participate in the formation of the image signals, and
therefore the input optical power can be kept at minimal level. We have demonstrated a
Mach-Zehnder TIRHM system that uses a prism in TIR as a near-field imager in its
object arm. We have demonstrated these imaging principles of TIRHM using model
objects of liquid droplets and spherical surface of known material and shape, and the
results indicate distinct capabilities and potential strengths in biomedical cellular
microscopy and other applications. System implementation of hardware and software, it’s
imaging modes, and our results for Amoeba Proteus, Dictyostelium Discoideum
myxamoeba, SKOV-3 ovarian cancer, and 3T3 Fibroblast cells are also presented.
The TIRHM system has undergone evaluation of critical performance parameters,
displaying a resolution capability nearly inherent to that of the microscope objective
used. We find this new technique described herein, total internal reflection holographic
microscopy (TIRHM), to be an inherently quantitative tool and offer it as a means of
measuring surface profiles with direct applicability in characterizing cellular adhesion
and migration, as well as other biomedical applications and ‘nanometrics’ in general.
Based upon this performance, it is fully anticipated that near term applications include
measurement of cellular adhesion and motility attributes, particularly those important to
30
understanding embryogenesis, morphogenesis and cancer metastasis, without the need to
introduce stains or fluorophores.
I have attempted to organize this dissertation in as logical and familiar a fashion
as possible. After a sufficiently rigorous development of TIRHM theory from first
principles, I will discuss the experimental methods in detail and present all of the
pertinent results to date. Following the experiments is a discussion of important
principles, what conclusions we can draw from this research, and the promise of future
work. It is hoped that the reader will largely agree with the findings herein and perhaps
choose to encourage investigation in complementary efforts.
31
CHAPTER 2
THEORY
The theory behind digital holography is well understood and characterized.
Furthermore, we have demonstrated that it is possible to couple phase information from a
near field evanescent sensing wave produced by Total Internal Reflection (TIR) into the
object beam signal of a holographic imager and that the digital holography of total
internal reflection is described by Fresnel reflection theory as anticipated. In our cellular
imaging application here, the presence of focal adhesions and cell-substrate interfaces on
the prism’s sensing face cause relative refractive index (RRI) phase shifts and frustrated
TIR (f-TIR) that modulates the object beam’s evanescent wave phase front thus
producing a form of quantitative phase microscopy.
2.1 Total Internal Reflection (TIR)
From Snell’s Law, it is well known and characterized that when light is incident
from inside of a higher-index medium n1, into a lower-index medium n2, with an angle of
incidence greater than the critical angle given by θc = sin-1 (n2/n1), the incident light is
reflected back into the first medium. The TIR effect may be easily viewed while
submerged under water and looking back up at the surface at an angle, for instance.
Under TIR, light does not propagate into the second medium except for an
evanescent wavefield, whose amplitude decays exponentially over a distance a fraction of
a wavelength (~ λ / 3). If another medium, ncell is present (as in Fig. 2.1), we shall see
that a form of frustrated TIR (f-TIR) can take place.
This ‘evanescent’ exponentially decaying wave field is set up in order that the
electromagnetic fields remain continuous at the interface, extends into the second
medium and propagates parallel to the interface. The phase shift and reflectance
variations are effective within the penetration depth of about, or about 200 nm if we use
600 nm light. The phase variation therefore can be used to make precise measurements of
the interface thickness and characteristics within a few hundred nm. Note that the phase
profile of light reflected from an object can be readily obtained by digital holography, a
unique and powerful capability that digital holography enjoys over other techniques.
An understanding of total internal reflection (TIR) as described by Fresnel reflection
theory is instrumental in seeing how interactions in the resultant near-field modulate the
phase of the incident light. It is this phase modulation that, when coupled with digital
holographic microscopy, allows for the quantitative near-field phase microscopy of
TIRHM. Consider reflection of light, of vacuum wavelength 0λ , across a boundary
between two dielectric media with indices and . The reflection coefficients are given 1n 2n
32
Fig. 2.1 Geometry of TIR evanescent wave surface sensing. When an
evanescent wavefront (dotted line ····) is formed at suitable glass-air interface,
angle of incidence θi > θc, a “TIR frustrating” (f-TIR) sample surface (ncell)
introduces optical path difference information as a phase shift. A is the plane of
the prism sensing face, H is the hologram plane. Note: the evanescent field is
NOT to scale.
33
by the familiar Fresnel equations:
1 1 2 2 2 1 1
1 1 2 2 2 1 1
cos cos cos cos;cos cos cos cos
n n n nr rn n n n
2
2
θ θ θ θθ θ θ⊥ θ− −
= =+ +
2
(2.1.1)
for the s-polarization ( ) and the p-polarization ( ), respectively. For internal reflection,
, if the angle of incidence
r⊥ //r
1n n> 1θ is larger than the critical angle (1
2 1sinc n nθ −= ) , then
the reflectance 2R r= becomes unity in total internal reflection (TIR) and 2cosθ is
imaginary. Defining
2
2 1
2 22 2 1 2cos sinh n i n n i 2θ θ= −= η= (2.1.2)
the reflection coefficients become complex:
( )2
11 12
1 1 1 1
2 21 sin
exp 2 tan tancos cos
;n n
r in n
θηϕ ϕ
θ θ− −
⊥ ⊥ ⊥
−= − = = 2 (2.1.3)
( )2
1 11 11// // //
1 1
2 212
2 22 2
sinexp 2 tan tan
cos cos;
n n nnr i
n n
θηϕ ϕ
θ θ− −
−= − = = 2 (2.1.4)
There is no propagating wave in transmission, but a thin layer of evanescent wave exists
that decays exponentially, ( )0 2exptE k zη∝ − , where 0 2 /k 0π λ= and is the distance
from the interface. Figure 2.2 (a) shows the reflectance R = |r|
z
2 vs. angle of incidence θ1,
while Fig. 2.2 (b) is the reflection phase ϕ vs. 1θ for the relative index 1 2 1.517n n = . One
34
notes the Brewster angle at 33° and the critical angle at 41°.
35
°
While the reflection phase is only zero or 180° for non-TIR Fresnel reflection,
beyond the critical angle the reflection phase decreases continuously and monotonically
from 0 to for both cases of polarization. Figure 2.2 (c) illustrates the reflection
phase of s-polarization for a few values of the relative index, with n
180−
1 = 1.517 and 1.000,
n2 = 1.333, 1.382, 1.432, and 1.458. Here the n1 value represents the BK7 glass prism
and the n2 values are for air, water, 50/50 mixture of water and ethylene glycol, pure
ethylene glycol, and fused quartz, respectively, which are the materials used in the
measurements below. For a given angle of incidence, for example 72° shown as dotted
line in Fig. 2.2 (c), the phase of TIR-reflected light will vary with n2 the index of
refraction of the second medium. This suggests one possible mode of TIR imaging,
where the phase profile of the TIR-reflected light reveals the variation of index of
refraction of material in contact with the prism.
Another imaging mode makes use of the frustrated TIR (fTIR) that occurs when a
third layer of index n3 is brought close to the interface within the thickness of the
evanescent wave. (Here we use the term frustrated TIR in a general sense that includes
any disturbance, in amplitude or phase, of TIR by the presence of another interface
within the evanescent field.) Referring to the geometry of Fig. 2.3, light is incident from
the n1 medium and undergoes reflection at the two interfaces, n1/n2 and n2/n3.
a) b) c)
Fig. 2.2. a) Reflectance R and b) reflection phase, phi (φ in text) vs. angle of
incidence, theta1 (θ1 in text) for the relative index, n1/n2 = 1.517. [red: s-
polarization; blue: p-polarization] c) Reflection phase of s-polarization vs. angle of
incidence for various relative indices: n1 = 1.517; n2 = 1.000 (red), 1.333 (blue),
1.382 (green), 1.432 (purple), 1.458 (black).
36
The reflection coefficient, for s-polarization, is found to be
( )( ) ( )( ) (( )( ) ( )( ) (
))
1 2 2 3 1 2 2 3 0 21
1 1 2 2 3 1 2 2 3 0 2
exp 2
exp 2
h h h h h h h h i hEr
E h h h h h h h h i h
ϕ
ϕ⊥
⊥
′ − + + + −= =
+ + + − −
⎛ ⎞⎜ ⎟⎝ ⎠
(2.1.5)
where 2
1
2 21cos sinii i ih n n nθ θ== − and . For illustration, if we take 1.517
(glass), 1.000 (air), and
0 0k zϕ = 0 1n =
2n = 3n = 1.458 (quartz), then the critical angles for the 1 2n n and
1 3n n interfaces are and , respectively. ,12 41cθ = ° ,13 74cθ = °
The reflectance 2R r= and reflection phase ϕ are graphed in Figs. 2.4(a) and 2.4
(b), respectively, as two-dimensional functions of the angle of incidence 1θ and the -
layer thickness . Figure 2.4(c) is an expanded view of the dotted-box area of Fig.
2.4(b), showing details of the subtle and rapid variation of phase over a short distance of
. Figures 2.4(d) and 2.4(e) are graphs of
2n
0z
0z ( )0R z and ( )0zϕ , respectively, for several
values of 1θ . Figure 2.4(f) is an expanded view of the dotted-box area of Fig. 2.4(e). As
indicated in Fig. 2.4, there are three distinct ranges of 1θ for consideration:
Case I: When 1 ,12 ,,c c 13θ θ θ< , r is real and both the reflectance and reflection phase display
the oscillatory characteristics of thin film interference, as shown in Fig. 2.4 for 1 41θ < ° .
37
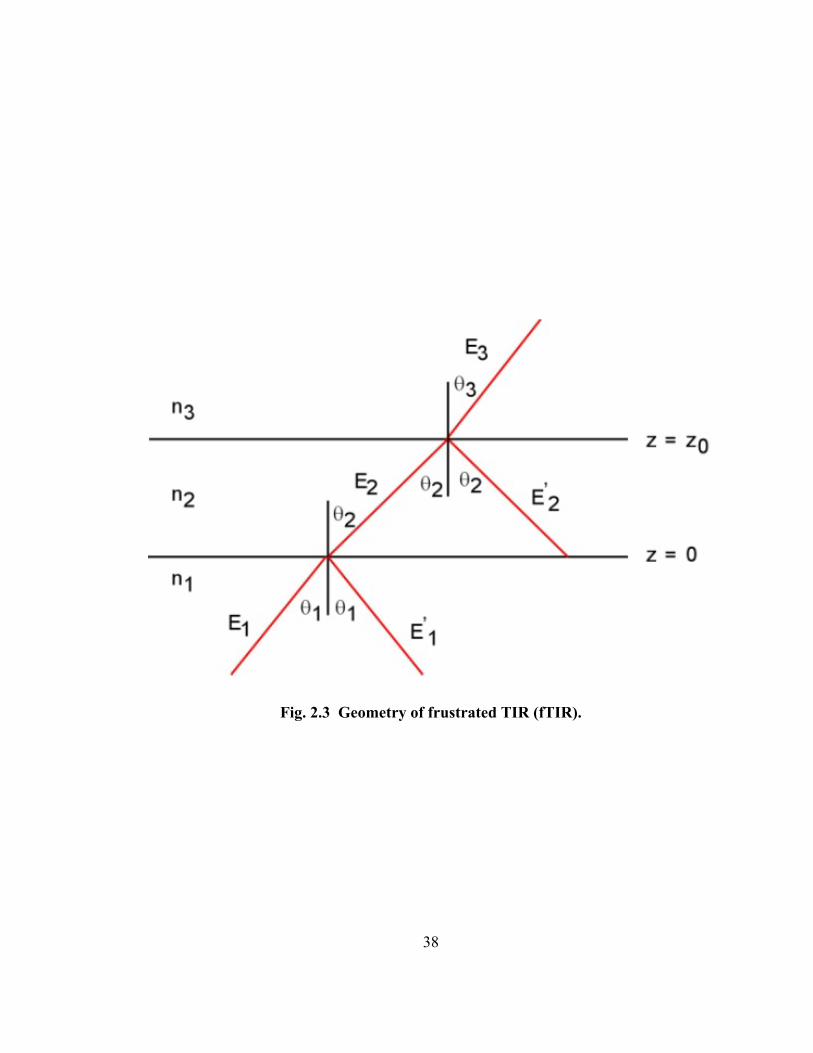
Fig. 2.3 Geometry of frustrated TIR (fTIR).
38
Case II: When ,12 1 ,13c cθ θ θ<< , the 1 2n n interface is in TIR ( 2h i 2η= becomes imaginary),
but the 1 3n n interface is not, and the overall reflection coefficient becomes
( )( ) ( )( ) (( )( ) ( )( ) (
))
1 2 3 1 2 2 3 0 21
1 1 2 2 3 1 2 2 3 0
2 exp 2
exp 2
h i i h h i i hEr
E h i i h h i i h 2
η η η η ϕ η
η η η η⊥
⊥
′ − + + + − −= =
+ + + − − −
⎛ ⎞⎜ ⎟⎝ ⎠ ϕ η
°
(2.1.6)
This is the conventional narrow definition of fTIR, where the evanescent field couples into
the third medium and becomes a propagating field. For sufficiently short , a fraction of
wavelength, the reflectance is substantially reduced and the reflection phase varies
monotonically with , as shown in Fig. 2.4 for
0z
0z 141 74θ° << . This is the regime where
‘conventional’ TIR imaging methods operate, such as TIR fluorescence microscopy, making
use of the amplitude changes in fTIR. Amplitude images can also be obtained using digital
holography such that outlines of an object in contact on the surface
appear as dark areas against bright background, and the darkness would be a measure of
the layer thickness . 0z
Case III: It is possible to make use of phase-only changes in fTIR if the angle of
incidence is large enough for TIR of both 1 2n n and 1 3n n interfaces, ,12 ,13 1,c cθ θ < θ . Then
39
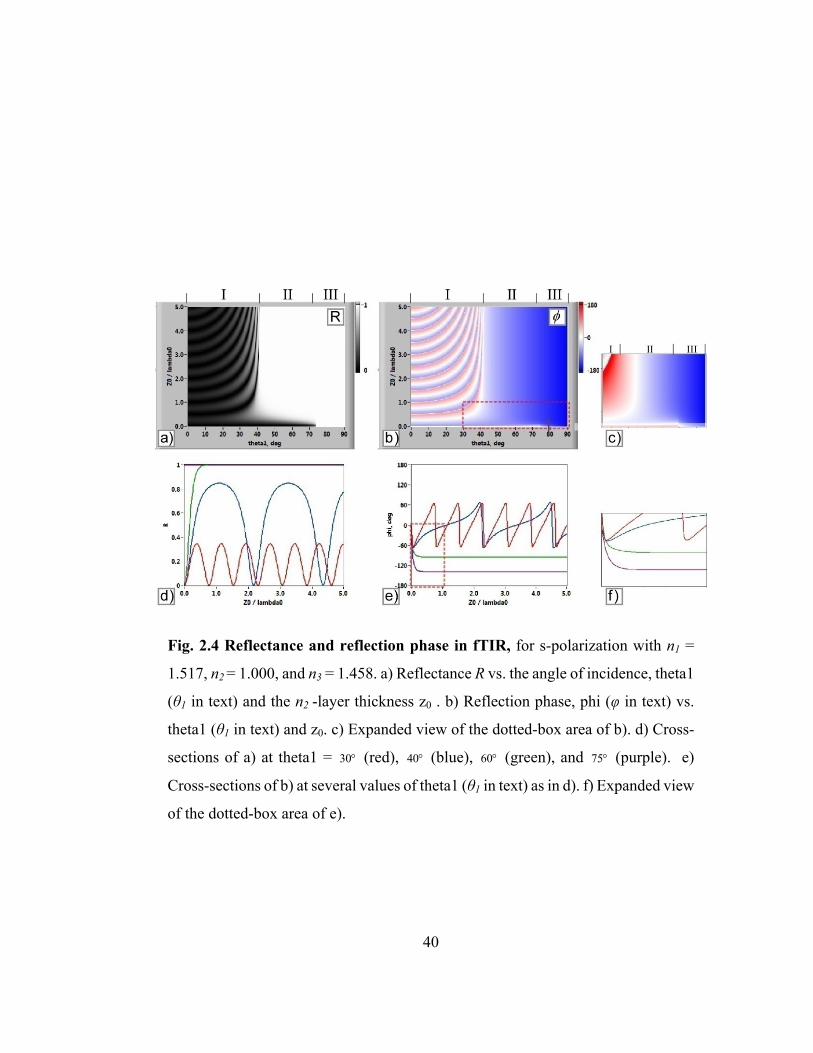
Fig. 2.4 Reflectance and reflection phase in fTIR, for s-polarization with n1 =
1.517, n2 = 1.000, and n3 = 1.458. a) Reflectance R vs. the angle of incidence, theta1
(θ1 in text) and the n2 -layer thickness z0 . b) Reflection phase, phi (φ in text) vs.
theta1 (θ1 in text) and z0. c) Expanded view of the dotted-box area of b). d) Cross-
sections of a) at theta1 = (red), (blue), (green), and (purple). e)
Cross-sections of b) at several values of theta1 (θ
30° 40° 60° 75°
1 in text) as in d). f) Expanded view
of the dotted-box area of e).
40
41
3 3h iη= also becomes imaginary and
( )( ) ( )( ) (( )( ) ( )( ) (
))
1 2 2 3 1 2 2 3 0 21
1 1 2 2 3 1 2 2 3 0
exp 2
exp 2
h i h iEr
E h i h i 2
η η η η η η ϕ η
η η η η η η ϕ η⊥
⊥
′ − + + + − −= =
+ + + − − −
⎛ ⎞⎜ ⎟⎝ ⎠
(2.1.7)
Then the reflectance R is identically unity. But in this case, the phase varies with 1θ and
, as seen in Fig. 2.4 for 0z 174 θ° < , where for less than a fraction of wavelength, the 0z
phase varies monotonically and rapidly. This can be used to provide a sensitive measure
of the thickness of the -layer over a range of 100 nm or less. 2n
This suggests one possible mode of TIR imaging, where the phase profile of the TIR-
reflected light reveals the variation of index of refraction of material in contact with the
prism (Figure 2.5a). On the other hand, it is possible to make use of phase-only changes in
fTIR if the angle of incidence is large enough for TIR of both n1 / n2 and n1 / n3 interfaces.
Then the reflectance R is identically unity. But the phase does vary with q1 and d, where for
d less than a fraction of wavelength, the phase varies monotonically and rapidly. This can be
used to provide a sensitive measure of the thickness of the n2 -layer over a range of 100 nm
or less.
So we see that two imaging modes of total internal reflection are possible, based
on quantitative phase microscopy by digital holography. In one (Figure 2.5a), the
reflection phase profile results from variation of refractive index of an object of
inhomogeneous optical property in contact with the prism.
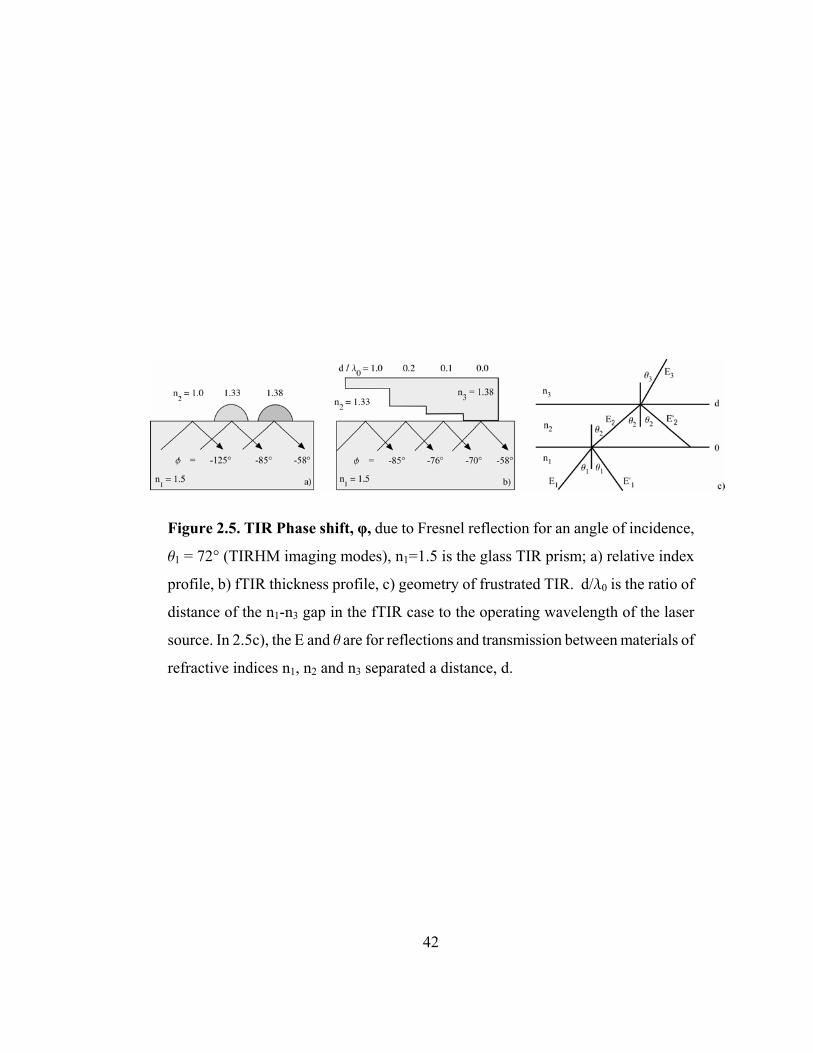
Figure 2.5. TIR Phase shift, φ, due to Fresnel reflection for an angle of incidence,
q1 = 72° (TIRHM imaging modes), n1=1.5 is the glass TIR prism; a) relative index
profile, b) fTIR thickness profile, c) geometry of frustrated TIR. d/l0 is the ratio of
distance of the n1-n3 gap in the fTIR case to the operating wavelength of the laser
source. In 2.5c), the E and q are for reflections and transmission between materials of
refractive indices n1, n2 and n3 separated a distance, d.
42
43
For example, as in Figure 2.5a), a phase profile between air (n=1.00) and a water
droplet (n=1.33) on the prism surface (n1=1.5, q1 = 72°) would show a shift in reflected
phase from φair/n1 = -125° to φwater/n1 = -85° or Δφ = φwater/n1 - φair/n1 = -85° - (-125°) = 40°
(or 0.7 radians) across the air water boundary on the prism surface. A biological cell
(n=1.38), for example, in complete contact with the prism surface can thus be imaged to
reveal it’s interface with the prism substrate. In the other mode (Figure 2.5b), the
reflection phase profile reflects the gap distance between the surfaces of the prism and an
object placed on the prism. For example, a biological cell in locomotion can reveal the
profile of protrusion of pseudopodia, formation of focal adhesion, development of
traction, and release of adhesion.
2.2 The principle of digital holography; the Angular Spectrum Method
As the basis for digital holography, numerical diffraction may be described the
Huygens Convolution, the Fresnel Transform method and the angular spectrum method
(ASM). The digital holographic technique used in this work is based upon the Angular
Spectrum Method, synonymously (and aptly) termed ‘plane wave decomposition’. In
ASM, the holographic image is numerically converted into Fourier space, filtered and
reconstructed at the appropriate distance (to be in focus, for instance). The calculation of
the optical field as an array of complex numbers directly yields the phase profile of the
object signal as a monotonic function. ASM inherently lends itself to performing the un-
tilting processing as part of the algorithm.
There are a number of advantages in using the angular spectrum algorithm over
the more commonly used Fresnel transform or the Huygens convolution methods; they
are consistent pixel resolution, no minimum reconstruction distance, easy filtering of
noise and background components and computational efficiency. Once the angular
spectrum at z = 0 is calculated by a Fourier transform, the field at any other z-plane can
be calculated with just one more Fourier transform, whereas the Fresnel or convolution
methods require two or three Fourier transforms for each value of z. The theory behind
digital holography is well understood and characterized, particularly for the Angular
Spectrum Method (ASM).
Specifically, suppose EΣ0 (x, y) represents the two-dimensional optical E-field at
the hologram plane Σ0 which we wish to filter and propagate to the image plane Σ. Given
an input field EΣ0 (x, y) from the CCD hologram, the input spectrum is:
0 0 0x y x y F (k , k ) = { E } = E (x, y) exp[ -i(k x + k y)]dxdyΣ Σ Σ∫∫F (2.2.1)
Where kx and ky are the spatial frequencies and k = 2π/λ. The input field of course comes
back out with the inverse Fourier transform as:
0 0 0 x y x y E (x, y) = { F } = F (k , k ) exp[i(k x + k y)]x ydk dkΣ Σ Σ∫∫-1F (2.2.2)
44
Written in terms of plane wave components:
x y z = exp i[k·r] = exp[ i(k x + k y +k z)]ψ (2.2.3) where
(2.2.4) 2 2 2 ½z x y z x yk = [k - k - k ] = k (k , k )
Such that a plane wave on Σ0 looks like:
0 x y= ( 0) = exp[ i(k x + k y)]zψ ψΣ = (2.2.5)
and a plane wave on Σ can be expressed as:
0x y z = ( ) = exp ( x + y + Z)] = exp [ ]zz Z i k k k i k Zψ ψ ψΣ Σ= (2.2.6)
The output field at Σ is now :
(2.2.7) 0 x y z x y E (x, y) = F (k , k ) expi[k Z]exp[i(k x + k y)] { F }x ydk dkΣ Σ∫∫ -1 = F Σ
with the anticipated efficiency in transform calculations. Furthermore, we will take
advantage of this inherent topology of the ASM when we proceed to image the inclined
plane imposed by the TIR sensing geometry. One of the reasons ASM is used in this
45
research is due to its algorithmic utility; the angular spectrum method allows the
reconstruction software to compensate for tilt anamorphism due to the inclined TIR
plane.
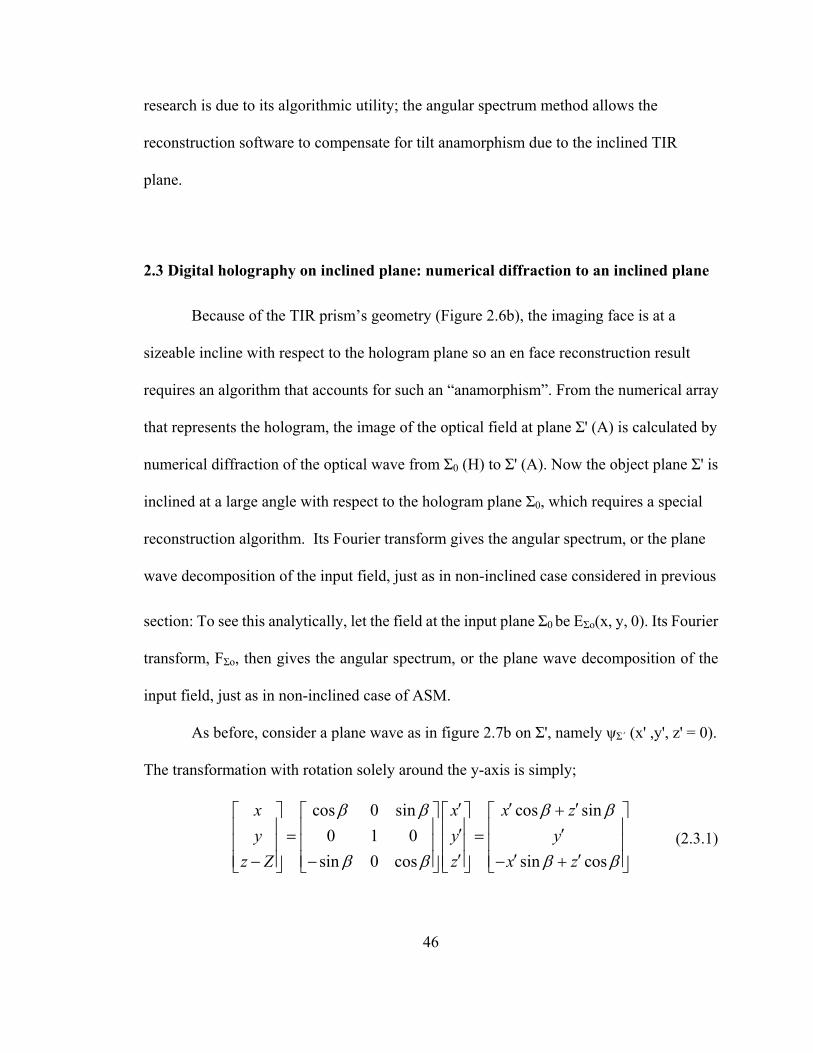
2.3 Digital holography on inclined plane: numerical diffraction to an inclined plane
Because of the TIR prism’s geometry (Figure 2.6b), the imaging face is at a
sizeable incline with respect to the hologram plane so an en face reconstruction result
requires an algorithm that accounts for such an “anamorphism”. From the numerical array
that represents the hologram, the image of the optical field at plane Σ' (A) is calculated by
numerical diffraction of the optical wave from Σ0 (H) to Σ' (A). Now the object plane Σ' is
inclined at a large angle with respect to the hologram plane Σ0, which requires a special
reconstruction algorithm. Its Fourier transform gives the angular spectrum, or the plane
wave decomposition of the input field, just as in non-inclined case considered in previous
section: To see this analytically, let the field at the input plane Σ0 be EΣo(x, y, 0). Its Fourier
transform, FΣo, then gives the angular spectrum, or the plane wave decomposition of the
input field, just as in non-inclined case of ASM.
As before, consider a plane wave as in figure 2.7b on Σ', namely ψΣ´ (x' ,y', z' = 0).
The transformation with rotation solely around the y-axis is simply;
46
zy
cos 0 sin cos sin0 1 0
sin 0 cos sin cos
x x xy y
z Z z x z
β β β β
β β β β
′ ′ ′+⎡ ⎤ ⎡ ⎤ ⎡ ⎤ ⎡⎢ ⎥ ⎢ ⎥ ⎢ ⎥ ⎢′ ′= =⎢ ⎥ ⎢ ⎥ ⎢ ⎥ ⎢
′ ′ ′⎢ ⎥ ⎢ ⎥ ⎢ ⎥ ⎢− − − +⎣ ⎦ ⎣ ⎦ ⎣ ⎦ ⎣
⎤⎥⎥⎥⎦
(2.3.1)
so,
47
z
exp [ ] |
exp [ ( cos ) ( sin )]
exp [( cos sin ) ]exp [ ]
x y z
x y z
x z y
i k x k y k z
i k x k y k Z x
i k k x k y i k Z
ψ
β
β β
′ ′Σ Σ= + +
′ ′ ′= + + −
′ ′= − +
β (2.3.2)
And the output field on Σ' is just:
(2.3.3) 0
0
0
( , ) ( , )
( , ) exp [( cos sin ) ]exp [ ]
exp [ ] ( , ) exp [( cos sin ) ]exp [ ]
x y x y
x y x y x z y z
y y x x y x z z
E x y dk dk F k k
dk dk F k k i k k x k y i k Z
dk i k y dk F k k i k k x i k Z
ψ
β β
β β
′ ′Σ Σ Σ
Σ
Σ
′ ′ =
′ ′= − +
′ ′= −
∫∫∫∫∫ ∫
Where
0 0( , ) ( , ) exp[ ( )]x y x yF k k dxdyE x y i k x k yΣ Σ= − +∫∫ (2.3.4)
is simply the Fourier transform of the field at the input plane, Σ0.
Recombination of the plane wave components at the output plane then yields the
resultant diffraction field in an integration over kx which in general is not a Fourier
transform, and therefore can be handled by direct summation of the array, whereas the
integration over ky is an inverse Fourier transform and therefore fast Fourier transform
(FFT) is available. The algorithm provides exact (non-approximated) results with a
reasonable compromise in computation speed.
Numerical diffraction on to an inclined plane has been attempted with several
techniques [52-54], but since existing algorithms are either very slow or provide only
approximate solutions for small inclination angles, we have developed this more general
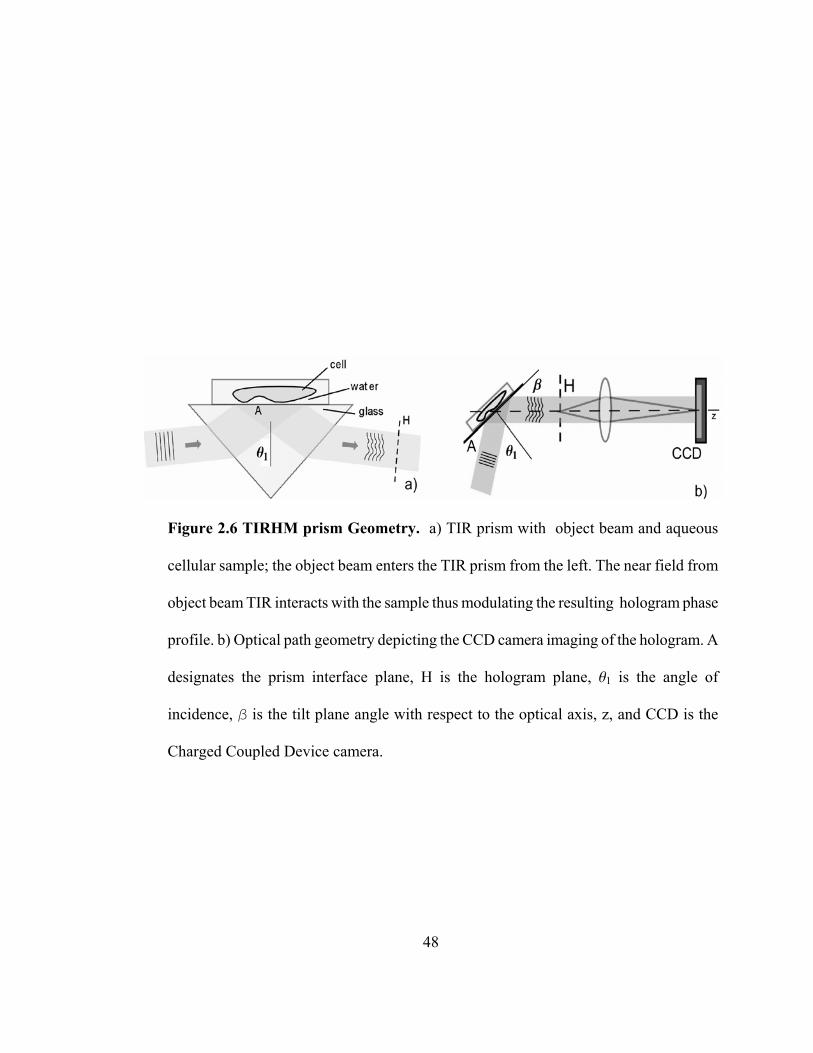
Figure 2.6 TIRHM prism Geometry. a) TIR prism with object beam and aqueous
cellular sample; the object beam enters the TIR prism from the left. The near field from
object beam TIR interacts with the sample thus modulating the resulting hologram phase
profile. b) Optical path geometry depicting the CCD camera imaging of the hologram. A
designates the prism interface plane, H is the hologram plane, q1 is the angle of
incidence, β is the tilt plane angle with respect to the optical axis, z, and CCD is the
Charged Coupled Device camera.
48
49
angular spectrum algorithm. The Angular Spectrum Method (ASM) of digital holography
is used in this technique is due to its algorithmic utility; among its other strengths, the
angular spectrum method allows the reconstruction software to compensate for tilt
anamorphism due to hypotenuse face/TIR plane inclination and prism optical path.
Figure 2.8 is offered as a conceptual representation of how TIRHM images
cellular adhesion in the near-field. The adhesion is formed by components of cellular
membrane, here depicted as a phospolipid bilayer, in the range of the near field where
phase shifts due to RRI and f-TIR field modulation are carried forward by the object
beam
into the hologram. When the hologram is reconstructed numerically the phase information
becomes available for the production of a phase image of the substrate-adhesion interface.
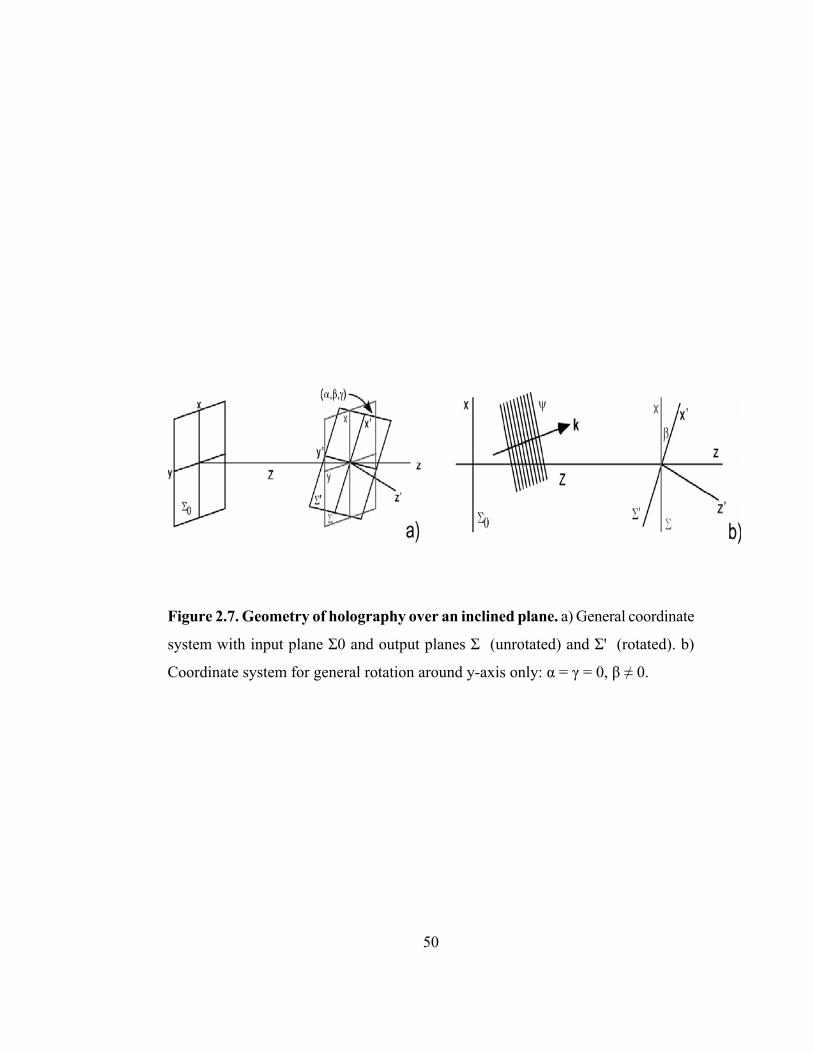
Figure 2.7. Geometry of holography over an inclined plane. a) General coordinate
system with input plane Σ0 and output planes Σ (unrotated) and Σ' (rotated). b)
Coordinate system for general rotation around y-axis only: α = γ = 0, β ≠ 0.
50
51
CHAPTER 3
EXPERIMENTAL SETUP
One can imagine how this research progressed over the years from January of
2007 to the Spring of 2010. The system itself can broadly be understood as an initial
breadboard unit (System I) which, as a result of lessons learned by empirical
implementation of theory, eventually matured into a cage-based unit pinned to a vertical
plate (System II). Table 3.3 is included at the end of this chapter depicting milestones of
significance in the project’s timeline.
3.1 TIR Prism
The heart of the TIRHM system is its prism upon whose hypotenuse face the
sample rests. (Please see Figure 3.1) The object beam enters a short face, goes into TIR
at the hypotenuse face setting up the near field and reflecting to exit the second short
face. The interferometer and all fixturing are built around the prism to keep it positioned
horizontally in the object beam at the correct angle of incidence allowing the hologram to
be created, modulated by the TIR near-field and imaged by the CCD camera. Note that
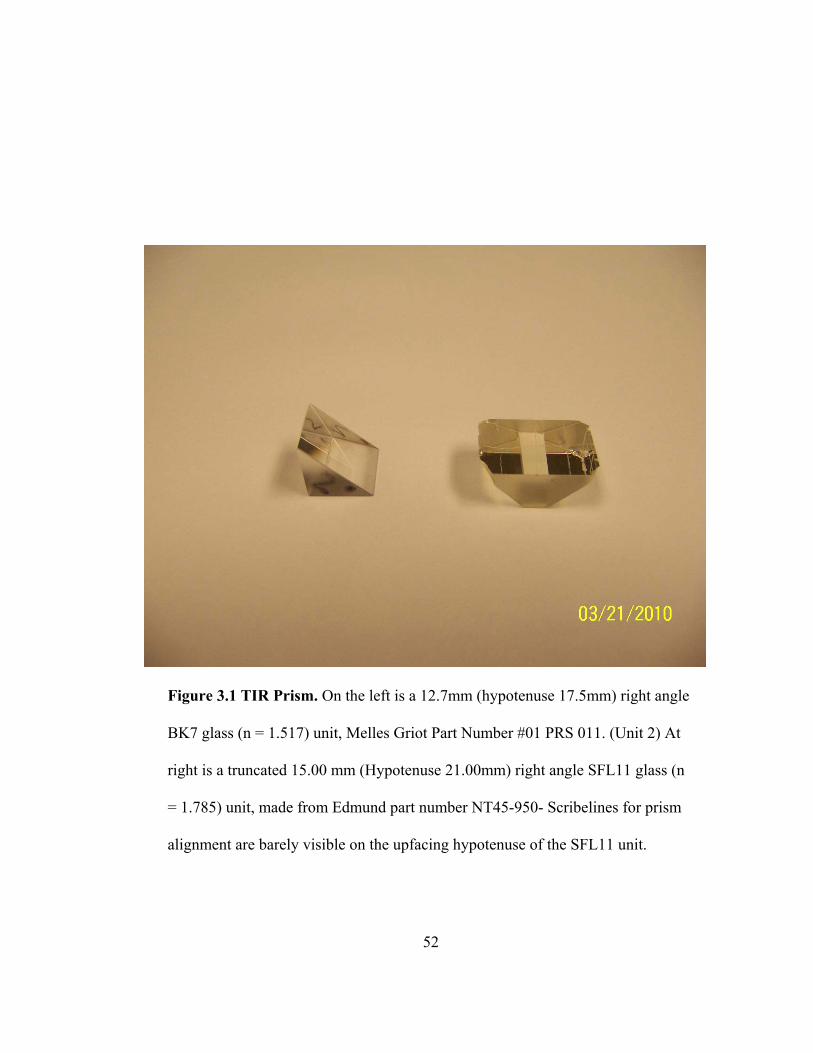
Figure 3.1 TIR Prism. On the left is a 12.7mm (hypotenuse 17.5mm) right angle
BK7 glass (n = 1.517) unit, Melles Griot Part Number #01 PRS 011. (Unit 2) At
right is a truncated 15.00 mm (Hypotenuse 21.00mm) right angle SFL11 glass (n
= 1.785) unit, made from Edmund part number NT45-950- Scribelines for prism
alignment are barely visible on the upfacing hypotenuse of the SFL11 unit.
52
53
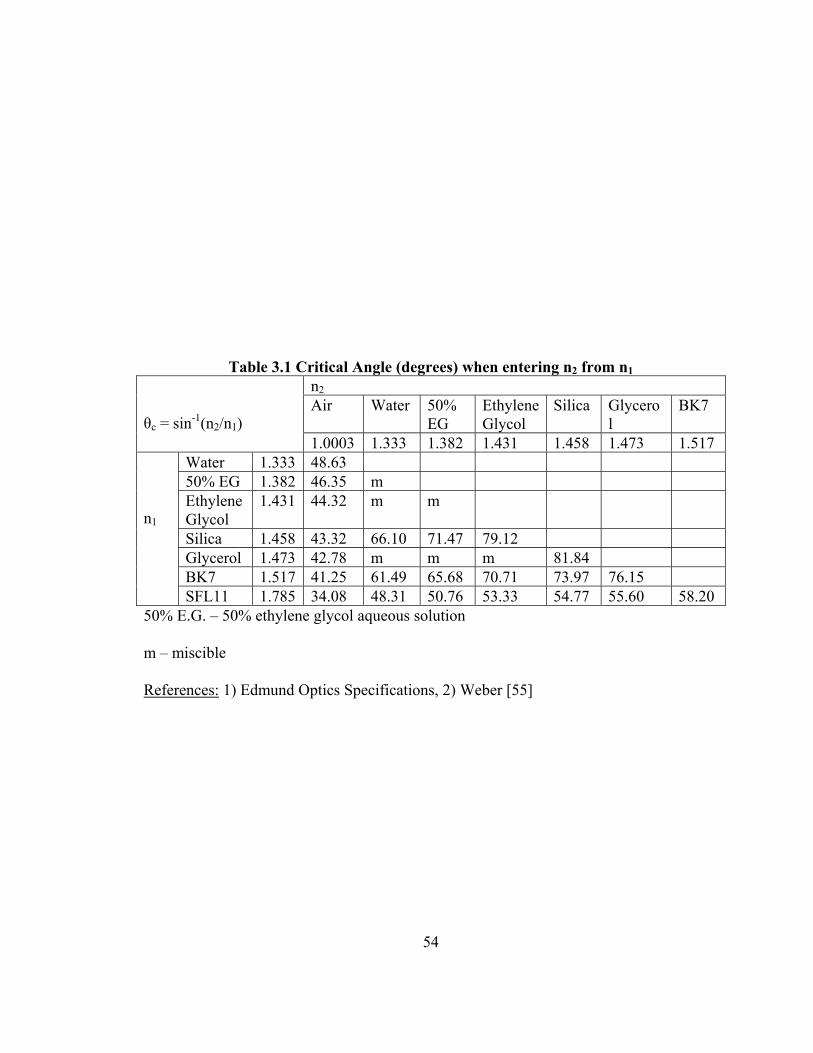
there is a minimum requirement of θ1 > θcritical as depicted in Table 3.1 in order to
maintain the TIR condition.
Two types of prisms were used in this work. Initially, early on, a 25.4mm
(hypotenuse 35mm) right angle BK7 glass (n = 1.517) lab unit was used, followed by a
smaller 12.7mm (hypotenuse 17.5mm) right angle BK7 glass (n = 1.517) unit (Melles
Griot Part Number #01 PRS 011), and eventually, a 15.00 mm (Hypotenuse 21.00mm)
right angle SFL11 glass (n = 1.785) unit, (Edmund part number NT45-950) was
employed; the higher index of refraction being able to accommodate smaller angles of
incidence and therefore less tilt of the image plane. In order to accommodate illumination
entrance for the LookDown camera (see Section 3.3), the right angle point of the SFL11
prism was truncated down to a polished flat by the Physics Department Machine Shop.
3.2 Interferometer
In the interest of completeness, it is worth some historical note that this
investigation started, not with the Mach-Zehnder (M-Z) interferometer used for TIRHM,
but with initial practice on the Michelson topology depicted in Figure 3.2. Please note
the progression of instrument designs from the Michelson unit in Figure 3.2, to the
transmission M-Z in Figure 3.3, the System I TIRHM in Figures 3.4 and 3.5, and
eventually the System II configuration in Figure 3.6
The basic interferometer topology to implement the TIRHM system is depicted in
54
Table 3.1 Critical Angle (degrees) when entering n2 from n1n2Air Water 50%
EG EthyleneGlycol
Silica Glycerol
BK7 θc = sin-1(n2/n1)
1.0003 1.333 1.382 1.431 1.458 1.473 1.517 Water 1.333 48.63 50% EG 1.382 46.35 m Ethylene Glycol
1.431 44.32 m m
Silica 1.458 43.32 66.10 71.47 79.12 Glycerol 1.473 42.78 m m m 81.84 BK7 1.517 41.25 61.49 65.68 70.71 73.97 76.15
n1
SFL11 1.785 34.08 48.31 50.76 53.33 54.77 55.60 58.20 50% E.G. – 50% ethylene glycol aqueous solution
m – miscible
References: 1) Edmund Optics Specifications, 2) Weber [55]
55
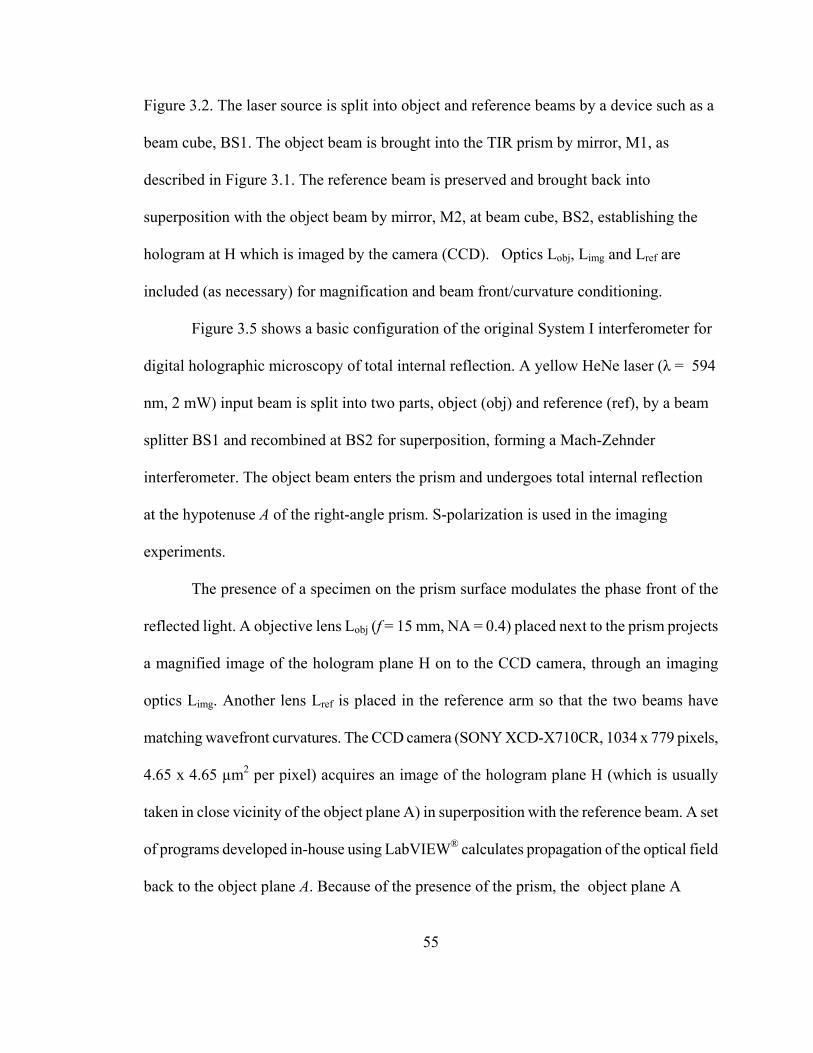
Figure 3.2. The laser source is split into object and reference beams by a device such as a
beam cube, BS1. The object beam is brought into the TIR prism by mirror, M1, as
described in Figure 3.1. The reference beam is preserved and brought back into
superposition with the object beam by mirror, M2, at beam cube, BS2, establishing the
hologram at H which is imaged by the camera (CCD). Optics Lobj, Limg and Lref are
included (as necessary) for magnification and beam front/curvature conditioning.
Figure 3.5 shows a basic configuration of the original System I interferometer for
digital holographic microscopy of total internal reflection. A yellow HeNe laser (λ = 594
nm, 2 mW) input beam is split into two parts, object (obj) and reference (ref), by a beam
splitter BS1 and recombined at BS2 for superposition, forming a Mach-Zehnder
interferometer. The object beam enters the prism and undergoes total internal reflection
at the hypotenuse A of the right-angle prism. S-polarization is used in the imaging
experiments.
The presence of a specimen on the prism surface modulates the phase front of the
reflected light. A objective lens Lobj (f = 15 mm, NA = 0.4) placed next to the prism projects
a magnified image of the hologram plane H on to the CCD camera, through an imaging
optics Limg. Another lens Lref is placed in the reference arm so that the two beams have
matching wavefront curvatures. The CCD camera (SONY XCD-X710CR, 1034 x 779 pixels,
4.65 x 4.65 µm2 per pixel) acquires an image of the hologram plane H (which is usually
taken in close vicinity of the object plane A) in superposition with the reference beam. A set
of programs developed in-house using LabVIEW® calculates propagation of the optical field
back to the object plane A. Because of the presence of the prism, the object plane A
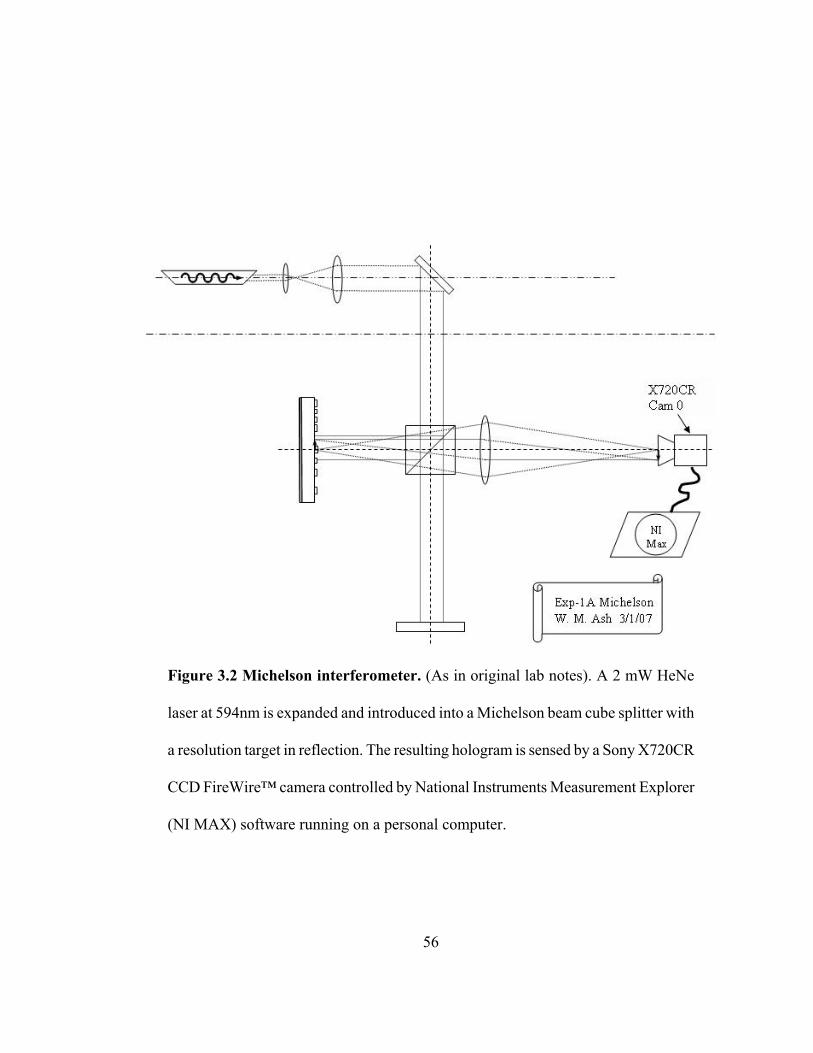
Figure 3.2 Michelson interferometer. (As in original lab notes). A 2 mW HeNe
laser at 594nm is expanded and introduced into a Michelson beam cube splitter with
a resolution target in reflection. The resulting hologram is sensed by a Sony X720CR
CCD FireWire™ camera controlled by National Instruments Measurement Explorer
(NI MAX) software running on a personal computer.
56
57
optically appears to the camera, or to the plane H, at about 72° angle of inclination, which
causes a large difference (about 1:3) in the x- and y-scales of images presented below. (This
angle is only coincidentally of same numerical value as θ1 below.)
The System II TIRHM apparatus configuration is depicted in Figure 3.6. Note
that the TIR prism is mounted into a three axis micrometer translation stage with
hypotenuse horizontal to the breadboard. The System II laser source is a Coherent DPSS
producing 40mW at λ = 532nm fiber coupled into a single mode 50:50 fiber splitter
(Thorlabs FC632-50B-FC 2x2; instead of a more traditional beam cube splitter). The
fiber splitter feeds the expander/ collimators (BE OBJ / REF ) for both the object and
reference arms. The object beam is incident upon the TIR prism, interacts with the TIR
face and the sample in the near field, reflects, and is imaged onto the CCD camera by
microscope objective MOOBJ. In order to produce the hologram, the reference beam is
brought into superposition by a 1” beam cube, B/C, acting as a combiner. The system is
also polarized to aid in balancing beam intensity levels in superposition at the CCD
camera.
Built on a 30mm Thorlabs cage system with 1” optics, the unit is mechanically
pinned to a vertical plate with the sample sitting atop the TIR prism; the objective beam
entering and exiting from underneath. Two types of microscope objectives for MOOBJ
and MOREF are currently in use with the TIRHM; a 10x/0.25 Edmund μPlan and a
25x/0.40 LWD (Long Working Distance) UNICO plan, whose working distances are
10mm and 5mm, respectively. Note that continual hardware upgrades were incorporated.
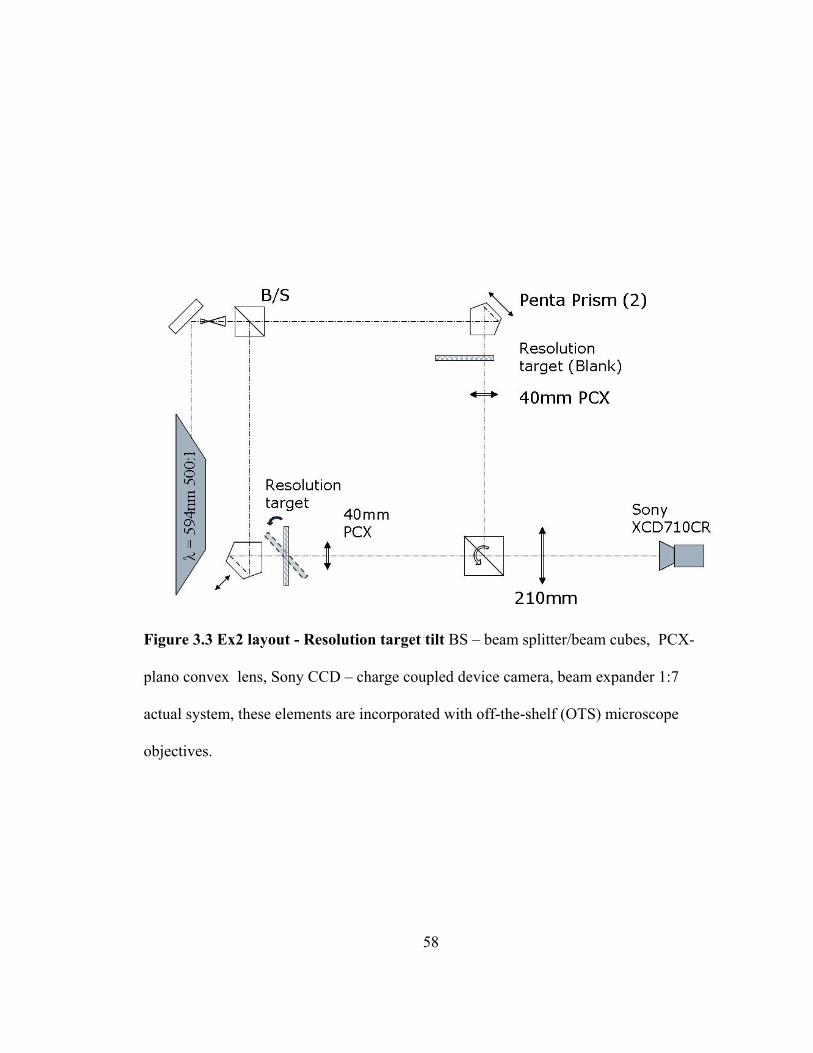
Figure 3.3 Ex2 layout - Resolution target tilt BS – beam splitter/beam cubes, PCX-
plano convex lens, Sony CCD – charge coupled device camera, beam expander 1:7
actual system, these elements are incorporated with off-the-shelf (OTS) microscope
objectives.
58
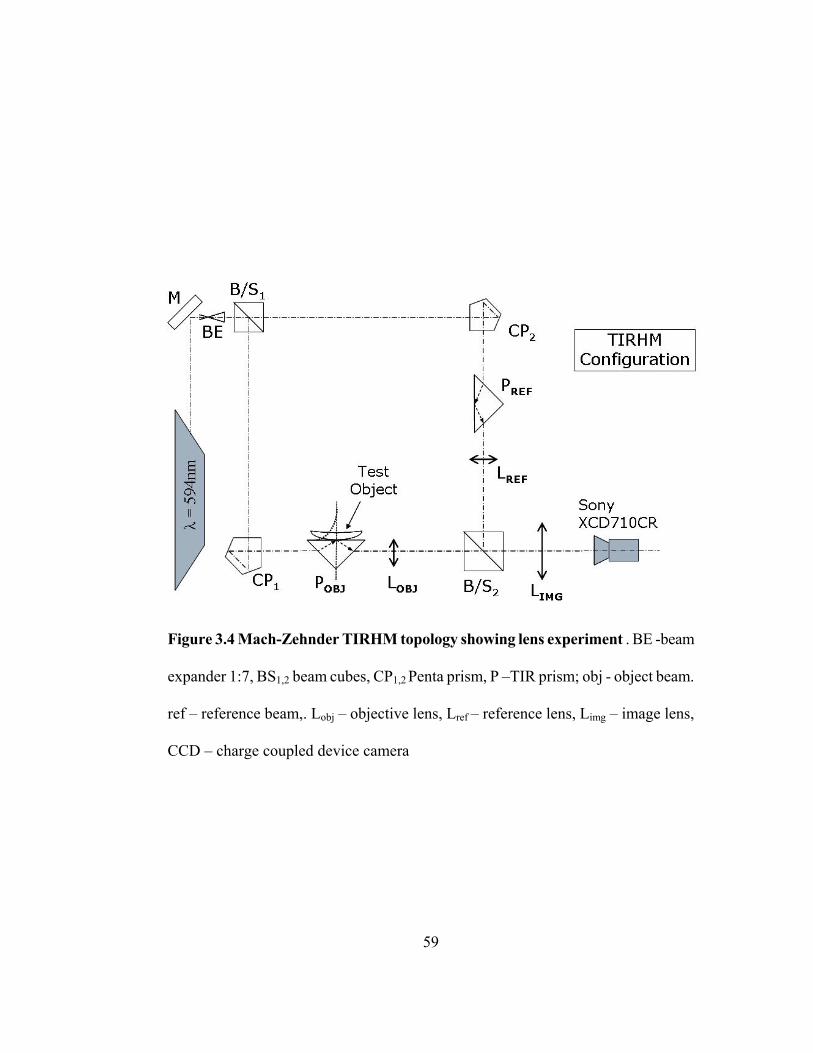
Figure 3.4 Mach-Zehnder TIRHM topology showing lens experiment . BE -beam
expander 1:7, BS1,2 beam cubes, CP1,2 Penta prism, P –TIR prism; obj - object beam.
ref – reference beam,. Lobj – objective lens, Lref – reference lens, Limg – image lens,
CCD – charge coupled device camera
59
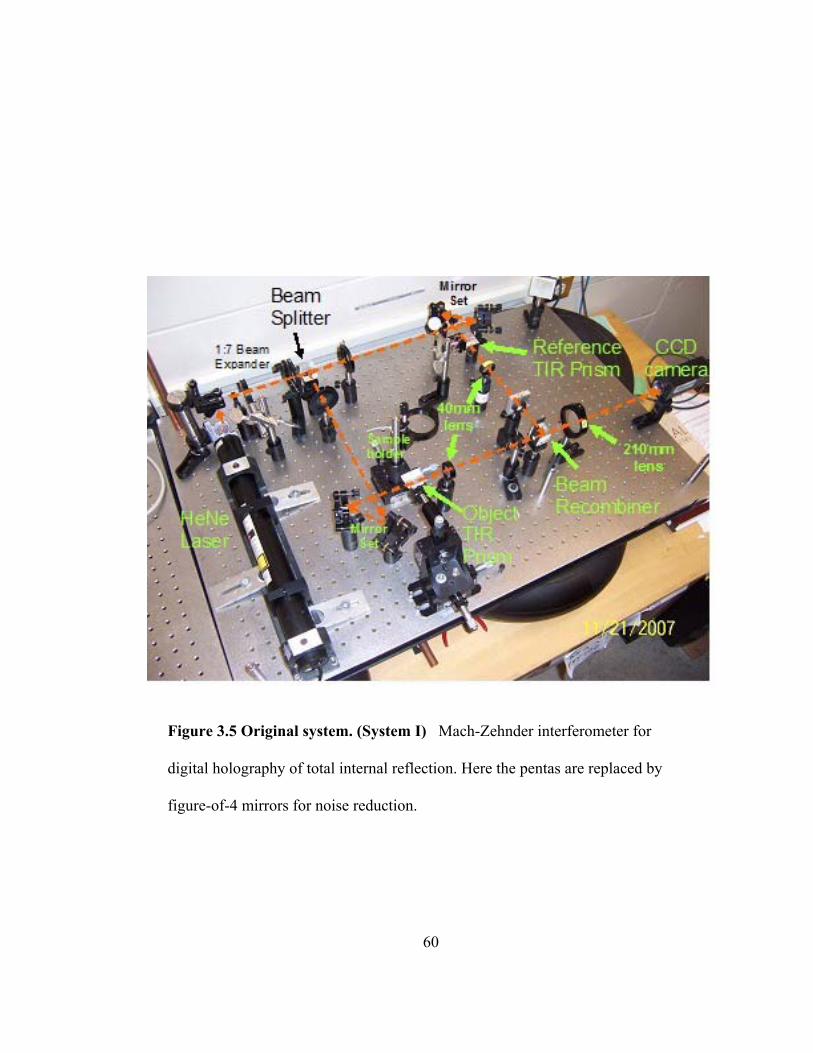
Figure 3.5 Original system. (System I) Mach-Zehnder interferometer for
digital holography of total internal reflection. Here the pentas are replaced by
figure-of-4 mirrors for noise reduction.
60
61
3.3 Camera and Image Acquisition
The CCD camera used to acquire the TIRHM hologram is a SONY FireWire
CCD camera XCD-X710CR, with 1034 x 779 pixels (horizontal x vertical), 4.65 x 4.65
µm2 per pixel. To process the hologram, the CCD camera digitally images the hologram
to a Firewire card installed in a Dell personal computer platform which also runs the
camera drivers, support routines and numeric processing algorithms.
A second SONY Firewire camera is mounted directly over the TIR prism and
pointed down at the hypotenuse face. Termed the “Lookdown camera”, it is focused on
the same spot that the TIRHM camera is looking up into to provide a direct image for
correlation with the TIRHM phase image. The lookdown camera uses either an Edmund
10X/0.25 or 20X/0.40 MO depending on the TIRHM camera magnification and has a
super luminescent diode (SLD) for illumination underneath the TIR prism.
Camera setup and alignment is performed with National Instruments
Measurement and Automation Explorer (MAX) package which is used to initialize
camera settings particularly protocol and shutter speed prior to handoff to the Angular
Spectrum Method virtual instrument (vi), named “AAA HoloExpt.vi” . The cameras are
set at Format 7, Mode 1, 512 x 384, Mono 16, 400 Mbps with the TIRHM camera
designated as “cam1” and the Look Down camera designated as “cam0” by the firmware.
3.4 Computer and Programs Overview
The first computer system, full name U241589.cas.usf.edu, initially used with this
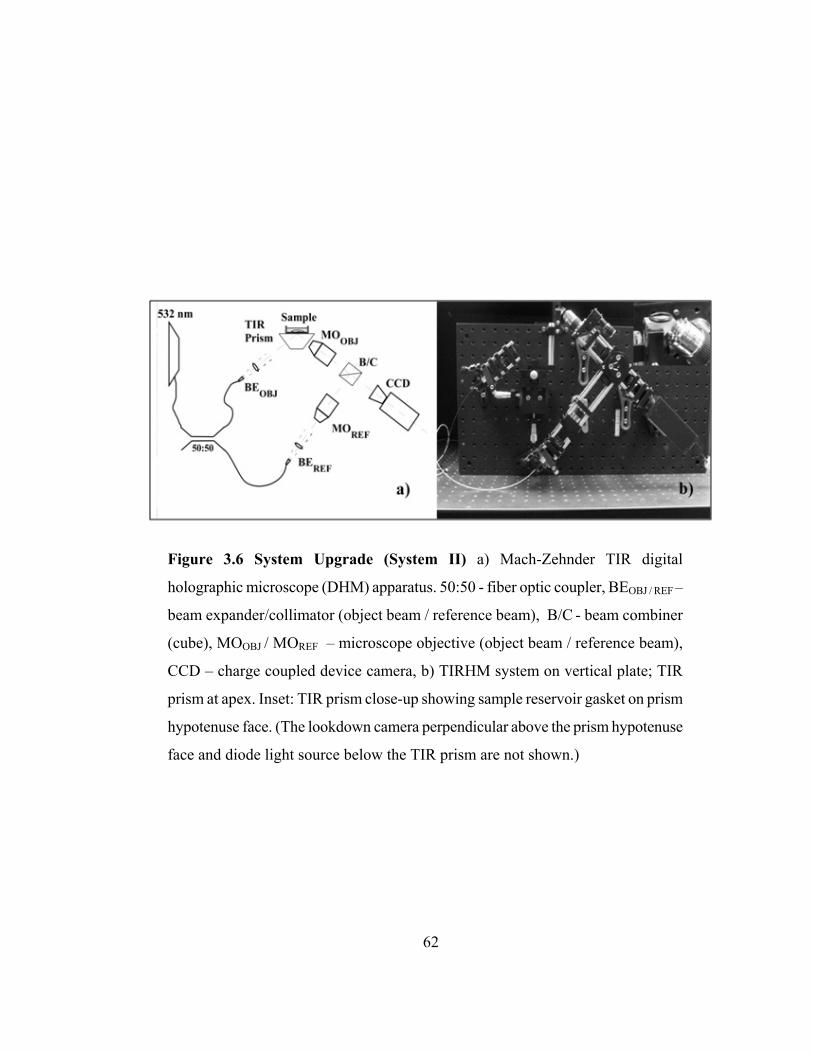
Figure 3.6 System Upgrade (System II) a) Mach-Zehnder TIR digital
holographic microscope (DHM) apparatus. 50:50 - fiber optic coupler, BEOBJ / REF –
beam expander/collimator (object beam / reference beam), B/C - beam combiner
(cube), MOOBJ / MOREF – microscope objective (object beam / reference beam),
CCD – charge coupled device camera, b) TIRHM system on vertical plate; TIR
prism at apex. Inset: TIR prism close-up showing sample reservoir gasket on prism
hypotenuse face. (The lookdown camera perpendicular above the prism hypotenuse
face and diode light source below the TIR prism are not shown.)
62
63
research is a Dell Optiplex GX280 with an Intel Pentium ® 4 CPU 3.40 Ghz with 1.00
GB of RAM running Microsoft Windows XP Professional Version 2002 Service pack 2.
The Firewire interface card is a Texas Instruments OHCI Compliant IEEE 1394 Host
controller in PCI Slot 3 (PCI bus 4, device 2, function 0). The digital camera interface is
National Instruments NI-IMAQdx IIDC with device driver
C:\WINDOWS\system32\DRIVERS\niimaqdxkw.sys downloaded from NI.
The second computer system, full name C004673.forest.usf.edu, used with this
research is a Dell Optiplex 960 with an Intel® Core™2 Duo CPU E8400 @ 3.00GHz
2.99 GHz with 4.00 GB of RAM (3.25 GB usable) running Microsoft Windows 7
Enterprise. The Firewire interface card is a Texas Instruments OHCI Compliant IEEE
1394 Host controller (PCI bus 4, device 0, function 0). The digital camera interface is
National Instruments NI-IMAQdx IIDC with device driver 3.5.0.49155 at
C:\WINDOWS\system32\DRIVERS\niimaqdxkw.sys. Note that this system was
eventually replaced with the initial system due to software contention.
The LabVIEW software package from National Instruments, Inc. is used for
hologram acquisition and reconstruction, and also for the untilt post processing routine.
This software algorithm is performed in a routine that LabVIEW refers to as “Virtual
Instrument” or “.vi” . A .vi routine can call a subroutine, termed a “sub vi”, which allows
for modular software construction and the use of both NI library vi’s as well as user
defined vi routines. The specific routine used for digital hologram reconstruction in this
64
research is called “AAA HoloExpt.vi”. The primary sub vi’s used by AAA HoloExpt.vi
are depicted in Table X and are part of the kimlab electronic software library, in this
instance, I:\kimlab\__folder 2007 - Bill A\_DHML library 2007-04-15 WMAwork.
Note that for IEEE 1394 Firewire, NI-IMAQdx ‘grandfathers’ in the IEEE 1394
compatibility to the more recent ‘dx’ version. The AAA HoloExpt.vi and major subvi’s
also allow for images to be saved as bmp or kimlab defined “.dh2c” files with notes for
later retrieval and processing. Note that continual software improvements were
incorporated over the duration of this investigation.
The procedure behind digital holography is depicted in Figure 3.7. The sample,
Allium cepa (onion) cells, resides on the prism face (with θ1 < θcritical ; non-TIR mode for
engineering) and provides a direct image as shown in Figure 3.4a. With the addition of
the reference beam, the CCD camera captures the hologram created by superposition of
the object beam (OBJ) with the reference beam (REF) (Figures 3.7b and 3.9) and this is
relayed to the processing platform as a direct camera feed, over Firewire in this instance.
At that point, our LabVIEW software converts the numerical image of the
hologram into Fourier space, where it is processed, including filtering (Figure 3.7c). The
complex array comprising the angular spectrum is then transformed back into its real
image. So it is this numerical processing inherent in DHM that has allowed us to extract
the phase information and thus perform phase microscopy. ASM also allows the un-tilt
algorithm to be directly coded into the LabVIEW software routine. Note also the change
in aspect ratio between Figures 3.7d and e, and 3.7g and h due to the un-tilting process. A
65
Table 3.2. Primary Sub vi’s (subroutines) of AAA HoloExpt.vi
Name Purpose
camera setup (ieee).vi Sets up the parameters of the camera for the holography session
cam image (ieee).vi Acquires an image from the camera res-scale.vi Used to calibrate FOV with a USAF 1951
Resolution target get hologram.vi Get a hologram from images(s) acquired
from the camera or read from files AS HoloDiffract.vi Top level program to acquire hologram and
calculate diffraction using the angular spectrum method (See Fig. 3.8)
66
typical en face direct image of onion tissue, fig. 3.7f), is presented for comparison.
The un-tilt algorithm provides exact (non-approximated) results with a
reasonable compromise in computation speed, which we perform in near real-time using
CUDA (Compute Unified Device Architecture from NVIDIA Corporation, Santa Clara,
California) hardware acceleration. Thus the angular spectrum method allows the
reconstruction software to compensate for tilt anamorphism due to the inclined TIR plane
of the prism with respect to the optical axis.
3.4 Sample preparation
For certain organisms, such as the live Dictyostelium Discoideum myxamoeba,
sample preparation is as simple as placing the specimens into a gasket reservoir
containing an aqueous solution on the prism hypotenuse (Figure 3b inset). The gasket
reservoir here contains an aqueous (water) solution (n~1.33) around the sample, the
amoeba themselves being allowed to adhere to the prism surface in range of the near-
field. These Dictyostelium are imaged under a conformal layer of polyacrylamide
approximately 100um thick that serves the dual purpose of promoting adhesion by
keeping the myxamoeba down on the prism face in the near-field and maintaining an
aqueous ambient around the specimens.
For our tests on live 3T3 fibroblasts and SKOV-3 ovarian cancer cells, the
specimens were cultured on the prism hypotenuse which acted as a sample carrier; the
gasket reservoir containing Hank’s Buffered Saline Solution (HBSS; n~1.33) simply
Figure 3.7. DHM process with un-tilt via the angular spectrum method: non-TIR
engineering run with onion tissue (Allium cepa); 10x Edmund mPlan with BK7
prism. a) Direct prism image with tilt (field-of-view (FOV) (x,y); 256μm x 684μm
(tilt-compressed)), b) hologram, c) angular spectrum filtering first order peak, d) and
e) amplitude and phase image reconstruction with inherent tilt (FOV 256μm x
684μm (tilt-compressed)), f), typical en face ‘direct’ image of Allium cepa (FOV
400μm x 400μm), g) un-tilted (and transposed) amplitude and h) phase image. space
yielding both the amplitude and the phase information (Figures 3.7 d and e).
67
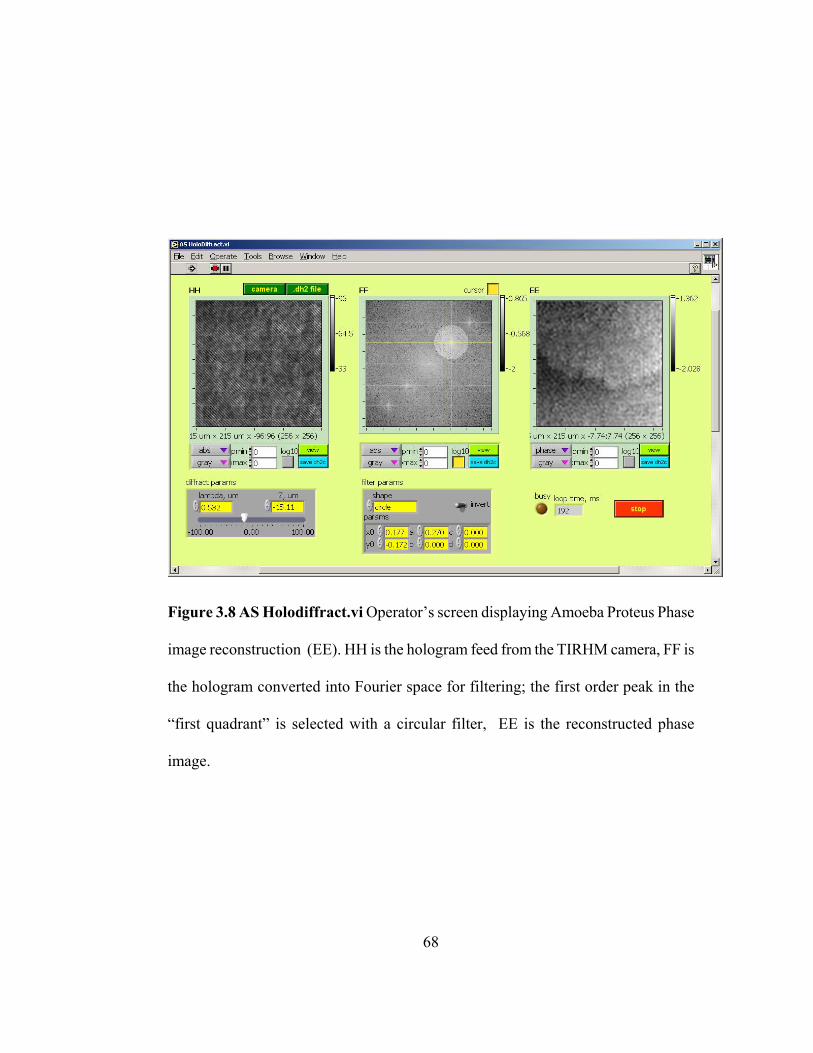
Figure 3.8 AS Holodiffract.vi Operator’s screen displaying Amoeba Proteus Phase
image reconstruction (EE). HH is the hologram feed from the TIRHM camera, FF is
the hologram converted into Fourier space for filtering; the first order peak in the
“first quadrant” is selected with a circular filter, EE is the reconstructed phase
image.
68
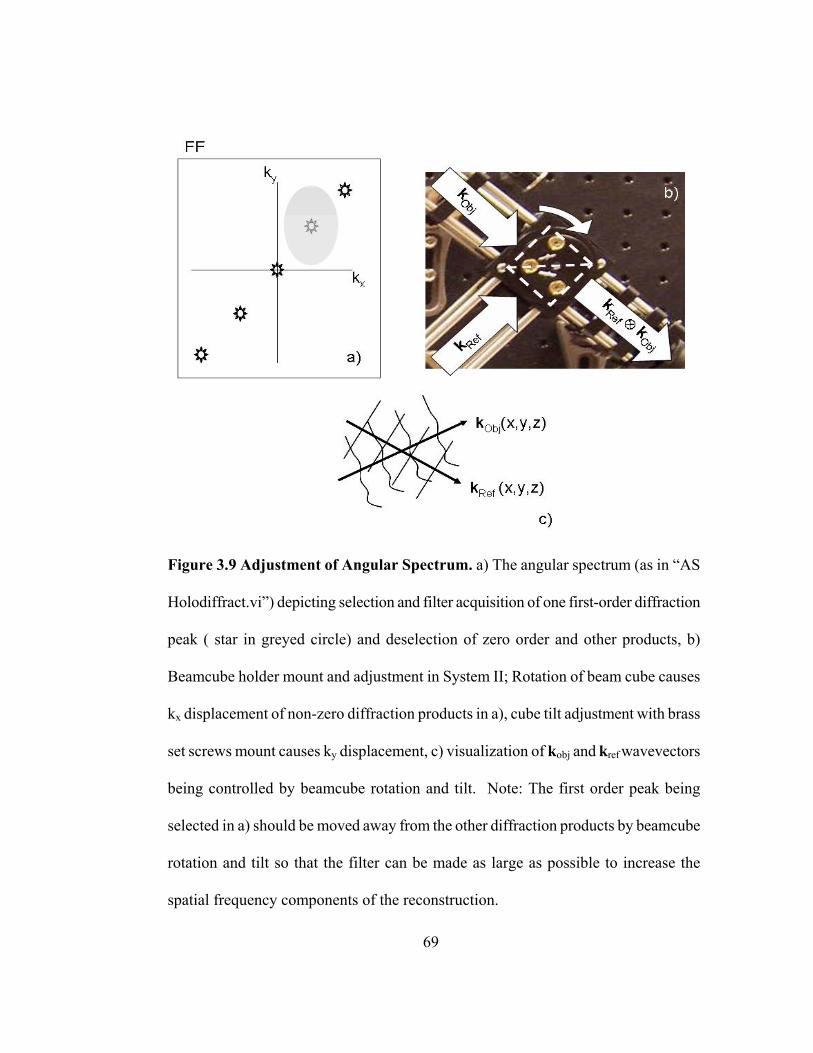
Figure 3.9 Adjustment of Angular Spectrum. a) The angular spectrum (as in “AS
Holodiffract.vi”) depicting selection and filter acquisition of one first-order diffraction
peak ( star in greyed circle) and deselection of zero order and other products, b)
Beamcube holder mount and adjustment in System II; Rotation of beam cube causes
kx displacement of non-zero diffraction products in a), cube tilt adjustment with brass
set screws mount causes ky displacement, c) visualization of kobj and kref wavevectors
being controlled by beamcube rotation and tilt. Note: The first order peak being
selected in a) should be moved away from the other diffraction products by beamcube
rotation and tilt so that the filter can be made as large as possible to increase the
spatial frequency components of the reconstruction.
69

70
emplaced around the sample. The fibroblasts and the SKOV-3 were prepared with
standard biological preparatory procedures as related in their references [47, 48] with the
kind help of Dr. Lo. Amoeba proteus and Dictyostelium Discoideum samples were
obtained from Carolina Scientific Supply, Burlington, NC 27215-3398.
71
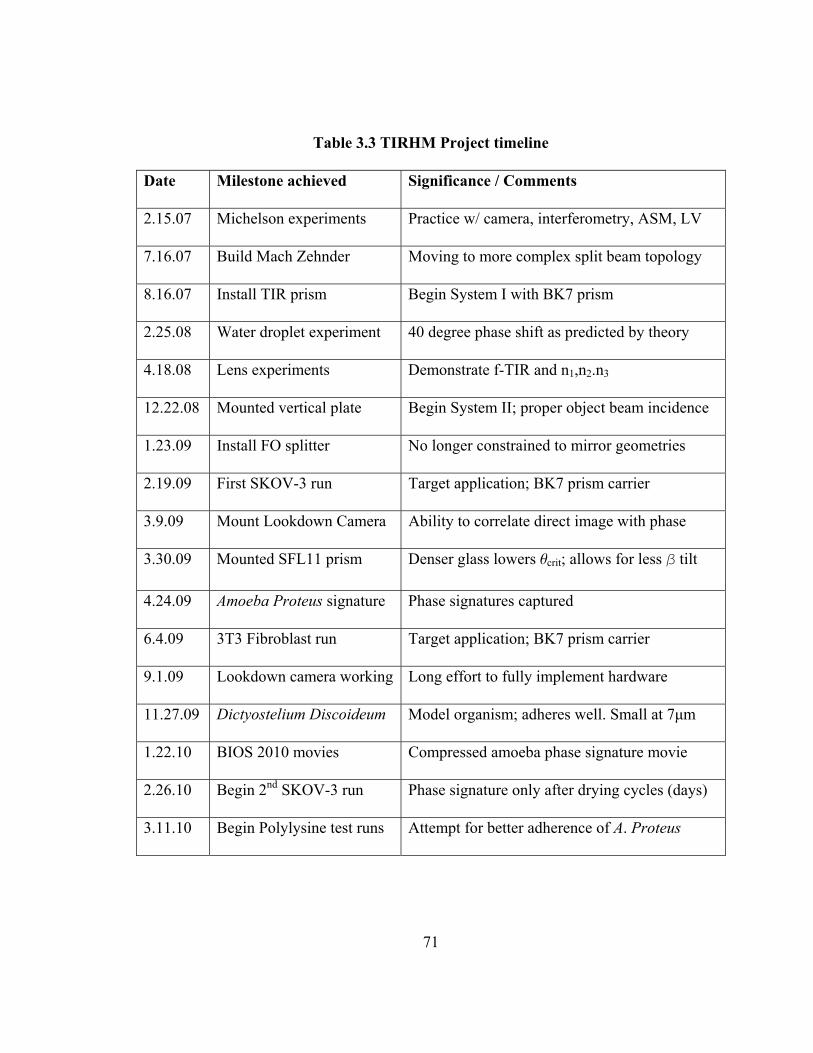
Table 3.3 TIRHM Project timeline
Date Milestone achieved Significance / Comments
2.15.07 Michelson experiments Practice w/ camera, interferometry, ASM, LV
7.16.07 Build Mach Zehnder Moving to more complex split beam topology
8.16.07 Install TIR prism Begin System I with BK7 prism
2.25.08 Water droplet experiment 40 degree phase shift as predicted by theory
4.18.08 Lens experiments Demonstrate f-TIR and n1,n2.n3
12.22.08 Mounted vertical plate Begin System II; proper object beam incidence
1.23.09 Install FO splitter No longer constrained to mirror geometries
2.19.09 First SKOV-3 run Target application; BK7 prism carrier
3.9.09 Mount Lookdown Camera Ability to correlate direct image with phase
3.30.09 Mounted SFL11 prism Denser glass lowers qcrit; allows for less β tilt
4.24.09 Amoeba Proteus signature Phase signatures captured
6.4.09 3T3 Fibroblast run Target application; BK7 prism carrier
9.1.09 Lookdown camera working Long effort to fully implement hardware
11.27.09 Dictyostelium Discoideum Model organism; adheres well. Small at 7μm
1.22.10 BIOS 2010 movies Compressed amoeba phase signature movie
2.26.10 Begin 2nd SKOV-3 run Phase signature only after drying cycles (days)
3.11.10 Begin Polylysine test runs Attempt for better adherence of A. Proteus
72
CHAPTER 4
EXPERIMENTS
4.1 Early efforts; EX-1A through EX-3
The first experiments of this research were conducted even before the
development of the first Mach Zehnder System I and became almost a set of
preproduction practice exercises, such as camera operations, HeNe laser illumination,
angular spectrum establishment, LabVIEW vi construction and operation, angular
spectrum diffraction and filtering, and hologram reconstruction, that built upon each
other to produce a working Michelson unit in order to produce Digital Holographic
Microscopy (DHM).
Initial sample objects were USAF 1951 1X resolution targets (Figure 4.1).
The features on this resolution target (RT) are nickel plated bars with sizes ranging from
Group 0 Element 1 (G0E1) 2500 μm long x 500 μm wide down to G7E6 (10.96μm x
2.192 μm). These RT are used in the calibration routine “res_targ” for the AAA
HoloExpt.vi software. Table 4.1 recounts much of the early groundwork in preparation
for proceeding into the TIRHM phase of this investigation. The AAA HoloExpt
captures in Figures 4.2 and 4.3 present many of the salient features from this
experimental period using the equipment depicted previously in Figures 3.2 through 3.5.
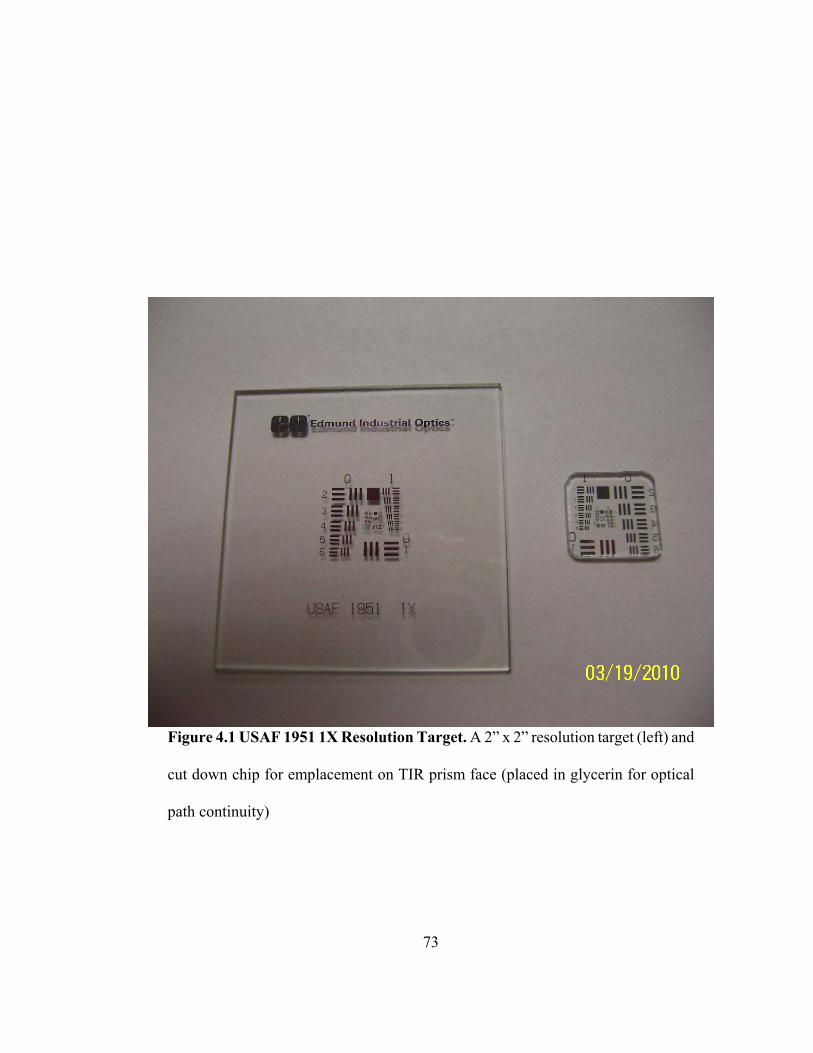
Figure 4.1 USAF 1951 1X Resolution Target. A 2” x 2” resolution target (left) and
cut down chip for emplacement on TIR prism face (placed in glycerin for optical
path continuity)
73
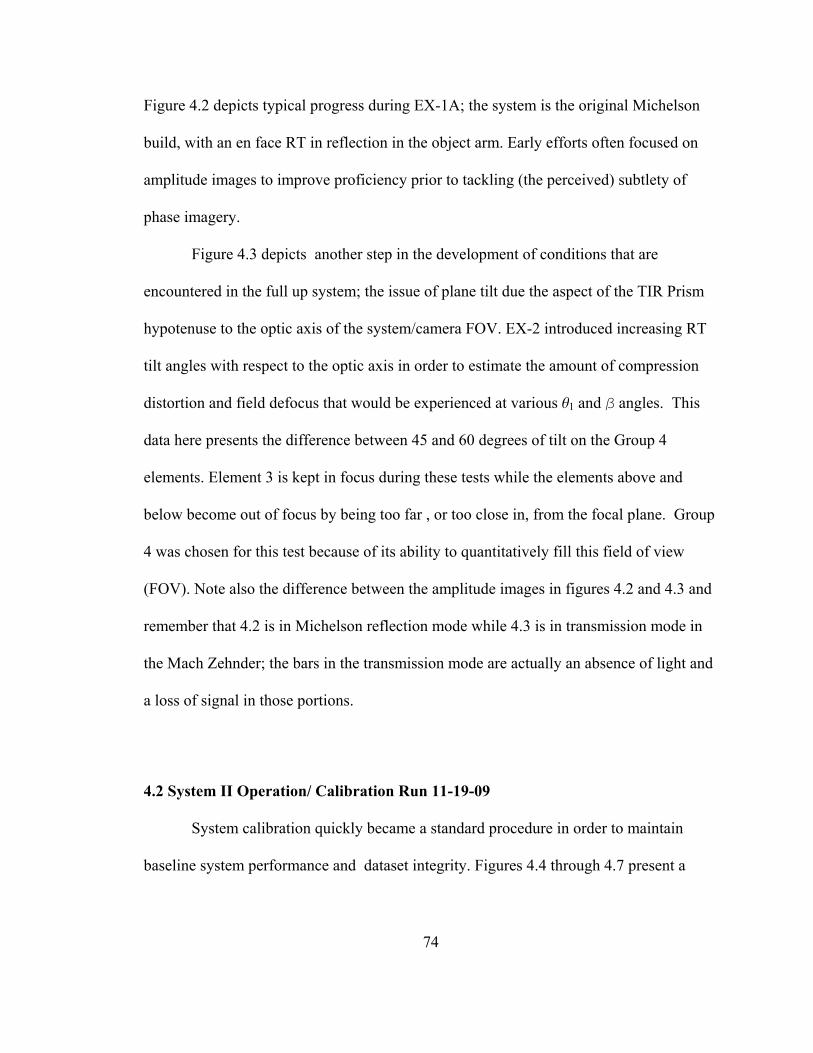
74
Figure 4.2 depicts typical progress during EX-1A; the system is the original Michelson
build, with an en face RT in reflection in the object arm. Early efforts often focused on
amplitude images to improve proficiency prior to tackling (the perceived) subtlety of
phase imagery.
Figure 4.3 depicts another step in the development of conditions that are
encountered in the full up system; the issue of plane tilt due the aspect of the TIR Prism
hypotenuse to the optic axis of the system/camera FOV. EX-2 introduced increasing RT
tilt angles with respect to the optic axis in order to estimate the amount of compression
distortion and field defocus that would be experienced at various q1 and β angles. This
data here presents the difference between 45 and 60 degrees of tilt on the Group 4
elements. Element 3 is kept in focus during these tests while the elements above and
below become out of focus by being too far , or too close in, from the focal plane. Group
4 was chosen for this test because of its ability to quantitatively fill this field of view
(FOV). Note also the difference between the amplitude images in figures 4.2 and 4.3 and
remember that 4.2 is in Michelson reflection mode while 4.3 is in transmission mode in
the Mach Zehnder; the bars in the transmission mode are actually an absence of light and
a loss of signal in those portions.
4.2 System II Operation/ Calibration Run 11-19-09
System calibration quickly became a standard procedure in order to maintain
baseline system performance and dataset integrity. Figures 4.4 through 4.7 present a
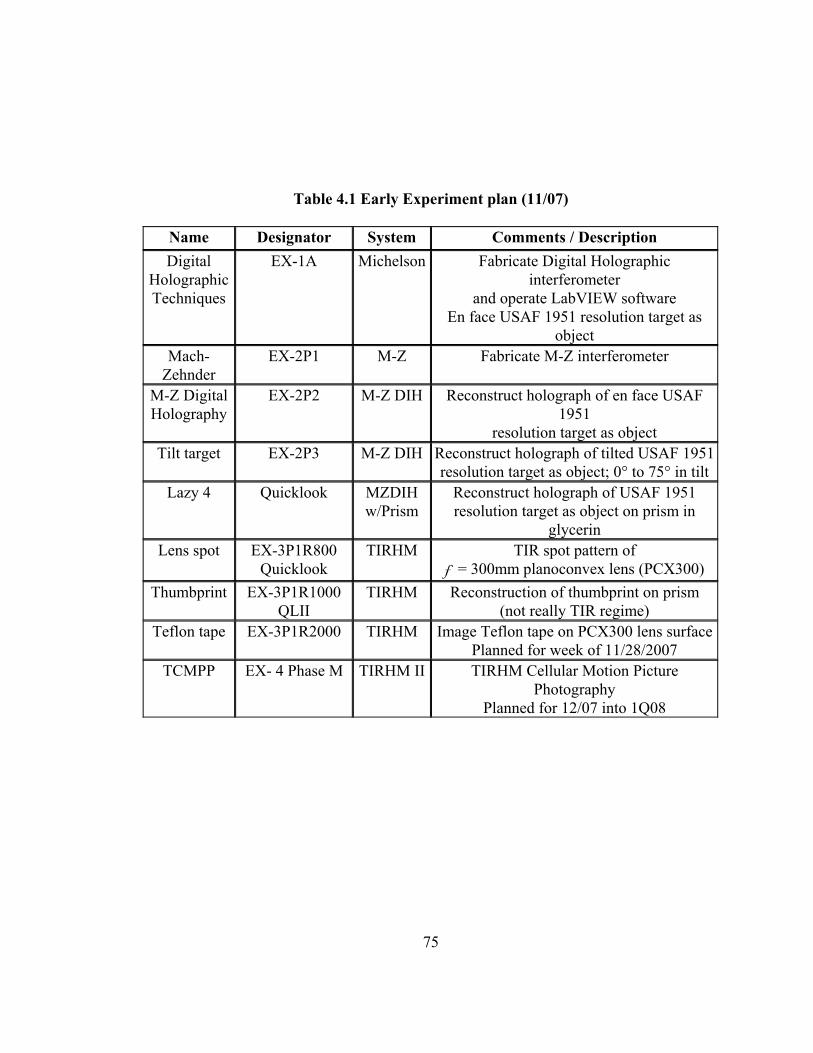
75
Table 4.1 Early Experiment plan (11/07)
Name Designator System Comments / Description Digital
Holographic Techniques
EX-1A Michelson Fabricate Digital Holographic interferometer
and operate LabVIEW software En face USAF 1951 resolution target as
object Mach-
Zehnder EX-2P1 M-Z Fabricate M-Z interferometer
M-Z Digital Holography
EX-2P2 M-Z DIH Reconstruct holograph of en face USAF 1951
resolution target as object Tilt target EX-2P3 M-Z DIH Reconstruct holograph of tilted USAF 1951
resolution target as object; 0° to 75° in tilt Lazy 4 Quicklook MZDIH
w/Prism Reconstruct holograph of USAF 1951 resolution target as object on prism in
glycerin Lens spot EX-3P1R800
Quicklook TIRHM TIR spot pattern of
f = 300mm planoconvex lens (PCX300) Thumbprint EX-3P1R1000
QLII TIRHM Reconstruction of thumbprint on prism
(not really TIR regime) Teflon tape EX-3P1R2000 TIRHM Image Teflon tape on PCX300 lens surface
Planned for week of 11/28/2007 TCMPP EX- 4 Phase M TIRHM II TIRHM Cellular Motion Picture
Photography Planned for 12/07 into 1Q08
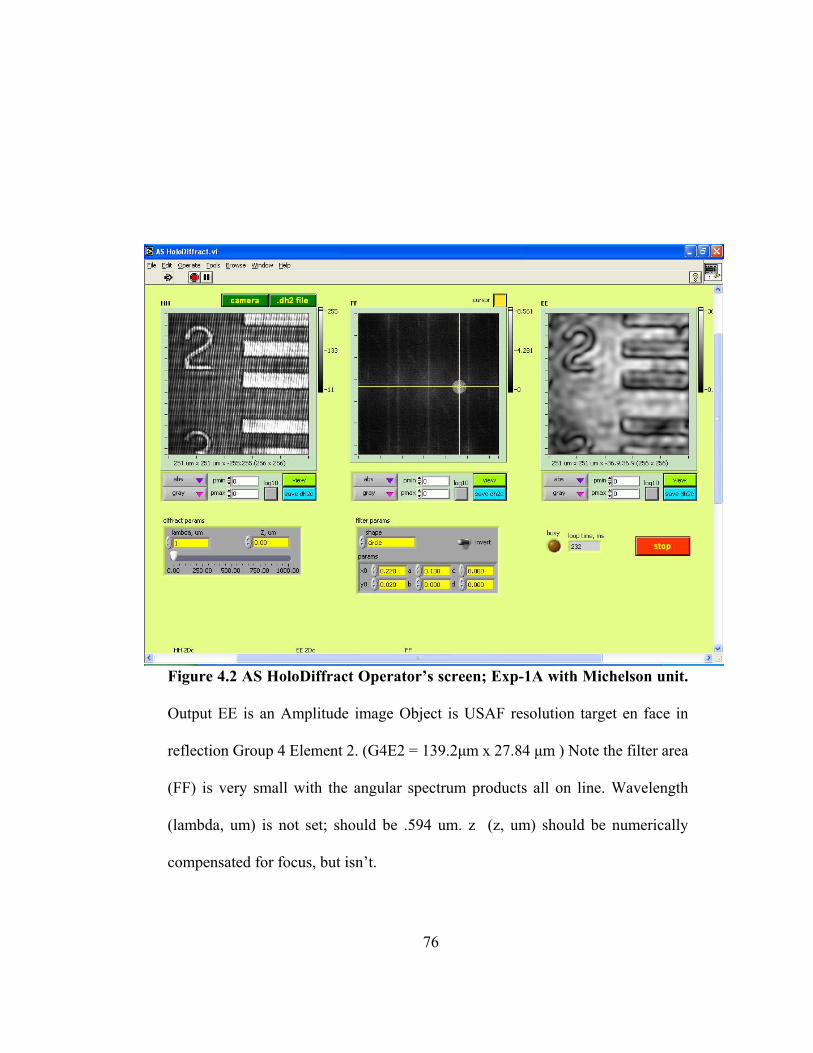
Figure 4.2 AS HoloDiffract Operator’s screen; Exp-1A with Michelson unit.
Output EE is an Amplitude image Object is USAF resolution target en face in
reflection Group 4 Element 2. (G4E2 = 139.2μm x 27.84 μm ) Note the filter area
(FF) is very small with the angular spectrum products all on line. Wavelength
(lambda, um) is not set; should be .594 um. z (z, um) should be numerically
compensated for focus, but isn’t.
76
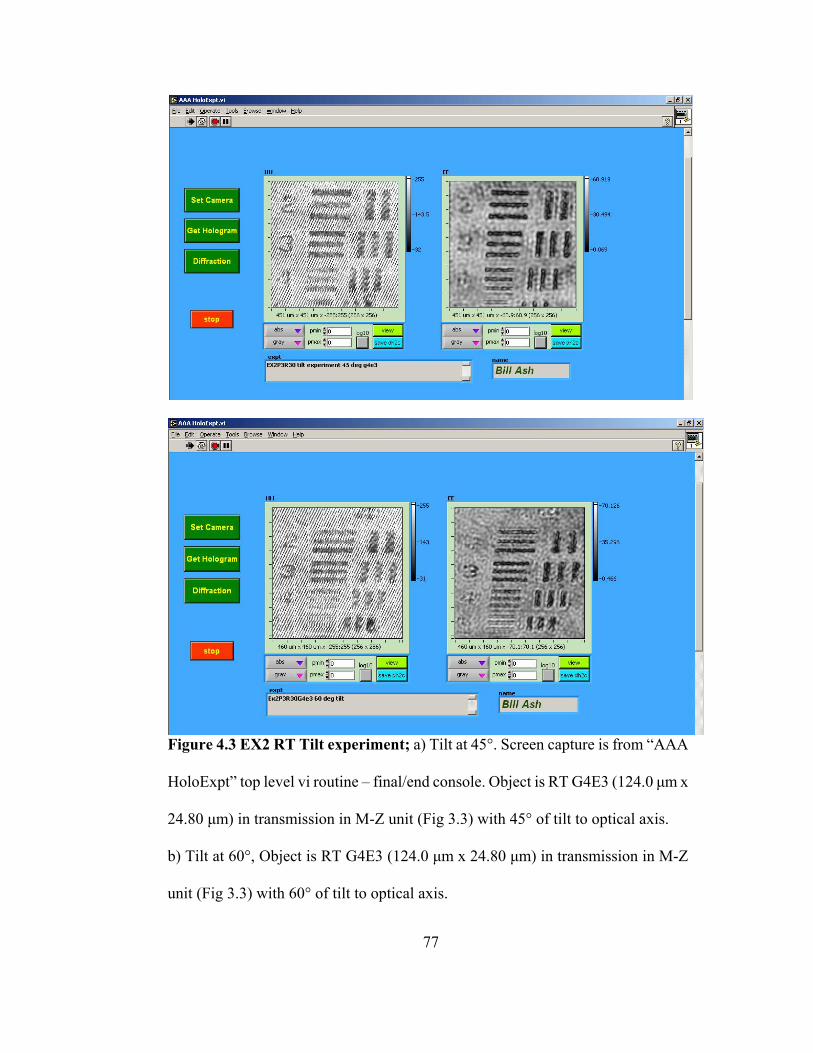
Figure 4.3 EX2 RT Tilt experiment; a) Tilt at 45°. Screen capture is from “AAA
HoloExpt” top level vi routine – final/end console. Object is RT G4E3 (124.0 μm x
24.80 μm) in transmission in M-Z unit (Fig 3.3) with 45° of tilt to optical axis.
b) Tilt at 60°, Object is RT G4E3 (124.0 μm x 24.80 μm) in transmission in M-Z
unit (Fig 3.3) with 60° of tilt to optical axis.
77
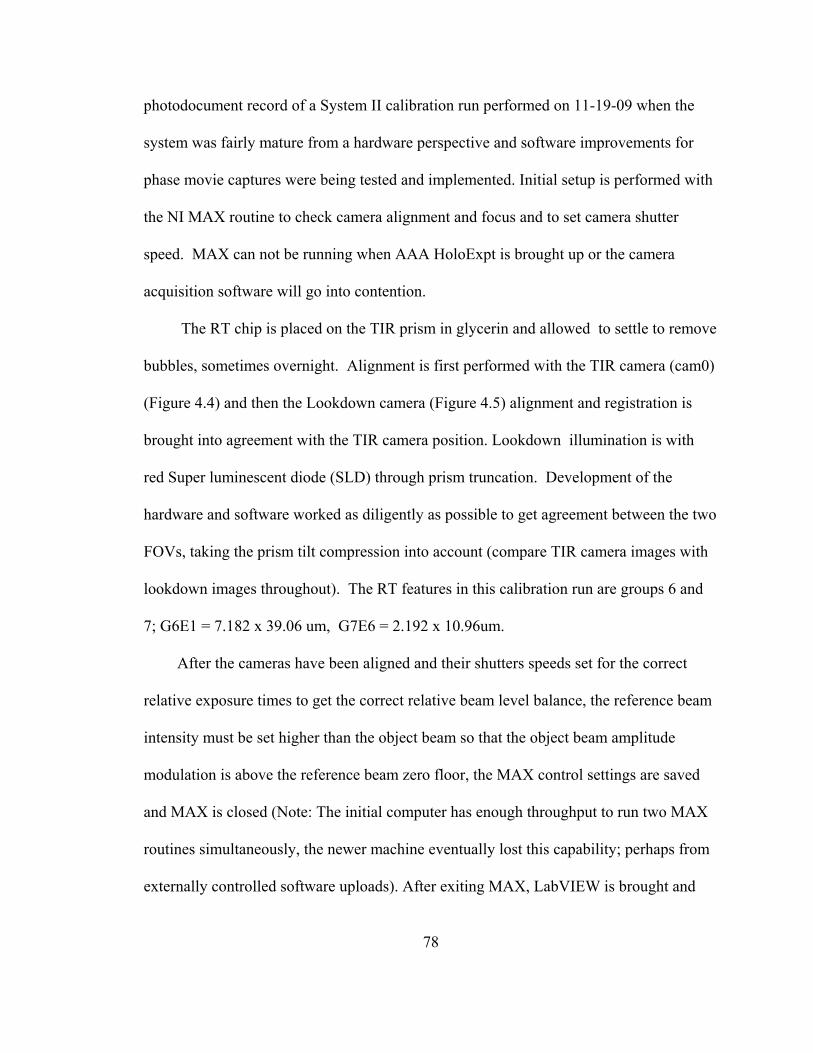
78
photodocument record of a System II calibration run performed on 11-19-09 when the
system was fairly mature from a hardware perspective and software improvements for
phase movie captures were being tested and implemented. Initial setup is performed with
the NI MAX routine to check camera alignment and focus and to set camera shutter
speed. MAX can not be running when AAA HoloExpt is brought up or the camera
acquisition software will go into contention.
The RT chip is placed on the TIR prism in glycerin and allowed to settle to remove
bubbles, sometimes overnight. Alignment is first performed with the TIR camera (cam0)
(Figure 4.4) and then the Lookdown camera (Figure 4.5) alignment and registration is
brought into agreement with the TIR camera position. Lookdown illumination is with
red Super luminescent diode (SLD) through prism truncation. Development of the
hardware and software worked as diligently as possible to get agreement between the two
FOVs, taking the prism tilt compression into account (compare TIR camera images with
lookdown images throughout). The RT features in this calibration run are groups 6 and
7; G6E1 = 7.182 x 39.06 um, G7E6 = 2.192 x 10.96um.
After the cameras have been aligned and their shutters speeds set for the correct
relative exposure times to get the correct relative beam level balance, the reference beam
intensity must be set higher than the object beam so that the object beam amplitude
modulation is above the reference beam zero floor, the MAX control settings are saved
and MAX is closed (Note: The initial computer has enough throughput to run two MAX
routines simultaneously, the newer machine eventually lost this capability; perhaps from
externally controlled software uploads). After exiting MAX, LabVIEW is brought and
Figure 4.4 TIR camera MAX image of RT chip in glycerin on truncated SFL11 TIR
prism; Groups 6 and 7. Tilt compression in phase image is in x-direction. Illumination is
with green laser object beam. Shutter speed at 0.02s. Note bubble curvature at bottom
FOV; black for loss of signal (LOS).
79
80
AAA HoloExpt.vi is loaded and run. The first action is to run the Camera Setup (ieee).vi
routine from the top level AAA routine. Note that this is a the IEEE 1394 FireWire
version for the SONY cameras used on TIRHM. The camera setup routine displays the
TIR camera power bar, the TIR camera hologram feed, the lookdown camera feed and
the angular spectrum.
Having roughed the reference and object beam power levels in MAX and set a
nominally camera speed, the final adjustments on ref and obj power levels are made in
camera set up with the power bar. In order to stay out of overdriving the input, the obj
and ref beams are checked against the power bar reading separately and the levels
adjusted with the polarizers on the reference beam and the camera input, the obj beam
polarization being locked perpendicular (s-polarization - senkrecht) to the prism plane of
incidence at the object beam expander/collimator polarizer control. Object beam usually
runs about 3 bars and the reference beam level near 4 bars.
Camera setup is also where the hologram feed is calibrated; the <scale> control
conveniently runs “Res_scale” so that the RT can be measured on the screen and the
correct FOV set. NOTE: TIR prism compression must be taken into account when
setting the FOV, so care must be taken to read in-focus, non-compressed RT bars.
Note that the FOV can also be selected in the TIE camera feed screen. Once the FOV has
been correctly set the next step is to align the angular spectrum. In order to insure proper
Angular Spectrum (AS) alignment for this TIR system, please refer to the discussion that
goes with “Figure 3.6 Adjustment of Angular Spectrum.” The AS adjustment set
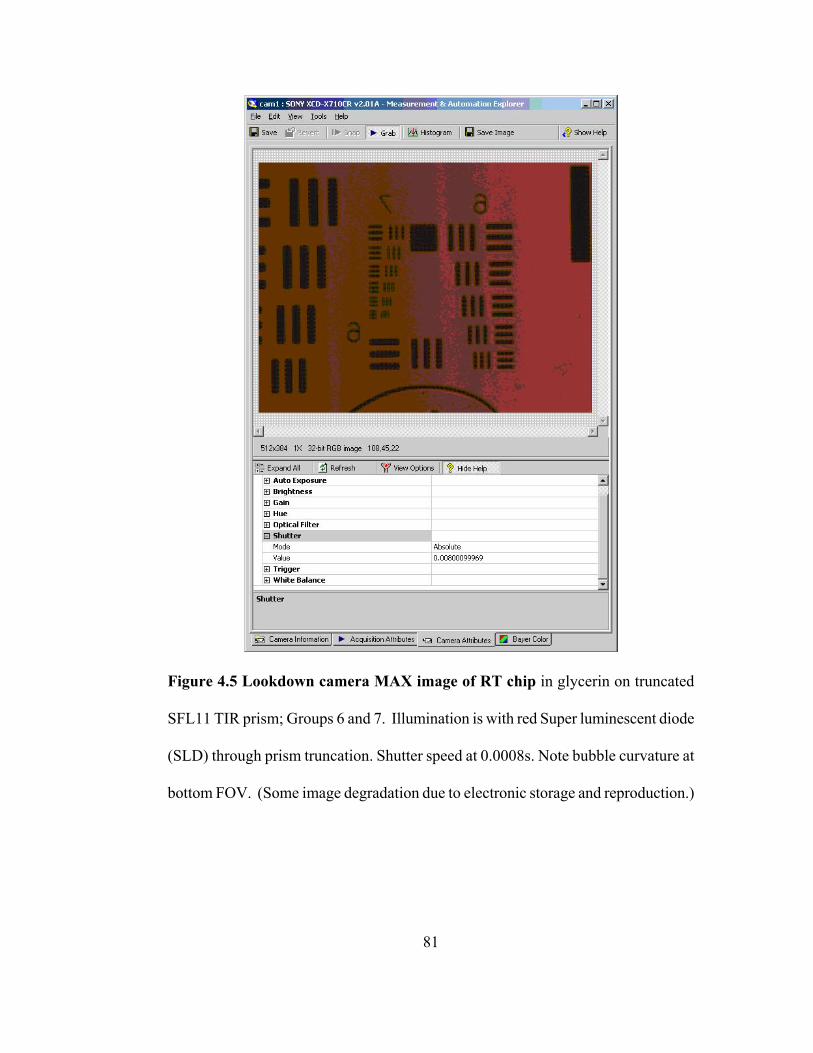
Figure 4.5 Lookdown camera MAX image of RT chip in glycerin on truncated
SFL11 TIR prism; Groups 6 and 7. Illumination is with red Super luminescent diode
(SLD) through prism truncation. Shutter speed at 0.0008s. Note bubble curvature at
bottom FOV. (Some image degradation due to electronic storage and reproduction.)
81
82
screws are located on the beam cube dynamic mount and are set while viewing the AS
feed in the camera setup panel. Once the power levels, FOV and angular spectrum are
set, the camera setup routine is closed and software control reverts to top level vi. The
next step is to acquire the hologram and perform filtering and reconstruction.
The hologram can be acquired either at <Get Hologram> or, with the
implementation of direct hologram feed for real time phase imagery and movie
production, acquisition can take place in the AS HoloDiffract routine. AS HoloDiffract
has controls to acquire and filter the AS and display processed data. Figure 4.7 presents a
screen capture of the phase image and lookdown camera feed from the RT target
calibration run in this section. Note reasonable definition in the phase image down to
about G7E2 (3.480 x 17.40um) and G7E5 is visible in phase. Note also the overall
planarity of the phase image, consistency of filed composition and generally acceptable
noise figure overall.
Subsequent to calibration runs such as these the system would display reasonable
stability even after TIR prism removal and remount. The image mode of Figure 4.7 also
must be understood because it is in this setting that long duration acquisitions would be
performed. In this operator’s panel, prism x-axis traverse, display vertical axis, is
conducted in a straightforward fashion with the x translation micrometer control, the only
limitations therein being alignment tolerance of the prism body coordinates to the optic
axis and maintenance of full illumination coverage. Prism traverse in the view panel x –
axis, the compression axis, is slightly more involved. The prism micrometer controls for
the other two body axes, being affixed to the vertical plate (Figure 3.6), they are rotated
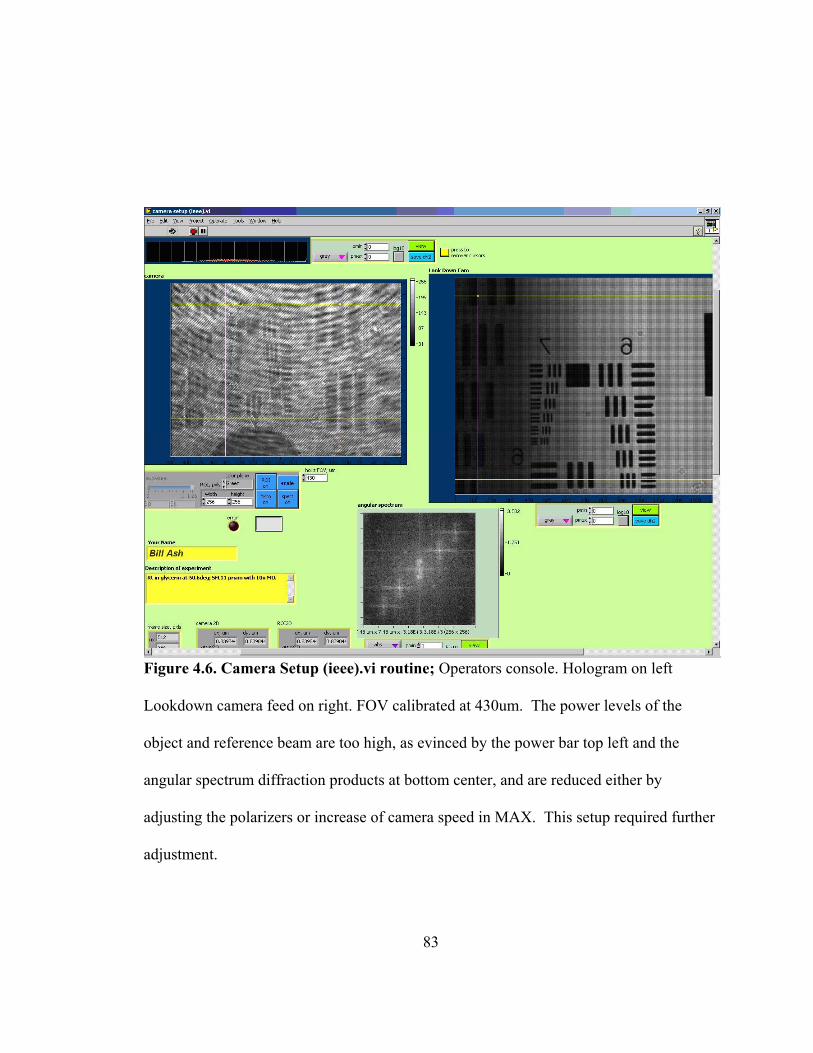
Figure 4.6. Camera Setup (ieee).vi routine; Operators console. Hologram on left
Lookdown camera feed on right. FOV calibrated at 430um. The power levels of the
object and reference beam are too high, as evinced by the power bar top left and the
angular spectrum diffraction products at bottom center, and are reduced either by
adjusting the polarizers or increase of camera speed in MAX. This setup required further
adjustment.
83
84
counterclockwise from the TIR optic axis and thus sample positioning much be
compensated for by a combination of micrometer adjustments, but this can also be
accomplished with sufficient practice.
One final operator control worthy of note in the AS HoloDiffract operator’s panel
of Figure 4.7 is the movie sequence control <Start BMP Sequence> located below the
image windows. This control initiates image capture of the hologram, the phase image,
and the lookdown camera image which are saved to files for processing into movie
sequences in order to characterize phase images over time. In order to capture these
movie sequences the operator can spend lengthy periods examining and positioning
samples with the real-time phase and lookdown feeds and capture image sequences of the
most useful datasets.
4.3 Water droplets and Lens Experiments
First, we demonstrate the imaging of the reflected phase profile due to variations
of refractive index of materials in contact with the prism. As shown in Fig. 4.8(a), water
droplets of index n2=1.333 are placed on the prism of BK7 glass, n1 = 1.517. Figure
4.8(b) is the amplitude image of the reflected optical field, while Fig. 4.8(c) is the phase
image, at the object plane A, calculated from a hologram image at H., The field of view is
300 x 900 µm2 and the presumably circular water droplets, of about 100µm in diameter,
appear highly elliptical because of the relatively large angle of the plane A relative to H.
Given the angle of incidence θ1 = 72° , TIR is in effect for both glass-air and
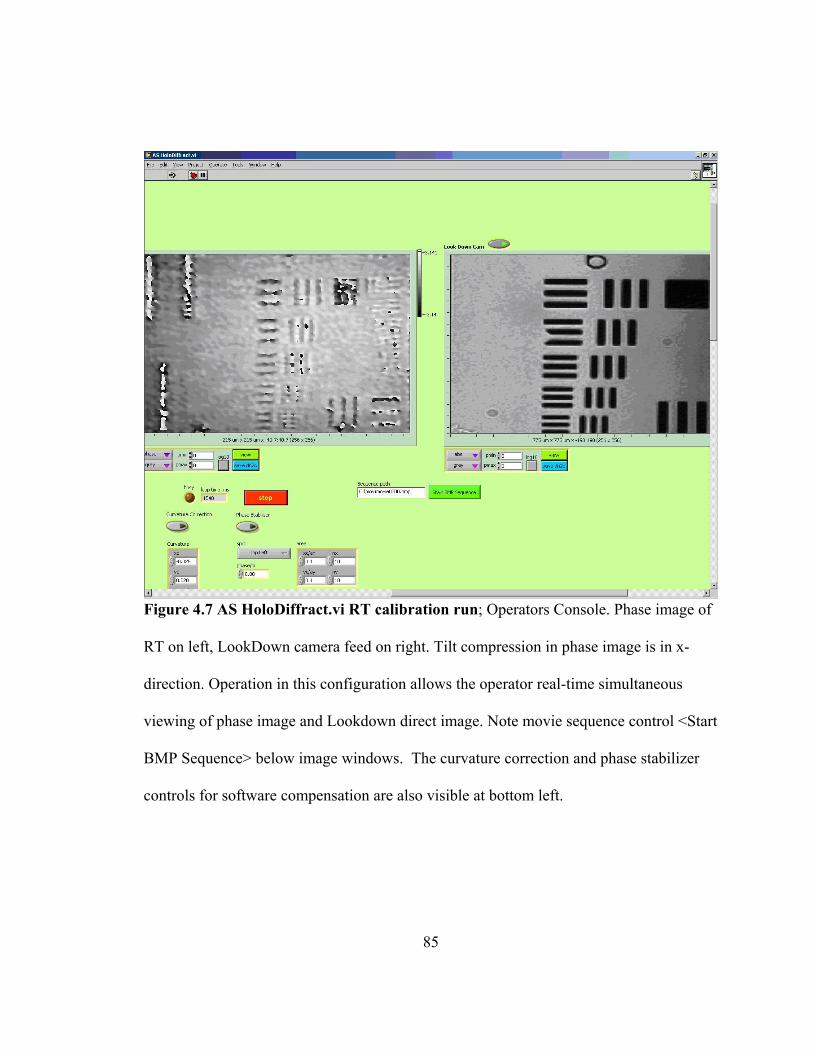
Figure 4.7 AS HoloDiffract.vi RT calibration run; Operators Console. Phase image of
RT on left, LookDown camera feed on right. Tilt compression in phase image is in x-
direction. Operation in this configuration allows the operator real-time simultaneous
viewing of phase image and Lookdown direct image. Note movie sequence control <Start
BMP Sequence> below image windows. The curvature correction and phase stabilizer
controls for software compensation are also visible at bottom left.
85
86
glass-water interfaces. The amplitude image of Fig. 4.8(b) does show variations in
intensity due to diffraction from phase discontinuities and other spurious interference.
We note that when the angle of incidence is not large enough for TIR at the glass-water
interface, the water droplets appear as black spots because of the diminished reflectance.
On the other hand, the phase image of Fig. 4.8(c) has significantly less noise or spurious
signal and displays the profile of water droplets with good fidelity. Referring to Fig.
2.2(c) in Section 2 Theory, the reflection phase shift is φ = -131° for the glass/air
interface, while it is φ = -97° for the glass/water interface, so that the phase difference
between the two areas is expected to be Δφ = 34°.
Figure 4.8(d) is a cross-section through one of the droplets of Fig. 4.8(c), where the
phase step is measured to be about Δφ = 40° ± 5°. A similar measurement is made using
50/50 mixture of water (1.333) and ethylene glycol (1.432) in Fig. 4.8(e). With presumed
index of 1.382 for the mixture, the expected phase step is Δφ = 85° , while the measured
value is Δφ = 60° ± 10°. Although these numerical values have significant uncertainties,
the trend is consistent with expectation, i.e., the larger the index difference, the larger the
phase difference.
The next experiment demonstrates imaging of phase profile resulting from
variation of thickness of the gap between two layers of materials. As depicted in Fig. 4.9
and 4.10(a), a fused quartz plano-convex lens (n3 = 1.458) of UV focal length 250 mm is
placed on the glass (n1 = 1.517) prism. Note that only the index of refraction (at visible
wavelength) and the surface curvature of the sample lens are the pertinent parameters for
this experiment, while the UV focal length is not. The angle of incidence was 75°, just
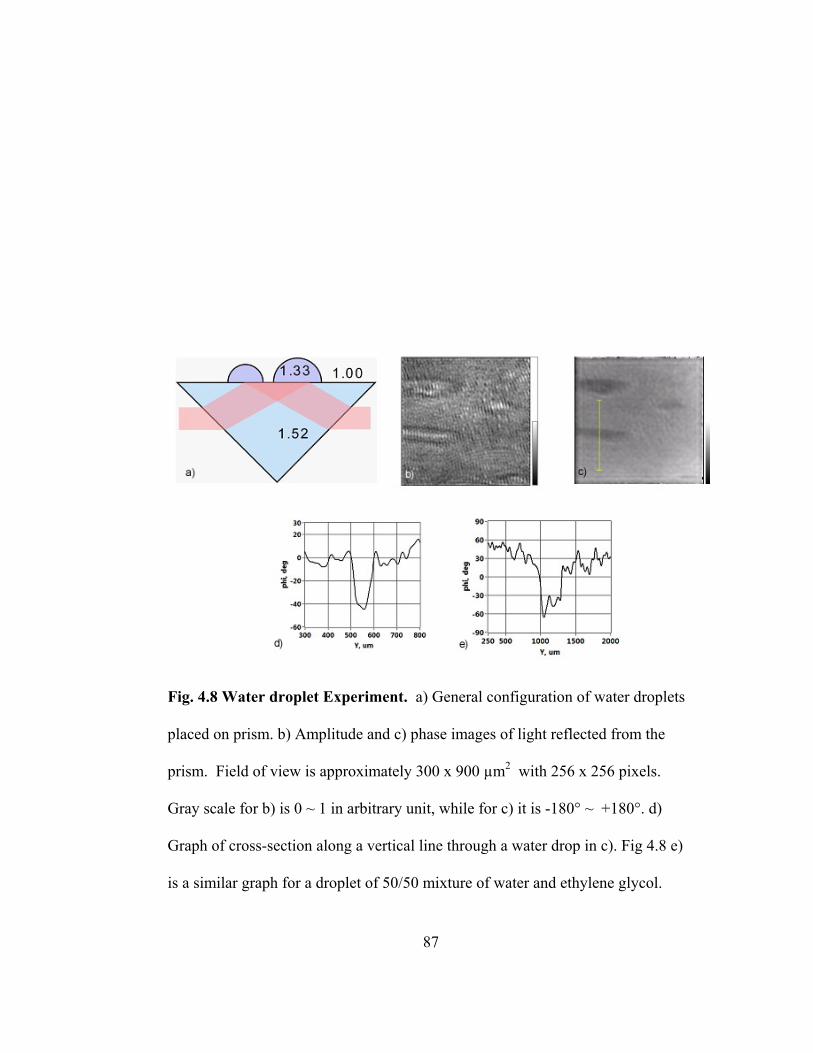
Fig. 4.8 Water droplet Experiment. a) General configuration of water droplets
placed on prism. b) Amplitude and c) phase images of light reflected from the
prism. Field of view is approximately 300 x 900 µm2 with 256 x 256 pixels.
Gray scale for b) is 0 ~ 1 in arbitrary unit, while for c) it is -180° ~ +180°. d)
Graph of cross-section along a vertical line through a water drop in c). Fig 4.8 e)
is a similar graph for a droplet of 50/50 mixture of water and ethylene glycol.
87
88
beyond the critical angle of glass-quartz interface (θc,13 = 74°). The relatively uniform
amplitude image in Fig. 4.10(b) indicates TIR, whereas the phase image in Fig. 4.10(c)
shows a clear profile of the contact area (which again has about 3:1 anamorphism). The
field of view is 260 µm horizontal by 780 µm vertical. The radius of curvature of the
convex surface is 115 mm (UV lens), so that the air gap (n2 = 1.000) goes from zero at
the point of contact to 660 nm at the edge of the 780 µm vertical field of view.
A cross-section of Fig. 4.10(c) along a vertical line through the center of the spot
is shown in Fig. 4.11(a), while Fig. 4.11(d) shows such cross-section calculated from the
given indices and curvature. The measured phase dip through the spot is 130° ± 15°,while
the modeled value is 100°. The discrepancy is attributed to spurious diffraction
perspective rendering in Fig. 4.10(d), represents the area of contact, circular shape of
about 140 µm diameter and within 20 nm between the prism and lens surfaces. That is,
the thickness of the evanescent field is about 20 nm and the profile of the lens surface
within the evanescent field can be imaged. The measurements are repeated by filling the
glass-quartz gap with 50/50 mixture of water and ethylene glycol (n2 = 1.382, Fig.
4.11(b) and 4.11(e)), and with pure ethylene glycol (n2 = 1.432, Fig. 4.11(c) and 4.11(f)).
The expected phase dips for these cases are 60° ± 15° and 35° ± 15°, while the
measured values are 80° and 50°, respectively. These measured values of phase dips as
well as the width of the spots show trends consistent with the model. When the gap is
filled with these materials, the index difference across interfaces become smaller and the
evanescent fields become thicker. The maximum gaps that can be imaged in these cases
are 70 nm and 120 nm, respectively.
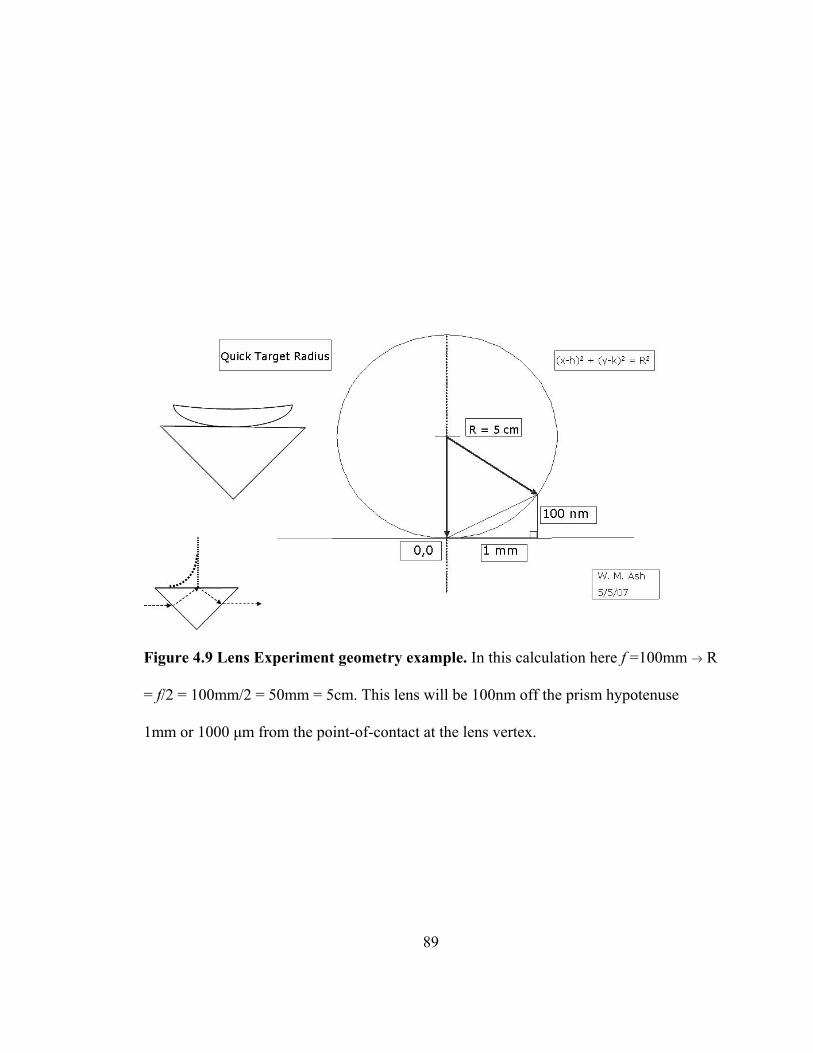
Figure 4.9 Lens Experiment geometry example. In this calculation here f =100mm → R
= f/2 = 100mm/2 = 50mm = 5cm. This lens will be 100nm off the prism hypotenuse
1mm or 1000 μm from the point-of-contact at the lens vertex.
89
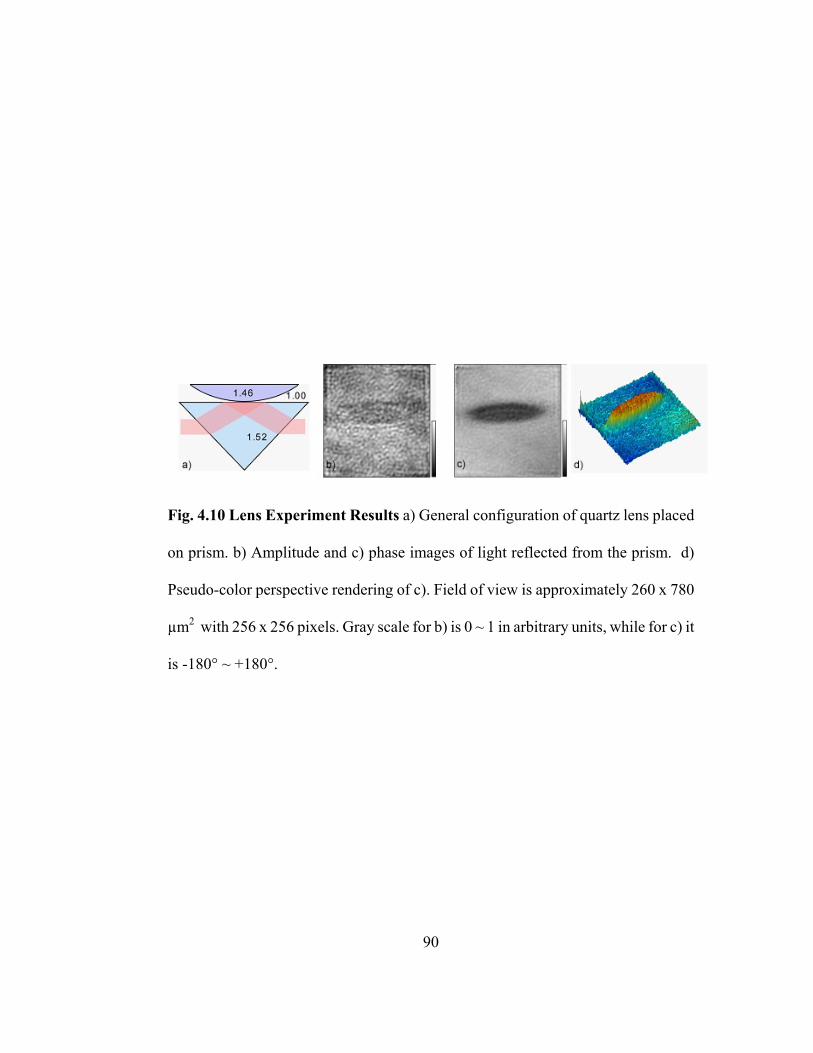
Fig. 4.10 Lens Experiment Results a) General configuration of quartz lens placed
on prism. b) Amplitude and c) phase images of light reflected from the prism. d)
Pseudo-color perspective rendering of c). Field of view is approximately 260 x 780
µm2 with 256 x 256 pixels. Gray scale for b) is 0 ~ 1 in arbitrary units, while for c) it
is -180° ~ +180°.
90
91
4.4 TIRHM of cells: Amoeba Proteus
Performed with System II as described in Section 3, Experimental Setup. Test
specimens, tissues and protists, such as the Amoeba Proteus, SKOV-3 ovarian cancer cell
and 3T3 fibroblasts presented herein, were quantitatively imaged both in amplitude and
phase to evaluate of critical performance parameters, such as its resolution limit, and
demonstrate performance as predicted by theory.
Figure 4.12 is a capture of a live Amoeba Proteus sample on a right angle SFL11
prism taken with a 10X Edmund μPlan MO and with a tilt-compression ratio of about 2:1
x-axis (tilt-compressed) versus the non-compressed y-axis. The aqueous amoeba sample
was placed in a covered reservoir directly on the hypotenuse face of the prism.
Figure 4.13 is a capture of a live Amoeba Proteus sample on a right angle SFL11
prism taken with a 10X Edmund μPlan MO. In figure 4.13 e) through h), protoplasm
movement, captured at 7 minute intervals, may be discerned by thrust activity designated
at arrow between phase captures relative to overall relaxation, shift and counterclockwise
rotation for the feature in general.
The feature in Figure 4.14. was imaged during an Amoeba Proteus run. The
features bear strong resemblance to other Proteus protoplasm. Note the near total
attenuation of amplitude signature and pronounced phase cross-section indicative of
TIR.. Taken with 10xMO on SFL11 prism with incidence of 50 degrees.
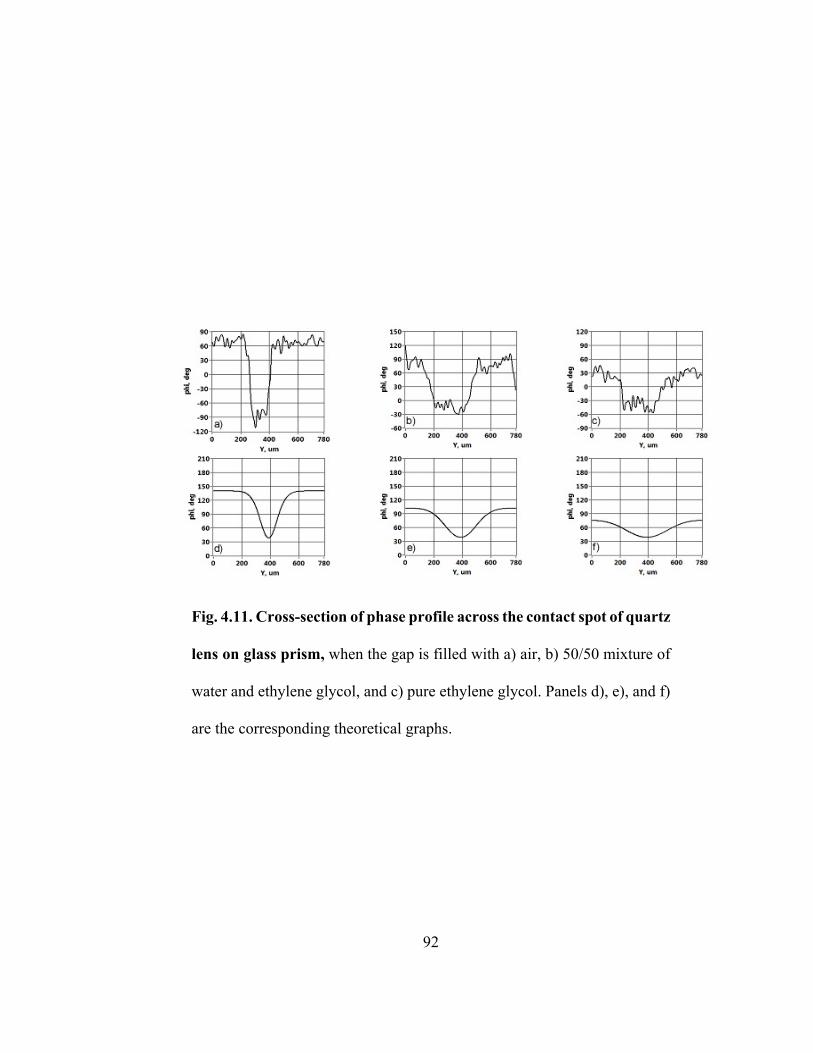
Fig. 4.11. Cross-section of phase profile across the contact spot of quartz
lens on glass prism, when the gap is filled with a) air, b) 50/50 mixture of
water and ethylene glycol, and c) pure ethylene glycol. Panels d), e), and f)
are the corresponding theoretical graphs.
92
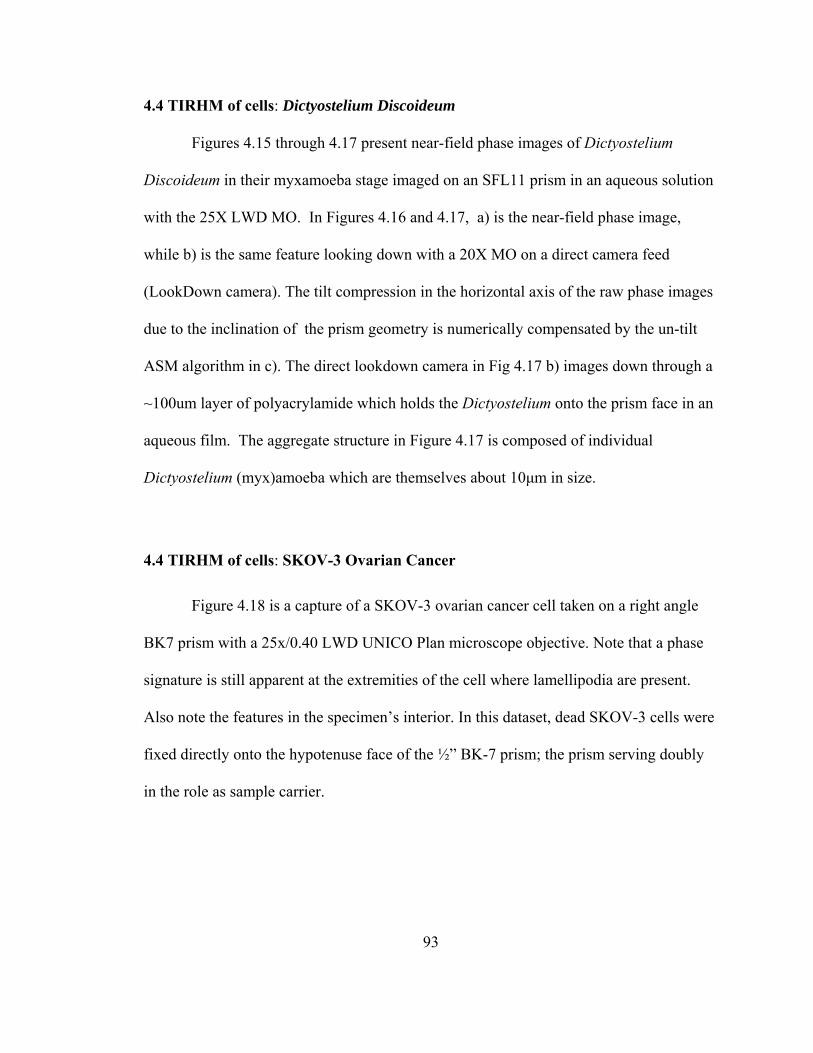
93
4.4 TIRHM of cells: Dictyostelium Discoideum
Figures 4.15 through 4.17 present near-field phase images of Dictyostelium
Discoideum in their myxamoeba stage imaged on an SFL11 prism in an aqueous solution
with the 25X LWD MO. In Figures 4.16 and 4.17, a) is the near-field phase image,
while b) is the same feature looking down with a 20X MO on a direct camera feed
(LookDown camera). The tilt compression in the horizontal axis of the raw phase images
due to the inclination of the prism geometry is numerically compensated by the un-tilt
ASM algorithm in c). The direct lookdown camera in Fig 4.17 b) images down through a
~100um layer of polyacrylamide which holds the Dictyostelium onto the prism face in an
aqueous film. The aggregate structure in Figure 4.17 is composed of individual
Dictyostelium (myx)amoeba which are themselves about 10μm in size.
4.4 TIRHM of cells: SKOV-3 Ovarian Cancer
Figure 4.18 is a capture of a SKOV-3 ovarian cancer cell taken on a right angle
BK7 prism with a 25x/0.40 LWD UNICO Plan microscope objective. Note that a phase
signature is still apparent at the extremities of the cell where lamellipodia are present.
Also note the features in the specimen’s interior. In this dataset, dead SKOV-3 cells were
fixed directly onto the hypotenuse face of the ½” BK-7 prism; the prism serving doubly
in the role as sample carrier.
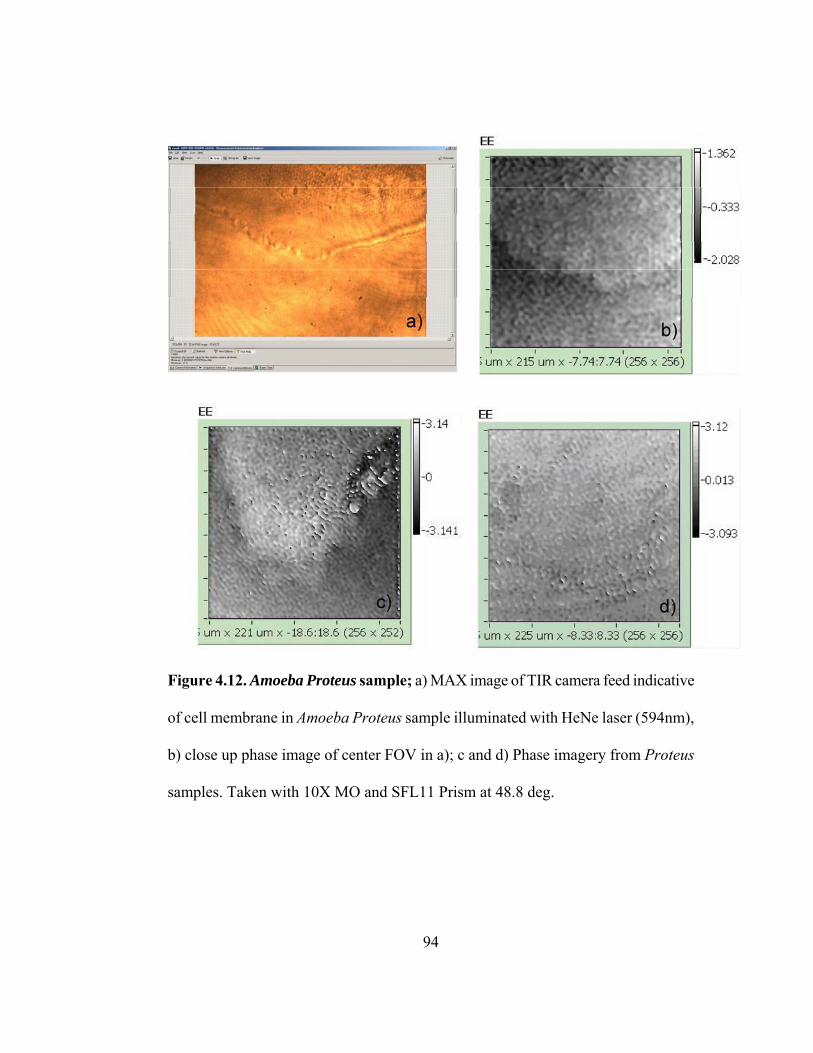
Figure 4.12. Amoeba Proteus sample; a) MAX image of TIR camera feed indicative
of cell membrane in Amoeba Proteus sample illuminated with HeNe laser (594nm),
b) close up phase image of center FOV in a); c and d) Phase imagery from Proteus
samples. Taken with 10X MO and SFL11 Prism at 48.8 deg.
94
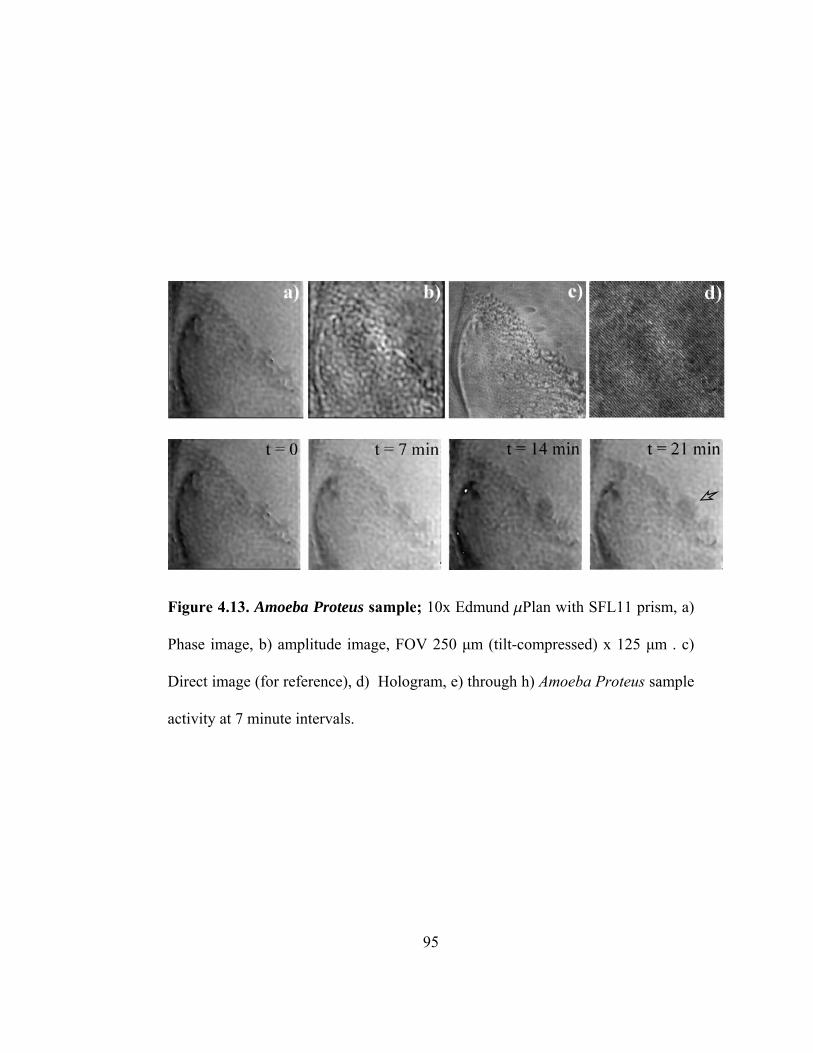
Figure 4.13. Amoeba Proteus sample; 10x Edmund mPlan with SFL11 prism, a)
Phase image, b) amplitude image, FOV 250 μm (tilt-compressed) x 125 μm . c)
Direct image (for reference), d) Hologram, e) through h) Amoeba Proteus sample
activity at 7 minute intervals.
95
Figure 4.14. Proteus Sample. This feature was imaged during an Amoeba Proteus
run. The features bear strong resemblance to other Proteus protoplasm. Note the near
total attenuation of amplitude signature and pronounced phase cross-section
indicative of TIR.. Taken with 10xMO on SFL11 prism with incidence of 50 degrees.
96
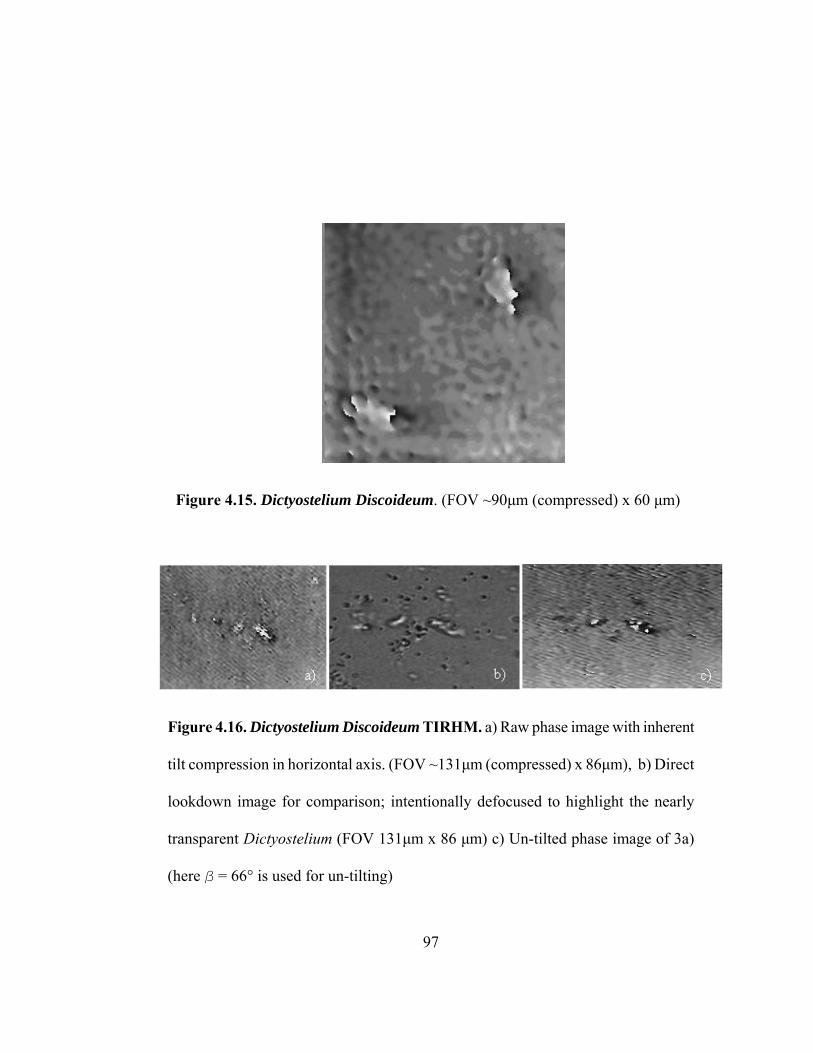
Figure 4.15. Dictyostelium Discoideum. (FOV ~90μm (compressed) x 60 μm)
Figure 4.16. Dictyostelium Discoideum TIRHM. a) Raw phase image with inherent
tilt compression in horizontal axis. (FOV ~131μm (compressed) x 86μm), b) Direct
lookdown image for comparison; intentionally defocused to highlight the nearly
transparent Dictyostelium (FOV 131μm x 86 μm) c) Un-tilted phase image of 3a)
(here β = 66° is used for un-tilting)
97
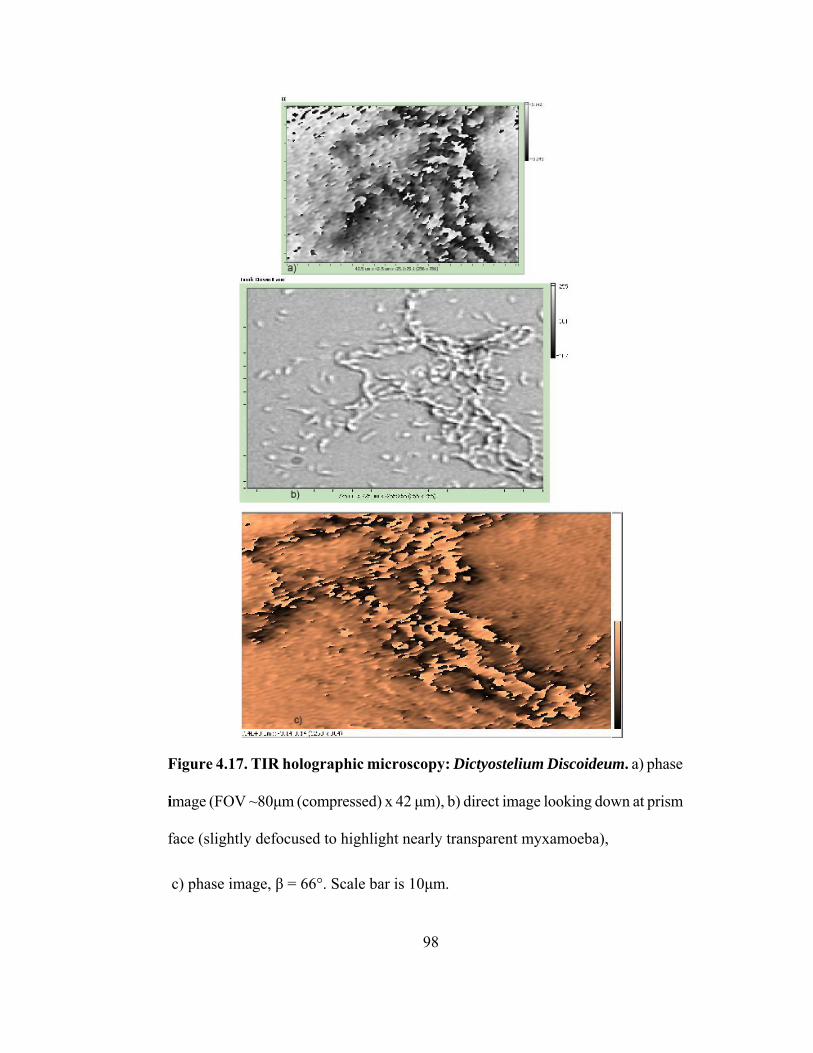
Figure 4.17. TIR holographic microscopy: Dictyostelium Discoideum. a) phase
image (FOV ~80μm (compressed) x 42 μm), b) direct image looking down at prism
face (slightly defocused to highlight nearly transparent myxamoeba),
c) phase image, β = 66°. Scale bar is 10μm.
98
99
Figure 4.19 is from the second run of SKOV-3 cultured on SFL11 prism with
25xLWD UNICO plan. This run was intiially intended to be a live run in order to
image SKOV-3 motion, however, phase signatures were not obtainable until after the
sample sat in the laboratory environemnt for 48hiurs and subject to random drying
and rehydration steps, possibly fixing the cells onto the prism face. Note that the TIR
phase image shows round feature of cell at center FOV and “ridge” adhesion below it.
Note that there is also slight rotation in the lookdown camera mount and subsequently
its FOV.
4.4 TIRHM of cells: 3T3 Fibroblast
Figure 4.20 is a capture of a 3T3 fibroblast cell taken on a right angle SFL11
prism with a 25x/0.40 LWD UNICO Plan microscope objective. Note the features in the
specimen’s interior. In this dataset, the fibroblast cells were cultured directly onto the
hypotenuse face of the SFL11 prism; the prism serving doubly in the role as sample
carrier.
While the phase image does produce an overall still capture, the pronounced
amplitude image in b) would seem to indicate a lack of full TIR. The fibroblasts were
cultured onto the prism surface still extant, their sensitivity to temperatures below 37°C,
and in vitro conditions in general, limited the duration of this data capture. In order to
alleviate this situation for future image captures, an environmental chamber such as the
prototype in use here at the laboratory is highly recommended. CO2 ambient should also
be considered.
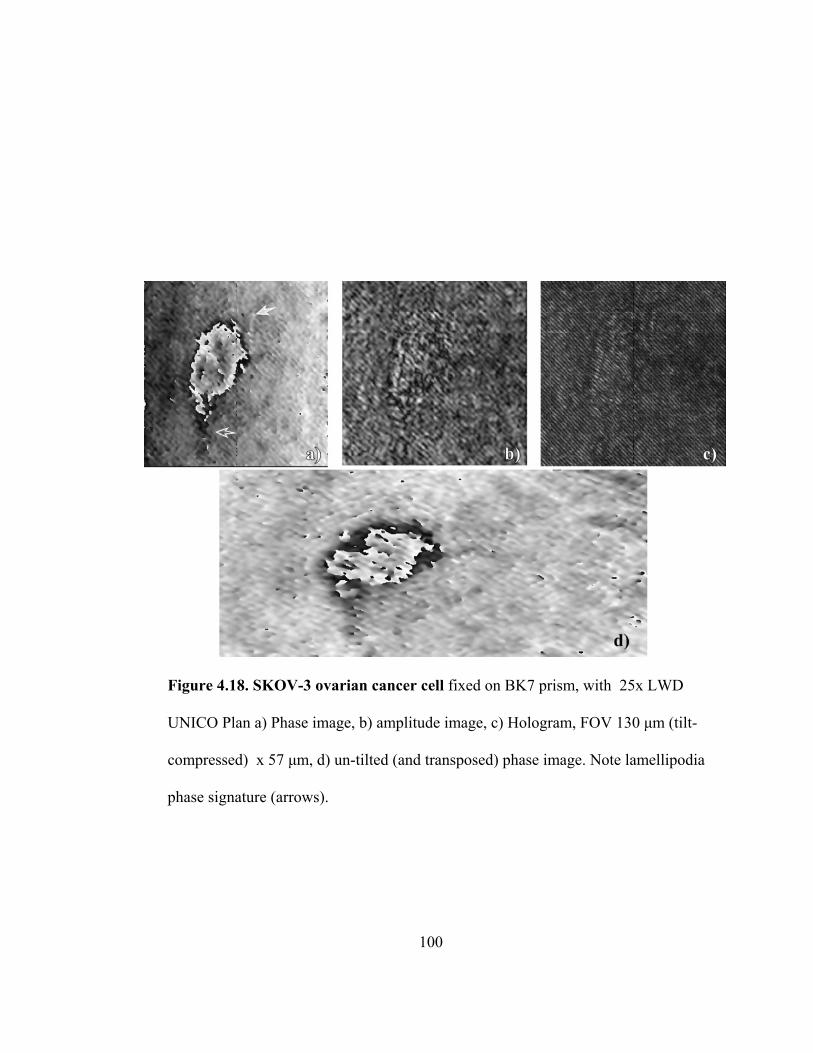
Figure 4.18. SKOV-3 ovarian cancer cell fixed on BK7 prism, with 25x LWD
UNICO Plan a) Phase image, b) amplitude image, c) Hologram, FOV 130 μm (tilt-
compressed) x 57 μm, d) un-tilted (and transposed) phase image. Note lamellipodia
phase signature (arrows).
100
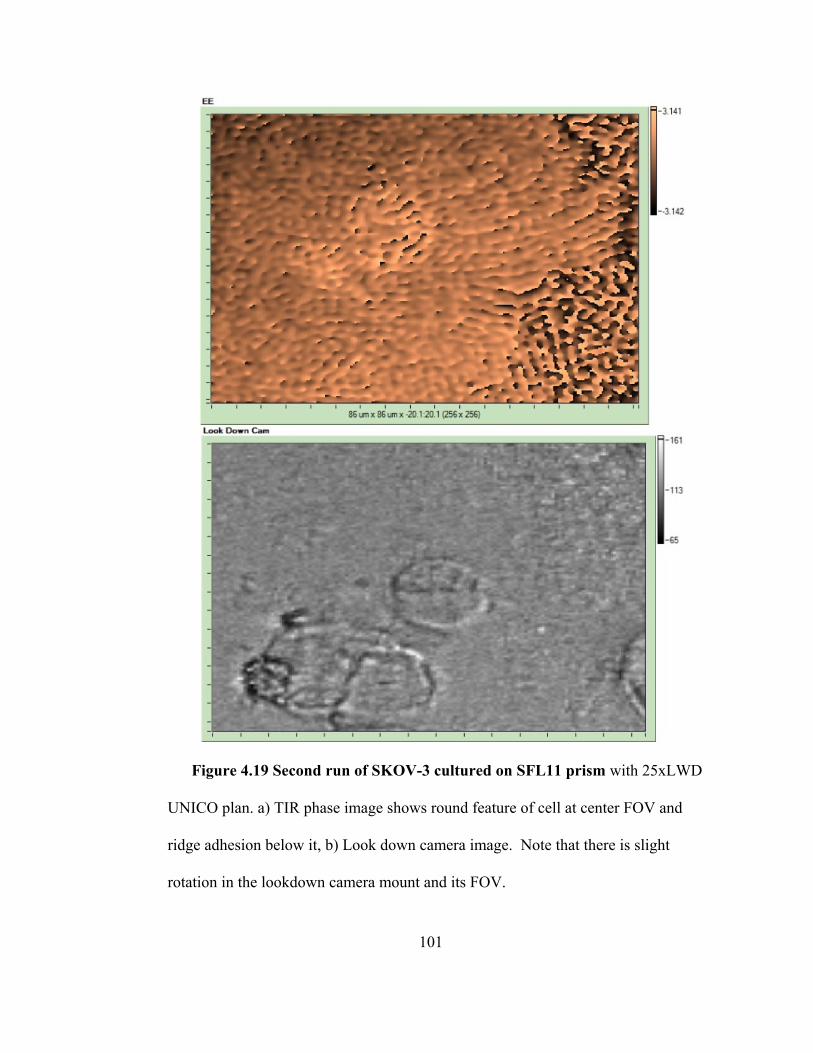
Figure 4.19 Second run of SKOV-3 cultured on SFL11 prism with 25xLWD
UNICO plan. a) TIR phase image shows round feature of cell at center FOV and
ridge adhesion below it, b) Look down camera image. Note that there is slight
rotation in the lookdown camera mount and its FOV.
101
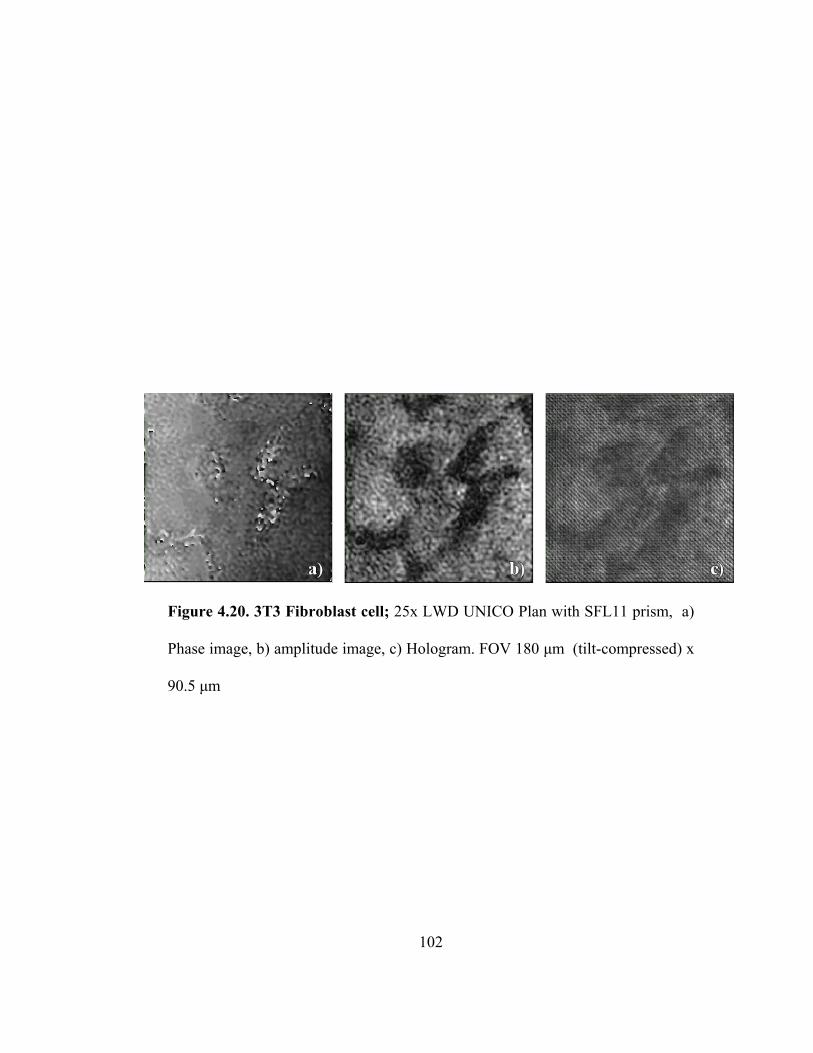
Figure 4.20. 3T3 Fibroblast cell; 25x LWD UNICO Plan with SFL11 prism, a)
Phase image, b) amplitude image, c) Hologram. FOV 180 μm (tilt-compressed) x
90.5 μm
102
103
4.5 TIRHM of cell motion
It is desirable to capture phase images of cellular adhesion over time to
characterize their dynamic behavior; this necessitates the capture of a set of temporally
correlated images as a “movie”. While this may sound simple from a theoretical
perspective, in practice, the logistics and techniques involved quickly demonstrate the
level of talent and experience required for acceptable production of this rather
straightforward concept. Variabilities that can be tolerated with “still photography”
quickly ruin the most enticing datasets and techniques thought well-honed by hours
produce often less-than-spectacular results if useful at all.
The movies here were captured as bmp’s ( device-independent bitmaps) by
routines written into LabVIEW AS Holodiffract for both the phase image and the
lookdown camera captures simultaneously (another routine captures and stores the
holograms separately for record keeping and post-processing, if necessary). The bmps
are then assembled into movies with Apple QuickTime™ Player Pro (7.6.5) with the
<File> => <Open Image Sequence> command. which allows the operator to select the
first image file out of a file folder of sequentially numbered image files and also select a
frame rate for processing (i.e. 2 frames per second). the bmps run around 150Kbytes of
memory so the assembled movies can run well into the megabyte range. Figures 4.21 and
4.22 are stills from a Proteus run taken with the standard System II 10X MO.
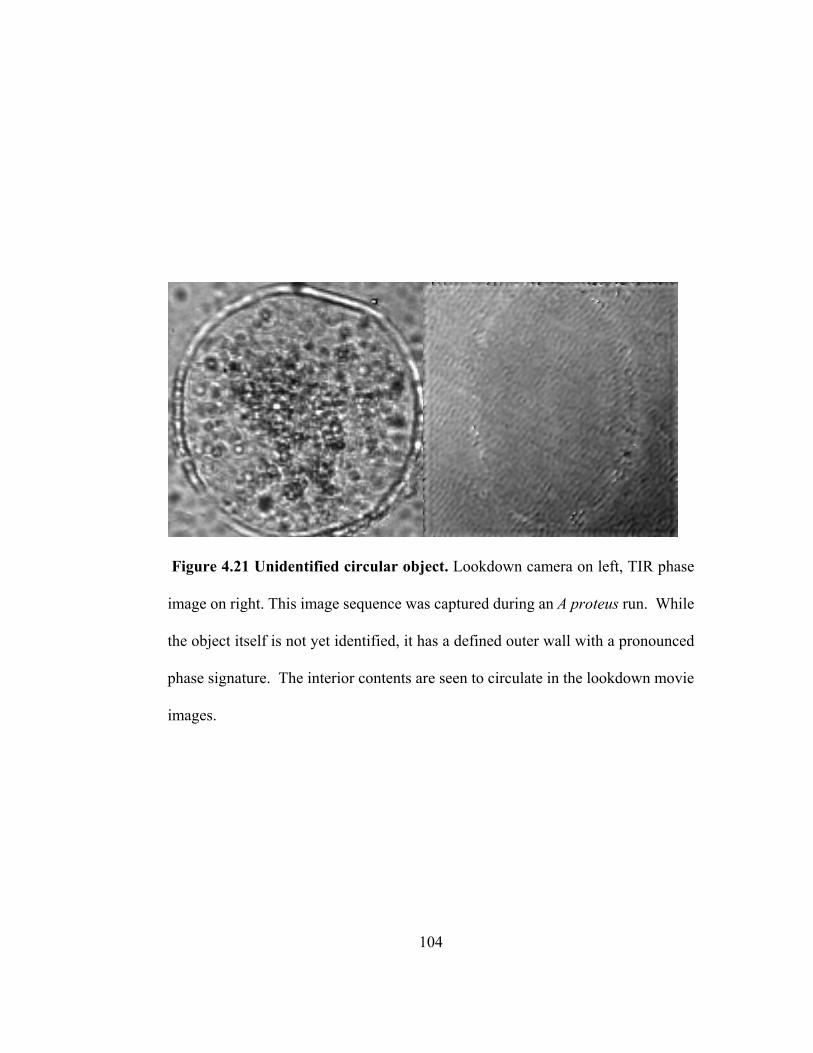
Figure 4.21 Unidentified circular object. Lookdown camera on left, TIR phase
image on right. This image sequence was captured during an A proteus run. While
the object itself is not yet identified, it has a defined outer wall with a pronounced
phase signature. The interior contents are seen to circulate in the lookdown movie
images.
104
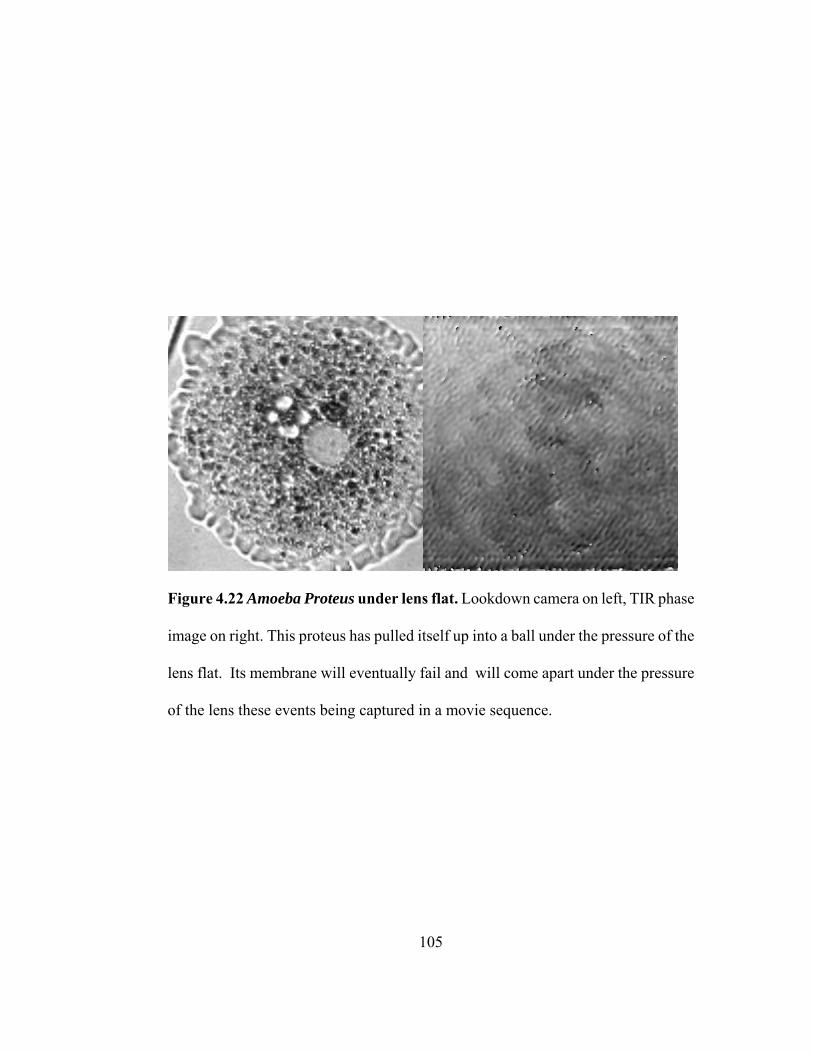
Figure 4.22 Amoeba Proteus under lens flat. Lookdown camera on left, TIR phase
image on right. This proteus has pulled itself up into a ball under the pressure of the
lens flat. Its membrane will eventually fail and will come apart under the pressure
of the lens these events being captured in a movie sequence.
105
106
CHAPTER 5
DISCUSSION
TIRHM images in the near-field without the introduction of stains or fluorophores
and makes use of the phase information that is obtained with digital holography. With
simple geometries and relative refractive indices, such as our lens and water droplet
experiments, we have demonstrated the expected phase shifts predicted by Fresnel
reflection theory within reasonable experimental variation. While we have a more
complex situation with living cells, we still see phase signatures successful being
produced. With an estimation of the cellular refractive index of n = 1.38, nominal
operation of our system currently can produce a phase contrast of approximately .35
radians (Δφwater/cell = 20°) in an aqueous solution on a n = 1.785 SFL11 prism at an angle
of incidence of some 52°. This actually exceeds the calculated phase contrast of .28
radians (Δφwater/cell = 16°). Note however, that the change in phase that is caused by the f-
TIR thickness profile (gap) between the substrate and the specimens and the relative
refractive index (RRI) phase profile from adherent parts of the investigated specimen
cannot be differentiated between without additional information or assumptions about the
nature of the specimen’s adhesions to the substrate.
107
Since the sensing face is at a sizeable incline with respect to the hologram plane,
an en face reconstruction result requires an algorithm that accounts for such inclination.
In order to appreciate the geometry of the prism required to produce the evanescent wave,
consider that, when looking through the prism, the plane of the object appears to be tilted
with respect to the holograph image plane and hence the CCD sensing array. Looking
through an SFL11 prism of n = 1.785, the object plane appears to be inclined at about an
angle of β = tan-1 (n tan θ) ~ 66° (for θi = 52°) (which then becomes the un-tilt angle).
The reader should keep in mind, however, that when imaging through a prism in
this fashion, in addition to the first-order plane-tilt and optical path effects that must be
taken into account, there are higher-order effects in applying a microscope objective
system that has been designed for an en face object plane to a tilted object plane, the
investigation of which is a subject for further study. Magnification (and N.A.) of the
objective versus available working distance through the prism’s optical path is another
key consideration that must be taken into account.
For numerical comparison, the penetration depth of the evanescent field for
532nm laser light in an SFL11 prism (n1= 1.785) at q1 = 51.7°, the 1/e evanescent wave
penetration depth into water (n2=1.333) is approximately 96nm. The same system with a
BK7 prism (n=1.517) at 62° has a 1/e depth of 266nm. Higher prism n was used to lessen
the incident angle (qi > qc) tilt for imaging, however, this has the competing effect of
reducing the penetration depth.
The Amoeba Proteus, Dictyostelium Discoideum, SKOV-3 ovarian cancer and
3T3 fibroblast samples were chosen based upon their availability, suitability, relative
108
ease of use and, especially in the instance of SKOV-3 and fibroblast, their importance to
the field.
Amoeba Proteus have been used for developmental characterization because of
their relative ease of use, their inherent interaction with the substrate and the time scale
of their motion. A drawback however, to the proteus amoeba is their size; some being
physically larger than the field-of-view (FOV) that we are dealing with here (~ 900µm).
A review of the literature noticed a curious lack of TIRFM data on A proteus and
eventually a dearth of material (apparently supplanted by Dicty work-- being the model
organism in this field) followed by a renewed interest in the organism in the mid-1980’s,
notably by Grebecki [43].
Dictyostelium Discoideum was selected for this investigation because, in addition
to being a reasonably ‘dependable’ organism to work with (i.e. availability, handling,
preparation, etc.), it is interesting in that it has motility similar to many adherent cells,
demonstrates cellular differentiation during its life cycle, and is a ‘model organism’ with
a well known and understood genome. The Dictyostelium Discoideum myxamoeba are
relatively small cells (approximately 10 microns), thus requiring a special long working
distance (LWD = 5mm) 25x/0.40 microscope objective to be used in this experiment in
order to accommodate the thickness of the prism exit path, while still providing
meaningful magnification and optical performance. Studied particularly for their
agglomeration processes, while the individual Dictyostelium make for more challenging
detailed features for this particular implementation, it is interesting to note, however, that
the phase image clearly shows distinctive composite cellular structures on the scale of the
109
overall structure captured in the aspect of this particular specimen. The conformal
polyacrylamide gelatin layer is also a useful technique having reasonable mechanical
properties to keep the specimens relatively hydrated and in the near-field, while being
quite transparent and easy to image the direct lookdown camera through.
Being a significant threat to women’s health, the study and characterization of
SKOV-3 ovarian cancer has been one of our primary goals. SKOV-3 is a relatively small
cell (approximately 30 microns), thus requiring the more powerful 25x MO to be used; a
special long working distance (LWD = 5mm) unit is employed to accommodate the
thickness of the prism exit path.
But TIRHM is not without its own set of considerations. While not necessarily
apparent from the cellular features herein, image anamorphism due to the angle of
inclination is a subject of design interest that is currently being addressed. Working
distance is a related parameter that also must be kept in mind and accounted for in the
optical design. These considerations, plus the strong desire to enter and exit
perpendicular to the face, and minimize noise and additional tilt from the refraction,
while maintaining a greater than critical angle for TIR are driving the design into custom
prism angles and refractive indices. As a result of working with the apparatus and these
procedures, we find the primary identifiable noise sources to be from the sample surface
preparation involved with handling, culturing and fixing these biological specimens.
While noisy components cannot be ruled out, system noise can be due to non-optimized
illumination that causes light scattering in the experimental setup. All of these sources
110
are alleviated with continued emphasis placed upon sample preparation, system
engineering, alignment and operation.
Also worth mention is the importance of producing and properly handling the
angular spectrum, its filtering and reconstruction. The researcher is encouraged to
visualize the superposition of the wave vectors for the object and the reference beam
plane waves and their resulting diffraction products in k-space that constitute the angular
spectrum. Alongside this is the numerical process where the spatial frequency of the
hologram is Fourier transformed into angular spectrum k-space and only those spatial
frequencies of interest around the first order diffraction peak being selected out by the
numerical filter and then reconverted back into image space gaining the phase
information in the process. As such, it is the researcher’s task to physically adjusts the
real space (laboratory) angle between the object and reference beams with the beam
recombiner cube rotation and tilt, thus altering the spatial frequency components of the
angular spectrum and placing the first order peak away from other diffraction
components for it to be properly filtered.
111
CHAPTER 6
CONCLUSIONS
We have introduced a novel analytical method of total internal reflection
holographic microscopy (TIRHM) for obtaining quantitative phase images of micron
scale surface profiles in near-field. The theory of TIRHM is developed from the basic
Fresnel description of TIR and frustrated TIR (fTIR). Phase shifts in TIR and fTIR are
calculated in terms of the indices of refraction, angle of incidence, and the gap thickness.
Digital holography allows imaging of the phase profile of TIR and two specific imaging
modes of TIRHM, relative refractive index (RRI) and f-TIR shifts are described. In RRI,
the reflection phase profile results from variation of refractive index of an object of
inhomogeneous optical property in contact with the prism. A biological cell, for example,
in complete contact with the prism surface can be imaged to reveal the intracellular
structure. In the f-TIR mode, the reflection phase profile images the gap distance between
the surfaces of the prism and an object placed on the prism. For example, a biological cell
in locomotion can reveal the profile of protrusion of pseudopodia, formation of focal
adhesion, development of traction, and release of adhesion.
The holographic microscopy of total internal reflection (TIRHM) is particularly
advantageous in cellular microscopy applications for a number of reasons. The imaging
112
makes use of total reflection, meaning essentially all of the input photons participate in
the formation of the image signals, and therefore the input optical power can be kept at
minimal level. Although the intensity images of conventional holography are often
associated with speckle and other interference noise, the phase images of digital
holography are much less susceptible to such noise. The phase image is directly
calculated from the hologram as part of the complex optical field. Therefore it is
completely quantitative and can be subjected to various numerical processing techniques.
In principle, it may be possible to image the phase front of TIR using conventional
interference techniques, but the geometry of the imaging system through the prism
requires the ability to image a plane with large inclination angle. This is not possible in
any existing microscopy technology, whereas digital holography has a great deal of
flexibility including the ability to image an inclined plane. With a relatively simple
apparatus, one can easily obtain phase images of prism-cell interface with a optical
thickness resolution of a few nanometers. We have demonstrated these imaging
principles of TIRHM using model objects of liquid droplets and spherical surface of
known material and shape. The results unambiguously demonstrate the capabilities of
TIRHM to image profiles of these parameters and indicate strengths in potential
applications in biomedical cellular imaging.
We have demonstrated a Mach-Zehnder TIRHM system that uses a prism in TIR
as a near-field imager in its object arm. The relative refractive index (RRI) shift and
frustrated TIR (f-TIR) resulting from the presence of focal adhesions and cell-substrate
interfaces on the prism’s sensing face modulating the object beam’s evanescent wave
113
phase front. Subsequent processing by digital holography allows for quantitative phase
imaging and measurement of the sample features’ surface profile. Herein we have
reviewed the near-field of Fresnel reflection theory, the angular spectrum method (ASM)
of digital holography and discussed this technique to integrate near field microscopy with
digital holography to produce a new quantitative form of near field phase microscopy.
We have also presented current results with the important model organism, Dictyostelium
Discoideum, the well-known and characterized Amoeba Proteus, as well as 3T3
fibroblast testing and SKOV-3 ovarian cancer cell imagery. Evaluation of the TIRHM
system’s critical performance parameters displays a resolution capability nearly inherent
to that of the microscope objective used, displaying reasonable definition in the phase
image down to about G7E2 (3.480 x 17.40μm) with visibility down to at least G7E5
(2.461 x 12.30μm) for a 10X/0.25 μPlan microscope objective.
Based upon the results of our phase shift imagery, we see that we can evaluate which
portions of the cell membrane are within the range of the evanescent field, capture their
phase shift, and then use this phase shift for quantitative imaging of the sample’s focal
adhesions at the sample-substrate interface. Frustrated TIR (f-TIR) and relative refractive
index phase shift from the presence of focal adhesions and cell-substrate interfaces
allows for digital holographic phase imaging such that our TIRHM method successfully
integrates phase shift digital holography with evanescent wave surface sensing and phase
profile imagery. With the near-field phase microscopy results from Dictyostelium
Discoideum and A. Proteus, and our results with SKOV-3 ovarian cancer and 3T3
fibroblasts, it is fully anticipated that near term applications include the measurement of
114
cell motility attributes and adhesion mechanics, without the need to introduce stains or
fluorophores. Particularly important are those applications leading to the understanding
of morphogenesis, embryogenesis, and cancer metastasis.
Based upon our analysis and results from our phase shift imagery, we see that
TIRHM can;
1) evaluate which portions of the cell membrane are within the range of the
evanescent field,
2) measure the phase shift for those portions of the cell, and,
3) use this phase shift for quantitative imaging of the sample’s focal adhesions at
the sample-substrate interface.
As such, this performance is indeed capable of providing a form of quantitative near-field
phase microscopy suitable for characterization of cellular adhesions and motility.
FUTURE WORK
Based upon this performance, it is fully anticipated that near term applications
include measurement of cellular adhesion and motility attributes, particularly those
important to understanding embryogenesis, morphogenesis and cancer metastasis,
without the need to introduce stains or fluorophores.
115
We also excitedly anticipate as near term opportunities, a host of new experiments
not only with new samples, but also in combination with other techniques such as
correlation of cellular adhesion pull-strength/push strength force tests, correlation testing
with fluorophore tags and evaluation of prism functionalizations both biological, such as
polylysine, conacavalin, fibronectin, laminin and collagen, and physical
functionalizations especially plasmonics. Other experiments include the study and
evaluation of wound healing/morphogenesis and quantitative characterization of cellular
membranes and motility.
As this research proceeds, all results indicate that TIRHM can soon be available
as a tool for quantitative surface imagery by clinicians and researchers. Immediate tasks
to be accomplished include, continuing to evaluate system performance and
establishment of noise floor, increasing magnification, improvements in sample
preparation and handling and new prism designs in support of these initiatives.
Evaluation of the unit’s performance will continue, and engineering development of a
clinical prototype, particularly in combination with other microscopic techniques, also
needs attention.
116
REFERENCES
[1] Leckband, Deborah and Prakasam, Anil, “Mechanism and Dynamics of Cadherin
Adhesion”, Annual Review of Biomedical Engineering, Vol. 8: 259-287 (2006).
[2] Mitra, Satyajit K., Hanson, Daniel A. & Schlaepfer, David D., “Focal adhesion
kinase: in command and control of cell motility”, Nature Reviews Molecular Cell
Biology 6, 56-68 (2005).
[3] Gumbiner, Barry M., “Regulation of cadherin-mediated adhesion in morphogenesis”,
Nature Reviews Molecular Cell Biology 6, 622-634 (2005).
[4] Jeanes, A., Gottardi, C J and Yap, A S, “Cadherins and cancer: how does cadherin
dysfunction promote tumor progression?”, Oncogene 27, 6920–6929, (2008).
[5] Bray, D., [Cell Movements: from molecules to motility], 2nd ed., Garland, New York
(2001).
[6] Ivan Cameron, Robert Rinaldi, Gerald Kriby, David Davidson, “Amoeba Proteus
117
display a walking form of locomotion”, Cell Biology Intl 31, 759-762 (2007)
[7] O’Shea, Donald C., Elements of Modern Optical Design, Wiley-Interscience, New
York, (1985), page 29.
[8] Murphy, D. B., [Fundamentals of Light Microscopy and Electronic Imaging], Wiley-
Liss, New York (2001).
[9] Zernike, F., “How I Discovered Phase Contrast”, Science, New Series, Vol. 121, No.
3141, 345-349 (1955).
[10] Spencer, M., [Fundamentals of Light Microscopy], Cambridge University Press,
London (1982).
[11] James, J. and Tanke H., [Biomedical Light Microscopy], Kluwer Academic Press,
Dordrecht (1991).
[12] Debnath, S. K., Kothiyal, M. P., Schmit, J. and Hariharan, P., "Spectrally resolved
white–light phase–shifting interference microscopy for thickness–profile measurements
of transparent thin film layers on patterned substrates," Opt. Express 14, 4662-4667
(2006). http://www.opticsinfobase.org/oe/abstract.cfm?URI=oe-14-11-4662
118
[13] Frits Zernike, Phase Contrast Microscopy, 1953 Nobel Lecture
[14] http://nobelprize.org/nobel_prizes/physics/
[15] A.S.G. Curtis, “ The mechanism of adhesion of cells to glass – a study by
interference reflection microscopy,” J Cell Biol 20, 199-215 (1964).
[16] H. Verschueren, “Interference reflection microscopy in cell biology: methodology
and applications,” J Cell Sci 75, 279-301 (1985).
[17] A.S.G. Curtis, “ The mechanism of adhesion of cells to glass – a study by
interference reflection microscopy,” J Cell Biol 20, 199-215 (1964).
[18] H. Verschueren, “Interference reflection microscopy in cell biology: methodology
and applications,” J Cell Sci 75, 279-301 (1985).
[19] D. Axelrod, “Cell-substrate contacts illuminated by total internal reflection
fluorescence,” J Cell Biol 89, 141-145 (1981).
[20] D. Axelrod, N.L. Thompson, and T.P. Burghardt, “ Total internal reflection
fluorescent microscopy,” J Microsc 129, 19-28 (1983).
119
[21] Daniel Axelrod, “Total Internal Reflection Fluorescence Microscopy in Cell
Biology”, Traffic 2: 764(2001)
[22] Schnars, U. and Jueptner, W., Digital Holography, Springer Verlag, Berlin
Heidelberg (2005).
[23] Gabor D 1971 Holography Nobel Lecture
[24] J.W. Goodman, Introduction to Fourier Optics, 2nd ed (New York, McGraw-Hill,
1996).
[25] U. Schnars and W.P. Jueptner, “Direct recording of holograms by a CCD target and
numerical reconstruction,” Appl. Opt. 33, 179-81 (1994).
[26] S. Grilli, P. Ferraro, S. De Nicola, A. Finizio, G. Pierattini and R. Meucci, “Whole
optical wavefields reconstruction by digital holography,” Opt. Express 9, 294-302
(2001).
[27] I. Yamaguchi and T. Zhang, “Phase-shifting digital holography,” Opt. Lett. 22,
1268 (1997).
[28] T.-C. Poon, “Three-dimensional image processing and optical scanning
120
holography,” Adv. Imaging & Electron Phys. 126, 329-350 (2003).
[29] E. Cuche, F. Bevilacqua and C. Depeursinge, “Digital holography for quantitative
phase-contrast imaging,” Opt. Lett. 24, 291 (1999).
[30] F. Dubois, C. Schockaert, N. Callens, and C. Yourassowsky, “Focus plane detection
criteria in digital holography microscopy by amplitude analysis,” Opt. Express 14, 5895-
5908 (2006).
[31] P. Ferraro, S. De Nicola, A. Finizio, G. Coppola, S. Grilli, C. Magro and G.
Pierattini, “Compensation of the inherent wave front curvature in digital holographic
coherent microscopy for quantitative phase-contrast imaging,” Appl. Opt. 42, 1938-46
(2003).
[232] M.L. Xu, X. Peng, J. Miao and A. Asundi, “Studies of digital microscopic
holography with applications to microstructure testing,” Appl. Opt. 40, 5046-5051
(2001).
[33] G. Pedrini and H. J. Tiziani, “Quantitative evaluation of two-dimensional dynamic
deformations using digital holography,” Opt. Laser Technol. 29, 249–256 (1997).
[34] W. Xu, M.H. Jericho, I.A. Meinertzhagen and H.J. Kreuzer, “Digital in-line
holography for biological applications,” Proc. Natl. Acad. Sci. USA 98, 11301-05 (2001).
121
[35] K.J. Chalut, W.J. Brown, and A. Wax, “Quantitative phase microscopy with
asynchronous digital holography,” Opt. Express 15, 3047-3052 (2007).
[36] D. Carl, B. Kemper, G. Wernicke, and G. von Bally, “Parameter-optimized digital
holographic microscope for high-resolution living-cell analysis,” Appl. Opt. 43, 6536-
6544 (2004).
[37] Marquet, P., Rappaz, B., Magistretti, P. J., Cuche, E., Emery, Y., Colomb, T. and
Depeursinge, C., “Digital holographic microscopy: a noninvasive contrast imaging
technique allowing quantitative visualization of living cells with sub wavelength
accuracy,” Opt. Lett. 30, 468–470, (2005).
[38] K. Jeong, J.J. Turek, and D.D. Nolte, “Fourier-domain digital holographic optical
coherence imaging of living tissue,” Appl. Opt. 46, 4999-5008 (2007).
[39] M.K. Kim, “Tomographic three-dimensional imaging of a biological specimen using
wavelength-scanning digital interference holography,” Opt. Express 7, 305-10 (2000).
[40] L. Yu and M.K. Kim, “Wavelength-scanning digital interference holography for
tomographic imaging using the angular spectrum method,” Opt. Lett. 30, 2092, 2005.
122
[41] J. Gass, A. Dakoff and M.K. Kim, “Phase imaging without 2-pi ambiguity by
multiwavelength digital holography,” Opt. Lett. 28, 1141-3 (2003).
[42] C. J. Mann, L. Yu, C.M. Lo, and M.K. Kim, “High-resolution quantitative phase-
contrast microscopy by digital holography,” Opt. Express 13, 8693-8698 (2005).
[43] C. Mann, L. Yu, and M.K. Kim, “Movies of cellular and sub-cellular motion by
digital holographic microscopy,” Biomed. Eng. Online, 5, 21 (2006).
[44] Andrzej Grebecki, “Two-directional pattern of movements on the cell surface of
Amoeba Proteus,” J. Cell Science 83 (1): 23. (1986)
[45] Lucyna Grebecka, Pawel Pomorski, Andrezej Gre and Anna Lopatowska, “Adhesion
Dependent F-Actin Pattern in Amoeba Proteus as a Common Feature of Amoebae and
the metazoan motile cells”, Cell Biology International, Vol 21, Issue 9, September 1997,
Pages 565-573
[46] Dormann, D. and Weijer C. J., “Imaging of cell migration” EMBO J. 25:3480–3493
(2006).
[47] Coates, Juliet C. and Harwood, A. J., “Cell-cell adhesion and signal transduction
during Dictyostelium development”, Journal of Cell Science 114, 4349 (2001).
123
[48] Kazuhiko S. K. Uchida and Shigehiko Yumura, “Dynamics of novel feet of
Dictyostelium cells during migration,” Journal of Cell Science 117, 1443-1455 (2004)
[49] D. C. Lovelady, T. C. Richmond, A. N. Maggi, C.-M. Lo, and D. A. Rabson,
“Distinguishing cancerous from noncancerous cells through analysis of electrical noise”
Phys. Rev. E 76, 041908 (2007)
[50] Douglas C. Lovelady, Jennifer Friedman, Sonali Patel, David A. Rabson and Chun-
Min Lo, “Detecting effects of low levels of cytochalasin B in 3T3 fibroblast cultures by
analysis of electrical noise obtained from cellular micromotion,” Biosensors and
Bioelectronics, Volume 24, Issue 7, 2250-2254 (2009)
[51] David Brown & Joan E. Strassmann, Permission: CC Creative Commons
Attribution - Share Alike 3.0, David Brown & Joan E. Strassmann
http://dictybase.org/Multimedia/DdLifeCycles/index.html
[52] De Nicola, S., Finizio, A., Pierattini, G., Ferraro, P. and Alfieri, D., “Angular
spectrum method with correction of anamorphism for numerical reconstruction of digital
holograms on tilted planes”, Opt Express 13, 9935-9940 (2005).
[53] Jeong, J. and Hong, C. K., "Pixel-size-maintained image reconstruction of digital
124
holograms on arbitrarily tilted planes by the angular spectrum method," Appl. Opt. 47,
3064-3071 (2008). http://www.opticsinfobase.org/abstract.cfm?URI=ao-47-16-3064
[54] Matsushima, Kyoji, Schimmel, Hagen and Wyrowski, Frank, "Fast calculation
method for optical diffraction on tilted planes by use of the angular spectrum of plane
waves," J. Opt. Soc. Am. A 20, 1755-1762 (2003).
http://www.opticsinfobase.org/josaa/abstract.cfm?URI=josaa-20-9-1755
[55] Marvin J. Weber, “Handbook of Optical Materials,” CRC Press, Boca Raton, 2003
125
BIBLIOGRAPHY
Born, M., Wolf, E., Principles of Optics: Electromagnetic Theory of Propagation,
Interference and Diffraction of Light, Cambridge University Press (1999)
Bray, D. Cell Movements: from molecules to motility, 2nd ed. New York: Garland (2001).
Fischer, R. E., and Tadic-Galeb, B., Optical System Design, SPIE Press; McGraw-Hill,
(2000)
Goodman, J. W., Introduction to Fourier Optics, Second Edition, McGraw-Hill, Inc.,
New York, NY (1996).
Hariharan, P., Basics of Holography, Cambridge University Press (2002).
Hariharan, P., Optical Interferometry, Second Edition, Academic Press (2003).
Hecht, E., Zajac, A., Optics, Addision Wesley Publishing, Reading, MA. (1974)
126
James, J. and Tanke H., Biomedical Light Microscopy. Dordrecht: Kluwer Academic
Press, (1991)
Murphy, D. B. Fundamentals of Light Microscopy and Electronic Imaging. New York:
Wiley-Liss, (2001).
O’Shea, Donald C., Elements of Modern Optical Design, Wiley-Interscience, New York,
(1985)
Schnars, U. and Jueptner, W., Digital Holography, Berlin: Springer Verlag, (2005).
Spencer, M. Fundamentals of Light Microscopy. New York: Cambridge University
Press, (1982).
Weber, Marvin, Handbook of Optical Materials, CRC Press, Boca Raton, FL (2003)
127
PAPERS AND CONFERENCES
Ash, William M. , Krzewina, Leo and Kim, Myung K., "Quantitative imaging of cellular
adhesion by total internal reflection holographic microscopy," Appl. Opt. 48, H144-H152
(2009).
W. M. Ash and M. K. Kim, "Digital holography of total internal reflection," Opt. Express
16, 9811-9820 (2008) http://www.opticsinfobase.org/abstract.cfm?URI=oe-16-13-9811
Ash, William M., Clark, David, Lo, Chun-Min and Kim, Myung K., "Quantitative
characterization of cellular adhesions with Total Internal Reflection Holographic
Microscopy," in Digital Holography and Three-Dimensional Imaging, OSA Technical
Digest, (2010).
Ash, William M., Clark, D., Lo, Chun-Min and Kim, Myung K., “Total internal
reflection holographic microscopy for quantitative phase characterization of cellular
adhesion”, Proc. SPIE BIOS, Vol. 7568-58, (2010).
Ash, William M. and Kim, Myung K., “Cellular imagery with total internal reflection
128
holographic microscopy” Proc. SPIE BIOS, Vol. 7182-9, (2009).
Ash, W. M. and Kim, M. K., "Total Internal Reflection Holographic Microscopy," in
Frontiers in Optics, OSA Technical Digest (CD) (Optical Society of America), paper
PDPB1, (2008) http://www.opticsinfobase.org/abstract.cfm?URI=FiO-2008-PDPB1
Kim, M. K. and Ash, W. M., "Digital Holography of Total Internal Reflection," in
Coherent Optical Technologies and Applications, (Optical Society of America), paper
CTuA4, (2008) http://www.opticsinfobase.org/abstract.cfm?URI=COTA-2008-CTuA4
W.M. Ash III and M.K. Kim, “A demonstration of total internal reflection holographic
microscopy for the study of cellular motion,” in Digital Holography and Three-
Dimensional Imaging, Opt. Soc. Am. Topical Meeting (St. Petersburg, FL, March 2008)
Technical Digest.
ABOUT THE AUTHOR
Bill Ash received his Bachelor’s of Science Degree in Physics from Indiana
University of Pennsylvania in 1985 and his Masters of Science in Applied Physics from
The Johns Hopkins University in 1995. In addition to his work at The Johns Hopkins
University Applied Physics Laboratory, he has also worked in all aspects of aerospace
systems from semiconductor fabrication to interplanetary mission analysis for NASA,
DoD and the FORTUNE 100 aerospace industry.
As part of his National Science Foundation IGERT-SKINS Fellowship at the
University of South Florida, Bill completed an integrated curriculum including work in
Electrical Engineering, Anatomy and Technical Entrepreneurship. This resulted in the
generation of one US patent for an Interfereometric Chemical Sensor Array and a
technological business venture. Bill is also a former President of the USF Student
Chapter of the Optical Society of America (OSA), a Duckworth Fellow, and a Charter
Member of the USF Inventor’s Academy.