Embed Size (px)
Citation preview

U.S. Department of the InteriorU.S. Geological Survey
Scientific Investigations Report 2010–5258
Digital Signal Processing and Interpretation of Full Waveform Sonic Log for Well BP-3-USGS, Great Sand Dunes National Park and Preserve, Alamosa County, Colorado

Digital Signal Processing and Interpretation of Full Waveform Sonic Log for Well BP-3-USGS, Great Sand Dunes National Park and Preserve, Alamosa County, Colorado
By Lauri Burke
Scientific Investigations Report 2010–5258
U.S. Department of the InteriorU.S. Geological Survey
U.S. Department of the InteriorKEN SALAZAR, Secretary
U.S. Geological SurveyMarcia K. McNutt, Director
U.S. Geological Survey, Reston, Virginia: 2011
For more information on the USGS—the Federal source for science about the Earth, its natural and living resources, natural hazards, and the environment, visit http://www.usgs.gov or call 1-888-ASK-USGS
For an overview of USGS information products, including maps, imagery, and publications, visit http://www.usgs.gov/pubprod
To order this and other USGS information products, visit http://store.usgs.gov
Any use of trade, product, or firm names is for descriptive purposes only and does not imply endorsement by the U.S. Government.
Although this report is in the public domain, permission must be secured from the individual copyright owners to reproduce any copyrighted materials contained within this report.
Suggested citation:Burke, Lauri, 2011, Digital signal processing and interpretation of full waveform sonic log for well BP-3-USGS, Great Sand Dunes National Park and Preserve, Alamosa County, Colorado: U.S. Geological Survey Scientific Investigations Report 2010–5258, 4 p.
iii
Contents
Introduction.....................................................................................................................................................1Sonic Tool Description ..................................................................................................................................1Signal Processing Methodology .................................................................................................................2Density Log......................................................................................................................................................3Results .............................................................................................................................................................3Acknowledgments .........................................................................................................................................3References Cited............................................................................................................................................4
Figures
1. Location map of the Great Sand Dunes National Park and Preserve in Alamosa County, southern Colorado ..........................................................................................................1
2. Graph showing unfiltered, full waveforms for the near and far receiver at selected depths .............................................................................................................................2
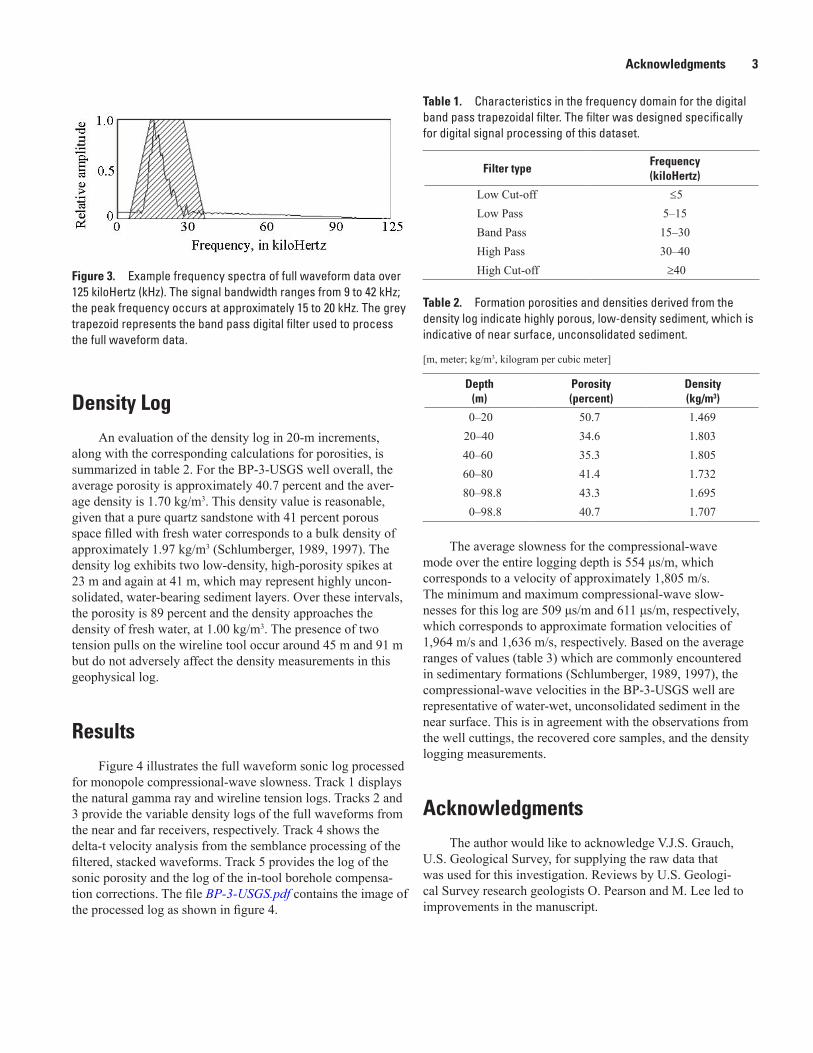
3. Graph showing example frequency spectra of full waveform data over 125 kiloHertz with band pass digital filter .........................................................................................................3
4. Full waveform sonic log processed for monopole compressional-wave slowness .........4
Tables
1. Characteristics of the digital band pass trapezoidal filter .....................................................3 2. Formation porosities and densities derived from the density log .......................................3 3. Comparison of compressional-wave slownesses and corresponding velocities
encountered in well BP-3-USGS with sonic slownesses and sonic velocities of typical subsurface materials ......................................................................................................4
iv
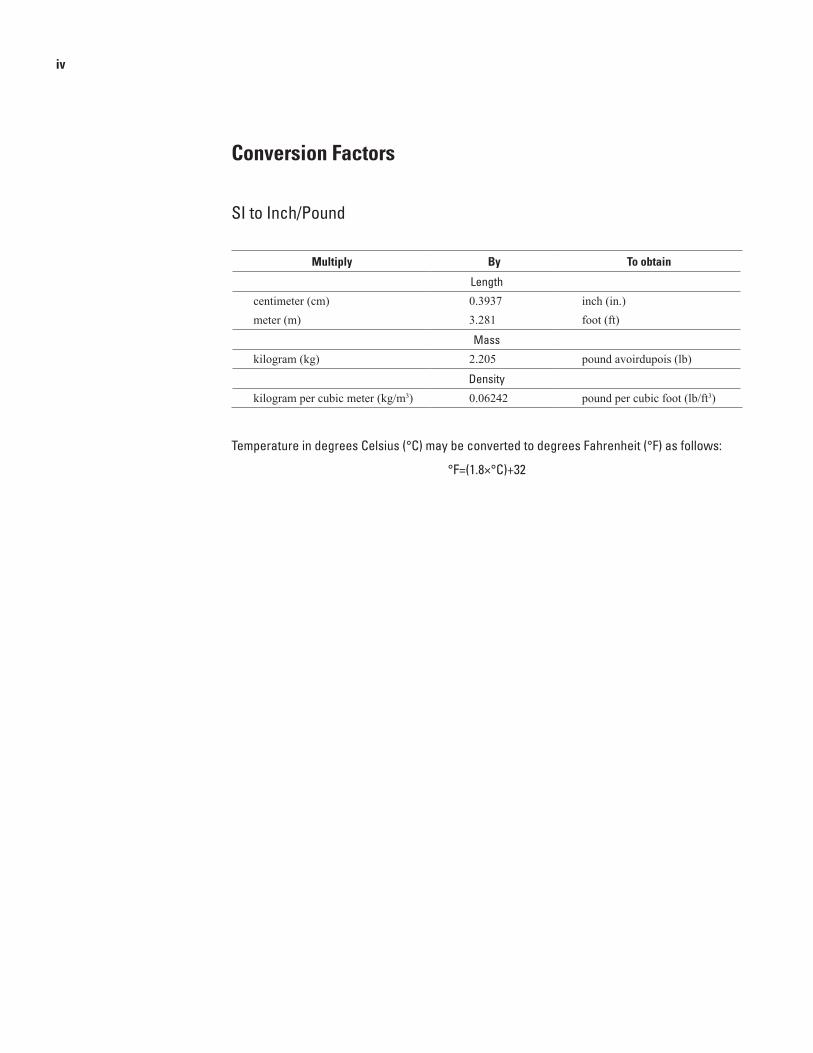
Conversion Factors
SI to Inch/Pound
Multiply By To obtain
Length
centimeter (cm) 0.3937 inch (in.)meter (m) 3.281 foot (ft)
Mass
kilogram (kg) 2.205 pound avoirdupois (lb)
Density
kilogram per cubic meter (kg/m3) 0.06242 pound per cubic foot (lb/ft3)
Temperature in degrees Celsius (°C) may be converted to degrees Fahrenheit (°F) as follows:
°F=(1.8×°C)+32
Introduction
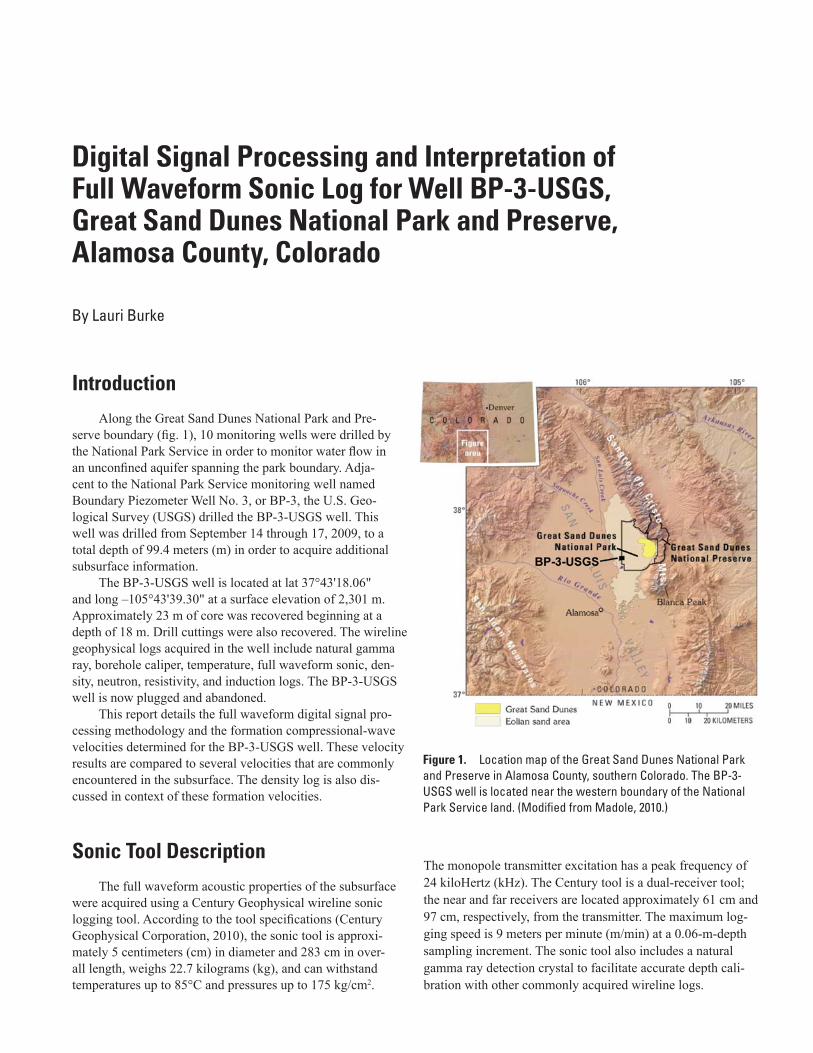
Along the Great Sand Dunes National Park and Pre-serve boundary (fig. 1), 10 monitoring wells were drilled by the National Park Service in order to monitor water flow in an unconfined aquifer spanning the park boundary. Adja-cent to the National Park Service monitoring well named Boundary Piezometer Well No. 3, or BP-3, the U.S. Geo-logical Survey (USGS) drilled the BP-3-USGS well. This well was drilled from September 14 through 17, 2009, to a total depth of 99.4 meters (m) in order to acquire additional subsurface information.
The BP-3-USGS well is located at lat 37°43'18.06" and long –105°43'39.30" at a surface elevation of 2,301 m. Approximately 23 m of core was recovered beginning at a depth of 18 m. Drill cuttings were also recovered. The wireline geophysical logs acquired in the well include natural gamma ray, borehole caliper, temperature, full waveform sonic, den-sity, neutron, resistivity, and induction logs. The BP-3-USGS well is now plugged and abandoned.
This report details the full waveform digital signal pro-cessing methodology and the formation compressional-wave velocities determined for the BP-3-USGS well. These velocity results are compared to several velocities that are commonly encountered in the subsurface. The density log is also dis-cussed in context of these formation velocities.
Sonic Tool Description
The full waveform acoustic properties of the subsurface were acquired using a Century Geophysical wireline sonic logging tool. According to the tool specifications (Century Geophysical Corporation, 2010), the sonic tool is approxi-mately 5 centimeters (cm) in diameter and 283 cm in over-all length, weighs 22.7 kilograms (kg), and can withstand temperatures up to 85°C and pressures up to 175 kg/cm2.
The monopole transmitter excitation has a peak frequency of 24 kiloHertz (kHz). The Century tool is a dual-receiver tool; the near and far receivers are located approximately 61 cm and 97 cm, respectively, from the transmitter. The maximum log-ging speed is 9 meters per minute (m/min) at a 0.06-m-depth sampling increment. The sonic tool also includes a natural gamma ray detection crystal to facilitate accurate depth cali-bration with other commonly acquired wireline logs.
Digital Signal Processing and Interpretation of Full Waveform Sonic Log for Well BP-3-USGS, Great Sand Dunes National Park and Preserve, Alamosa County, Colorado
By Lauri Burke
Figure 1. Location map of the Great Sand Dunes National Park and Preserve in Alamosa County, southern Colorado. The BP-3-USGS well is located near the western boundary of the National Park Service land. (Modified from Madole, 2010.)
2 Digital Signal Processing and Interpretation of Full Waveform Sonic Log for Well BP-3-USGS, Alamosa County, Colorado
Signal Processing Methodology
Comprehensive mathematical descriptions of wave mechanics in and around a fluid-filled borehole penetration, modern sonic tool acquisition theory, and full waveform sem-blance processing methodology can be found in Paillet and Cheng (1991).
The full waveform logging data were processed using the Full Waveform Sonic Module component for Advanced Logic Technology’s WellCAD version 4.3 software package. Full waveform processing enables the formation compressional-wave slownesses to be calculated over the depth interval of the log.
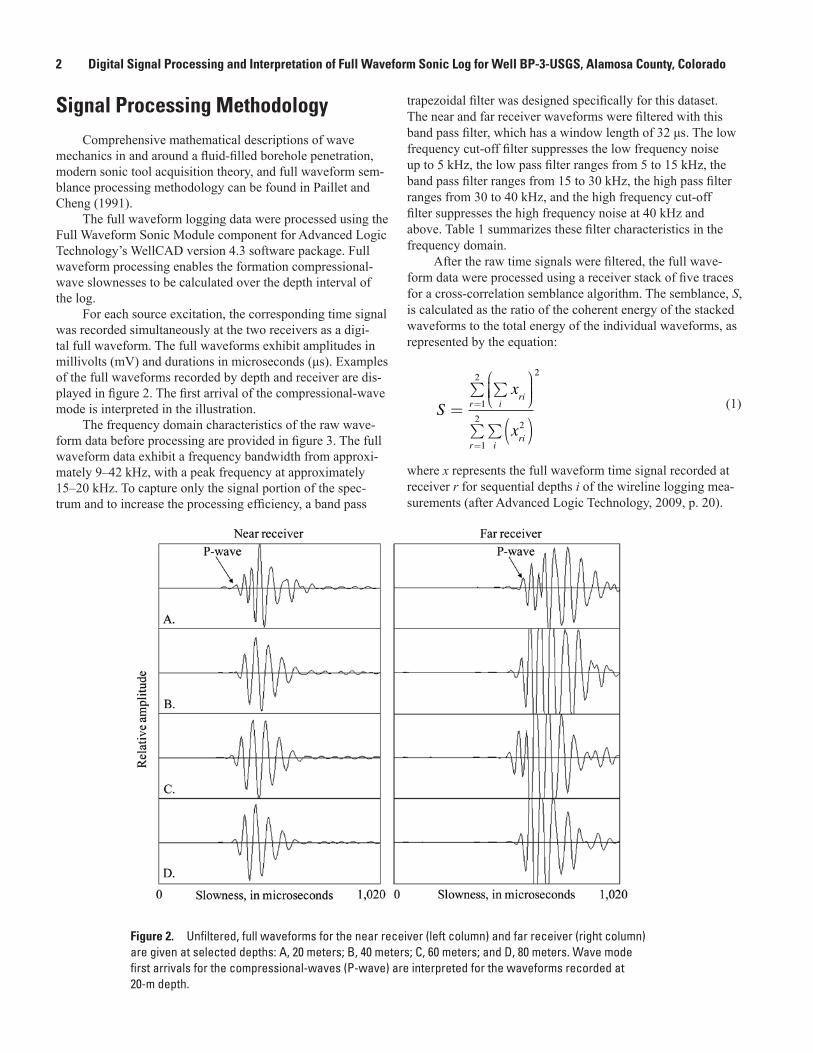
For each source excitation, the corresponding time signal was recorded simultaneously at the two receivers as a digi-tal full waveform. The full waveforms exhibit amplitudes in millivolts (mV) and durations in microseconds (μs). Examples of the full waveforms recorded by depth and receiver are dis-played in figure 2. The first arrival of the compressional-wave mode is interpreted in the illustration.
The frequency domain characteristics of the raw wave-form data before processing are provided in figure 3. The full waveform data exhibit a frequency bandwidth from approxi-mately 9–42 kHz, with a peak frequency at approximately 15–20 kHz. To capture only the signal portion of the spec-trum and to increase the processing efficiency, a band pass
trapezoidal filter was designed specifically for this dataset. The near and far receiver waveforms were filtered with this band pass filter, which has a window length of 32 μs. The low frequency cut-off filter suppresses the low frequency noise up to 5 kHz, the low pass filter ranges from 5 to 15 kHz, the band pass filter ranges from 15 to 30 kHz, the high pass filter ranges from 30 to 40 kHz, and the high frequency cut-off filter suppresses the high frequency noise at 40 kHz and above. Table 1 summarizes these filter characteristics in the frequency domain.
After the raw time signals were filtered, the full wave-form data were processed using a receiver stack of five traces for a cross-correlation semblance algorithm. The semblance, S, is calculated as the ratio of the coherent energy of the stacked waveforms to the total energy of the individual waveforms, as represented by the equation:
Sx
x
riir
riir
=∑
∑
( )∑∑
=
=
1
2
2
1
2
2
where x represents the full waveform time signal recorded at receiver r for sequential depths i of the wireline logging mea-surements (after Advanced Logic Technology, 2009, p. 20).
Figure 2. Unfiltered, full waveforms for the near receiver (left column) and far receiver (right column) are given at selected depths: A, 20 meters; B, 40 meters; C, 60 meters; and D, 80 meters. Wave mode first arrivals for the compressional-waves (P-wave) are interpreted for the waveforms recorded at 20-m depth.
(1)
Acknowledgments 3
Filter typeFrequency (kiloHertz)
Low Cut-off ≤5Low Pass 5–15Band Pass 15–30High Pass 30–40High Cut-off ≥40
Table 1. Characteristics in the frequency domain for the digital band pass trapezoidal filter. The filter was designed specifically for digital signal processing of this dataset.
Table 2. Formation porosities and densities derived from the density log indicate highly porous, low-density sediment, which is indicative of near surface, unconsolidated sediment.
[m, meter; kg/m3, kilogram per cubic meter]
Density Log
An evaluation of the density log in 20-m increments, along with the corresponding calculations for porosities, is summarized in table 2. For the BP-3-USGS well overall, the average porosity is approximately 40.7 percent and the aver-age density is 1.70 kg/m3. This density value is reasonable, given that a pure quartz sandstone with 41 percent porous space filled with fresh water corresponds to a bulk density of approximately 1.97 kg/m3 (Schlumberger, 1989, 1997). The density log exhibits two low-density, high-porosity spikes at 23 m and again at 41 m, which may represent highly uncon-solidated, water-bearing sediment layers. Over these intervals, the porosity is 89 percent and the density approaches the density of fresh water, at 1.00 kg/m3. The presence of two tension pulls on the wireline tool occur around 45 m and 91 m but do not adversely affect the density measurements in this geophysical log.
Results
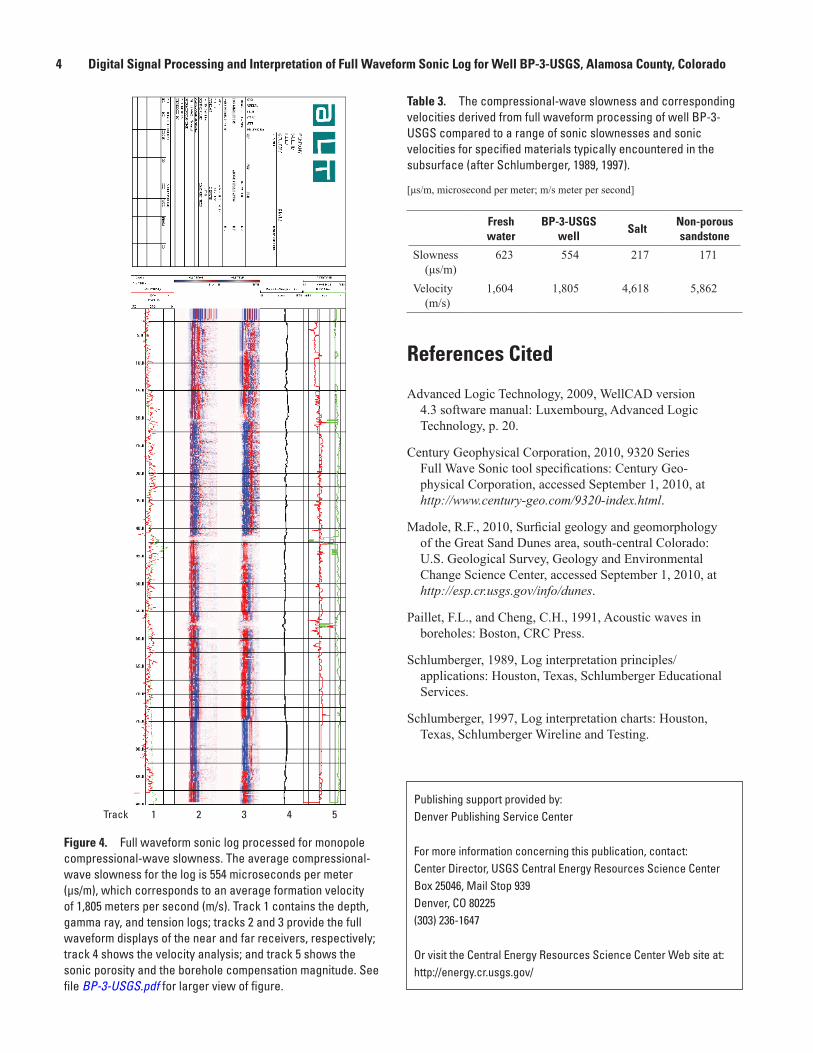
Figure 4 illustrates the full waveform sonic log processed for monopole compressional-wave slowness. Track 1 displays the natural gamma ray and wireline tension logs. Tracks 2 and 3 provide the variable density logs of the full waveforms from the near and far receivers, respectively. Track 4 shows the delta-t velocity analysis from the semblance processing of the filtered, stacked waveforms. Track 5 provides the log of the sonic porosity and the log of the in-tool borehole compensa-tion corrections. The file BP-3-USGS.pdf contains the image of the processed log as shown in figure 4.
Figure 3. Example frequency spectra of full waveform data over 125 kiloHertz (kHz). The signal bandwidth ranges from 9 to 42 kHz; the peak frequency occurs at approximately 15 to 20 kHz. The grey trapezoid represents the band pass digital filter used to process the full waveform data.
The average slowness for the compressional-wave mode over the entire logging depth is 554 μs/m, which corresponds to a velocity of approximately 1,805 m/s. The minimum and maximum compressional-wave slow-nesses for this log are 509 μs/m and 611 μs/m, respectively, which corresponds to approximate formation velocities of 1,964 m/s and 1,636 m/s, respectively. Based on the average ranges of values (table 3) which are commonly encountered in sedimentary formations (Schlumberger, 1989, 1997), the compressional-wave velocities in the BP-3-USGS well are representative of water-wet, unconsolidated sediment in the near surface. This is in agreement with the observations from the well cuttings, the recovered core samples, and the density logging measurements.
Acknowledgments
The author would like to acknowledge V.J.S. Grauch, U.S. Geological Survey, for supplying the raw data that was used for this investigation. Reviews by U.S. Geologi-cal Survey research geologists O. Pearson and M. Lee led to improvements in the manuscript.
Depth (m)
Porosity (percent)
Density (kg/m3)
0–20 50.7 1.469 20–40 34.6 1.80340–60 35.3 1.80560–80 41.4 1.73280–98.8 43.3 1.6950–98.8 40.7 1.707
4 Digital Signal Processing and Interpretation of Full Waveform Sonic Log for Well BP-3-USGS, Alamosa County, Colorado
References Cited
Advanced Logic Technology, 2009, WellCAD version 4.3 software manual: Luxembourg, Advanced Logic Technology, p. 20.
Century Geophysical Corporation, 2010, 9320 Series Full Wave Sonic tool specifications: Century Geo-physical Corporation, accessed September 1, 2010, at http://www.century-geo.com/9320-index.html.
Madole, R.F., 2010, Surficial geology and geomorphology of the Great Sand Dunes area, south-central Colorado: U.S. Geological Survey, Geology and Environmental Change Science Center, accessed September 1, 2010, at http://esp.cr.usgs.gov/info/dunes.
Paillet, F.L., and Cheng, C.H., 1991, Acoustic waves in boreholes: Boston, CRC Press.
Schlumberger, 1989, Log interpretation principles/applications: Houston, Texas, Schlumberger Educational Services.
Schlumberger, 1997, Log interpretation charts: Houston, Texas, Schlumberger Wireline and Testing.
Table 3. The compressional-wave slowness and corresponding velocities derived from full waveform processing of well BP-3-USGS compared to a range of sonic slownesses and sonic velocities for specified materials typically encountered in the subsurface (after Schlumberger, 1989, 1997).
[μs/m, microsecond per meter; m/s meter per second]
Fresh water
BP-3-USGS well
SaltNon-porous sandstone
Slowness (μs/m)
623 554 217 171
Velocity (m/s)
1,604 1,805 4,618 5,862
Track 1 2 3 4 5
Figure 4. Full waveform sonic log processed for monopole compressional-wave slowness. The average compressional-wave slowness for the log is 554 microseconds per meter (μs/m), which corresponds to an average formation velocity of 1,805 meters per second (m/s). Track 1 contains the depth, gamma ray, and tension logs; tracks 2 and 3 provide the full waveform displays of the near and far receivers, respectively; track 4 shows the velocity analysis; and track 5 shows the sonic porosity and the borehole compensation magnitude. See file BP-3-USGS.pdf for larger view of figure.
Publishing support provided by: Denver Publishing Service Center
For more information concerning this publication, contact:Center Director, USGS Central Energy Resources Science CenterBox 25046, Mail Stop 939Denver, CO 80225(303) 236-1647
Or visit the Central Energy Resources Science Center Web site at:http://energy.cr.usgs.gov/

Burke, Lauri—
Digital Signal Processing and Interpretation of Full W
aveform Sonic Log for W
ell BP-3-U
SGS, —
Scientific investigation Report 2010–5258 G
reat Sand Dunes N
ational Park and Preserve, Alam
osa County, Colorado


![ECE-V-DIGITAL SIGNAL PROCESSING [10EC52] …vtusolution.in/.../digital-signal-processing-10ec52.pdfDigital vtusolution.in Signal Processing 10EC52 TEXT BOOK: 1. DIGITAL SIGNAL PROCESSING](https://img.pdfslide.net/doc/110x75/5afe42bb7f8b9a256b8ccd2e/ece-v-digital-signal-processing-10ec52-signal-processing-10ec52-text-book.jpg)