Embed Size (px)
Citation preview
S1
SUPPORTING INFORMATION
Hybrid organic-inorganic connectivity of NdIII(pyrazine-N,N’-dioxide)[CoIII(CN)6]3- coordination chains for creating near-infrared emissive Nd(III) showing a field-induced slow magnetic relaxation
Szymon Chorazy,*,a Tomasz Charytanowicz,a Junhao Wang,b Shin-ichi Ohkoshi,b and Barbara Siekluckaa
aFaculty of Chemistry, Jagiellonian University, Gronostajowa 2, 30-387 Krakow, Poland.
bDepartment of Chemistry, School of Science, The University of Tokyo, 7-3-1 Hongo, Bunkyo-ku, Tokyo 113-0033, Japan.
*Corresponding author: [email protected]
Experimental details. S2Infrared absorption spectrum of the single crystal and the polycrystalline sample of 1. (Figure S1) S4Thermogravimetric curve of 1 with the related comment. (Figure S2) S5Crystal data and structure refinement for 1. (Table S1) S6Detailed structure parameters of 1. (Table S2) S7Results of Continuous Shape Measure Analysis for the nine-coordinated [NdIII(pzdo)(H2O)4(NC)3] complex in 1. (Table S3)
S8
Results of Continuous Shape Measure Analysis for the six-coordinated [CoIII(CN)6]3- complex in 1. (Table S4)
S8
Asymmetric unit of 1 with the non-hydrogen atoms labelling scheme. (Figure S3) S9The supramolecular arrangement of cyanido-bridged chains and non-coordinated pzdo molecules of 1 with the insight into the related hydrogen bonds. (Figure S4)
S10
Detailed interatomic distances of hydrogen bonds network of 1. (Table S5) S10Powder diffraction pattern of the polycrystalline sample of 1. (Figure S5) S11Direct-current magnetic properties of 1. (Figure S6) S12Zero-field cooled (ZFC) and field-cooled (FC) magnetic susceptibility curves of 1. (Figure S7) S12Frequency dependences of in-phase χM’ and out-of-phase χM” magnetic susceptibilities of 1 under ac magnetic field of 1 Oe, at T = 1.8 K and T = 4 K, at various values of dc magnetic field. (Figure S8)
S13
Parameters obtained by fitting the Argand χM”–χM’ plots of 1 for Hdc = 1000 Oe using the generalized Debye model. (Table S6)
S14
Temperature dependence of the relaxation time of 1 for Hdc = 1000 Oe with the results of two possible fitting procedures. (Figure S9)
S15
Overview of NdIII complexes revealing Single-Molecule Magnet behaviour. (Table S7) S16Solid state UV-Vis-NIR absorption (Kubelka-Munk function) spectra of 1 compared with the relevant spectra of pyrazine N,N’-dioxide and K3[Co(CN)6]. (Figure S10)
S17
Analysis of the solid state UV-Vis-NIR absorption spectrum of 1 compared with the analyses of the relevant spectra of pyrazine N,N’-dioxide (pzdo) and K3[CoIII(CN)6]. (Table S8)
S18
Solid state excitation and emission spectra of pyrazine N,N’-dioxide collected at 77 K. (Figure S11) S19Solid state excitation and emission spectra of K3[CoIII(CN)6] collected at 77 K. (Figure S12) S19References to Supporting Information. S20
Electronic Supplementary Material (ESI) for Dalton Transactions.This journal is © The Royal Society of Chemistry 2018
S2
Experimental details.
Materials
Neodymium(III) chloride hexahydrate (NdIIICl3·6H2O, CAS: 13477-89-9, Sigma-Aldrich) and potassium
hexacyanidocobaltate(III) (K3[CoIII(CN)6], CAS: 13963-58-1, Sigma-Aldrich) were purchased from commercial
sources, and used without further purification. Pyrazine N,N’-dioxide (pzdo) was prepared following the published
procedure through the oxidation of commercially available pyrazine (CAS: 290-37-9, Sigma-Aldrich) by using the
hydrogen peroxide under heating in the acidic water solution.S1 All the solvents used in the syntheses were reagent
grade, purchased from commercial sources, and used without further purification.
Synthesis and basic characterization of 1
For the synthesis of 1, three separate precursor solutions were prepared. Light pink solution I was obtained
by dissolving the 0.4 mmol (143 mg) portion of NdIIICl3·6H2O in the 10 mL of distilled water. Light yellow
solution II was prepared by dissolving the 2 mmol (224 mg) portion of pzdo in the 10 mL of ethanol. Colourless
solution III was obtained by dissolving the 0.4 mmol (133 mg) of K3[CoIII(CN)6] in the 10 mL of distiller water.
The freshly prepared solution II was added slowly to the solution I, and the resulting mixture was stirred for five
minutes. Then, the solution III was slowly added, and the resulting mixture stirred for five minutes. It gave
the almost colourless mixture with the small amount of white impurities which were separated by suction filtration.
The clear filtrate was left closed for crystallization. After a few days, the light pink platelet crystals of 1 were
collected by suction filtration, washed by ethanol, and dried on the air. The resulting crystalline material was stable
on the air, and could be identified by the composition of {[NdIII(pzdo)(H2O)4][CoIII(CN)6]}·0.5(pzdo)·4H2O (1)
as determined by the single-crystal X-ray diffraction analysis, and confirmed by the CHN elemental analysis,
IR spectra (Figure S1), and thermogravimetric studies (Figure S2). Yield: 126 mg, 47%.
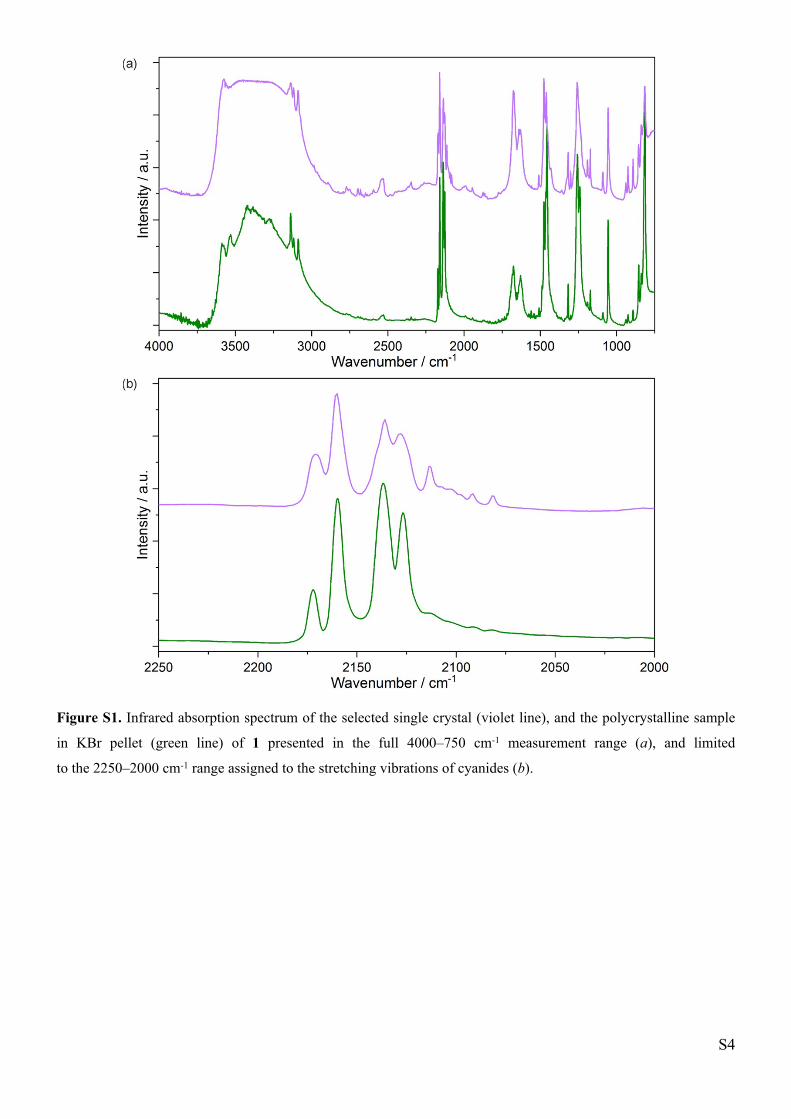
IR spectrum (cm-1, Figure S1). Cyanides stretching vibrations: 2171m, 2160s, 2139sh, 2136s, 2128s, 2124sh,
2113w, indicated the presence of both bridging and terminal cyanides within the [CoIII(CN)6]3- moieties.S2-S5
A series of peaks in the 1500–750 cm-1 range confirm the presence of pyrazine N,N’-dioxide.S1
CHN elemental analysis. Anal. Calcd. for Nd1Co1C12H22N9O11 (1, MW = 671.53 g·mol-1): C, 21.46%; H, 3.30%;
N, 18.77%. Found: C, 21.47%, H, 3.33%; N, 18.88%.
Crystal structure determination
Single crystal X-ray diffraction measurement for 1 was performed using a Bruker D8 Quest Eco Photon50 CMOS
diffractometer equipped with Mo Kα radiation and a graphite monochromator. The selected well-shaped single
crystal was taken from the mother solution, covered with Apiezon® N grease, and measured at the low temperature
of 120(2) K (Table S1). Data reduction and cell refinement were conducted using the SAINT and SADABS
programs. The reflections intensities were corrected for the compound absorption by a multi-scan method.
The structure was solved by an intrinsic phasing method using a SHELXT, and refined using a weighted full-matrix
least-squares technique on F2 within the SHELX-2014/7.S6-S7 Further calculations were executed using a WinGX
(ver. 2014.1) integrated system.S8

S3
In the crystal structure of 1, all non-hydrogen atoms were refined anisotropically. The hydrogen atoms were found
independently from the electron density map, and refined isotropically using a riding model. The positions of most
of the hydrogen atoms were restrained by using the DFIX commands for the respective O–H and C–H distances
which ensure the convergence of the refinement process, and the proper geometry of the related water molecules
and pzdo ligands. Structural diagrams (Figures 1 and S3–S4) were prepared using Mercury 3.5.1 software.
CCDC reference number for the crystal structure of 1 is 1811806.
Physical techniques
Infrared absorption spectra of 1 were collected on the tiny single crystals using a Nicolet iN10 MX FTIR
microscope, settled in a transmission mode, and, for the comparison, on the polycrystalline sample mixed and
grinded with KBr on a Jasco FTIR-4100 spectrometer. The UV-Vis-NIR diffuse reflectance spectra of 1
and the reference materials were measured on the polycrystalline samples grinded with barium sulphate using a
Jasco V-670 spectrophotometer. Thermogravimetric curve was measured on a Rigaku Thermo Plus TG8120
in the 20–375 °C range under an air atmosphere under a heating rate of 1 °C·min-1. Elemental analysis of C, H,
and N elements were performed using an EuroEA EuroVector elemental analyser. Powder X-ray diffraction pattern
of 1 was collected for the air-dried polycrystalline sample using a PANalytical X′Pert PRO MPD diffractometer
equipped with a Cu-Kα radiation source, and a capillary system to avoid the disturbing effect of the preferred
orientation of the platelet microcrystals.
Solid state photoluminescent spectra, including emission and excitation spectra, were gathered using a Horiba
Jobin-Yvon Fluorolog-3 (FL3-211) spectrofluorimeter (model TKN-7) equipped with an Xe (450 W) lamp. For the
UV-Vis range of 250–850 nm, a room temperature R928P emission detector operating in photon-counting mode
was applied. For measurements in the NIR region of 800–1550 nm, a liquid-nitrogen-cooled version of an InGaAs
photodiode detector DSS-IGA020 L was used. The emission and excitation data were collected and analysed using
FluorEssence® software. Part of the measurements were performed at 77 K in a cryostat filled with liquid nitrogen.
Magnetic properties were investigated using a Quantum Design MPMS-3 Evercool magnetometer.
The microcrystals covered by the small amount of the water/ethanol mixture was loaded into two plastic bags.
Then, the sample was fixed to long quartz stick using small piece of a kapton tape. The data of magnetic
susceptibility were corrected for the diamagnetic contributions of the sample holders (foil and kapton), and
diamagnetism of the samples themselves using Pascal constants.S9
Calculations
Continuous Shape Measure Analysis for coordination sphere of nine-coordinated NdIII and six-coordinated CoIII
complexes of 1 was conducted using SHAPE software ver. 2.1.S10-S11
S4
Figure S1. Infrared absorption spectrum of the selected single crystal (violet line), and the polycrystalline sample
in KBr pellet (green line) of 1 presented in the full 4000–750 cm-1 measurement range (a), and limited
to the 2250–2000 cm-1 range assigned to the stretching vibrations of cyanides (b).
S5
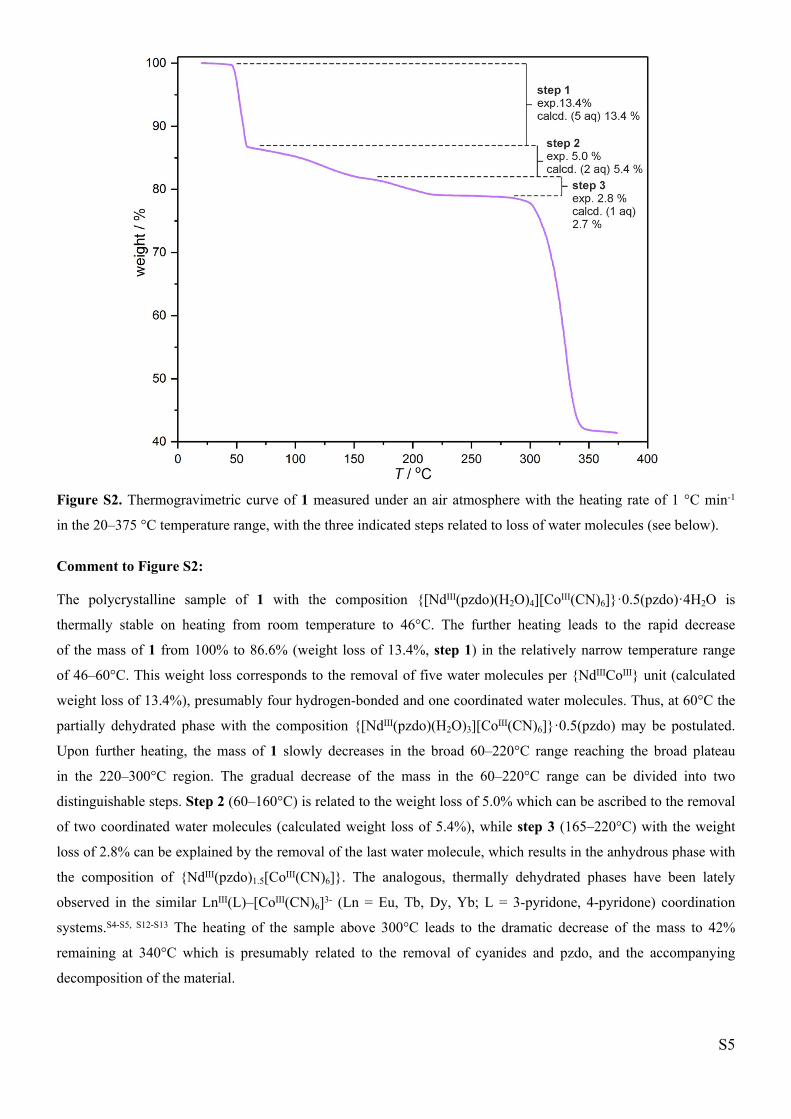
Figure S2. Thermogravimetric curve of 1 measured under an air atmosphere with the heating rate of 1 °C min-1
in the 20–375 °C temperature range, with the three indicated steps related to loss of water molecules (see below).
Comment to Figure S2:
The polycrystalline sample of 1 with the composition {[NdIII(pzdo)(H2O)4][CoIII(CN)6]}·0.5(pzdo)·4H2O is
thermally stable on heating from room temperature to 46°C. The further heating leads to the rapid decrease
of the mass of 1 from 100% to 86.6% (weight loss of 13.4%, step 1) in the relatively narrow temperature range
of 46–60°C. This weight loss corresponds to the removal of five water molecules per {NdIIICoIII} unit (calculated
weight loss of 13.4%), presumably four hydrogen-bonded and one coordinated water molecules. Thus, at 60°C the
partially dehydrated phase with the composition {[NdIII(pzdo)(H2O)3][CoIII(CN)6]}·0.5(pzdo) may be postulated.
Upon further heating, the mass of 1 slowly decreases in the broad 60–220°C range reaching the broad plateau
in the 220–300°C region. The gradual decrease of the mass in the 60–220°C range can be divided into two
distinguishable steps. Step 2 (60–160°C) is related to the weight loss of 5.0% which can be ascribed to the removal
of two coordinated water molecules (calculated weight loss of 5.4%), while step 3 (165–220°C) with the weight
loss of 2.8% can be explained by the removal of the last water molecule, which results in the anhydrous phase with
the composition of {NdIII(pzdo)1.5[CoIII(CN)6]}. The analogous, thermally dehydrated phases have been lately
observed in the similar LnIII(L)–[CoIII(CN)6]3- (Ln = Eu, Tb, Dy, Yb; L = 3-pyridone, 4-pyridone) coordination
systems.S4-S5, S12-S13 The heating of the sample above 300°C leads to the dramatic decrease of the mass to 42%
remaining at 340°C which is presumably related to the removal of cyanides and pzdo, and the accompanying
decomposition of the material.
S6
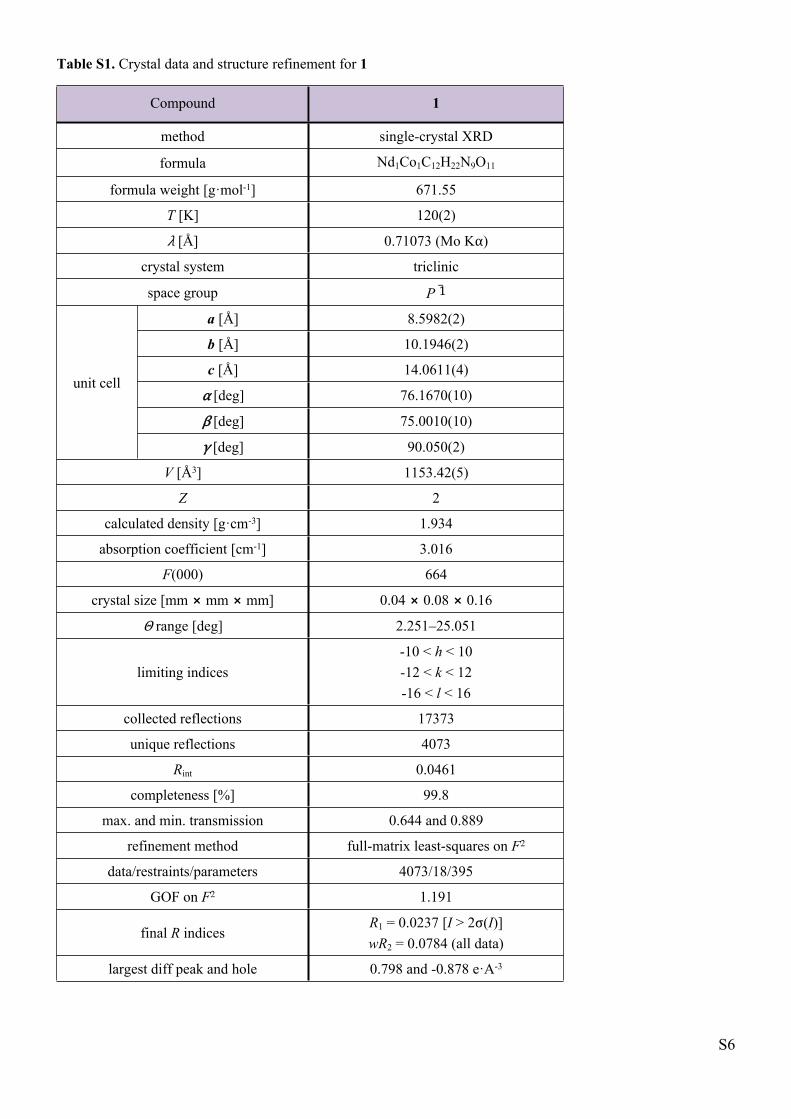
Table S1. Crystal data and structure refinement for 1
Compound 1
method single-crystal XRD
formula Nd1Co1C12H22N9O11
formula weight [g·mol-1] 671.55
T [K] 120(2)
λ [Å] 0.71073 (Mo Kα)
crystal system triclinic
space group P 1̅
a [Å] 8.5982(2)
b [Å] 10.1946(2)
c [Å] 14.0611(4)
α [deg] 76.1670(10)
β [deg] 75.0010(10)
unit cell
γ [deg] 90.050(2)
V [Å3] 1153.42(5)
Z 2
calculated density [g·cm-3] 1.934
absorption coefficient [cm-1] 3.016
F(000) 664
crystal size [mm ⨯ mm ⨯ mm] 0.04 ⨯ 0.08 ⨯ 0.16
Θ range [deg] 2.251–25.051
limiting indices-10 < h < 10-12 < k < 12-16 < l < 16
collected reflections 17373
unique reflections 4073
Rint 0.0461
completeness [%] 99.8
max. and min. transmission 0.644 and 0.889
refinement method full-matrix least-squares on F2
data/restraints/parameters 4073/18/395
GOF on F2 1.191
final R indicesR1 = 0.0237 [I > 2σ(I)]wR2 = 0.0784 (all data)
largest diff peak and hole 0.798 and -0.878 e·A-3
S7
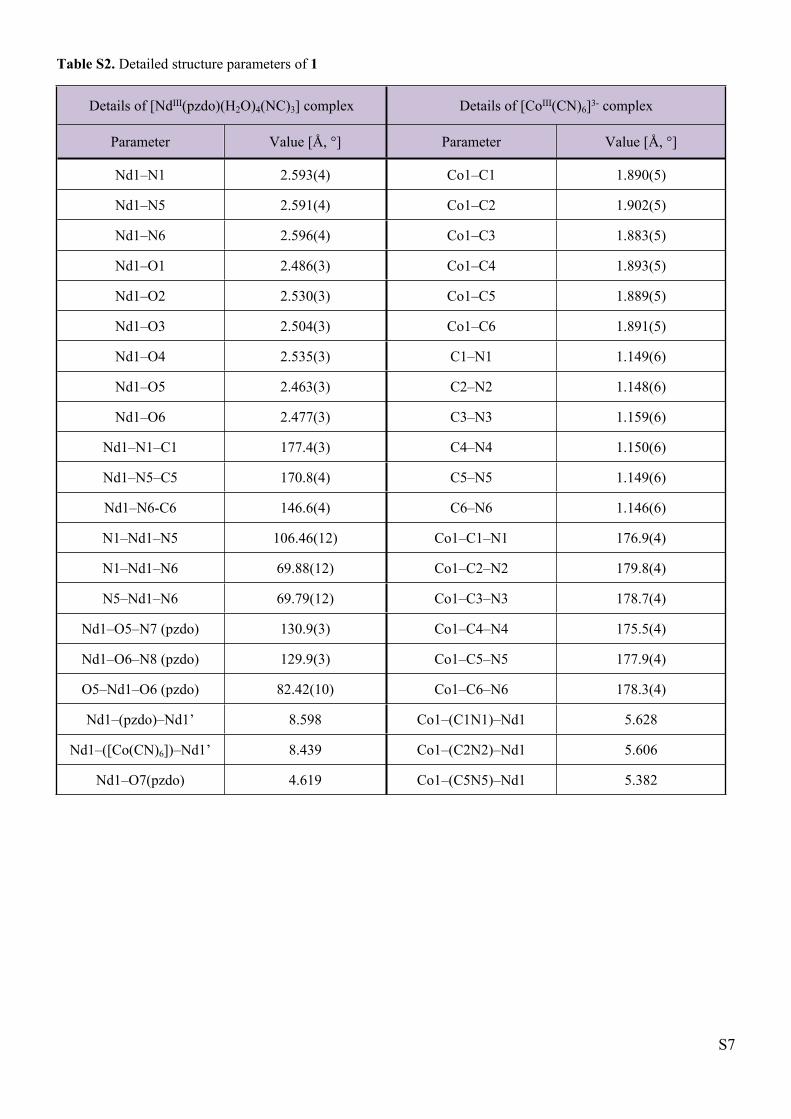
Table S2. Detailed structure parameters of 1
Details of [NdIII(pzdo)(H2O)4(NC)3] complex Details of [CoIII(CN)6]3- complex
Parameter Value [Å, °] Parameter Value [Å, °]
Nd1–N1 2.593(4) Co1–C1 1.890(5)
Nd1–N5 2.591(4) Co1–C2 1.902(5)
Nd1–N6 2.596(4) Co1–C3 1.883(5)
Nd1–O1 2.486(3) Co1–C4 1.893(5)
Nd1–O2 2.530(3) Co1–C5 1.889(5)
Nd1–O3 2.504(3) Co1–C6 1.891(5)
Nd1–O4 2.535(3) C1–N1 1.149(6)
Nd1–O5 2.463(3) C2–N2 1.148(6)
Nd1–O6 2.477(3) C3–N3 1.159(6)
Nd1–N1–C1 177.4(3) C4–N4 1.150(6)
Nd1–N5–C5 170.8(4) C5–N5 1.149(6)
Nd1–N6-C6 146.6(4) C6–N6 1.146(6)
N1–Nd1–N5 106.46(12) Co1–C1–N1 176.9(4)
N1–Nd1–N6 69.88(12) Co1–C2–N2 179.8(4)
N5–Nd1–N6 69.79(12) Co1–C3–N3 178.7(4)
Nd1–O5–N7 (pzdo) 130.9(3) Co1–C4–N4 175.5(4)
Nd1–O6–N8 (pzdo) 129.9(3) Co1–C5–N5 177.9(4)
O5–Nd1–O6 (pzdo) 82.42(10) Co1–C6–N6 178.3(4)
Nd1–(pzdo)–Nd1’ 8.598 Co1–(C1N1)–Nd1 5.628
Nd1–([Co(CN)6])–Nd1’ 8.439 Co1–(C2N2)–Nd1 5.606
Nd1–O7(pzdo) 4.619 Co1–(C5N5)–Nd1 5.382
S8
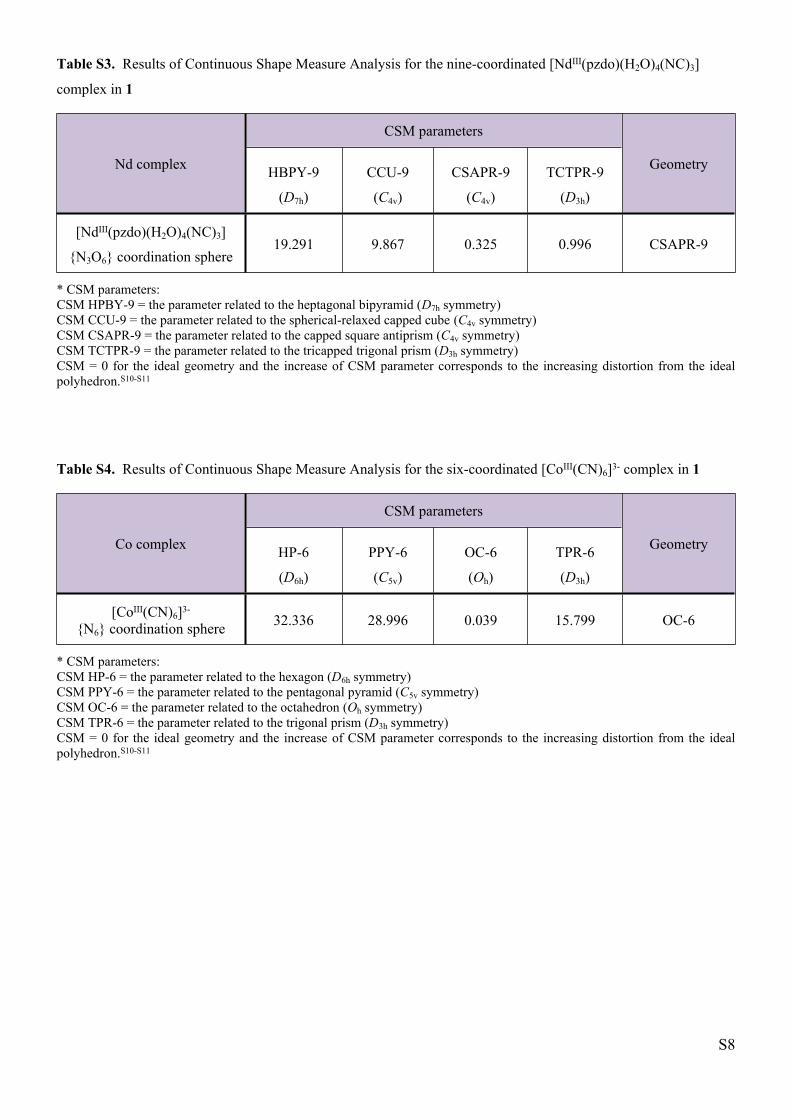
Table S3. Results of Continuous Shape Measure Analysis for the nine-coordinated [NdIII(pzdo)(H2O)4(NC)3]
complex in 1
CSM parameters
Nd complex HBPY-9
(D7h)
CCU-9
(C4v)
CSAPR-9
(C4v)
TCTPR-9
(D3h)
Geometry
[NdIII(pzdo)(H2O)4(NC)3]
{N3O6} coordination sphere19.291 9.867 0.325 0.996 CSAPR-9
* CSM parameters:CSM HPBY-9 = the parameter related to the heptagonal bipyramid (D7h symmetry)CSM CCU-9 = the parameter related to the spherical-relaxed capped cube (C4v symmetry)CSM CSAPR-9 = the parameter related to the capped square antiprism (C4v symmetry)CSM TCTPR-9 = the parameter related to the tricapped trigonal prism (D3h symmetry)CSM = 0 for the ideal geometry and the increase of CSM parameter corresponds to the increasing distortion from the ideal polyhedron.S10-S11
Table S4. Results of Continuous Shape Measure Analysis for the six-coordinated [CoIII(CN)6]3- complex in 1
CSM parameters
Co complex HP-6
(D6h)
PPY-6
(C5v)
OC-6
(Oh)
TPR-6
(D3h)
Geometry
[CoIII(CN)6]3- {N6} coordination sphere 32.336 28.996 0.039 15.799 OC-6
* CSM parameters:CSM HP-6 = the parameter related to the hexagon (D6h symmetry)CSM PPY-6 = the parameter related to the pentagonal pyramid (C5v symmetry)CSM OC-6 = the parameter related to the octahedron (Oh symmetry)CSM TPR-6 = the parameter related to the trigonal prism (D3h symmetry)CSM = 0 for the ideal geometry and the increase of CSM parameter corresponds to the increasing distortion from the ideal polyhedron.S10-S11
S9
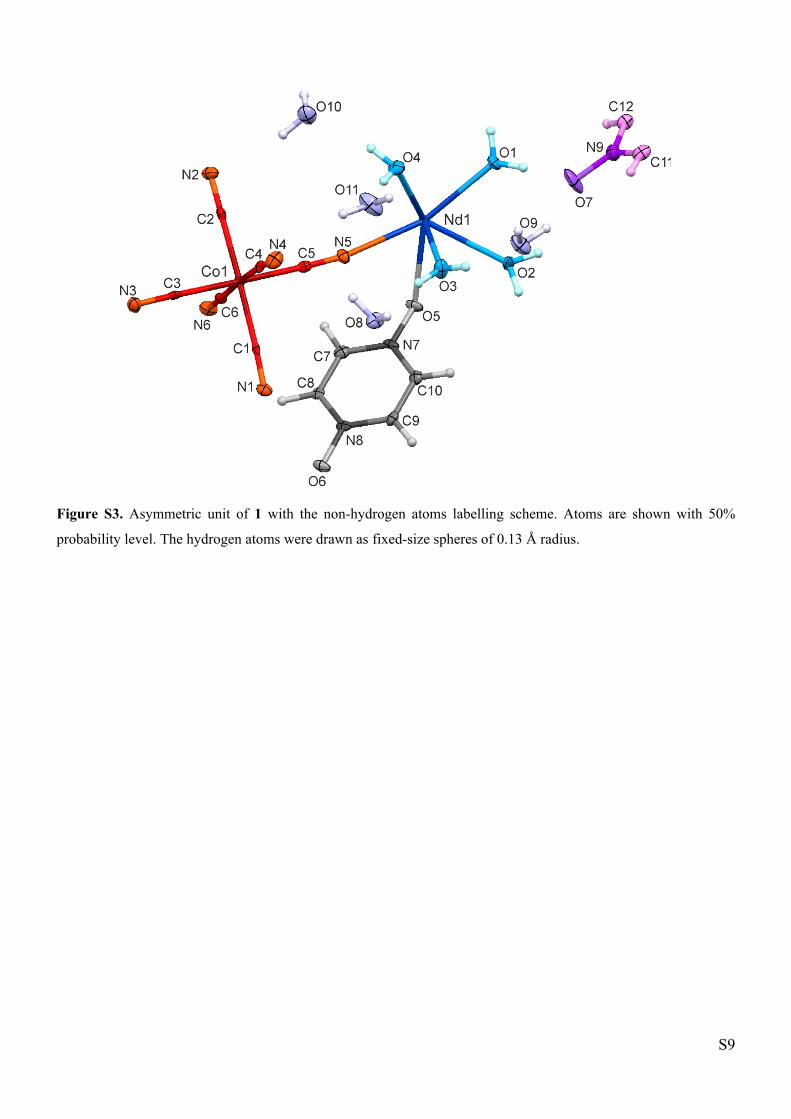
Figure S3. Asymmetric unit of 1 with the non-hydrogen atoms labelling scheme. Atoms are shown with 50%
probability level. The hydrogen atoms were drawn as fixed-size spheres of 0.13 Å radius.
S10
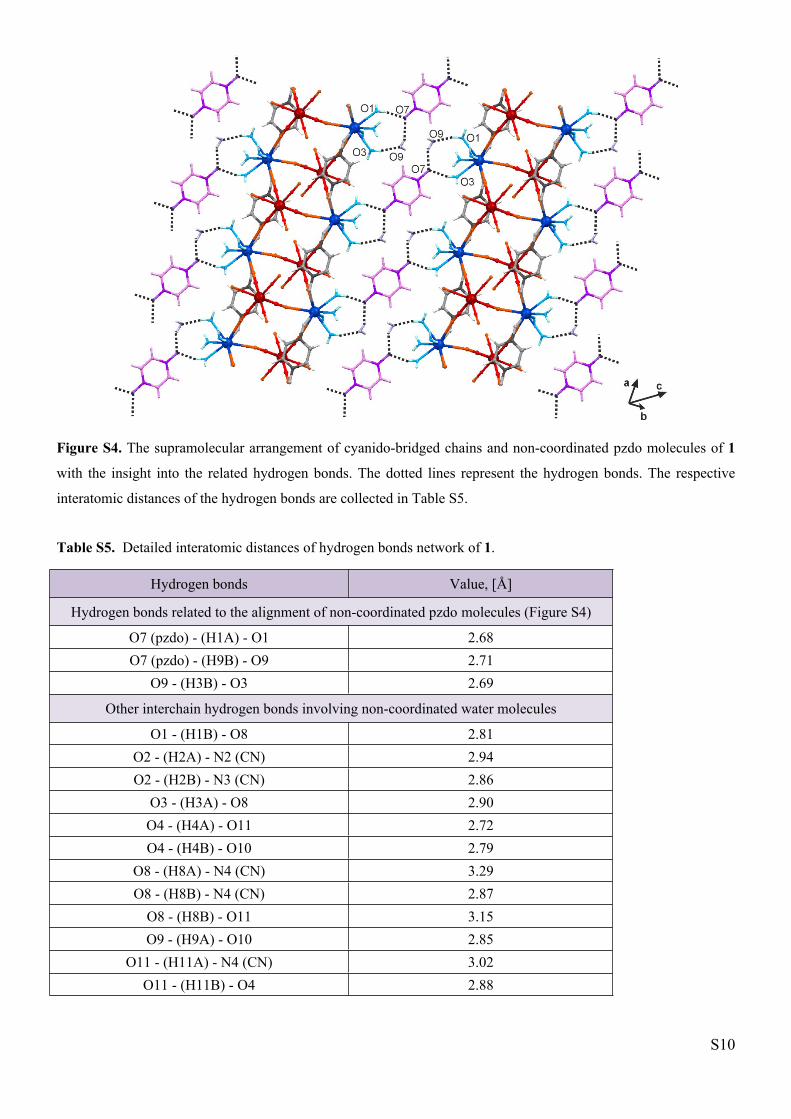
Figure S4. The supramolecular arrangement of cyanido-bridged chains and non-coordinated pzdo molecules of 1
with the insight into the related hydrogen bonds. The dotted lines represent the hydrogen bonds. The respective
interatomic distances of the hydrogen bonds are collected in Table S5.
Table S5. Detailed interatomic distances of hydrogen bonds network of 1.
Hydrogen bonds Value, [Å]
Hydrogen bonds related to the alignment of non-coordinated pzdo molecules (Figure S4)
O7 (pzdo) - (H1A) - O1 2.68O7 (pzdo) - (H9B) - O9 2.71
O9 - (H3B) - O3 2.69
Other interchain hydrogen bonds involving non-coordinated water molecules
O1 - (H1B) - O8 2.81O2 - (H2A) - N2 (CN) 2.94O2 - (H2B) - N3 (CN) 2.86
O3 - (H3A) - O8 2.90O4 - (H4A) - O11 2.72O4 - (H4B) - O10 2.79
O8 - (H8A) - N4 (CN) 3.29O8 - (H8B) - N4 (CN) 2.87
O8 - (H8B) - O11 3.15O9 - (H9A) - O10 2.85
O11 - (H11A) - N4 (CN) 3.02O11 - (H11B) - O4 2.88
S11
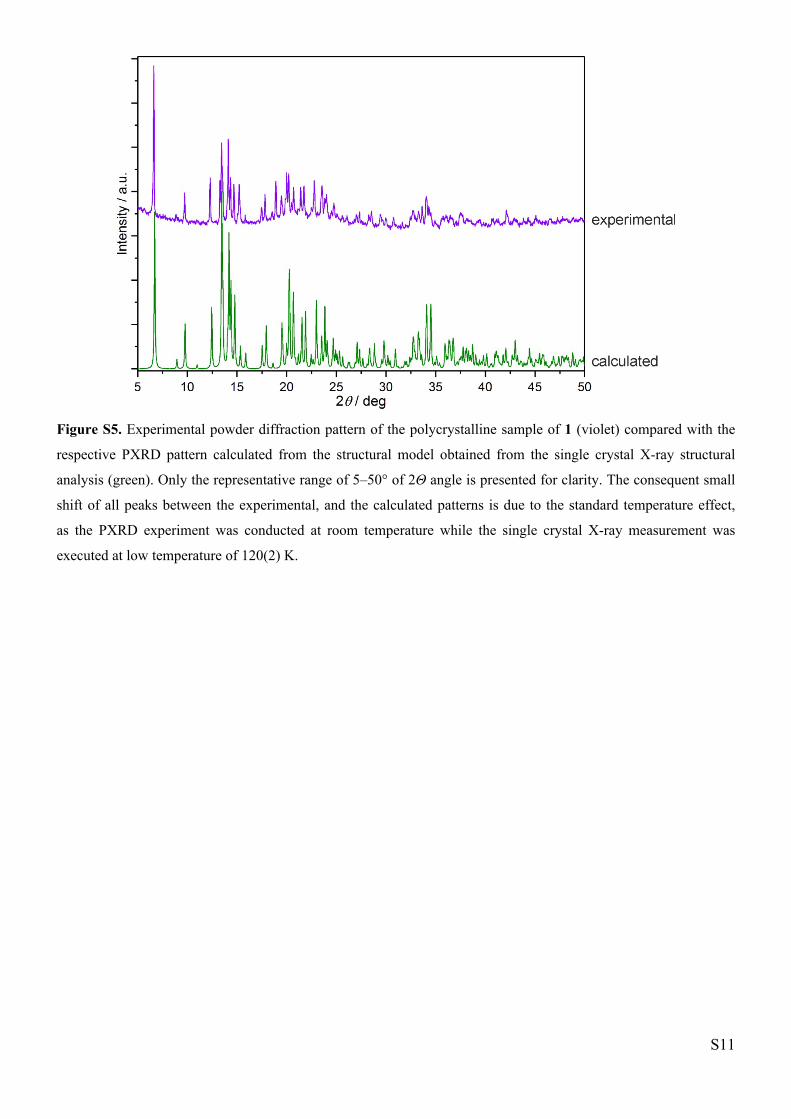
Figure S5. Experimental powder diffraction pattern of the polycrystalline sample of 1 (violet) compared with the
respective PXRD pattern calculated from the structural model obtained from the single crystal X-ray structural
analysis (green). Only the representative range of 5–50° of 2Θ angle is presented for clarity. The consequent small
shift of all peaks between the experimental, and the calculated patterns is due to the standard temperature effect,
as the PXRD experiment was conducted at room temperature while the single crystal X-ray measurement was
executed at low temperature of 120(2) K.
S12
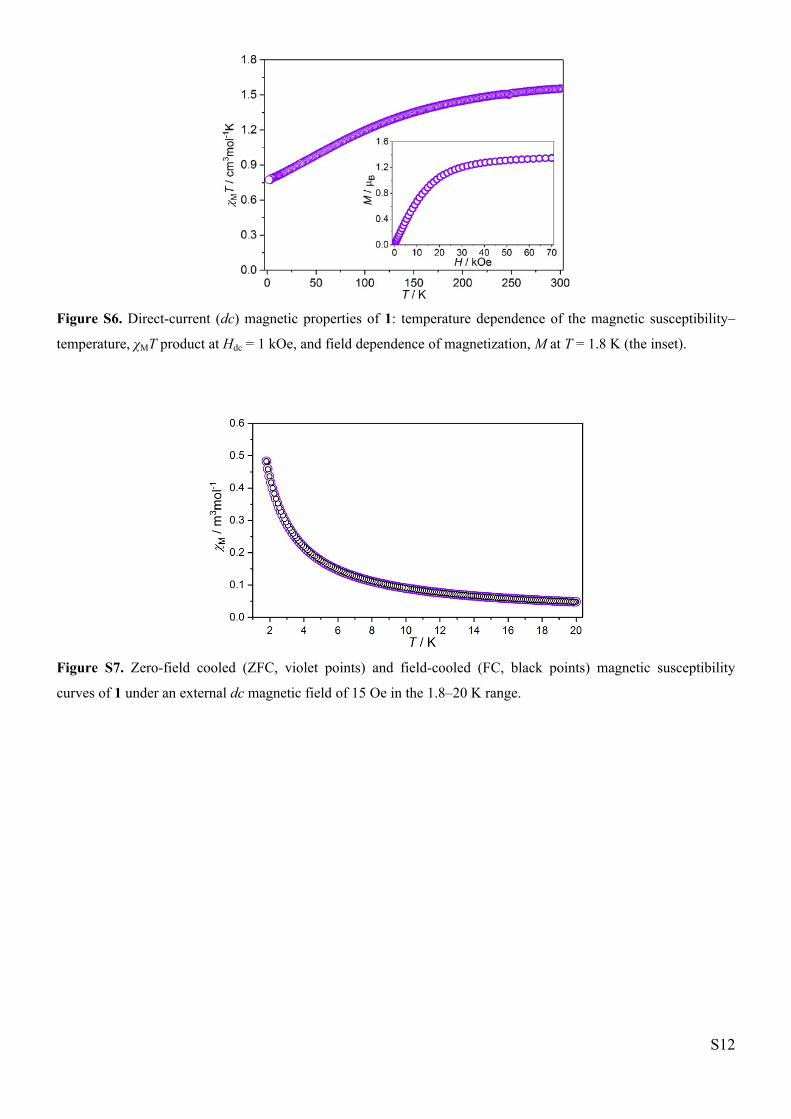
Figure S6. Direct-current (dc) magnetic properties of 1: temperature dependence of the magnetic susceptibility–
temperature, χMT product at Hdc = 1 kOe, and field dependence of magnetization, M at T = 1.8 K (the inset).
Figure S7. Zero-field cooled (ZFC, violet points) and field-cooled (FC, black points) magnetic susceptibility
curves of 1 under an external dc magnetic field of 15 Oe in the 1.8–20 K range.
S13
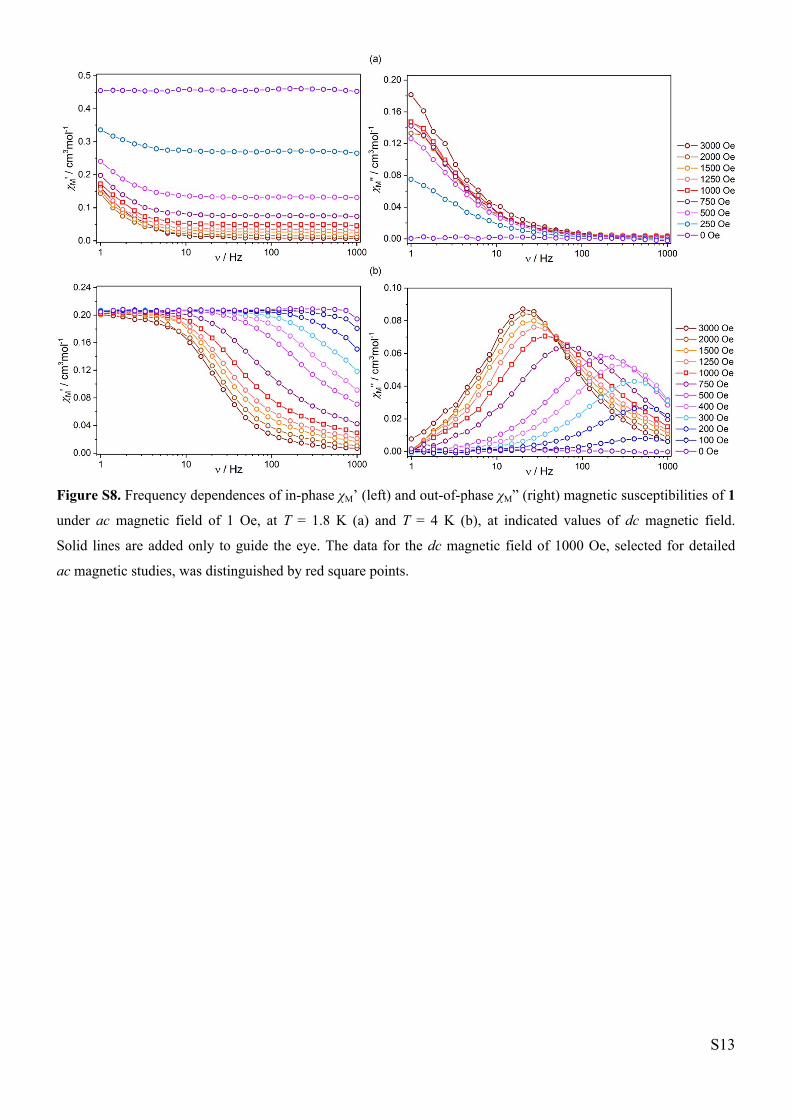
Figure S8. Frequency dependences of in-phase χM’ (left) and out-of-phase χM” (right) magnetic susceptibilities of 1
under ac magnetic field of 1 Oe, at T = 1.8 K (a) and T = 4 K (b), at indicated values of dc magnetic field.
Solid lines are added only to guide the eye. The data for the dc magnetic field of 1000 Oe, selected for detailed
ac magnetic studies, was distinguished by red square points.
S14
Table S6. Parameters obtained by fitting the Argand χM”–χM’ plots (Hdc = 1000 Oe, Figure 4) of 1 using
the generalized Debye model.
T / K χS cm3mol-1
χT cm3mol-1 τ / s α
1.8 0.0501 0.455 0.262 0.118
2.0 0.0446 0.409 0.164 0.105
2.2 0.0405 0.367 0.0908 0.096
2.4 0.0371 0.338 0.0526 0.125
2.6 0.0337 0.316 0.0332 0.173
2.8 0.0301 0.298 0.0230 0.221
3.0 0.0295 0.280 0.0166 0.233
3.2 0.0284 0.266 0.0124 0.249
3.4 0.0293 0.249 0.00904 0.227
3.6 0.0296 0.236 0.00666 0.212
3.8 0.0292 0.222 0.00479 0.187
4.0 0.0287 0.211 0.00345 0.162
4.2 0.0290 0.199 0.00240 0.124
4.4 0.0281 0.191 0.00170 0.104
4.6 0.0272 0.182 0.00121 0.082
4.8 0.0273 0.174 0.000853 0.056
5.0 0.0279 0.167 0.000617 0.035
5.2 0.0284 0.160 0.000453 0.018
5.4 0.0276 0.155 0.000334 0.017
5.6 0.0277 0.149 0.000248 0.018
5.8 0.0278 0.145 0.000186 0.018
6.0 0.0288 0.140 0.000142 0.019
6.2 0.0332 0.136 0.000115 0.020
The following equations representing the generalized Debye model for a single relaxation process were used:
𝜒'(𝜔) = 𝜒𝑆 + (𝜒𝑇 ‒ 𝜒𝑆)1 + (𝜔𝜏)1 ‒ 𝛼sin (𝜋𝛼
2)1 + 2(𝜔𝜏)1 ‒ 𝛼sin (𝜋𝛼
2) + (𝜔𝜏)2(1 ‒ 𝛼)
𝜒''(𝜔) = (𝜒𝑇 ‒ 𝜒𝑆)(𝜔𝜏)1 ‒ 𝛼cos (𝜋𝛼
2)1 + 2(𝜔𝜏)1 ‒ 𝛼sin (𝜋𝛼
2) + (𝜔𝜏)2(1 ‒ 𝛼)
whereχS = the adiabatic susceptibility (at infinitely high frequency of ac field),χT = the isothermal susceptibility (at infinitely low frequency of ac field),τ = the relaxation time,α = the distribution (Cole-Cole) parameter,and ω = 2πν, with ν being the frequency in [Hz] units.S14-S15
S15
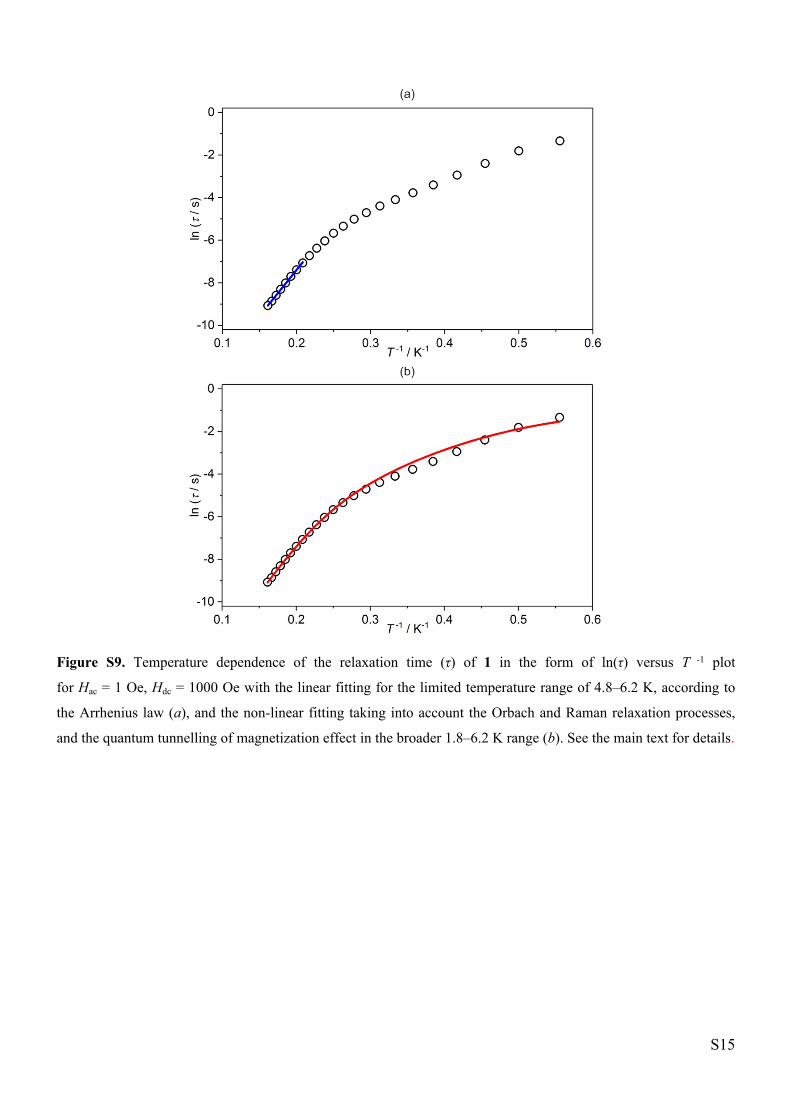
Figure S9. Temperature dependence of the relaxation time (τ) of 1 in the form of ln(τ) versus T -1 plot
for Hac = 1 Oe, Hdc = 1000 Oe with the linear fitting for the limited temperature range of 4.8–6.2 K, according to
the Arrhenius law (a), and the non-linear fitting taking into account the Orbach and Raman relaxation processes,
and the quantum tunnelling of magnetization effect in the broader 1.8–6.2 K range (b). See the main text for details.
S16
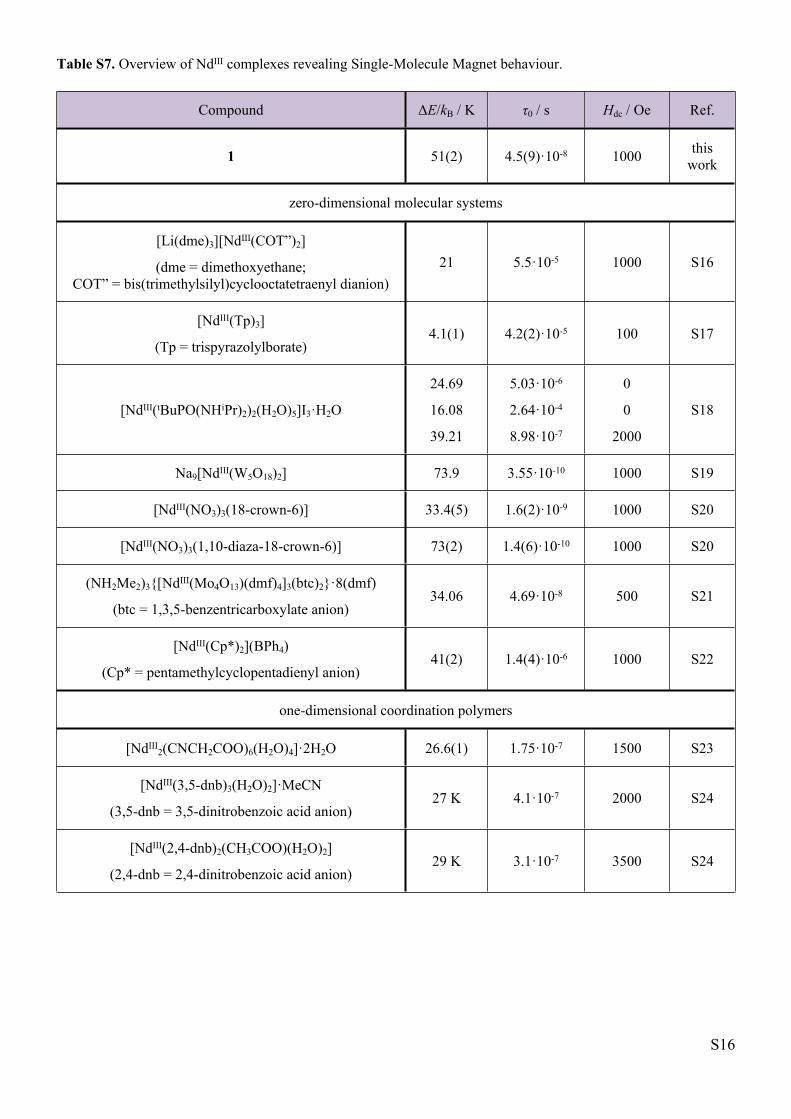
Table S7. Overview of NdIII complexes revealing Single-Molecule Magnet behaviour.
Compound ΔE/kB / K τ0 / s Hdc / Oe Ref.
1 51(2) 4.5(9)·10-8 1000 this work
zero-dimensional molecular systems
[Li(dme)3][NdIII(COT”)2]
(dme = dimethoxyethane; COT” = bis(trimethylsilyl)cyclooctatetraenyl dianion)
21 5.5·10-5 1000 S16
[NdIII(Tp)3]
(Tp = trispyrazolylborate)4.1(1) 4.2(2)·10-5 100 S17
[NdIII(tBuPO(NHiPr)2)2(H2O)5]I3·H2O
24.69
16.08
39.21
5.03·10-6
2.64·10-4
8.98·10-7
0
0
2000
S18
Na9[NdIII(W5O18)2] 73.9 3.55·10-10 1000 S19
[NdIII(NO3)3(18-crown-6)] 33.4(5) 1.6(2)·10-9 1000 S20
[NdIII(NO3)3(1,10-diaza-18-crown-6)] 73(2) 1.4(6)·10-10 1000 S20
(NH2Me2)3{[NdIII(Mo4O13)(dmf)4]3(btc)2}·8(dmf)
(btc = 1,3,5-benzentricarboxylate anion)34.06 4.69·10-8 500 S21
[NdIII(Cp*)2](BPh4)
(Cp* = pentamethylcyclopentadienyl anion)41(2) 1.4(4)·10-6 1000 S22
one-dimensional coordination polymers
[NdIII2(CNCH2COO)6(H2O)4]·2H2O 26.6(1) 1.75·10-7 1500 S23
[NdIII(3,5-dnb)3(H2O)2]·MeCN
(3,5-dnb = 3,5-dinitrobenzoic acid anion)27 K 4.1·10-7 2000 S24
[NdIII(2,4-dnb)2(CH3COO)(H2O)2]
(2,4-dnb = 2,4-dinitrobenzoic acid anion)29 K 3.1·10-7 3500 S24
S17
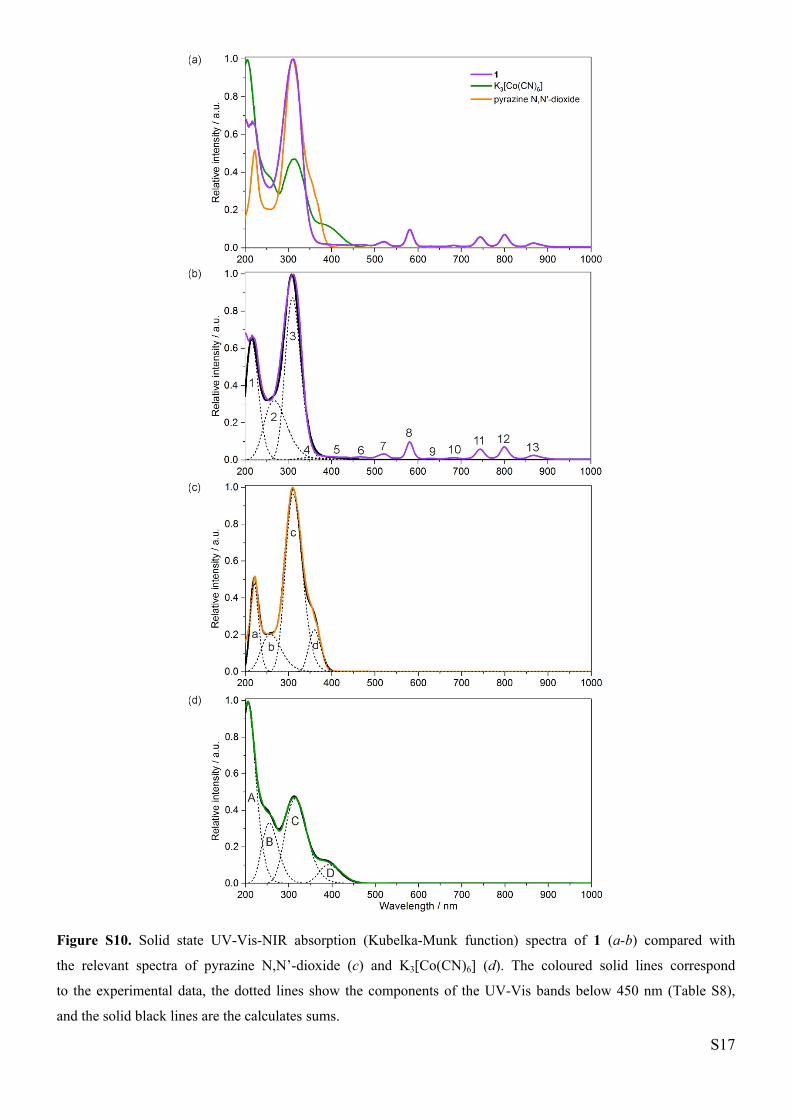
Figure S10. Solid state UV-Vis-NIR absorption (Kubelka-Munk function) spectra of 1 (a-b) compared with
the relevant spectra of pyrazine N,N’-dioxide (c) and K3[Co(CN)6] (d). The coloured solid lines correspond
to the experimental data, the dotted lines show the components of the UV-Vis bands below 450 nm (Table S8),
and the solid black lines are the calculates sums.
S18
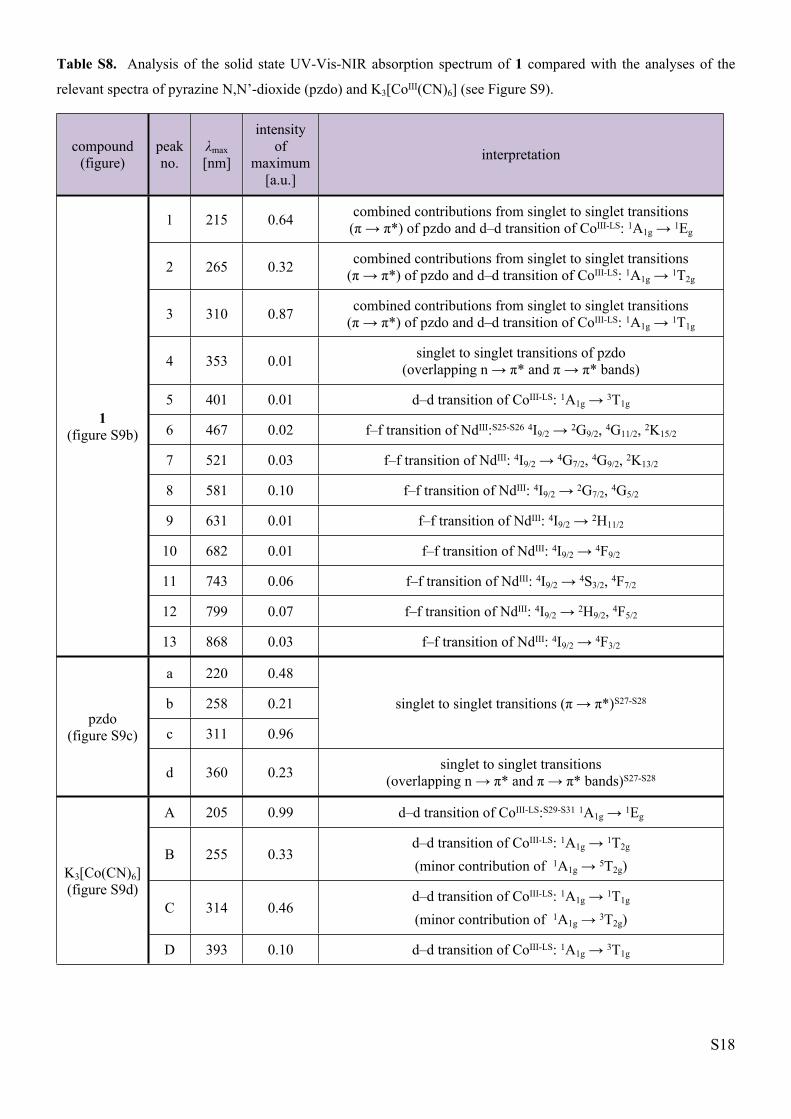
Table S8. Analysis of the solid state UV-Vis-NIR absorption spectrum of 1 compared with the analyses of the
relevant spectra of pyrazine N,N’-dioxide (pzdo) and K3[CoIII(CN)6] (see Figure S9).
compound (figure)
peak no.
λmax [nm]
intensity of
maximum [a.u.]
interpretation
1 215 0.64 combined contributions from singlet to singlet transitions (π → π*) of pzdo and d–d transition of CoIII-LS: 1A1g → 1Eg
2 265 0.32 combined contributions from singlet to singlet transitions (π → π*) of pzdo and d–d transition of CoIII-LS: 1A1g → 1T2g
3 310 0.87 combined contributions from singlet to singlet transitions (π → π*) of pzdo and d–d transition of CoIII-LS: 1A1g → 1T1g
4 353 0.01 singlet to singlet transitions of pzdo(overlapping n → π* and π → π* bands)
5 401 0.01 d–d transition of CoIII-LS: 1A1g → 3T1g
6 467 0.02 f–f transition of NdIII:S25-S26 4I9/2 → 2G9/2, 4G11/2, 2K15/2
7 521 0.03 f–f transition of NdIII: 4I9/2 → 4G7/2, 4G9/2, 2K13/2
8 581 0.10 f–f transition of NdIII: 4I9/2 → 2G7/2, 4G5/2
9 631 0.01 f–f transition of NdIII: 4I9/2 → 2H11/2
10 682 0.01 f–f transition of NdIII: 4I9/2 → 4F9/2
11 743 0.06 f–f transition of NdIII: 4I9/2 → 4S3/2, 4F7/2
12 799 0.07 f–f transition of NdIII: 4I9/2 → 2H9/2, 4F5/2
1(figure S9b)
13 868 0.03 f–f transition of NdIII: 4I9/2 → 4F3/2
a 220 0.48
b 258 0.21
c 311 0.96
singlet to singlet transitions (π → π*)S27-S28
pzdo(figure S9c)
d 360 0.23 singlet to singlet transitions (overlapping n → π* and π → π* bands)S27-S28
A 205 0.99 d–d transition of CoIII-LS:S29-S31 1A1g → 1Eg
B 255 0.33d–d transition of CoIII-LS: 1A1g → 1T2g
(minor contribution of 1A1g → 5T2g)
C 314 0.46d–d transition of CoIII-LS: 1A1g → 1T1g
(minor contribution of 1A1g → 3T2g)
K3[Co(CN)6] (figure S9d)
D 393 0.10 d–d transition of CoIII-LS: 1A1g → 3T1g
S19
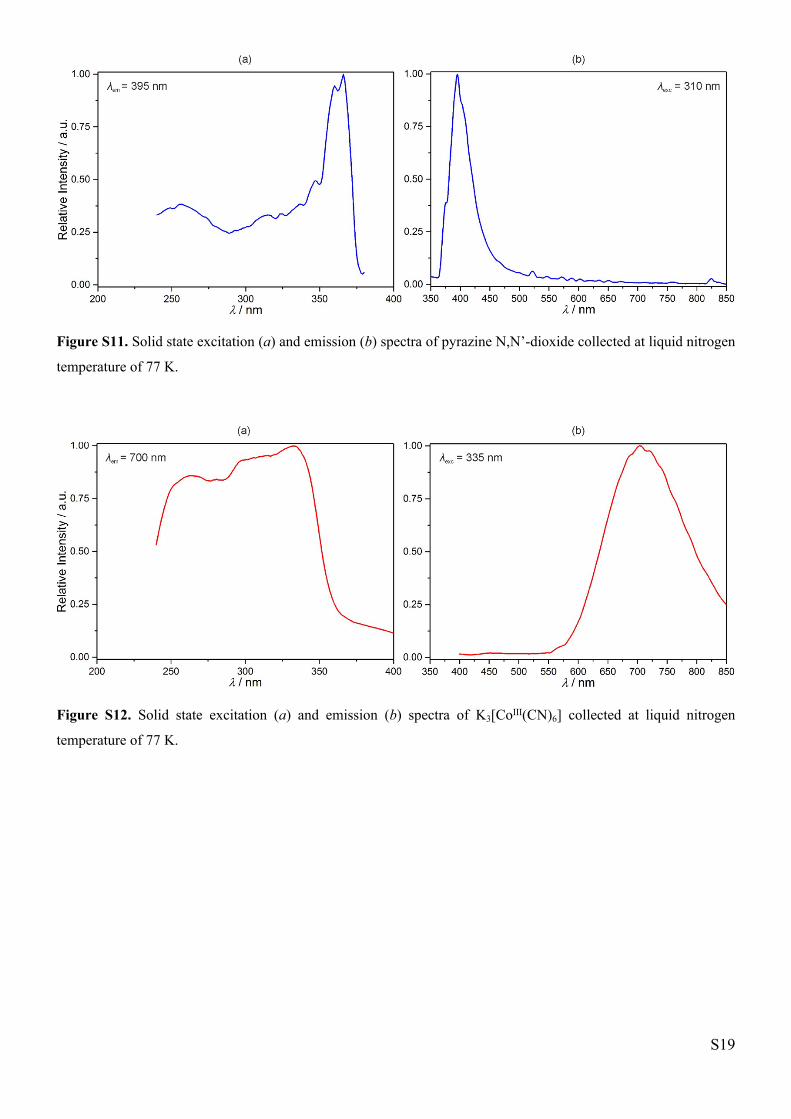
Figure S11. Solid state excitation (a) and emission (b) spectra of pyrazine N,N’-dioxide collected at liquid nitrogen
temperature of 77 K.
Figure S12. Solid state excitation (a) and emission (b) spectra of K3[CoIII(CN)6] collected at liquid nitrogen
temperature of 77 K.
S20
References to Supporting Information
[S1] R. Podgajny, D. Pinkowicz, T. Korzeniak, W. Nitek, M. Rams and B. Sieklucka, Inorg. Chem., 2007,
46, 10416.
[S2] W.-T. Chang, G.-C. Guo, M.-S. Wang, G. Xu, L.-Z. Cai, T. Akitsu, M. Akita-Tanaka, A. Matsuchita and J.-
S. Huang, Inorg. Chem., 2007, 46, 2105.
[S3] Y. Zhang, Z. Guo, S. Xie, H.-L. Li, W.-H. Zhu, L. Liu, X.-Q. Dong, W.-X. Ren, L.-Z. Liu and A. K. Powell,
Inorg. Chem., 2015, 54, 10316.
[S4] S. Chorazy, M. Rams, K. Nakabayashi, B. Sieklucka and S. Ohkoshi, Chem. Eur. J., 2016, 22, 7371.
[S5] S. Chorazy, M. Rams, J. Wang, B. Sieklucka and S. Ohkoshi, Dalton Trans., 2017, 46, 13668.
[S6] G. Sheldrick, Acta Crystallogr., Sect. A: Found Crystallogr., 2008, 64, 112.
[S7] G. Sheldrick, Acta Crystallogr., Sect. C: Struct. Chem., 2015, 71, 3.
[S8] L. Farrugia, J. Appl. Crystallogr., 2012, 45, 849.
[S9] G. A. Bain and J. F. Berry, J. Chem. Educ., 2008, 85, 532.
[S10] M. Llunell, D. Casanova, J. Cirera, J. Bofill, P. Alemany, S. Alvarez, M. Pinsky, D. Avnir, SHAPE v. 2.1.
Program for the Calculation of Continuous Shape Measures of Polygonal and Polyhedral Molecular
Fragments, University of Barcelona: Barcelona, Spain, 2013.
[S11] D. Casanova, J. Cirera, M. Llunell, P. Alemany, D. Avnir and S. Alvarez, J. Am. Chem. Soc., 2004,
126, 1755.
[S12] S. Chorazy, J. Wang and S. Ohkoshi, Dalton Trans., 2016, 52, 10795.
[S13] S. Chorazy, K. Kumar, K. Nakabayashi, B. Sieklucka and S. Ohkoshi, Inorg. Chem., 2017, 56, 5239.
[S14] Y.-N. Guo, G.-F. Xu, Y. Guo and J. Tang, Dalton Trans., 2011, 40, 9953.
[S15] M. Ramos Silva, P. Martin-Ramos, J. T. Coutinho, L. C. J. Perreira and J. Martin-Gil, Dalton Trans., 2014,
43, 6752.
[S16] J. J. Le Roy, S. I. Gorelsky, I. Korobkov and M. Murugesu, Organometallics, 2015, 34, 1415.
[S17] J. D. Rinehart and J. R. Long, Dalton Trans., 2012, 41, 13572.
[S18] S. K. Gupta, T. Rajeshkumar, G. Rajaraman and R. Murugavel, Chem. Commun., 2016, 52, 7168.
[S19] J. J. Baldovi, J. M. Clemente-Juan, E. Coronado, Y. Duan, A. Gaita-Arino and C. Gimenez-Saiz, Inorg.
Chem., 2014, 53, 9976.
[S20] H. Wada, S. Ooka, T. Yamamura and T. Kajiwara, Inorg. Chem., 2017, 56, 147.
[S21] H. Zhang, X. Wu, J. Liao, X. Kuang, W. Yang and C. Lu, Dalton Trans., 2018, doi: 10.1039/C7DT04908K.
[S22] S. Demir, K. R. Meihaus and J. R. Long, J. Organomet. Chem., 2017, doi.org/10.1016/j.jorganchem.
2017.10.035.
[S23] A. Arauzo, A. Lazarescu, S. Shova, E. Bartolome, R. Cases, J. Luzon, J. Bartolome and C. Turta, Dalton
Trans., 2014, 43, 12342.

S21
[S24] A. K. Jassal, N. Aliaga-Alcalde, M. Corbella, D. Aravena, E. Ruiz and G. Hundal, Dalton Trans., 2015, 44,
15774.
[S25] S. P. Sinha, Spectrochem. Acta, 1966, 22, 57.
[S26] B. Chen, J. Xu, N. Dong, H. Liang, Q. Zhang and M. Yin, Spectrochem. Acta A, 2004, 60, 3113.
[S27] J. Del Bene and H. H. Jaffe, J. Chem. Physics, 1968, 49, 1221.
[S28] M. Yamakawa, T. Kubota and H. Akazawa, Theoret. Chim Acta, 1969, 15, 244.
[S29] V. M. Miskowski, H. B. Gray, R. B. Wilson and E. I. Solomon, Inorg. Chem., 1979, 18, 1410.
[S30] H. Kunkely and A. Vogler, Inorg. Chem. Commun., 2004, 7, 770.
[S31] T. Lazarides, G. M. Davies, H. Adams, C. Sabatini, F. Barigelletti, A. Barbieri, S. J. A. Pope, S. Faulkner
and M. D. Ward, Photochem. Photobiol. Sci., 2007, 6, 1152.


![Index [ftp.feq.ufu.br]ftp.feq.ufu.br/Luis_Claudio/Segurança/Safety/Double/fire_handbook... · Backdraft Explosion 174 Barium 216 Barium Carbonate 300 Barium Chlorate 300 Barium Nitrate](https://img.pdfslide.net/doc/110x75/5ea2585052451660ed3ed304/index-ftpfequfubrftpfequfubrluisclaudioseguranasafetydoublefirehandbook.jpg)