Embed Size (px)
Citation preview
HSE Health & Safety
Executive
Dioxin exposure from work related activities
Prepared by Lancaster University for the Health and Safety Executive 2002
RESEARCH REPORT 027
HSE Health & Safety
Executive
Dioxin exposure from work related activities
Dr Andy Sweetman, Dr Rob Lee and Prof Kevin Jones
Department of Environmental Science Institute of Environmental and Natural Science
Lancaster University Lancaster
LA1 4YQ United Kingdom
Following concern raised by DEFRA about the potential for occupational exposure to polychlorinated dibenzo-p-dioxins and polychlorinated dibenzo furans (‘dioxins’), Lancaster University were asked by the Health and Safety Executive (HSE) to undertake a sampling and analysis campaign of industrial indoor air. This report covers the findings of a second study and includes static air monitoring and personal air sampling using portable equipment. Both systems used polyurethane foam (PUF) to trap vapour phase contaminants and glass fibre filters for the particulate phase. Industries included in this study were aluminium and copper recycling, waste incineration and landfill operation. Hence, this study was designed to quantify occupational exposure via inhalation for a variety of industries and compare these estimates to dietary intake and the Committee on Toxicity Tolerable Daily Intake values.
This report and the work it describes were funded by the HSE. Its contents, including any opinions and/or conclusions expressed, are those of the authors alone and do not necessarily reflect HSE policy.
HSE BOOKS

© Crown copyright 2002Applications for reproduction should be made in writing to:Copyright Unit, Her Majesty’s Stationery Office,St Clements House, 2-16 Colegate, Norwich NR3 1BQ
First published 2002
ISBN 0 7176 2573 7
All rights reserved. No part of this publication may be reproduced, stored in a retrieval system, or transmitted in any form or by any means (electronic, mechanical, photocopying, recording or otherwise) without the prior written permission of the copyright owner.
ii
1. Background
Following concern raised by DEFRA about the potential for occupational exposure to
polychlorinated dibenzo-p-dioxins and polychlorinated dibenzo furans (‘dioxins’), Lancaster
University were asked by the Health and Safety Executive to undertake a sampling and
analysis campaign of industrial indoor air. This report covers the findings of a second study1
and includes static air monitoring and personal air sampling using portable equipment. Both
systems used polyurethane foam (PUF) to trap vapour phase contaminants and glass fibre
filters for the particulate phase. Industries included in this study were aluminium and copper
recycling, waste incineration and landfill operation. Hence, this study was designed to
quantify occupational exposure via inhalation for a variety of industries and compare these
estimates to dietary intake and the Committee on Toxicity Tolerable Daily Intake values.
2. Sample collection and analytical procedure
2.1 Hi-volume samples
Sampling was based on the USEPA method TO4 using General Metal Works high volume air
samplers (model PS-1), calibrated prior to use. Each sample consisted of a glass fibre filter
backed up by two PUF plugs (5cm x 3cm radius). The filters were cleaned by baking at 450ºC
whilst PUF plugs were pre-extracted by soxhlet, first with toluene then DCM. The volume of
air sampled was calculated using the mean flow rate over the sampling period multiplied by
the sampling time. Air samples are typically 500 - 1000 m3 for ambient air measurements but
were typically 100 m3 for this study. Additional information pertaining to the sample, such as
maximum and minimum temperature, relative humidity were also recorded.
2.2 Personal samples.
Sampling was conducted by Health and Safety Laboratories on behalf of HSE and samples
passed on to Lancaster University for analysis. Essentially the personal samplers were based
on the same principle as the Hi-volume samplers - consisting of a glass fibre filter and a PUF
plug (7.6cm x 2.2 cm diameter). Sample preparation procedures were also the same as for the
Hi-volume samplers.
1 Previous study – project number 4176/R51.307
1
2.3 Spiking Procedure 13C12 labelled surrogates for all 2,3,7,8-substituted PCDD/Fs were added to each sample prior
to extraction for purposes of quantification and recovery calculation. Immediately prior to
quantitation an injection spike was added to the final extract to act as a retention index for the
GC, and as a recovery standard to allow the calculation of recoveries of all other spiked
compounds. Finally, 37Cl4 labelled 2,3,7,8-TCDD was used as injection spike.
2.4 Transport and Storage
Sample heads were assembled, with pre-cleaned PUF plugs and glass fibre filter, in the
laboratory with each end wrapped in hexane-rinsed aluminium foil. The foil was then
removed immediately prior to sampling and fresh hexane-rinsed foil used to rewrap each end
of the sample head once sampling has finished. Field blanks were treated likewise although
no air was drawn through the sample head.
Sample heads were stored in a cool-box containing freezer blocks for transport to and from
the field site.
Once back in the laboratory the sample heads were dismantled and the filter and PUF plugs
transferred either directly to a soxhlet apparatus or, if the sample required storage before
extraction, to glass jars with aluminium foil lagged lids. These were stored in a freezer at -
20ºC.
A range of solid samples were also collected on site ranging from ambient dust to PFA,
bottom ash and bag plant/scrubber particulates. These samples were stored in pre-cleaned air
tight containers and returned to the laboratory for analysis. Again, they were stored in a
freezer at -20ºC.
2.5 Extraction and Clean-up
Samples were generally analysed in batches of six or twelve, including a field blank and a
reference soil. Extraction was by soxhlet with toluene for 16 hours.
1ml n-nonane was added to the extract as a keeper solvent and the toluene completely
removed under reduced pressure on a rotary evaporator before continuing to the two step
clean-up stage. The extract was cleaned by elution through an adsorption chromatography
column containing acid-modified silica gel, base-modified silica gel and activated neutral
silica gel. The eluate was again concentrated to n-nonane on a rotary evaporator. The extract
in n-nonane was applied to a column of 4.5g alumina which had been pre-rinsed with 30ml n
hexane. The column was first eluted with 20ml 7% DCM/n-hexane to separate other
2
halogenated organic compounds that would otherwise interfere with analysis. The column
was finally eluted with 20ml 1:1 DCM/n-hexane to give a fraction containing and all
PCDD/Fs.
The eluate containaing the PCDD/Fs was reduced to ca 0.5ml at 40ºC under a stream of dry
nitrogen then quantitatively transferred to a tapered 1ml GC vial. 15ml of a solution
containing the injection spike was added and the extract blown down to ca 15ml under the
same conditions. The vial was capped and stored in a fridge at 4ºC until required for analysis
by HRGC-HRMS.
2.6 Quantitation
Quantitation of PCDD/Fs was carried out by HRGC-HRMS using a HP6890 GC fitted with a
HP 6890 series autosampler connected to a Micromass Autospec Ultima high resolution mass
spectrometer run in SIR mode with a resolving power of 10,000.
Each PCDD/F sample was analysed on two different capillary GC columns to allow
quantitation on a total homologue, and on an individual 2,3,7,8-substituted congener basis.
The columns used were 30m DB5-ms (0.25mm i.d., 0.1mm film thickness) and 60m SP2331
(0.25mm i.d., 0.2mm film thickness).
Peak identification was based on retention time as well as ion ratio of the two masses
monitored for each homologue. The quantitation software automatically discounts peaks lying
outside the set acceptance criteria. The integration of every chromatogram was checked
manually before it was accepted.
Quantitation of analytes was made by isotope dilution relative to the internal standard using
the peak areas of the specific 13C12 surrogate for each 2,3,7,8-PCDD/F analyte. Recoveries of
each surrogate were calculated relative to the injection standard.
3. Results
The analytical results from this study are contained in Table 1. Generally, the air
concentrations measured using the static Hi-volume samplers were higher than those
measured using the personal air samplers. Hi-volume air concentrations ranged between 0.06
and 214 pgTEQ m-3 and personal air sample concentrations ranged from 0.16 to 55 pgTEQ m
3. Another high personal air sample was reported as 59 pgTEQ m-3, the PCDD/F loading of
which was entirely associated with the filter. Hence, this sample might have been
3
contaminated during the collection process as the corresponding PUF contained levels below
the detection limits. Although the majority of the PCDD/F burden is generally associated with
particles, the PUF usually contain measurable amounts. It is interesting for comparison that
typical ambient air levels are considerably lower ranging from 1 to 30 fgTEQ m-3 for a semi
rural site.
If you assume that an average employee weighing 70 kg breathes 10m3 per shift, and absorbs
all that he breathes, then taking the personal samplers alone, the majority of workers were
exposed to levels below the current recommendation of 2 pgTEQ kg body weight-1 day-1
(COT, 20012) . Two samples resulted in exposure levels greater than the current COT
guidelines. However, if the Hi-volume samples are included then the number of samples
exceeding these recommendations increases.
A number of solid samples were also analysed for PCDD/Fs. The results are also contained
within Table 1. Most of the samples analysed were controlled wastes and although the levels
were relatively high (10s ppb) their handling is strictly controlled. However, a number of
ambient dust samples were also taken and some of these also showed levels up to 1 ppb.
As a result, based on this limited dataset there is evidence that some workers may be exposed
to levels of PCDD/Fs in excess of the COT advised tolerable daily intake via inhalation. This
exposure is in addition to their dietary intake. Hence, further investigation into the nature of
these sources within the workplace is recommended.
2 COT. Committee on Toxicity of Chemicals in Food, consumer products and the environment.
4
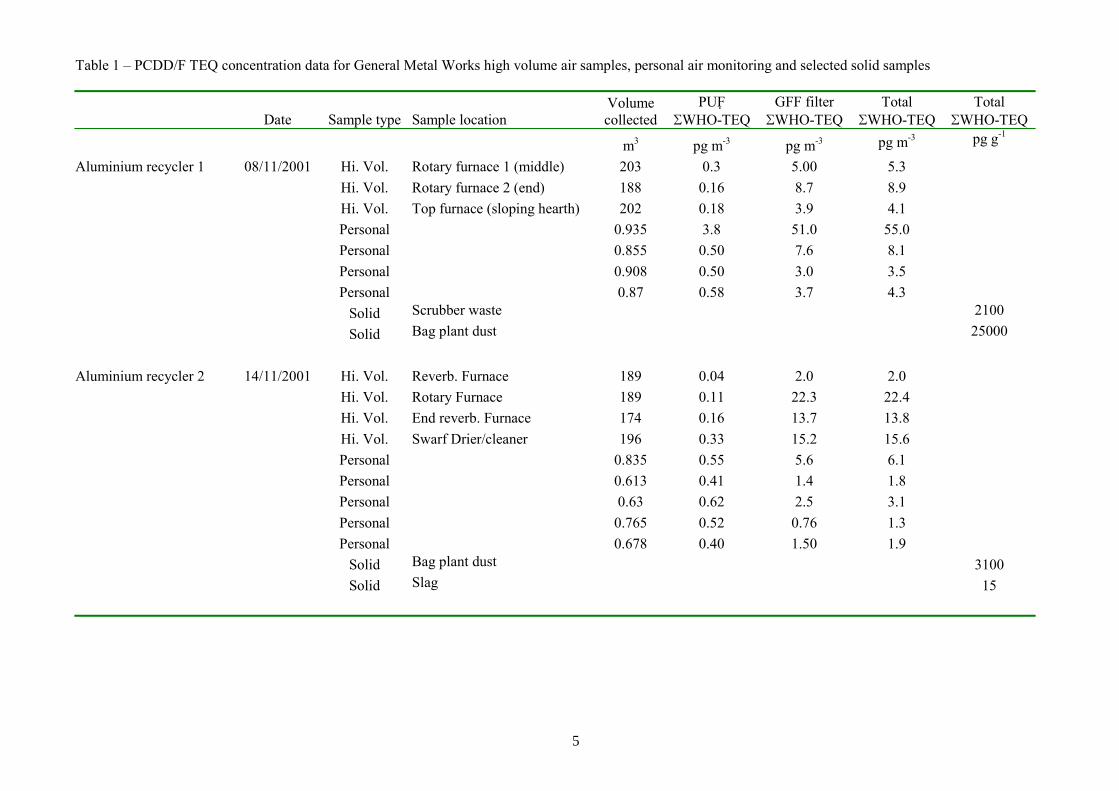
Table 1 – PCDD/F TEQ concentration data for General Metal Works high volume air samples, personal air monitoring and selected solid samples
Volume PUF GFF filter Total Total Date Sample type Sample location collected SWHO-TEQ SWHO-TEQ SWHO-TEQ SWHO-TEQ
m3 pg m-3 pg m-3 pg m-3 pg g-1
Aluminium recycler 1 08/11/2001 Hi. Vol. Rotary furnace 1 (middle) 203 0.3 5.00 5.3 Hi. Vol. Rotary furnace 2 (end) 188 0.16 8.7 8.9 Hi. Vol. Top furnace (sloping hearth) 202 0.18 3.9 4.1 Personal 0.935 3.8 51.0 55.0 Personal 0.855 0.50 7.6 8.1 Personal 0.908 0.50 3.0 3.5 Personal 0.87 0.58 3.7 4.3
Solid Scrubber waste 2100
Solid Bag plant dust 25000
Aluminium recycler 2 14/11/2001 Hi. Vol. Reverb. Furnace 189 0.04 2.0 2.0 Hi. Vol. Rotary Furnace 189 0.11 22.3 22.4 Hi. Vol. End reverb. Furnace 174 0.16 13.7 13.8 Hi. Vol. Swarf Drier/cleaner 196 0.33 15.2 15.6 Personal 0.835 0.55 5.6 6.1 Personal 0.613 0.41 1.4 1.8 Personal 0.63 0.62 2.5 3.1 Personal 0.765 0.52 0.76 1.3 Personal 0.678 0.40 1.50 1.9
Solid Bag plant dust 3100 Solid Slag 15
5
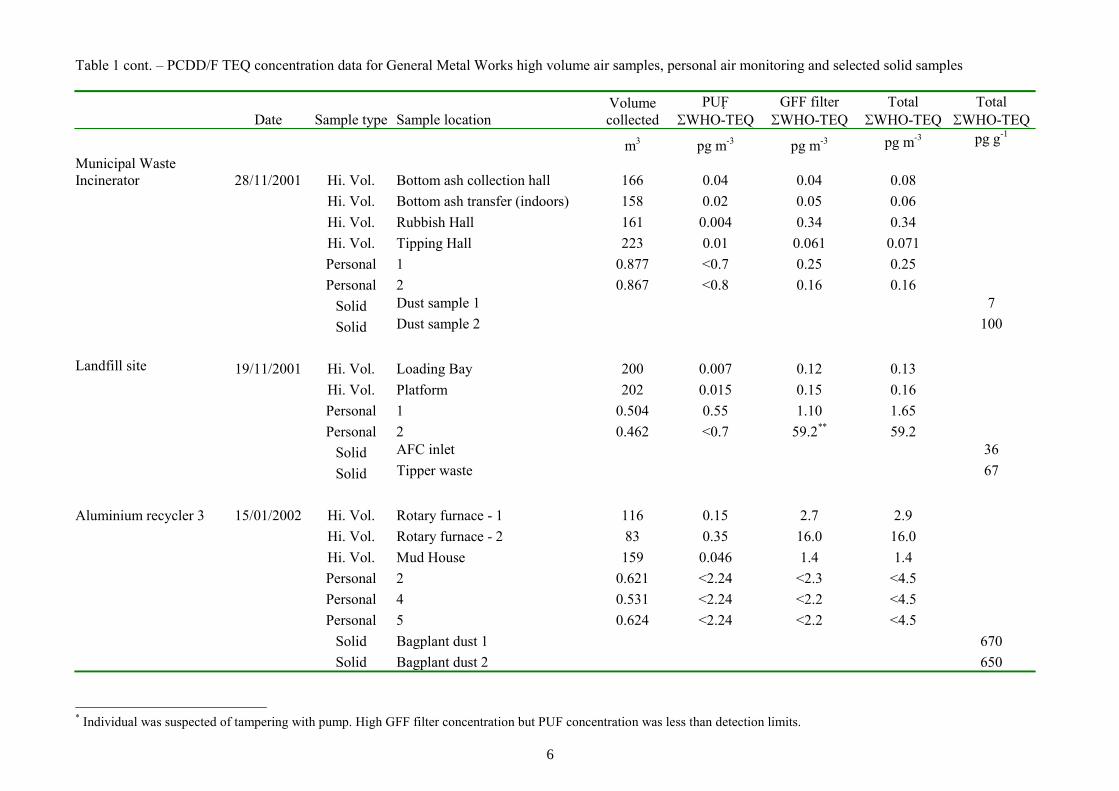
Table 1 cont. – PCDD/F TEQ concentration data for General Metal Works high volume air samples, personal air monitoring and selected solid samples
Volume PUF GFF filter Total Total Date Sample type Sample location collected SWHO-TEQ SWHO-TEQ SWHO-TEQ SWHO-TEQ
m3 pg m-3 pg m-3 pg m-3 pg g-1
Municipal Waste Incinerator 28/11/2001 Hi. Vol. Bottom ash collection hall 166 0.04 0.04 0.08
Hi. Vol. Bottom ash transfer (indoors) 158 0.02 0.05 0.06 Hi. Vol. Rubbish Hall 161 0.004 0.34 0.34 Hi. Vol. Tipping Hall 223 0.01 0.061 0.071 Personal 1 0.877 <0.7 0.25 0.25 Personal 2 0.867 <0.8 0.16 0.16
Solid Dust sample 1 7
Solid Dust sample 2 100
Landfill site 19/11/2001 Hi. Vol. Loading Bay 200 0.007 0.12 0.13 Hi. Vol. Platform 202 0.015 0.15 0.16
Personal 1 0.504 0.55 1.10 1.65 Personal 2 0.462 <0.7 59.2** 59.2
Solid AFC inlet 36
Solid Tipper waste 67
Aluminium recycler 3 15/01/2002 Hi. Vol. Rotary furnace - 1 116 0.15 2.7 2.9 Hi. Vol. Rotary furnace - 2 83 0.35 16.0 16.0 Hi. Vol. Mud House 159 0.046 1.4 1.4 Personal 2 0.621 <2.24 <2.3 <4.5 Personal 4 0.531 <2.24 <2.2 <4.5 Personal 5 0.624 <2.24 <2.2 <4.5
Solid Bagplant dust 1 670 Solid Bagplant dust 2 650
* Individual was suspected of tampering with pump. High GFF filter concentration but PUF concentration was less than detection limits.
6
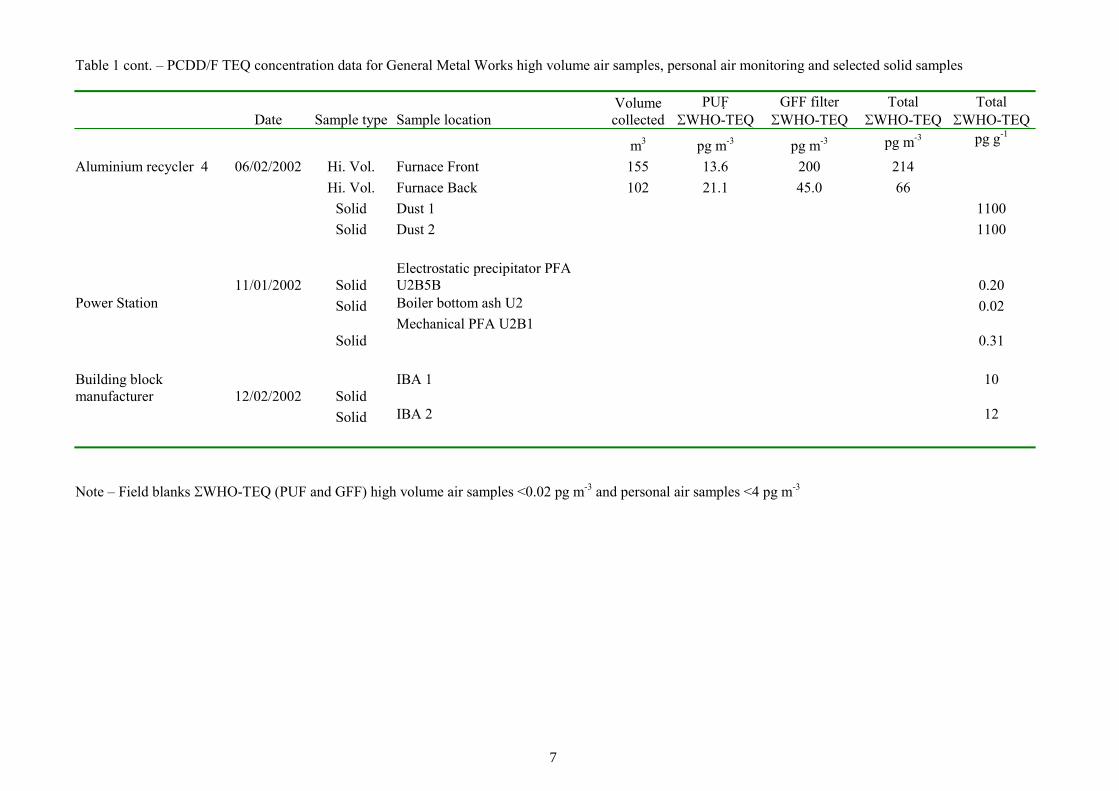
Table 1 cont. – PCDD/F TEQ concentration data for General Metal Works high volume air samples, personal air monitoring and selected solid samples
Volume PUF GFF filter Total Total Date Sample type Sample location collected SWHO-TEQ SWHO-TEQ SWHO-TEQ SWHO-TEQ
m3 pg m-3 pg m-3 pg m-3 pg g-1
Aluminium recycler 4 06/02/2002 Hi. Vol. Furnace Front 155 13.6 200 214 Hi. Vol. Furnace Back 102 21.1 45.0 66
Solid Dust 1 1100 Solid Dust 2 1100
Electrostatic precipitator PFA 11/01/2002 Solid U2B5B 0.20
Power Station Solid Boiler bottom ash U2 0.02 Mechanical PFA U2B1
Solid 0.31
Building block IBA 1 10 manufacturer 12/02/2002 Solid
Solid IBA 2 12
Note – Field blanks SWHO-TEQ (PUF and GFF) high volume air samples <0.02 pg m-3 and personal air samples <4 pg m-3
7

Printed and published by the Health and Safety ExecutiveC30 1/98
Printed and published by the Health and Safety Executive C1.25 9/02
ISBN 0-7176-2573-7
RR 027
780717625734£10.00 9