Embed Size (px)
Citation preview
University of Michigan Dioxin Exposure Study 06/05/2008 SOIL DIOXIN CONCENTRATIONS: Weighted TEQ by region ZONE: Midland/Saginaw Floodplain STRATA: 0-1 inch Number of Participants: 191 Sample Type: soil Notes: TEQ is the TEF-weighted average of the 17 dioxin congeners (excluding the PCBs) based on
WHO 1998 TEFs Survey Sampling Weight: wt_final_soil
TEQ (ppt)
Zone N Mean S.E. Median 75th %ile 95th %ile Min. Max. Overall 191 300.6 52 14.4 281.2 1325.8 1.1 9334.2 M/S FP 191 300.6 52 14.4 281.2 1325.8 1.1 9334.2 M/S Near FP M/S Out FP M/S Plume Jackson/Calhoun
M/S: Midland/Saginaw FP: Floodplain SAS program: Get_table1_figure1.sas Created by: BH & XJ Last Update: XZ 06/05/2008

University of Michigan Dioxin Exposure Study 06/05/2008 SOIL DIOXIN CONCENTRATIONS: Weighted TEQ by region ZONE: Midland/Saginaw Floodplain STRATA: 0-1 inch Number of Participants: 191 Sample Type: soil Notes: TEQ is the TEF-weighted average of the 17 dioxin congeners (excluding the PCBs) based on
WHO 1998 TEFs Survey Sampling Weight: wt_final_soil
Overall Distribution of TEQ_DF17-1998, N=191
Curve: Normal(Mu=303.36 Sigma=755.95)
Percent
0
10
20
30
40
50
60
70
80
90
Soil TEQ_DF17-1998
-500 1000 2500 4000 5500 7000 8500 10000 11500 13000 14500
Mean 300.6
Minimum 1.1
Median 14.4
Maximum 9334.2
Overall Distribution of log10(TEQ_DF17-1998), N=191
Curve: Normal(Mu=1.5028 Sigma=0.9554)
Percent
0.0
2.5
5.0
7.5
10.0
12.5
15.0
17.5
log10(Soil TEQ_DF17-1998)
-0.25 0.25 0.75 1.25 1.75 2.25 2.75 3.25 3.75 4.25 4.75
Mean 1.5
Minimum 0.1
Median 1.2
Maximum 4.0
SAS program: Get_table1_figure1.sas Created by: BH & XJ Last Update: XZ 06/05/2008
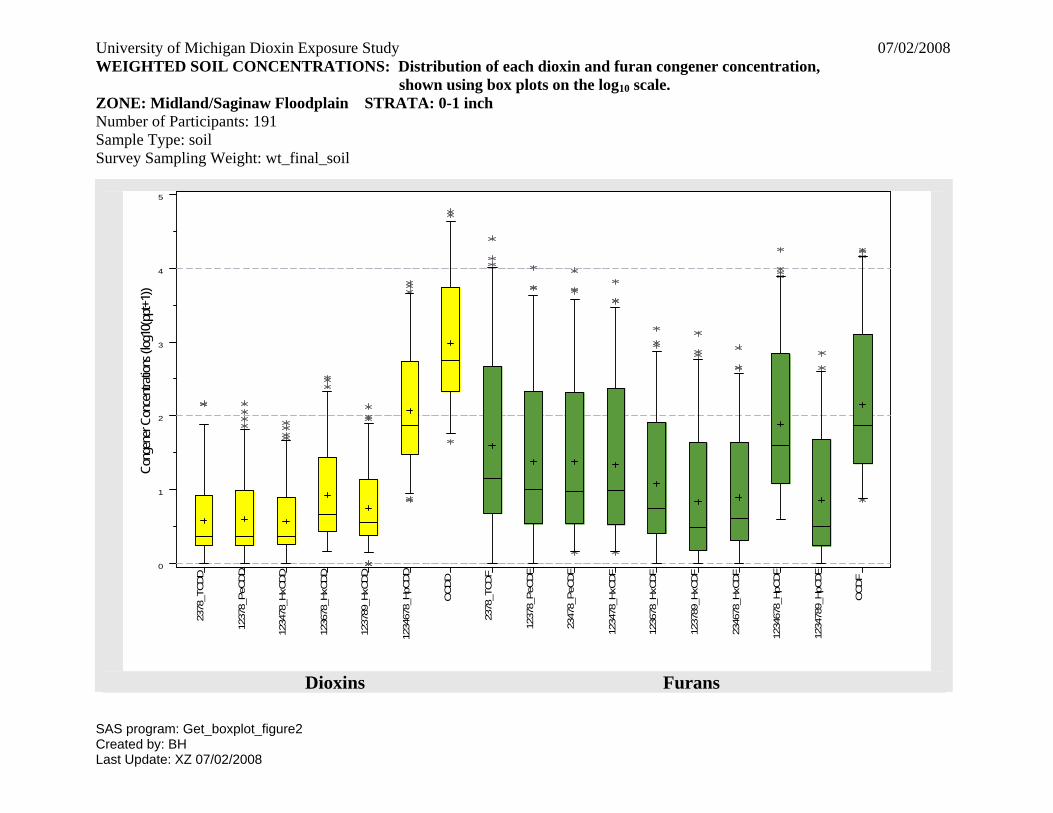
University of Michigan Dioxin Exposure Study 07/02/2008 WEIGHTED SOIL CONCENTRATIONS: Distribution of each dioxin and furan congener concentration, shown using box plots on the log10 scale. ZONE: Midland/Saginaw Floodplain STRATA: 0-1 inch
Number of Participants: 191 Sample Type: soil Survey Sampling Weight: wt_final_soil
SAS program: Get_boxplot_figure2
2378
_TCDD
1237
8_PeC
DD
1234
78_H
xCDD
1236
78_H
xCDD
1237
89_H
xCDD
1234
678_
HpC
DD
OCDD
2378
_TCDF
1237
8_PeC
DF
2347
8_PeC
DF
1234
78_H
xCDF
1236
78_H
xCDF
1237
89_H
xCDF
2346
78_H
xCDF
1234
678_
HpC
DF
1234
789_
HpC
DF
OCDF
0
1
2
3
4
5
Cong
ener
Con
centr
ation
s (log
10(p
pt+1)
)
Dioxins Furans
Created by: BH Last Update: XZ 07/02/2008
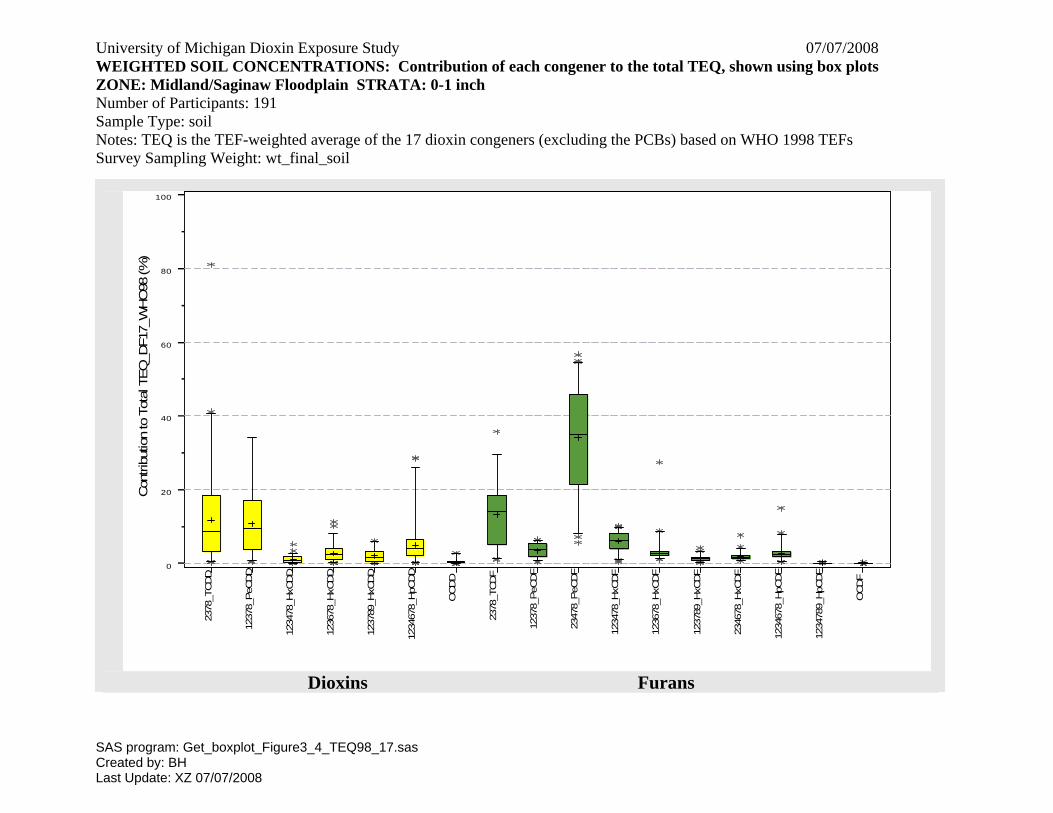
University of Michigan Dioxin Exposure Study 07/07/2008 WEIGHTED SOIL CONCENTRATIONS: Contribution of each congener to the total TEQ, shown using box plots ZONE: Midland/Saginaw Floodplain STRATA: 0-1 inch
Number of Participants: 191 Sample Type: soil
Notes: TEQ is the TEF-weighted average of the 17 dioxin congeners (excluding the PCBs) based on WHO 1998 TEFs Survey Sampling Weight: wt_final_soil
2378
_TCDD
1237
8_PeC
DD
1234
78_H
xCDD
1236
78_H
xCDD
1237
89_H
xCDD
1234
678_
HpC
DD
OCDD
2378
_TCDF
1237
8_PeC
DF
2347
8_PeC
DF
1234
78_H
xCDF
1236
78_H
xCDF
1237
89_H
xCDF
2346
78_H
xCDF
1234
678_
HpC
DF
1234
789_
HpC
DF
OCDF
0
20
40
60
80
100
Con
tribu
tion
to T
otal
TEQ
_DF1
7_W
HO
98 (%
)
Dioxins Furans
SAS program: Get_boxplot_Figure3_4_TEQ98_17.sas Created by: BH Last Update: XZ 07/07/2008
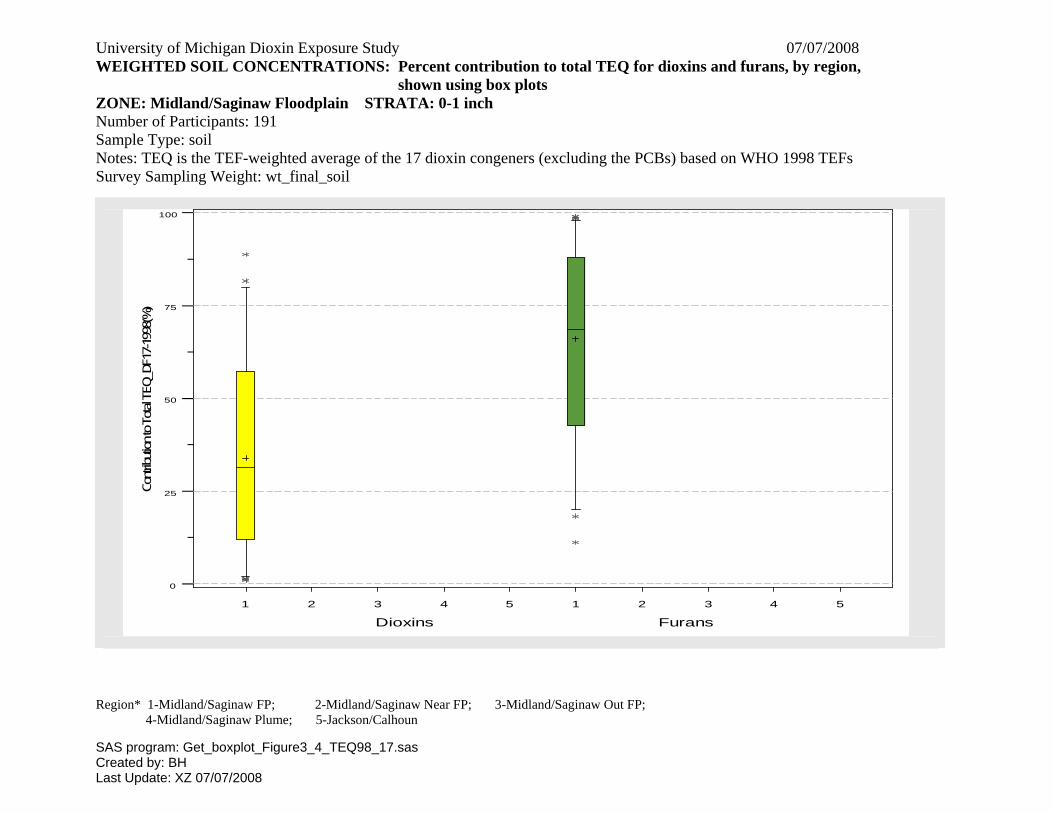
University of Michigan Dioxin Exposure Study 07/07/2008 WEIGHTED SOIL CONCENTRATIONS: Percent contribution to total TEQ for dioxins and furans, by region, shown using box plots ZONE: Midland/Saginaw Floodplain STRATA: 0-1 inch
Number of Participants: 191 Sample Type: soil Notes: TEQ is the TEF-weighted average of the 17 dioxin congeners (excluding the PCBs) based on WHO 1998 TEFs Survey Sampling Weight: wt_final_soil
Region* 1-Midland/Saginaw FP; 2-Midland/Saginaw Near FP; 3-Midland/Saginaw Out FP; 4-Midland/Saginaw Plume; 5-Jackson/Calhoun
1 2 3 4 5 1 2 3 4 5
0
25
50
75
100
Contr
ibutio
n to T
otal T
EQ_D
F17-
1998
(%)
Dioxins Furans
SAS program: Get_boxplot_Figure3_4_TEQ98_17.sas Created by: BH Last Update: XZ 07/07/2008
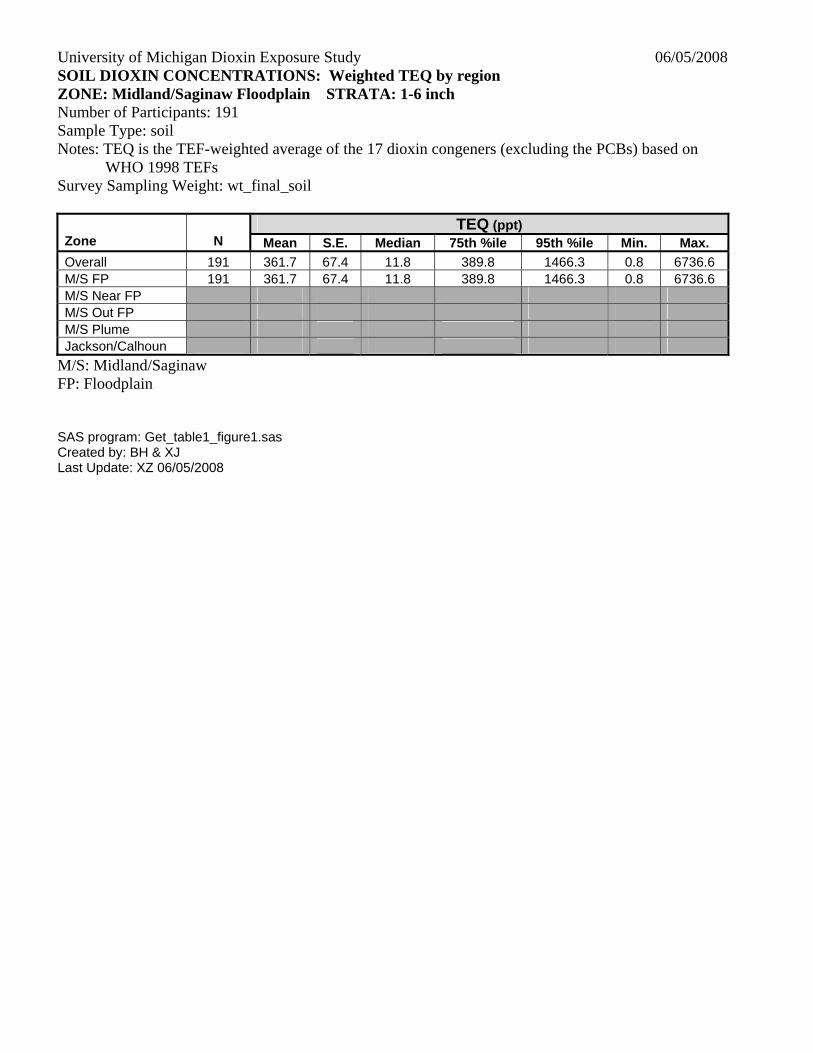
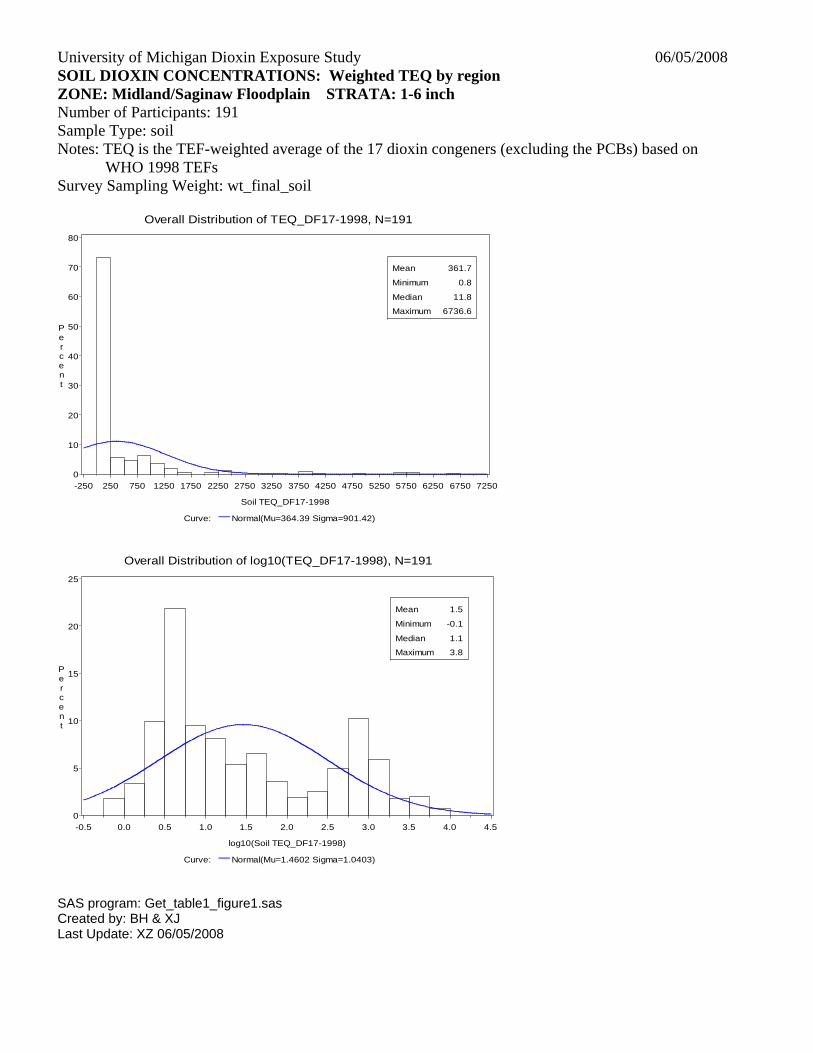
University of Michigan Dioxin Exposure Study 06/05/2008 SOIL DIOXIN CONCENTRATIONS: Weighted TEQ by region ZONE: Midland/Saginaw Floodplain STRATA: 1-6 inch Number of Participants: 191 Sample Type: soil Notes: TEQ is the TEF-weighted average of the 17 dioxin congeners (excluding the PCBs) based on
WHO 1998 TEFs Survey Sampling Weight: wt_final_soil
TEQ (ppt)
Zone N Mean S.E. Median 75th %ile 95th %ile Min. Max. Overall 191 361.7 67.4 11.8 389.8 1466.3 0.8 6736.6 M/S FP 191 361.7 67.4 11.8 389.8 1466.3 0.8 6736.6 M/S Near FP M/S Out FP M/S Plume Jackson/Calhoun
M/S: Midland/Saginaw FP: Floodplain SAS program: Get_table1_figure1.sas Created by: BH & XJ Last Update: XZ 06/05/2008
University of Michigan Dioxin Exposure Study 06/05/2008 SOIL DIOXIN CONCENTRATIONS: Weighted TEQ by region ZONE: Midland/Saginaw Floodplain STRATA: 1-6 inch Number of Participants: 191 Sample Type: soil Notes: TEQ is the TEF-weighted average of the 17 dioxin congeners (excluding the PCBs) based on
WHO 1998 TEFs Survey Sampling Weight: wt_final_soil
Overall Distribution of TEQ_DF17-1998, N=191
Curve: Normal(Mu=364.39 Sigma=901.42)
Percent
0
10
20
30
40
50
60
70
80
Soil TEQ_DF17-1998
-250 250 750 1250 1750 2250 2750 3250 3750 4250 4750 5250 5750 6250 6750 7250
Mean 361.7
Minimum 0.8
Median 11.8
Maximum 6736.6
Overall Distribution of log10(TEQ_DF17-1998), N=191
Curve: Normal(Mu=1.4602 Sigma=1.0403)
Percent
0
5
10
15
20
25
log10(Soil TEQ_DF17-1998)
-0.5 0.0 0.5 1.0 1.5 2.0 2.5 3.0 3.5 4.0 4.5
Mean 1.5
Minimum -0.1
Median 1.1
Maximum 3.8
SAS program: Get_table1_figure1.sas Created by: BH & XJ Last Update: XZ 06/05/2008
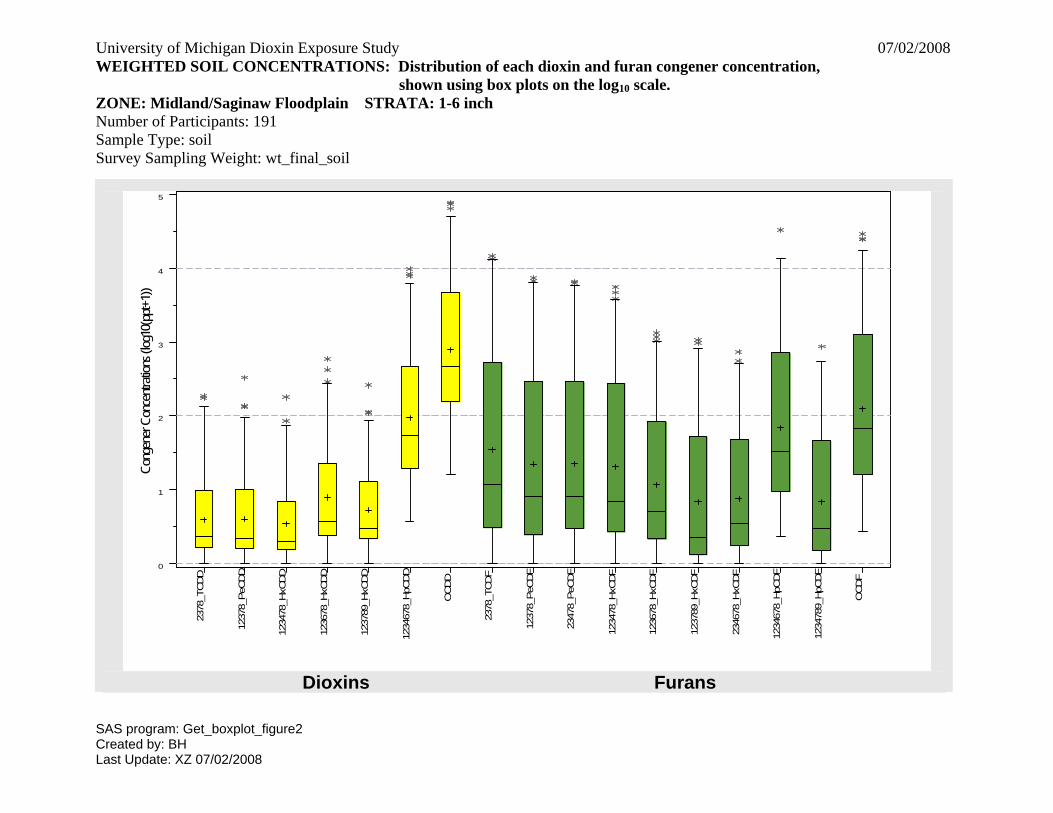
University of Michigan Dioxin Exposure Study 07/02/2008 WEIGHTED SOIL CONCENTRATIONS: Distribution of each dioxin and furan congener concentration, shown using box plots on the log10 scale. ZONE: Midland/Saginaw Floodplain STRATA: 1-6 inch Number of Participants: 191 Sample Type: soil Survey Sampling Weight: wt_final_soil
SAS program: Get_boxplot_figure2
2378
_TCDD
1237
8_PeC
DD
1234
78_H
xCDD
1236
78_H
xCDD
1237
89_H
xCDD
1234
678_
HpC
DD
OCDD
2378
_TCDF
1237
8_PeC
DF
2347
8_PeC
DF
1234
78_H
xCDF
1236
78_H
xCDF
1237
89_H
xCDF
2346
78_H
xCDF
1234
678_
HpC
DF
1234
789_
HpC
DF
OCDF
0
1
2
3
4
5
Cong
ener
Con
centr
ation
s (log
10(p
pt+1)
)
Dioxins Furans
Created by: BH Last Update: XZ 07/02/2008

University of Michigan Dioxin Exposure Study 07/07/2008 WEIGHTED SOIL CONCENTRATIONS: Contribution of each congener to the total TEQ, shown using box plots ZONE: Midland/Saginaw Floodplain STRATA: 1-6 inch Number of Participants: 191 Sample Type: soil Notes: TEQ is the TEF-weighted average of the 17 dioxin congeners (excluding the PCBs) based on WHO 1998 TEFs Survey Sampling Weight: wt_final_soil
2378
_TCDD
1237
8_PeC
DD
1234
78_H
xCDD
1236
78_H
xCDD
1237
89_H
xCDD
1234
678_
HpC
DD
OCDD
2378
_TCDF
1237
8_PeC
DF
2347
8_PeC
DF
1234
78_H
xCDF
1236
78_H
xCDF
1237
89_H
xCDF
2346
78_H
xCDF
1234
678_
HpC
DF
1234
789_
HpC
DF
OCDF
0
20
40
60
80
100
Con
tribu
tion
to T
otal
TEQ
_DF1
7_W
HO
98 (%
)
Dioxins Furans
SAS program: Get_boxplot_Figure3_4_TEQ98_17.sas Created by: BH Last Update: XZ 07/07/2008
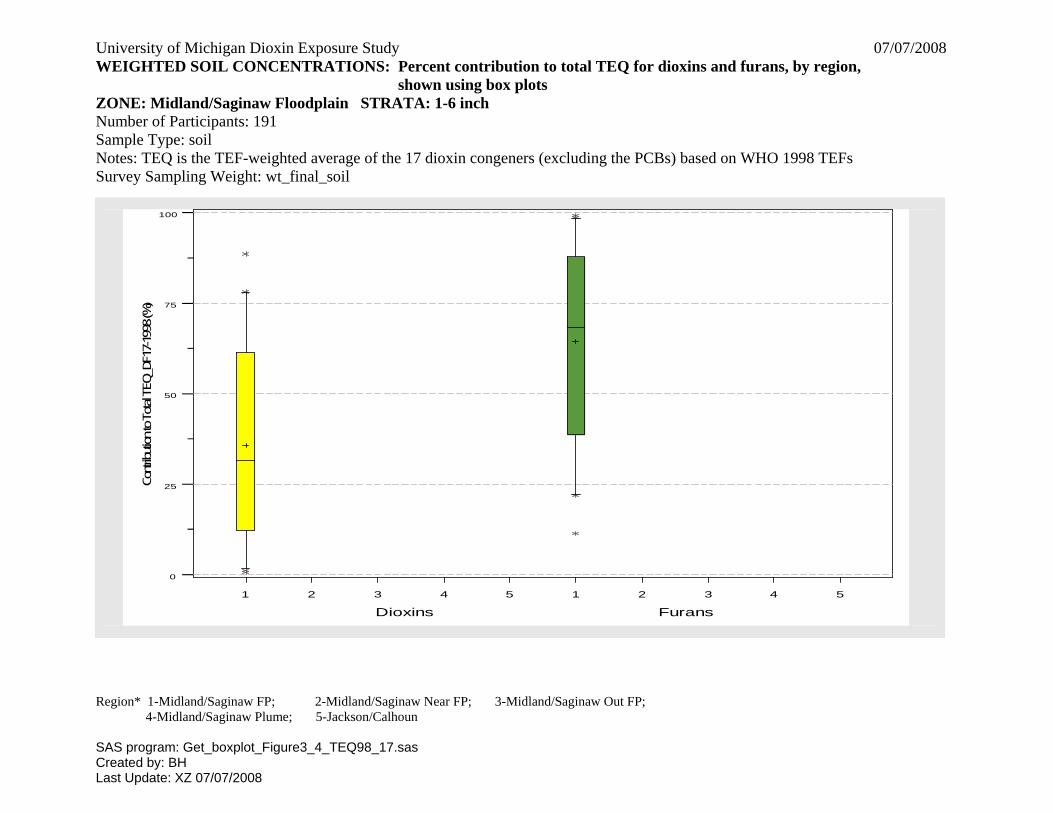
University of Michigan Dioxin Exposure Study 07/07/2008 WEIGHTED SOIL CONCENTRATIONS: Percent contribution to total TEQ for dioxins and furans, by region, shown using box plots ZONE: Midland/Saginaw Floodplain STRATA: 1-6 inch Number of Participants: 191 Sample Type: soil Notes: TEQ is the TEF-weighted average of the 17 dioxin congeners (excluding the PCBs) based on WHO 1998 TEFs Survey Sampling Weight: wt_final_soil
Region* 1-Midland/Saginaw FP; 2-Midland/Saginaw Near FP; 3-Midland/Saginaw Out FP; 4-Midland/Saginaw Plume; 5-Jackson/Calhoun
1 2 3 4 5 1 2 3 4 5
0
25
50
75
100
Contr
ibutio
n to To
tal T
EQ_D
F17-
1998
(%)
Dioxins Furans
SAS program: Get_boxplot_Figure3_4_TEQ98_17.sas Created by: BH Last Update: XZ 07/07/2008

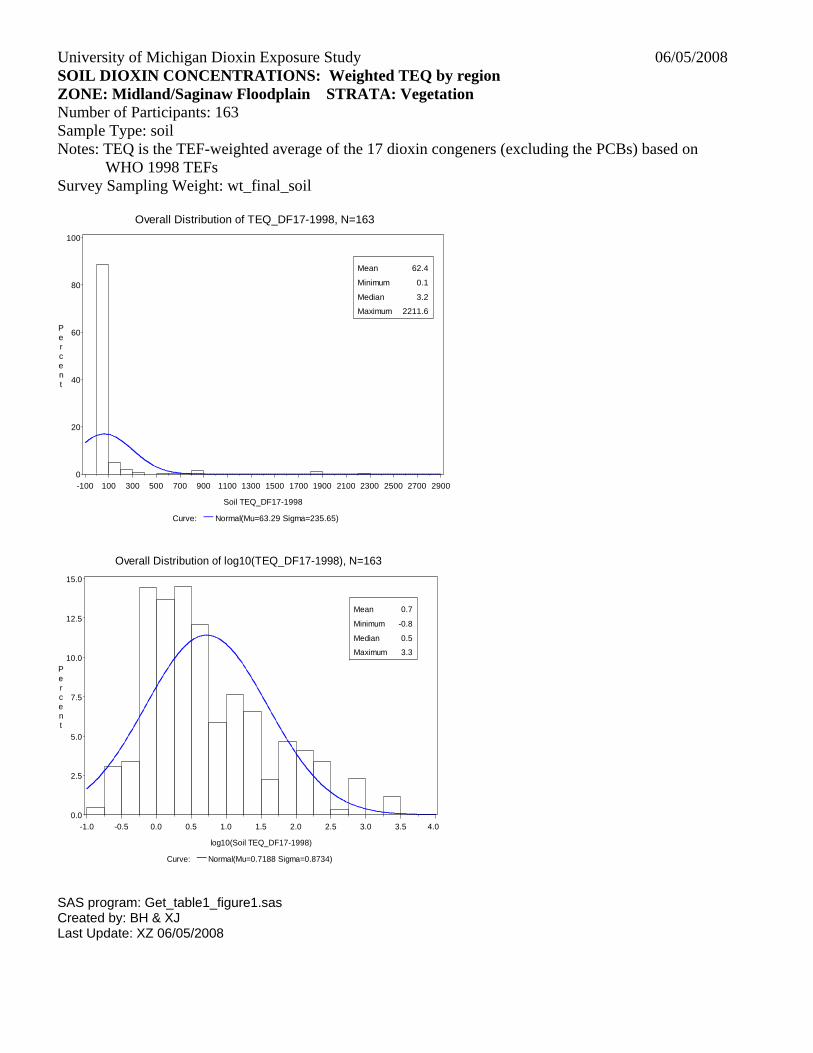
University of Michigan Dioxin Exposure Study 06/05/2008 SOIL DIOXIN CONCENTRATIONS: Weighted TEQ by region ZONE: Midland/Saginaw Floodplain STRATA: Vegetation Number of Participants: 163 Sample Type: soil Notes: TEQ is the TEF-weighted average of the 17 dioxin congeners (excluding the PCBs) based on
WHO 1998 TEFs Survey Sampling Weight: wt_final_soil
TEQ (ppt)
Zone N Mean S.E. Median 75th %ile 95th %ile Min. Max. Overall 163 62.4 21.1 3.2 16.1 291.1 0.1 2211.6 M/S FP 163 62.4 21.1 3.2 16.1 291.1 0.1 2211.6 M/S Near FP M/S Out FP M/S Plume Jackson/Calhoun
M/S: Midland/Saginaw FP: Floodplain SAS program: Get_table1_figure1.sas Created by: BH & XJ Last Update: XZ 06/05/2008
University of Michigan Dioxin Exposure Study 06/05/2008 SOIL DIOXIN CONCENTRATIONS: Weighted TEQ by region ZONE: Midland/Saginaw Floodplain STRATA: Vegetation Number of Participants: 163 Sample Type: soil Notes: TEQ is the TEF-weighted average of the 17 dioxin congeners (excluding the PCBs) based on
WHO 1998 TEFs Survey Sampling Weight: wt_final_soil
Overall Distribution of TEQ_DF17-1998, N=163
Curve: Normal(Mu=63.29 Sigma=235.65)
Percent
0
20
40
60
80
100
Soil TEQ_DF17-1998
-100 100 300 500 700 900 1100 1300 1500 1700 1900 2100 2300 2500 2700 2900
Mean 62.4
Minimum 0.1
Median 3.2
Maximum 2211.6
Overall Distribution of log10(TEQ_DF17-1998), N=163
Curve: Normal(Mu=0.7188 Sigma=0.8734)
Percent
0.0
2.5
5.0
7.5
10.0
12.5
15.0
log10(Soil TEQ_DF17-1998)
-1.0 -0.5 0.0 0.5 1.0 1.5 2.0 2.5 3.0 3.5 4.0
Mean 0.7
Minimum -0.8
Median 0.5
Maximum 3.3
SAS program: Get_table1_figure1.sas Created by: BH & XJ Last Update: XZ 06/05/2008
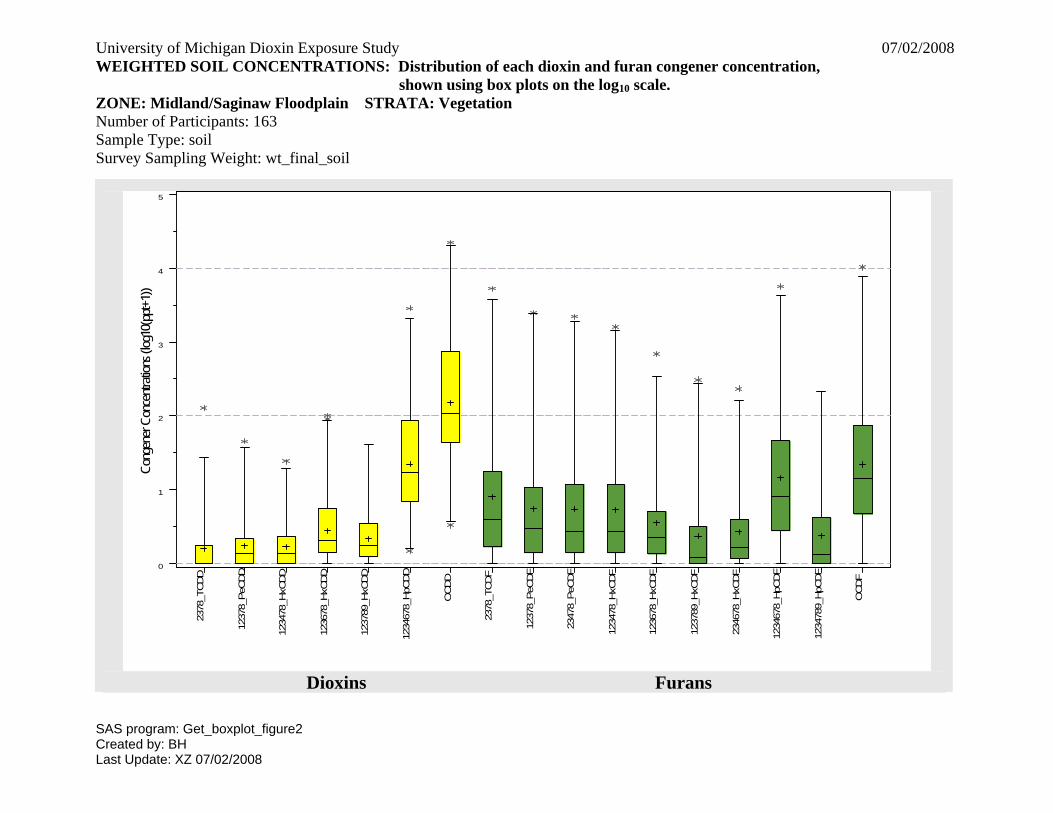
University of Michigan Dioxin Exposure Study 07/02/2008 WEIGHTED SOIL CONCENTRATIONS: Distribution of each dioxin and furan congener concentration, shown using box plots on the log10 scale. ZONE: Midland/Saginaw Floodplain STRATA: Vegetation
Number of Participants: 163 Sample Type: soil Survey Sampling Weight: wt_final_soil
SAS program: Get_boxplot_figure2
2378
_TCDD
1237
8_PeC
DD
1234
78_H
xCDD
1236
78_H
xCDD
1237
89_H
xCDD
1234
678_
HpC
DD
OCDD
2378
_TCDF
1237
8_PeC
DF
2347
8_PeC
DF
1234
78_H
xCDF
1236
78_H
xCDF
1237
89_H
xCDF
2346
78_H
xCDF
1234
678_
HpC
DF
1234
789_
HpC
DF
OCDF
0
1
2
3
4
5
Cong
ener
Con
centr
ation
s (log
10(p
pt+1)
)
Dioxins Furans
Created by: BH Last Update: XZ 07/02/2008

University of Michigan Dioxin Exposure Study 07/07/2008 WEIGHTED SOIL CONCENTRATIONS: Contribution of each congener to the total TEQ, shown using box plots ZONE: Midland/Saginaw Floodplain STRATA: Vegetation
Number of Participants: 163 Sample Type: soil Notes: TEQ is the TEF-weighted average of the 17 dioxin congeners (excluding the PCBs) based on WHO 1998 TEFs Survey Sampling Weight: wt_final_soil
2378
_TCDD
1237
8_Pe
CDD
1234
78_H
xCDD
1236
78_H
xCDD
1237
89_H
xCDD
1234
678_
HpC
DD
OCDD
2378
_TCDF
1237
8_Pe
CDF
2347
8_Pe
CDF
1234
78_H
xCDF
1236
78_H
xCDF
1237
89_H
xCDF
2346
78_H
xCDF
1234
678_
HpC
DF
1234
789_
HpC
DF
OCDF
0
20
40
60
Contr
ibutio
n to
Total
TEQ
_DF1
7-19
98 (%
)
Dioxins Furans
SAS program: Get_boxplot_Figure3_4_TEQ98_17.sas Created by: BH Last Update: XZ 07/07/2008
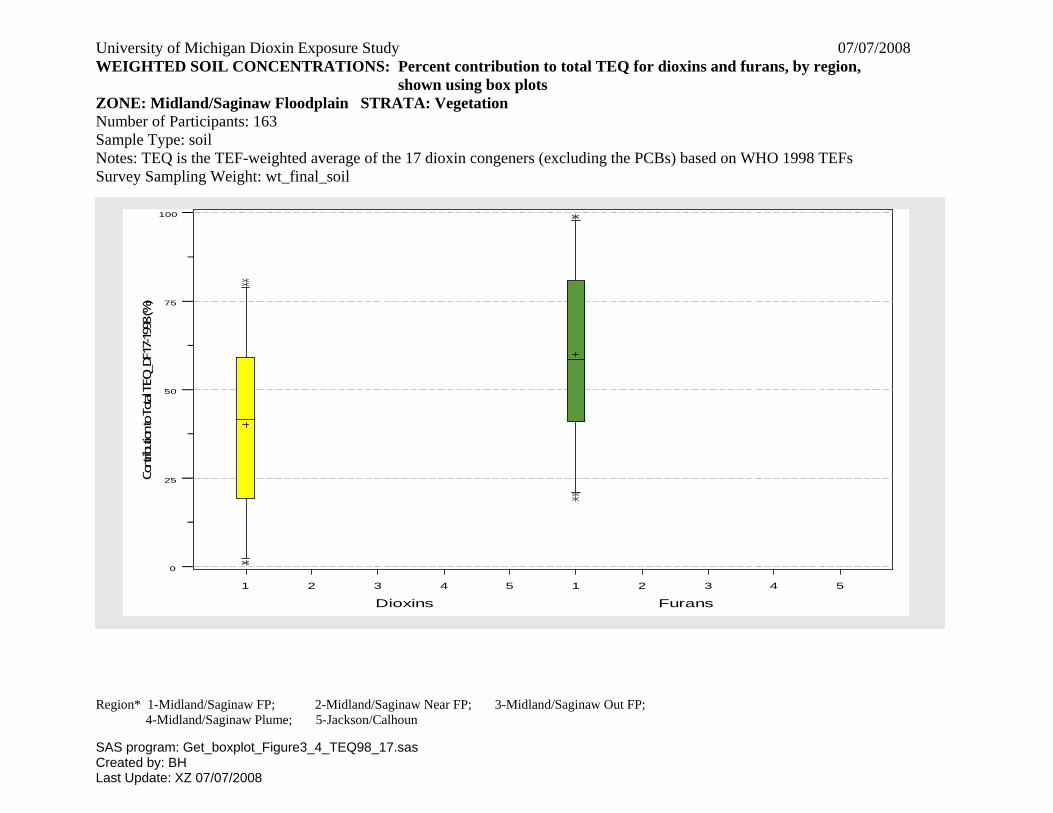
University of Michigan Dioxin Exposure Study 07/07/2008 WEIGHTED SOIL CONCENTRATIONS: Percent contribution to total TEQ for dioxins and furans, by region, shown using box plots ZONE: Midland/Saginaw Floodplain STRATA: Vegetation
Number of Participants: 163 Sample Type: soil Notes: TEQ is the TEF-weighted average of the 17 dioxin congeners (excluding the PCBs) based on WHO 1998 TEFs Survey Sampling Weight: wt_final_soil
Region* 1-Midland/Saginaw FP; 2-Midland/Saginaw Near FP; 3-Midland/Saginaw Out FP; 4-Midland/Saginaw Plume; 5-Jackson/Calhoun
1 2 3 4 5 1 2 3 4 5
0
25
50
75
100
Contr
ibutio
n to T
otal T
EQ_D
F17-
1998
(%)
Dioxins Furans
SAS program: Get_boxplot_Figure3_4_TEQ98_17.sas Created by: BH Last Update: XZ 07/07/2008

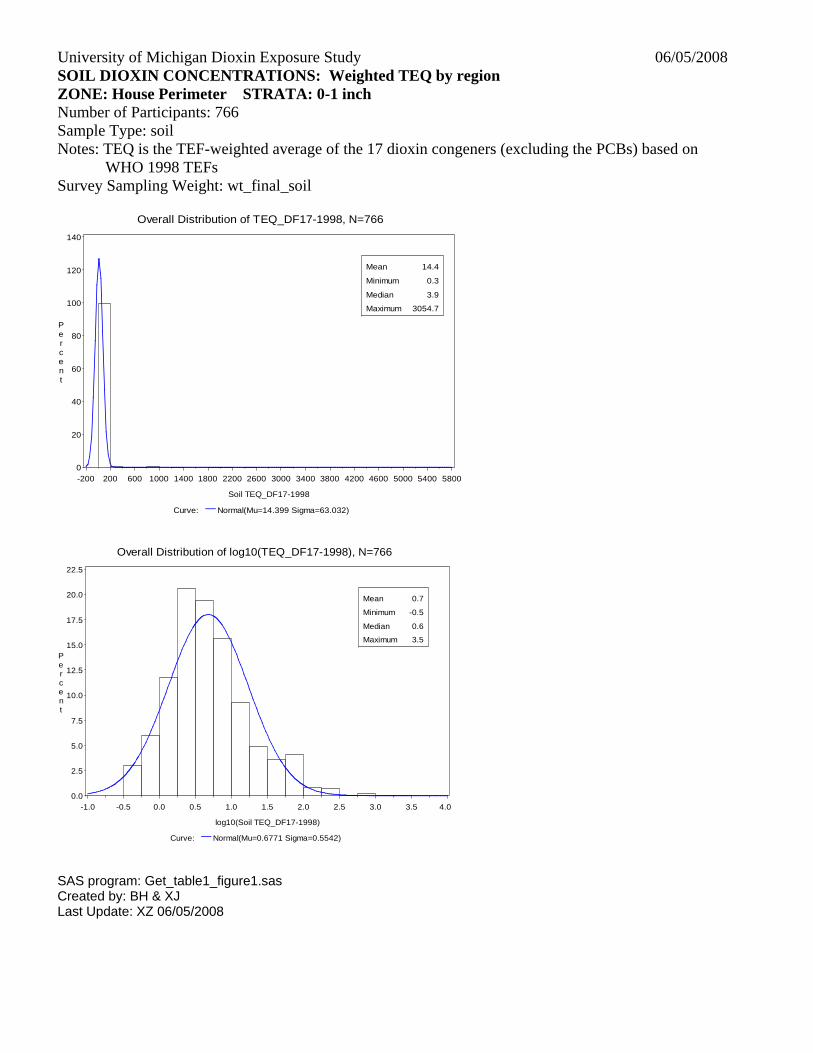
University of Michigan Dioxin Exposure Study 06/05/2008 SOIL DIOXIN CONCENTRATIONS: Weighted TEQ by region ZONE: House Perimeter STRATA: 0-1 inch Number of Participants: 766 Sample Type: soil Notes: TEQ is the TEF-weighted average of the 17 dioxin congeners (excluding the PCBs) based on
WHO 1998 TEFs Survey Sampling Weight: wt_final_soil
TEQ (ppt)
Zone N Mean S.E. Median 75th %ile 95th %ile Min. Max. Overall 766 14.4 1.9 3.9 9.2 58.5 0.3 3054.7 M/S FP 203 71.3 12.7 12.1 40 291 1.1 2480.1 M/S Near FP 164 67.4 48.7 4 10.5 135 0.8 3054.7 M/S Out FP 168 14.8 2.4 4.7 12.1 71.7 0.8 204.7 M/S Plume 37 113.1 38.2 58.1 96.6 255.9 4.9 922.8 Jackson/Calhoun 194 5.2 0.5 2.8 6.2 15.6 0.3 65.6
M/S: Midland/Saginaw FP: Floodplain SAS program: Get_table1_figure1.sas Created by: BH & XJ Last Update: XZ 06/05/2008
University of Michigan Dioxin Exposure Study 06/05/2008 SOIL DIOXIN CONCENTRATIONS: Weighted TEQ by region ZONE: House Perimeter STRATA: 0-1 inch Number of Participants: 766 Sample Type: soil Notes: TEQ is the TEF-weighted average of the 17 dioxin congeners (excluding the PCBs) based on
WHO 1998 TEFs Survey Sampling Weight: wt_final_soil
Overall Distribution of TEQ_DF17-1998, N=766
Curve: Normal(Mu=14.399 Sigma=63.032)
Percent
0
20
40
60
80
100
120
140
Soil TEQ_DF17-1998
-200 200 600 1000 1400 1800 2200 2600 3000 3400 3800 4200 4600 5000 5400 5800
Mean 14.4
Minimum 0.3
Median 3.9
Maximum 3054.7
Overall Distribution of log10(TEQ_DF17-1998), N=766
Curve: Normal(Mu=0.6771 Sigma=0.5542)
Percent
0.0
2.5
5.0
7.5
10.0
12.5
15.0
17.5
20.0
22.5
log10(Soil TEQ_DF17-1998)
-1.0 -0.5 0.0 0.5 1.0 1.5 2.0 2.5 3.0 3.5 4.0
Mean 0.7
Minimum -0.5
Median 0.6
Maximum 3.5
SAS program: Get_table1_figure1.sas Created by: BH & XJ Last Update: XZ 06/05/2008
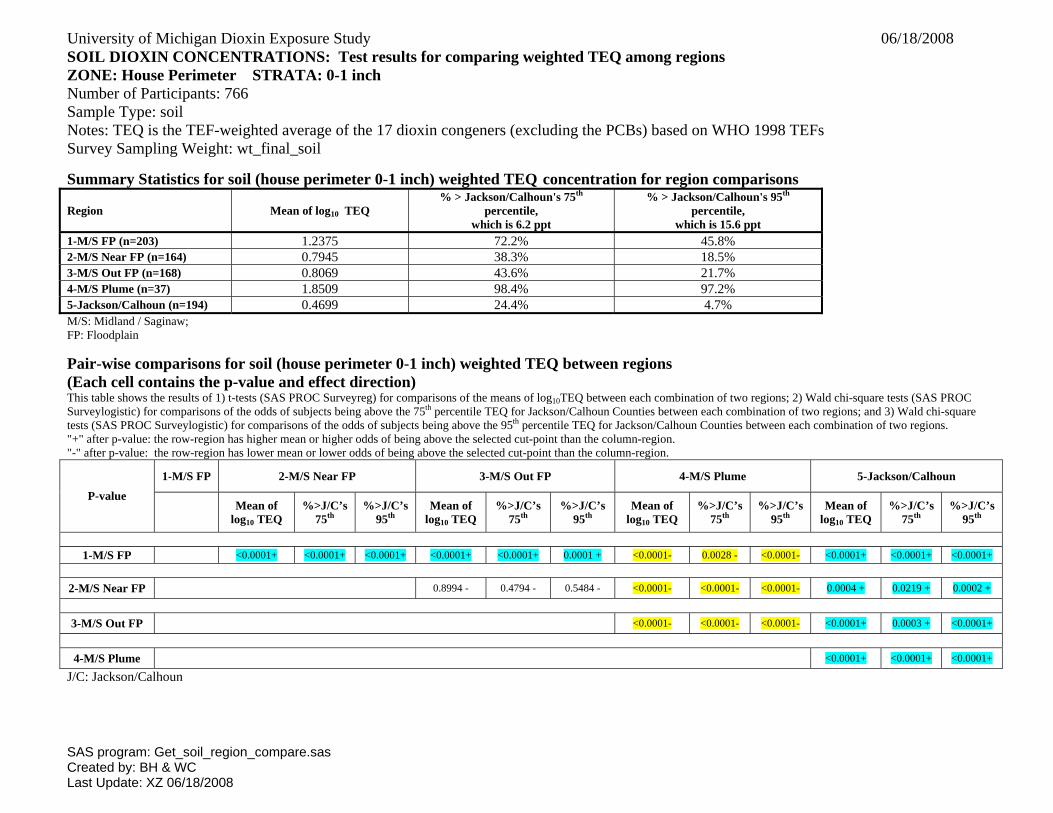
University of Michigan Dioxin Exposure Study 06/18/2008 SOIL DIOXIN CONCENTRATIONS: Test results for comparing weighted TEQ among regions ZONE: House Perimeter STRATA: 0-1 inch Number of Participants: 766 Sample Type: soil
Notes: TEQ is the TEF-weighted average of the 17 dioxin congeners (excluding the PCBs) based on WHO 1998 TEFs Survey Sampling Weight: wt_final_soil Summary Statistics for soil (house perimeter 0-1 inch) weighted TEQ concentration for region comparisons
Region Mean of log10 TEQ % > Jackson/Calhoun's 75th
percentile, which is 6.2 ppt
% > Jackson/Calhoun's 95th percentile,
which is 15.6 ppt 1-M/S FP (n=203) 1.2375 72.2% 45.8% 2-M/S Near FP (n=164) 0.7945 38.3% 18.5% 3-M/S Out FP (n=168) 0.8069 43.6% 21.7% 4-M/S Plume (n=37) 1.8509 98.4% 97.2% 5-Jackson/Calhoun (n=194) 0.4699 24.4% 4.7% M/S: Midland / Saginaw; FP: Floodplain Pair-wise comparisons for soil (house perimeter 0-1 inch) weighted TEQ between regions (Each cell contains the p-value and effect direction) This table shows the results of 1) t-tests (SAS PROC Surveyreg) for comparisons of the means of log10TEQ between each combination of two regions; 2) Wald chi-square tests (SAS PROC Surveylogistic) for comparisons of the odds of subjects being above the 75th percentile TEQ for Jackson/Calhoun Counties between each combination of two regions; and 3) Wald chi-square tests (SAS PROC Surveylogistic) for comparisons of the odds of subjects being above the 95th percentile TEQ for Jackson/Calhoun Counties between each combination of two regions. "+" after p-value: the row-region has higher mean or higher odds of being above the selected cut-point than the column-region. "-" after p-value: the row-region has lower mean or lower odds of being above the selected cut-point than the column-region.
1-M/S FP 2-M/S Near FP 3-M/S Out FP 4-M/S Plume 5-Jackson/Calhoun
P-value Mean of log10 TEQ
%>J/C’s 75th
%>J/C’s 95th
Mean of log10 TEQ
%>J/C’s 75th
%>J/C’s 95th
Mean of log10 TEQ
%>J/C’s 75th
%>J/C’s 95th
Mean of log10 TEQ
%>J/C’s 75th
%>J/C’s 95th
1-M/S FP <0.0001+ <0.0001+ <0.0001+ <0.0001+ <0.0001+ 0.0001 + <0.0001- 0.0028 - <0.0001- <0.0001+ <0.0001+ <0.0001+
2-M/S Near FP 0.8994 - 0.4794 - 0.5484 - <0.0001- <0.0001- <0.0001- 0.0004 + 0.0219 + 0.0002 +
3-M/S Out FP <0.0001- <0.0001- <0.0001- <0.0001+ 0.0003 + <0.0001+
4-M/S Plume <0.0001+ <0.0001+ <0.0001+
J/C: Jackson/Calhoun
SAS program: Get_soil_region_compare.sas Created by: BH & WC Last Update: XZ 06/18/2008
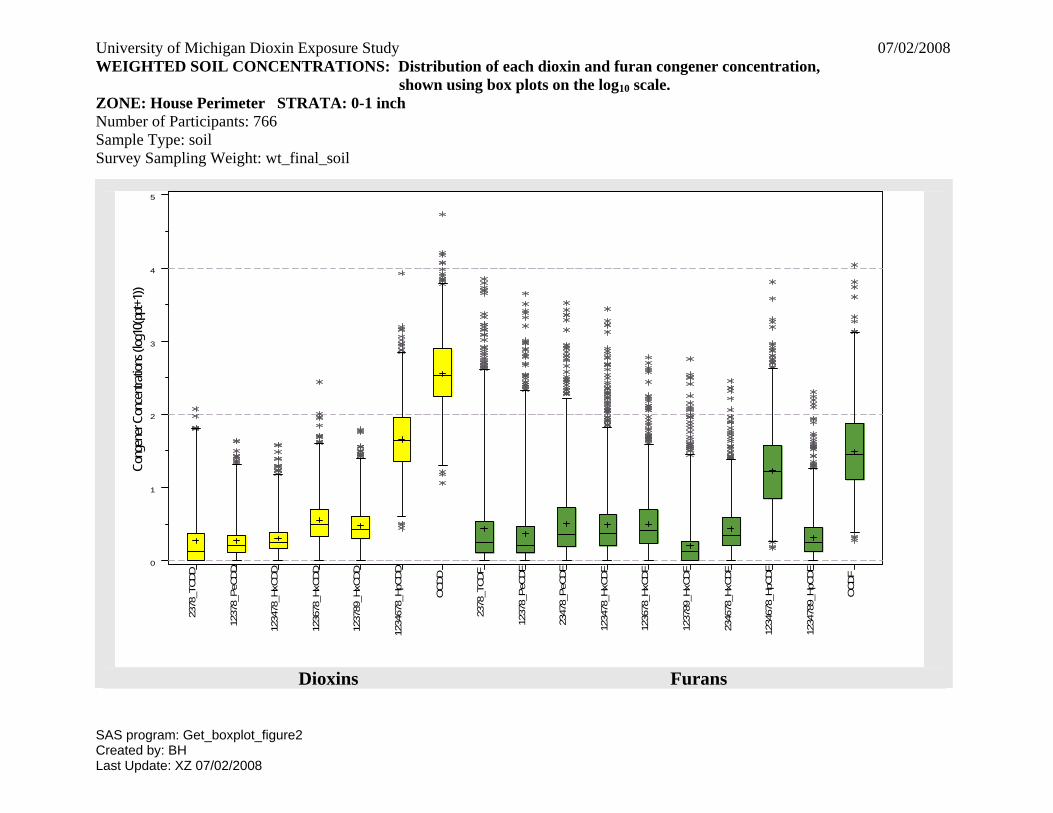
University of Michigan Dioxin Exposure Study 07/02/2008 WEIGHTED SOIL CONCENTRATIONS: Distribution of each dioxin and furan congener concentration, shown using box plots on the log10 scale. ZONE: House Perimeter STRATA: 0-1 inch
Number of Participants: 766 Sample Type: soil Survey Sampling Weight: wt_final_soil
SAS program: Get_boxplot_figure2
2378
_TCDD
1237
8_PeC
DD
1234
78_H
xCDD
1236
78_H
xCDD
1237
89_H
xCDD
1234
678_
HpC
DD
OCDD
2378
_TCDF
1237
8_PeC
DF
2347
8_PeC
DF
1234
78_H
xCDF
1236
78_H
xCDF
1237
89_H
xCDF
2346
78_H
xCDF
1234
678_
HpC
DF
1234
789_
HpC
DF
OCDF
0
1
2
3
4
5
Cong
ener
Con
centr
ation
s (log
10(p
pt+1)
)
Dioxins Furans
Created by: BH Last Update: XZ 07/02/2008

University of Michigan Dioxin Exposure Study 07/07/2008 WEIGHTED SOIL CONCENTRATIONS: Contribution of each congener to the total TEQ, shown using box plots ZONE: House Perimeter STRATA: 0-1 inch
Number of Participants: 766 Sample Type: soil
Notes: TEQ is the TEF-weighted average of the 17 dioxin congeners (excluding the PCBs) based on WHO 1998 TEFs Survey Sampling Weight: wt_final_soil
2378
_TCDD
1237
8_PeC
DD
1234
78_H
xCDD
1236
78_H
xCDD
1237
89_H
xCDD
1234
678_
HpC
DD
OCDD
2378
_TCDF
1237
8_PeC
DF
2347
8_PeC
DF
1234
78_H
xCDF
1236
78_H
xCDF
1237
89_H
xCDF
2346
78_H
xCDF
1234
678_
HpC
DF
1234
789_
HpC
DF
OCDF
0
25
50
75
100
Cont
ributi
on to
Tota
l TEQ
_DF1
7-19
98 (%
)
Dioxins Furans
SAS program: Get_boxplot_Figure3_4_TEQ98_17.sas Created by: BH Last Update: XZ 07/07/2008

University of Michigan Dioxin Exposure Study 07/07/2008 WEIGHTED SOIL CONCENTRATIONS: Percent contribution to total TEQ for dioxins and furans, by region, shown using box plots ZONE: House Perimeter STRATA: 0-1 inch
Number of Participants: 766 Sample Type: soil Notes: TEQ is the TEF-weighted average of the 17 dioxin congeners (excluding the PCBs) based on WHO 1998 TEFs Survey Sampling Weight: wt_final_soil
Region* 1-Midland/Saginaw FP; 2-Midland/Saginaw Near FP; 3-Midland/Saginaw Out FP; 4-Midland/Saginaw Plume; 5-Jackson/Calhoun
1 2 3 4 5 1 2 3 4 5
0
25
50
75
100
Contr
ibutio
n to T
otal T
EQ_D
F17-
1998
(%)
Dioxins Furans
SAS program: Get_boxplot_Figure3_4_TEQ98_17.sas Created by: BH Last Update: XZ 07/07/2008

University of Michigan Dioxin Exposure Study 06/05/2008 SOIL DIOXIN CONCENTRATIONS: Weighted TEQ by region ZONE: House Perimeter STRATA: 1-6 inch Number of Participants: 449 Sample Type: soil Notes: TEQ is the TEF-weighted average of the 17 dioxin congeners (excluding the PCBs) based on
WHO 1998 TEFs Survey Sampling Weight: wt_final_soil
TEQ (ppt)
Zone N Mean S.E. Median 75th %ile 95th %ile Min. Max. Overall 449 96.9 72.7 10 22 80.1 0.7 15306.8 M/S FP 198 71.1 14.6 11.3 28.2 275.9 1.1 2835.7 M/S Near FP 75 82.7 36.9 11.9 42.7 402.7 1.2 918.7 M/S Out FP 87 151.7 135.8 11.2 21 80.1 1 15306.8 M/S Plume 36 109.7 45.3 56.4 70.5 292.7 7 1068.3 Jackson/Calhoun 53 9.1 1.4 7.4 9.3 25.8 0.7 31.9
M/S: Midland/Saginaw FP: Floodplain SAS program: Get_table1_figure1.sas Created by: BH & XJ Last Update: XZ 06/05/2008

University of Michigan Dioxin Exposure Study 06/05/2008 SOIL DIOXIN CONCENTRATIONS: Weighted TEQ by region ZONE: House Perimeter STRATA: 1-6 inch Number of Participants: 449 Sample Type: soil Notes: TEQ is the TEF-weighted average of the 17 dioxin congeners (excluding the PCBs) based on
WHO 1998 TEFs Survey Sampling Weight: wt_final_soil
Overall Distribution of TEQ_DF17-1998, N=449
Curve: Normal(Mu=97.052 Sigma=1045)
Percent
0
20
40
60
80
100
Soil TEQ_DF17-1998
-1000 2000 5000 8000 11000 14000 17000 20000 23000 26000 29000
Mean 96.9
Minimum 0.7
Median 10.0
Maximum 15307
Overall Distribution of log10(TEQ_DF17-1998), N=449
Curve: Normal(Mu=1.0427 Sigma=0.5476)
Percent
0
5
10
15
20
25
30
log10(Soil TEQ_DF17-1998)
-0.25 0.25 0.75 1.25 1.75 2.25 2.75 3.25 3.75 4.25 4.75
Mean 1.0
Minimum -0.1
Median 1.0
Maximum 4.2
SAS program: Get_table1_figure1.sas Created by: BH & XJ Last Update: XZ 06/05/2008
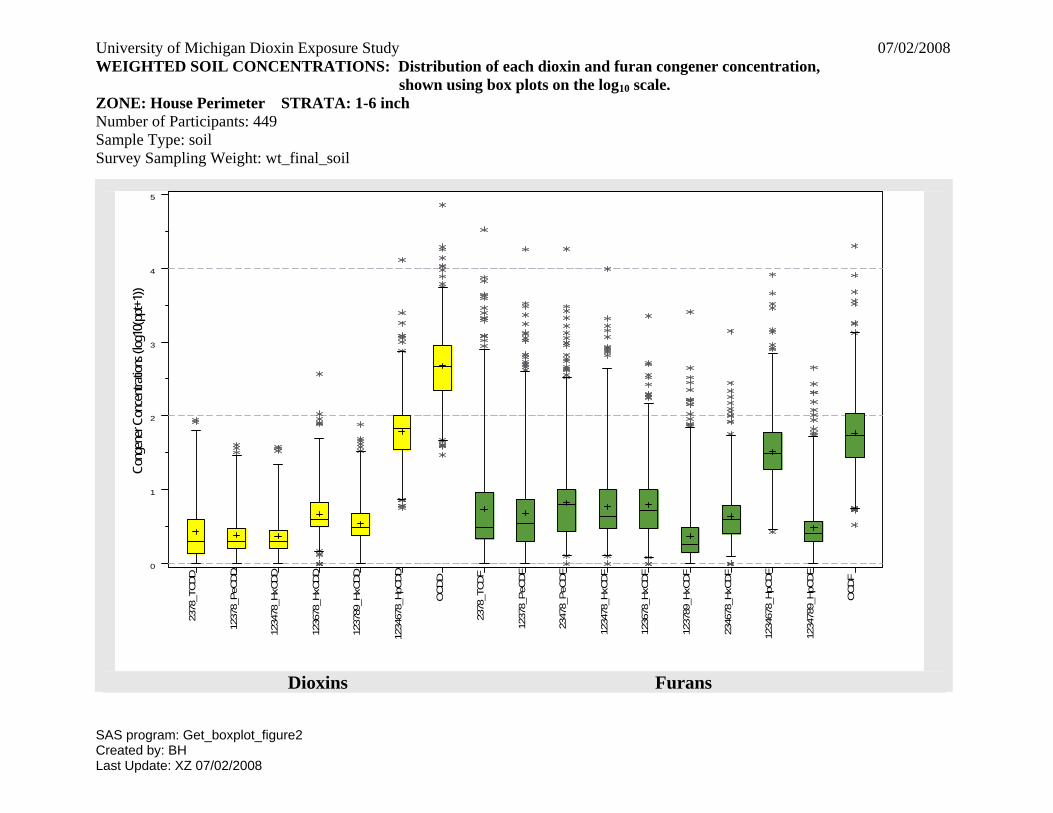
University of Michigan Dioxin Exposure Study 07/02/2008 WEIGHTED SOIL CONCENTRATIONS: Distribution of each dioxin and furan congener concentration, shown using box plots on the log10 scale. ZONE: House Perimeter STRATA: 1-6 inch Number of Participants: 449 Sample Type: soil Survey Sampling Weight: wt_final_soil
SAS program: Get_boxplot_figure2
2378
_TCDD
1237
8_PeC
DD
1234
78_H
xCDD
1236
78_H
xCDD
1237
89_H
xCDD
1234
678_
HpC
DD
OCDD
2378
_TCDF
1237
8_PeC
DF
2347
8_PeC
DF
1234
78_H
xCDF
1236
78_H
xCDF
1237
89_H
xCDF
2346
78_H
xCDF
1234
678_
HpC
DF
1234
789_
HpC
DF
OCDF
0
1
2
3
4
5
Cong
ener
Con
centr
ation
s (log
10(p
pt+1)
)
Dioxins Furans
Created by: BH Last Update: XZ 07/02/2008
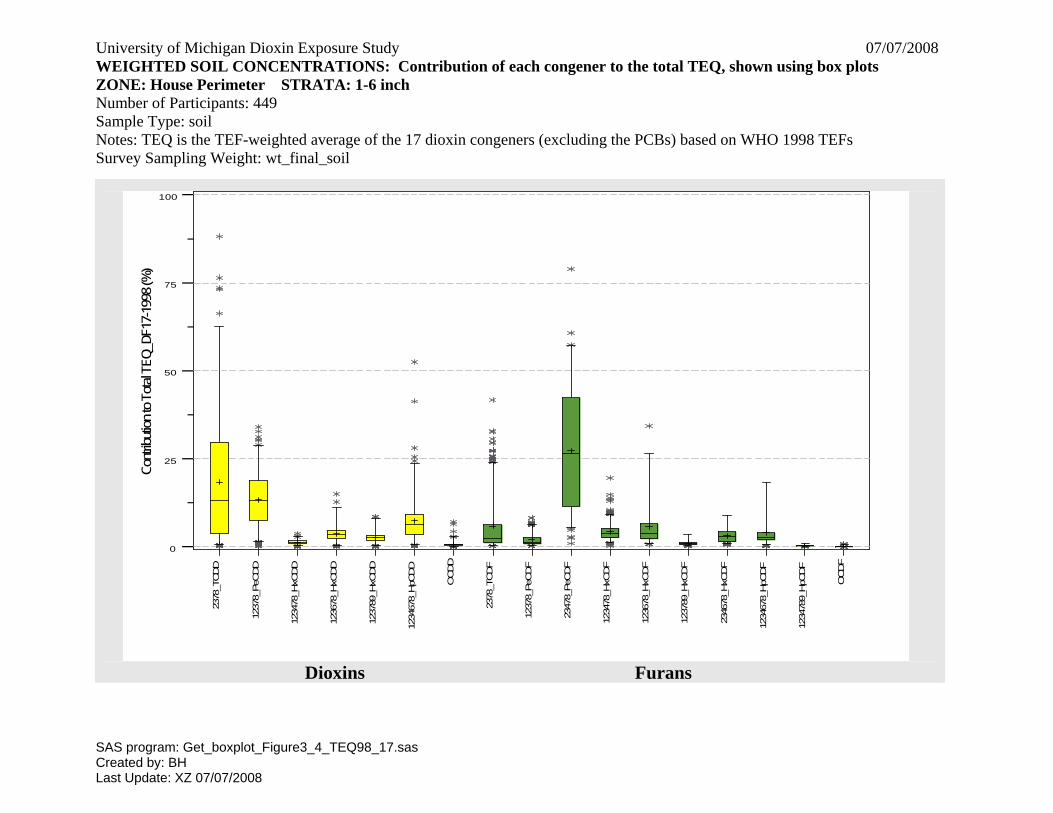
University of Michigan Dioxin Exposure Study 07/07/2008 WEIGHTED SOIL CONCENTRATIONS: Contribution of each congener to the total TEQ, shown using box plots ZONE: House Perimeter STRATA: 1-6 inch Number of Participants: 449 Sample Type: soil
Notes: TEQ is the TEF-weighted average of the 17 dioxin congeners (excluding the PCBs) based on WHO 1998 TEFs Survey Sampling Weight: wt_final_soil
2378
_TCDD
1237
8_PeC
DD
1234
78_H
xCDD
1236
78_H
xCDD
1237
89_H
xCDD
1234
678_
HpC
DD
OCDD
2378
_TCDF
1237
8_PeC
DF
2347
8_PeC
DF
1234
78_H
xCDF
1236
78_H
xCDF
1237
89_H
xCDF
2346
78_H
xCDF
1234
678_
HpC
DF
1234
789_
HpC
DF
OCDF
0
25
50
75
100
Cont
ributi
on to
Tota
l TEQ
_DF1
7-19
98 (%
)
Dioxins Furans
SAS program: Get_boxplot_Figure3_4_TEQ98_17.sas Created by: BH Last Update: XZ 07/07/2008
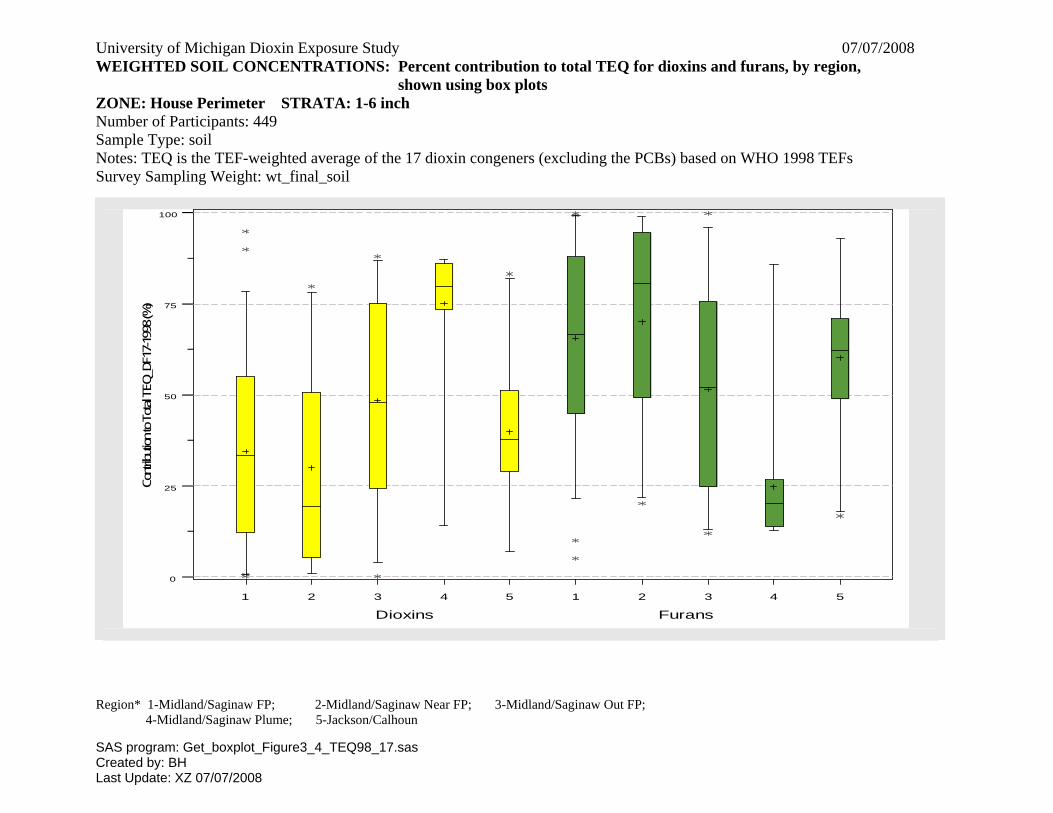
University of Michigan Dioxin Exposure Study 07/07/2008 WEIGHTED SOIL CONCENTRATIONS: Percent contribution to total TEQ for dioxins and furans, by region, shown using box plots ZONE: House Perimeter STRATA: 1-6 inch Number of Participants: 449 Sample Type: soil
Notes: TEQ is the TEF-weighted average of the 17 dioxin congeners (excluding the PCBs) based on WHO 1998 TEFs Survey Sampling Weight: wt_final_soil
Region* 1-Midland/Saginaw FP; 2-Midland/Saginaw Near FP; 3-Midland/Saginaw Out FP; 4-Midland/Saginaw Plume; 5-Jackson/Calhoun
1 2 3 4 5 1 2 3 4 5
0
25
50
75
100
Contr
ibutio
n to T
otal T
EQ_D
F17-
1998
(%)
Dioxins Furans
SAS program: Get_boxplot_Figure3_4_TEQ98_17.sas Created by: BH Last Update: XZ 07/07/2008
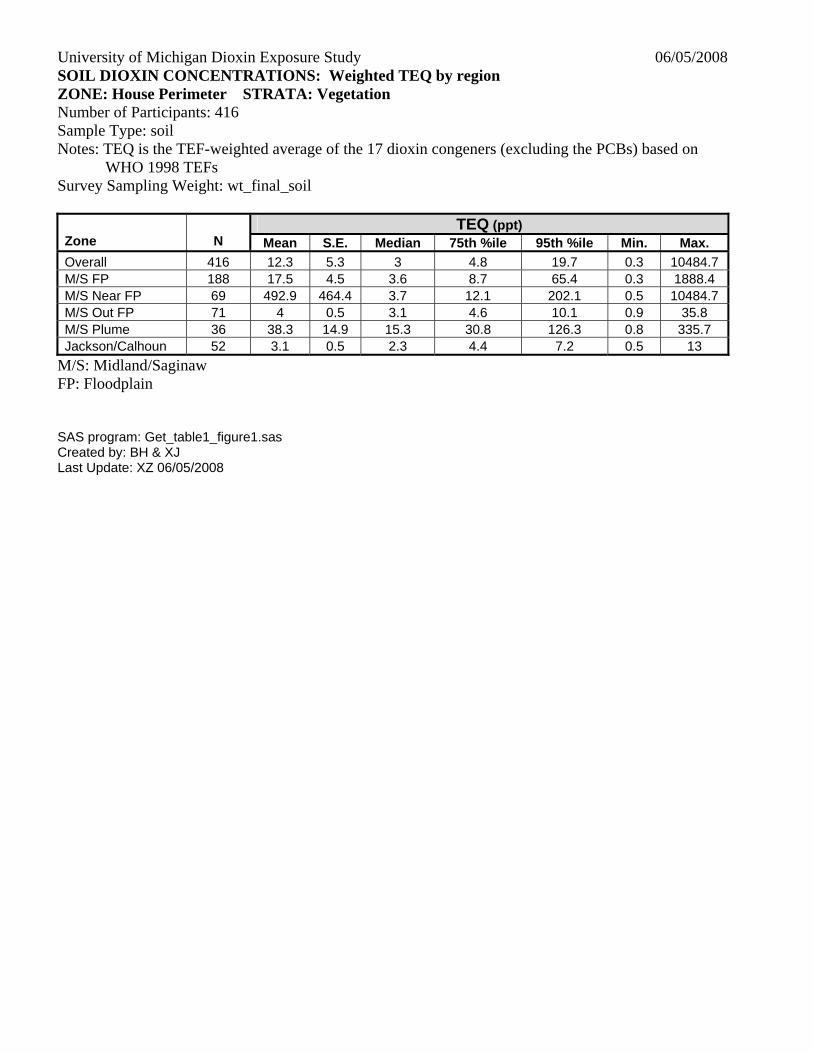
University of Michigan Dioxin Exposure Study 06/05/2008 SOIL DIOXIN CONCENTRATIONS: Weighted TEQ by region ZONE: House Perimeter STRATA: Vegetation Number of Participants: 416 Sample Type: soil Notes: TEQ is the TEF-weighted average of the 17 dioxin congeners (excluding the PCBs) based on
WHO 1998 TEFs Survey Sampling Weight: wt_final_soil
TEQ (ppt)
Zone N Mean S.E. Median 75th %ile 95th %ile Min. Max. Overall 416 12.3 5.3 3 4.8 19.7 0.3 10484.7 M/S FP 188 17.5 4.5 3.6 8.7 65.4 0.3 1888.4 M/S Near FP 69 492.9 464.4 3.7 12.1 202.1 0.5 10484.7 M/S Out FP 71 4 0.5 3.1 4.6 10.1 0.9 35.8 M/S Plume 36 38.3 14.9 15.3 30.8 126.3 0.8 335.7 Jackson/Calhoun 52 3.1 0.5 2.3 4.4 7.2 0.5 13
M/S: Midland/Saginaw FP: Floodplain SAS program: Get_table1_figure1.sas Created by: BH & XJ Last Update: XZ 06/05/2008

University of Michigan Dioxin Exposure Study 06/05/2008 SOIL DIOXIN CONCENTRATIONS: Weighted TEQ by region ZONE: House Perimeter STRATA: Vegetation Number of Participants: 416 Sample Type: soil Notes: TEQ is the TEF-weighted average of the 17 dioxin congeners (excluding the PCBs) based on
WHO 1998 TEFs Survey Sampling Weight: wt_final_soil
Overall Distribution of TEQ_DF17-1998, N=416
Curve: Normal(Mu=12.287 Sigma=232.43)
Percent
0
20
40
60
80
100
Soil TEQ_DF17-1998
-500 1000 2500 4000 5500 7000 8500 10000 11500 13000 14500
Mean 12.3
Minimum 0.3
Median 3.0
Maximum 10485
Overall Distribution of log10(TEQ_DF17-1998), N=416
Curve: Normal(Mu=0.5193 Sigma=0.422)
Percent
0
5
10
15
20
25
30
log10(Soil TEQ_DF17-1998)
-0.5 0.0 0.5 1.0 1.5 2.0 2.5 3.0 3.5 4.0 4.5
Mean 0.5
Minimum -0.5
Median 0.5
Maximum 4.0
SAS program: Get_table1_figure1.sas Created by: BH & XJ Last Update: XZ 06/05/2008
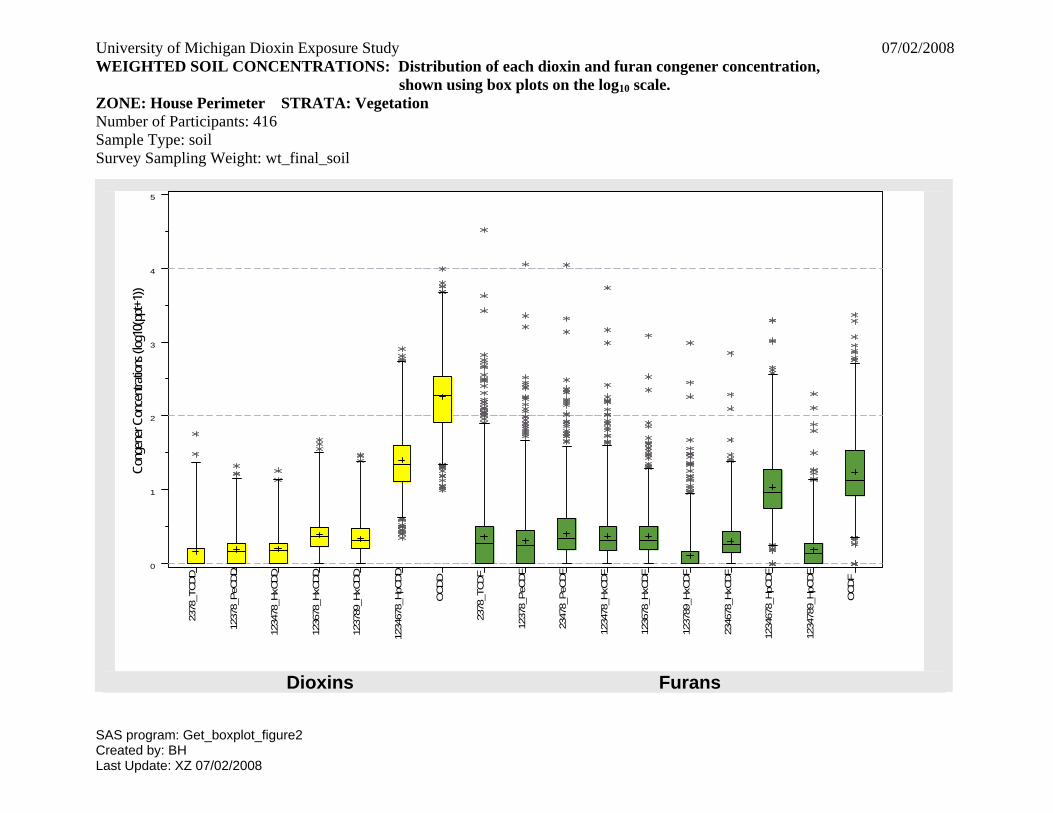
University of Michigan Dioxin Exposure Study 07/02/2008 WEIGHTED SOIL CONCENTRATIONS: Distribution of each dioxin and furan congener concentration, shown using box plots on the log10 scale. ZONE: House Perimeter STRATA: Vegetation
Number of Participants: 416 Sample Type: soil Survey Sampling Weight: wt_final_soil
SAS program: Get_boxplot_figure2
2378
_TCDD
1237
8_PeC
DD
1234
78_H
xCDD
1236
78_H
xCDD
1237
89_H
xCDD
1234
678_
HpC
DD
OCDD
2378
_TCDF
1237
8_PeC
DF
2347
8_PeC
DF
1234
78_H
xCDF
1236
78_H
xCDF
1237
89_H
xCDF
2346
78_H
xCDF
1234
678_
HpC
DF
1234
789_
HpC
DF
OCDF
0
1
2
3
4
5
Cong
ener
Con
centr
ation
s (log
10(p
pt+1)
)
Dioxins Furans
Created by: BH Last Update: XZ 07/02/2008
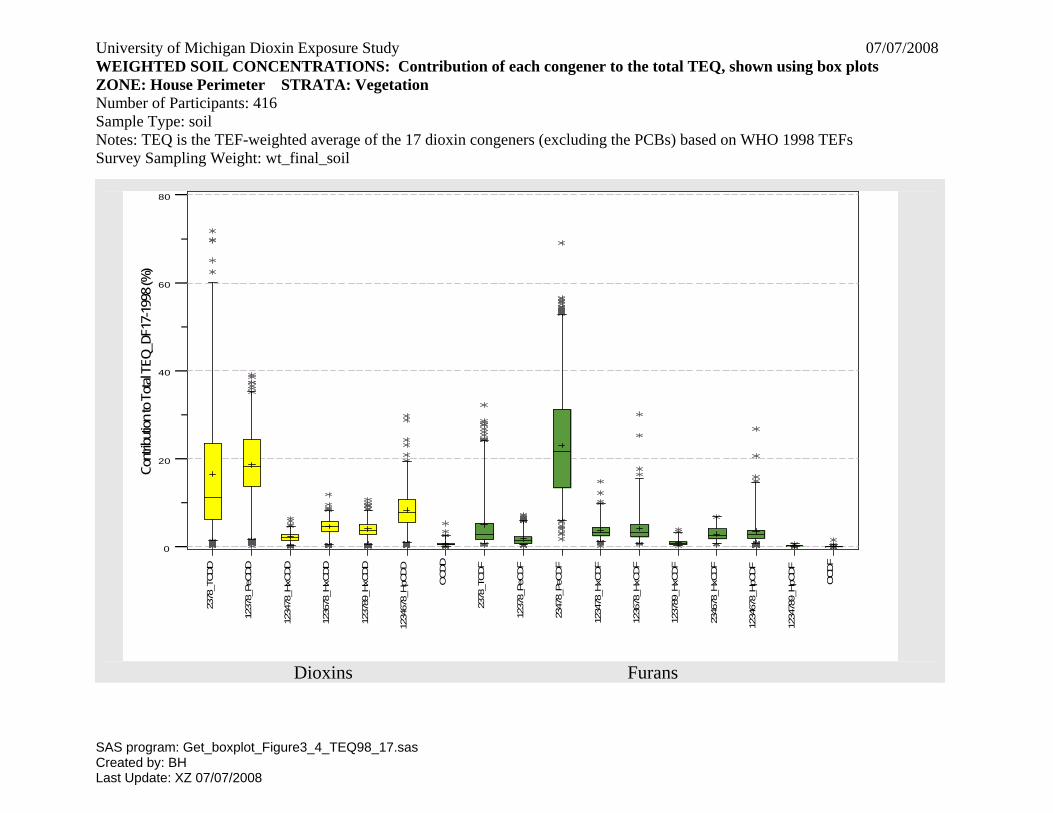
University of Michigan Dioxin Exposure Study 07/07/2008 WEIGHTED SOIL CONCENTRATIONS: Contribution of each congener to the total TEQ, shown using box plots ZONE: House Perimeter STRATA: Vegetation
Number of Participants: 416 Sample Type: soil Notes: TEQ is the TEF-weighted average of the 17 dioxin congeners (excluding the PCBs) based on WHO 1998 TEFs Survey Sampling Weight: wt_final_soil
2378
_TCDD
1237
8_PeC
DD
1234
78_H
xCDD
1236
78_H
xCDD
1237
89_H
xCDD
1234
678_
HpC
DD
OCDD
2378
_TCDF
1237
8_PeC
DF
2347
8_PeC
DF
1234
78_H
xCDF
1236
78_H
xCDF
1237
89_H
xCDF
2346
78_H
xCDF
1234
678_
HpC
DF
1234
789_
HpC
DF
OCDF
0
20
40
60
80
Contr
ibutio
n to T
otal T
EQ_D
F17-
1998
(%)
Dioxins Furans
SAS program: Get_boxplot_Figure3_4_TEQ98_17.sas Created by: BH Last Update: XZ 07/07/2008
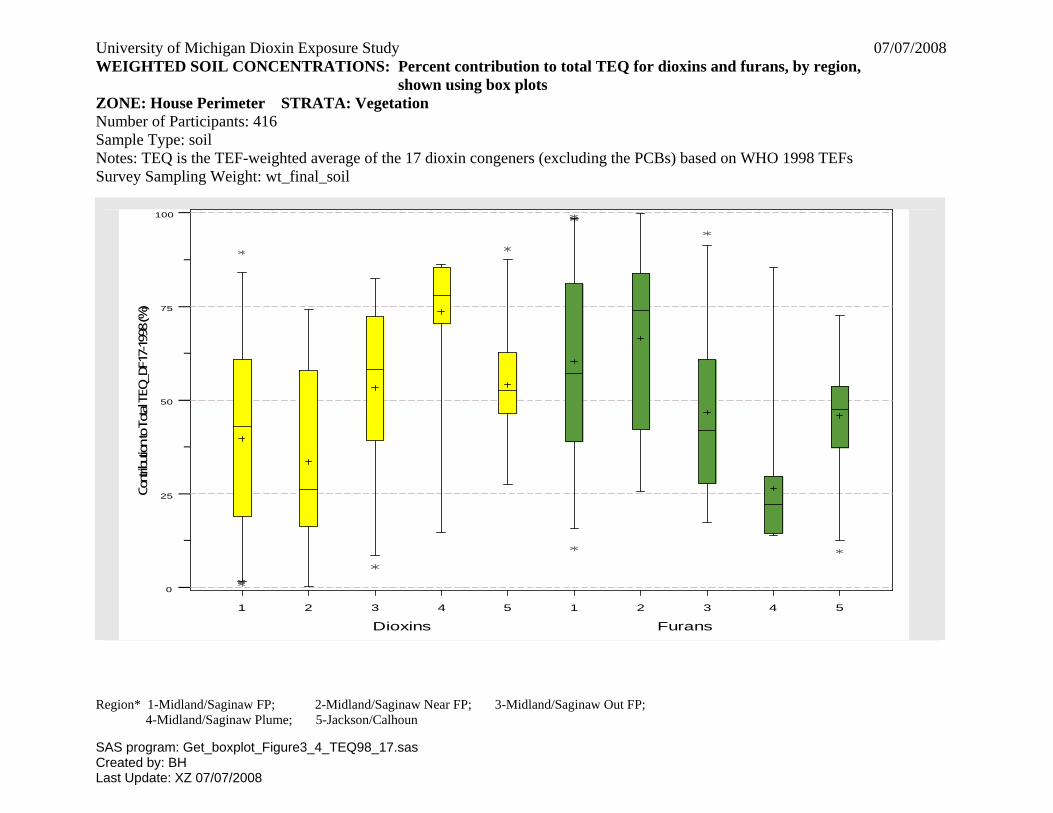
University of Michigan Dioxin Exposure Study 07/07/2008 WEIGHTED SOIL CONCENTRATIONS: Percent contribution to total TEQ for dioxins and furans, by region, shown using box plots ZONE: House Perimeter STRATA: Vegetation
Number of Participants: 416 Sample Type: soil Notes: TEQ is the TEF-weighted average of the 17 dioxin congeners (excluding the PCBs) based on WHO 1998 TEFs Survey Sampling Weight: wt_final_soil
Region* 1-Midland/Saginaw FP; 2-Midland/Saginaw Near FP; 3-Midland/Saginaw Out FP; 4-Midland/Saginaw Plume; 5-Jackson/Calhoun
1 2 3 4 5 1 2 3 4 5
0
25
50
75
100
Contr
ibutio
n to
Total
TEQ
_DF1
7-19
98 (%
)
Dioxins Furans
SAS program: Get_boxplot_Figure3_4_TEQ98_17.sas Created by: BH Last Update: XZ 07/07/2008

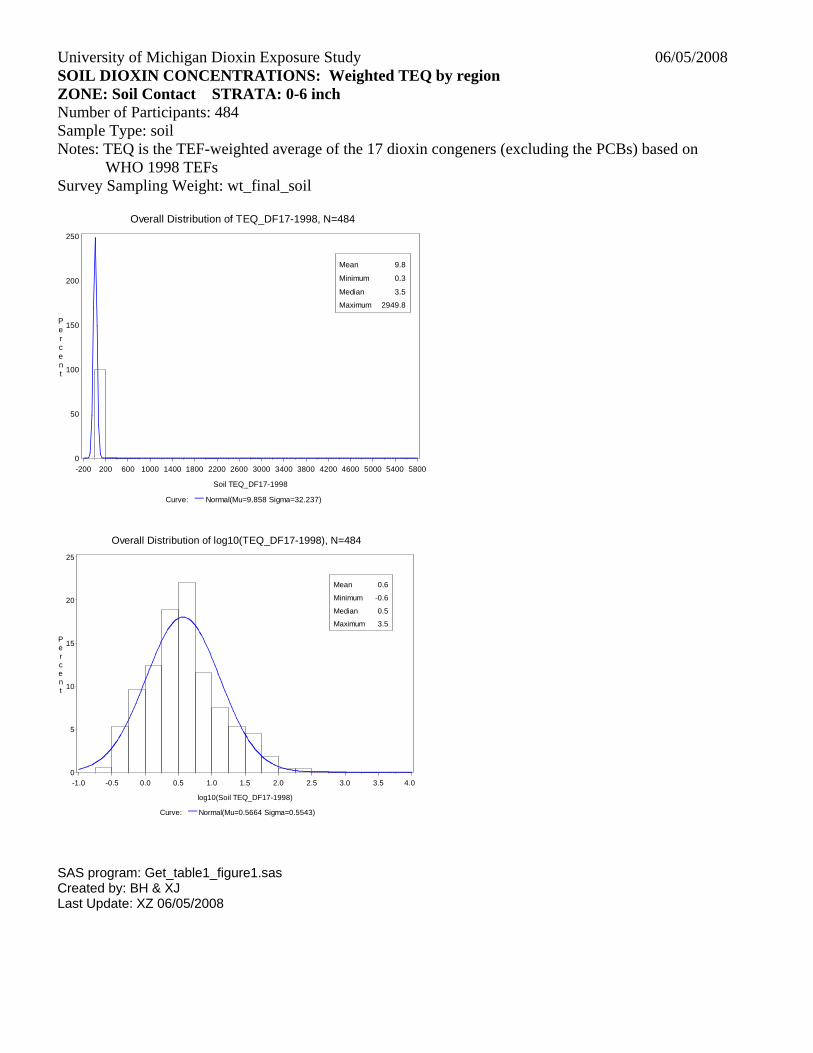
University of Michigan Dioxin Exposure Study 06/05/2008 SOIL DIOXIN CONCENTRATIONS: Weighted TEQ by region ZONE: Soil Contact STRATA: 0-6 inch Number of Participants: 484 Sample Type: soil Notes: TEQ is the TEF-weighted average of the 17 dioxin congeners (excluding the PCBs) based on
WHO 1998 TEFs Survey Sampling Weight: wt_final_soil
TEQ (ppt)
Zone N Mean S.E. Median 75th %ile 95th %ile Min. Max. Overall 484 9.8 0.9 3.5 7.5 39.3 0.3 2949.8 M/S FP 132 63.1 14.5 9.6 40 249.8 1.1 2949.8 M/S Near FP 100 24.9 6.5 5.7 11.5 117.4 0.7 730 M/S Out FP 101 10.1 1.1 3.8 11.5 37.3 0.4 115.2 M/S Plume 27 62.9 12.8 53.8 61.7 272.2 19.7 272.2 Jackson/Calhoun 124 3.3 0.3 2.2 4.3 9.5 0.3 19
M/S: Midland/Saginaw FP: Floodplain SAS program: Get_table1_figure1.sas Created by: BH & XJ Last Update: XZ 06/05/2008
University of Michigan Dioxin Exposure Study 06/05/2008 SOIL DIOXIN CONCENTRATIONS: Weighted TEQ by region ZONE: Soil Contact STRATA: 0-6 inch Number of Participants: 484 Sample Type: soil Notes: TEQ is the TEF-weighted average of the 17 dioxin congeners (excluding the PCBs) based on
WHO 1998 TEFs Survey Sampling Weight: wt_final_soil
Overall Distribution of TEQ_DF17-1998, N=484
Curve: Normal(Mu=9.858 Sigma=32.237)
Percent
0
50
100
150
200
250
Soil TEQ_DF17-1998
-200 200 600 1000 1400 1800 2200 2600 3000 3400 3800 4200 4600 5000 5400 5800
Mean 9.8
Minimum 0.3
Median 3.5
Maximum 2949.8
Overall Distribution of log10(TEQ_DF17-1998), N=484
Curve: Normal(Mu=0.5664 Sigma=0.5543)
Percent
0
5
10
15
20
25
log10(Soil TEQ_DF17-1998)
-1.0 -0.5 0.0 0.5 1.0 1.5 2.0 2.5 3.0 3.5 4.0
Mean 0.6
Minimum -0.6
Median 0.5
Maximum 3.5
SAS program: Get_table1_figure1.sas Created by: BH & XJ Last Update: XZ 06/05/2008
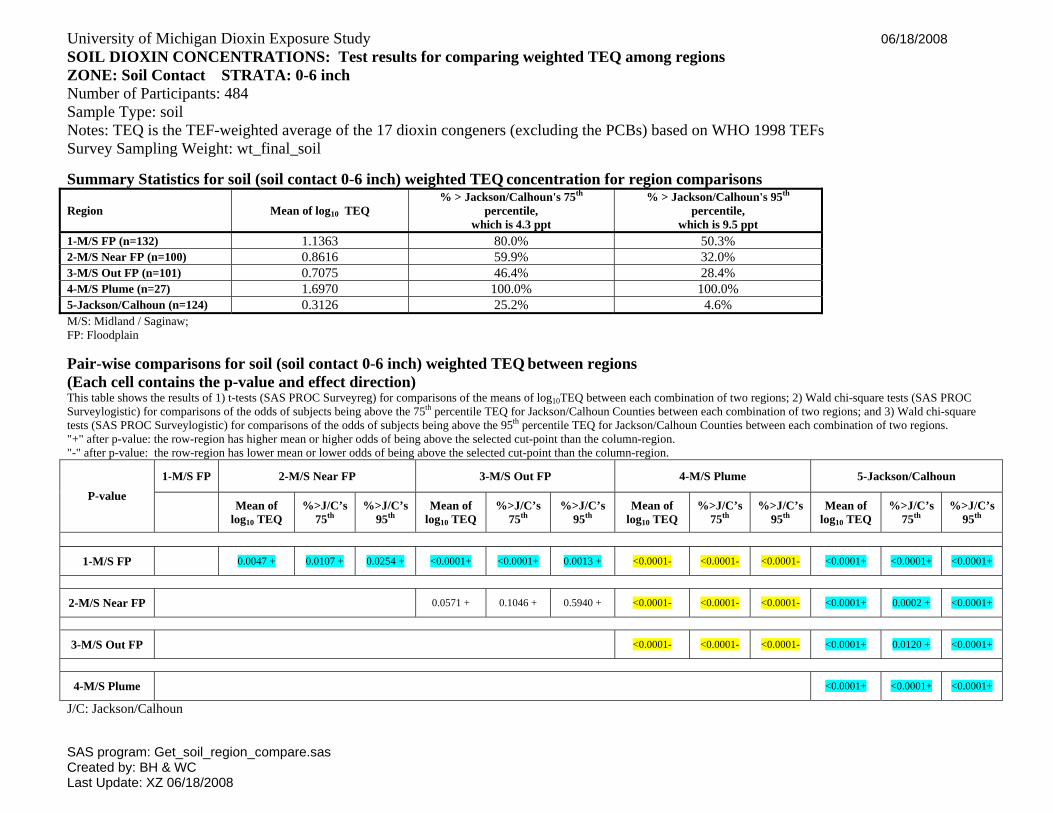
University of Michigan Dioxin Exposure Study 06/18/2008 SOIL DIOXIN CONCENTRATIONS: Test results for comparing weighted TEQ among regions ZONE: Soil Contact STRATA: 0-6 inch Number of Participants: 484 Sample Type: soil
Notes: TEQ is the TEF-weighted average of the 17 dioxin congeners (excluding the PCBs) based on WHO 1998 TEFs Survey Sampling Weight: wt_final_soil Summary Statistics for soil (soil contact 0-6 inch) weighted TEQ concentration for region comparisons
Region Mean of log10 TEQ % > Jackson/Calhoun's 75th
percentile, which is 4.3 ppt
% > Jackson/Calhoun's 95th percentile,
which is 9.5 ppt 1-M/S FP (n=132) 1.1363 80.0% 50.3% 2-M/S Near FP (n=100) 0.8616 59.9% 32.0% 3-M/S Out FP (n=101) 0.7075 46.4% 28.4% 4-M/S Plume (n=27) 1.6970 100.0% 100.0% 5-Jackson/Calhoun (n=124) 0.3126 25.2% 4.6% M/S: Midland / Saginaw; FP: Floodplain Pair-wise comparisons for soil (soil contact 0-6 inch) weighted TEQ between regions (Each cell contains the p-value and effect direction) This table shows the results of 1) t-tests (SAS PROC Surveyreg) for comparisons of the means of log10TEQ between each combination of two regions; 2) Wald chi-square tests (SAS PROC Surveylogistic) for comparisons of the odds of subjects being above the 75th percentile TEQ for Jackson/Calhoun Counties between each combination of two regions; and 3) Wald chi-square tests (SAS PROC Surveylogistic) for comparisons of the odds of subjects being above the 95th percentile TEQ for Jackson/Calhoun Counties between each combination of two regions. "+" after p-value: the row-region has higher mean or higher odds of being above the selected cut-point than the column-region. "-" after p-value: the row-region has lower mean or lower odds of being above the selected cut-point than the column-region.
1-M/S FP 2-M/S Near FP 3-M/S Out FP 4-M/S Plume 5-Jackson/Calhoun
P-value Mean of log10 TEQ
%>J/C’s 75th
%>J/C’s 95th
Mean of log10 TEQ
%>J/C’s 75th
%>J/C’s 95th
Mean of log10 TEQ
%>J/C’s 75th
%>J/C’s 95th
Mean of log10 TEQ
%>J/C’s 75th
%>J/C’s 95th
1-M/S FP 0.0047 + 0.0107 + 0.0254 + <0.0001+ <0.0001+ 0.0013 + <0.0001- <0.0001- <0.0001- <0.0001+ <0.0001+ <0.0001+
2-M/S Near FP 0.0571 + 0.1046 + 0.5940 + <0.0001- <0.0001- <0.0001- <0.0001+ 0.0002 + <0.0001+
3-M/S Out FP <0.0001- <0.0001- <0.0001- <0.0001+ 0.0120 + <0.0001+
4-M/S Plume <0.0001+ <0.0001+ <0.0001+
J/C: Jackson/Calhoun
SAS program: Get_soil_region_compare.sas Created by: BH & WC Last Update: XZ 06/18/2008

University of Michigan Dioxin Exposure Study 07/02/2008 WEIGHTED SOIL CONCENTRATIONS: Distribution of each dioxin and furan congener concentration, shown using box plots on the log10 scale. ZONE: Soil Contact STRATA: 0-6 inch
Number of Participants: 484 Sample Type: soil Survey Sampling Weight: wt_final_soil
SAS program: Get_boxplot_figure2
2378
_TCDD
1237
8_PeC
DD
1234
78_H
xCDD
1236
78_H
xCDD
1237
89_H
xCDD
1234
678_
HpC
DD
OCDD
2378
_TCDF
1237
8_PeC
DF
2347
8_PeC
DF
1234
78_H
xCDF
1236
78_H
xCDF
1237
89_H
xCDF
2346
78_H
xCDF
1234
678_
HpC
DF
1234
789_
HpC
DF
OCDF
0
1
2
3
4
5
Cong
ener
Con
centr
ation
s (log
10(p
pt+1)
)
Dioxins Furans
Created by: BH Last Update: XZ 07/02/2008
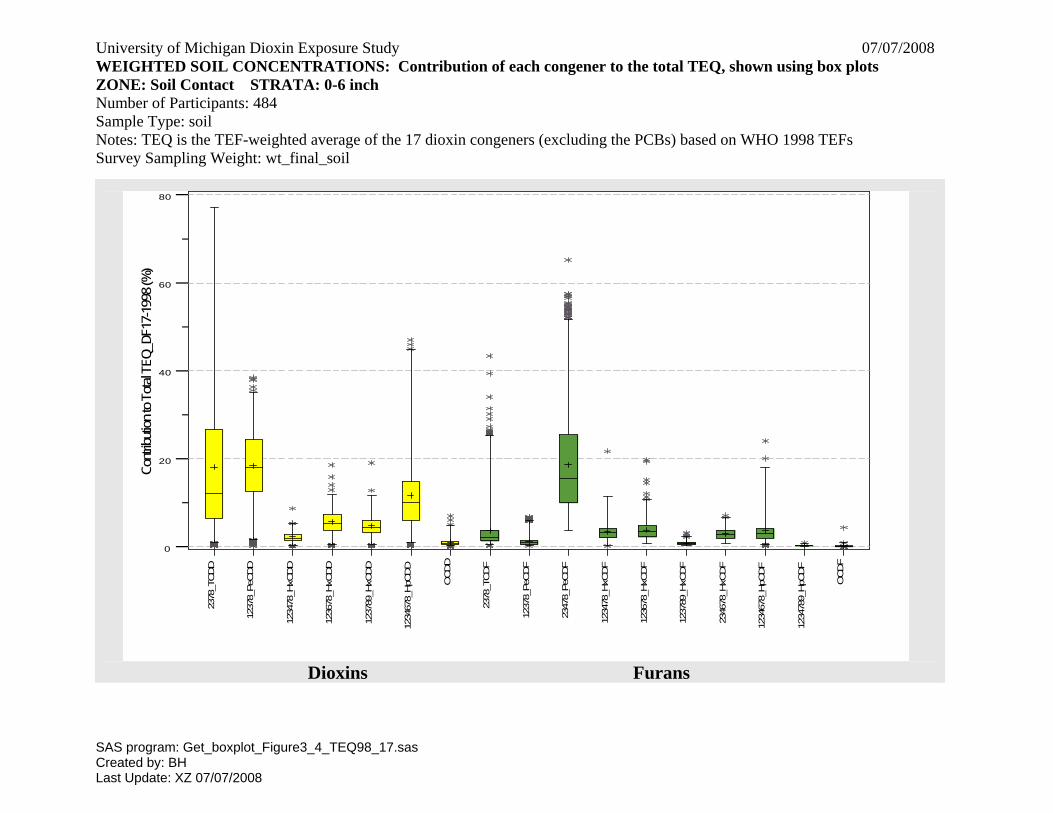
University of Michigan Dioxin Exposure Study 07/07/2008 WEIGHTED SOIL CONCENTRATIONS: Contribution of each congener to the total TEQ, shown using box plots ZONE: Soil Contact STRATA: 0-6 inch
Number of Participants: 484 Sample Type: soil
Notes: TEQ is the TEF-weighted average of the 17 dioxin congeners (excluding the PCBs) based on WHO 1998 TEFs Survey Sampling Weight: wt_final_soil
2378
_TCDD
1237
8_PeC
DD
1234
78_H
xCDD
1236
78_H
xCDD
1237
89_H
xCDD
1234
678_
HpC
DD
OCDD
2378
_TCDF
1237
8_PeC
DF
2347
8_PeC
DF
1234
78_H
xCDF
1236
78_H
xCDF
1237
89_H
xCDF
2346
78_H
xCDF
1234
678_
HpC
DF
1234
789_
HpC
DF
OCDF
0
20
40
60
80
Cont
ributi
on to
Tota
l TEQ
_DF1
7-19
98 (%
)
Dioxins Furans
SAS program: Get_boxplot_Figure3_4_TEQ98_17.sas Created by: BH Last Update: XZ 07/07/2008
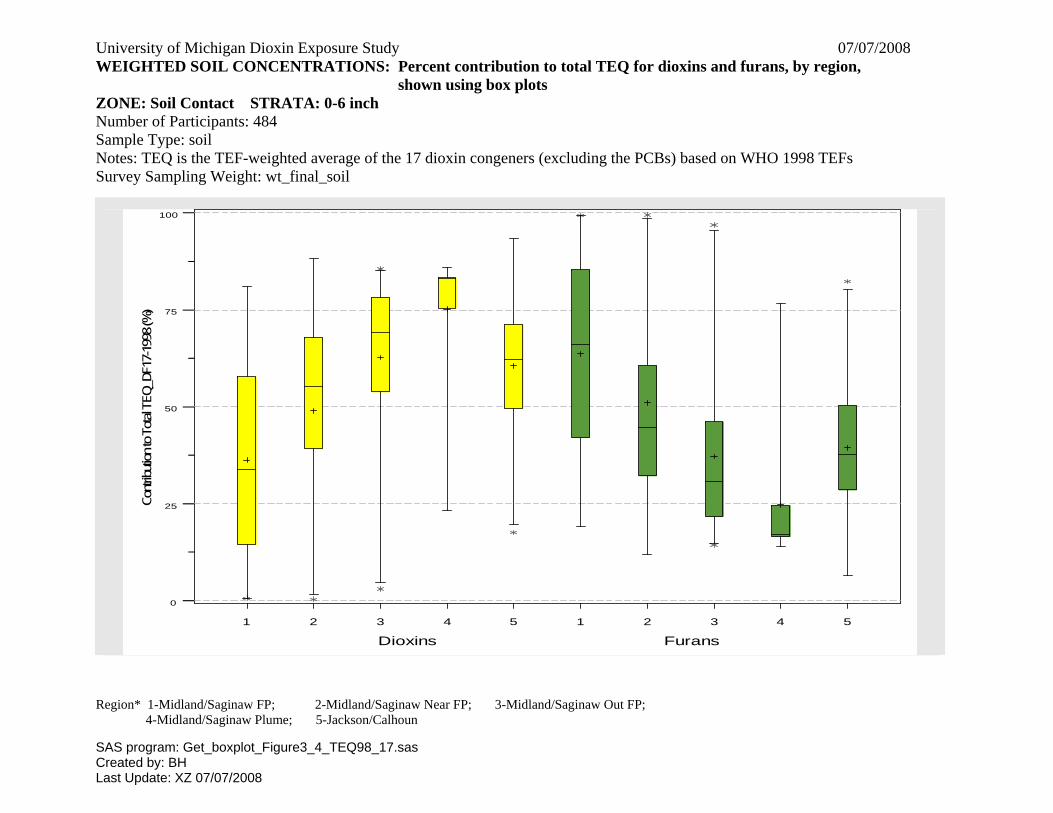
University of Michigan Dioxin Exposure Study 07/07/2008 WEIGHTED SOIL CONCENTRATIONS: Percent contribution to total TEQ for dioxins and furans, by region, shown using box plots ZONE: Soil Contact STRATA: 0-6 inch
Number of Participants: 484 Sample Type: soil
Notes: TEQ is the TEF-weighted average of the 17 dioxin congeners (excluding the PCBs) based on WHO 1998 TEFs Survey Sampling Weight: wt_final_soil
Region* 1-Midland/Saginaw FP; 2-Midland/Saginaw Near FP; 3-Midland/Saginaw Out FP; 4-Midland/Saginaw Plume; 5-Jackson/Calhoun
1 2 3 4 5 1 2 3 4 5
0
25
50
75
100
Contr
ibutio
n to
Total
TEQ
_DF1
7-19
98 (%
)
Dioxins Furans
SAS program: Get_boxplot_Figure3_4_TEQ98_17.sas Created by: BH Last Update: XZ 07/07/2008
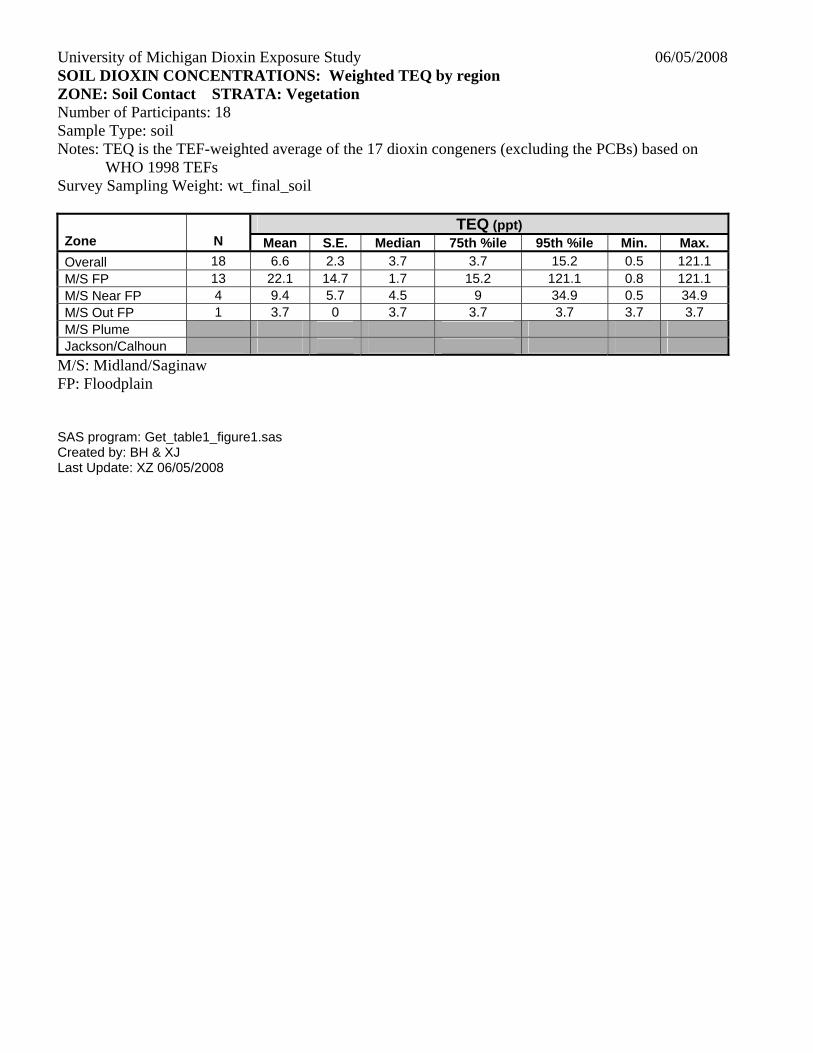
University of Michigan Dioxin Exposure Study 06/05/2008 SOIL DIOXIN CONCENTRATIONS: Weighted TEQ by region ZONE: Soil Contact STRATA: Vegetation Number of Participants: 18 Sample Type: soil Notes: TEQ is the TEF-weighted average of the 17 dioxin congeners (excluding the PCBs) based on
WHO 1998 TEFs Survey Sampling Weight: wt_final_soil
TEQ (ppt)
Zone N Mean S.E. Median 75th %ile 95th %ile Min. Max. Overall 18 6.6 2.3 3.7 3.7 15.2 0.5 121.1 M/S FP 13 22.1 14.7 1.7 15.2 121.1 0.8 121.1 M/S Near FP 4 9.4 5.7 4.5 9 34.9 0.5 34.9 M/S Out FP 1 3.7 0 3.7 3.7 3.7 3.7 3.7 M/S Plume Jackson/Calhoun
M/S: Midland/Saginaw FP: Floodplain SAS program: Get_table1_figure1.sas Created by: BH & XJ Last Update: XZ 06/05/2008
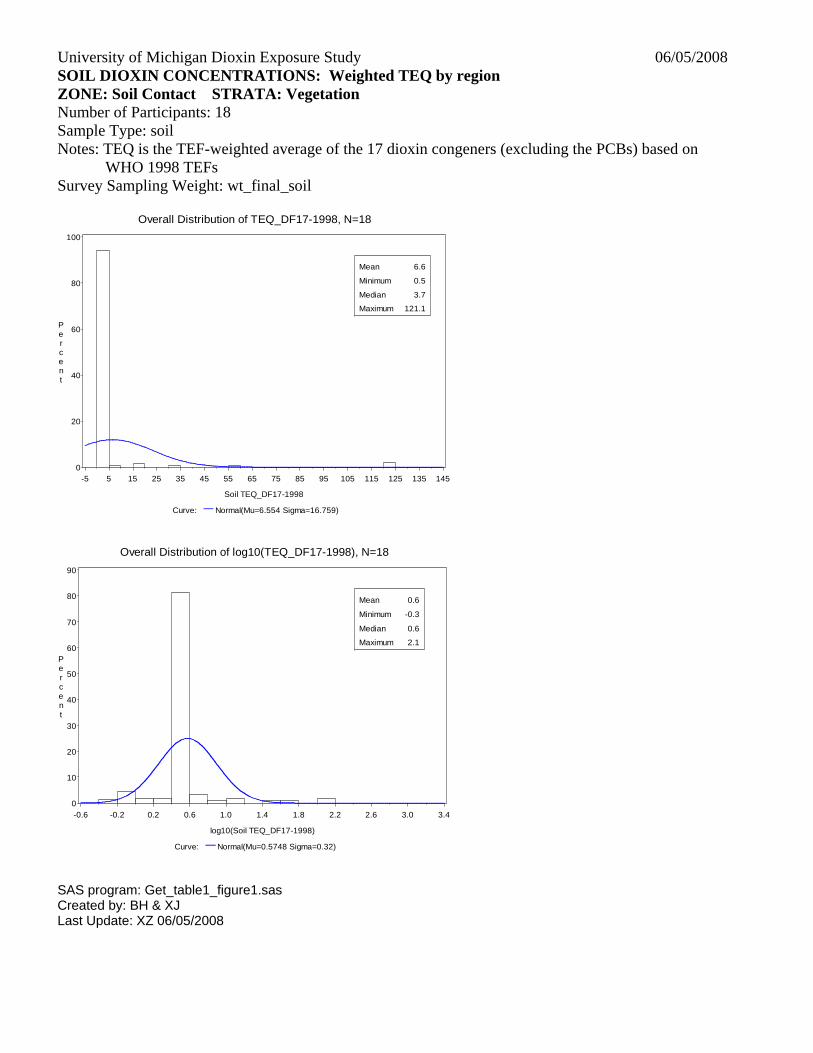
University of Michigan Dioxin Exposure Study 06/05/2008 SOIL DIOXIN CONCENTRATIONS: Weighted TEQ by region ZONE: Soil Contact STRATA: Vegetation Number of Participants: 18 Sample Type: soil Notes: TEQ is the TEF-weighted average of the 17 dioxin congeners (excluding the PCBs) based on
WHO 1998 TEFs Survey Sampling Weight: wt_final_soil
Overall Distribution of TEQ_DF17-1998, N=18
Curve: Normal(Mu=6.554 Sigma=16.759)
Percent
0
20
40
60
80
100
Soil TEQ_DF17-1998
-5 5 15 25 35 45 55 65 75 85 95 105 115 125 135 145
Mean 6.6
Minimum 0.5
Median 3.7
Maximum 121.1
Overall Distribution of log10(TEQ_DF17-1998), N=18
Curve: Normal(Mu=0.5748 Sigma=0.32)
Percent
0
10
20
30
40
50
60
70
80
90
log10(Soil TEQ_DF17-1998)
-0.6 -0.2 0.2 0.6 1.0 1.4 1.8 2.2 2.6 3.0 3.4
Mean 0.6
Minimum -0.3
Median 0.6
Maximum 2.1
SAS program: Get_table1_figure1.sas Created by: BH & XJ Last Update: XZ 06/05/2008
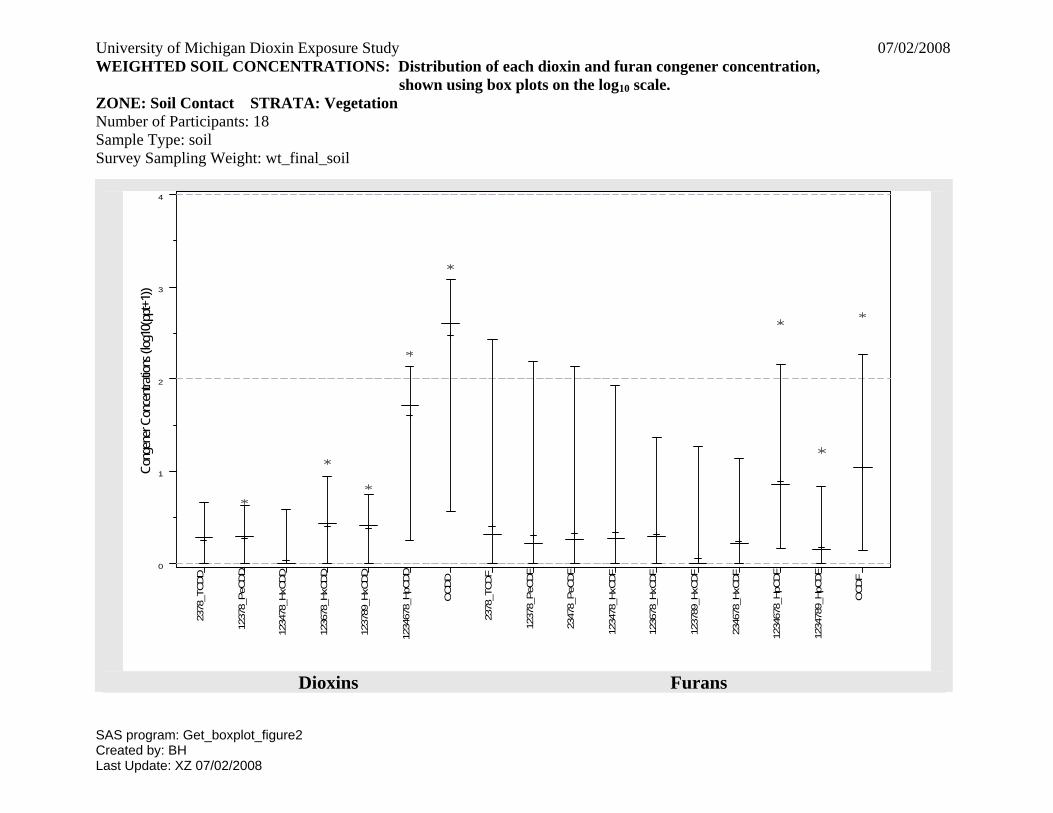
University of Michigan Dioxin Exposure Study 07/02/2008 WEIGHTED SOIL CONCENTRATIONS: Distribution of each dioxin and furan congener concentration, shown using box plots on the log10 scale. ZONE: Soil Contact STRATA: Vegetation
Number of Participants: 18 Sample Type: soil Survey Sampling Weight: wt_final_soil
SAS program: Get_boxplot_figure2
2378
_TCDD
1237
8_PeC
DD
1234
78_H
xCDD
1236
78_H
xCDD
1237
89_H
xCDD
1234
678_
HpC
DD
OCDD
2378
_TCDF
1237
8_PeC
DF
2347
8_PeC
DF
1234
78_H
xCDF
1236
78_H
xCDF
1237
89_H
xCDF
2346
78_H
xCDF
1234
678_
HpC
DF
1234
789_
HpC
DF
OCDF
0
1
2
3
4
Cong
ener
Con
centr
ation
s (log
10(p
pt+1)
)
Dioxins Furans
Created by: BH Last Update: XZ 07/02/2008
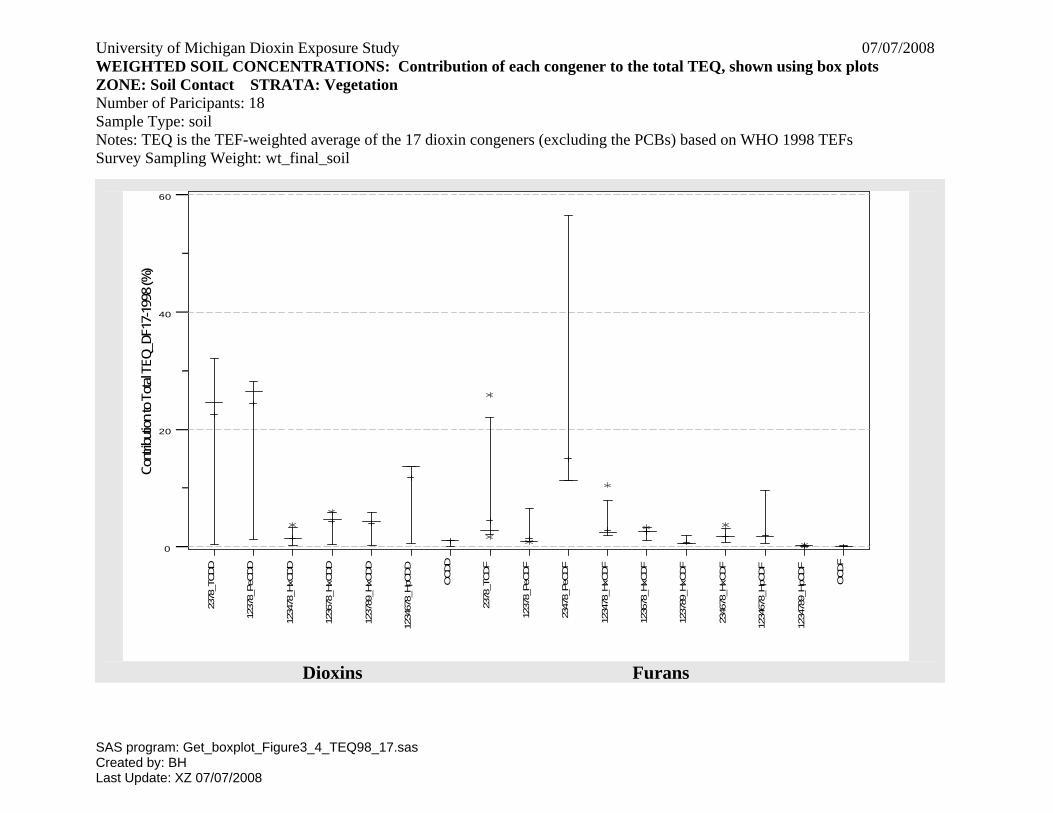
University of Michigan Dioxin Exposure Study 07/07/2008 WEIGHTED SOIL CONCENTRATIONS: Contribution of each congener to the total TEQ, shown using box plots ZONE: Soil Contact STRATA: Vegetation
Number of Paricipants: 18 Sample Type: soil Notes: TEQ is the TEF-weighted average of the 17 dioxin congeners (excluding the PCBs) based on WHO 1998 TEFs Survey Sampling Weight: wt_final_soil
2378
_TCDD
1237
8_PeC
DD
1234
78_H
xCDD
1236
78_H
xCDD
1237
89_H
xCDD
1234
678_
HpC
DD
OCDD
2378
_TCDF
1237
8_PeC
DF
2347
8_PeC
DF
1234
78_H
xCDF
1236
78_H
xCDF
1237
89_H
xCDF
2346
78_H
xCDF
1234
678_
HpC
DF
1234
789_
HpC
DF
OCDF
0
20
40
60
Cont
ributi
on to
Tota
l TEQ
_DF1
7-19
98 (%
)
Dioxins Furans
SAS program: Get_boxplot_Figure3_4_TEQ98_17.sas Created by: BH Last Update: XZ 07/07/2008
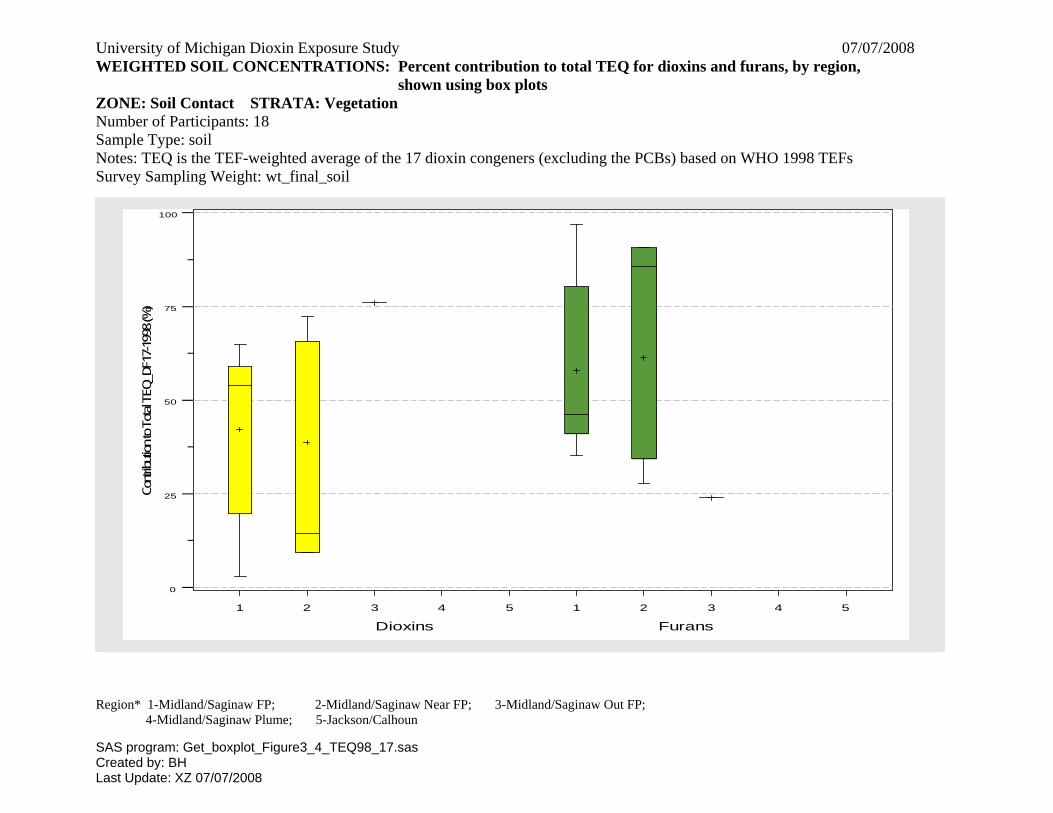
University of Michigan Dioxin Exposure Study 07/07/2008 WEIGHTED SOIL CONCENTRATIONS: Percent contribution to total TEQ for dioxins and furans, by region, shown using box plots ZONE: Soil Contact STRATA: Vegetation
Number of Participants: 18 Sample Type: soil Notes: TEQ is the TEF-weighted average of the 17 dioxin congeners (excluding the PCBs) based on WHO 1998 TEFs Survey Sampling Weight: wt_final_soil
Region* 1-Midland/Saginaw FP; 2-Midland/Saginaw Near FP; 3-Midland/Saginaw Out FP; 4-Midland/Saginaw Plume; 5-Jackson/Calhoun
1 2 3 4 5 1 2 3 4 5
0
25
50
75
100
Contr
ibutio
n to
Total
TEQ
_DF1
7-19
98 (%
)
Dioxins Furans
SAS program: Get_boxplot_Figure3_4_TEQ98_17.sas Created by: BH Last Update: XZ 07/07/2008