Embed Size (px)
Citation preview
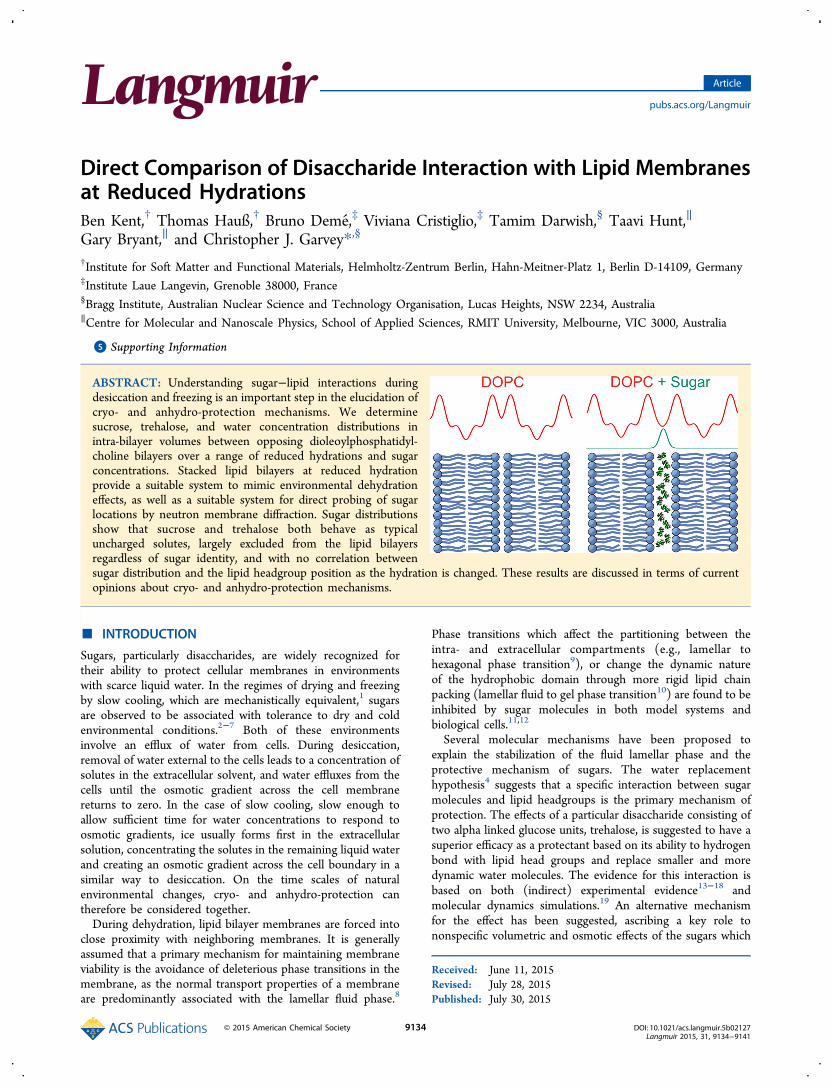
Direct Comparison of Disaccharide Interaction with Lipid Membranesat Reduced HydrationsBen Kent,† Thomas Hauß,† Bruno Deme,́‡ Viviana Cristiglio,‡ Tamim Darwish,§ Taavi Hunt,∥
Gary Bryant,∥ and Christopher J. Garvey*,§
†Institute for Soft Matter and Functional Materials, Helmholtz-Zentrum Berlin, Hahn-Meitner-Platz 1, Berlin D-14109, Germany‡Institute Laue Langevin, Grenoble 38000, France§Bragg Institute, Australian Nuclear Science and Technology Organisation, Lucas Heights, NSW 2234, Australia∥Centre for Molecular and Nanoscale Physics, School of Applied Sciences, RMIT University, Melbourne, VIC 3000, Australia
*S Supporting Information
ABSTRACT: Understanding sugar−lipid interactions duringdesiccation and freezing is an important step in the elucidation ofcryo- and anhydro-protection mechanisms. We determinesucrose, trehalose, and water concentration distributions inintra-bilayer volumes between opposing dioleoylphosphatidyl-choline bilayers over a range of reduced hydrations and sugarconcentrations. Stacked lipid bilayers at reduced hydrationprovide a suitable system to mimic environmental dehydrationeffects, as well as a suitable system for direct probing of sugarlocations by neutron membrane diffraction. Sugar distributionsshow that sucrose and trehalose both behave as typicaluncharged solutes, largely excluded from the lipid bilayersregardless of sugar identity, and with no correlation betweensugar distribution and the lipid headgroup position as the hydration is changed. These results are discussed in terms of currentopinions about cryo- and anhydro-protection mechanisms.
■ INTRODUCTION
Sugars, particularly disaccharides, are widely recognized fortheir ability to protect cellular membranes in environmentswith scarce liquid water. In the regimes of drying and freezingby slow cooling, which are mechanistically equivalent,1 sugarsare observed to be associated with tolerance to dry and coldenvironmental conditions.2−7 Both of these environmentsinvolve an efflux of water from cells. During desiccation,removal of water external to the cells leads to a concentration ofsolutes in the extracellular solvent, and water effluxes from thecells until the osmotic gradient across the cell membranereturns to zero. In the case of slow cooling, slow enough toallow sufficient time for water concentrations to respond toosmotic gradients, ice usually forms first in the extracellularsolution, concentrating the solutes in the remaining liquid waterand creating an osmotic gradient across the cell boundary in asimilar way to desiccation. On the time scales of naturalenvironmental changes, cryo- and anhydro-protection cantherefore be considered together.During dehydration, lipid bilayer membranes are forced into
close proximity with neighboring membranes. It is generallyassumed that a primary mechanism for maintaining membraneviability is the avoidance of deleterious phase transitions in themembrane, as the normal transport properties of a membraneare predominantly associated with the lamellar fluid phase.8
Phase transitions which affect the partitioning between theintra- and extracellular compartments (e.g., lamellar tohexagonal phase transition9), or change the dynamic natureof the hydrophobic domain through more rigid lipid chainpacking (lamellar fluid to gel phase transition10) are found to beinhibited by sugar molecules in both model systems andbiological cells.11,12
Several molecular mechanisms have been proposed toexplain the stabilization of the fluid lamellar phase and theprotective mechanism of sugars. The water replacementhypothesis4 suggests that a specific interaction between sugarmolecules and lipid headgroups is the primary mechanism ofprotection. The effects of a particular disaccharide consisting oftwo alpha linked glucose units, trehalose, is suggested to have asuperior efficacy as a protectant based on its ability to hydrogenbond with lipid head groups and replace smaller and moredynamic water molecules. The evidence for this interaction isbased on both (indirect) experimental evidence13−18 andmolecular dynamics simulations.19 An alternative mechanismfor the effect has been suggested, ascribing a key role tononspecific volumetric and osmotic effects of the sugars which
Received: June 11, 2015Revised: July 28, 2015Published: July 30, 2015
Article
pubs.acs.org/Langmuir
© 2015 American Chemical Society 9134 DOI: 10.1021/acs.langmuir.5b02127Langmuir 2015, 31, 9134−9141
mediate the compressive stresses induced in membranesbrought into close contact by dehydration.3,20,21 Thisexplanation is supported by a model which quantitativelypredicts the hydration dependence of the fluid−gel transitiontemperature,22 as well as (indirect) experimental evidence thatsugars tend to be excluded from the regions close to themembranes.23−26 Andersen et al.27 have attempted to reconcilethe two views with a concentration dependent explanation,where the water replacement mechanism is dominant at lowsugar concentration, to be replaced in importance bynonspecific effects at higher sugar concentrations.Note that the discussion above is relevant to moderate levels
of dehydration/freezing where glass formation does not occur.The formation of glassy sugar solutions28 is an additional butseparate protective mechanism which occurs at lowerhydrations and/or temperatures. The effects of sugars on thestructure of aqueous solutions, and in particular the glasstransition, have been studied in detail.29−33 The related effectsof glass formation on membranes is discussed in detail inreferences.15,34−36 The remainder of this paper is concernedwith conditions where glass formation does not occur.Phenomenologically, these two sugar membrane protection
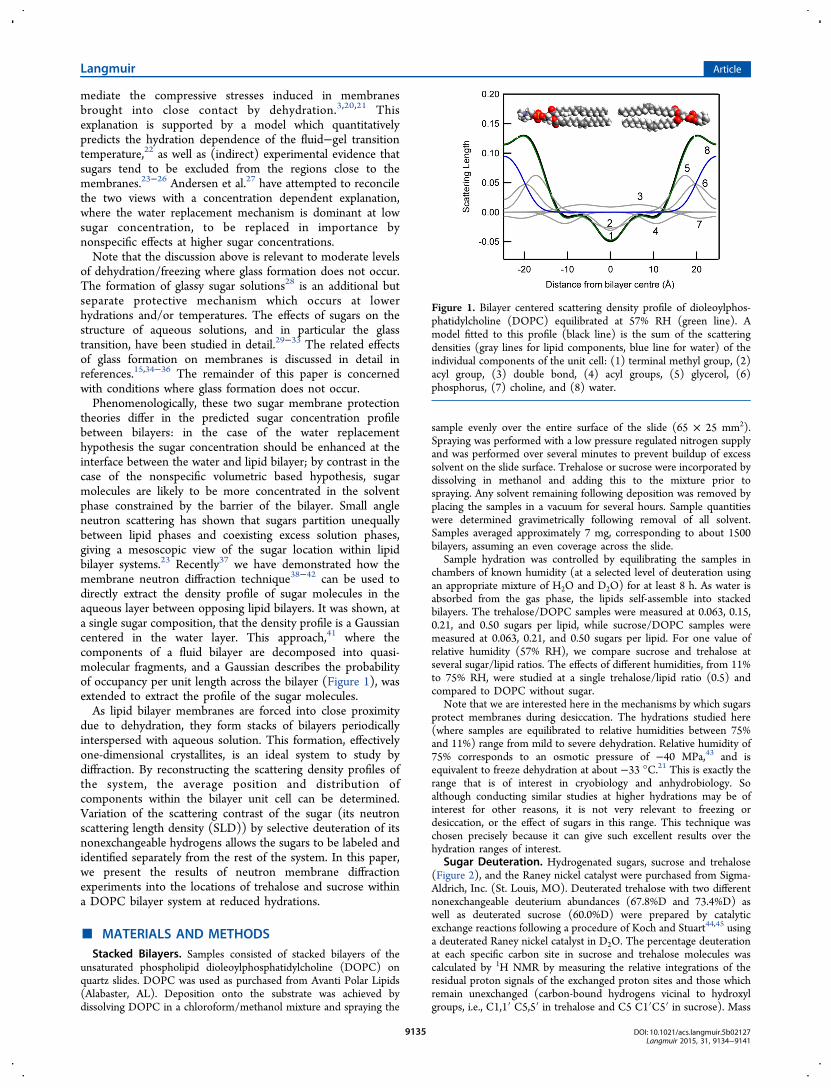
theories differ in the predicted sugar concentration profilebetween bilayers: in the case of the water replacementhypothesis the sugar concentration should be enhanced at theinterface between the water and lipid bilayer; by contrast in thecase of the nonspecific volumetric based hypothesis, sugarmolecules are likely to be more concentrated in the solventphase constrained by the barrier of the bilayer. Small angleneutron scattering has shown that sugars partition unequallybetween lipid phases and coexisting excess solution phases,giving a mesoscopic view of the sugar location within lipidbilayer systems.23 Recently37 we have demonstrated how themembrane neutron diffraction technique38−42 can be used todirectly extract the density profile of sugar molecules in theaqueous layer between opposing lipid bilayers. It was shown, ata single sugar composition, that the density profile is a Gaussiancentered in the water layer. This approach,41 where thecomponents of a fluid bilayer are decomposed into quasi-molecular fragments, and a Gaussian describes the probabilityof occupancy per unit length across the bilayer (Figure 1), wasextended to extract the profile of the sugar molecules.As lipid bilayer membranes are forced into close proximity
due to dehydration, they form stacks of bilayers periodicallyinterspersed with aqueous solution. This formation, effectivelyone-dimensional crystallites, is an ideal system to study bydiffraction. By reconstructing the scattering density profiles ofthe system, the average position and distribution ofcomponents within the bilayer unit cell can be determined.Variation of the scattering contrast of the sugar (its neutronscattering length density (SLD)) by selective deuteration of itsnonexchangeable hydrogens allows the sugars to be labeled andidentified separately from the rest of the system. In this paper,we present the results of neutron membrane diffractionexperiments into the locations of trehalose and sucrose withina DOPC bilayer system at reduced hydrations.
■ MATERIALS AND METHODSStacked Bilayers. Samples consisted of stacked bilayers of the
unsaturated phospholipid dioleoylphosphatidylcholine (DOPC) onquartz slides. DOPC was used as purchased from Avanti Polar Lipids(Alabaster, AL). Deposition onto the substrate was achieved bydissolving DOPC in a chloroform/methanol mixture and spraying the
sample evenly over the entire surface of the slide (65 × 25 mm2).Spraying was performed with a low pressure regulated nitrogen supplyand was performed over several minutes to prevent buildup of excesssolvent on the slide surface. Trehalose or sucrose were incorporated bydissolving in methanol and adding this to the mixture prior tospraying. Any solvent remaining following deposition was removed byplacing the samples in a vacuum for several hours. Sample quantitieswere determined gravimetrically following removal of all solvent.Samples averaged approximately 7 mg, corresponding to about 1500bilayers, assuming an even coverage across the slide.
Sample hydration was controlled by equilibrating the samples inchambers of known humidity (at a selected level of deuteration usingan appropriate mixture of H2O and D2O) for at least 8 h. As water isabsorbed from the gas phase, the lipids self-assemble into stackedbilayers. The trehalose/DOPC samples were measured at 0.063, 0.15,0.21, and 0.50 sugars per lipid, while sucrose/DOPC samples weremeasured at 0.063, 0.21, and 0.50 sugars per lipid. For one value ofrelative humidity (57% RH), we compare sucrose and trehalose atseveral sugar/lipid ratios. The effects of different humidities, from 11%to 75% RH, were studied at a single trehalose/lipid ratio (0.5) andcompared to DOPC without sugar.
Note that we are interested here in the mechanisms by which sugarsprotect membranes during desiccation. The hydrations studied here(where samples are equilibrated to relative humidities between 75%and 11%) range from mild to severe dehydration. Relative humidity of75% corresponds to an osmotic pressure of −40 MPa,43 and isequivalent to freeze dehydration at about −33 °C.21 This is exactly therange that is of interest in cryobiology and anhydrobiology. Soalthough conducting similar studies at higher hydrations may be ofinterest for other reasons, it is not very relevant to freezing ordesiccation, or the effect of sugars in this range. This technique waschosen precisely because it can give such excellent results over thehydration ranges of interest.
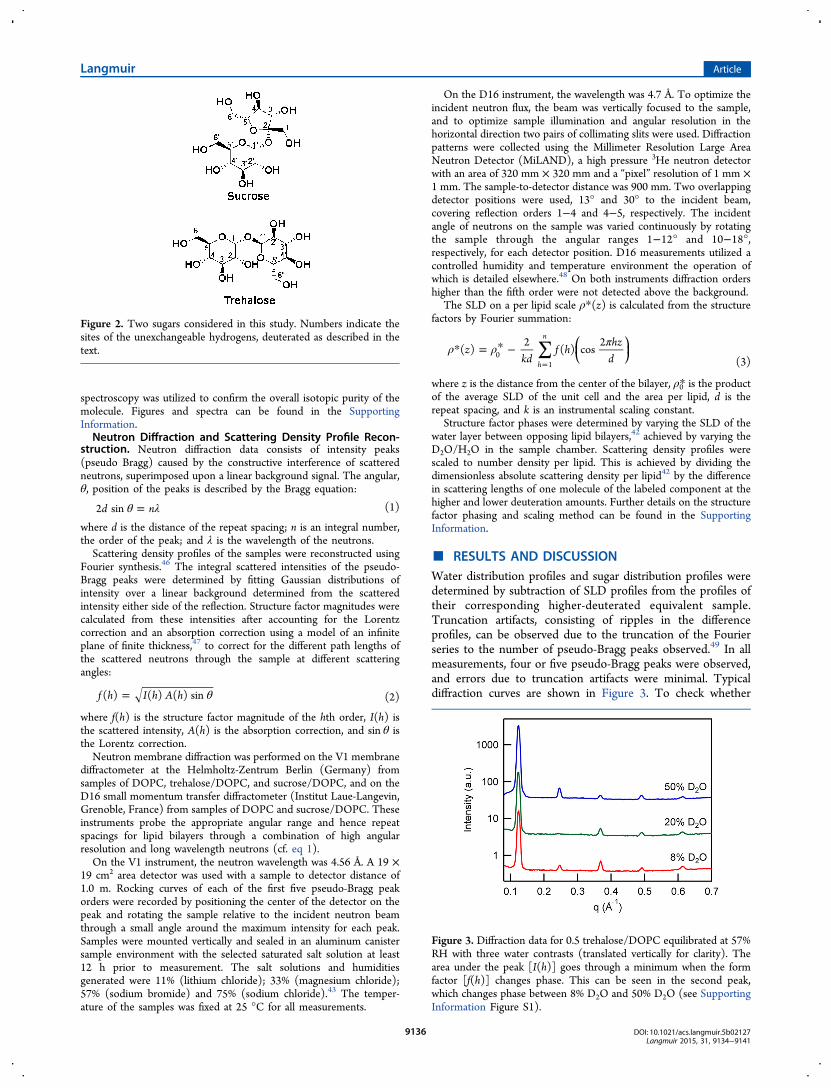
Sugar Deuteration. Hydrogenated sugars, sucrose and trehalose(Figure 2), and the Raney nickel catalyst were purchased from Sigma-Aldrich, Inc. (St. Louis, MO). Deuterated trehalose with two differentnonexchangeable deuterium abundances (67.8%D and 73.4%D) aswell as deuterated sucrose (60.0%D) were prepared by catalyticexchange reactions following a procedure of Koch and Stuart44,45 usinga deuterated Raney nickel catalyst in D2O. The percentage deuterationat each specific carbon site in sucrose and trehalose molecules wascalculated by 1H NMR by measuring the relative integrations of theresidual proton signals of the exchanged proton sites and those whichremain unexchanged (carbon-bound hydrogens vicinal to hydroxylgroups, i.e., C1,1′ C5,5′ in trehalose and C5 C1′C5′ in sucrose). Mass
Figure 1. Bilayer centered scattering density profile of dioleoylphos-phatidylcholine (DOPC) equilibrated at 57% RH (green line). Amodel fitted to this profile (black line) is the sum of the scatteringdensities (gray lines for lipid components, blue line for water) of theindividual components of the unit cell: (1) terminal methyl group, (2)acyl group, (3) double bond, (4) acyl groups, (5) glycerol, (6)phosphorus, (7) choline, and (8) water.
Langmuir Article
DOI: 10.1021/acs.langmuir.5b02127Langmuir 2015, 31, 9134−9141
9135
spectroscopy was utilized to confirm the overall isotopic purity of themolecule. Figures and spectra can be found in the SupportingInformation.Neutron Diffraction and Scattering Density Profile Recon-
struction. Neutron diffraction data consists of intensity peaks(pseudo Bragg) caused by the constructive interference of scatteredneutrons, superimposed upon a linear background signal. The angular,θ, position of the peaks is described by the Bragg equation:
θ λ=d n2 sin (1)
where d is the distance of the repeat spacing; n is an integral number,the order of the peak; and λ is the wavelength of the neutrons.Scattering density profiles of the samples were reconstructed using
Fourier synthesis.46 The integral scattered intensities of the pseudo-Bragg peaks were determined by fitting Gaussian distributions ofintensity over a linear background determined from the scatteredintensity either side of the reflection. Structure factor magnitudes werecalculated from these intensities after accounting for the Lorentzcorrection and an absorption correction using a model of an infiniteplane of finite thickness,47 to correct for the different path lengths ofthe scattered neutrons through the sample at different scatteringangles:
θ=f h I h A h( ) ( ) ( ) sin (2)
where f(h) is the structure factor magnitude of the hth order, I(h) isthe scattered intensity, A(h) is the absorption correction, and sin θ isthe Lorentz correction.Neutron membrane diffraction was performed on the V1 membrane
diffractometer at the Helmholtz-Zentrum Berlin (Germany) fromsamples of DOPC, trehalose/DOPC, and sucrose/DOPC, and on theD16 small momentum transfer diffractometer (Institut Laue-Langevin,Grenoble, France) from samples of DOPC and sucrose/DOPC. Theseinstruments probe the appropriate angular range and hence repeatspacings for lipid bilayers through a combination of high angularresolution and long wavelength neutrons (cf. eq 1).On the V1 instrument, the neutron wavelength was 4.56 Å. A 19 ×
19 cm2 area detector was used with a sample to detector distance of1.0 m. Rocking curves of each of the first five pseudo-Bragg peakorders were recorded by positioning the center of the detector on thepeak and rotating the sample relative to the incident neutron beamthrough a small angle around the maximum intensity for each peak.Samples were mounted vertically and sealed in an aluminum canistersample environment with the selected saturated salt solution at least12 h prior to measurement. The salt solutions and humiditiesgenerated were 11% (lithium chloride); 33% (magnesium chloride);57% (sodium bromide) and 75% (sodium chloride).43 The temper-ature of the samples was fixed at 25 °C for all measurements.
On the D16 instrument, the wavelength was 4.7 Å. To optimize theincident neutron flux, the beam was vertically focused to the sample,and to optimize sample illumination and angular resolution in thehorizontal direction two pairs of collimating slits were used. Diffractionpatterns were collected using the Millimeter Resolution Large AreaNeutron Detector (MiLAND), a high pressure 3He neutron detectorwith an area of 320 mm × 320 mm and a “pixel” resolution of 1 mm ×1 mm. The sample-to-detector distance was 900 mm. Two overlappingdetector positions were used, 13° and 30° to the incident beam,covering reflection orders 1−4 and 4−5, respectively. The incidentangle of neutrons on the sample was varied continuously by rotatingthe sample through the angular ranges 1−12° and 10−18°,respectively, for each detector position. D16 measurements utilized acontrolled humidity and temperature environment the operation ofwhich is detailed elsewhere.48 On both instruments diffraction ordershigher than the fifth order were not detected above the background.
The SLD on a per lipid scale ρ*(z) is calculated from the structurefactors by Fourier summation:
∑ρ ρ π* = * −=
⎜ ⎟⎛⎝
⎞⎠z
kdf h
hzd
( )2
( ) cos2
h
n
01 (3)
where z is the distance from the center of the bilayer, ρ0* is the productof the average SLD of the unit cell and the area per lipid, d is therepeat spacing, and k is an instrumental scaling constant.
Structure factor phases were determined by varying the SLD of thewater layer between opposing lipid bilayers,42 achieved by varying theD2O/H2O in the sample chamber. Scattering density profiles werescaled to number density per lipid. This is achieved by dividing thedimensionless absolute scattering density per lipid42 by the differencein scattering lengths of one molecule of the labeled component at thehigher and lower deuteration amounts. Further details on the structurefactor phasing and scaling method can be found in the SupportingInformation.
■ RESULTS AND DISCUSSIONWater distribution profiles and sugar distribution profiles weredetermined by subtraction of SLD profiles from the profiles oftheir corresponding higher-deuterated equivalent sample.Truncation artifacts, consisting of ripples in the differenceprofiles, can be observed due to the truncation of the Fourierseries to the number of pseudo-Bragg peaks observed.49 In allmeasurements, four or five pseudo-Bragg peaks were observed,and errors due to truncation artifacts were minimal. Typicaldiffraction curves are shown in Figure 3. To check whether
Figure 2. Two sugars considered in this study. Numbers indicate thesites of the unexchangeable hydrogens, deuterated as described in thetext.
Figure 3. Diffraction data for 0.5 trehalose/DOPC equilibrated at 57%RH with three water contrasts (translated vertically for clarity). Thearea under the peak [I(h)] goes through a minimum when the formfactor [f(h)] changes phase. This can be seen in the second peak,which changes phase between 8% D2O and 50% D2O (see SupportingInformation Figure S1).
Langmuir Article
DOI: 10.1021/acs.langmuir.5b02127Langmuir 2015, 31, 9134−9141
9136
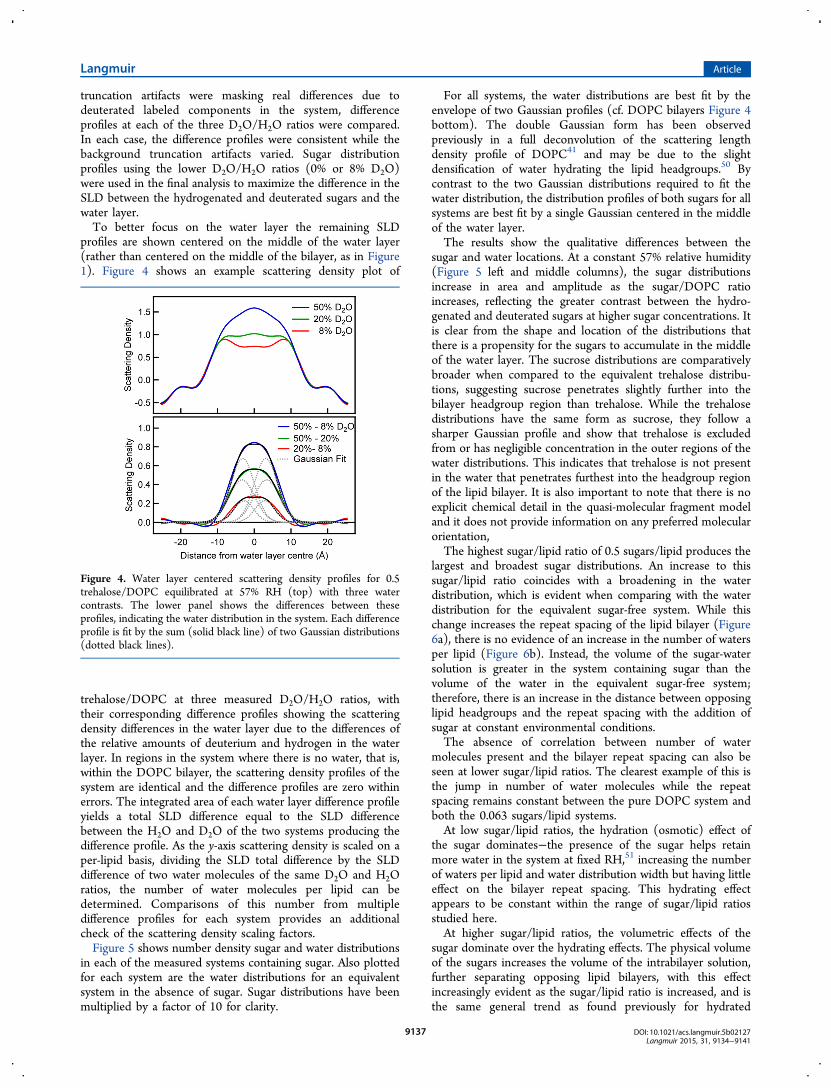
truncation artifacts were masking real differences due todeuterated labeled components in the system, differenceprofiles at each of the three D2O/H2O ratios were compared.In each case, the difference profiles were consistent while thebackground truncation artifacts varied. Sugar distributionprofiles using the lower D2O/H2O ratios (0% or 8% D2O)were used in the final analysis to maximize the difference in theSLD between the hydrogenated and deuterated sugars and thewater layer.To better focus on the water layer the remaining SLD
profiles are shown centered on the middle of the water layer(rather than centered on the middle of the bilayer, as in Figure1). Figure 4 shows an example scattering density plot of
trehalose/DOPC at three measured D2O/H2O ratios, withtheir corresponding difference profiles showing the scatteringdensity differences in the water layer due to the differences ofthe relative amounts of deuterium and hydrogen in the waterlayer. In regions in the system where there is no water, that is,within the DOPC bilayer, the scattering density profiles of thesystem are identical and the difference profiles are zero withinerrors. The integrated area of each water layer difference profileyields a total SLD difference equal to the SLD differencebetween the H2O and D2O of the two systems producing thedifference profile. As the y-axis scattering density is scaled on aper-lipid basis, dividing the SLD total difference by the SLDdifference of two water molecules of the same D2O and H2Oratios, the number of water molecules per lipid can bedetermined. Comparisons of this number from multipledifference profiles for each system provides an additionalcheck of the scattering density scaling factors.Figure 5 shows number density sugar and water distributions
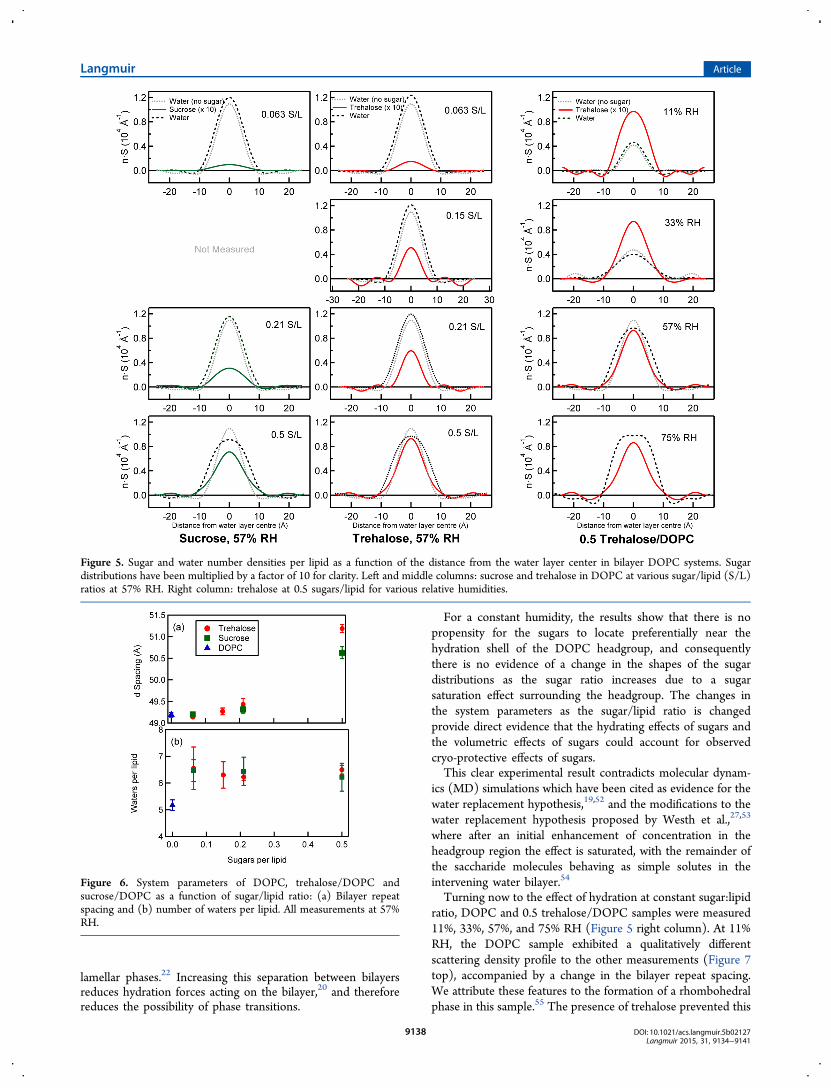
in each of the measured systems containing sugar. Also plottedfor each system are the water distributions for an equivalentsystem in the absence of sugar. Sugar distributions have beenmultiplied by a factor of 10 for clarity.
For all systems, the water distributions are best fit by theenvelope of two Gaussian profiles (cf. DOPC bilayers Figure 4bottom). The double Gaussian form has been observedpreviously in a full deconvolution of the scattering lengthdensity profile of DOPC41 and may be due to the slightdensification of water hydrating the lipid headgroups.50 Bycontrast to the two Gaussian distributions required to fit thewater distribution, the distribution profiles of both sugars for allsystems are best fit by a single Gaussian centered in the middleof the water layer.The results show the qualitative differences between the
sugar and water locations. At a constant 57% relative humidity(Figure 5 left and middle columns), the sugar distributionsincrease in area and amplitude as the sugar/DOPC ratioincreases, reflecting the greater contrast between the hydro-genated and deuterated sugars at higher sugar concentrations. Itis clear from the shape and location of the distributions thatthere is a propensity for the sugars to accumulate in the middleof the water layer. The sucrose distributions are comparativelybroader when compared to the equivalent trehalose distribu-tions, suggesting sucrose penetrates slightly further into thebilayer headgroup region than trehalose. While the trehalosedistributions have the same form as sucrose, they follow asharper Gaussian profile and show that trehalose is excludedfrom or has negligible concentration in the outer regions of thewater distributions. This indicates that trehalose is not presentin the water that penetrates furthest into the headgroup regionof the lipid bilayer. It is also important to note that there is noexplicit chemical detail in the quasi-molecular fragment modeland it does not provide information on any preferred molecularorientation,The highest sugar/lipid ratio of 0.5 sugars/lipid produces the
largest and broadest sugar distributions. An increase to thissugar/lipid ratio coincides with a broadening in the waterdistribution, which is evident when comparing with the waterdistribution for the equivalent sugar-free system. While thischange increases the repeat spacing of the lipid bilayer (Figure6a), there is no evidence of an increase in the number of watersper lipid (Figure 6b). Instead, the volume of the sugar-watersolution is greater in the system containing sugar than thevolume of the water in the equivalent sugar-free system;therefore, there is an increase in the distance between opposinglipid headgroups and the repeat spacing with the addition ofsugar at constant environmental conditions.The absence of correlation between number of water
molecules present and the bilayer repeat spacing can also beseen at lower sugar/lipid ratios. The clearest example of this isthe jump in number of water molecules while the repeatspacing remains constant between the pure DOPC system andboth the 0.063 sugars/lipid systems.At low sugar/lipid ratios, the hydration (osmotic) effect of
the sugar dominates−the presence of the sugar helps retainmore water in the system at fixed RH,51 increasing the numberof waters per lipid and water distribution width but having littleeffect on the bilayer repeat spacing. This hydrating effectappears to be constant within the range of sugar/lipid ratiosstudied here.At higher sugar/lipid ratios, the volumetric effects of the
sugar dominate over the hydrating effects. The physical volumeof the sugars increases the volume of the intrabilayer solution,further separating opposing lipid bilayers, with this effectincreasingly evident as the sugar/lipid ratio is increased, and isthe same general trend as found previously for hydrated
Figure 4. Water layer centered scattering density profiles for 0.5trehalose/DOPC equilibrated at 57% RH (top) with three watercontrasts. The lower panel shows the differences between theseprofiles, indicating the water distribution in the system. Each differenceprofile is fit by the sum (solid black line) of two Gaussian distributions(dotted black lines).
Langmuir Article
DOI: 10.1021/acs.langmuir.5b02127Langmuir 2015, 31, 9134−9141
9137
lamellar phases.22 Increasing this separation between bilayersreduces hydration forces acting on the bilayer,20 and thereforereduces the possibility of phase transitions.
For a constant humidity, the results show that there is nopropensity for the sugars to locate preferentially near thehydration shell of the DOPC headgroup, and consequentlythere is no evidence of a change in the shapes of the sugardistributions as the sugar ratio increases due to a sugarsaturation effect surrounding the headgroup. The changes inthe system parameters as the sugar/lipid ratio is changedprovide direct evidence that the hydrating effects of sugars andthe volumetric effects of sugars could account for observedcryo-protective effects of sugars.This clear experimental result contradicts molecular dynam-
ics (MD) simulations which have been cited as evidence for thewater replacement hypothesis,19,52 and the modifications to thewater replacement hypothesis proposed by Westh et al.,27,53
where after an initial enhancement of concentration in theheadgroup region the effect is saturated, with the remainder ofthe saccharide molecules behaving as simple solutes in theintervening water bilayer.54
Turning now to the effect of hydration at constant sugar:lipidratio, DOPC and 0.5 trehalose/DOPC samples were measured11%, 33%, 57%, and 75% RH (Figure 5 right column). At 11%RH, the DOPC sample exhibited a qualitatively differentscattering density profile to the other measurements (Figure 7top), accompanied by a change in the bilayer repeat spacing.We attribute these features to the formation of a rhombohedralphase in this sample.55 The presence of trehalose prevented this
Figure 5. Sugar and water number densities per lipid as a function of the distance from the water layer center in bilayer DOPC systems. Sugardistributions have been multiplied by a factor of 10 for clarity. Left and middle columns: sucrose and trehalose in DOPC at various sugar/lipid (S/L)ratios at 57% RH. Right column: trehalose at 0.5 sugars/lipid for various relative humidities.
Figure 6. System parameters of DOPC, trehalose/DOPC andsucrose/DOPC as a function of sugar/lipid ratio: (a) Bilayer repeatspacing and (b) number of waters per lipid. All measurements at 57%RH.
Langmuir Article
DOI: 10.1021/acs.langmuir.5b02127Langmuir 2015, 31, 9134−9141
9138
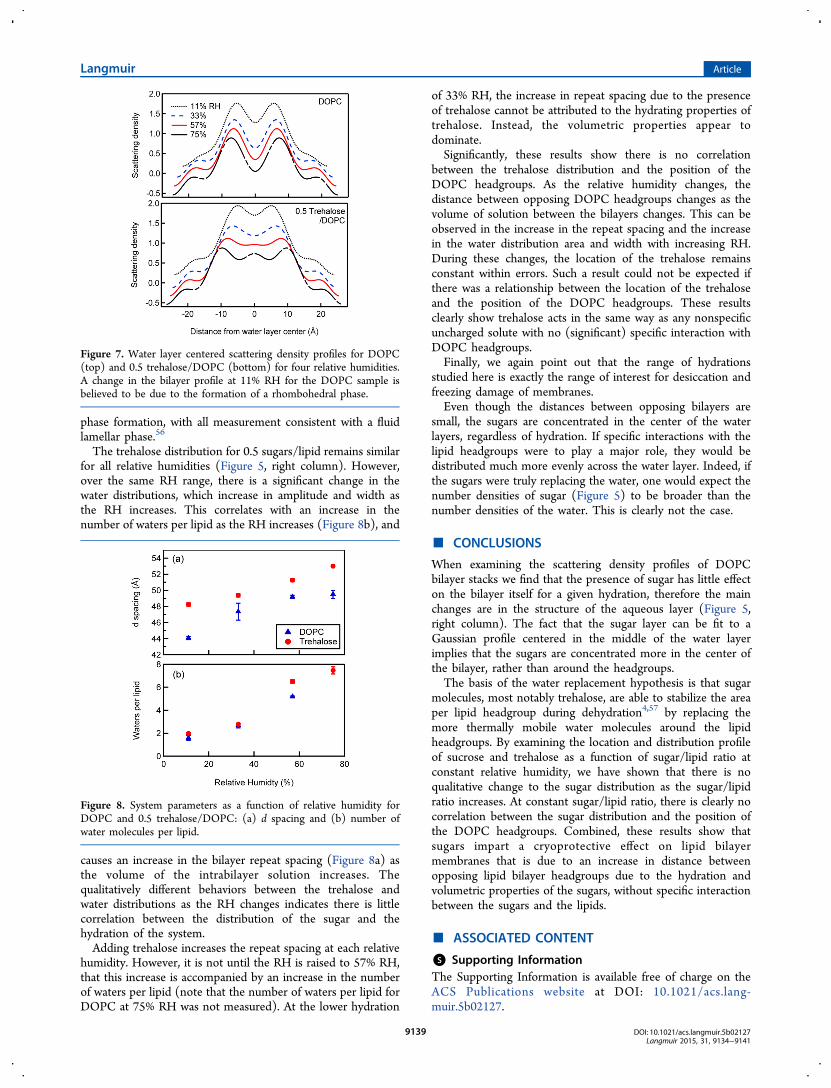
phase formation, with all measurement consistent with a fluidlamellar phase.56
The trehalose distribution for 0.5 sugars/lipid remains similarfor all relative humidities (Figure 5, right column). However,over the same RH range, there is a significant change in thewater distributions, which increase in amplitude and width asthe RH increases. This correlates with an increase in thenumber of waters per lipid as the RH increases (Figure 8b), and
causes an increase in the bilayer repeat spacing (Figure 8a) asthe volume of the intrabilayer solution increases. Thequalitatively different behaviors between the trehalose andwater distributions as the RH changes indicates there is littlecorrelation between the distribution of the sugar and thehydration of the system.Adding trehalose increases the repeat spacing at each relative
humidity. However, it is not until the RH is raised to 57% RH,that this increase is accompanied by an increase in the numberof waters per lipid (note that the number of waters per lipid forDOPC at 75% RH was not measured). At the lower hydration
of 33% RH, the increase in repeat spacing due to the presenceof trehalose cannot be attributed to the hydrating properties oftrehalose. Instead, the volumetric properties appear todominate.Significantly, these results show there is no correlation
between the trehalose distribution and the position of theDOPC headgroups. As the relative humidity changes, thedistance between opposing DOPC headgroups changes as thevolume of solution between the bilayers changes. This can beobserved in the increase in the repeat spacing and the increasein the water distribution area and width with increasing RH.During these changes, the location of the trehalose remainsconstant within errors. Such a result could not be expected ifthere was a relationship between the location of the trehaloseand the position of the DOPC headgroups. These resultsclearly show trehalose acts in the same way as any nonspecificuncharged solute with no (significant) specific interaction withDOPC headgroups.Finally, we again point out that the range of hydrations
studied here is exactly the range of interest for desiccation andfreezing damage of membranes.Even though the distances between opposing bilayers are
small, the sugars are concentrated in the center of the waterlayers, regardless of hydration. If specific interactions with thelipid headgroups were to play a major role, they would bedistributed much more evenly across the water layer. Indeed, ifthe sugars were truly replacing the water, one would expect thenumber densities of sugar (Figure 5) to be broader than thenumber densities of the water. This is clearly not the case.
■ CONCLUSIONS
When examining the scattering density profiles of DOPCbilayer stacks we find that the presence of sugar has little effecton the bilayer itself for a given hydration, therefore the mainchanges are in the structure of the aqueous layer (Figure 5,right column). The fact that the sugar layer can be fit to aGaussian profile centered in the middle of the water layerimplies that the sugars are concentrated more in the center ofthe bilayer, rather than around the headgroups.The basis of the water replacement hypothesis is that sugar
molecules, most notably trehalose, are able to stabilize the areaper lipid headgroup during dehydration4,57 by replacing themore thermally mobile water molecules around the lipidheadgroups. By examining the location and distribution profileof sucrose and trehalose as a function of sugar/lipid ratio atconstant relative humidity, we have shown that there is noqualitative change to the sugar distribution as the sugar/lipidratio increases. At constant sugar/lipid ratio, there is clearly nocorrelation between the sugar distribution and the position ofthe DOPC headgroups. Combined, these results show thatsugars impart a cryoprotective effect on lipid bilayermembranes that is due to an increase in distance betweenopposing lipid bilayer headgroups due to the hydration andvolumetric properties of the sugars, without specific interactionbetween the sugars and the lipids.
■ ASSOCIATED CONTENT
*S Supporting InformationThe Supporting Information is available free of charge on theACS Publications website at DOI: 10.1021/acs.lang-muir.5b02127.
Figure 7. Water layer centered scattering density profiles for DOPC(top) and 0.5 trehalose/DOPC (bottom) for four relative humidities.A change in the bilayer profile at 11% RH for the DOPC sample isbelieved to be due to the formation of a rhombohedral phase.
Figure 8. System parameters as a function of relative humidity forDOPC and 0.5 trehalose/DOPC: (a) d spacing and (b) number ofwater molecules per lipid.
Langmuir Article
DOI: 10.1021/acs.langmuir.5b02127Langmuir 2015, 31, 9134−9141
9139
Structure factor phasing and scaling method, sugardeuteration method, and associated NMR spectra(PDF)
■ AUTHOR INFORMATIONCorresponding Author*E-mail: [email protected] authors declare no competing financial interest.
■ ACKNOWLEDGMENTSThis research was supported by the Australian ResearchCouncil through Discovery Projects DP110105380 andDP0881009 and Linkage Project LP0884027, with additionalfinancial support from BHP Billiton Worsley Alumina andAlcoa of Australia. This work was supported through theAustralian Access to Major Research Facilities Fund (AMRF),and AINSE Grants 11173, 12024, and 13075. We thank the ILLand HZB for allocation of beamtime. The authors alsoacknowledge the use of NCRIS-supported National Deutera-tion Facility Laboratories for the synthesis of deuterated sugarmolecules.
■ ABBREVIATIONSSLD, scattering length density; DOPC, dioleoylphosphatidyl-choline; %D, percent deuteration; RH, relative humidity
■ REFERENCES(1) Storey, K. B. Organic solutes in freezing tolerance. ComparativeBiochemistry and Physiology a-Physiology 1997, 117 (3), 319−326.(2) Billi, D.; Potts, M. Life and death of dried prokaryotes. Res.Microbiol. 2002, 153 (1), 7−12.(3) Bryant, G.; Koster, K. L.; Wolfe, J. Membrane behaviour in seedsand other systems at low water content: the various effects of solutes.Seed Sci. Res. 2001, 11 (1), 17−25.(4) Crowe, J. H.; Crowe, L. M.; Chapman, D. Preservation ofMembranes in Anhydrobiotic Organisms: The Role of Trehalose.Science 1984, 223 (4637), 701−703.(5) Crowe, L. M.; Crowe, J. H.; Rudolph, A.; Womersley, C.; Appel,L. Preservation of freeze-dried liposomes by trehalose. Arch. Biochem.Biophys. 1985, 242 (1), 240−247.(6) Crowe, J. H.; Crowe, L. M.; Carpenter, J. F.; Wistrom, C. A.Stabilization of dry phospholipid bilayers and proteins by sugars.Biochem. J. 1987, 242 (1), 1−10.(7) Rolland, F.; Baena-Gonzalez, E.; Sheen, J. Sugar sensing andsignaling in plants: Conserved and novel mechanisms. In AnnualReview of Plant Biology; Annual Reviews: Palo Alto, 2006; Vol. 57, pp675−709.(8) Singer, S. J.; Nicolson, G. L. Fluid Mosaic Model of Structure ofCell-Membranes. Science 1972, 175 (4023), 720−731.(9) Garvey, C. J.; Lenne, T.; Koster, K. L.; Kent, B.; Bryant, G.Phospholipid Membrane Protection by Sugar Molecules duringDehydration-Insights into Molecular Mechanisms Using ScatteringTechniques. Int. J. Mol. Sci. 2013, 14 (4), 8148−8163.(10) Lenne,́ T.; Bryant, G.; Holcomb, R.; Koster, K. L. How muchsolute is needed to inhibit the fluid to gel membrane phase transitionat low hydration? Biochim. Biophys. Acta, Biomembr. 2007, 1768 (5),1019−1022.(11) Gordon-Kamm, W. J.; Steponkus, P. L. Lamellar-to-hexagonal IIphase-transitions in the plasma-membrane of isolated protoplasts afterfreeze-induced dehydration. Proc. Natl. Acad. Sci. U. S. A. 1984, 81(20), 6373−6377.(12) Steponkus, P. L. Role of the Plasma Membrane in FreezingInjury and Cold Acclimation. Annu. Rev. Plant Physiol. 1984, 35 (1),543−584.
(13) Crowe, L. M.; Crowe, J. H. Hydration-dependent hexagonalphase lipid in a biological membrane. Arch. Biochem. Biophys. 1982,217 (2), 582−587.(14) Crowe, J. H.; Crowe, L. M.; Oliver, A. E.; Tsvetkova, N.;Wolkers, W.; Tablin, F. The trehalose myth revisited: Introduction to asymposium on stabilization of cells in the dry state. Cryobiology 2001,43 (2), 89−105.(15) Sun, W. Q.; Leopold, A. C.; Crowe, L. M.; Crowe, J. H. Stabilityof dry liposomes in sugar glasses. Biophys. J. 1996, 70 (4), 1769−1776.(16) Crowe, J. H.; Hoekstra, F. A.; Crowe, L. M. Anhydrobiosis.Annu. Rev. Physiol. 1992, 54, 579−599.(17) Lambruschini, C.; Relini, A.; Ridi, A.; Cordone, L.; Gliozzi, A.Trehalose interacts with phospholipid polar heads in Langmuirmonolayers. Langmuir 2000, 16 (12), 5467−5470.(18) Konov, K. B.; Isaev, N. P.; Dzuba, S. A. Low-TemperatureMolecular Motions in Lipid Bilayers in the Presence of Sugars: Insightsinto Cryoprotective Mechanisms. J. Phys. Chem. B 2014, 118 (43),12478−12485.(19) Pereira, C. S.; Hunenberger, P. H. Interaction of the sugarstrehalose, maltose and glucose with a phospholipid bilayer: Acomparative molecular dynamics study. J. Phys. Chem. B 2006, 110(31), 15572−15581.(20) Bryant, G.; Wolfe, J. Interfacial forces in cryobiology andanhydrobiology. CryoLetters 1992, 13 (1), 23−36.(21) Wolfe, J.; Bryant, G. Freezing, Drying, and/or Vitrification ofMembrane-Solute-Water Systems. Cryobiology 1999, 39, 103−129.(22) Lenne,́ T.; Garvey, C. J.; Koster, K. L.; Bryant, G. Effects ofSugars on Lipid Bilayers during Dehydration: SAXS/WAXS Measure-ments and Quantitative Model. J. Phys. Chem. B 2009, 113 (8), 2486−2491.(23) Deme,́ B.; Zemb, T. Measurement of sugar depletion fromuncharged lamellar phases by SANS contrast variation. J. Appl.Crystallogr. 2000, 33 (3−1), 569−573.(24) Lenne,́ T.; Bryant, G.; Garvey, C. J.; Keiderling, U.; Koster, K. L.Location of sugars in multilamellar membranes at low hydration. Phys.B 2006, 385−386, 862−864.(25) Pincet, F.; Perez, E.; Wolfe, J. Do Trehalose and DimethylSulfoxide Affect Intermembrane Forces? Cryobiology 1994, 31 (6),531−539.(26) Yoon, Y. H.; Pope, J. M.; Wolfe, J. The effects of solutes on thefreezing properties of and hydration forces in lipid lamellar phases.Biophys. J. 1998, 74 (4), 1949−1965.(27) Andersen, H. D.; Wang, C.; Arleth, L.; Peters, G. H.; Westh, P.Reconciliation of opposing views on membrane - sugar interactions.Proc. Natl. Acad. Sci. U. S. A. 2011, 108 (5), 1874−1878.(28) Green, J. L.; Angell, C. A. Phase-Relations and Vitrification inSaccharide-Water Solutions and the Trehalose Anomaly. J. Phys. Chem.1989, 93 (8), 2880−2882.(29) Lerbret, A.; Affouard, F.; Hed́oux, A.; Krenzlin, S.; Siepmann, J.;Bellissent-Funel, M.-C.; Descamps, M. How Strongly Does TrehaloseInteract with Lysozyme in the Solid State? Insights from MolecularDynamics Simulation and Inelastic Neutron Scattering. J. Phys. Chem.B 2012, 116 (36), 11103−11116.(30) Lerbret, A.; Bordat, P.; Affouard, F.; Descamps, M.; Migliardo,F. How Homogeneous Are the Trehalose, Maltose, and Sucrose WaterSolutions? An Insight from Molecular Dynamics Simulations. J. Phys.Chem. B 2005, 109 (21), 11046−11057.(31) Magazu,̀ S.; Migliardo, F.; Mondelli, C.; Vadala,̀ M. Correlationbetween bioprotective effectiveness and dynamic properties oftrehalose−water, maltose−water and sucrose−water mixtures. Carbo-hydr. Res. 2005, 340 (18), 2796−2801.(32) Magazu, S.; Migliardo, F.; Ramirez-Cuesta, A. J. Inelasticneutron scattering study on bioprotectant systems. J. R. Soc., Interface2005, 2 (5), 527−532.(33) Magazu,̀ S.; Migliardo, F.; Telling, M. T. F. α,α-Trehalose−Water Solutions. VIII. Study of the Diffusive Dynamics of Water byHigh-Resolution Quasi Elastic Neutron Scattering. J. Phys. Chem. B2006, 110 (2), 1020−1025.
Langmuir Article
DOI: 10.1021/acs.langmuir.5b02127Langmuir 2015, 31, 9134−9141
9140
(34) Bryant, G.; Koster, K. L.; Wolfe, J. Membrane behaviour inseeds and other systems at low water content: the various effects ofsolutes. Seed Sci. Res. 2001, 11, 17−25.(35) Koster, K. L.; Lei, Y. P.; Anderson, M.; Martin, S.; Bryant, G.Effects of vitrified and nonvitrified sugars on phosphatidylcholinefluid-to-gel phase transitions. Biophys. J. 2000, 78 (4), 1932.(36) Koster, K. L.; Webb, M. S.; Bryant, G.; Lynch, D. V. Interactionsbetween soluble sugars and POPC (1-palmitoyl-2-oleoylphosphatidyl-choline) during dehydration: vitrification of sugars alters the phasebehavior of the phospholipid. Biochim. Biophys. Acta, Biomembr. 1994,1193 (1), 143−150.(37) Kent, B.; Hunt, T.; Darwish, T. A.; Hauss, T.; Garvey, C. J.;Bryant, G. Localization of trehalose in partially hydrated DOPCbilayers: insights into cryoprotective mechanisms. J. R. Soc., Interface2014, 11 (95), 6.(38) Al Kayal, T.; Russo, E.; Pieri, L.; Caminati, G.; Berti, D.;Bucciantini, M.; Stefani, M.; Baglioni, P. Interactions of lysozyme withphospholipid vesicles: effects of vesicle biophysical features on proteinmisfolding and aggregation. Soft Matter 2012, 8 (35), 9115−9126.(39) Hristova, K.; White, S. H. Determination of the HydrocarbonCore Structure of Fluid Dioleoylphosphocholine (DOPC) Bilayers byX-Ray Diffraction Using Specific Bromination of the Double-Bonds:Effect of Hydration. Biophys. J. 1998, 74 (5), 2419−2433.(40) Wiener, M. C.; White, S. H. Fluid Bilayer StructureDetermination by the Combined Use of X-Ray and Neutron-Diffraction 0.1. Fluid Bilayer Models and the Limits of Resolution.Biophys. J. 1991, 59 (1), 162−173.(41) Wiener, M. C.; White, S. H. Fluid Bilayer StructureDetermination by the Combined Use of X-Ray and Neutron-Diffraction 0.2. Composition-Space Refinement Method. Biophys. J.1991, 59 (1), 174−185.(42) Wiener, M. C.; White, S. H. Structure of a FluidDioleoylphosphatidylcholine Bilayer Determined by Joint Refinementof X-Ray and Neutron-Diffraction Data 0.3. Complete Structure.Biophys. J. 1992, 61 (2), 434−447.(43) Greenspan, L. Humidity Fixed Points of Binary SaturatedAqueous Solutions. J. Res. Natl. Bur. Stand., Sect. A 1977, 81A (1), 89−95.(44) Koch, H. J.; Stuart, R. S. The catalytic C-deuteration of somecarbohydrate derivatives. Carbohydr. Res. 1978, 67 (2), 341−348.(45) Koch, H. J.; Stuart, R. S. A novel method for specific labelling ofcarbohydrates with deuterium by catalytic exchange. Carbohydr. Res.1977, 59 (1), C1−C6.(46) Worcester, D. L. Neutron diffraction studies of biologicalmembranes and membrane components. Brookhaven Symp. Biol. 1976,27, III37−III57.(47) Franks, N. P.; Lieb, W. R. The structure of lipid bilayers and theeffects of general anaesthetics: An X-ray and neutron diffraction study.J. Mol. Biol. 1979, 133 (4), 469−500.(48) Schneck, E.; Rehfeldt, F.; Oliveira, R. G.; Gege, C.; Deme, B.;Tanaka, M. Modulation of intermembrane interaction and bendingrigidity of biomembrane models via carbohydrates investigated byspecular and off-specular neutron scattering. Phys. Rev. E 2008, 78 (6),061924.(49) Bracewell, R. N. The Fourier transform and its applications;McGraw Hill: New York, 2000.(50) Caracciolo, G.; Pozzi, D.; Caminiti, R. Hydration effect on thestructure of dioleoylphosphatidylcholine bilayers. Appl. Phys. Lett.2007, 90 (18), 3.(51) Bryant, G.; Koster, K. L. Dehydration of solute-lipid systems:hydration forces analysis. Colloids Surf., B 2004, 35, 73−79.(52) Sum, A. K.; Faller, R.; de Pablo, J. J. Molecular simulation studyof phospholipid bilayers and insights of the interactions withdisaccharides. Biophys. J. 2003, 85 (5), 2830−2844.(53) Westh, P. Glucose, sucrose and trehalose are partially excludedfrom the interface of hydrated DMPC bilayers. Phys. Chem. Chem.Phys. 2008, 10 (28), 4110−4112.(54) Tian, J.; Sethi, A.; Swanson; Basil, I.; Goldstein, B.; Gnanakaran,S. Taste of Sugar at the Membrane: Thermodynamics and Kinetics of
the Interaction of a Disaccharide with Lipid Bilayers. Biophys. J. 2013,104 (3), 622−632.(55) Yang, L.; Huang, H. W. A Rhombohedral Phase of LipidContaining a Membrane Fusion Intermediate Structure. Biophys. J.2003, 84 (3), 1808−1817.(56) Koster, K. L.; Lei, Y. P.; Anderson, M.; Martin, S.; Bryant, G.Effects of vitrified and nonvitrified sugars on phosphatidylcholinefluid-to-gel phase transitions. Biophys. J. 2000, 78 (4), 1932−1946.(57) Crowe, J. H.; Crowe, L. M.; Mouradian, R. Stabilization ofBiological-Membranes at Low Water Activities. Cryobiology 1983, 20(3), 346−356.
Langmuir Article
DOI: 10.1021/acs.langmuir.5b02127Langmuir 2015, 31, 9134−9141
9141