Embed Size (px)
Citation preview
Direct Measurement of Mercury Reactions
in Power Plant Plumes
Leonard LevinEPRIDOE NETL Mercury Control Technology R&D Program Review MeetingPittsburgh, PAAugust 12-13, 2003

2 Copyright © 2003 Electric Power Research Institute, Inc. All rights reserved.
Power plant plumes may promote rapid mercury chemistry
• Ionic mercury (6 orders of magnitude more water soluble, easily washed out of plume) rapidly reduced to …
• Elemental mercury (much less soluble in precipitation, likely to go into regional, global background) in power plant plumes.

3 Copyright © 2003 Electric Power Research Institute, Inc. All rights reserved.
CURRENT MODELING OF MERCURY IN PLUMES

4 Copyright © 2003 Electric Power Research Institute, Inc. All rights reserved.
Plume behavior in model atmosphere
Level 2
Level 3
Grid cell at coords. (x,y)
Emissions plume mixes WITHOUT REACTION into grid cell
Mercury valence state at stack exit: Hg(II), Hg(0)
ratio A:B
RESULT: Mercury valence state ratio at full dispersion Hg(II)/Hg(0) ratio STILL
A:B
Dispersion intothe free
atmosphere; reactions in atmosphere
Level 1

5 Copyright © 2003 Electric Power Research Institute, Inc. All rights reserved.
Plume behavior in “real” atmosphere
Physical stack height
Dispersion into
the free atmosphere
Redox chemistry occurs in the emissions plume
Hg(0)
Hg(II)
Hg(0) tends to disperse more
widely into regional and global
background
Mercury valence state at
stack exit: Hg(II), Hg(0)
Top of boundary layer
Mercury valence state downwind:
Hg(II), Hg(0) ratio <A:>B
ratio A:B Hg(II) tends to deposit closer to source at higher concentrations
Surface level

6 Copyright © 2003 Electric Power Research Institute, Inc. All rights reserved.
– PLUME DILUTION SIMULATIONS

7 Copyright © 2003 Electric Power Research Institute, Inc. All rights reserved.

8 Copyright © 2003 Electric Power Research Institute, Inc. All rights reserved.
Some SPDC Study Locations
• October 2002 at Plant Bowen, EPRI (Levin), Southern Company, (Jansen), in collaboration with TVA (Valente) and EERC (Laudal and Schulz)
• March 2000 @ EERC UARG-EPRI (Michaud and Levin), CATM-EERC (Laudal), EPA-ORD (Kilgroe) and FGS (Prestbo)
• May 1997 @ Dickerson and Mont. Co. Waste Inc. Maryland DNR-PPRP (Sherwell) and ERM (J. Ross)
• February 1995 @ WEPCO-PIPP Wisconsin DNR (Knauer) and EPA GLNPO(A. Bandemeier)

9 Copyright © 2003 Electric Power Research Institute, Inc. All rights reserved.
SPDC EERC Pilot Plant Study Conclusions:Hg(II) Hg(0) in Plume
•Hg(0)/HgTOT at end > ratio injected into the SPDC –Hg(II) Hg(0)?
•Conversion is fast (<5 minutes), significant•Greater conversion of Hg(II) to Hg(0) for SPDC “daytime” runs.
•Conversion of Hg(II) to Hg(0): typically x1.5-3,largest (x6) when O3 added at 200 ppb.
•No SPDC runs showed significant amounts of gaseous Hg(II) adsorbing to the particulate phase

10 Copyright © 2003 Electric Power Research Institute, Inc. All rights reserved.
– REGIONAL MODEL SIMULATIONS vs.
OBSERVATIONAL DATA
11 Copyright © 2003 Electric Power Research Institute, Inc. All rights reserved.
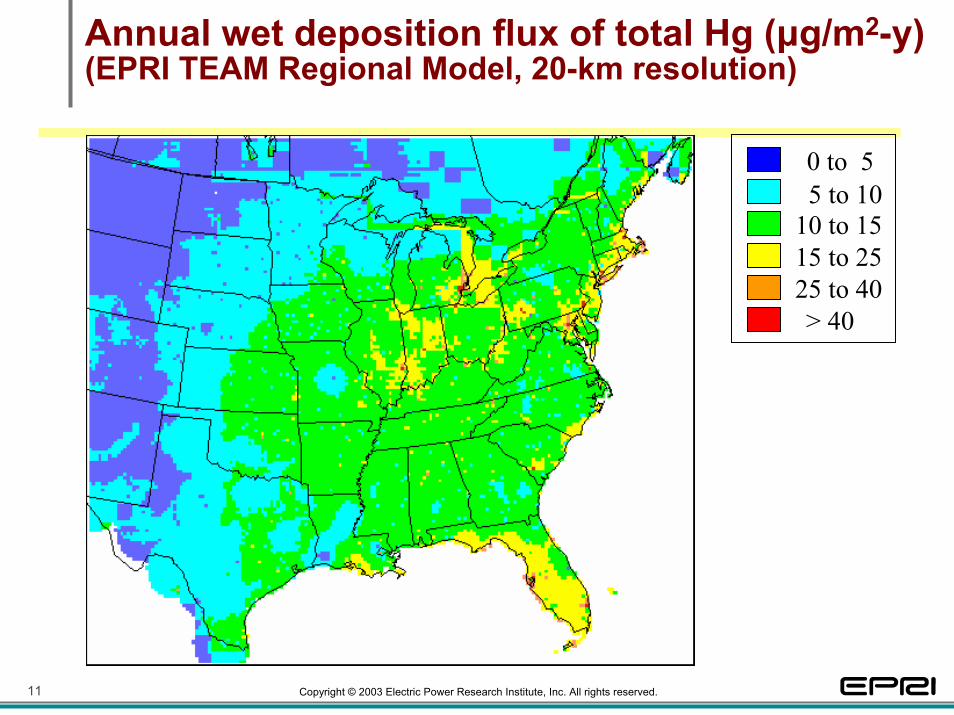
Annual wet deposition flux of total Hg (µg/m2-y)(EPRI TEAM Regional Model, 20-km resolution)
0 to 55 to 10
10 to 1515 to 2525 to 40> 40

12 Copyright © 2003 Electric Power Research Institute, Inc. All rights reserved.
Observed Mercury Wet Deposition (µg/m2-y), Mercury Deposition Network, 2001

13 Copyright © 2003 Electric Power Research Institute, Inc. All rights reserved.
EPRI TEAM Model Prediction vs. ObservationsWet Deposition Data Averaged by State
0123456789
10111213141516171819202122232425
Sim
ulat
ed (µ
g/m
2 -yr
)1 : 1.5 line
1.5 : 1 line
1:1 line
TX
WA
PA
CA
NC
FL
ME
GA
MN
WI SC
NM
NH
NB
ON
NS
“Pennsylvania Anomaly”
0 1 2 3 4 5 6 7 8 9 10 11 12 13 14 15 16 17 18 19 20 21 22 23 24 25
Measured (µg/m2-yr)

14 Copyright © 2003 Electric Power Research Institute, Inc. All rights reserved.
– FIELD MEASUREMENTS, SOURCE vs. SAMPLER
SPECIATION

15 Copyright © 2003 Electric Power Research Institute, Inc. All rights reserved.
Simulations vs. Measurements,Plant Bowen to Yorkville Ground Station
Ambient TEAM simulationsEmissions measurements without clouds | with clouds (a)
SO2/NOy 3.2 3.5 3.1 2.9
SO2/Hg (x105) 8.2 6.4 7.8 7.3
Hg(0)/HgTOT 0.40 0.94 0.41 0.42
Hg(II)/Hg 0.60 0.06 0.59 0.58TOT(a) Clouds placed between 450 m and 2000 m above ground level

16 Copyright © 2003 Electric Power Research Institute, Inc. All rights reserved.
Hg(0) vs. SO2 – July 20, 2001 Event, Bowen Plume Impingement at Yorkville Station
Hg(0) = 8.1*SO2 + 1559R2 = 0.602
1400
1500
1600
1700
1800
1900
0 5 10 15 20 25 30 35
SO2 (ppb)
Hg(
0) (p
g/m
3)

17 Copyright © 2003 Electric Power Research Institute, Inc. All rights reserved.
Observed vs. Expected Emission Ratios (pg/m3 perppb) – July 20, 2001 Event, Bowen Plume Impingement at Yorkville Station
14 14
12 12
10 10
8 8
ER
ER
6 6
4 4
2 2
0 0ObsHg(0) ExpHg(0) ObsRGM ExpRGM ObsTPM ExpTPM ObsTotal ExpTotal

18 Copyright © 2003 Electric Power Research Institute, Inc. All rights reserved.
EXPERIMENTAL PLAN

19 Copyright © 2003 Electric Power Research Institute, Inc. All rights reserved.
WORKING HYPOTHESES
• Hg(II)/HgTOT: [stack gases]>[aircraft]>[ground station]• From plume dilution experiments: look for rapid, high-ratio
chemical reduction in buoyancy segment of plume out to dilution ratio of hundreds to one.
• Ideally:– Steady, unidirectional winds < 15 m/s; low turbulence BL– Aircraft sampling of upwind background (free of other major
sources), several downwind transects (each with multiple passes), far downwind dispersion
– Aircraft multiple passes through plume rise portion just above stack
• Reality: a lot more difficult (approach to stack; steady-state conditions;
• Additional goal: method evaluation, plume dilution methods

20 Copyright © 2003 Electric Power Research Institute, Inc. All rights reserved.
Tekran Automated Hg Analyzer
21 Copyright © 2003 Electric Power Research Institute, Inc. All rights reserved.
PLANS FOR PLEASANT PRAIRIE EXPERIMENT
22 Copyright © 2003 Electric Power Research Institute, Inc. All rights reserved.
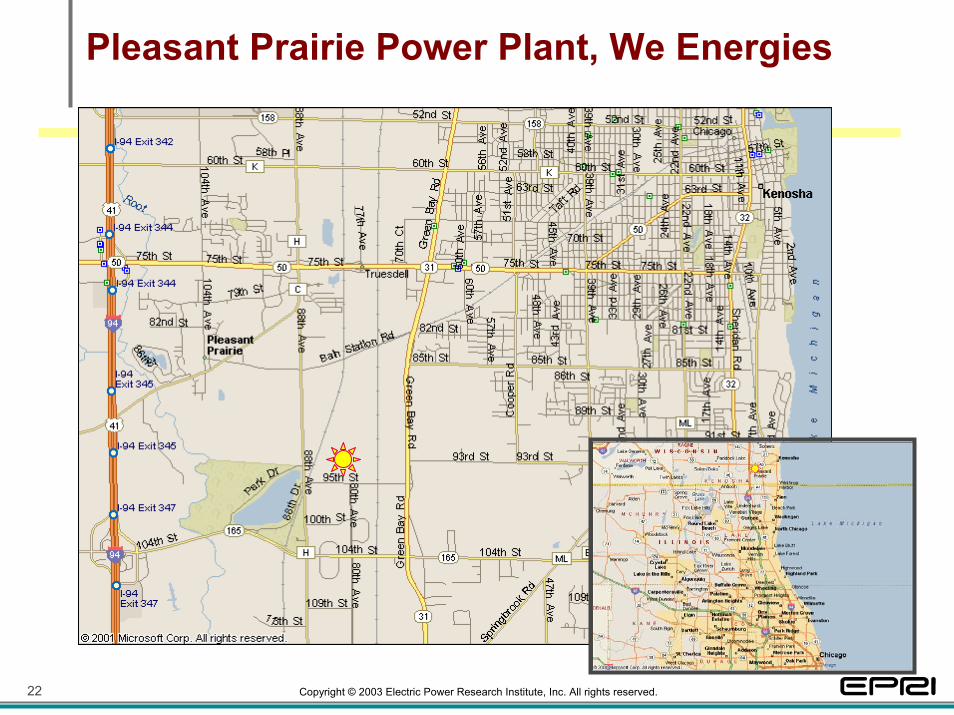
Pleasant Prairie Power Plant, We Energies

23 Copyright © 2003 Electric Power Research Institute, Inc. All rights reserved.
Pleasant Prairie Plant
External Stack Platforms2 Units Into Single Stack

24 Copyright © 2003 Electric Power Research Institute, Inc. All rights reserved.

25 Copyright © 2003 Electric Power Research Institute, Inc. All rights reserved.
PROJECT SCHEDULE FOR PLEASANT PRAIRIE EXPERIMENT
(August-September, 2003)
Task 4Plume Dilution
Chamber Sampling
Task 2In-stack
Sampling
Task 3Aircraft and
Aerial Sampling
Task 1Site
Reconnaissance and Project Preparation
Task 6: Project Integration and
ReportingTask 5Sampling and Data Analysis
Phase 3Jan 1 – Mar 31,
2004
Phase 2March 3 – Dec
31, 2003
Phase 1Oct 1, 2002 –
March 3, 2003

26 Copyright © 2003 Electric Power Research Institute, Inc. All rights reserved.
Dynamic Plume Dilution Stream
Instrumentation Courtesy Matt Landis, Bob Stevens; US EPA

27 Copyright © 2003 Electric Power Research Institute, Inc. All rights reserved.
HINT OF A MECHANISM????
28 Copyright © 2003 Electric Power Research Institute, Inc. All rights reserved.
Yusuf et al., 2003
• “Homogeneous and heterogeneous reactions of atmospheric mercury(II) with sulfur(IV),” Huda Yusuf, Nazafarin Lahoutifard, Kirsty Maunder, and Susannah L. Scott (presented at: XII International Conference on Heavy Metals in the Environment”, Grenoble, France, May 26-30, 2003)
– Abstract. Atmospheric models suggest that the reduction of Hg(II) to Hg(0) by S(IV) prolongs the residence time of mercury.The redox reaction was investigated both in the aqueous phase (where the reductant is sulfite) and on particulate matter (where the reductant in SO2(g)). In both cases, one of the ultimate products is HgS. A mechanism is proposed involving formation of Hg(0) followed by mercury-induced disproportionation of SO2[for SO2 ∼ Hg]
• Proposes HgO(s) + SO2(g) Hg(0)(g) + SO3(g) for SO2 >> Hg

29 Copyright © 2003 Electric Power Research Institute, Inc. All rights reserved.
RESEARCH TEAM

30 Copyright © 2003 Electric Power Research Institute, Inc. All rights reserved.
Research team, EPRI program on mercury reactions in power plant plumes
• ARA• Atmospheric and Environmental Research, Inc.• Energy & Environmental Research Ctr, University of North Dakota• Frontier Geosciences• National Energy Technology Laboratory, U.S. DOE• State of Florida• State of Wisconsin Department of Natural Resources• State of Wisconsin Division of Energy• Southern Company• Tennessee Valley Authority• U.S. Environmental Protection Agency• University of Alabama at Huntsville• University of North Dakota• We Energies• Wisconsin Focus on Energy• Many others: Allegheny Power, American Electric Power, Constellation
Energy, Detroit Edison, Duke Energy, MEAG, Oglethorpe Power, TXU

31 Copyright © 2003 Electric Power Research Institute, Inc. All rights reserved.
Global inventory (1995 datum)Pacyna et al., “Mapping 1995 global anthropogenic emissions of mercury,” Atmosph. Env., 2003

Gold Country