Embed Size (px)
Citation preview

SECOND GENERATION ADVANCED REBURNINGFOR HIGH EFFICIENCY NOx CONTROL
Phase I Final Report
Project Period: October 1, 1995 - September 30, 1997
Prepared by:Vladimir M. Zamansky, Peter M. Maly, Loc Ho, Mark S. Sheldon, David Moyeda,Blair A. Folsom, W. Randall Seeker, William C. Gardiner, Jr. and Vitaly V. Lissianski
July 31, 1997
DOE Contract No. DE-AC22-95PC95251Phase I
Submitted by:Energy and Environmental Research Corporation
18 Mason, Irvine, CA 92618
Disclaimer
This report was prepared as an accountof work sponsored by an agency of theUnited States Government. Neither theUnited States nor any agency thereof,nor any of their employees, makes anywarranty, express or implied, orassumes any legal liability orresponsibility for the accuracy,completeness, or usefulness of anyinformation, apparatus, product, orprocess disclosed, or represents that itsuse would not infringe privately ownedrights. Reference herein to any specificcommercial product, process, or serviceby trade name, trademark, manufacturer,or otherwise does not necessarilyconstitute or imply its endorsement,recommendation, or favoring by theUnited States Government or anyagency thereof. The views and opinionsof authors expressed herein do notnecessarily state or reflect those of theUnited States Government or anyagency thereof.
i
ABSTRACT
This project develops novel Advanced Reburning (AR) concepts for high efficiency and low costNOx control from coal fired utility boilers. AR technologies are based on combination of basicreburning and N-agent/promoter injections. Phase I demonstrated that AR technologies are able toprovide effective NOx control for coal fired combustors. Three technologies were originallyenvisioned for development: AR-Lean, AR-Rich, and Multiple Injection AR (MIAR). Alongwith these, three additional technologies were identified during the project: reburning pluspromoted SNCR, AR-Lean plus promoted SNCR, and AR-Rich plus promoted SNCR. Thepromoters are sodium salts, in particular sodium carbonate. These AR technologies have differentoptimum reburn heat input levels and furnace temperature requirements. For full scaleapplication, an optimum technology can be selected on a boiler-specific basis depending onfurnace temperature profile and regions of injector access.
The experimental program included combustion tests in 20 and 200 kW facilities. Pilot scalestudies in the 200 kW combustor demonstrated the ability of the AR technologies to achieve NOx
reductions of 95+% during gas firing and 90+% during coal firing. Byproduct emissions werefound to be lower than those generated by commercial reburning and SNCR technologies.
A detailed reaction mechanism was developed to model the AR chemical processes. Themechanism (355 reactions of 65 species) includes the following submechanisms: GRI-Mech-2.11,SNCR chemistry, sodium chemistry with Na2CO3 decomposition reactions, SO2/SO3 reactions,and interaction of HCl with flue gas components. Modeling provided insight into the controllingfactors of the process and qualitatively described the observed reaction trends. Modelingpredicted and explained the effect of sodium promotion under both fuel-rich and fuel-leanconditions. The sensitivity analysis revealed the most significant elementary reactions affectingformation and destruction of NO and other N-containing compounds in the reburning andburnout zones.
The AR design methodology was updated by using experiments and analytical models to includethe second generation improvements. This methodology was then used for application of thenovel AR concepts to a 100 MW tangentially fired utility boiler, and to predict the impacts ofthe AR systems on boiler performance and NOx emissions. A parallel AR-Lean demonstration(outside the scope of this project) provided an opportunity to test several novel AR componentsin the field.
Economic analysis demonstrates a considerable economic advantage of AR technologies incomparison with existing commercial NOx control techniques, such as basic reburning, SNCR,and SCR. Particularly for deep NOx control, AR results in 2-3 times lower costs (in $/ton of NOx
removed) than SCR for the same level of NOx control. The market for AR technologies isestimated to be above $1.5 billion.
ii
TABLE OF CONTENTS
Section Page
1.0 EXECUTIVE SUMMARY . . . . . . . . . . . . . . . . . . . . . . . . . . . . . . . . . . . . . . . . . . 1-1
2.0 INTRODUCTION . . . . . . . . . . . . . . . . . . . . . . . . . . . . . . . . . . . . . . . . . . . . . . . . . 2-1
3.0 BACKGROUND . . . . . . . . . . . . . . . . . . . . . . . . . . . . . . . . . . . . . . . . . . . . . . . . . . 3-13.1 High Efficiency NOx Control under Title 1 of the CAAA . . . . . . . . . . . . . 3-13.2 Limitations of Available NOx Control Technologies for
Post-RACT Applications . . . . . . . . . . . . . . . . . . . . . . . . . . . . . . . . . . . . . . 3-33.3 Advanced Reburning . . . . . . . . . . . . . . . . . . . . . . . . . . . . . . . . . . . . . . . . . . 3-53.4 Second Generation Advanced Reburning (SGAR) . . . . . . . . . . . . . . . . . . . 3-5
4.0 PHASE I PROGRAM OBJECTIVES . . . . . . . . . . . . . . . . . . . . . . . . . . . . . . . . . . 4-1
5.0 KINETICS OF Na2CO3 REACTIONS WITH FLUE GAS . . . . . . . . . . . . . . . . . 5-15.1 Literature Review . . . . . . . . . . . . . . . . . . . . . . . . . . . . . . . . . . . . . . . . . . . . 5-15.2 Thermodynamics of Sodium in Combustion Flue Gas . . . . . . . . . . . . . . . . 5-3
5.2.1 The Solid to Gas-Phase Transition . . . . . . . . . . . . . . . . . . . . . . . . . 5-35.2.2 Available Thermodynamic Data on Sodium in the Gas-Phase . . . . 5-8
5.3 Experimental Methods . . . . . . . . . . . . . . . . . . . . . . . . . . . . . . . . . . . . . . . 5-155.3.1 Flow System . . . . . . . . . . . . . . . . . . . . . . . . . . . . . . . . . . . . . . . . . 5-155.3.2 Mass Spectrometric Analysis . . . . . . . . . . . . . . . . . . . . . . . . . . . . 5-17
5.4 Rate of Sodium Carbonate Decomposition . . . . . . . . . . . . . . . . . . . . . . . . 5-175.4.1 Sodium Carbonate Decomposition in Nitrogen . . . . . . . . . . . . . . . 5-175.4.2 Reactions of Sodium Carbonate with Components of Flue Gas . . 5-25
5.5 Mass Spectrometry of Decomposition Products . . . . . . . . . . . . . . . . . . . 5-265.6 Kinetics of Na2CO3 Reactions: Conclusions . . . . . . . . . . . . . . . . . . . . . . 5-32
6.0 BENCH SCALE PROCESS OPTIMIZATION STUDIES . . . . . . . . . . . . . . . . . . 6-16.1 Controlled Temperature Tower . . . . . . . . . . . . . . . . . . . . . . . . . . . . . . . . . 6-16.2 Reburning Alone . . . . . . . . . . . . . . . . . . . . . . . . . . . . . . . . . . . . . . . . . . . . . 6-46.3 Promoted AR-Lean . . . . . . . . . . . . . . . . . . . . . . . . . . . . . . . . . . . . . . . . . . . 6-66.4 Promoted AR-Rich . . . . . . . . . . . . . . . . . . . . . . . . . . . . . . . . . . . . . . . . . . . 6-76.5 Multiple Injection AR (MIAR) . . . . . . . . . . . . . . . . . . . . . . . . . . . . . . . . 6-126.6 Bench Scale Combustion Tests: Conclusions . . . . . . . . . . . . . . . . . . . . . 6-13
7.0 PILOT SCALE DEVELOPMENT TESTS . . . . . . . . . . . . . . . . . . . . . . . . . . . . . . 7-17.1 Preparation of Pilot Scale Combustion Facility . . . . . . . . . . . . . . . . . . . . . 7-1
7.1.1 Boiler Simulator Facility . . . . . . . . . . . . . . . . . . . . . . . . . . . . . . . . . 7-1
iii
7.1.2 Reburning and Additive Injection Systems . . . . . . . . . . . . . . . . . . . 7-37.1.3 Sampling and Analysis Methods . . . . . . . . . . . . . . . . . . . . . . . . . . 7-4
7.2 Pilot Scale Combustion Tests with Natural Gas Firing . . . . . . . . . . . . . . . 7-47.2.1 Promoted AR-Lean . . . . . . . . . . . . . . . . . . . . . . . . . . . . . . . . . . . . . 7-47.2.2 Promoted AR-Rich . . . . . . . . . . . . . . . . . . . . . . . . . . . . . . . . . . . . . 7-77.2.3 Hybrid AR-Lean/SNCR . . . . . . . . . . . . . . . . . . . . . . . . . . . . . . . . 7-127.2.4 MIAR . . . . . . . . . . . . . . . . . . . . . . . . . . . . . . . . . . . . . . . . . . . . . . 7-14
7.3 Pilot Scale Combustion Tests with Coal Firing . . . . . . . . . . . . . . . . . . . . 7-167.3.1 Promoted AR-Lean . . . . . . . . . . . . . . . . . . . . . . . . . . . . . . . . . . . . 7-177.3.2 Promoted AR-Rich . . . . . . . . . . . . . . . . . . . . . . . . . . . . . . . . . . . . 7-187.3.3 Hybrid AR-Lean/SNCR . . . . . . . . . . . . . . . . . . . . . . . . . . . . . . . . 7-237.3.4 Hybrid AR-Rich/SNCR . . . . . . . . . . . . . . . . . . . . . . . . . . . . . . . . 7-267.3.5 MIAR . . . . . . . . . . . . . . . . . . . . . . . . . . . . . . . . . . . . . . . . . . . . . . 7-277.3.6 Byproduct Sampling Tests . . . . . . . . . . . . . . . . . . . . . . . . . . . . . . 7-31
7.4 Pilot Scale Combustion Tests: Conclusions . . . . . . . . . . . . . . . . . . . . . . . 7-38
8.0 MECHANISM DEVELOPMENT AND KINETIC MODELING . . . . . . . . . . . 8-18.1 Mechanism Development . . . . . . . . . . . . . . . . . . . . . . . . . . . . . . . . . . . . . . 8-1
8.1.1 GRI-Mech . . . . . . . . . . . . . . . . . . . . . . . . . . . . . . . . . . . . . . . . . . . . 8-28.1.2 SNCR Reations . . . . . . . . . . . . . . . . . . . . . . . . . . . . . . . . . . . . . . . . 8-28.1.3 Reactions of Sodium . . . . . . . . . . . . . . . . . . . . . . . . . . . . . . . . . . . . 8-58.1.4 Reactions of Sulfur and Chlorine . . . . . . . . . . . . . . . . . . . . . . . . . . . 8-78.1.5 Mechanism Development: Summary . . . . . . . . . . . . . . . . . . . . . . . 8-9
8.2 Modeling with Instantaneous Mixing Times . . . . . . . . . . . . . . . . . . . . . . . 8-98.2.1 Modeling of the Basic Reburning Process . . . . . . . . . . . . . . . . . . . 8-138.2.2 Injection of Ammonia into the Reburning Zone (AR-Rich) . . . . . 8-328.2.3 Promotion of the NO-NH3 Interaction in the Reburning Zone . . 8-428.2.4 Effect of Different Factors on the NO-NH3 Interaction in the
Reburning Zone . . . . . . . . . . . . . . . . . . . . . . . . . . . . . . . . . . . . . . . 8-488.2.5 Injection of Ammonia into the Burnout Zone (AR-Lean) . . . . . . 8-508.2.6 Modeling with Instantaneous Mixing Times: Summary . . . . . . . 8-51
8.3 Evaluation of Mixing Effects . . . . . . . . . . . . . . . . . . . . . . . . . . . . . . . . . . . 8-528.3.1 Approach . . . . . . . . . . . . . . . . . . . . . . . . . . . . . . . . . . . . . . . . . . . 8-528.3.2 Effect of Mixing Times on Basic Reburning . . . . . . . . . . . . . . . . . 8-548.3.3 Effect of Mixing Times on AR-Rich . . . . . . . . . . . . . . . . . . . . . . . 8-558.3.4 Effect of Mixing Times on AR-Lean . . . . . . . . . . . . . . . . . . . . . . . 8-588.3.5 Mixing Studies: Summary . . . . . . . . . . . . . . . . . . . . . . . . . . . . . . 8-60
8.4 Effect of Sodium . . . . . . . . . . . . . . . . . . . . . . . . . . . . . . . . . . . . . . . . . . . . 8-618.4.1 Effect of Sodium Promotion in AR-Rich . . . . . . . . . . . . . . . . . . . 8-628.4.2 Effect of Sodium Promotion in AR-Lean . . . . . . . . . . . . . . . . . . . 8-76
8.5 Summary of Modeling Studies . . . . . . . . . . . . . . . . . . . . . . . . . . . . . . . . . 8-84
iv

9.0 DESIGN METHODOLOGY AND APPLICATION . . . . . . . . . . . . . . . . . . . . . . 9-19.1 AR Design Methodology . . . . . . . . . . . . . . . . . . . . . . . . . . . . . . . . . . . . . . 9-1
9.1.1 General Approach . . . . . . . . . . . . . . . . . . . . . . . . . . . . . . . . . . . . . . 9-19.1.2 Case Study Boiler Characteristics . . . . . . . . . . . . . . . . . . . . . . . . . . 9-39.1.3 Heat Transfer Analysis . . . . . . . . . . . . . . . . . . . . . . . . . . . . . . . . . . 9-49.1.4 Injection System Studies . . . . . . . . . . . . . . . . . . . . . . . . . . . . . . . . 9-149.1.5 Full Scale Performance Prediction . . . . . . . . . . . . . . . . . . . . . . . . . 9-18
9.2 AR Application . . . . . . . . . . . . . . . . . . . . . . . . . . . . . . . . . . . . . . . . . . . . . 9-199.3 Economic and Market Analysis . . . . . . . . . . . . . . . . . . . . . . . . . . . . . . . . 9-24
9.3.1 NOx Control Drivers . . . . . . . . . . . . . . . . . . . . . . . . . . . . . . . . . . . 9-259.3.2 Methodology and Cases Evaluated . . . . . . . . . . . . . . . . . . . . . . . . 9-269.3.3 Technology Specific Inputs . . . . . . . . . . . . . . . . . . . . . . . . . . . . . 9-279.3.4 Economic Results . . . . . . . . . . . . . . . . . . . . . . . . . . . . . . . . . . . . . 9-299.3.5 Market Assessment . . . . . . . . . . . . . . . . . . . . . . . . . . . . . . . . . . . 9-31
9.4 Design Methodology and Application: Conclusions . . . . . . . . . . . . . . . . 9-33
10.0 CONCLUSIONS . . . . . . . . . . . . . . . . . . . . . . . . . . . . . . . . . . . . . . . . . . . . . . . . . . 10-1
11.0 ACKNOWLEDGEMENTS . . . . . . . . . . . . . . . . . . . . . . . . . . . . . . . . . . . . . . . . . 11-1
12.0 REFERENCES . . . . . . . . . . . . . . . . . . . . . . . . . . . . . . . . . . . . . . . . . . . . . . . . . . . 12-1
Appendix 1. Reaction Mechanism in Chemkin/Senkin Interpreter Format . . . . . . . . . . . A-1
Appendix 2. Thermodynamic database for Reaction Mechanism in Chemkin Format . A-12
Appendix 3. Thermodynamic database for sodium compounds . . . . . . . . . . . . . . . . . . A-17
v
LIST OF FIGURES
Figure Page2.1 SGAR schematic - definitions . . . . . . . . . . . . . . . . . . . . . . . . . . . . . . . . . . . . . . . . . 2-24.1. Phase I task structure and major milestones . . . . . . . . . . . . . . . . . . . . . . . . . . . . . . 4-2
5.2.1 Dependence of ÆrG¡ (EER thermochemistry) for Na2CO3 ↔ Na2O + CO2
and Na2CO3 + H2O ↔ 2NaOH + CO2 on temperature . . . . . . . . . . . . . . . . . . . . 5-55.2.2 Dependence of Na2CO3 to CO2 conversion according to equation (5.13) . . . . . . . 5-65.2.3 Comparison between experimental and calculated equilibrium conversions of
Na2CO3 to CO2 . . . . . . . . . . . . . . . . . . . . . . . . . . . . . . . . . . . . . . . . . . . . . . . . . . . 5-85.2.4 Equilibrium distribution of sodium-containing species at 1 atm pressure in 80%
N2, 20% H2O and 300 ppm Na2CO3 . . . . . . . . . . . . . . . . . . . . . . . . . . . . . . . . . . 5-135.2.5 Equilibrium distribution of sodium-containing species at 1 atm pressure in a
flue-gas-like mixture with 300 ppm of added Na2CO3 . . . . . . . . . . . . . . . . . . . . . 5-135.3.1 Flow system diagram . . . . . . . . . . . . . . . . . . . . . . . . . . . . . . . . . . . . . . . . . . . . . . 5-165.4.1 Comparison of experimental and calculated Na2CO3 conversion profiles . . . . . . 5-205.4.2 Temperature dependence of the decadic logarithm of time required for
decomposition of 30% of the initial amount of Na2CO3 . . . . . . . . . . . . . . . . . . . 5-215.4.3 Sensitivity spectrum for decomposition of Na2CO3 . . . . . . . . . . . . . . . . . . . . . . 5-23
5.4.4 Rate coefficient inferred for Na2CO3 → Na2O + CO2 (5.16) . . . . . . . . . . . . . . . 5-23
5.4.5 Rate coefficient inferred for Na2O + CO2 → Na2CO3 (5.17) . . . . . . . . . . . . . . . 5-245.5.1 Time histories of ion currents at m/z = 44 and 106 and total ion current . . . . . . . 5-275.5.2 Mass spectrum at 62 s on the x-axis of Figure 5.5.1 . . . . . . . . . . . . . . . . . . . . . . . 5-275.5.3 Mass spectrum at the time m/z = 23 reaches its maximum . . . . . . . . . . . . . . . . . 5-285.5.4 Mass spectrum at the time m/z = 23 reaches its maximum in thermal ionization
mode . . . . . . . . . . . . . . . . . . . . . . . . . . . . . . . . . . . . . . . . . . . . . . . . . . . . . . . . . . . 5-285.5.5 Time histories of ions with m/z = 23 (Na+), 44 (CO2+), 53 (Na2CO3++), 106
(Na2CO3+), 129 (Na3CO3+), and total ion current . . . . . . . . . . . . . . . . . . . . . . . . 5-295.5.6 Time histories of Ag+ (109) and total ion current for experiments with Ag wire . 5-305.5.7 Mass spectrum at 1235 K . . . . . . . . . . . . . . . . . . . . . . . . . . . . . . . . . . . . . . . . . . . 5-315.5.8 Time histories of ions with m/z = 23 (Na+) and 109 (Ag+), and total ion
current through the detector for thermal ionization mode . . . . . . . . . . . . . . . . . . . 5-315.5.9 Mass spectrum corresponding to the moment of burnout of Ag wire
for thermal ionization mode . . . . . . . . . . . . . . . . . . . . . . . . . . . . . . . . . . . . . . . . . 5-326.1 Controlled Temperature Tower (CTT) . . . . . . . . . . . . . . . . . . . . . . . . . . . . . . . . . . 6-26.2 CTT temperature profiles . . . . . . . . . . . . . . . . . . . . . . . . . . . . . . . . . . . . . . . . . . . . 6-36.3 NO reduction vs. reburn heat input for CTT gas reburn: No additives or
promoters . . . . . . . . . . . . . . . . . . . . . . . . . . . . . . . . . . . . . . . . . . . . . . . . . . . . . . . . 6-56.4 NO reduction vs. reburn zone residence time for gas reburn: No additives or
promoters . . . . . . . . . . . . . . . . . . . . . . . . . . . . . . . . . . . . . . . . . . . . . . . . . . . . . . . . 6-66.5 AR-Lean performance . . . . . . . . . . . . . . . . . . . . . . . . . . . . . . . . . . . . . . . . . . . . . . . 6-7
vi
6.6 AR-Rich performance . . . . . . . . . . . . . . . . . . . . . . . . . . . . . . . . . . . . . . . . . . . . . . . 6-86.7 Alternative promoter screening test results . . . . . . . . . . . . . . . . . . . . . . . . . . . . . . 6-96.8 NO control vs. Na promoter concentration . . . . . . . . . . . . . . . . . . . . . . . . . . . . . 6-106.9 NO reduction vs. NOi for rich side injection of NH4OH + Na2CO3 . . . . . . . . . . 6-116.10 NO reduction vs. NSR for rich side injeciton of NH4OH + Na2CO3 . . . . . . . . . . 6-126.11 MIAR: NO reduction vs. additive injection temperature for reburn with both
rich and lean side additives . . . . . . . . . . . . . . . . . . . . . . . . . . . . . . . . . . . . . . . . . . 6-137.1 Boiler Simulator Facility (BSF) . . . . . . . . . . . . . . . . . . . . . . . . . . . . . . . . . . . . . . . . 7-27.2 BSF temperature profile during 10% reburning . . . . . . . . . . . . . . . . . . . . . . . . . . . 7-37.3 AR-Lean with aqueous urea/sodium injection . . . . . . . . . . . . . . . . . . . . . . . . . . . . . 7-57.4 AR-Lean with aqueous ammonia/sodium injection . . . . . . . . . . . . . . . . . . . . . . . . . 7-67.5 AR-Rich with urea/sodium injection . . . . . . . . . . . . . . . . . . . . . . . . . . . . . . . . . . . . 7-77.6 AR-Rich with ammonia/sodium injection . . . . . . . . . . . . . . . . . . . . . . . . . . . . . . . . 7-87.7 AR-Rich with urea/sodium injection . . . . . . . . . . . . . . . . . . . . . . . . . . . . . . . . . . . 7-107.8 AR-Rich with urea/sodium injection . . . . . . . . . . . . . . . . . . . . . . . . . . . . . . . . . . . 7-117.9 Effect of sodium on NO reduction in AR-Rich . . . . . . . . . . . . . . . . . . . . . . . . . . . 7-127.10 NO reduction during natural gas firing by combined AR-Lean/SNCR with
urea injection at two locations . . . . . . . . . . . . . . . . . . . . . . . . . . . . . . . . . . . . . . . . 7-137.11 Effect of rich side additive injection temperature upon MIAR performance
during natural gas firing at SR2 = 0.99 . . . . . . . . . . . . . . . . . . . . . . . . . . . . . . . . . . 7-157.12 Effect of rich side additivie injection temperature upon MIAR performance
during natural gas firing at SR2 = 0.90 . . . . . . . . . . . . . . . . . . . . . . . . . . . . . . . . . . 7-167.13 NO reduction by AR-Lean during coal firing . . . . . . . . . . . . . . . . . . . . . . . . . . . . 7-177.14 AR-Lean tests: Effect of N-agent/OFA injection temperature upon
performance . . . . . . . . . . . . . . . . . . . . . . . . . . . . . . . . . . . . . . . . . . . . . . . . . . . . . . 7-187.15 Effect of urea injection tmperature and concentration of sodium on NO
reduction in AR-Rich with coal firing . . . . . . . . . . . . . . . . . . . . . . . . . . . . . . . . . . 7-197.16 Effect of urea injection temperature and concentration of sodium on NO
reduction in AR-Rich with coal firing . . . . . . . . . . . . . . . . . . . . . . . . . . . . . . . . . . 7-207.17 AR-Rich tests: Effect of N-agent injectin temperature upon performance . . . . . 7-217.18 AR-Rich tests: Effect of OFA injection temperature upon performance . . . . . . 7-227.19 AR-Rich tests: Effect of sodium promoter concentration upon performance . . . 7-237.20 NO reduction during coal firing by combined AR-Lean/SNCR with urea
injection at two locations . . . . . . . . . . . . . . . . . . . . . . . . . . . . . . . . . . . . . . . . . . . 7-247.21 AR-Rich + SNCR tests: Effect of second additive injection temperature upon
performance . . . . . . . . . . . . . . . . . . . . . . . . . . . . . . . . . . . . . . . . . . . . . . . . . . . . . . 7-267.22 MIAR tests: Effect of first additive injection temperature upon performance
at 18% reburning . . . . . . . . . . . . . . . . . . . . . . . . . . . . . . . . . . . . . . . . . . . . . . . . . . 7-277.23 MIAR tests: Effect of first additive injection temperature upon performance
at 9% reburning . . . . . . . . . . . . . . . . . . . . . . . . . . . . . . . . . . . . . . . . . . . . . . . . . . . 7-287.24 MIAR tests: Effect of second additive injection temperature upon performance
at 18% reburning . . . . . . . . . . . . . . . . . . . . . . . . . . . . . . . . . . . . . . . . . . . . . . . . . . 7-29
vii
7.25 MIAR tests: Effect of second additive injection temperature upon performanceat 9% reburning . . . . . . . . . . . . . . . . . . . . . . . . . . . . . . . . . . . . . . . . . . . . . . . . . . . 7-30
7.26 CO and N2O emissions for AR technologies . . . . . . . . . . . . . . . . . . . . . . . . . . . . 7-337.27 NH3 and HCN emissions for AR technologies . . . . . . . . . . . . . . . . . . . . . . . . . . . 7-347.28 SO3 emissions for AR technologies . . . . . . . . . . . . . . . . . . . . . . . . . . . . . . . . . . . 7-357.29 Fly ash size distribution . . . . . . . . . . . . . . . . . . . . . . . . . . . . . . . . . . . . . . . . . . . . 7-367.30 Fly ash total loading, PM 10 and PM 2.5 . . . . . . . . . . . . . . . . . . . . . . . . . . . . . . . 7-377.31 Carbon in ash results . . . . . . . . . . . . . . . . . . . . . . . . . . . . . . . . . . . . . . . . . . . . . . . 7-388.1.1 Comparison of experimental data and modeling with mechanisms A and B for
the Thermal DeNOx process . . . . . . . . . . . . . . . . . . . . . . . . . . . . . . . . . . . . . . . . . . 8-48.1.2 Effect of sulfur and chlorine on equlibrium concentrations of sodium species
in flue gas . . . . . . . . . . . . . . . . . . . . . . . . . . . . . . . . . . . . . . . . . . . . . . . . . . . . . . . . 8-108.2.1 Kinetic curves of the main species in the reburning zone at SR2 = 0.99 and
injection temperature T1 = 1700 K . . . . . . . . . . . . . . . . . . . . . . . . . . . . . . . . . . . . 8-148.2.2 Kinetic curves of the main species in the reburning zone at SR2 = 0.95 and
injection temperature T1 = 1700 K . . . . . . . . . . . . . . . . . . . . . . . . . . . . . . . . . . . . 8-148.2.3 Kinetic curves of the main species in the reburning zone at SR2 = 0.90 and
injection temperature T1 = 1700 K . . . . . . . . . . . . . . . . . . . . . . . . . . . . . . . . . . . . 8-158.2.4 Kinetic curves in the reburning zone at SR2 = 0.99, T1 = 1700 K and t = 5ms . . 8-168.2.5 Kinetic curves in the reburning zone at SR2 = 0.90, T1 = 1700 K and t = 5ms . . 8-188.2.6 Modeling and experimental data on concentrations of NO, NH3, HCN, and
TFN in the reburning zone (t = 0.5 s) at T1 = 1700 K for differentconcentrations of reburning fuel, SR2 . . . . . . . . . . . . . . . . . . . . . . . . . . . . . . . . . . 8-20
8.2.7 Modeling data on concentrations of NO, NH3, HCN, and TFN in thereburning zone (t = 0.5 s) at T1 = 1500 - 1700 K for different concentrationsof reburning fuel, SR2 . . . . . . . . . . . . . . . . . . . . . . . . . . . . . . . . . . . . . . . . . . . . . . 8-21
8.2.8 NO contribution factors at SR2 = 0.99 in the fast NO decrease region . . . . . . . . 8-238.2.9 NO contribution factors at SR2 = 0.99 in the slow NO decrease region . . . . . . . . 8-248.2.10 NO sensitivity coefficients at SR2 = 0.99 in the fast NO decrease region . . . . . . 8-268.2.11 NO sensitivity coefficients at SR2 = 0.99 in the slow NO decrease region . . . . . 8-278.2.12 NO contribution factors at SR2 = 0.90 in the fast NO decrease region . . . . . . . . 8-298.2.13 NO contribution factors at SR2 = 0.90 in the slow NO decrease region . . . . . . . . 8-308.2.14 NO sensitivity coefficients at SR2 = 0.90 in the slow NO decrease region . . . . . 8-318.2.15 Effect of ammonia co-injection with the reburning fuel and 0.1 s delayed NH3
injection on fuel-N species in the reburning zone . . . . . . . . . . . . . . . . . . . . . . . . . 8-348.2.16 Effect of the delay time of NH3 injection into the reburning zone at SR2 = 0.99 . 8-358.2.17 Effect of the NH3 concentration injected into the reburning zone at SR2 = 0.99
and 0.1 s delay time . . . . . . . . . . . . . . . . . . . . . . . . . . . . . . . . . . . . . . . . . . . . . . . . 8-358.2.18 Kinetic curves of species in the reburning zone at SR2 = 0.99 for injection of
800 ppm ammonia along with the reburning fuel at 1700 K . . . . . . . . . . . . . . . . . 8-378.2.19 NO contribution factors for conditions of Figure 8.2.18 . . . . . . . . . . . . . . . . . . . 8-38
viii
8.2.20 Kinetic curves of species in the reburning zone at SR2 = 0.99 for injection of800 ppm ammonia with a 0.1 s delay after the reburning fuel injected at1700 K . . . . . . . . . . . . . . . . . . . . . . . . . . . . . . . . . . . . . . . . . . . . . . . . . . . . . . . . . . 8-39
8.2.21 NO contribution factors for conditions of Figure 8.2.20 . . . . . . . . . . . . . . . . . . . 8-408.2.22 NO sensitivity coefficients for conditions of Figure 8.2.20 . . . . . . . . . . . . . . . . . 8-418.2.23 Effect of NH3 injection temperature and NH3 concentration in mixture I on
NO/TFN reduction . . . . . . . . . . . . . . . . . . . . . . . . . . . . . . . . . . . . . . . . . . . . . . . . 8-448.2.24 Effect of radicals co-injection with 500 ppm NH3 into mixture I, T2 = 1600 K . 8-458.2.25 Comparison of the promotion effect ofdifferent compounds . . . . . . . . . . . . . . . . 8-468.2.26 Modeling of the promotion effect at different predexponential factors A . . . . . . 8-478.2.27 Effect of O2 co-injection with 500 ppm NH3 into mixture I at different injection
temperatures . . . . . . . . . . . . . . . . . . . . . . . . . . . . . . . . . . . . . . . . . . . . . . . . . . . . . 8-498.2.28 Effect OFA co-injection with NH3 on the final NO concentration . . . . . . . . . . . 8-518.3.1 Kinetic curves of important species in the reburning zone at SR2 = 0.99 and
with mixing of the reburning fuel over an interval of 30 ms . . . . . . . . . . . . . . . . . 8-558.3.2 Kinetic curves of important species in the reburning zone at SR2 = 0.99 and
with mixing of the reburningfuel over an interval of 300 ms . . . . . . . . . . . . . . . . . 8-568.3.3 Kinetic curves of important species in the reburning zone at SR2 = 0.99 and
with mixing of the reburning fuel over an interval of 30 ms . . . . . . . . . . . . . . . . . 8-578.3.4 Kinetic curves of important species in the reburning zone at SR2 = 0.99 and
with mixing of the reburning fuel over an interval of 300 ms . . . . . . . . . . . . . . . . 8-588.3.5 AR-Rich NO emissions, for SR2 = 0.99 and NH3 added at NSR = 1 . . . . . . . . . . 8-598.3.6 AR-Lean NO emissions, for SR2 = 0.99 and NH3 added at the same time as
overfire air, at NSR = 1 . . . . . . . . . . . . . . . . . . . . . . . . . . . . . . . . . . . . . . . . . . . . . 8-608.3.7 AR-Lean NO emissions, for SR2 = 0.99 and NH3 added 0.1 s after burnout air
at NSR = 1 . . . . . . . . . . . . . . . . . . . . . . . . . . . . . . . . . . . . . . . . . . . . . . . . . . . . . . . 8-618.4.1 AR-Rich kinetic curves with instantaneous mixing, from the point of reburn
fuel injection with NH3 (NSR = 1) injected after 0.1 s. . . . . . . . . . . . . . . . . . . . . 8-638.4.2 AR-Rich kinetic curves with 30 ms mixing, from the point of reburn fuel
injection with NH3 (NSR = 1) injected after 0.1 s . . . . . . . . . . . . . . . . . . . . . . . . 8-648.4.3 AR-Rich kinetic curves with 300 ms mixing, from the point of reburn fuel
injection with NH3 (NSR = 1) injected after 0.1 s . . . . . . . . . . . . . . . . . . . . . . . . 8-658.4.4 NO and total fuel nitrogen before burnout for AR-Rich vs. mixing time,
NSR = 1.0 . . . . . . . . . . . . . . . . . . . . . . . . . . . . . . . . . . . . . . . . . . . . . . . . . . . . . . . 8-678.4.5 NO and total fuel nitrogen before burnout for AR-Rich vs. mixing time,
800 ppm NH3 added . . . . . . . . . . . . . . . . . . . . . . . . . . . . . . . . . . . . . . . . . . . . . . . 8-678.4.6 NO concentration prior to start of overfire air injection at 1300 K, as a
function of N-agent/promoter injection delay time . . . . . . . . . . . . . . . . . . . . . . . . 8-698.4.7 TFN concentration prior to start of overfire air injection at 1300 K, as a
function of N-agent/promoter injection delay time . . . . . . . . . . . . . . . . . . . . . . . . 8-698.4.8 Final NO concentration at 600 K, as a function of N-agent/promoter injection
ix

delay time . . . . . . . . . . . . . . . . . . . . . . . . . . . . . . . . . . . . . . . . . . . . . . . . . . . . . . . 8-708.4.9 Kinetic curves after NH3 (NSR = 1) injection in AR-Rich 500 ms after
reburn fuel, with and without 50 ppm . . . . . . . . . . . . . . . . . . . . . . . . . . . . . . . . . 8-728.4.10 Effect of promoter on NO exit concentrations for AR-Lean . . . . . . . . . . . . . . . . 8-778.4.11 AR-Lean kinetic curves with 30 ms mixing from the point of NH3 injection,
which is 0.1 s after OFA injection at 1280 K . . . . . . . . . . . . . . . . . . . . . . . . . . . . 8-798.4.12 AR-Lean kinetic curves with 30 ms mixing from the point of NH3 injection,
which is 0.1 s after OFA injection at 1380 K . . . . . . . . . . . . . . . . . . . . . . . . . . . . 8-819.1.1 Generalized design methodology for AR technologies . . . . . . . . . . . . . . . . . . . . . . 9-29.1.2 Schematic of case study boiler . . . . . . . . . . . . . . . . . . . . . . . . . . . . . . . . . . . . . . . . 9-39.1.3 Furnace heat transfer model set up . . . . . . . . . . . . . . . . . . . . . . . . . . . . . . . . . . . . . 9-69.1.4 Comparison of predicted and measured furnace gas temperatures . . . . . . . . . . . . . 9-79.1.5 Predicted bulk mean temperatures in upper furnace of case study boiler . . . . . . . . 9-89.1.6 Implementation of AR technologies on case study boiler . . . . . . . . . . . . . . . . . . . . 9-99.1.7 Projected impacts of AR processes on furnace exit gas temperature . . . . . . . . . . 9-119.1.8 Projected impacts of AR processes on carbon in ash . . . . . . . . . . . . . . . . . . . . . . 9-119.1.9 Projected impacts of AR processes on ASME heat loss efficiency . . . . . . . . . . . 9-129.1.10 Projected impacts of AR processes on steam temperatures . . . . . . . . . . . . . . . . . 9-139.1.11 Baseline flow field characteristics . . . . . . . . . . . . . . . . . . . . . . . . . . . . . . . . . . . . . 9-159.1.12 Dispersion pattern for preferred reburning fuel injector configuration . . . . . . . . . 9-169.1.13 Dispersion pattern for preferred overfire air port configuration . . . . . . . . . . . . . . 9-179.2.1 Isometric view of Greenridge Unit 4 showing gas reburning and AR-Lean
components external to the boiler . . . . . . . . . . . . . . . . . . . . . . . . . . . . . . . . . . . . . 9-209.2.2 Gas reburning and AR-Lean NOx data, Greenridge Unit 4 . . . . . . . . . . . . . . . . . . 9-229.3.1 Cyclone fired boiler NOx economics . . . . . . . . . . . . . . . . . . . . . . . . . . . . . . . . . . . 9-309.3.2 Wall fired boiler NOx economics . . . . . . . . . . . . . . . . . . . . . . . . . . . . . . . . . . . . . . 9-30
x

LIST OF TABLES
Table Page3.1 Performance of NOx control technologies . . . . . . . . . . . . . . . . . . . . . . . . . . . . . . . . 3-35.2.1 JANAF standard enthalpies of formation at 298 and 1500 K . . . . . . . . . . . . . . . . 5-95.2.2 JANAF standard enthalpies of formation at 298 and 1500 K . . . . . . . . . . . . . . . 5-105.2.3 Thermochemistry for breaking NaÑX bonds at 1500 K . . . . . . . . . . . . . . . . . . . 5-107.1 Comparison of NO reduction for hybrid AR-Lean/SNCR with gas and coal
firing . . . . . . . . . . . . . . . . . . . . . . . . . . . . . . . . . . . . . . . . . . . . . . . . . . . . . . . . . . . 7-257.2 Byproduct sampling conditions and results . . . . . . . . . . . . . . . . . . . . . . . . . . . . . 7-328.2.1 Comparison of NO reaction rates with C-radicals at SR2 = 0.99, T1 = 1700 K
and t = 2ms . . . . . . . . . . . . . . . . . . . . . . . . . . . . . . . . . . . . . . . . . . . . . . . . . . . . . . 8-178.4.1 Results of AR-Rich at different delay times . . . . . . . . . . . . . . . . . . . . . . . . . . . . . 8-718.4.2 Results of AR-Lean at different injection temperatures, with and without
sodium . . . . . . . . . . . . . . . . . . . . . . . . . . . . . . . . . . . . . . . . . . . . . . . . . . . . . . . . . . 8-789.3.1 Economic data . . . . . . . . . . . . . . . . . . . . . . . . . . . . . . . . . . . . . . . . . . . . . . . . . . . . 9-279.3.2 Evaluated NOx control technologies . . . . . . . . . . . . . . . . . . . . . . . . . . . . . . . . . . . 9-289.3.3 NOx control technology data . . . . . . . . . . . . . . . . . . . . . . . . . . . . . . . . . . . . . . . . . 9-289.3.4 Comparing cost effectiveness for deep NOx control . . . . . . . . . . . . . . . . . . . . . . . 9-319.3.5 Estimated market for AR technologies . . . . . . . . . . . . . . . . . . . . . . . . . . . . . . . . . 9-329.3.6 Total estimated AR market . . . . . . . . . . . . . . . . . . . . . . . . . . . . . . . . . . . . . . . . . . 9-33
xi
1.0 EXECUTIVE SUMMARY
In this project EER is developing second generation enhancements to Advanced Reburning (AR). AR is an NOx control technology which integrates reburning with injection of a nitrogen reducingagent (N-agent), two well known commercial NOx control technologies. Reburning involvesinjection of a hydrocarbon fuel above the burners to produce a fuel rich zone where NOx isreduced to elemental nitrogen. Overfire air is added to burn out combustibles. Reburning cantypically achieve about 60% NOx reduction in full scale applications. N-agent injection involvesthe injection of an N-agent such as ammonia or urea into high temperature gases in the convectivepass of a boiler where is reduces NOx to elemental nitrogen. The commercial version of thissystem is termed Selective Non-Catalytic Reduction (SNCR) and typically achieves 20-40%NOx reduction in full scale applications.
EER's original configuration of AR (now termed AR-Lean) was developed prior to this projectand is currently being demonstrated at full scale. AR-Lean is expected to achieve NOx reductionin the range of 75-85% in compatible boiler designs. This project is developing second generationAR (SGAR) systems which increase the NOx reduction to over 95% and broaden applicabilityto a wide range of boiler designs. This family of SGAR technologies includes variouscombinations of the following elements:
¥ Injection of a reburning fuel to produce slightly fuel-rich conditions in the reburn zonewhere a portion of the NOx reduction occurs.
¥ Injection of overfire at a lower temperature range than conventional reburning, typically(1250-1420¡K).
¥ N-agent injection at one or multiple locations: in the reburning zone, with overfire air, anddownstream of the overfire air injection to provide the remainder of the NOx reduction.
¥ Addition of water soluble promoter additives which enhance the effectiveness of theN-agent NOx reduction.
By selecting various combinations of these elements, the SGAR systems can be tailored to sitespecific boiler characteristics to achieve NOx control ranging from about 60% for reburning aloneto as high as 95% for the most complex SGAR system. These SGAR systems can meet the moststringent NOx control requirements of Title 1 of the Clean Air Act Amendment at considerablyless cost than Selective Catalytic Reduction, the only commercial NOx control technology whichcan achieve comparable NOx reduction. In addition, SGAR avoids the massive ductmodifications and catalyst replacement/disposal problems of SCR.
At the beginning of the project, EER proposed the development of three SGAR systems differingin the way in which the N-agent injection is integrated with reburning:
¥ Promoted Advanced Reburning - Lean (AR-Lean) -- This is the original AR configurationbut with a promoter added to the N-agent. The N-agent and promoter are injected with
1-1

the overfire air.
¥ Advanced Reburning - Rich (AR-Rich) -- Here, the N-agent is injected into the reburningzone with or without a promoter. This provides increased flexibility in locating theoverfire air ports to match the boiler convective pass configuration.
¥ Multiple Injection Advanced Reburning (MIAR) -- This involves two stages of N- agentinjection with promoters: in the reburning zone and with the overfire air. NOx reductionas high as 95% is achieved by three stages: reburning, rich injection of the N-agent andlean injection o the N-agent.
During the project, the family of SGAR systems was expanded with three additionalconfigurations:
¥ AR-Lean + SNCR -- This is the integration of the AR-Lean with conventional SNCRwhere the N-agent is injected downstream of the overfire air with a promoter.
¥ AR-Rich + SNCR -- This is the integration of AR-Rich with conventional SNCR wherethe N-agent is injected downstream of the overfire air with a promoter.
¥ Reburning + Promoted SNCR -- This is basic reburning followed by the promoted SNCRprocess.
This family of six SGAR configurations allows the NOx control system to be tailored to sitespecific requirements. Also, components can be added in building block fashion to increase NOx
reduction as the NOx regulations become more stringent over time.
This project is being conducted in two phases: Phase I -- Development of a DesignMethodology, and Phase II -- Process Optimization and Scale-up.
Phase I consists of the following six tasks:
Task 1.1 Project Coordination and Reporting/DeliverablesTask 1.2 Kinetics of Na2CO3 Reactions with Flue Gas ComponentsTask 1.3 0.1 x 10⁶ Btu/hr Optimization StudiesTask 1.4 1.0 x 10⁶ Btu/hr Process Development TestsTask 1.5 Mechanism Development and ModelingTask 1.6 Design Methodology and Application
This report presents the results of Phase I which was conducted over a period of two years. The objectives of Phase I were as follows:
1-2
1. Develop an understanding of the mechanisms through which promoter additives improveN-agent effectiveness.
2. Develop a kinetic analytical model of the Promoted and Multiple Injection ARtechnologies.
3. Optimize the SGAR processes using the analytical model and bench and pilot scaleexperiments under controlled mixing conditions.
4. Upgrade EER's AR design methodology to include the second generation advances.
The following Phase I technical performance goals were established in the Project ManagementPlan:
¥ NOx emissions from the 1.0 x 10⁶ Btu coal fired Boiler Simulator Facility should becontrolled to less than the requirements for post-RACT NOx control in the NortheastOzone Transport Region for the year 2003.
¥ The total estimated cost of controlling NOx emissions based on the 1.0 x 10⁶ Btu/yr coalfired tests should be less than that currently projected for SCR NOx control systems.
¥ SGAR should not cause a significant reduction in boiler efficiency or significant adverseenvironmental impacts compared to basic reburning and SNCR technologies.
All Phase I objectives and technical performance goals have been met or exceeded, and it wasdemonstrated that AR technologies can achieve high efficiency and low cost NOx control.
Initial parametric screening tests were conducted in a bench scale facility, followed by pilot scaledevelopmental studies. Experimental work was paralleled by kinetic modeling which provided ascientific understanding of the process, including the activity of N-agent promoters. Simultaneously, an experimental study was conducted to define the high-temperature chemistryof sodium carbonate under simulated flue gas conditions. The results were used for updating thekinetic model. The modeling used experimental data to define key process parameters,culminating in a design methodology for the eventual scale-up and implementation of thetechnologies.
A kinetic study on thermal decomposition of Na2CO3 was conducted in Task 1.2 using a flowsystem with Gas Chromatography (GC) and Mass-Spectrometry (MS) analysis of products. Itwas found that significant decomposition of Na2CO3 occurs on a one second time scale attemperatures between 900 and 1300 K. The main decomposition products were identified asCO2, Na atoms, and Na2O. The rate of Na2CO3 decomposition was measured as functions oftemperature, residence time, and initial Na2CO3 concentration. The decomposition of Na2CO3
1-3
from 900 to 1190 K was described kinetically in terms of two irreversible and one reversible
reactions: Na2CO3→Na2O+CO2; Na2O+CO2→Na2CO3; and Na2O+H2O<=>2NaOH.
In Task 1.3, 0.1 x 10⁶ Btu/hr combustion tests were conducted with natural gas as main andreburning fuel. The promoted AR-Lean process achieved about 86% NOx reduction at 10%reburning fuel heat input and only 15 ppm Na2CO3 in flue gas. The promoted AR-Rich processachieved 88% NOx reduction at 10% reburning fuel and 15 ppm Na2CO3. Thus, the presence ofNa2CO3 promotes the effect of both "lean" and "rich" N-agent injection. Several sodiumcompounds (Na2CO3, NaHCO3, and NaOH) were tested and achieved comparable promotioneffectiveness. In AR-Rich, NOx reduction was enhanced when the N-agent was injected into thereburning zone with a delay time after injection of the reburning fuel. The MIAR processachieved 90-91% NOx reduction in these bench scale tests and was expected to improve at largerscales since the injectors adversely affected the temperature profile in these small scale tests.
Task 1.4 involved 1.0 x 10⁶ Btu/hr tests in a Boiler Simulator Facility (BSF). Initial experimentswere performed with natural gas firing. In AR-Lean, injection of urea or ammonia with OFAprovided 45-82% NO reduction depending on the injection temperature. This was consistentwith previous EER research. Addition of 15 ppm of Na2CO3 promoter to the N-agent greatlyimproved NOx reduction. Performance was about equal for ammonia and urea with maximum of89-94%. In AR-Rich, similar NOx reduction was obtained for injection of ammonia and urea, 70-77%. However, addition of 15-25 ppm Na2CO3 significantly improved NOx reduction, up to94- 95%. Two N-agent injections (MIAR) demonstrated 78-82% NOx reduction without sodiumand up to 98% NOx reduction, with 15 ppm Na2CO3. This was the maximum NOx reductionachieved by AR systems.
Experiments were also conducted with coal firing. The results showed that the AR technologiescan provide up to 95% NOx control for a high-sulfur coal-fired combustor. The NOx reductiondue to N-agent injection was higher, but the effect of sodium promotion was lower in comparisonwith gas firing. Na2CO3 was found to promote performance only by 5-8 percentage points whenadded at 75 ppm. Maximum NOx reductions achieved by the promoted AR technologies withcoal firing were 90% for AR-Lean, 93% for AR-Rich, and 95% for MIAR. Three other ARmodifications: AR-Lean+Promoted SNCR, AR-Rich+Promoted SNCR, andReburning+Promoted SNCR, provided up to 95, 92, and 93% NOx reduction, respectively.
A separate study was then conducted to evaluate byproducts emissions from different ARvariants in comparison with basic reburning and SNCR. The following emissions werecharacterized: NOx, CO, CO2, O2, SO2, N2O, total hydrocarbons, NH3, HCN, SO3, fly ash massloading, size distribution, PM10, PM2.5, and carbon in ash. The results showed that in mostconfigurations AR technologies have less byproduct emissions than basic reburning and SNCRprocesses under similar operating conditions.
1-4
In Task 1.5, a reaction mechanism, including 355 reactions of 65 chemical species, was developedto characterize the chemical processes of reburning and AR. The mechanism consists ofC-H-O-N submechanism (GRI-Mech-2.11, no variation of rate constants) and submechanismsdescribing SNCR chemistry, and reactions of sodium, sulfur, and chlorine. Modeling wasperformed using three kinetic programs: Chemkin-2, Senkin (developed by Sandia NationalLaboratories) and EER's One Dimensional Flame code (ODF). Modeling was capable ofpredicting major reaction trend, qualitatively describing AR processes, and, in some cases, wasclose to quantitative process description. Modeling explained why the delayed ammoniainjection into the reburning zone is capable of reducing NO concentration and why certainadditives, such as oxygen and active radicals, can promote the NO-NH3 interaction in thereburning zone. Modeling also described the NO-NH3 interaction in the burnout zone. Asensitivity analysis was conducted which revealed the most significant elementary reactionsaffecting formation and destruction of fuel-N compounds in the reburning zone under variousconditions. Modeling with different mixing times demonstrated the importance of delayed mixingmodes for efficient NOx reduction. Modeling explained the effect of sodium promoters underboth fuel-rich and fuel-lean conditions. Sodium reactions can affect NOx control by decreasing orincreasing the radical pool when it is needed. The radicals in turn can react with NH3 to formNH 2 species which reduce NO to molecular nitrogen. The effect of promoters is mostpronounced in systems with long characteristic mixing times, as is typical in full-scale industrialapplications.
In Task 1.6, EER's reburning design methodology was expanded to SGAR and an economic andmarket assessment was conducted. To demonstrate the applicability of the methodology, it wasapplied to a typical 100 MW coal-fired utility boiler with tangentially firing burners, resulting indevelopment of conceptual designs for several second generation AR systems, and predictions oftheir impacts on boiler NOx emissions and operating performance. Thermal performance modelswere used to evaluate the impacts of implementing AR processes on the thermal performance ofthe boiler. For implementation of AR-Lean, AR-Rich, or MIAR processes, the reburning fuelwould be injected into the lower furnace and the overfire air would be injected into the upperfurnace in a cavity between the first two tube banks of the convective pass. The overall boilerefficiency for operation with an AR system is similar to that for operation with a basic gasreburning system. The results of the analysis are specific to the boiler configuration evaluated andshould not be generalized to other boiler designs. The results of injection system analysisindicate that good mixing of the process streams necessary to implement advanced reburning(AR-Lean, AR-Rich, and MIAR) on the case study boiler can be achieved. Natural gas can beinjected from each wall in a pattern which achieves good distribution of the reburning fuel.Overfire air injection into a cavity in the convective pass, needed for implementation of each ofthe AR processes under consideration, can be achieved using high pressure wall jets. For theAR-Lean and MIAR processes, these ports can also be used to inject the reagent. Injection ofreagent into the upper furnace, needed for the AR-Rich and MIAR processes, can be achievedusing a lance-based system. Full scale NOx reduction level is predicted to be above 90% and canbe additionally increased with the use of promoters.
1-5
The original work scope for this task was based on applying the design methodology to ahypothetical case study; however, it was hoped that an initial AR demonstration could bedeveloped in parallel with Phase I (outside the scope of this DOE project) to allow application toa real unit and evaluation of some of the SGAR elements. EER was successful in developing aninitial AR demonstration project. In 1995 EER installed AR-Lean on a 105 MW tangentiallyfired boiler. Initial AR testing was conducted in 1996 and will continue through 1998. This unitwas used as the basis for extending the design methodology. AR-Lean tests on the boiler showedthat stratification within the reburn zone could adversely affect the performance. Regions ofinadequate CO in the reburning zone reduced the N-agent NOx control and caused NH3 slip. While modifications were successful in reducing stratification, this experience shows theimportance of mixing and scale up, two factors to be evaluated in Phase II. In addition to theseAR-Lean tests, opportunity was taken to obtain preliminary larger scale data on several of theSGAR components including N-agent injection into the reburning zone, N-agent injectiondownstream of the reburning zone in an SNCR mode, and N-agent injection into the reburningzone and with the overfire air.
An economic analysis was conducted comparing SGAR technologies using gas and coal asreburning fuels with SCR for two representative Title 1 CAAA applications: a cyclone firedboiler and a wall fired boiler equipped with low NOx burners. The analysis was based on theEPRI Technology Assessment Guide (TAG) methodology which evaluates the total annuallevelized cost including capital and operating cost components ($/ton). The unit cost of NOx
control ($/ton) is also calculated. Depending on the specific application, SGAR offers total costreductions of 48 to 69% over SCR. The market for AR technologies is estimated to be above$1.5 billion.
Additional work is needed in Phase II to move the technology to a demonstration stage. Inparticular, the following steps are necessary to optimize and scale up the SGAR technologies:
¥ Identify alternative promoters based on the promotion mechanisms developed in Phase I.¥ Identify and test coal mineral compounds responsible for the increased NOx reduction in
AR-Rich and MIAR with coal firing (about 10% higher than for gas firing).¥ Optimize mixing (reburn fuel, N-agents, OFA) via combined chemistry/mixing models.¥ Optimize N-agent injection to maximize NOx reduction with negligible ammonia slip.¥ Evaluate the effect of N-agent/promoter mixing times representative of full scale.¥ Optimize SGAR with new promoters and mixing regimes at 1 x 10⁶ Btu/hr scale.¥ Scale up and confirm the design methodology via 10 x 106 Btu/hr Proof-of- Concept tests
and limited component tests during the ongoing boiler AR tests.¥ Update the economic and market analysis to confirm the advantages of SGAR.
1-6

2-1
2.0 INTRODUCTION
This project develops a family of novel Advanced Reburning (AR) NOx control technologies, which
have the potential to achieve 95% NOx control in coal fired boilers at a significantly lower cost than
Selective Catalytic Reduction (SCR). AR systems integrate basic reburning and N-agent injection
(typically ammonia or urea). Specific features of the new AR systems in comparison with basic
reburning include:
• Low heat input of reburn fuel to provide slightly fuel-rich conditions in the
reburning zone.
• N-agent injection at one or two locations, including in the reburning zone, along
with overfire air, and/or downstream of the overfire air injection.
• Low temperature of overfire air injection (1250-1400 K).
• Injection of promoter additives which enhance the effectiveness of the N-agent.
Phase I consists of six tasks:
Task 1.1 Project Coordination and Reporting/Deliverables
Task 1.2 Kinetics of Na2CO3 Reactions with Flue Gas Components
Task 1.3 0.1 x 10⁶ Btu/hr Optimization Studies
Task 1.4 1.0 x 10⁶ Btu/hr Process Development Tests
Task 1.5 Mechanism Development and Modeling
Task 1.6 Design Methodology and Application
The project is currently in schedule, about 94% of the planned activities are completed, and all
project objectives and technical performance goals have been met or exceeded. The project work
under Tasks 1.2 and 1.6 is underway, however, these results will not change the main conclusions.
2-2
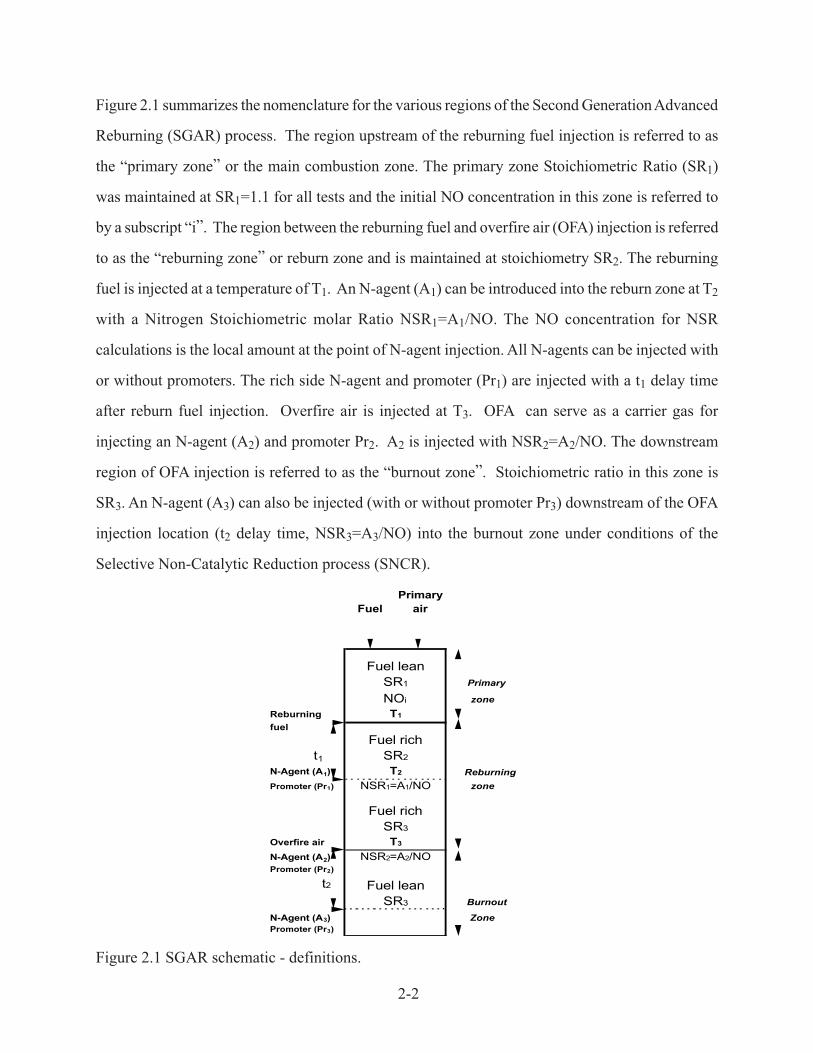
Figure 2.1 summarizes the nomenclature for the various regions of the Second Generation Advanced
Reburning (SGAR) process. The region upstream of the reburning fuel injection is referred to as
the “primary zone” or the main combustion zone. The primary zone Stoichiometric Ratio (SR1)
was maintained at SR1=1.1 for all tests and the initial NO concentration in this zone is referred to
by a subscript “i”. The region between the reburning fuel and overfire air (OFA) injection is referred
to as the “reburning zone” or reburn zone and is maintained at stoichiometry SR2. The reburning
fuel is injected at a temperature of T1. An N-agent (A1) can be introduced into the reburn zone at T2
with a Nitrogen Stoichiometric molar Ratio NSR1=A1/NO. The NO concentration for NSR
calculations is the local amount at the point of N-agent injection. All N-agents can be injected with
or without promoters. The rich side N-agent and promoter (Pr1) are injected with a t1 delay time
after reburn fuel injection. Overfire air is injected at T3. OFA can serve as a carrier gas for
injecting an N-agent (A2) and promoter Pr2. A2 is injected with NSR2=A2/NO. The downstream
region of OFA injection is referred to as the “burnout zone”. Stoichiometric ratio in this zone is
SR3. An N-agent (A3) can also be injected (with or without promoter Pr3) downstream of the OFA
injection location (t2 delay time, NSR3=A3/NO) into the burnout zone under conditions of the
Selective Non-Catalytic Reduction process (SNCR).
Figure 2.1 SGAR schematic - definitions.
PrimaryFuel air
Fuel leanSR1 Primary
NOi zone
Reburning T1
fuel
Fuel rich t1 SR2
N-Agent (A1) T2 Reburning
Promoter (Pr1) NSR1=A1/NO zone
Fuel richSR3
Overfire air T3
N-Agent (A2) NSR2=A2/NOPromoter (Pr2)
t2 Fuel leanSR3 Burnout
N-Agent (A3) ZonePromoter (Pr3)
3.0 BACKGROUND
3.1 High Efficiency NOx Control under Title 1 of the CAAA
Title 1 of the Clean Air Act Amendment (CAAA) of 1990 requires NOx controls in ozone non-
attainment areas. The initial Title 1 regulations, implemented over the last few years, required
Reasonably Available Control Technologies (RACT). In most areas, the NOx levels for RACT
are based on Low NOx Burners (LNB) and are in the range of 0.4 to 0.5 lb/106 Btu. As a result,
there has been little industry demand for higher efficiency and more expensive NOx controls such
as reburning, SNCR, and SCR. However, the current RACT requirements are not the end of NOx
regulations. Much more stringent NOx control will be required to bring many of the ozone non-
attainment areas into compliance, particularly in the Northeast. The post-RACT requirements
are based, to a large extent, on SCR, the commercial technology with the highest NOx control
efficiency.
With SCR, NOx is reduced to N2 by reactions with N-agents on the surface of a catalyst. The
SCR process effectively uses the N-agent. Injection at a NSR of 1.0 typically achieves about
80% NOx reduction (i.e., 80% N-agent utilization). SCR is fully commercial in Europe and Japan
and there are a few US installations. This is the reason for its extensive use as the basis of NOx
control requirements for post-RACT.
Since the post-RACT NOx control requirements are largely based on SCR, achieving the required
NOx levels with SCR is relatively easy. However, SCR is far from an ideal utility solution.
There are several important problems, and cost leads the list. SCR requires a catalyst in the flue
gas exhaust stream. This large catalyst, and its related installation and boiler modifications, are
expensive. As SCR technology has advanced over the last decade, the cost has decreased;
however, at present, the initial cost of an 80% NOx control SCR system for a coal fired boiler is
3-1

still about a factor of four greater than that of LNB. Increasing the NOx control to 95%
approximately doubles the SCR system cost.
In addition, the SCR catalyst life is limited. Catalyst deactivation, through a number of
mechanisms, typically limits catalyst life to about 4 years for coal fired applications. SCR
catalysts are also toxic and, therefore, pose disposal problems. Since the catalyst is the major
cost element in the SCR system, catalyst replacement and disposal contributes heavily to the
total cost of NOx control.
Thus, there is a need for a high efficiency, low cost NOx control which utilities could apply to
meet post-RACT NOx control requirements without the problems of SCR discussed above.
Ideally, such a technology would meet the following requirements:
1. NOx control comparable or greater than SCR;
2. Low capital cost compared to SCR;
3. Total cost of NOx control ($/ton) low compared to SCR and ideally comparable to LNB;
4. Compatible with all types of coal fired units (wall, tangential and cyclone fired);
5. Minimal plant modifications and no requirement to re-route and treat the entire flue gas
stream;
6. No major components with limited life (such as the SCR catalyst);
7. No additional emissions of air toxics, criteria pollutants, or toxic solid or liquid waste
materials;
8. Ability to integrate with technologies for controlling other pollutants, such as SO2, air
toxics and with projected CO2 control strategies;
9. Minimal impact on boiler efficiency and operations; and
10. Flexibility to achieve the required level of control with potential to readily implement
add-on controls to reach more stringent control levels if required.
3-2

3.2 Limitations of Available NOx Control Technologies for Post-RACT Applications
The suitability of AR for post-RACT applications can best be appreciated by comparing it with
the currently available NOx control technologies. Table 3.1 shows the typical performance for a
range of conventional NOx controls applied to a pulverized coal fired boiler with baseline
emissions of 1.0 lb/106 Btu. Both the applicability of specific NOx controls and their
performance depend heavily on site specific factors. While the values in the table are generally
representative of state of the art performance, each installation will be different.
Table 3.1. Performance of NOx control technologies.
Technology Nominal PerformanceFor Baseline NOx 1.0 lb/106 Btu
NOx Reduction (%) NOx Emission (lb/106
Btu)
Low NOx Burners 30-50 0.5-0.7
Low NOx Burners + Overfire Air 50-60 0.4-0.5
Reburning 50-70 0.3-0.5
Selective Non-Catalytic Reduction(SNCR)
40-70 0.3-0.6
Selective Catalytic Reduction (SCR) 80 0.2
AR systems (projected) 80-95 0.05-0.2
Low NOx burners and overfire air (OFA) provide only modest NOx control. However, their
capital costs are low and, since no reagents are required, their operating costs are near zero. This
has made them the technologies of choice for the modest NOx control required under Title 4 and
the initial RACT under Title 1 of the CAAA. However, alone, they cannot approach the NOx
control required for post-RACT or the 90-95% NOx control goal of the near future.
For deeper NOx control, reburning, SNCR or SCR can be added to low NOx burners and OFA, or
3-3

installed as stand alone systems. Reburning controls NOx via fuel staging. The main portion of
the fuel is fired through the conventional burners with a small portion of the fuel injected into the
furnace above the burners. The result is a fuel rich "reburning zone" where NOx is reduced by
reactions with active radicals formed during interaction of the reburn fuel and oxygen from the
main combustion zone. Reburning, alone, can achieve only 50-70% NOx control and, hence, may
not be a candidate for most post-RACT applications.
The reaction of N-agents with NOx can proceed without a catalyst at high temperatures. This is
the SNCR process. It is effective over a narrow "temperature window" centered about 1250 K
where the N-agent forms NH2 radicals which react with NO. The NH2 radicals are formed from
the N-agent via interaction with radicals, e.g.
NH3 + OH → NH2 + H2O and NH3 + H → NH2 + H2
The NH2 species can reduce NO to molecular nitrogen
NH2 + NO → N2 + H2O
Under ideal laboratory conditions, deep NOx control can be achieved; however, in practical, full
scale installations, the non-uniformity of the temperature profile, difficulties of mixing the
N-agent across the full boiler cross section, limited residence time for reactions, and ammonia
slip, limit SNCR's effectiveness to about 40%. For typical SNCR conditions with a NSR of 1.5
and 40% NOx control, the N-agent utilization is only 27%. Thus, while SNCR does not require a
catalyst, and, therefore, has a low capital cost compared to SCR, it requires about four times as
much N-agent resulting in higher operating costs.
In summary, the NOx control technologies listed above all have limitations which may prevent
3-4
them from successfully achieving cost effective post-RACT compliance.
3.3 Advanced Reburning
The conventional AR process is an EER patented (Seeker et al., 1992) synergetic integration of
basic reburning and N-agent injection. In this process, an N-agent is injected along with the OFA
and the reburning system is adjusted to optimize the NOx reduction due to the N-agent. By
adjusting the reburning fuel injection rate to achieve near stoichiometric conditions (instead of the
fuel rich conditions normally used for reburning), the CO level is controlled and the temperature
window for selective NOx reduction is broadened and deepened. The reburning fuel is reduced
from about 20 to about 10% which has considerable economic benefits (the incremental cost of
gas for gas reburning and the cost of the coal pulverization equipment for coal reburning). With
AR, the NOx control due to reburning is somewhat reduced, however, this reduction is offset by
the significant enhancement of the N-agent NOx control.
The AR process was developed by EER as part of a DOE program (Chen et al., 1989) focusing
on the optimization of basic reburning. Tests were conducted over a range of scales (up to 10 x
106 Btu/hr) and achieved above 80% NOx control. An AR design methodology was developed by
extending EER's reburning design methodology. Conventional AR is now being demonstrated at
the NYSEG 105 MW Greenidge Station.
3.4 Second Generation Advanced Reburning (SGAR)
Improved versions of the conventional AR process are under development at EER since 1993.
They were first predicted by kinetic modeling and then confirmed by 300 kW combustion tests
via EER in-house R&D funds. The SGAR systems have the potential to achieve 95% NOx
control on all types of coal fired boilers without massive hardware changes, without increasing air
toxic and toxic waste problems, and at a cost for NOx control on the order of half that of SCR.
3-5
These systems will provide flexible installations that allow NOx levels to be lowered as new
elements of the technology become available. The SGAR systems incorporate several
improvements over conventional AR, such as:
¥ N-agent injection into the reburning zone;
¥ Promoter additives which enhance the effectiveness of the N-agent; and
¥ Injection of N-agents with or without promoters at two locations.
Sodium salts, in particular sodium carbonate (Na2CO3) were identified as effective AR
promoters. By integrating these improvements with conventional AR, NOx control can be
increased to 90-95% for cyclone units and even higher for pulverized coal fired units (wall and
tangentially fired) where AR can be further integrated with low NOx burners and overfire air.
This family of AR technologies is intended for post-RACT applications in ozone non-attainment
areas where NOx control in excess of 80% is required.
Three SGAR systems were originally proposed to DOE under the 1994 PRDA solicitation.
They include:
¥ Promoted Advanced Reburning - Lean (AR-Lean) - conventional AR (N-agent injected
with the OFA) which can be used with a promoter added to the agent.
¥ Advanced Reburning - Rich (AR-Rich) - N-agent injection with or without a promoter
into the reburning zone.
¥ Multiple Injection Advanced Reburning (MIAR) - N-agents with promoters injected in
two locations: within the reburning zone and with the OFA.
3-6

4-1
4.0 PHASE I PROGRAM OBJECTIVES
The overall objective of Phase I was to demonstrate the effectiveness of the SGAR technologies at
bench and pilot scale over a sufficiently broad range of conditions to provide all of the information
needed for process optimization and scale up. The Phase I program is conducted over a two year
period. Specific program objectives were as follows:
1. Develop an understanding of the mechanisms through which promoter additives improve
N-agent effectiveness;
2. Develop a kinetic analytical model of the Promoted and Multiple Injection AR technolo-
gies;
3. Optimize the SGAR processes using the analytical model and bench and pilot scale
experiments under controlled mixing conditions; and
4. Upgrade EER’s AR design methodology to include the second generation advances.
Phase I project determines the ability of the SGAR technologies to meet the following technical
performance goals:
• NOx emissions from the 1 x 10⁶ Btu/hr coal fired Boiler Simulator Facility controlled to
less than the requirements for post-RACT NOx control in the NESCAUM area for the
year 2003;
• Total estimated cost of controlling NOx emissions based on the 1 x 10⁶ Btu/hr coal fired
tests less than that currently projected for SCR NOx control systems; and
• No significant reduction in boiler efficiency or significant adverse environmental impacts
when compared to current reburning and SNCR technologies.
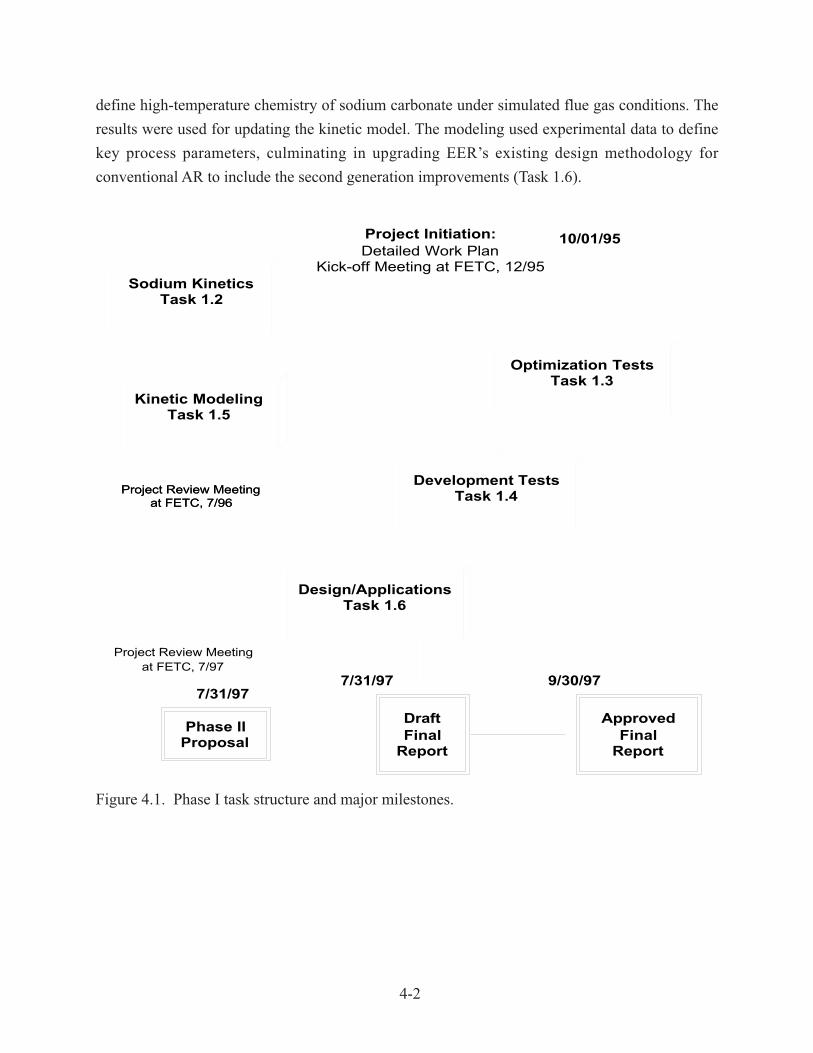
Figure 4.1 shows the task structure and the major milestones for the program. Task 1.1, Project
Coordination and Reporting/Deliverables, coordinates the efforts of the Key Personnel involved
with the project so that the objectives of this project are met: on time, on specification, and on
budget. Phase I experimental work started from parametric screening tests at a bench scale facility
(Task 1.3), followed by pilot scale developmental studies (Task 1.4). The Phase I program utilized
two EER test facilities providing nominal thermal capacities of 0.1 and 1 x 10⁶ Btu/hr. The
experimental work was paralleled by kinetic modeling (Task 1.5) which provided a scientific
understanding of the process, including the activity of N-agent promoters. A detailed reaction
mechanism of the SGAR processes was developed based on available combustion chemistry data.
Simultaneously, an experimental study (Task 1.2) was conducted at the University of Texas to
4-2
define high-temperature chemistry of sodium carbonate under simulated flue gas conditions. The
results were used for updating the kinetic model. The modeling used experimental data to define
key process parameters, culminating in upgrading EER’s existing design methodology for
conventional AR to include the second generation improvements (Task 1.6).
Figure 4.1. Phase I task structure and major milestones.
Project Initiation:Detailed Work Plan
Kick-off Meeting at FETC, 12/95Sodium Kinetics
Task 1.2
Kinetic ModelingTask 1.5
Optimization TestsTask 1.3
DraftFinal
Report
9/30/97
ApprovedFinal
Report
7/31/97
Phase IIProposal
7/31/97
10/01/95
Development TestsTask 1.4
Design/ApplicationsTask 1.6
Project Review Meetingat FETC, 7/96
Project Review Meetingat FETC, 7/96
Project Review Meetingat FETC, 7/97
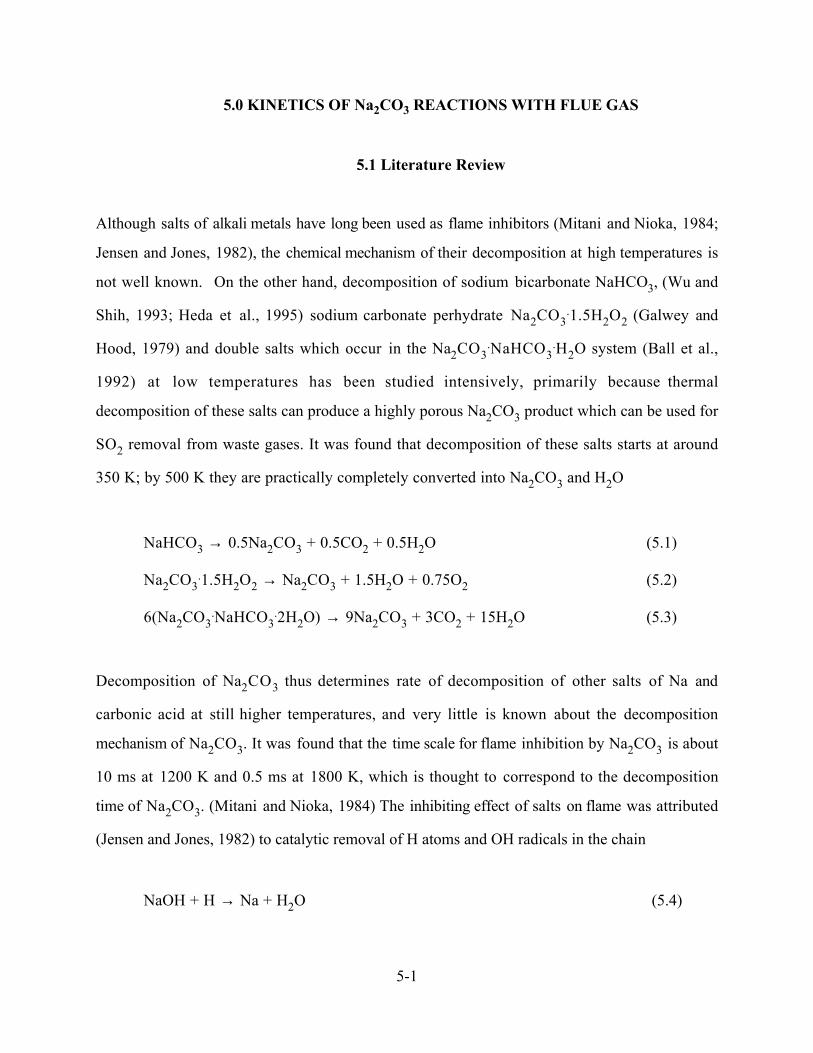
5.0 KINETICS OF Na2CO3 REACTIONS WITH FLUE GAS
5.1 Literature Review
Although salts of alkali metals have long been used as flame inhibitors (Mitani and Nioka, 1984;
Jensen and Jones, 1982), the chemical mechanism of their decomposition at high temperatures is
not well known. On the other hand, decomposition of sodium bicarbonate NaHCO3, (Wu and
Shih, 1993; Heda et al., 1995) sodium carbonate perhydrate Na2CO3.1.5H2O2 (Galwey and
Hood, 1979) and double salts which occur in the Na2CO3.NaHCO3
.H2O system (Ball et al.,
1992) at low temperatures has been studied intensively, primarily because thermal
decomposition of these salts can produce a highly porous Na2CO3 product which can be used for
SO2 removal from waste gases. It was found that decomposition of these salts starts at around
350 K; by 500 K they are practically completely converted into Na2CO3 and H2O
NaHCO3 → 0.5Na2CO3 + 0.5CO2 + 0.5H2O (5.1)
Na2CO3.1.5H2O2 → Na2CO3 + 1.5H2O + 0.75O2 (5.2)
6(Na2CO3.NaHCO3
.2H2O) → 9Na2CO3 + 3CO2 + 15H2O (5.3)
Decomposition of Na2CO3 thus determines rate of decomposition of other salts of Na and
carbonic acid at still higher temperatures, and very little is known about the decomposition
mechanism of Na2CO3. It was found that the time scale for flame inhibition by Na2CO3 is about
10 ms at 1200 K and 0.5 ms at 1800 K, which is thought to correspond to the decomposition
time of Na2CO3. (Mitani and Nioka, 1984) The inhibiting effect of salts on flame was attributed
(Jensen and Jones, 1982) to catalytic removal of H atoms and OH radicals in the chain
NaOH + H → Na + H2O (5.4)
5-1
Na + OH + M → NaOH + M (5.5)
While Na atoms in flames have been studied for years, (Carabetta and Kaskan, 1968; Hynes et
al., 1984; Srinivasachar et al., 1990; Schofield and Steinberg, 1992) their reaction mechanisms are
not well understood, and the rate coefficients of some important reactions are not known.
Apparently Na, NaO, NaO2, and NaOH are coupled to one another in flames by fast reactions
which rapidly interconvert one species to another as conditions vary. (Hynes et al., 1984;
Schofield and Steinberg, 1992) Analysis of Na influences on H2ÐO2ÐN2 flames led to the
conclusion that the Na chemistry is largely controlled by
Na + H2O → NaOH + H (5.6)
Na + O2 + M → NaO2 + M (5.7)
NaO2 + H → NaO + OH (5.8)
NaOH + OH → NaO + H2O (5.9)
At temperatures above 2300 K the main channel for Na disappearance is reaction (5.6). As
temperature decreases, however, the importance of NaO2 increases and the predominant
depletion of sodium is via reaction (5.7). Kaskan (1971) concluded that reaction (5.7) is the
dominant Na oxidation process in lean H2ÐO2ÐN2 flames at temperatures from 1400 to 1700 K.
Other observations also support NaO2 as an important intermediate species at temperatures
below 1900 K. (McEwan and Phillips, 1966) However, contradictory values of the rate
coefficient for the reaction (5.7) have been reported. (Kaskan, 1971; McEwan and Phillips, 1966;
Husain and Plane, 1982)
Ho et al. (1993) and Chen et al. (1993) considered the feasibility of using sodium (a
representative alkali metal) salts to control N2O emissions from combustion sources. Perry and
Miller (1996) investigated this process by dynamic modeling and concluded that the key reaction
5-2
is
Na + N2O → NaO + N2 (5.10)
where sodium atoms are produced by the reverse of reaction (5.6). This explanation, however, is
not the only possible one. The same effect of N2O removal could be explained by the reaction
N2O + OH → N2 + HO2 (5.11)
since sodium hydroxide additive enhances production of active species like OH (reaction (5.5))
already present in exhaust gases.
The literature review thus shows that practically no information is available about the rate of
Na2CO3 decomposition at high temperatures. The active species formed during decomposition
are not well defined either, and as a result the mechanism of Na2CO3 influences on high
temperature chemistry is essentially unknown.
5.2 Thermodynamics of Sodium in Combustion Flue Gas
5.2.1 The Solid to Gas-Phase Transition
Sodium carbonate melts at 1120 K and is relatively stable at still more elevated
temperaturesÑaccording to a textbook of inorganic chemistry (Bailar et al. 1973) it does not
decompose until 1220 K. Thermodynamic calculations based on the EER thermochemical data
base show that ÆrGû for the reaction
Na2CO3 ↔ Na2O + CO2 (5.12)
5-3
changes sign from positive to negative in the temperature range 2400Ð2500 K (Figure 5.2.1),
making reaction (5.12) ÒspontaneousÓ only at temperatures above 2400 K. Since the most
common way to supply Na2CO 3 is as an aqueous solution, one also has to consider the
spontaneity of
Na2CO3 + H2O ↔ 2NaOH + CO2 (5.13)
Figure 5.2.1 shows that reaction (5.13) becomes spontaneous (in the sense that PCO2 is greater
than PH2O) at temperatures above 2000 K. Thermodynamic calculations thus show that reactions
(5.12) and (5.13) for all species in their standard states are not spontaneous at temperatures
normally achieved in the flow system, i.e., less than 1400 K. This statement does not mean,
however, that at low Na2CO3 concentrations significant conversion of Na2CO3 to products can
not be achieved. The equilibrium partial pressure of CO2 in reaction (5.12) over the surface of
liquid or solid Na2CO3 calculated using values of ÆrGû from Figure 5.2.1 is equal to 0.01 Torr at
1400 K. The statement Òreaction (5.12) is not spontaneous at 1400 KÓ means that Na2CO3
decomposes at that temperature only until the partial pressure of CO2 reaches 0.01 Torr. Thus if
the amount of Na2CO3 is very small, all of it might decompose and the partial pressure of CO2
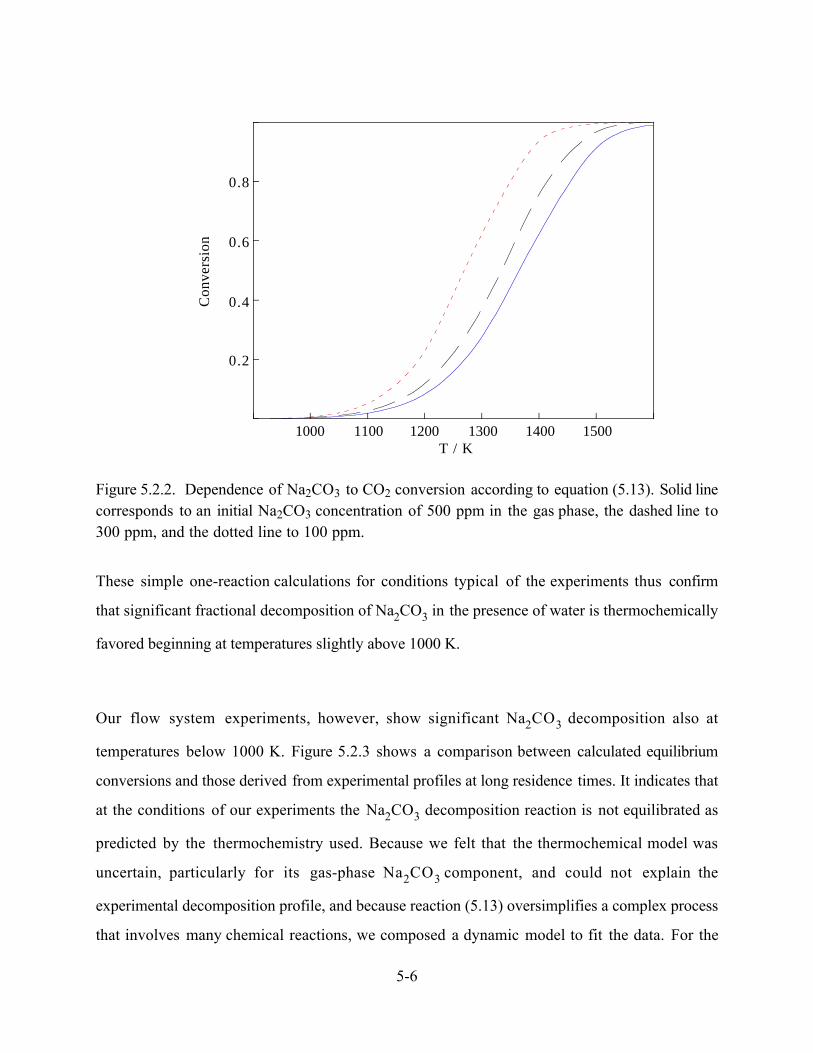
still be less than 0.01 Torr. Figure 5.2.2 illustrates this idea by showing how Na2CO3 to CO2
conversion (based on equation (5.13)) at chemical and phase equilibrium at a total pressure of 1
atmosphere depends on temperature at initial Na2CO3 concentrations of 100, 300 and 500 ppm,
typical concentrations used in our flow system experiments and proposed for pollution control
in flue gas. The assumed amount of H2O in the mixture is 20%, the rest is N2. Conversion in
Figure 5.2.2 is defined as the concentration ratio [CO2]/[Na2CO3]0, where [Na2CO3]0 is the
initial concentration of sodium carbonate. The calculations were performed using the EER
thermochemistry data base and the NASA program CET89 (Feitelberg, 1994), which calculates
chemical equilibrium compositions taking into account both gaseous and condensed-phase
reactants and products. It is clear from Figure 5.2.2 that significant decomposition of Na2CO3
5-4
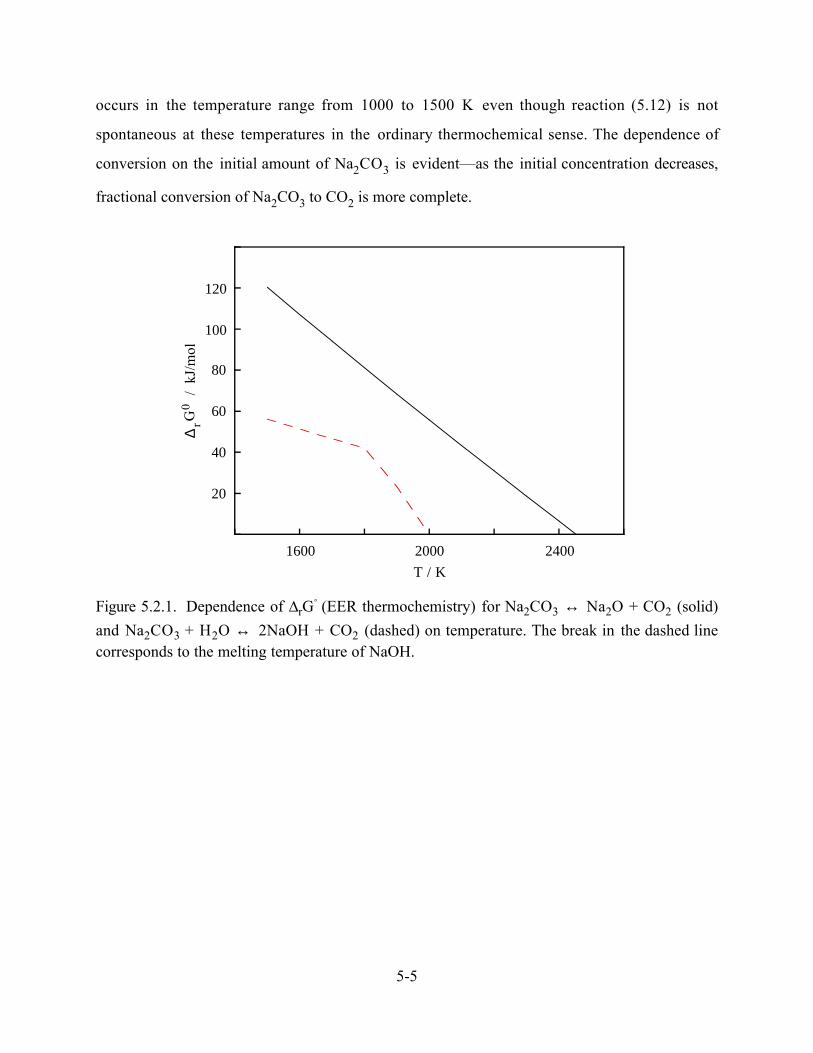
occurs in the temperature range from 1000 to 1500 K even though reaction (5.12) is not
spontaneous at these temperatures in the ordinary thermochemical sense. The dependence of
conversion on the initial amount of Na2CO3 is evidentÑas the initial concentration decreases,
fractional conversion of Na2CO3 to CO2 is more complete.
20
40
60
80
100
120
1600 2000 2400
∆rG
0 /
kJ/
mol
T / K
Figure 5.2.1. Dependence of ÆrGû (EER thermochemistry) for Na2CO3 ↔ Na2O + CO2 (solid)
and Na2CO3 + H2O ↔ 2NaOH + CO2 (dashed) on temperature. The break in the dashed linecorresponds to the melting temperature of NaOH.
5-5
0.2
0.4
0.6
0.8
1000 1100 1200 1300 1400 1500
Con
vers
ion
T / K
Figure 5.2.2. Dependence of Na2CO3 to CO2 conversion according to equation (5.13). Solid linecorresponds to an initial Na2CO3 concentration of 500 ppm in the gas phase, the dashed line to300 ppm, and the dotted line to 100 ppm.
These simple one-reaction calculations for conditions typical of the experiments thus confirm
that significant fractional decomposition of Na2CO3 in the presence of water is thermochemically
favored beginning at temperatures slightly above 1000 K.
Our flow system experiments, however, show significant Na2CO3 decomposition also at
temperatures below 1000 K. Figure 5.2.3 shows a comparison between calculated equilibrium
conversions and those derived from experimental profiles at long residence times. It indicates that
at the conditions of our experiments the Na2CO3 decomposition reaction is not equilibrated as
predicted by the thermochemistry used. Because we felt that the thermochemical model was
uncertain, particularly for its gas-phase Na2CO3 component, and could not explain the
experimental decomposition profile, and because reaction (5.13) oversimplifies a complex process
that involves many chemical reactions, we composed a dynamic model to fit the data. For the
5-6
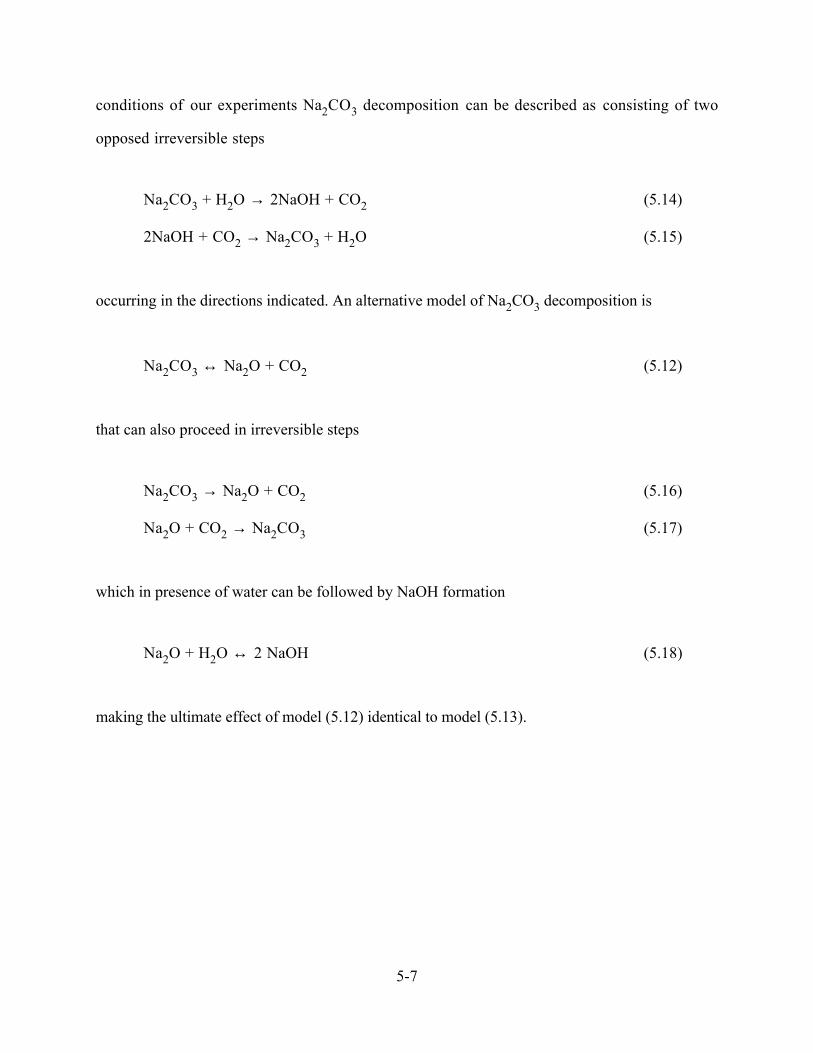
conditions of our experiments Na2CO3 decomposition can be described as consisting of two
opposed irreversible steps
Na2CO3 + H2O → 2NaOH + CO2 (5.14)
2NaOH + CO2 → Na2CO3 + H2O (5.15)
occurring in the directions indicated. An alternative model of Na2CO3 decomposition is
Na2CO3 ↔ Na2O + CO2 (5.12)
that can also proceed in irreversible steps
Na2CO3 → Na2O + CO2 (5.16)
Na2O + CO2 → Na2CO3 (5.17)
which in presence of water can be followed by NaOH formation
Na2O + H2O ↔ 2 NaOH (5.18)
making the ultimate effect of model (5.12) identical to model (5.13).
5-7

0.2
0.4
0.6
0.8
900 1000 1100 1200 1300 1400
Con
vers
ion
T / K
Figure. 5.2.3. Comparison between experimental and calculated (Feitelberg, 1994) equilibriumconversions of Na2CO3 to CO2. The initial concentration of Na2CO3 was 300 ppm.
5.2.2 Available Thermodynamic Data on Sodium in the Gas-Phase
The documented gas-phase thermochemistry of sodium compounds is sparse. The 1985 JANAF
table provides for non-halogen neutral compounds the information shown in Table 5.2.1. The
tabulated enthalpy of formation values for 1500 K can be combined with the 1500 K values for
the radicals H, O, OH and CN and the stable molecules HCN, H2, H2O and H2SO4 to derive the
bond strengths of the sodium bonds in these molecules and the enthalpy changes of reaction for
the key atom exchange reactions that establish the equilibrium composition of high temperature
systems containing sodium. The JANAF values for these species at 1500 K are summarized in
Table 5.2.2.
5-8

Table 5.2.1. JANAF standard enthalpies of formation at 298 and 1500 K.
Species
ÆfH298
(kJ)
ÆfH1500
(kJ)
Error
@ 298 K
Source
Na 107.3 0 ± 0.7 Vapor pressure data at 298 K;reference state above 1170.5 K.
Na2 142.07 Ð75.2 ± 1.2 Spectroscopic bond dissociationenergy value.
NaO 83.68 Ð23.7 ± 41.8 Estimated bond dissociation energyfrom kereDû= constant andspectroscopic Dû for LiO.
Na2SO4 Ð1033.6 Ð1294.5 ± 25.1 Thermo of solid and average ofvarious vapor measurements.
NaH 124.26 15.6 ± 19.2 Spectroscopic measurement of Dû.
NaOH Ð197.76 Ð303.7 ± 12.6 Complex but securethermochemical cycles
(NaOH)2 Ð607.5 Ð822.5 ± 25.1 Mass-spectrometric study of vapor-phase dissociation equilibria
NaCN 94.27 Ð12.8 ± 2.1 Vapor pressure and compositionmeasurements, thermo of crystal
(NaCN)2 Ð8.8 Ð213.2 ± 13 1200 K vapor composition.
5-9

Table 5.2.2. JANAF standard enthalpies of formation at 298 and 1500 K.
Species ÆfH1500 (kJ) Species ÆfH1500 (kJ)
H 224.8 H2 0
O 254.2 H2O Ð250.3
OH 124.8 H2SO4 Ð788.8
CN 259.7 HCN 132.1
The dissociation reactions breaking off the Na atom can then be compared with one another and
with the corresponding reactions for breaking off a hydrogen atom at 1500 K as shown in Table
5.2.3.
Table 5.2.3. Thermochemistry for breaking NaÐX bonds at 1500 K.
Reaction ÆrH1500
(kJ)
ÆrH1500
(kJ) for Na = H
Differencebetween H and
Na
Na2 → Na + Na 75.2
NaH → Na + H 208.2 449.6 241.4
NaCN → Na + CN 272.5 352.4 79.9
NaO → Na + O 277.9 354.2 75.3
NaOH → Na + OH 428.5 599.9 171.4
NaOH → NaO + H 504.8 599.9 95.1
The sense of the results is not surprizing: The strength of the NaÐX bond increases with
increasing electronegativity difference between Na and X, and Na bonds to other atoms and
radicals less strongly than does H. The numerical comparisons shown in the fourth column are
disappointing, however, in that there is neither consistency nor an understandable trend in the
comparison to be seen in the compounds for which there is data to analyze this way.
5-10
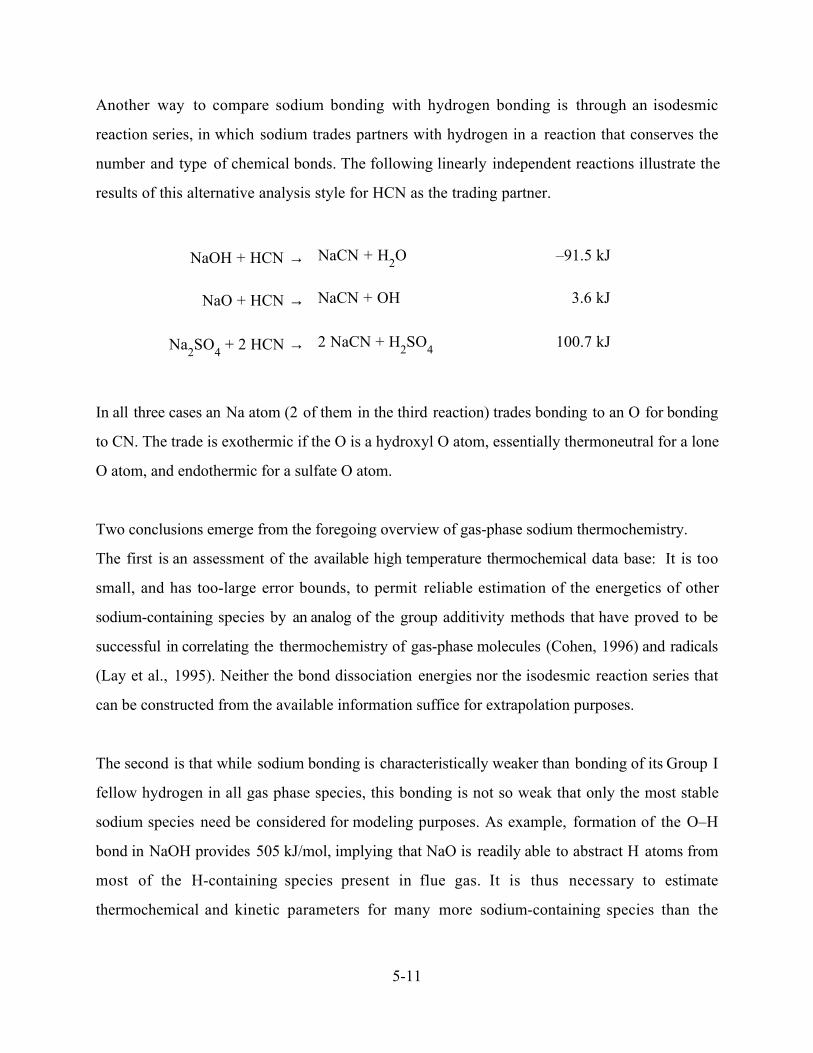
Another way to compare sodium bonding with hydrogen bonding is through an isodesmic
reaction series, in which sodium trades partners with hydrogen in a reaction that conserves the
number and type of chemical bonds. The following linearly independent reactions illustrate the
results of this alternative analysis style for HCN as the trading partner.
NaOH + HCN → NaCN + H2O Ð91.5 kJ
NaO + HCN → NaCN + OH 3.6 kJ
Na2SO4 + 2 HCN → 2 NaCN + H2SO4 100.7 kJ
In all three cases an Na atom (2 of them in the third reaction) trades bonding to an O for bonding
to CN. The trade is exothermic if the O is a hydroxyl O atom, essentially thermoneutral for a lone
O atom, and endothermic for a sulfate O atom.
Two conclusions emerge from the foregoing overview of gas-phase sodium thermochemistry.
The first is an assessment of the available high temperature thermochemical data base: It is too
small, and has too-large error bounds, to permit reliable estimation of the energetics of other
sodium-containing species by an analog of the group additivity methods that have proved to be
successful in correlating the thermochemistry of gas-phase molecules (Cohen, 1996) and radicals
(Lay et al., 1995). Neither the bond dissociation energies nor the isodesmic reaction series that
can be constructed from the available information suffice for extrapolation purposes.
The second is that while sodium bonding is characteristically weaker than bonding of its Group I
fellow hydrogen in all gas phase species, this bonding is not so weak that only the most stable
sodium species need be considered for modeling purposes. As example, formation of the OÐH
bond in NaOH provides 505 kJ/mol, implying that NaO is readily able to abstract H atoms from
most of the H-containing species present in flue gas. It is thus necessary to estimate
thermochemical and kinetic parameters for many more sodium-containing species than the
5-11

JANAF set if one is to hope for adequate dynamic modeling of sodium chemistry under flue gas
conditions.
Mention should be made of two other gas phase sodium species that have been discussed. The
first is the sodium analog of water, Na2O, for which thermochemical data have been generated
based on the experiments of Hildenbrand and Murad (1970). As shown below, the binding of the
second Na atom is sufficiently weak that very small amounts of it are formed at low total sodium
concentrations. The second species is the superoxide NaO2, which has been invoked to explain
Na concentration measurements in flames, Knudsen cells and flow reactors. The thermochemical
inferences show disappointingly large scatter, i.e., dissociation energy values in kJ/mol of <115,
>145, 163± 21, <184, <195, >202, 234±13, 230±5, and 243 ±21. (Marshall et al., 1990 and
references cited therein.) Theoretical values of 150, 151, 156, 185, 196 and 199 kJ/mol have been
reported for various levels of theory (Partridge et al., 1992 and references cited therein). The
experimental and theoretical values are consistently large enough to demonstrate that NaO2 has to
be considered as an intermediate in high-temperature sodium chemistry, but its thermochemistry
is clearly as much or more a problem as that of NaO.
Taking the available thermochemical data all together permits one to generate more complete
overviews of the species expected to be present at chemical equilibrium than is seen in the
foregoing more narrowly targeted discussion. Leaving out the uncertain NaO2 and solving the
equilibrium at 1 atm pressure over the temperature range of interest here provides the overviews
shown below. Figure 5.2.4 shows an equilibrium composition chart for the conditions of our
laboratory experiments, in which the only source of CO2 was the small addition of Na2CO3, and
Figure 5.2.5 shows the corresponding distribution for conditions that can be encountered at flue
gas compositions, when there is an exogenous source of CO2 corresponding to an equivalence
ratio of 1 for a fuel containing equimolar amounts of C and H.
5-12

10-10
10-9
10-8
10-7
10-6
10-5
10-4
1000 1100 1200 1300 1400 1500
NaNaHNaONaOHNa2Na2O(NaOH)2Na2CO3(s)
Mol
e Fr
actio
n
Temperature
Figure 5.2.4. Equilibrium distribution of sodium-containing species at 1 atm pressure in 80% N2,20% H2O and 300 ppm Na2CO3. The only condensed phase stable for these conditions is solidNa2CO3 below 1100 K.
1 0- 1 0
1 0- 9
1 0- 8
1 0- 7
1 0- 6
1 0- 5
1 0- 4
1 0 0 0 1 1 0 0 1 2 0 0 1 3 0 0 1 4 0 0 1 5 0 0
NaNaHNaONaOHNa2Na2O(NaOH)2Na2CO3(l)Na2CO3(s,II)
Mol
e Fr
actio
n
Temperature
Figure 5.2.5. Equilibrium distribution of sodium-containing species at 1 atm pressure in aflue-gas-like mixture with 300 ppm of added Na2CO3. The assumed fuel had C:H and equivalenceratios of 1. The high concentration of CO2 forces the condensed phase to be solid or liquidsodium carbonate rather than the intrinsically more stable hydroxide. Aside from this differencethe composition is quite similar to that of the CO2-free case, especially at higher temperatures.
5-13
Based upon the JANAF species and NaO2, one can start to model flue gas conditions to examine
the basic flow of sodium chemistry. Such models have been composed for example by Plane
(1991) and Schofield and Steinberg (1992). In these mechanisms additional species are advanced,
with provision of estimated, if any, thermochemical data. The additional species include NaO3,
NaHCO3, and NaCO3 in the Plane (1991) model, designed to describe sodium chemistry in the
mesosphere, and NaS, NaSH, NaS2, NaOS and NaSO2 in the Schofield and Steinberg (1992)
model, designed to describe sodium-sulfur interactions in flames; the latter authors describe
structural and thermochemical estimation procedures in detail. Calculations using the Chemkin
program and these reactions are in progress.
It is clear that the JANAF species and NaO2 do not suffice to give a complete picture of the
interactions of sodium species with the advanced reburning process. The strength of sodium
bonds to other prominent radicals (as we have calculated, but not reported here) at the
6-31G(d)++/MP2 level with isodesmic series) is sufficient to enable many such species to
interact with not only the common flame radicals but also with the ones that are specific to the
AR chemistry, such as the NHi species. Translating our molecular electronic structure results for
these species into temperature-dependent thermodynamics for these species is in progress. We
assume that the results of simulations that include these species will support the basic conclusion
of our Phase I researchÑthat the sodium enhancement effect arises from general increased radical
availabilityÑbut until the main candidate sodium species relevant to the advanced reburning
environment are tested in simulations, as Plane and coworkers did for the atmospheric case and
Schofield and coworkers did for the sulfur-interactions, this conclusion must remain tentative.
5.3 Experimental Methods
Most of our experiments on Na2CO3 decomposition were done in a flow system over the
5-14
temperature range from 900 to 1300 K. These experiments provided information about the rate of
Na2CO3 decomposition and reactions of Na2CO3 with components of flue gas. In place of our
early intention to identify gas-phase species by shock tube experiments, we decided to substitute
mass spectrometric ones in order to get a broader range of information about the product
distribution resulting from high temperature Na2CO3 decomposition.
The following sections give descriptions of the experimental apparatus used in our work.
5.3.1 Flow System
The flow system used for our experiments is shown in Figure 5.3.1. Our efforts began with the
construction of the flow and gas handling systems for our gas chromatograph (GC). The gas
handling system was made with a combination of glass and metal components so as to enable
both high and low pressure operation. A new reactor for the flow system was constructed that
took advantage of an ultrasonic atomizing nozzle system supplied by EER, which provided a
reliable way to spray aqueous Na2CO3 solution with salt concentrations up to 15% by weight.
The reactor was initially horizontal and later rearranged in a vertical orientation to suppress
deposition of Na2CO3 on the walls. The second design also included preheating the carrier gas to
temperatures in the range 300Ð400 ûC and use of a ceramic adapter between the nozzle system
and the reactor. The adapter allowed mixing hot carrier gas with the spray from the nozzle
without overheating the nozzle itself. (The specified working temperature range of the nozzle is
up to 200 ûC). The original GC columns were replaced with new ones packed with molecular
sieve and HAYESEP Q to enable measurements of CO2 and surrogate components of flue gas.
The sensitivity of the GC to CO2 was enhanced by use of high-sensitivity thermal conductivity
filaments and by prolonged pretreatment of the columns at 200 ûC. These modifications resulted
in a sensitivity level of 50 ppm of CO2 and permitted us to work with the flow system at
Na2CO3 levels close to those used by EER in their field experiments.
5-15

Preliminary experiments showed that temperature measurements taken inside of the reactor were
significantly different from measurements taken in the furnace area that originally were used for
temperature determinations. To enable correct temperature measurements, the construction of
the flow reactor was changed to enable a thermocouple to be inserted directly into the gas flow.
Measurements showed that by adjusting the current through each of three segments of the
furnace a uniform temperature distribution inside of the reactor can be created with temperature
variations within ±10 degrees.
Nitrogen Additive
Vent
Water in
Water out
Mixture ofaceton and icePumpGas
cylinder
GCCalibration mixtures
Sodium carbonate solution
Flowmeters
Nozzle
Gas preheat
Thermocouple
Figure 5.3.1 Flow system diagram.
Two drying systems were installed to dry gas after passing through the reactor. The first system
was used to separate most of the water so as to prevent condensation in communication lines.
The second system used acetone and dry ice to dry gas before taking a sample for GC analysis.
5-16

The second system protected the sensitive GC columns from being destroyed by the basic
solution formed from Na2CO3 decomposition.
5.3.2 Mass Spectrometric Analysis
The products of Na2CO3 thermal decomposition were identified using a Finnigan MAT TSQ 70
mass spectrometer in thermal, electron bombardment and chemical ionization modes. Small
amounts of aqueous Na2CO3 solution were heated on a Nichrome wire until the water evaporated
and the solid or liquid Na2CO3 started to decompose. In electron ionization mode, used in most
experiments, the gas phase was bombarded at electron ionization (EI) energies of 70, 25, 12 volts.
In chemical ionization mode (CI), the gas pressure in the ion source was increased to typically
10Ð3 mbar of CH4; the dominant initial CH4+ ions collide with molecules M and transfer a proton
to give MH+ ions with little excess initial energy and therefore little tendency to fragment. Thus,
whereas the EI spectra contained peaks corresponding to both molecular and fragment ions, the
CI spectra were simpler, mostly having predominantly parent ion peaks. Both EI and CI modes
were used in our experiments. In auxiliary experiments the Nichrome wire was replaced by
lower-melting metals in order to identify, by the melting temperature, the effective temperatures
where changes in the ion patterns appeared.
5.4 Rate of Sodium Carbonate Decomposition
5.4.1 Sodium Carbonate Decomposition in Nitrogen
Experiments on Na2CO3 decomposition were done in quartz and stainless steel reactors. It was
found that reactors made from different materials produced similar results. It is known, however,
that sodium carbonate reacts with silicon oxide, the main component of quartz, to form silicates
Na2CO3 + SiO2 → Na2SiO3 + CO2 (5.19)
5-17
Reaction (5.19) becomes spontaneous in the temperature range 500Ð600 K (Chase et al., 1985).
That reaction (5.19) does occur for the conditions of our experiments is supported by the
observation that after passing Na2CO3-containing test gas through the quartz reactor for 18 to 20
hours the surface of the reactor roughened, and after running for still longer times the reactor was
virtually destroyed. The observed rate of Na2CO3 decomposition was the same in a fresh reactor
and in a reactor with surface exposed to Na2CO3 for several hours, which suggests that reaction
(5.19) does not contribute significantly to CO2 production on the time scale of our experiments.
This observation is supported by a study of reaction (5.19) undertaken by Terai et al. (1968).
Using thermogravimetry, x-ray diffraction, and radioactive tracing they studied the sodium
carbonate-silica reaction in the temperature range from 1000 to 1100 K and reported that the
reaction is not controlled by diffusion of Na in silica. The diffusion coefficient calculated from the
penetration rate of Na into fused silica was determined to be D = 5.0×10Ð11 cm2/s. This value of
D actually shows how fast the reaction between sodium carbonate and silica is and can be used to
estimate the rate of reaction (5.19), which then can be compared with rate of the reaction in the
gas phase as follows. Since the gas volume in the reactor is V = 100 cm3 and typical
concentrations of CO2 were about 1×10Ð7 mol/cm3, the total amount of CO2 produced is 1×10Ð5
mol per second. For a reactor with diameter 2.5 cm, length 40 cm and wall thickness 0.1 cm the
total amount of silica in the reactor is 0.5 mol. From this data, the time required to produce
1×10Ð5 mol of CO2 in reaction (5.19) can be computed and compared with typical residence time
0.5 second. Production of 1×10Ð5 mol of CO2 results in consumption of 1×10Ð5/0.5 = 2×10Ð5
volume of silica. For our reactor it gives penetration distance l = 0.1× (2×10Ð5) = 2×10Ð6 cm.
Values of l and diffusion coefficient D give a simple estimation of reaction time t in the solid
phase through the Einstein equation
t = l2/D (5.4.I)
5-18
Using l = 2×10Ð6 cm and the value of D measured by Terai et al. (1968), formula (5.4.I) gives t =
8 s, much larger than the 0.5 s characteristic times of our experiments.
An alternate line of reasoning leading to the same result is this. The entire reactor contains about
0.5 mol of silica; as the observed production rate of CO2 is about 10Ð5 mol/s, the entire reactor
would be lost to form sodium silicate in only 5×10⁴ seconds (14 hours) if all of the CO2 would
originate in heterogeneous reaction (5.19) to form sodium silicate. Our observations show
however that the lifetime of the quartz reactor is at least 30 hours. Thus reaction (5.19) does not
contribute significantly to CO2 production on the time scale of our experiments.
Experimental study of Na2CO3 decomposition at temperatures from 900 to 1300 K and pressure
1 atm was done in the flow system. Details of the experimental procedure are given below. An
aqueous solution of Na2CO3 was sprayed into preheated flow of N2; the mixture then passed
through the quartz reactor and cooled. Sample taken from exhaust gases passed through additional
cooling system to get rid of water traces and then analyzed by GC. The flow rate of N2 and the
rate of solution consumption were measured and used to calculate the residence time of the
mixture in the reactor. These calculations were done assuming ideal behavior of N2 and H2O
vapor formed upon evaporation of water in the reactor. Initial concentrations of Na2CO3 in the
mixture were varied in the range from 300 to 1000 ppm. Since both reactions (5.12) and (5.13)
give stoichiometric ratio CO2/Na2CO3 = 1, this ratio can be used to determine degree of Na2CO3
decomposition. Concentrations of CO2 measured in samples taken from the outlet of the reactor
were used to compute the degree of Na2CO3 decomposition (Figure 5.4.1). Experiments in the
flow system show that at temperatures above 900 K significant amounts of CO2 are formed. The
scatter of the data is significant, especially at short residence times, probably due to
insufficiently controlled mixing. At residence times longer that 0.1 s a distinct temperature
influence on CO2 production can be observed. At temperatures around 900 K the maximum
conversion of Na2CO3 to products is about 0.5 even at the longest residence times. As
5-19
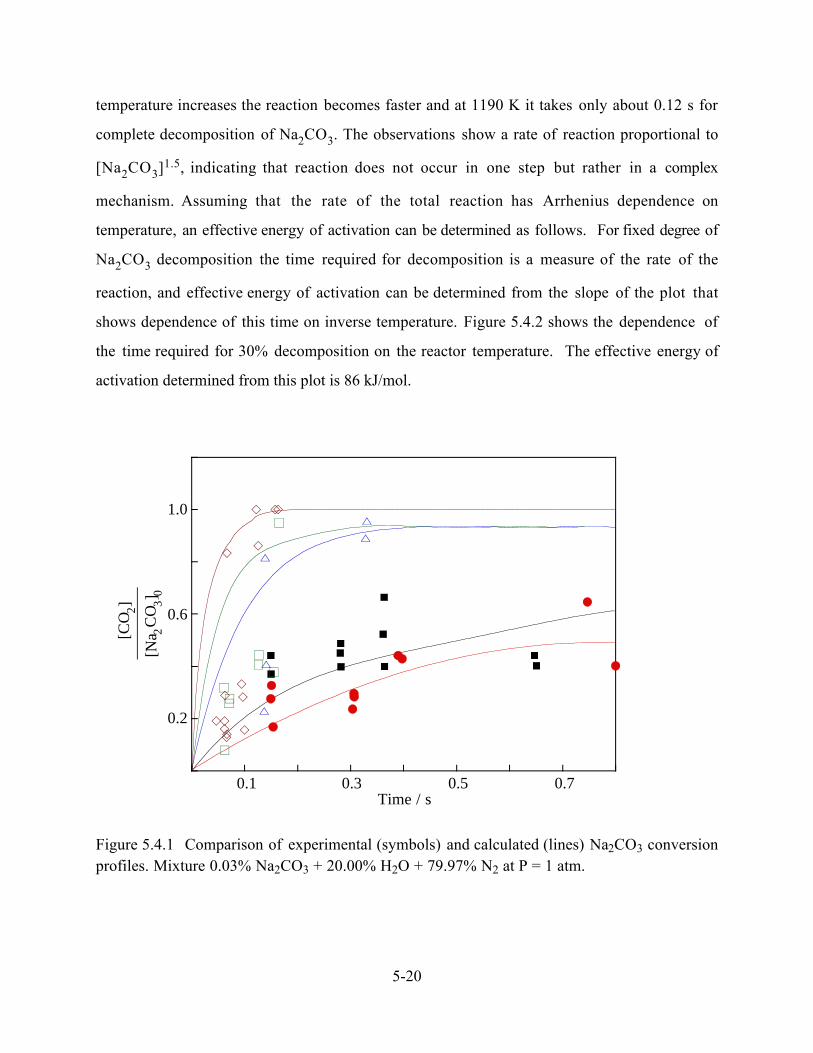
temperature increases the reaction becomes faster and at 1190 K it takes only about 0.12 s for
complete decomposition of Na2CO3. The observations show a rate of reaction proportional to
[Na2CO3]1.5, indicating that reaction does not occur in one step but rather in a complex
mechanism. Assuming that the rate of the total reaction has Arrhenius dependence on
temperature, an effective energy of activation can be determined as follows. For fixed degree of
Na2CO3 decomposition the time required for decomposition is a measure of the rate of the
reaction, and effective energy of activation can be determined from the slope of the plot that
shows dependence of this time on inverse temperature. Figure 5.4.2 shows the dependence of
the time required for 30% decomposition on the reactor temperature. The effective energy of
activation determined from this plot is 86 kJ/mol.
0.2
0.6
1.0
0.1 0.3 0.5 0.7
[Na 2
CO
3]0
Time / s
[CO
2]__
____
___
Figure 5.4.1 Comparison of experimental (symbols) and calculated (lines) Na2CO3 conversionprofiles. Mixture 0.03% Na2CO3 + 20.00% H2O + 79.97% N2 at P = 1 atm.
5-20

0.06
0.07
0.080.090.10
0.20
0.85 0.9 0.95 1 1.05 1.1
1000 / T / K
Tim
e /
s
Figure 5.4.2 Temperature dependence of the decadic logarithm of time required fordecomposition of 30% of the initial amount of Na2CO3.
To model irreversible (see section 5.2) Na2CO3 conversion, we used reactions (5.16, 5.17) and
Na2O + H2O ↔ 2NaOH (5.20)
with reactions (5.16) and (5.17) being irreversible and reaction (5.20) being possible in both
directions. The rate coefficient of reaction (5.20) was estimated as that of
CaO + H2O ↔ Ca(OH)2, (5.21)
measured by Cotton and Jenkins (1971) to be 9.18×10¹²exp(Ð3120/RT). Estimates show that the
characteristic lifetime of CaO in the reaction (5.21) at 1000 K, 1 atm and 20% H2O is less than 1
µs, much less than the characteristic time of our experiments. This suggests that for the
conditions of our experiments Na2O is practically instantaneously converted to NaOH, and thus
5-21

the value of the rate coefficient of reaction (5.20) is not really important. All calculations were
made using the Chemkin-II modeling program (Kee et al., 1992) under constant pressure and
temperature constraints. Thermochemical data for all species but Na2O were taken from
Zamansky and Maly (January 1997); thermochemical data for Na2O were taken from the NASA
database (McBride et al., 1993).
Sensitivity calculations (Figure 5.4.3) show that the rate coefficient of reaction (5.16) affects both
initial and equilibrium conversions of Na2CO3 to CO2, while that of reaction (5.17) mainly
affects the equilibrium value. The rate coefficients of reactions (5.16) and (5.17) were adjusted for
the conditions of our experiments (0.03% Na2CO3 + 20.00% H2O + 79.97% N2 at 1 atm). The
rate coefficient of reaction (5.16) was varied to match the initial part of the profiles at 900, 940,
1040, 1100 and 1190 K, while the rate coefficient of reaction (5.17) was changed until the final
calculated conversion was equal to the experimental value. Figures 5.4.4 and 5.4.5 show the
dependence of rate coefficient of reactions (5.16) and (5.17) on temperature as derived from
matching the experimental conversion profiles. The rate coefficient of reaction (5.16) follows a
simple Arrhenius dependence, while that of reaction (5.17) decreases with temperature, possibly
due to limitation of the reaction rate by CO2 transport. Least square fits to all data give next
expressions for k5 and k6
k16 = 2.54×10⁶exp(Ð13040/T) (5.4.II)
k17 = 1.11×10⁵exp(7580/T) (5.4.III)
5-22

0.2
0.4
0.6
0.8
0.1 0.3 0.5Time / s
Con
vers
ion
Figure 5.4.3 Sensitivity spectrum for decomposition of Na2CO3. The dashed line representscalculations with a doubled rate coefficient of reaction (5.16), the dotted line a doubled ratecoefficient of the reaction (5.17).
1
10
100
0.85 0.9 0.95 1 1.05 1.1
Rat
e co
effi
cien
t /
s
1000 / T
Figure 5.4.4 Rate coefficient inferred for Na2CO3 → Na2O + CO2 (5.16).
5-23

8
9
0.85 0.9 0.95 1 1.05 1.1
log
k 6 /
cm3,
mol
, s
1000 / T
Figure 5.4.5 Rate coefficient inferred for Na2O + CO2 → Na2CO3 (5.17).
The total uncertainties (TU) in rate coefficient of reactions (5.16) and (5.17) were determined
through the formula
TUi = ((ai×Uexp)2 + Ufi2)0.5
where Uexp is the uncertainty of the experimental data (20%), ai is the sensitivity of the rate
coefficient of the reaction (i) to the experimental data, and Ufi is the uncertainty associated with
the least square fit to all data points for the rate coefficient of reaction (i). Sensitivity coefficients
ai were defined as ai = 1.4ln(C/C0), where C and C0 are computed conversions for doubled and
for reference values of the rate coefficient of the reaction (i), and are equal to 0.46 for reaction
(5.16) and 0.1 for reaction (5.17). The values of Ufi were found to be 10 and 25% for k16 and k17.
Based on these data, values of TU16 and TU17 were calculated to be 14 and 25 %.
Figure 5.4.1 shows a comparison between experimental and calculated conversion profiles based
5-24

on the above expressions. At higher temperatures complete decomposition of Na2CO3 occurs
within 0.2 s, while at low temperatures conversion at long times reaches a maximum value and
then stays constant. Taking into account the significant scatter of the experimental data, the
agreement between measured and calculated profiles is good.
These results for the rate of Na2CO3 decomposition thus show that at temperatures higher than
1400 K Na2CO3 decomposes relatively quickly to produce NaOH and CO2, suggesting that
Na2CO3 and NaOH should have practically the same efficiencies as NOx control agents.
5.4.2 Reactions of Sodium Carbonate with Components of Flue Gas
The flow system was used to measure the rate of reaction between the decomposition products
of Na2CO3 and CH4, H2, CO, and NO. These experiments were done at 1150 K and a residence
time of 2 s in mixtures containing 0.5%Na2CO3 + 1.7%H2O + N2 with 0.5% additive. In each
case the concentration of additive in the mixture after passing through the reactor was measured;
measurements were done by GC for C H 4, H 2, CO, and O 2 additive and with the
chemiluminescence analyzer for NO. In the first set of experiments pure water was sprayed
through the nozzle while a mixture of additive and nitrogen passed through the reactor and the
concentration of additive in the outlet gas was measured. In the second set of experiments the gas
and liquid flow conditions were the same as in the first one except that the water was replaced
with a solution containing 5% Na2CO3 by mass. Comparison of two runs showed no detectable
changes in additive concentrations. We conclude that there is no chemical reaction with
observable rate between the decomposition products of Na2CO3 and CH4, H2, CO, and NO
under the conditions studied. It was also observed that the concentration of NO stayed constant
when O2 and Na2CO3 were injected into the mixture at the same time.
Experiments with ammonia injection to evaluate the reactions of NO and NH3 in the presence of
5-25
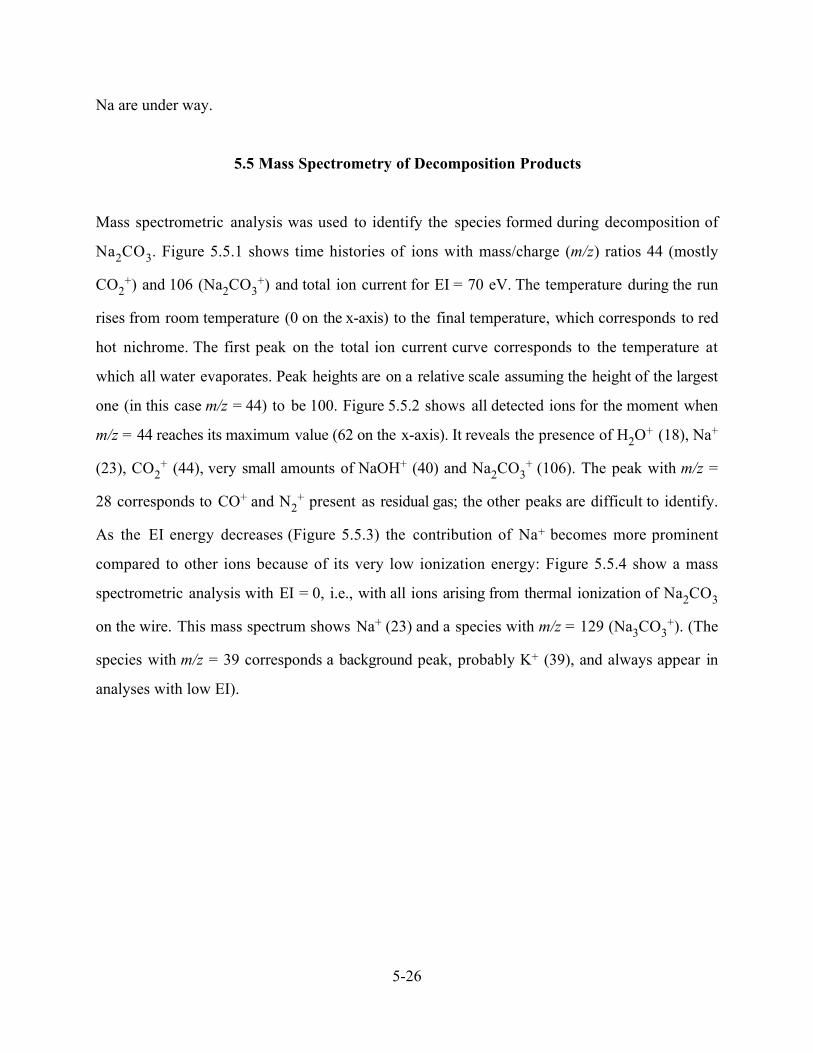
Na are under way.
5.5 Mass Spectrometry of Decomposition Products
Mass spectrometric analysis was used to identify the species formed during decomposition of
Na2CO3. Figure 5.5.1 shows time histories of ions with mass/charge (m/z) ratios 44 (mostly
CO2+) and 106 (Na2CO3
+) and total ion current for EI = 70 eV. The temperature during the run
rises from room temperature (0 on the x-axis) to the final temperature, which corresponds to red
hot nichrome. The first peak on the total ion current curve corresponds to the temperature at
which all water evaporates. Peak heights are on a relative scale assuming the height of the largest
one (in this case m/z = 44) to be 100. Figure 5.5.2 shows all detected ions for the moment when
m/z = 44 reaches its maximum value (62 on the x-axis). It reveals the presence of H2O+ (18), Na+
(23), CO2+ (44), very small amounts of NaOH+ (40) and Na2CO3
+ (106). The peak with m/z =
28 corresponds to CO+ and N2+ present as residual gas; the other peaks are difficult to identify.
As the EI energy decreases (Figure 5.5.3) the contribution of Na+ becomes more prominent
compared to other ions because of its very low ionization energy: Figure 5.5.4 show a mass
spectrometric analysis with EI = 0, i.e., with all ions arising from thermal ionization of Na2CO3
on the wire. This mass spectrum shows Na+ (23) and a species with m/z = 129 (Na3CO3+). (The
species with m/z = 39 corresponds a background peak, probably K+ (39), and always appear in
analyses with low EI).
5-26
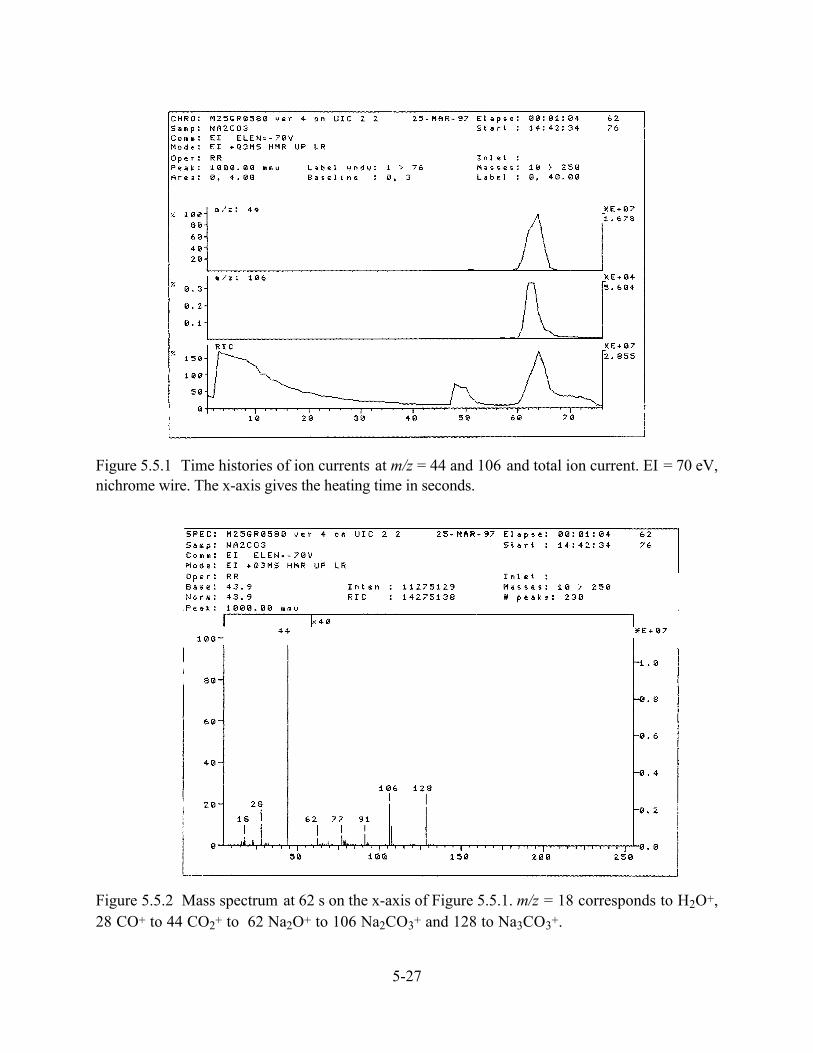
Figure 5.5.1 Time histories of ion currents at m/z = 44 and 106 and total ion current. EI = 70 eV,nichrome wire. The x-axis gives the heating time in seconds.
Figure 5.5.2 Mass spectrum at 62 s on the x-axis of Figure 5.5.1. m/z = 18 corresponds to H2O+,28 CO+ to 44 CO2+ to 62 Na2O+ to 106 Na2CO3+ and 128 to Na3CO3+.
5-27

Figure 5.5.3 Mass spectrum at the time m/z = 23 reaches its maximum. EI = 12 eV.
Figure 5.5.4 Mass spectrum at the time m/z = 23 reaches its maximum in thermal ionizationmode.
5-28
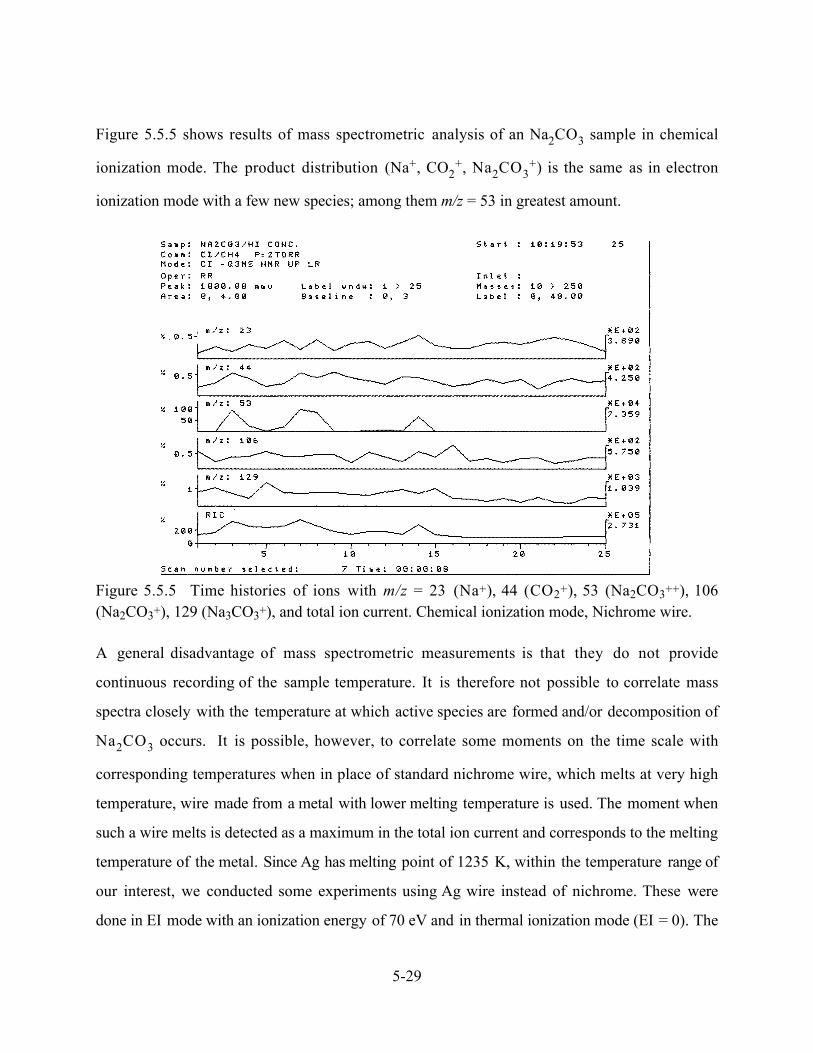
Figure 5.5.5 shows results of mass spectrometric analysis of an Na2CO3 sample in chemical
ionization mode. The product distribution (Na+, CO2+, Na2CO3
+) is the same as in electron
ionization mode with a few new species; among them m/z = 53 in greatest amount.
Figure 5.5.5 Time histories of ions with m/z = 23 (Na+), 44 (CO2+), 53 (Na2CO3++), 106(Na2CO3+), 129 (Na3CO3+), and total ion current. Chemical ionization mode, Nichrome wire.
A general disadvantage of mass spectrometric measurements is that they do not provide
continuous recording of the sample temperature. It is therefore not possible to correlate mass
spectra closely with the temperature at which active species are formed and/or decomposition of
Na2CO3 occurs. It is possible, however, to correlate some moments on the time scale with
corresponding temperatures when in place of standard nichrome wire, which melts at very high
temperature, wire made from a metal with lower melting temperature is used. The moment when
such a wire melts is detected as a maximum in the total ion current and corresponds to the melting
temperature of the metal. Since Ag has melting point of 1235 K, within the temperature range of
our interest, we conducted some experiments using Ag wire instead of nichrome. These were
done in EI mode with an ionization energy of 70 eV and in thermal ionization mode (EI = 0). The
5-29

time of Ag occurrence in the mass spectrum (Figure 5.5.6) (which also corresponds to the
maximum in total current) corresponds to the moment of time when temperature of the wire is
1235 K (39 s). The mass spectrum (Figure 5.5.7) at this temperature shows CO2+ (44), NaOH+
(40), Na2CO3+ (106) and many other species. Some of them are easily identifiable (H2O+ and
N2+), while secure identification of others requires additional (i.e., high-resolution) analysis.
Figure 5.5.7 does not indicate the presence of Na atoms. To find out if Na atoms are present in
the system at 1235 K we repeated experiments with an Ag wire in thermal ionization mode (Figs.
5.5.8 and 5.5.9). Figure 5.5.8 shows that one of the maximums in Ag+ (109) concentration
corresponds to the maximum in total ion current (22 s on x-axis) at the temperature 1235 K. The
mass spectrum (Figure 5.5.9) at this temperature shows Na+ (23) and species with m/z = 39 and
129.
Figure 5.5.6 Time histories of Ag+ (109) and total ion current for experiments with Ag wire. EI =70 eV. Time 39 s corresponds to 1235 K.
5-30

Figure 5.5.7 Mass spectrum at 1235 K. EI = 70 eV.
Figure 5.5.8 Time histories of ions with m/z = 23 (Na+) and 109 (Ag+), and total ion currentthrough the detector for thermal ionization mode.
5-31

Figure 5.5.9 Mass spectrum corresponding to the moment of burnout of Ag wire for thermalionization mode.
Mass spectrometric analysis of products of Na2CO3 decomposition thus confirms that the
primary gas-phase decomposition products are Na, NaOH and CO2. Experiments with
temperature control show formation of Na atoms at 1235 K.
5.6 Kinetics of Na2CO3 Reactions: Conclusions
1. Decomposition of Na2CO3 was studied in a flow system over the temperature range from 900
to 1190 K. An aqueous solution of sodium carbonate was sprayed into a flow of N2 such that the
concentration of Na2CO3 injected into the test gas ranged from 100 to 500 ppm. The observed
decomposition rate of Na2CO3 can be described kinetically in terms of two irreversible Na2CO3
→ Na2O + CO2 (5.16) and Na2O + CO2 → Na2CO3 (5.17) and one reversible Na2O + H2O ↔
5-32
2NaOH (5.20) chemical reactions. The corresponding rate coefficients k16 and k17 were adjusted
to describe the measured rate of Na2CO3 decomposition, while the rate coefficient of reaction
(5.20) was estimated from kinetic data for the similar reaction of CaO. Least square fits to all data
gave k16 = 2.54×10⁶exp(Ð13040/T), k17 = 1.11×10⁵exp(7580/T) cm3mol-1s-1.
2. Mass spectrometric analysis of products of Na2CO3 decomposition confirms that the
primary gas-phase products of decomposition are Na, NaOH and CO2. Experiments with
temperature control show formation of Na atoms at temperature 1235 K.
3. Extrapolating the results of our flow system experiments to higher temperatures shows that
Na2CO3 decomposition at temperatures over 1400 K produces NaOH and CO2 very quickly .
NaOH then decomposes more slowly. According to Westley et al. (1994), the characteristic time
of NaOH decomposition at 1500 K to produce Na and OH is 160 ms; extrapolation of our data
for Na2CO3 decomposition to that temperature gives an Na2CO3 decomposition time of 2.3 ms.
These observations suggest that Na2CO3 and NaOH should have practically the same efficiencies
as pollution control agents.
4. Flow system experiments at 1150 K show no chemical reaction between Na2CO3
decomposition products and H2, CO, CH4 or NO. This experiment indicates that the effect of
NO removal by Na2CO3 is mainly due to promotional effect that Na2CO3 additive has on the
concentrations of atoms and radicals already present in flue gas at high temperature, in particular
OH and H. Enhancement of radical concentrations in the presence of Na2CO3 can occur through
NaOH thermal decomposition
NaOH + M → Na + OH + M
and in further reactions of Na atoms, which were observed among the products of Na2CO3
5-33

decomposition in mass spectrometric analysis. H-atoms, for example, are produced by
Na + H2O → NaOH + H
These two reactions provide for continuous flow of radicals into the system and thus account for
high efficiency of Na2CO3. Radicals then react with NH3 which is injected to flue gas in SNCR
process
NH3 + OH → NH2 + H2O
NH3 + H → NH2 + H2
such that the efficiency of NH3 as NO removing agent through the reaction
NH2 + NO → N2 + H2O
in the conventional AR process is significantly enhanced in presence of Na2CO3.
Our experiments indicate that other additives that have decomposition times similar to NaOH
and produce active species that enhance production of OH and H radicals in flue gas should also
be considered as potential NO control agents.
5. Completion of the Phase I research will include the following, as mentioned in the preceding
sections. (a) Flow system experiments including ammonia and NO additives; (b) Translation of
molecular electronic structure results into NASA-style thermochemical polynomials; and (c)
Chemkin simulations with the expanded set of sodium species.
5-34
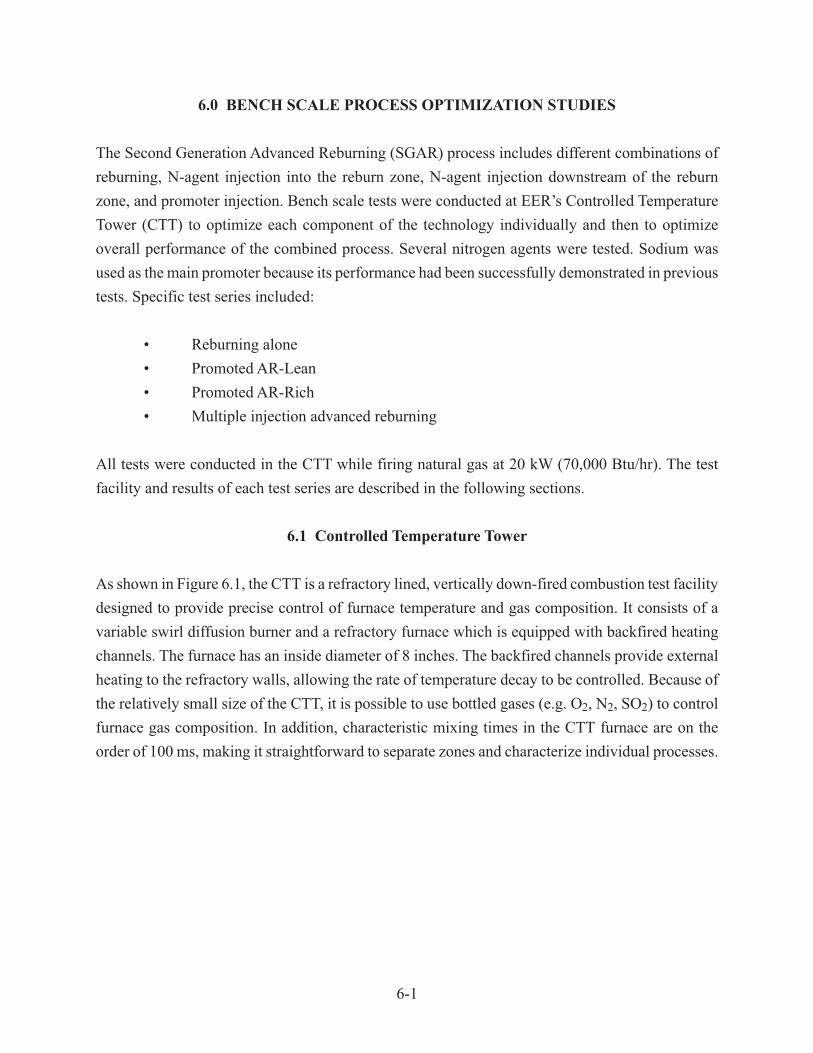
6-1
6.0 BENCH SCALE PROCESS OPTIMIZATION STUDIES
The Second Generation Advanced Reburning (SGAR) process includes different combinations of
reburning, N-agent injection into the reburn zone, N-agent injection downstream of the reburn
zone, and promoter injection. Bench scale tests were conducted at EER’s Controlled Temperature
Tower (CTT) to optimize each component of the technology individually and then to optimize
overall performance of the combined process. Several nitrogen agents were tested. Sodium was
used as the main promoter because its performance had been successfully demonstrated in previous
tests. Specific test series included:
• Reburning alone
• Promoted AR-Lean
• Promoted AR-Rich
• Multiple injection advanced reburning
All tests were conducted in the CTT while firing natural gas at 20 kW (70,000 Btu/hr). The test
facility and results of each test series are described in the following sections.
6.1 Controlled Temperature Tower
As shown in Figure 6.1, the CTT is a refractory lined, vertically down-fired combustion test facility
designed to provide precise control of furnace temperature and gas composition. It consists of a
variable swirl diffusion burner and a refractory furnace which is equipped with backfired heating
channels. The furnace has an inside diameter of 8 inches. The backfired channels provide external
heating to the refractory walls, allowing the rate of temperature decay to be controlled. Because of
the relatively small size of the CTT, it is possible to use bottled gases (e.g. O2, N2, SO2) to control
furnace gas composition. In addition, characteristic mixing times in the CTT furnace are on the
order of 100 ms, making it straightforward to separate zones and characterize individual processes.
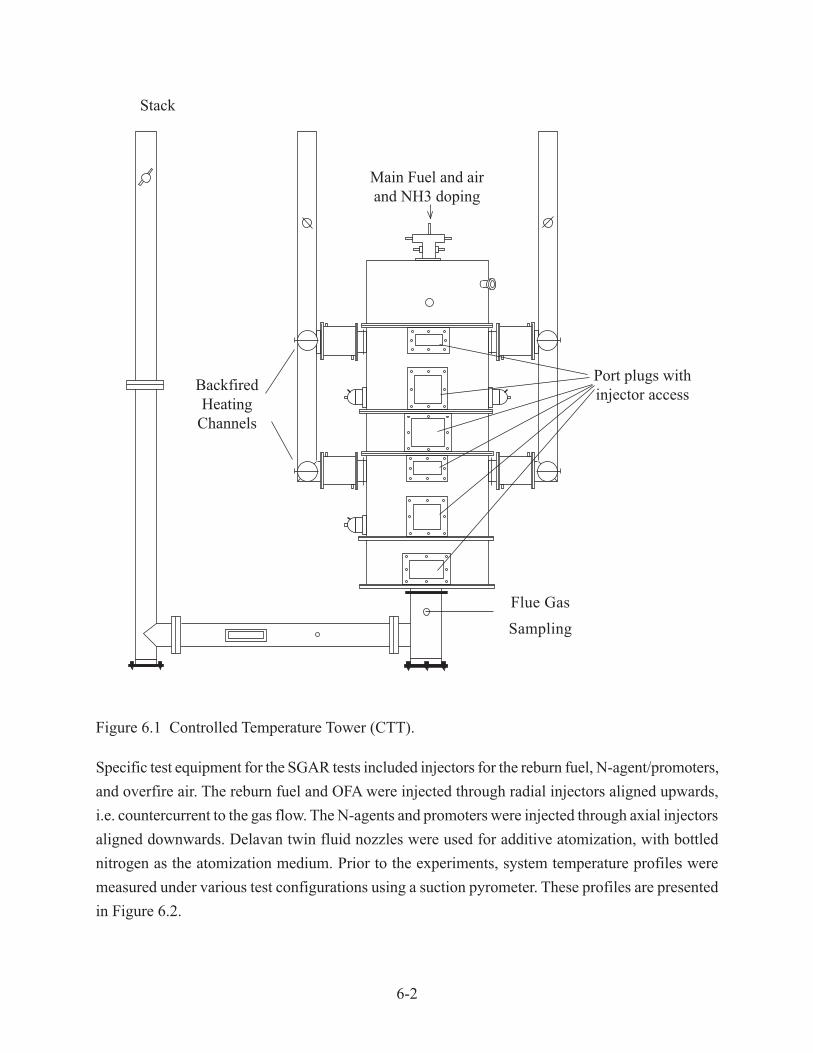
6-2
Figure 6.1 Controlled Temperature Tower (CTT).
Specific test equipment for the SGAR tests included injectors for the reburn fuel, N-agent/promoters,
and overfire air. The reburn fuel and OFA were injected through radial injectors aligned upwards,
i.e. countercurrent to the gas flow. The N-agents and promoters were injected through axial injectors
aligned downwards. Delavan twin fluid nozzles were used for additive atomization, with bottled
nitrogen as the atomization medium. Prior to the experiments, system temperature profiles were
measured under various test configurations using a suction pyrometer. These profiles are presented
in Figure 6.2.
Main Fuel and airand NH3 doping
Flue Gas
Sampling
Stack
BackfiredHeating
Channels
Port plugs withinjector access

6-3
Figure 6.2 CTT temperature profiles.
1000
1100
1200
1300
1400
1500
1600
1700
0 50 100 150 200 250 300
Fur
nace
Gas
Tem
pera
ture
(K
)
Axial Distance Along Furnace (cm)
No reburning
10% reburning
10% reburning + 12 g/min additive
Main burner: natural gas firing @ 20kW

6-4
Proper operation of system instrumentation was verified before the tests began, including
thermocouples, pressure gauges, and the flue gas sample system. A continuous emissions monitoring
system (CEMS) was used for on-line analysis of flue gas composition. The CEMS consisted of a
heated sample line, sample conditioning system (to remove moisture and particulate), and gas
analyzers. Species analyzed, detection principles, and detection limits were as follows:
• O2: paramagnetism, 0.1%
• NOx: chemiluminescence, 1 ppm
• CO: nondispersive infrared, 1 ppm
• CO2: nondispersive infrared, 0.1%
• N2O: nondispersive infrared, 1 ppm
Certified zero and span gases were used to calibrate the analyzers. A chart recorder was used to
provide a hard copy of analyzer outputs.
6.2 Reburning Alone
The first series of tests was designed to define the nominal performance of gas reburning without
additives. Test variables included reburn heat input (i.e. SR2), reburn zone residence time, and
reburn fuel transport medium (air or nitrogen). Baseline conditions were as follows:
• Reburn fuel injection temperature=1670 K
• SR1=1.10, SR3=1.15
• Overfire air injection temperature=1530 K
• Reburn zone residence time=350 msec
• NOi=600 ppm as measured
Figure 6.3 shows the impact of varying reburn fuel heat input upon NO reduction. For both air and
nitrogen transport, performance increased with increasing reburn heat input. Maximum NO
reductions were 42% and 59% with air and nitrogen transport, respectively. On the basis of reburn
heat input nitrogen transport gave greater NO reduction than air transport. However, this is primarily
because nitrogen transport gives lower reburn zone stoichiometry than air. When compared on the
basis of SR2, results are nearly identical.
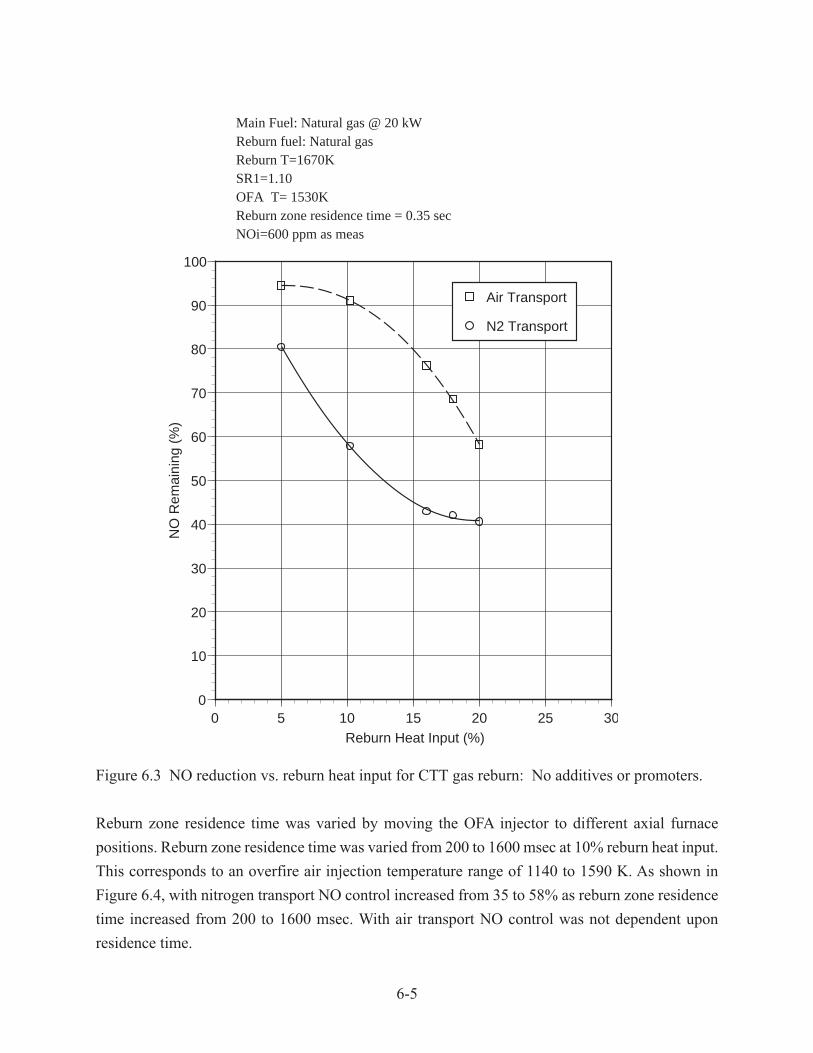
6-5
Figure 6.3 NO reduction vs. reburn heat input for CTT gas reburn: No additives or promoters.
Reburn zone residence time was varied by moving the OFA injector to different axial furnace
positions. Reburn zone residence time was varied from 200 to 1600 msec at 10% reburn heat input.
This corresponds to an overfire air injection temperature range of 1140 to 1590 K. As shown in
Figure 6.4, with nitrogen transport NO control increased from 35 to 58% as reburn zone residence
time increased from 200 to 1600 msec. With air transport NO control was not dependent upon
residence time.
0
10
20
30
40
50
60
70
80
90
100
0 5 10 15 20 25 30
NO
Rem
aini
ng (
%)
Reburn Heat Input (%)
Air Transport
N2 Transport
Main Fuel: Natural gas @ 20 kWReburn fuel: Natural gasReburn T=1670KSR1=1.10OFA T= 1530KReburn zone residence time = 0.35 secNOi=600 ppm as meas

6-6
Figure 6.4 NO reduction vs. reburn zone residence time for gas reburn: No additives or promoters.
6.3 Promoted AR-Lean
In the AR-Lean tests, reburning was coupled with the injection of a single nitrogen agent, both with
and without promoters. N-agent was injected with the overfire air. Reburn heat input was 10%.
Figure 6.5 shows AR-Lean test results. The overfire air plus additive injection temperature was
varied. This changed the reburn zone residence time, causing reburn performance to vary. Aqueous
ammonia, urea, and ammonium sulfate were tested, each with and without 15 ppm of sodium
carbonate promoter. The listed promoter concentration assumes complete conversion to the gas
phase. Aqueous ammonia and urea performed somewhat better than ammonium sulfate. Sodium
carbonate both expanded the optimum temperature window to the right (i.e. to higher temperatures)
and increased maximum NO control. The highest NO reduction achieved was 87% with both
promoted aqueous ammonia and promoted urea at an injection temperature of 1300 K.
0
10
20
30
40
50
60
70
80
90
100
0 500 1000 1500 2000
NO
Rem
aini
ng (
%)
Reburn Zone Residence Time (msec)
Air Transport
N2 Transport
Main Fuel: Natural gas @ 20 kWReburn fuel: Natural gasReburn T=1670 KSR1=1.1010.2% ReburnSR2 (air)=1.10, SR2(N2)=0.99OFA T: variedNOi=600 ppm as meas

6-7
Figure 6.5 AR-Lean performance.
6.4 Promoted AR-Rich
In the AR-Rich tests aqueous ammonia and urea were injected into the fuel rich reburn zone. Overfire
air was added at 1160 K. As shown in Figure 6.6, the impact of the promoter was pronounced for
this test system. Sodium carbonate shifted the optimum temperature to the right and significantly
widened the temperature window. Maximum NO reduction was 88%, obtained with both promoted
aqueous ammonia and promoted urea at an injection temperature of 1470 K.
0
10
20
30
40
50
60
70
80
90
100
1000 1050 1100 1150 1200 1250 1300 1350 1400
NO
Rem
aini
ng (
%)
Additive + OFA Injection Temperature (K)
Reburn Alone
Reburn+NH4OH
Reburn+Urea
Reburn+(NH4)2SO4
Reburn+NH4OH+15ppm Na2CO3
Reburn+Urea+15ppm Na2CO3
Reburn+(NH4)2SO4+15ppm Na2CO3
Main Fuel: Natural gas @20 kW10% Reburn @ 1670 K, N2 transportReburn zone res. time variesSR1=1.10, SR2=0.99, SR3=1.15NOi=600 ppm as meas, NSR=1.5N agent added with OFA

6-8
Figure 6.6 AR-Rich performance.
A series of screening tests was then conducted with different sodium promoter compounds. The
promoters were injected along with aqueous ammonia into the reburn zone at 1460 K. Six different
sodium compounds were characterized including Na2CO3, NaHCO3, trona (a mineral product
consisting of Na2CO3 and NaHCO3), NaCl, NaNO3, and NaOH. As shown in Figure 6.7, reburning
alone provided 47% NO control, which was increased to 57% by the addition of ammonia. All six
sodium compounds significantly enhanced performance, although NaCl and NaNO3 were somewhat
less effective than the other four. Na2CO3 is effective, non-toxic, readily soluble in water, and is the
least expensive compound on a unit-sodium basis, and thus was selected as the primary promoter
compound for subsequent tests.
0
10
20
30
40
50
60
70
80
90
100
1100 1150 1200 1250 1300 1350 1400 1450 1500 1550 1600
NO
Rem
aini
ng (
%)
Additive Injection Temperature (K)
Reburn Alone
Reburn+NH4OH
Reburn+NH4OH+15 ppm Na2CO3
Reburn+Urea
Reburn+Urea+15 ppm Na2CO3
Main Fuel: Natural gas @20 kW10% Reburn @ 1670 K, N2 transportReburn zone res. time=0.72 secOFA added at 1160 KSR1=1.10, SR2=0.99, SR3=1.15NOi=600 ppm as meas, NSR=1.5N agent added in reburn zone
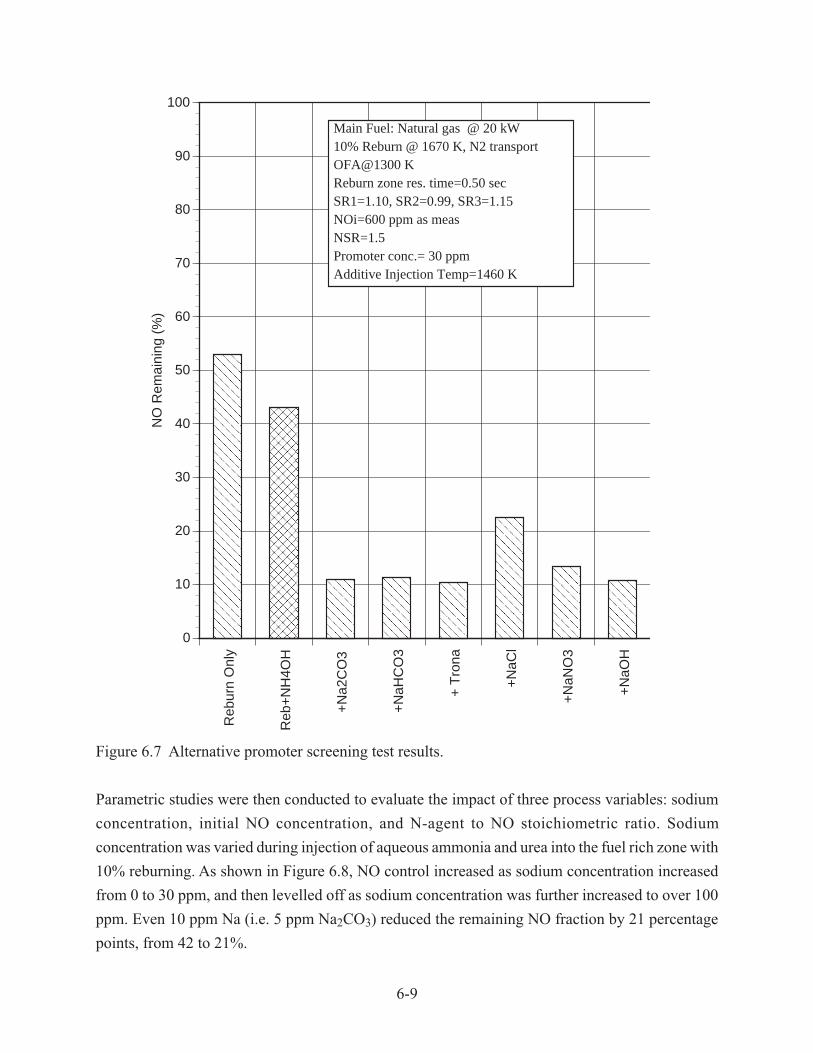
6-9
Figure 6.7 Alternative promoter screening test results.
Parametric studies were then conducted to evaluate the impact of three process variables: sodium
concentration, initial NO concentration, and N-agent to NO stoichiometric ratio. Sodium
concentration was varied during injection of aqueous ammonia and urea into the fuel rich zone with
10% reburning. As shown in Figure 6.8, NO control increased as sodium concentration increased
from 0 to 30 ppm, and then levelled off as sodium concentration was further increased to over 100
ppm. Even 10 ppm Na (i.e. 5 ppm Na2CO3) reduced the remaining NO fraction by 21 percentage
points, from 42 to 21%.
Reb
urn
Onl
y
Reb
+N
H4O
H
+N
a2C
O3
+N
aHC
O3
+ T
rona
+N
aCl
+N
aNO
3
+N
aOH
0
10
20
30
40
50
60
70
80
90
100
NO
Rem
aini
ng (
%)
Main Fuel: Natural gas @ 20 kW10% Reburn @ 1670 K, N2 transportOFA@1300 KReburn zone res. time=0.50 secSR1=1.10, SR2=0.99, SR3=1.15NOi=600 ppm as measNSR=1.5Promoter conc.= 30 ppmAdditive Injection Temp=1460 K

6-10
Figure 6.8 NO control vs. Na promoter concentration.
Initial NO concentration was varied from 150 to 950 ppm during tests with reburn alone and reburn
plus injection of aqueous ammonia and sodium carbonate. As shown in Figure 6.9, NO reduction
increased with increasing NOi. For reburn plus injection of aqueous ammonia and sodium carbonate
over 90% NO control was obtained at NOi=950 ppm.
0
10
20
30
40
50
60
70
80
90
100
0 20 40 60 80 100 120
NO
Rem
aini
ng (
%)
Na in Flue Gas (ppm)
NH4OH+Na2CO3
Urea+Na2CO3
Main Fuel: Natural gas @ 20 kW10% Reburn @ 1670 K, N2 transportReburn zone res. time=0.72 secOFA added at 1160 KSR1=1.10, SR2=0.99, SR3=1.15NOi=600 ppm as measNSRi=1.5Additive Injection Temp=1380 K
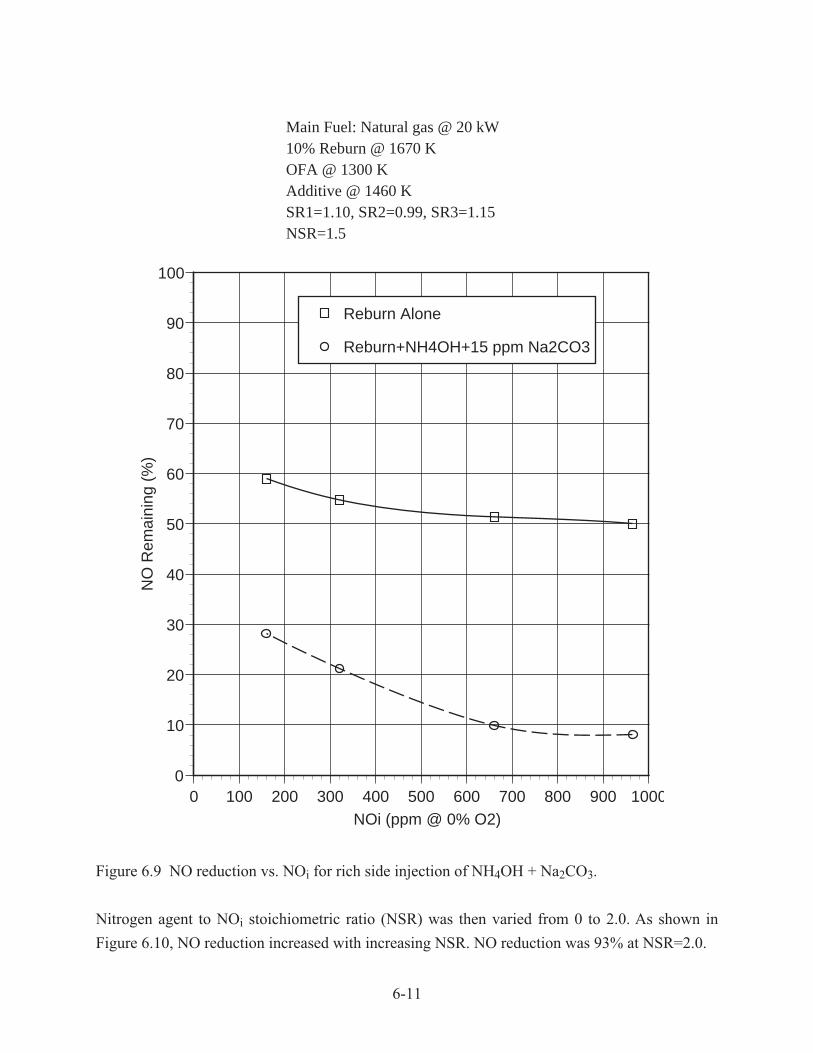
6-11
Figure 6.9 NO reduction vs. NOi for rich side injection of NH4OH + Na2CO3.
Nitrogen agent to NOi stoichiometric ratio (NSR) was then varied from 0 to 2.0. As shown in
Figure 6.10, NO reduction increased with increasing NSR. NO reduction was 93% at NSR=2.0.
0
10
20
30
40
50
60
70
80
90
100
0 100 200 300 400 500 600 700 800 900 1000
NO
Rem
aini
ng (
%)
NOi (ppm @ 0% O2)
Reburn Alone
Reburn+NH4OH+15 ppm Na2CO3
Main Fuel: Natural gas @ 20 kW10% Reburn @ 1670 KOFA @ 1300 KAdditive @ 1460 KSR1=1.10, SR2=0.99, SR3=1.15NSR=1.5

6-12
Figure 6.10 NO reduction vs. NSR for rich side injection of NH4OH + Na2CO3.
6.5 Multiple Injection AR (MIAR)
In the MIAR process N-agents and promoters are injected both in the reburn zone and with the
overfire air. CTT tests were conducted in which various combinations of rich and lean side additives
were injected. Figure 6.11 shows MIAR results obtained with promoter added to the fuel rich zone.
A maximum of 50% NO control was obtained by reburning alone. AR-Rich provided up to 67%
NO control. Reburning plus both rich and lean side injection of aqueous ammonia with no promoter
gave a maximum of 86% NO control. The best performance was obtained with reburning with rich
side injection of N-agent plus promoter and lean side injection of N-agent alone. This system reduced
NO emissions by over 90%. Reburning with rich side N-agent injection and lean side N-agent plus
promoter injection also gave up to 90% NO control. Moreover, these systems were largely insensitive
to injection temperature, with approximately 90% NO control obtained over the entire test range of
1380 to 1590 K.
0
10
20
30
40
50
60
70
80
90
100
0.0 0.5 1.0 1.5 2.0 2.5
NO
Rem
aini
ng (
%)
NSR (N/NOi, mol/mol)
NH4OH+15 ppm Na2CO3
Main Fuel: Natural gas @ 20 kW10% Reburn @ 1670 KOFA @ 1300 KAdditive @ 1460 KSR1=1.10, SR2=0.99, SR3=1.15NOi=600 ppm as meas
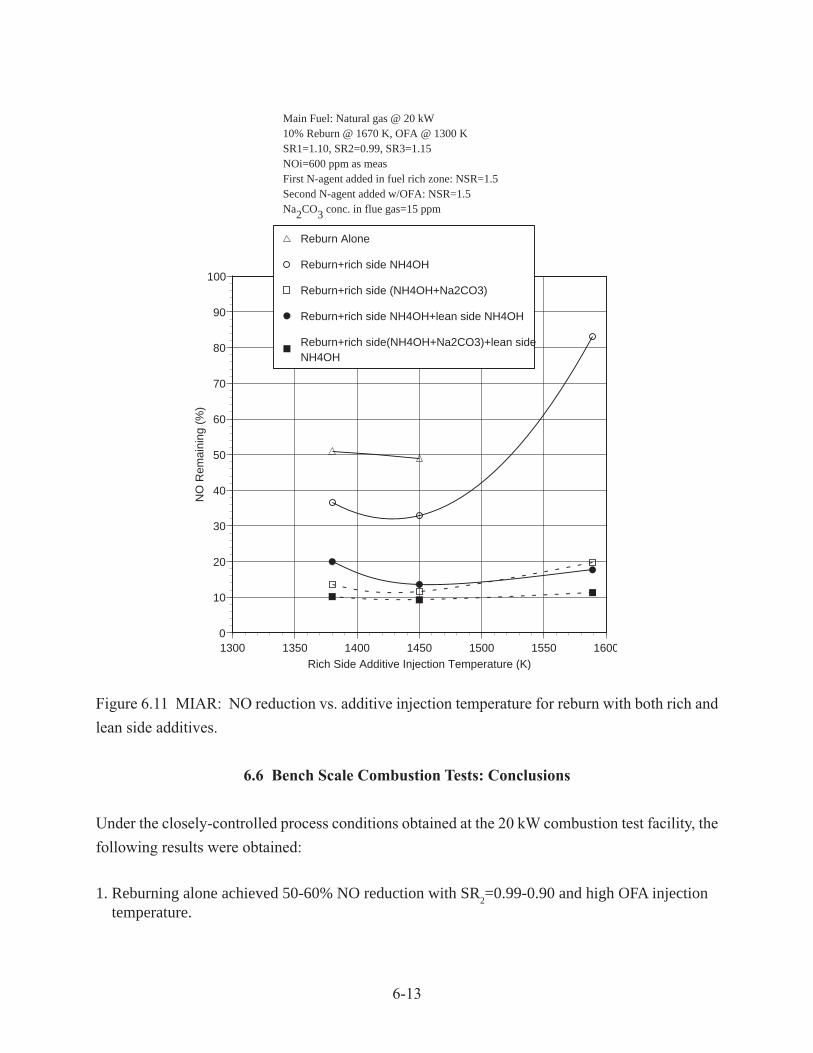
6-13
Figure 6.11 MIAR: NO reduction vs. additive injection temperature for reburn with both rich and
lean side additives.
6.6 Bench Scale Combustion Tests: Conclusions
Under the closely-controlled process conditions obtained at the 20 kW combustion test facility, the
following results were obtained:
1. Reburning alone achieved 50-60% NO reduction with SR2=0.99-0.90 and high OFA injection
temperature.
0
10
20
30
40
50
60
70
80
90
100
1300 1350 1400 1450 1500 1550 1600
NO
Rem
aini
ng (
%)
Rich Side Additive Injection Temperature (K)
Reburn Alone
Reburn+rich side NH4OH
Reburn+rich side (NH4OH+Na2CO3)
Reburn+rich side NH4OH+lean side NH4OH
Reburn+rich side(NH4OH+Na2CO3)+lean sideNH4OH
Main Fuel: Natural gas @ 20 kW10% Reburn @ 1670 K, OFA @ 1300 KSR1=1.10, SR2=0.99, SR3=1.15NOi=600 ppm as measFirst N-agent added in fuel rich zone: NSR=1.5Second N-agent added w/OFA: NSR=1.5Na2CO3 conc. in flue gas=15 ppm

6-14
2. Promoted AR-Lean provided up to 86% NO reduction at 10% reburning heat input and 15ppm Na
2CO
3 in the flue gas.
3. Promoted AR-Rich provided up to 88% NO reduction at 10% reburning heat input and 15 ppmNa
2CO
3 in the flue gas.
4. MIAR provided up to 91% NO removal, which is expected to increase at larger scale since theinjectors will not affect the temperature profile.

7-1
7.0 PILOT SCALE DEVELOPMENT TESTS
Pilot scale tests were performed to build upon the bench scale results in a test facility more closely
simulating the combustion conditions found in a full scale boiler. The test facility was first configured
to match the residence time-temperature profile of a typical boiler, and then SGAR performance
tests were conducted with both natural gas and coal as primary fuels. A series of sampling test runs
was also performed to determine if the SGAR technologies caused concentrations of any byproduct
species to increase.
7.1 Preparation of Pilot Scale Combustion Facility
The pilot scale test work was conducted in EER’s Boiler Simulation Facility (BSF), which has a
full load firing capacity of 300 kW (1 MMBtu/hr). The BSF is designed to provide an accurate
subscale simulation of the flue gas temperatures and composition found in a full scale boiler. Prior
to the tests the BSF was configured to provide access for all required reburn, additive, and overfire
air injectors.
7.1.1 Boiler Simulator Facility
A schematic of the BSF is shown in Figure 7.1. The furnace is designed with a high degree of
flexibility to produce combustion conditions typical of full scale utility boilers. The BSF consists
of a burner, vertically down–fired radiant furnace, horizontal convective pass, and baghouse. A
variable swirl diffusion burner with an axial fuel injector is used to simulate the approximate
temperature and gas composition of a commercial burner in a full scale boiler. Primary air is injected
axially, while the secondary air stream is injected radially through the swirl vanes to provide controlled
fuel/air mixing. The swirl number can be controlled by adjusting the angle of the swirl vanes.
Numerous ports located along the axis of the facility allow supplementary equipment such as reburn
injectors, additive injectors, overfire air injectors, and sampling probes to be placed in the furnace.
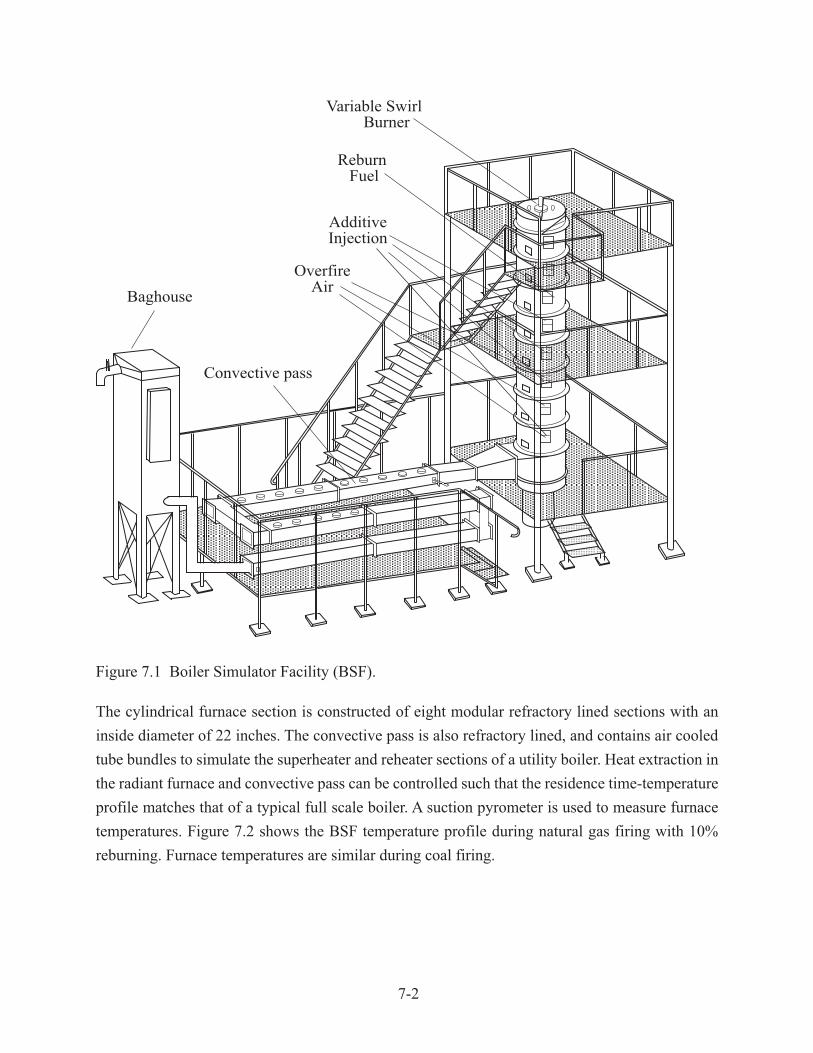
7-2
Figure 7.1 Boiler Simulator Facility (BSF).
The cylindrical furnace section is constructed of eight modular refractory lined sections with an
inside diameter of 22 inches. The convective pass is also refractory lined, and contains air cooled
tube bundles to simulate the superheater and reheater sections of a utility boiler. Heat extraction in
the radiant furnace and convective pass can be controlled such that the residence time-temperature
profile matches that of a typical full scale boiler. A suction pyrometer is used to measure furnace
temperatures. Figure 7.2 shows the BSF temperature profile during natural gas firing with 10%
reburning. Furnace temperatures are similar during coal firing.
Variable Swirl Burner
Baghouse
Reburn Fuel
OverfireAir
Convective pass
AdditiveInjection
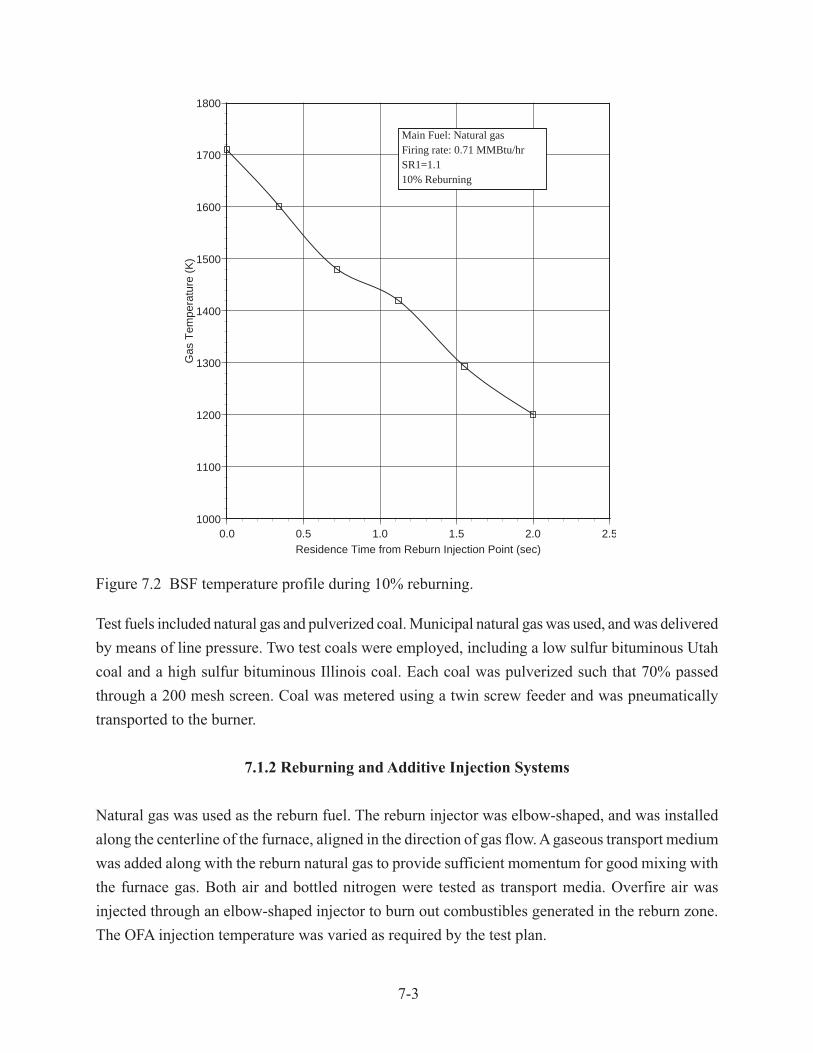
7-3
Figure 7.2 BSF temperature profile during 10% reburning.
Test fuels included natural gas and pulverized coal. Municipal natural gas was used, and was delivered
by means of line pressure. Two test coals were employed, including a low sulfur bituminous Utah
coal and a high sulfur bituminous Illinois coal. Each coal was pulverized such that 70% passed
through a 200 mesh screen. Coal was metered using a twin screw feeder and was pneumatically
transported to the burner.
7.1.2 Reburning and Additive Injection Systems
Natural gas was used as the reburn fuel. The reburn injector was elbow-shaped, and was installed
along the centerline of the furnace, aligned in the direction of gas flow. A gaseous transport medium
was added along with the reburn natural gas to provide sufficient momentum for good mixing with
the furnace gas. Both air and bottled nitrogen were tested as transport media. Overfire air was
injected through an elbow-shaped injector to burn out combustibles generated in the reburn zone.
The OFA injection temperature was varied as required by the test plan.
1000
1100
1200
1300
1400
1500
1600
1700
1800
0.0 0.5 1.0 1.5 2.0 2.5
Gas
Tem
pera
ture
(K
)
Residence Time from Reburn Injection Point (sec)
Main Fuel: Natural gasFiring rate: 0.71 MMBtu/hrSR1=1.110% Reburning

7-4
Nitrogen agents and sodium promoters were injected as aqueous solutions. Twin fluid atomizers
made by Delavan Corp. were used, employing both air and nitrogen as transport media. The additives
were injected into the reburn zone and/or with the OFA. In the latter case, the OFA itself was used
as the atomization medium.
7.1.3 Sampling and Analysis Methods
A continuous emissions monitoring system (CEMS) was used for on-line flue gas analysis. CEMS
equipment and analyzers were identical to those for the bench scale tests, as described in Section
6.1. Manual method sampling was also performed for the following byproduct species:
• NH3 and HCN: EPA Draft Method 206 with ion chromatography analysis
• SO3: controlled condensation
• Fly ash mass loading, size distribution, PM10, and PM2.5: EPA Method 5 and cascade
impactors
• Carbon in ash: Extractive ash sampling with induction furnace analysis
7.2 Pilot Scale Combustion Tests with Natural Gas Firing
In the initial pilot scale tests, natural gas was used as the main and reburning fuel. The initial NO
concentration, 600 ppm, was established by addition of ammonia to primary natural gas. The
reburning fuel (10% of total heat input) provided slightly fuel-rich conditions in the reburn zone
with SR2=0.99. Processes characterized included promoted AR-Lean, promoted AR-Rich, hybrid
AR-Lean/SNCR, hybrid AR-Rich/SNCR, and MIAR.
7.2.1 Promoted AR-Lean
AR-Lean includes the addition of reburning fuel followed by injection of OFA along with an N-
agent. The N-agent can be injected with or without promoter which is dissolved in the aqueous N-
agent solution. In all tests, the amount of N-agent corresponded to NSR=1.5.
Figures 7.3 and 7.4 demonstrate the performance of the AR-Lean process for injection of urea and
aqueous ammonia, respectively. Reburning alone gave about 50% NO reduction, and depended
slightly on the OFA injection location. At OFA injection temperatures of 1140 and 1530 K, NO was
reduced by 52 and 47%, respectively. Injection of urea with OFA provided 53-82% NO reduction
depending on the injection temperature. The performance of ammonia was slightly lower, i.e. 45-

7-5
81%. At an injection location of 1330 K, urea gave 78% NO reduction, while ammonia only 70%.
The results with ammonia injection are qualitatively consistent with modeling (Section 8) taking
into account the fact that ammonia appears in the gas mixture with a short delay time that is necessary
for evaporation of the solution. Addition of sodium carbonate to the N-agent greatly improved NO
reduction. Performance was about equal for ammonia and urea, in the range of 54-94% with optimum
performance obtained between 1200 and 1370 K. These data are in agreement with the CTT results,
although slightly higher NO reduction (by about 2-5 percentage points) was obtained in the BSF.
As in the CTT tests, there is almost no difference in NO reduction between injection of 30 and 50
ppm Na.
Figure 7.3 AR-Lean with aqueous urea/sodium injection.
0
10
20
30
40
50
60
70
80
90
100
1100 1150 1200 1250 1300 1350 1400 1450 1500 1550 1600
NO
Rem
aini
ng (
%)
N- Agent and OFA Peak Injection Temperature (K)
Reburning+ Urea
Reburning+Urea+30 ppm Na
Reburning+Urea+50 ppm Na
Reburning alone
Nat. Gas Main Fuel @ 705,000 Btu/hr10% Nat. Gas Reburning, N2 transport.Advanced Reburning, Urea injected w/ OFA,SR1= 1.10, SR2= 0.99 and SR3= 1.15Urea and Na2CO3 premixed, N2 atomization.
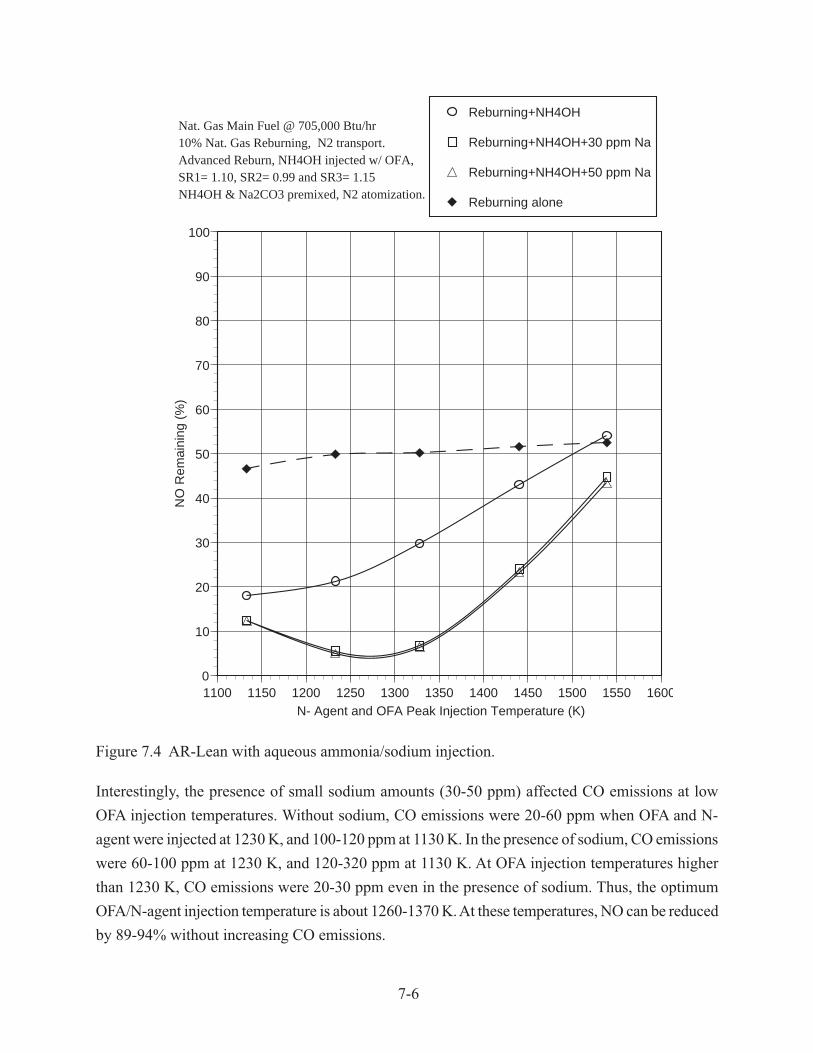
7-6
Figure 7.4 AR-Lean with aqueous ammonia/sodium injection.
Interestingly, the presence of small sodium amounts (30-50 ppm) affected CO emissions at low
OFA injection temperatures. Without sodium, CO emissions were 20-60 ppm when OFA and N-
agent were injected at 1230 K, and 100-120 ppm at 1130 K. In the presence of sodium, CO emissions
were 60-100 ppm at 1230 K, and 120-320 ppm at 1130 K. At OFA injection temperatures higher
than 1230 K, CO emissions were 20-30 ppm even in the presence of sodium. Thus, the optimum
OFA/N-agent injection temperature is about 1260-1370 K. At these temperatures, NO can be reduced
by 89-94% without increasing CO emissions.
0
10
20
30
40
50
60
70
80
90
100
1100 1150 1200 1250 1300 1350 1400 1450 1500 1550 1600
NO
Rem
aini
ng (
%)
N- Agent and OFA Peak Injection Temperature (K)
Reburning+NH4OH
Reburning+NH4OH+30 ppm Na
Reburning+NH4OH+50 ppm Na
Reburning alone
Nat. Gas Main Fuel @ 705,000 Btu/hr10% Nat. Gas Reburning, N2 transport.Advanced Reburn, NH4OH injected w/ OFA,SR1= 1.10, SR2= 0.99 and SR3= 1.15NH4OH & Na2CO3 premixed, N2 atomization.

7-7
7.2.2 Promoted AR-Rich
The AR-Rich process includes injection of reburning fuel, injection of N-agent into the reburning
zone, and injection of OFA. The N-agent can be injected with or without promoter which is, as in
AR-Lean, dissolved in an aqueous solution of the N-agent. In all tests the amount of N-agent
corresponded to NSR=1.5.
The performance of AR-Rich greatly depends on the OFA injection temperature. Figures 7.5 and
7.6 show experimental results obtained with injection of urea and aqueous ammonia, respectively,
for OFA injection at 1180 K. Each reagent provided 70-77% NO reduction, depending on injection
temperature. However, addition of sodium carbonate at 30-50 ppm Na significantly improved NO
reduction, up to 94-95%. Again, the reduction of NO in the BSF was a few percentage points better
than that in the bench scale CTT.
Figure 7.5 AR-Rich with urea/sodium injection. OFA is injected at 1180 K.
0
10
20
30
40
50
60
70
80
90
100
1100 1150 1200 1250 1300 1350 1400 1450 1500 1550 1600
NO
Rem
aini
ng (
%)
N- Agent and OFA Peak Injection Temperature (K)
Reburning+Urea
Reburning+Urea+30 ppm Na
Reburning+Urea+50 ppm Na
Reburning alone
Nat. Gas Main Fuel @ 705,000 Btu/hr10% Nat. Gas Reburning, N2 transport.Advanced Reburn, Urea injected in reburn zoneSR1= 1.10, SR2= 0.99 and SR3= 1.15Urea & Na2CO3 premixed, N2 atomization.

7-8
Figure 7.6 AR-Rich with ammonia/sodium injection. OFA is injected at 1180 K.
Surprisingly, injection of 30-50 ppm sodium resulted in much higher CO emissions (at low OFA
injection temperatures) than in the AR-Lean process. Without sodium, CO emissions were within
10-25 ppm, but injection of sodium caused greater than 2500 ppm CO emissions. This effect (higher
CO emissions after injection of sodium under fuel rich conditions) was noticed earlier in the CTT
tests, but measurement accuracy was considered to be questionable. In the BSF tests, CO
measurements were carefully checked and repeated. High CO emissions show that in the presence
of sodium the process of CO oxidation is inhibited. This inhibition effect is stronger under fuel rich
conditions. A possible explanation of this effect is the existence of the chain reaction involving
sodium compounds, H atoms and OH radicals:
NaOH + H → Na + H2O (7.1)
Na + OH + M → NaOH + M (7.2)
0
10
20
30
40
50
60
70
80
90
100
1100 1150 1200 1250 1300 1350 1400 1450 1500 1550 1600
NO
Rem
aini
ng (
%)
N- Agent and OFA Peak Injection Temperature (K)
Reburning+ NH4OH
Reburning+NH4OH+30 ppm Na
Reburning+NH4OH+50 ppm Na
Reburning alone
Nat. Gas Main Fuel @ 705,000 Btu/hr10% Nat. Gas Reburning, N2 transport.Advanced Reburn, NH4OH injected in reburn zoneSR1= 1.10, SR2= 0.99 and SR3= 1.15NH4OH & Na2CO3 premixed, N2 atomization.
7-9
Sodium hydroxide, NaOH, can be formed via thermal decomposition of sodium carbonate followed
by the reaction of sodium oxide with water vapor that is available in flue gas:
Na2CO3 = Na2O + CO2 (7.3)
Na2O + H2O = 2 NaOH (7.4)
Then, NaOH reacts with H atoms via reaction (7.1) to form Na atoms and H2O molecules. The Na
atoms can then recombine with OH radicals to return NaOH (7.2). The total reaction (7.1)+(7.2) is
just H and OH recombination into water:
Total (7.1)+(7.2): H + OH + M → H2O + M (7.5)
Thus, under certain conditions, the total amount of H and OH radicals can be reduced, due to the
presence of sodium compounds. As a result, CO can escape oxidation, since the main reaction of
CO oxidation is the interaction with hydroxyl radicals:
CO + OH → CO2 + H (7.6)
Under fuel rich conditions, the total amount of radicals is typically lower than under fuel lean
conditions. Therefore, this mechanism of radicals suppression can be more important under fuel
rich conditions. The experimental effort at the University of Texas (Section 5) and the modeling
study (Section 8) were conducted to model and better understand the reactions of Na in flue gas. A
preliminary reaction mechanism with Na reactions was selected and is presented in Section 8.
Similar to AR-Lean, increasing the OFA temperature during AR-Rich can decrease CO emissions
in the presence of sodium. AR-Rich tests were conducted with two higher OFA temperatures: 1380
and 1510 K. Figures 7.7 and 7.8 present the results. Injection of 20 g/min water in the reburning
zone did not change NO reduction. When urea was added, 60-70% NO reduction was achieved.
Sodium promoted the reaction up to 80-90% NO reduction, i.e. 10-20% NO remaining. CO emissions
were also found to decrease to near baseline levels at these high OFA temperatures.
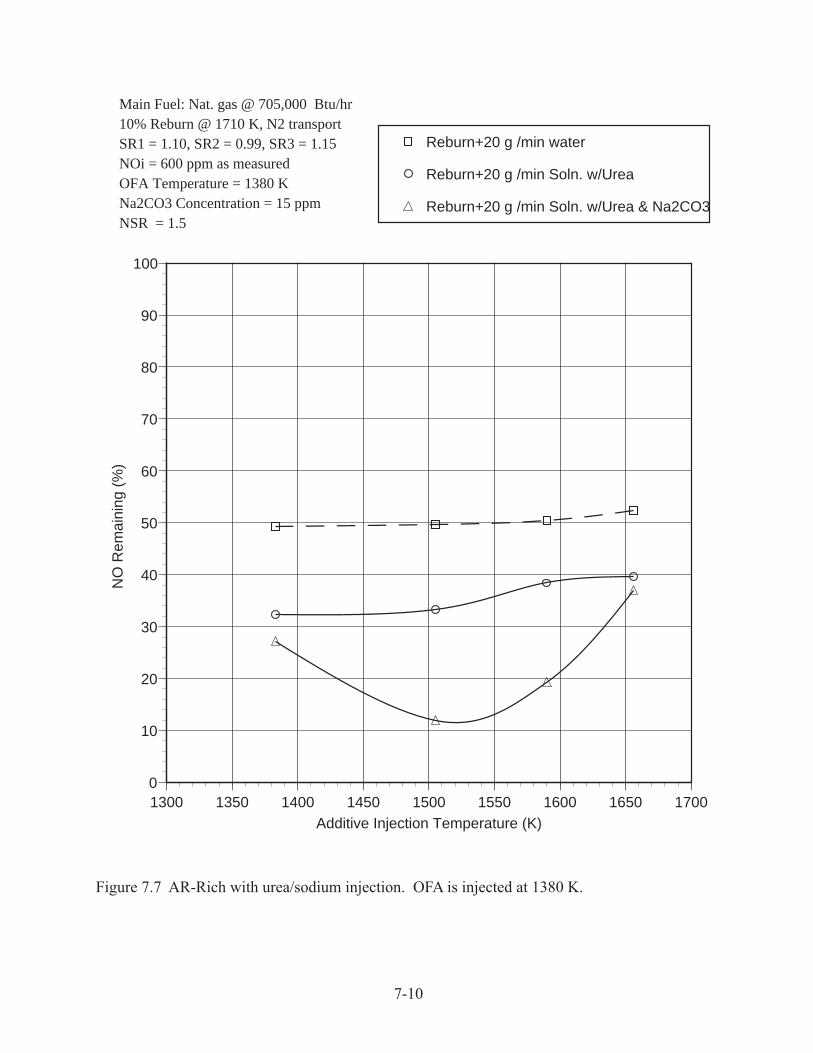
7-10
Figure 7.7 AR-Rich with urea/sodium injection. OFA is injected at 1380 K.
0
10
20
30
40
50
60
70
80
90
100
1300 1350 1400 1450 1500 1550 1600 1650 1700
NO
Rem
aini
ng (
%)
Additive Injection Temperature (K)
Reburn+20 g /min water
Reburn+20 g /min Soln. w/Urea
Reburn+20 g /min Soln. w/Urea & Na2CO3
Main Fuel: Nat. gas @ 705,000 Btu/hr10% Reburn @ 1710 K, N2 transportSR1 = 1.10, SR2 = 0.99, SR3 = 1.15NOi = 600 ppm as measuredOFA Temperature = 1380 KNa2CO3 Concentration = 15 ppmNSR = 1.5
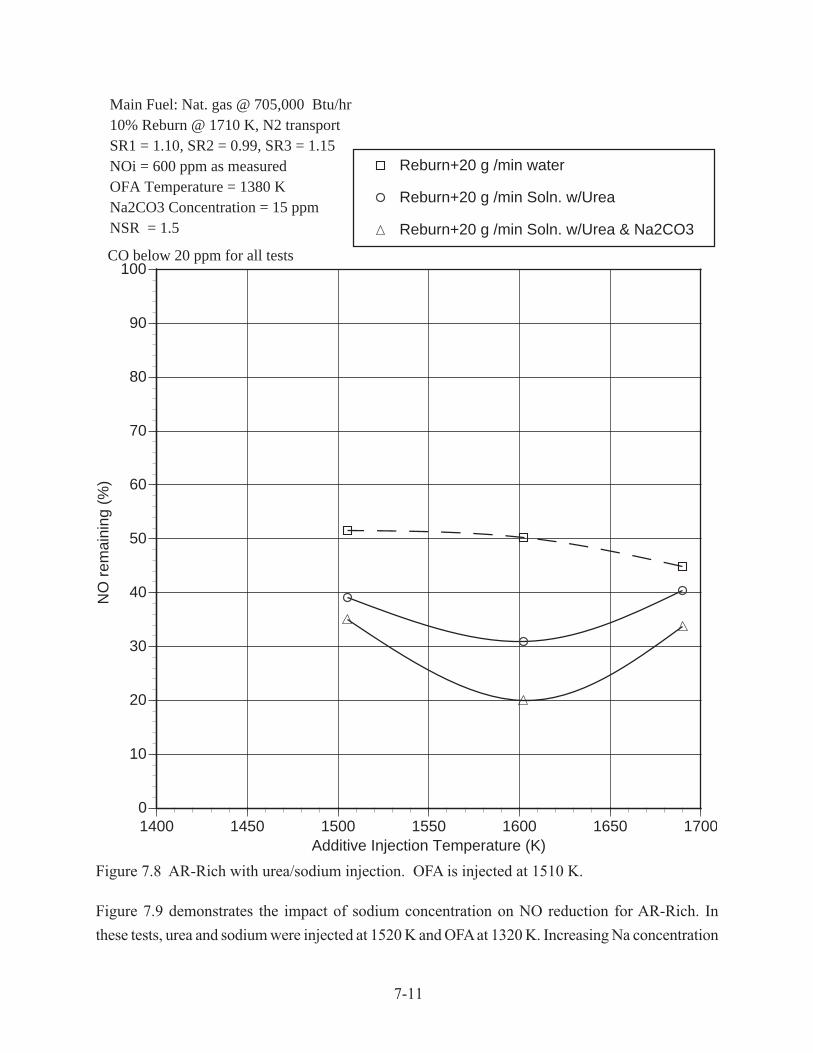
7-11
Figure 7.8 AR-Rich with urea/sodium injection. OFA is injected at 1510 K.
Figure 7.9 demonstrates the impact of sodium concentration on NO reduction for AR-Rich. In
these tests, urea and sodium were injected at 1520 K and OFA at 1320 K. Increasing Na concentration
0
10
20
30
40
50
60
70
80
90
100
1400 1450 1500 1550 1600 1650 1700
NO
rem
aini
ng (
%)
Additive Injection Temperature (K)
Reburn+20 g /min water
Reburn+20 g /min Soln. w/Urea
Reburn+20 g /min Soln. w/Urea & Na2CO3
CO below 20 ppm for all tests
Main Fuel: Nat. gas @ 705,000 Btu/hr10% Reburn @ 1710 K, N2 transportSR1 = 1.10, SR2 = 0.99, SR3 = 1.15NOi = 600 ppm as measuredOFA Temperature = 1380 KNa2CO3 Concentration = 15 ppmNSR = 1.5

7-12
from 0 to 55 ppm resulted in improvement of NO reduction from 76 to 90%. However, the CO
emissions increased from 20 ppm at Na=0 to 65 ppm at Na=22 ppm and to 500 ppm at Na=55 ppm.
Thus, injection of sodium with a N-agent in the reburn zone requires a temperature of OFA injection
higher than 1320 K to prevent CO formation. This result demonstrates the importance of sodium
chemistry in NO control via reburning.
Figure 7.9 Effect of sodium on NO reduction in AR-Rich.
7.2.3 Hybrid AR-Lean/SNCR
Combined AR-Lean/SNCR tests were then conducted at the BSF. In these tests, the reburning fuel
was injected at 1640 K and N-agent (aqueous ammonia or urea) was added with the OFA at 1370 K.
Then, a second N-agent was injected under fuel lean conditions at 1160 K. Concentration of each
N-agent corresponded to NSR=1.5. NO reduction was measured with and without addition of sodium
0
10
20
30
40
50
60
70
80
90
100
0 10 20 30 40 50 60 70
NO
rem
aini
ng (
%)
Na Concentration (ppm)
Main Fuel: Natural gas @ 705,000 Btu/hr10% Reburn with N2 TransportOFA at 1320 KUrea and Na2CO3 injection at 1520 KSR1 = 1.10, SR2 = 0.99, SR3 = 1.15NOi = 600 ppm as measuredNSR = 1.5
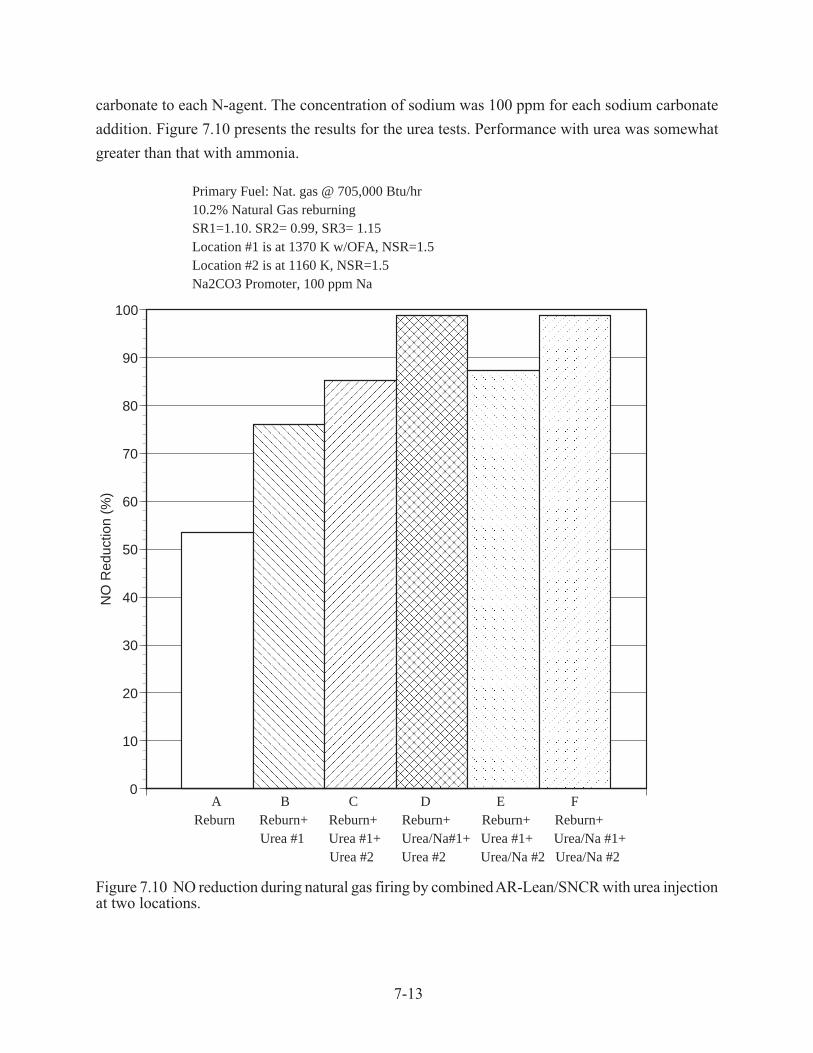
7-13
carbonate to each N-agent. The concentration of sodium was 100 ppm for each sodium carbonate
addition. Figure 7.10 presents the results for the urea tests. Performance with urea was somewhat
greater than that with ammonia.
Figure 7.10 NO reduction during natural gas firing by combined AR-Lean/SNCR with urea injectionat two locations.
0
10
20
30
40
50
60
70
80
90
100
NO
Red
uctio
n (%
)
Primary Fuel: Nat. gas @ 705,000 Btu/hr10.2% Natural Gas reburningSR1=1.10. SR2= 0.99, SR3= 1.15Location #1 is at 1370 K w/OFA, NSR=1.5Location #2 is at 1160 K, NSR=1.5Na2CO3 Promoter, 100 ppm Na
A B C D E F Reburn Reburn+ Reburn+ Reburn+ Reburn+ Reburn+ Urea #1 Urea #1+ Urea/Na#1+ Urea #1+ Urea/Na #1+ Urea #2 Urea #2 Urea/Na #2 Urea/Na #2

7-14
Reburning alone (bar A) gave 53% NO reduction. Injection of urea with OFA, i.e. AR-Lean resulted
in 76% NO removal, bar B. Injection of a second N-agent increased the NOx control to 85%, bar C.
The best result was achieved when sodium was injected with the first N-agent, bar D, for which NO
removal increased from 85 to above 98%. Addition of sodium to the second N-agent was not effective,
(see bars E and F). There is almost no difference in NO reduction for bars C and E, as well as for
bars D and F. This would appear to imply that it is necessary to add the promoter with the high
temperature N-agent for optimum performance.
7.2.4 MIAR
MIAR tests were conducted with natural gas as both the main and reburn fuels. N-agents and
promoters were injected at rich and lean side locations. Rich and lean side additive injection
temperatures and SR2 were varied. In all tests urea was used as the N-agent and Na2CO3 was used
as the promoter.
Tests were performed at SR2 values of 0.99 (10% reburning) and 0.90 (18% reburning). In the first
test series, rich side additive injection temperature was varied from 1370 to 1530 K, and lean side
additives were injected along with the OFA at 1310 K. Figure 7.11 shows NO reduction as a
function of rich side additive injection temperature at SR2 = 0.99. The systems were fairly insensitive
to temperature. Reburning alone gave 49% NO reduction. Reburning plus rich and lean side N-
agents with no promoters gave 77 - 82% NO reduction. Addition of sodium promoter to the lean
side additive improved NO reduction by about 4 percentage points at each temperature. When
sodium promoter was added to the rich side N-agent, NO reduction increased to 95 - 97%. Addition
of sodium to both N-agents also gave 95 - 97% NO reduction. These results indicate that for
natural gas firing sodium is most effective when added to the rich side additive.

7-15
Figure 7.11 Effect of rich side additive injection temperature upon MIAR performance duringnatural gas firing at SR2 = 0.99.
The promoters also demonstrated the ability to control N2O emissions. When N-agents were injected
without promoters, N2O ranged from 80 ppm at 1370 K to 39 ppm at 1530 K. When sodium
promoters were added with either N-agent, N2O fell to near zero.
Figure 7.12 shows NO reduction as a function of rich side additive injection temperature at SR2 =
0.90. Reburn alone provided 72% NO control. The N-agents provided limited additional NO
control, and in some cases actually caused NO to increase. Sodium promoted addition improved
performance, with the strongest effects seen when promoter was added in the rich zone. Maximum
NO control was 90% at a rich side additive injection temperature of 1370 K. N2O ranged from 13
to 32 ppm with N-agents but no promoter, and decreased to near zero when sodium was added.
1
11
C
CC
GGGEEE
0
10
20
30
40
50
60
70
80
90
100
1100 1200 1300 1400 1500 1600
NO
Rem
aini
ng (
%)
Rich Side Additive Injection Temperature (K)
Reburning
1 Reburning +Rich N-agent+Lean N-agent
C Reburning +Rich N-agent+Lean N-agent w/Na
G Reburning +Rich N-agent w/Na+Lean N-agent
E Reburning +Rich N-agent w/Na+Lean N-agent w/Na
BSF, Firing Rate: 705,000 Btu/HrMain Fuel: Nat.Gas, 10% Nat.Gas ReburnSR1=1.10, SR2=0.99 and SR3=1.15NOi=600 ppm @0%O2Rich side urea + Na2CO3 injection temperature variedLean side urea + Na2CO3 injected w/OFA at 1310 K30 ppm Na

7-16
Figure 7.12 Effect of rich side additive injection temperature upon MIAR performance duringnatural gas firing at SR2 = 0.90.
The test results indicate that optimum MIAR performance is obtained at SR2 = 0.99 (10% reburning).
This relatively low reburn heat input has several operational advantages. Specifically, the near-
stoichiometric conditions serves to minimize high temperature boiler corrosion problems, and the
low reburn heat input minimizes changes in boiler heat distribution and corresponding decreases in
thermal efficiency.
7.3 Pilot Scale Combustion Tests with Coal Firing
Pilot scale tests were then conducted with coal as the primary fuel and natural gas as the reburning
fuel. Both low sulfur Utah coal and high sulfur Illinois coal were tested. The initial NO concentration
was 800-1000 ppm. Processes characterized included promoted AR-Lean, promoted AR-Rich, hybrid
AR-Lean/SNCR, and MIAR. A series of byproduct sampling runs was also conducted while firing
coal.
11
1 CC
C GG
G
EE
E
0
10
20
30
40
50
60
70
80
90
100
1100 1200 1300 1400 1500 1600
NO
Rem
aini
ng (
%)
Rich Side Additive Injection Temperature (K)
Reburning
1 Reburning +Rich N-agent+Lean N-agent
C Reburning +Rich N-agent+Lean N-agent w/Na
G Reburning +Rich N-agent w/Na+Lean N-agent
E Reburning +Rich N-agent w/Na+Lean N-agent w/Na
BSF, Firing Rate: 705,000 Btu/HrMain Fuel: Nat.Gas, 18% Nat.Gas ReburnSR1=1.10, SR2=0.90 and SR3=1.15NOi=600 ppm @0%O2Rich side urea + Na2CO3 injection temperature variedLean side urea + Na2CO3 injected w/OFA at 1310 K30 ppm Na
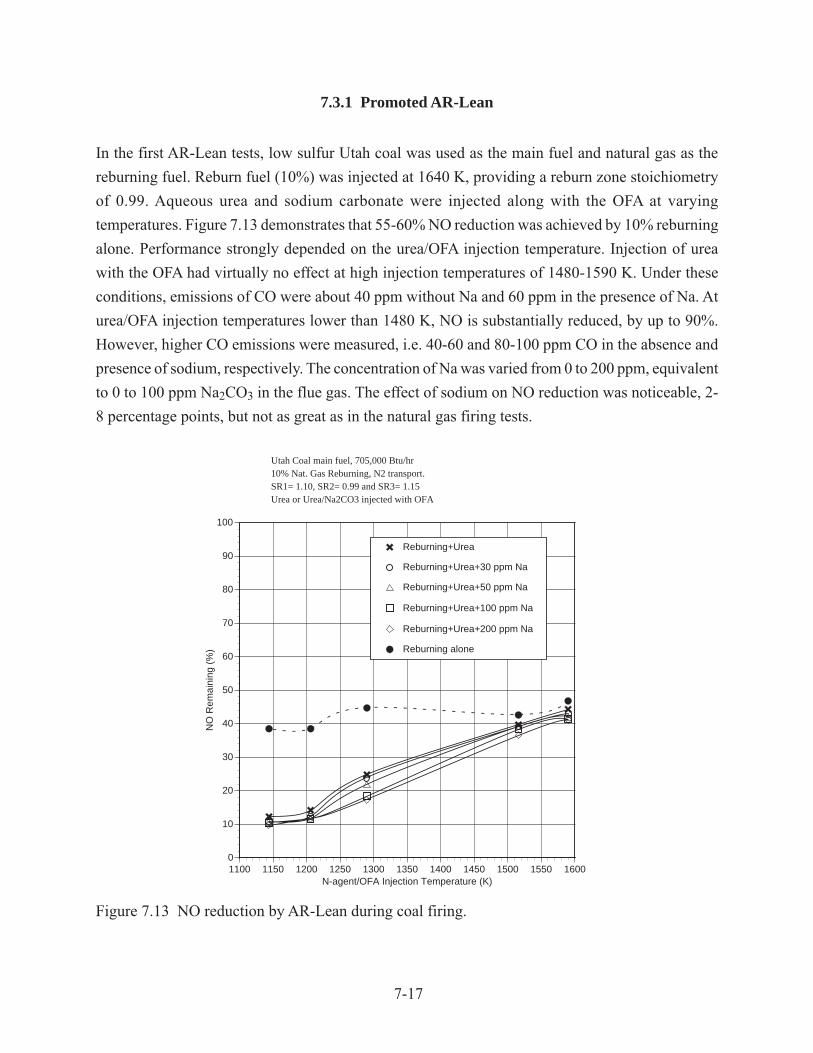
7-17
7.3.1 Promoted AR-Lean
In the first AR-Lean tests, low sulfur Utah coal was used as the main fuel and natural gas as the
reburning fuel. Reburn fuel (10%) was injected at 1640 K, providing a reburn zone stoichiometry
of 0.99. Aqueous urea and sodium carbonate were injected along with the OFA at varying
temperatures. Figure 7.13 demonstrates that 55-60% NO reduction was achieved by 10% reburning
alone. Performance strongly depended on the urea/OFA injection temperature. Injection of urea
with the OFA had virtually no effect at high injection temperatures of 1480-1590 K. Under these
conditions, emissions of CO were about 40 ppm without Na and 60 ppm in the presence of Na. At
urea/OFA injection temperatures lower than 1480 K, NO is substantially reduced, by up to 90%.
However, higher CO emissions were measured, i.e. 40-60 and 80-100 ppm CO in the absence and
presence of sodium, respectively. The concentration of Na was varied from 0 to 200 ppm, equivalent
to 0 to 100 ppm Na2CO3 in the flue gas. The effect of sodium on NO reduction was noticeable, 2-
8 percentage points, but not as great as in the natural gas firing tests.
Figure 7.13 NO reduction by AR-Lean during coal firing.
0
10
20
30
40
50
60
70
80
90
100
1100 1150 1200 1250 1300 1350 1400 1450 1500 1550 1600
NO
Rem
aini
ng (
%)
N-agent/OFA Injection Temperature (K)
Reburning+Urea
Reburning+Urea+30 ppm Na
Reburning+Urea+50 ppm Na
Reburning+Urea+100 ppm Na
Reburning+Urea+200 ppm Na
Reburning alone
Utah Coal main fuel, 705,000 Btu/hr10% Nat. Gas Reburning, N2 transport.SR1= 1.10, SR2= 0.99 and SR3= 1.15Urea or Urea/Na2CO3 injected with OFA
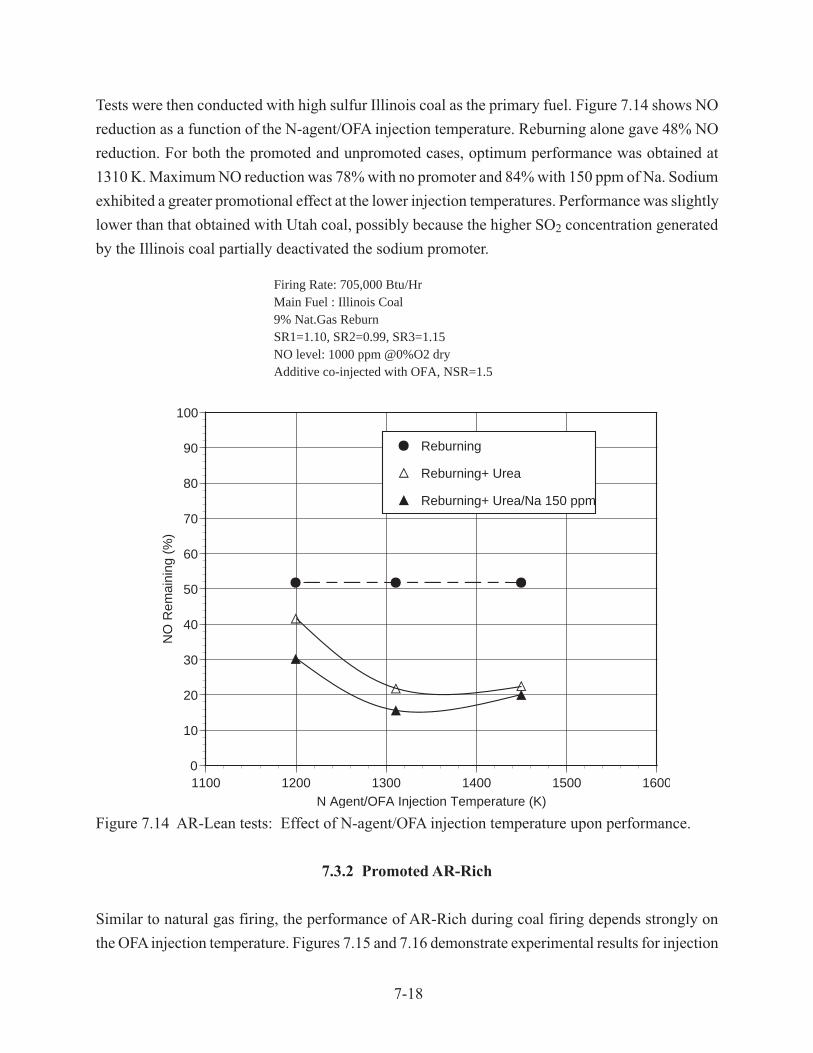
7-18
Tests were then conducted with high sulfur Illinois coal as the primary fuel. Figure 7.14 shows NO
reduction as a function of the N-agent/OFA injection temperature. Reburning alone gave 48% NO
reduction. For both the promoted and unpromoted cases, optimum performance was obtained at
1310 K. Maximum NO reduction was 78% with no promoter and 84% with 150 ppm of Na. Sodium
exhibited a greater promotional effect at the lower injection temperatures. Performance was slightly
lower than that obtained with Utah coal, possibly because the higher SO2 concentration generated
by the Illinois coal partially deactivated the sodium promoter.
Figure 7.14 AR-Lean tests: Effect of N-agent/OFA injection temperature upon performance.
7.3.2 Promoted AR-Rich
Similar to natural gas firing, the performance of AR-Rich during coal firing depends strongly on
the OFA injection temperature. Figures 7.15 and 7.16 demonstrate experimental results for injection
JJJ
CC
C
H
H
H
0
10
20
30
40
50
60
70
80
90
100
1100 1200 1300 1400 1500 1600
NO
Rem
aini
ng (
%)
N Agent/OFA Injection Temperature (K)
J Reburning
C Reburning+ Urea
H Reburning+ Urea/Na 150 ppm
Firing Rate: 705,000 Btu/HrMain Fuel : Illinois Coal9% Nat.Gas ReburnSR1=1.10, SR2=0.99, SR3=1.15NO level: 1000 ppm @0%O2 dryAdditive co-injected with OFA, NSR=1.5
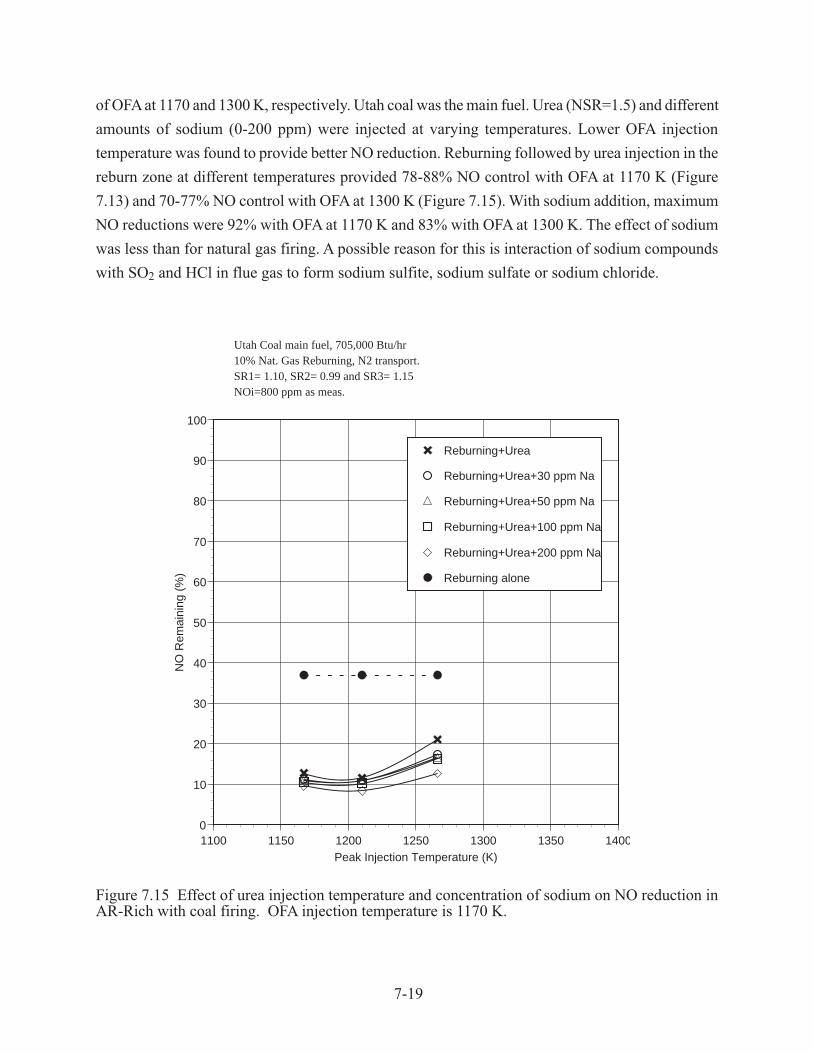
7-19
of OFA at 1170 and 1300 K, respectively. Utah coal was the main fuel. Urea (NSR=1.5) and different
amounts of sodium (0-200 ppm) were injected at varying temperatures. Lower OFA injection
temperature was found to provide better NO reduction. Reburning followed by urea injection in the
reburn zone at different temperatures provided 78-88% NO control with OFA at 1170 K (Figure
7.13) and 70-77% NO control with OFA at 1300 K (Figure 7.15). With sodium addition, maximum
NO reductions were 92% with OFA at 1170 K and 83% with OFA at 1300 K. The effect of sodium
was less than for natural gas firing. A possible reason for this is interaction of sodium compounds
with SO2 and HCl in flue gas to form sodium sulfite, sodium sulfate or sodium chloride.
Figure 7.15 Effect of urea injection temperature and concentration of sodium on NO reduction inAR-Rich with coal firing. OFA injection temperature is 1170 K.
0
10
20
30
40
50
60
70
80
90
100
1100 1150 1200 1250 1300 1350 1400
NO
Rem
aini
ng (
%)
Peak Injection Temperature (K)
Reburning+Urea
Reburning+Urea+30 ppm Na
Reburning+Urea+50 ppm Na
Reburning+Urea+100 ppm Na
Reburning+Urea+200 ppm Na
Reburning alone
Utah Coal main fuel, 705,000 Btu/hr10% Nat. Gas Reburning, N2 transport.SR1= 1.10, SR2= 0.99 and SR3= 1.15NOi=800 ppm as meas.

7-20
Figure 7.16 Effect of urea injection temperature and concentration of sodium on NO reduction inAR-Rich with coal firing. OFA injection temperature is 1300 K.
For injection of OFA at 1170 K, CO emissions were about 60 ppm without sodium and 100 ppm in
the presence of sodium. Variation of the sodium concentration did not affect CO emissions. At an
OFA injection temperature of 1300 K, CO emissions were about 40 and 60 ppm in the absence and
in the presence of sodium, respectively.
AR-Rich tests were then conducted with high sulfur Illinois coal as the main fuel, with OFA added
at 1310 K. Figure 7.17 shows NO reduction as a function of the N-agent injection temperature.
Performance increased with decreasing injection temperature, with greatest NO reduction obtained
at 1370 K. Maximum NO control was 86% with no promoter and 93% with 150 ppm sodium. The
incremental benefit provided by the sodium promoter appeared to increase with decreasing
temperature.
0
10
20
30
40
50
60
70
80
90
100
1200 1250 1300 1350 1400 1450 1500 1550 1600
NO
Rem
aini
ng (
%)
Peak Injection Temperature (K)
Reburning+Urea
Reburning+Urea+30 ppm Na
Reburning+Urea+50 ppm Na
Reburning+Urea+100 ppm Na
Reburning+Urea+200 ppm Na
Reburning alone
Utah Coal main fuel, 705,000 Btu/hr10% Nat. Gas Reburning, N2 transport.SR1= 1.10, SR2= 0.99 and SR3= 1.15NOi=800 ppm as meas.

7-21
Figure 7.17 AR-Rich tests: Effect of N-agent injection temperature upon performance.
Illinois coal AR-Rich tests were then conducted in which the OFA injection temperature was varied,
with the N-agent injection temperature held constant at 1530 K. This temperature is well above the
optimum, but is of interest for boilers that have limited access at lower temperatures for liquid
injectors. As shown in Figure 7.18, performance increased with decreasing OFA temperature. Sodium
provided an incremental increase in NO reduction of about 6 percentage points at each temperature.
JJJJJJ
CCCC
C
C
H
H
HH
H
H
0
10
20
30
40
50
60
70
80
90
100
1300 1400 1500 1600 1700 1800
NO
Rem
aini
ng (
%)
N-Agent Injection Temperature (K)
J Reburning
C Reburning+ Urea
H Reburning+ Urea/Na 150 ppm
Firing Rate: 705,000 Btu/HrMain Fuel : Illinois Coal9% Nat.Gas ReburnSR1=1.10, SR2=0.99, SR3=1.15NO level: 1000 ppm @0%O2 dryOFA injected at 1310 K, NSR=1.5

7-22
Figure 7.18 AR-Rich tests: Effect of OFA injection temperature upon performance.
Illinois coal AR-Rich tests were then conducted at high sodium concentrations to define the maximum
achievable extent of NO reduction. Sodium promoter concentration was varied from 0 to 2000
ppm. Reburn zone SR was 0.99, additives were injected at 1450 K, and OFA was injected at 1370
K. As shown in Figure 7.19, NO reduction increased from 63% at 0 ppm sodium to 86% at 2000
ppm sodium. The main drawback of high sodium level is the potential for increased boiler fouling.
A sodium concentration of 150 ppm was selected for most of the test work as a concentration
providing significant promotion while being low enough to minimize fouling effects. As shown in
Figure 7.19, this level of sodium addition can also provide a small degree of SO2 control by reaction
to form sodium sulfate.
JJJC
C
C
H
H
H
0
10
20
30
40
50
60
70
80
90
100
1100 1200 1300 1400 1500 1600
NO
Rem
aini
ng (
%)
OFA Injection Temperature (K)
J Reburning
C Reburning+ Urea
H Reburning+ Urea/Na 150 ppm
Firing Rate: 705,000 Btu/HrMain Fuel : Illinois Coal9% Nat.Gas ReburnSR1=1.10, SR2=0.99, SR3=1.15NO level: 1000 ppm @0%O2 dryAdditive injected at 1530 K, NSR=1.5
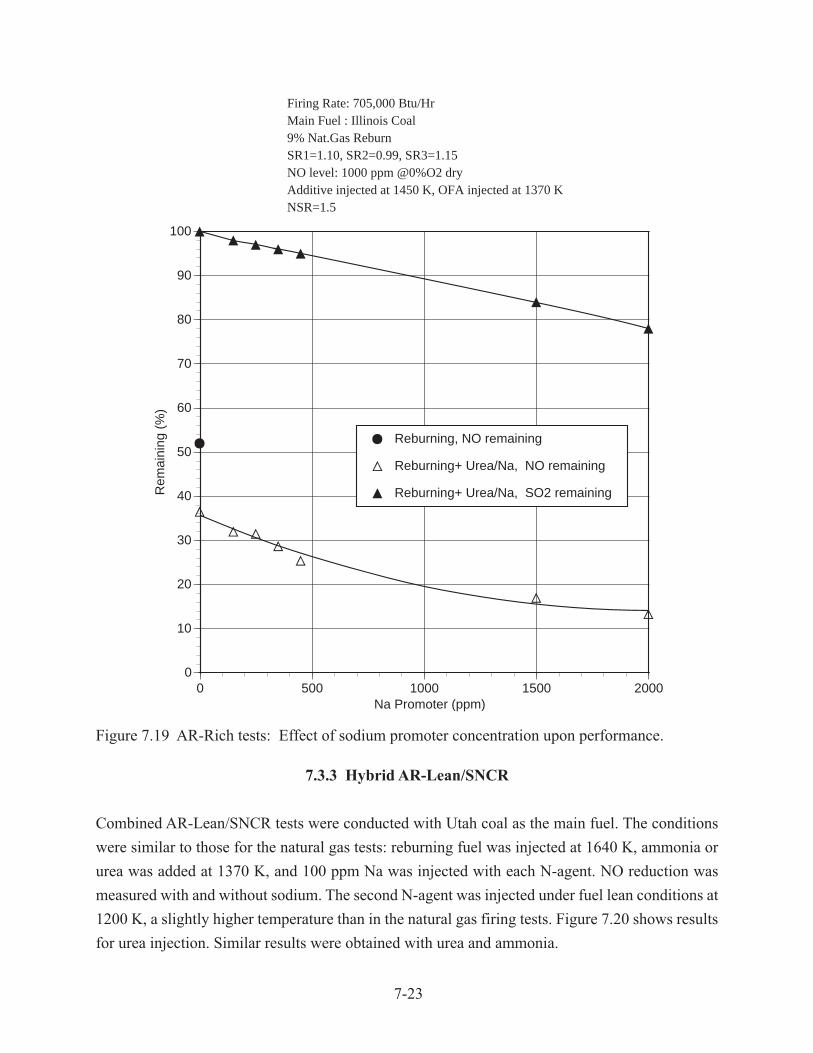
7-23
Figure 7.19 AR-Rich tests: Effect of sodium promoter concentration upon performance.
7.3.3 Hybrid AR-Lean/SNCR
Combined AR-Lean/SNCR tests were conducted with Utah coal as the main fuel. The conditions
were similar to those for the natural gas tests: reburning fuel was injected at 1640 K, ammonia or
urea was added at 1370 K, and 100 ppm Na was injected with each N-agent. NO reduction was
measured with and without sodium. The second N-agent was injected under fuel lean conditions at
1200 K, a slightly higher temperature than in the natural gas firing tests. Figure 7.20 shows results
for urea injection. Similar results were obtained with urea and ammonia.
J
C
C
C
CCC
C
H
H
HHHHH
0
10
20
30
40
50
60
70
80
90
100
0 500 1000 1500 2000
Rem
aini
ng (
%)
Na Promoter (ppm)
J Reburning, NO remaining
C Reburning+ Urea/Na, NO remaining
H Reburning+ Urea/Na, SO2 remaining
Firing Rate: 705,000 Btu/HrMain Fuel : Illinois Coal9% Nat.Gas ReburnSR1=1.10, SR2=0.99, SR3=1.15NO level: 1000 ppm @0%O2 dryAdditive injected at 1450 K, OFA injected at 1370 KNSR=1.5

7-24
Figure 7.20 NO reduction during coal firing by combined AR-Lean/SNCR with urea injection attwo locations.
It is of interest to compare the performance of the combined AR-Lean/SNCR process for natural
gas and coal firing, as summarized in Table 7.1. Corresponding test conditions are shown in Figures
7.10 and 7.20 for gas and coal firing, respectively.
0
10
20
30
40
50
60
70
80
90
100
NO
Red
uctio
n (%
)Primary Fuel: Utah coal @ 705,000 Btu/hr10.2% Natural Gas reburningSR1=1.10. SR2= 0.99, SR3= 1.15Location #1 is at 1370 K w/OFA, NSR=1.5Location #2 is at 1200 K, NSR=1.5Na2CO3 Promoter, 100 ppm Na
A B C D E F Reburn Reburn+ Reburn+ Reburn+ Reburn+ Reburn+ Urea #1 Urea #1+ Urea/Na#1+ Urea #1+ Urea/Na #1+ Urea #2 Urea #2 Urea/Na #2 Urea/Na #2
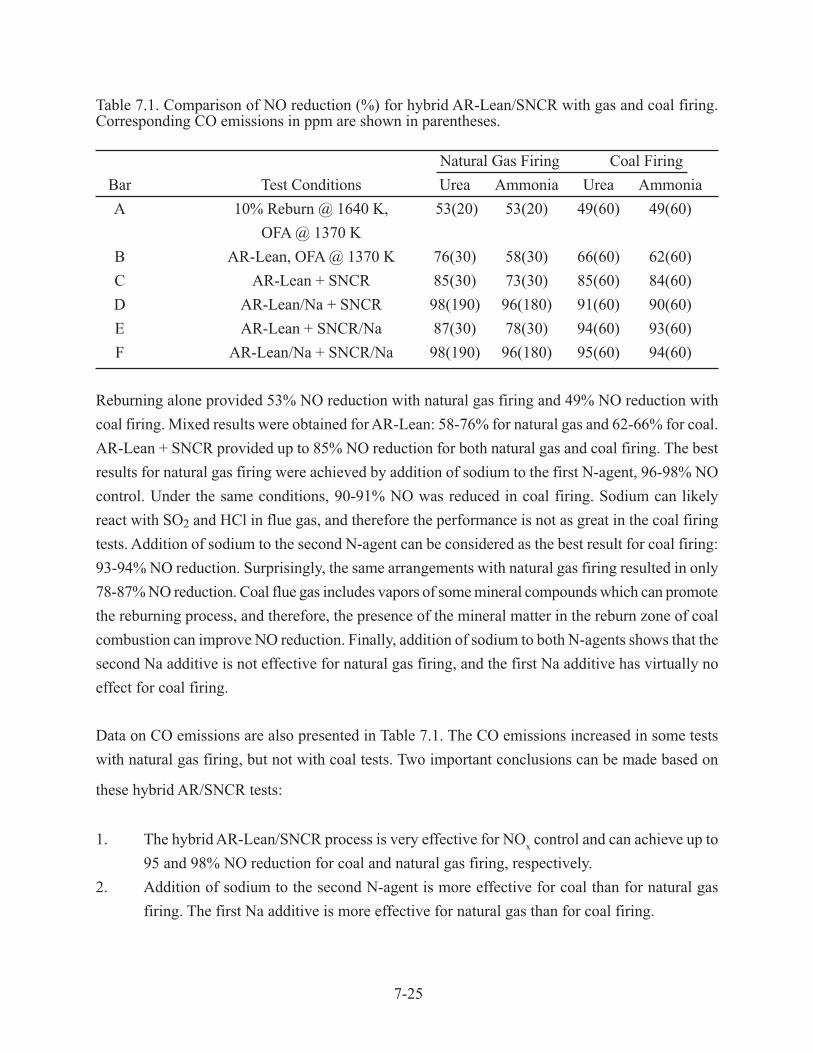
7-25
Table 7.1. Comparison of NO reduction (%) for hybrid AR-Lean/SNCR with gas and coal firing.Corresponding CO emissions in ppm are shown in parentheses.
Natural Gas Firing Coal Firing
Bar Test Conditions Urea Ammonia Urea Ammonia
A 10% Reburn @ 1640 K, 53(20) 53(20) 49(60) 49(60)
OFA @ 1370 K
B AR-Lean, OFA @ 1370 K 76(30) 58(30) 66(60) 62(60)
C AR-Lean + SNCR 85(30) 73(30) 85(60) 84(60)
D AR-Lean/Na + SNCR 98(190) 96(180) 91(60) 90(60)
E AR-Lean + SNCR/Na 87(30) 78(30) 94(60) 93(60)
F AR-Lean/Na + SNCR/Na 98(190) 96(180) 95(60) 94(60)
Reburning alone provided 53% NO reduction with natural gas firing and 49% NO reduction with
coal firing. Mixed results were obtained for AR-Lean: 58-76% for natural gas and 62-66% for coal.
AR-Lean + SNCR provided up to 85% NO reduction for both natural gas and coal firing. The best
results for natural gas firing were achieved by addition of sodium to the first N-agent, 96-98% NO
control. Under the same conditions, 90-91% NO was reduced in coal firing. Sodium can likely
react with SO2 and HCl in flue gas, and therefore the performance is not as great in the coal firing
tests. Addition of sodium to the second N-agent can be considered as the best result for coal firing:
93-94% NO reduction. Surprisingly, the same arrangements with natural gas firing resulted in only
78-87% NO reduction. Coal flue gas includes vapors of some mineral compounds which can promote
the reburning process, and therefore, the presence of the mineral matter in the reburn zone of coal
combustion can improve NO reduction. Finally, addition of sodium to both N-agents shows that the
second Na additive is not effective for natural gas firing, and the first Na additive has virtually no
effect for coal firing.
Data on CO emissions are also presented in Table 7.1. The CO emissions increased in some tests
with natural gas firing, but not with coal tests. Two important conclusions can be made based on
these hybrid AR/SNCR tests:
1. The hybrid AR-Lean/SNCR process is very effective for NOx control and can achieve up to
95 and 98% NO reduction for coal and natural gas firing, respectively.
2. Addition of sodium to the second N-agent is more effective for coal than for natural gas
firing. The first Na additive is more effective for natural gas than for coal firing.

7-26
7.3.4 Hybrid AR-Rich/SNCR
A series of tests was conducted involving AR-Rich plus SNCR during Illinois coal combustion.
The first N-agent was injected at 1590 K and OFA was added at 1530 K. The second N-agent was
injected downstream of the reburn zone at temperatures ranging from 1230 to 1390 K. Four
conditions were run, including no promoter, sodium addition to the first N-agent alone, sodium
addition to the second N-agent alone, and sodium addition to both N-agents. As shown in Figure
7.21, performance increased with increasing second N-agent injection tempeature. Adding 150
ppm sodium to both N-agents increased NO reduction by 4 to 6 percentage points at each temperature.
Maximum NO reductions, obtained at 1390 K, were 88% with no promoter and 93% with sodium
added to both N-agents.
Figure 7.2.1 AR-Rich + SNCR tests: Effect of second additive injection temperture uponperformance.
JJJ
CC
C
AA
A
222
GGG
0
10
20
30
40
50
60
70
80
90
100
1100 1150 1200 1250 1300 1350 1400 1450 1500
NO
Red
uctio
n (%
)
Second Additive Injection Temperature (K)
J Reburning
C Reburning +Agent1+Agent 2
A Reburning +Agent1+Agent 2/Na 150 ppm
2 Reburning +Agent1/Na 150 ppm+Agent 2
G Reburning +Agent1/Na 150 ppm+Agent 2/Na 150 ppm
Firing Rate: 705,000 Btu/HrMain Fuel : Illinois Coal9% Nat.Gas ReburnSR1=1.10, SR2=0.99, SR3=1.15NOi: 1000 ppm @0%O2 dryFirst additive injected at 1590 KOFA injected at 1530 KNSR=1.5
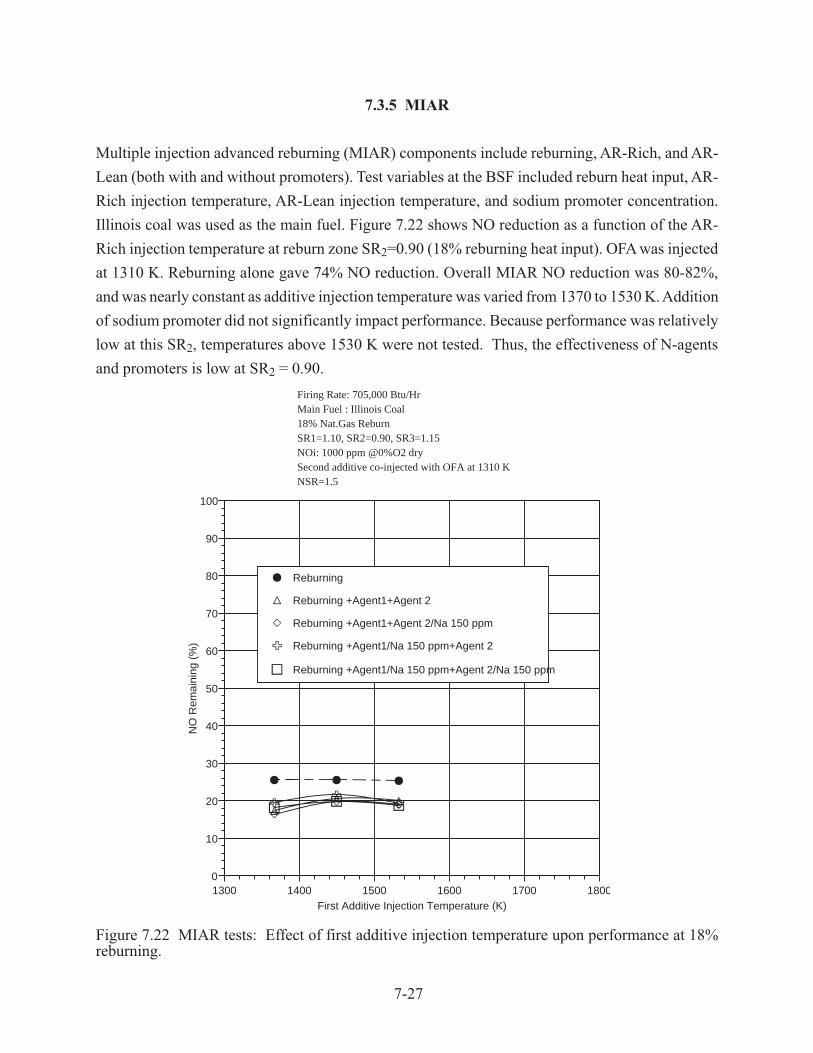
7-27
7.3.5 MIAR
Multiple injection advanced reburning (MIAR) components include reburning, AR-Rich, and AR-
Lean (both with and without promoters). Test variables at the BSF included reburn heat input, AR-
Rich injection temperature, AR-Lean injection temperature, and sodium promoter concentration.
Illinois coal was used as the main fuel. Figure 7.22 shows NO reduction as a function of the AR-
Rich injection temperature at reburn zone SR2=0.90 (18% reburning heat input). OFA was injected
at 1310 K. Reburning alone gave 74% NO reduction. Overall MIAR NO reduction was 80-82%,
and was nearly constant as additive injection temperature was varied from 1370 to 1530 K. Addition
of sodium promoter did not significantly impact performance. Because performance was relatively
low at this SR2, temperatures above 1530 K were not tested. Thus, the effectiveness of N-agents
and promoters is low at SR2 = 0.90.
Figure 7.22 MIAR tests: Effect of first additive injection temperature upon performance at 18%reburning.
JJJ
CC
CAA
A2
22 GGG
0
10
20
30
40
50
60
70
80
90
100
1300 1400 1500 1600 1700 1800
NO
Rem
aini
ng (
%)
First Additive Injection Temperature (K)
J Reburning
C Reburning +Agent1+Agent 2
A Reburning +Agent1+Agent 2/Na 150 ppm
2 Reburning +Agent1/Na 150 ppm+Agent 2
G Reburning +Agent1/Na 150 ppm+Agent 2/Na 150 ppm
Firing Rate: 705,000 Btu/HrMain Fuel : Illinois Coal18% Nat.Gas ReburnSR1=1.10, SR2=0.90, SR3=1.15NOi: 1000 ppm @0%O2 drySecond additive co-injected with OFA at 1310 KNSR=1.5

7-28
Similar tests were then conducted at SR2=0.99 (9% reburning). Figure 7.23 shows performance as
a function of AR-Rich additive injection temperature. Reburning alone gave 48% NO reduction.
MIAR NO reduction increased with decreasing first additive injection temperature. Sodium promoter
was added to each N-agent individually and to both agents. Adding promoter to both N-agents
provided an incremental performance increase of about 5 percentage points at each temperature.
Maximum NO reduction was 94%, obtained with promoter added to both N-agents at an AR-Rich
injection temperature of 1370 K. It is also noteworthy that performance remained relatively good at
high injection temperatures. NO reductions above 80% were obtained at injection temperatures
below 1590 K. This insensitivity can provide greater flexibility for application to boilers with limited
furnace access for injectors.
Figure 7.23 MIAR tests: Effect of first additive injection temperature upon performance at 9%reburning.
JJJJJJ
C
C
C
C
C
C
A
AA
A
A
A
2
22
22
2
GG
G
GGG
0
10
20
30
40
50
60
70
80
90
100
1300 1400 1500 1600 1700 1800
NO
Rem
aini
ng (
%)
First Additive Injection Temperature (K)
J Reburning
C Reburning +Agent1+Agent 2
A Reburning +Agent1+Agent 2/Na 150 ppm
2 Reburning +Agent1/Na 150 ppm+Agent 2
G Reburning +Agent1/Na 150 ppm+Agent 2/Na 150 ppm
Firing Rate: 705,000 Btu/HrMain Fuel : Illinois Coal9% Nat.Gas ReburnSR1=1.10, SR2=0.99, SR3=1.15NOi: 1000 ppm @0%O2 drySecond additive co-injected with OFA at 1310 KNSR=1.5

7-29
MIAR tests were then conducted in which the AR-Lean additive injection temperature was varied,
with the AR-Rich temperature fixed at 1450 K. The AR-Lean additives were co-injected along with
the OFA. Figure 7.24 shows results obtained at SR2=0.90 (18% reburning heat input). Reburning
alone gave 74% NO reduction. Overall MIAR NO reduction was 76-82%, and was nearly constant
as additive injection temperature was varied from 1200 to 1370 K. Addition of sodium promoter to
both N-agents increased NO reduction by 5 percentage points at 1200 K, but did not significantly
impact performance at 1370 K. These tests confirmed that N-agents and Na promoters have relatively
low effect at SR2 = 0.90.
Figure 7.24 MIAR tests: Effect of second additive injection temperature upon performance at 18%reburning.
CCC
AAA 222 GGG
0
10
20
30
40
50
60
70
80
90
100
1100 1150 1200 1250 1300 1350 1400 1450 1500
NO
Rem
aini
ng (
%)
Second Additive/OFA Injection Temperature (K)
Reburning
C Reburning +Agent1+Agent 2
A Reburning +Agent1+Agent 2/Na 150 ppm
2 Reburning +Agent1/Na 150 ppm+Agent 2
G Reburning +Agent1/Na 150 ppm+Agent 2/Na 150 ppm
Firing Rate: 705,000 Btu/HrMain Fuel : Illinois Coal18% Nat.Gas ReburnSR1=1.10, SR2=0.90, SR3=1.15NOi: 1000 ppm @0%O2 dryFirst additive injected at 1450 KSecond additive co-injected with OFANSR=1.5
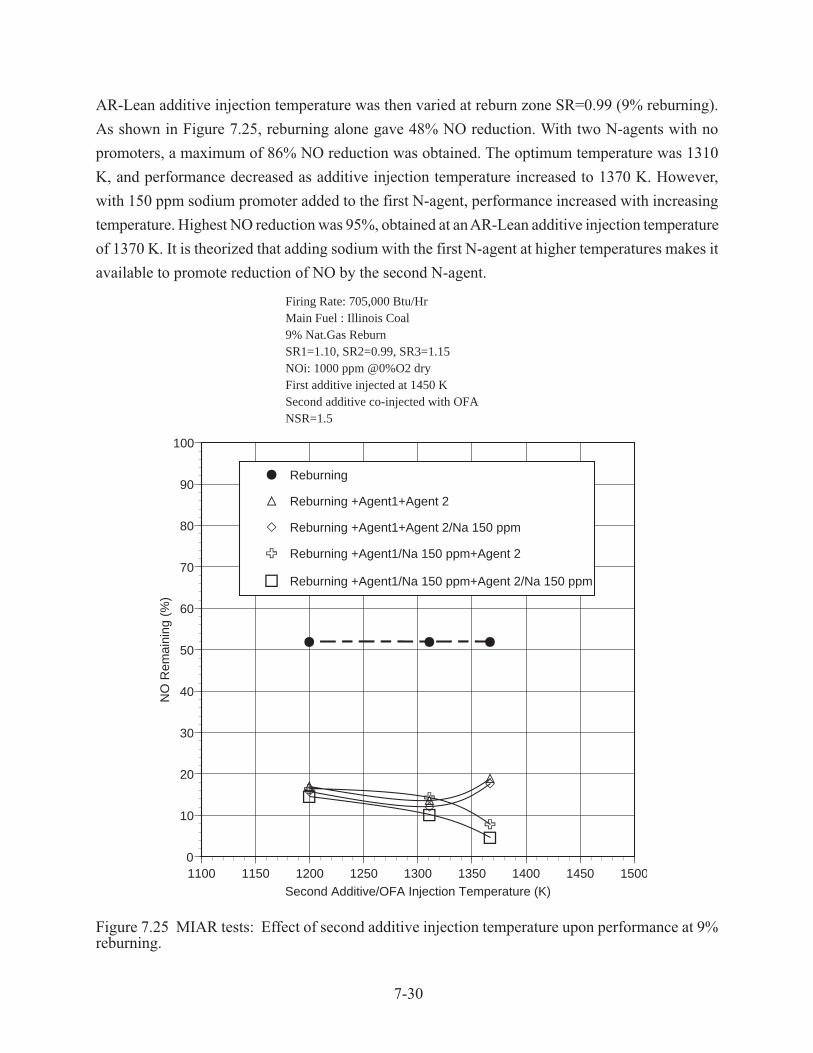
7-30
AR-Lean additive injection temperature was then varied at reburn zone SR=0.99 (9% reburning).
As shown in Figure 7.25, reburning alone gave 48% NO reduction. With two N-agents with no
promoters, a maximum of 86% NO reduction was obtained. The optimum temperature was 1310
K, and performance decreased as additive injection temperature increased to 1370 K. However,
with 150 ppm sodium promoter added to the first N-agent, performance increased with increasing
temperature. Highest NO reduction was 95%, obtained at an AR-Lean additive injection temperature
of 1370 K. It is theorized that adding sodium with the first N-agent at higher temperatures makes it
available to promote reduction of NO by the second N-agent.
Figure 7.25 MIAR tests: Effect of second additive injection temperature upon performance at 9%reburning.
JJJ
C
C
C A
A
A
2
22
G
G
G
0
10
20
30
40
50
60
70
80
90
100
1100 1150 1200 1250 1300 1350 1400 1450 1500
NO
Rem
aini
ng (
%)
Second Additive/OFA Injection Temperature (K)
J Reburning
C Reburning +Agent1+Agent 2
A Reburning +Agent1+Agent 2/Na 150 ppm
2 Reburning +Agent1/Na 150 ppm+Agent 2
G Reburning +Agent1/Na 150 ppm+Agent 2/Na 150 ppm
Firing Rate: 705,000 Btu/HrMain Fuel : Illinois Coal9% Nat.Gas ReburnSR1=1.10, SR2=0.99, SR3=1.15NOi: 1000 ppm @0%O2 dryFirst additive injected at 1450 KSecond additive co-injected with OFANSR=1.5

7-31
7.3.6 Byproduct Sampling Tests
While the AR technologies have shown the ability for effective NOx control, another consideration
is whether they generate any undesirable byproducts. Specifically, it was sought to determine whether
the different variations of AR generate byproduct emissions greater than those of commercially
accepted technologies such as SNCR and reburning. To answer this question, byproduct sampling
tests were performed at the BSF. The following seven conditions were tested:
• Baseline coal firing
• SNCR
• Reburning
• AR-Rich
• AR-Lean
• Reburning plus SNCR
• MIAR
Test conditions, including reburn heat input, injection temperatures, promoter amounts and OFA
temperatures, were selected as providing NOx control in the 80 - 90% range and also being achievable
in a typical utility boiler. For each condition, sampling included:
• CO, SO2, N2O, and total hydrocarbons
• NH3 and HCN
• SO3
• Fly ash mass loading, size distribution, PM10, and PM2.5
• Carbon in ash
Test conditions and sampling data are summarized in Table 7.2. The byproducts were measured at
conditions which were preliminarily optimized for NOx control. Additional optimization tests on
byproduct emissions is planned for Phase II. However, even without significant byproduct
optimization efforts, the AR technologies do not generate more byproducts than reburning or SNCR.
Results for each of the byproduct compounds tested are described below.

7-32
Table 7.2 Byproduct sampling conditions and results.
CEMS Emissions
A continuous emissions monitoring system (CEMS) was used to sample for CO, SO2, N2O, and
total hydrocarbons. SO2 concentrations were in the range of 3010 to 3140 ppm (@ 0% O2) for each
condition, and were not affected by the AR technologies. Total hydrocarbon emissions were 2 ppm
for each test condition. Figure 7.26 summarizes CO and N2O emissions for each of the seven test
conditions. CO and N2O generally increased during application of the NOx control technologies
relative to baseline coal firing. The largest increases were associated with the low temperature N-
agent injection technologies, i.e. SNCR and reburning + SNCR. For SNCR, CO increased from 58
to 120 ppm, and N2O increased from 1 to 73 ppm. OFA was injected at 1310 K. Thus AR-Lean,
AR-Rich, and MIAR generate lower concentrations of CO and N2O than does SNCR under similar
conditions. It is believed that CO and N2O concentrations could be further reduced by injecting
OFA at a higher temperature.
Baseline configuration: Illinois coal @ 0.71 MMBtu/hr Test conditions: NSR=1.5NOi=1000 ppm as measured N-agent: UreaSR1=1.10, SR3=1.15 Na promoter: Na2CO3
Test Case1. 2. 3. 4. 5. Reburn 6. 7.
Parameter Baseline SNCR AR-Rich MIAR +SNCR AR-Lean Reburning
Test ConditionsReburn heat input (%) None None 10% 10% 10% 10% 20%Rich side additive T (F) None None 2100 2000 None None NoneRich side Na (ppm) None None 150 150 None None NoneOFA T (F) None None 1900 1900 2300 1900 2300Lean side additive T (F) None 1900 None 1900 1900 1900 NoneLean side Na (ppm) None None None 0 None 150 None
Sampling ResultsCO (ppm @0% O2) 58 120 75 95 129 95 57SO2 (ppm @0% O2) 3140 3011 3050 3012 3120 3045 3011N2O (ppm @0% O2) 1 73 1 38 98 69 1THC (ppm @0% O2) 2 2 2 2 2 2 2NH3 (ppm @0% O2) 0.0 47.3 0.0 4.4 50.1 0.0 0.0HCN (ppm @0% O2) 0.0 0.0 1.1 1.2 1.6 1.0 0.5SO3 (ppm @0% O2) 2.0 0.8 1.3 1.1 1.7 2.8 1.2Particulate loading (gr/dscf) 2.0 2.3 1.8 1.9 2.2 2.3 2.1Fly ash MMD (microns) 8.1 8.7 10.8 10.1 8.2 8.6 8.5PM10 (%) 54.4 52.1 49.2 49.8 55.4 53.0 53.5 (gr/dscf) 1.09 1.21 0.88 0.93 1.24 1.23 1.10PM2.5 (%) 10.5 10.1 9.4 13.6 14.3 11.2 12.6 (gr/dscf) 0.21 0.23 0.17 0.25 0.32 0.26 0.26Carbon in ash (%) 0.08 0.03 0.17 0.26 0.07 0.10 0.08

7-33
Figure 7.26 CO and N2O emissions for AR technologies.
NH3 and HCN Emissions
NH3 and HCN emissions were measured by EPA Draft Method 206, using ion chromatography
analysis. Results are shown in Figure 7.27. NH3 emissions were fairly high (>40 ppm) for the two
SNCR conditions, but were below 5 ppm for all other conditions (including MIAR). HCN emissions
were below 2 ppm for baseline coal and all AR test conditions. Thus AR-Lean, AR-Rich, and
MIAR generate significantly lower NH3 emissions than does SNCR under similar conditions. These
results would appear to indicate that as long as the N-agent(s) are added with or upstream of the
OFA, NH3 and HCN emissions can be minimized. For the SNCR cases, it is believed that a higher
reagent injection temperature would reduce NH3 emissions.
1. B
asel
ine
2. S
NC
R
3. A
R-R
ich
4. M
IAR
5. R
eb.+
SN
CR
6. A
R-L
ean
7. R
ebur
ning
0
50
100
150
200
Em
issi
ons
(ppm
)CO
N2O
Main Fuel: Illinois Coal @ 705,000 Btu/hrSR1=1.10, SR3=1.15NOi=1000 ppm as measured

7-34
Figure 7.27 NH3 and HCN emissions for AR technologies.
SO3 Emissions
SO3 emissions can impact electrostatic precipitator performance and, if present in high concentrations,
cause boiler corrosion problems. SO3 emissions were measured using the controlled condensation
method, as detailed in the EPA’s “Process Measurement Procedures - Sulfuric Acid Emissions”
(1977). The sample probe was operated at a temperature of 590 K. Figure 7.28 shows SO3 test
results. The SO3 concentration for baseline coal firing was about 2 ppm. For each of the NOx
control technologies, SO3 remained below 3 ppm. It is concluded that none of the technologies
cause a significant increase in SO3 emissions.
1. B
asel
ine
2. S
NC
R
3. A
R-R
ich
4. M
IAR
5. R
eb.+
SN
CR
6. A
R-L
ean
7. R
ebur
ning
0
10
20
30
40
50
60
70
80E
mis
sion
s (p
pm @
0%
O2)
0.0 0.0
47.3
0.0 0.0 1.1
4.4
1.2
50.1
1.60.0 1.0 0.0 0.5
NH3
HCN
Main Fuel: Illinois Coal @ 705,000 Btu/hrSR1=1.10, SR3=1.15NOi=1000 ppm as measured

7-35
Figure 7.28 SO3 emissions for AR technologies.
Particulate Size Distribution
Fly ash particle size can affect dust control equipment efficiency as well as causing respirability
and health considerations. Particulate size distribution was measured using a cascade impactor.
Figure 7.29 shows fly ash distributions for each of the seven test conditions. Fly ash mass mean
diameter was between 8 and 11 microns for each condition. The AR technologies did not appear to
significantly alter overall size distribution.
1. Baseline 2. SNCR 3. AR-Rich 4. MIAR 5. Reb.+SNCR6. AR-Lean7. Reburning0
1
2
3
4
5
6
7
8
9
10
SO
3 E
mis
sion
s (p
pm)
Main Fuel: Illinois Coal @ 705,000 Btu/hrSR1=1.10, SR3=1.15NOi=1000 ppm as measured
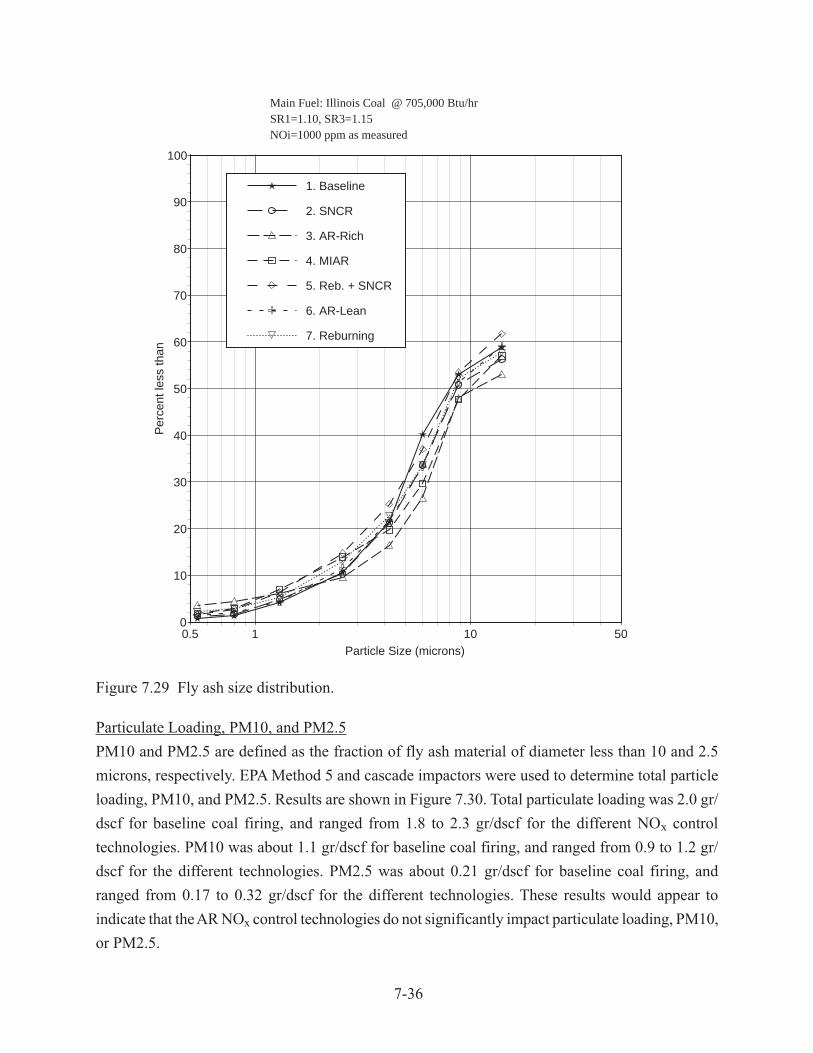
7-36
Figure 7.29 Fly ash size distribution.
Particulate Loading, PM10, and PM2.5
PM10 and PM2.5 are defined as the fraction of fly ash material of diameter less than 10 and 2.5
microns, respectively. EPA Method 5 and cascade impactors were used to determine total particle
loading, PM10, and PM2.5. Results are shown in Figure 7.30. Total particulate loading was 2.0 gr/
dscf for baseline coal firing, and ranged from 1.8 to 2.3 gr/dscf for the different NOx control
technologies. PM10 was about 1.1 gr/dscf for baseline coal firing, and ranged from 0.9 to 1.2 gr/
dscf for the different technologies. PM2.5 was about 0.21 gr/dscf for baseline coal firing, and
ranged from 0.17 to 0.32 gr/dscf for the different technologies. These results would appear to
indicate that the AR NOx control technologies do not significantly impact particulate loading, PM10,
or PM2.5.
0
10
20
30
40
50
60
70
80
90
100
0.5 1 10 50
Per
cent
less
than
Particle Size (microns)
1. Baseline
2. SNCR
3. AR-Rich
4. MIAR
5. Reb. + SNCR
6. AR-Lean
7. Reburning
Main Fuel: Illinois Coal @ 705,000 Btu/hrSR1=1.10, SR3=1.15NOi=1000 ppm as measured
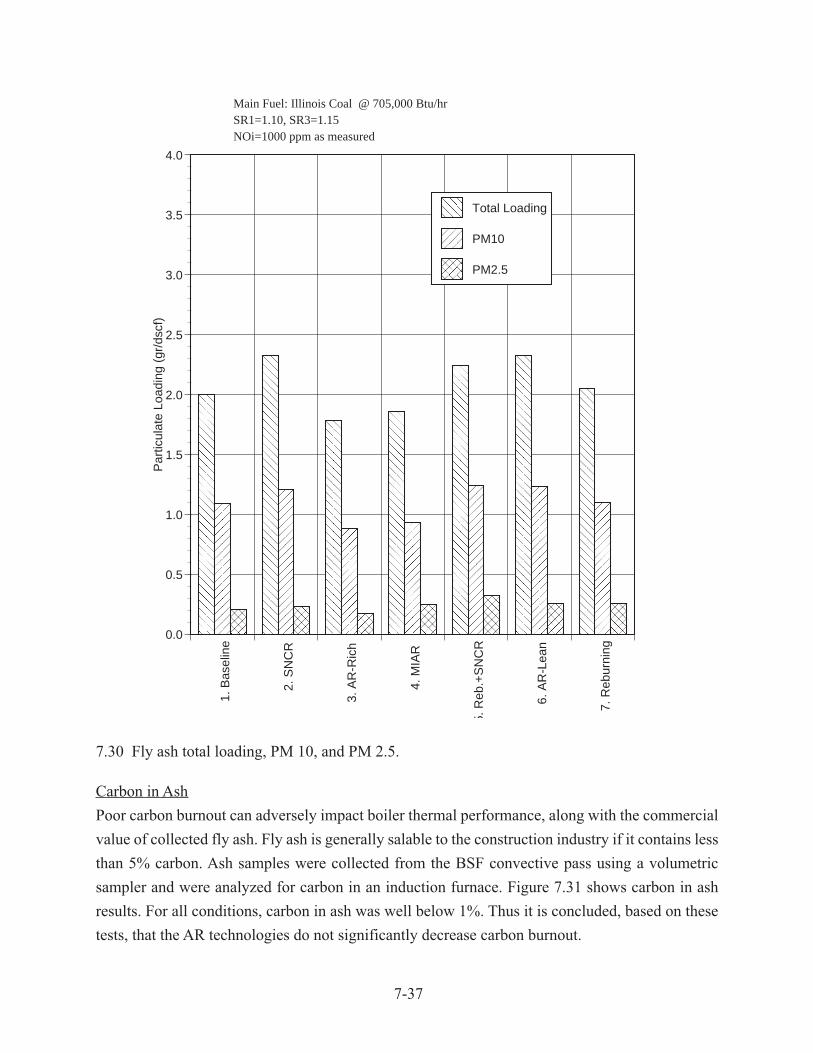
7-37
7.30 Fly ash total loading, PM 10, and PM 2.5.
Carbon in Ash
Poor carbon burnout can adversely impact boiler thermal performance, along with the commercial
value of collected fly ash. Fly ash is generally salable to the construction industry if it contains less
than 5% carbon. Ash samples were collected from the BSF convective pass using a volumetric
sampler and were analyzed for carbon in an induction furnace. Figure 7.31 shows carbon in ash
results. For all conditions, carbon in ash was well below 1%. Thus it is concluded, based on these
tests, that the AR technologies do not significantly decrease carbon burnout.
1. B
asel
ine
2. S
NC
R
3. A
R-R
ich
4. M
IAR
5. R
eb.+
SN
CR
6. A
R-L
ean
7. R
ebur
ning
0.0
0.5
1.0
1.5
2.0
2.5
3.0
3.5
4.0P
artic
ulat
e Lo
adin
g (g
r/ds
cf)
Total Loading
PM10
PM2.5
Main Fuel: Illinois Coal @ 705,000 Btu/hrSR1=1.10, SR3=1.15NOi=1000 ppm as measured

7-38
Figure 7.31 Carbon in ash results.
7.4 Pilot Scale Combustion Tests: Conclusions
In summary, the parametric tests showed that the AR technologies are able to provide effective
NOx control for a high-sulfur coal fired combustor. Three technologies were originally envisioned
for development: AR-Lean, AR-Rich, and MIAR. Along with these, three additional technologies
were identified during the course of the testing: Reburning plus SNCR, AR-Lean plus SNCR, and
AR-Rich plus SNCR, where SNCR performance can be enhanced by addition of promoters.
Sodium was found to significantly promote performance more effectively during gas firing than
coal firing. A possible reason for this is interaction of sodium compounds with fly ash, as well as
reaction with SO2 or HCl to form sodium sulfite, sodium sulfate or sodium chloride. Nevertheless,
1. B
asel
ine
2. S
NC
R
3. A
R-R
ich
4. M
IAR
5. R
eb. +
SN
CR
6. A
R-L
ean
7. R
ebur
ning
0
1
2
3
4
5
Car
bon
in A
sh (
%)
Main Fuel: Illinois Coal @ 705,000 Btu/hrSR1=1.10, SR3=1.15NOi=1000 ppm as measured
7-39
even for high sulfur coal sodium was found to significantly improve performance when added at
150 ppm, which is a manageable level for most utility boilers.
Maximum NO reductions achieved by the promoted AR technologies during gas and coal firing
were as follows:
Gas firing Coal firing
• AR-Lean: 95% 90%
• AR-Rich: 96% 93%
• AR-Lean + SNCR: 98% 94%
• AR-Rich + SNCR: 97% 93%
• MIAR: 98% 95%
These technolgies have different optimum reburn heat input levels and furnace temperature
requirements. For full scale application, an optimum technology can be selected on a boiler specific
basis depending on furnace temperature profile and regions of injector access.
In terms of byproduct emissions, in some cases CO was observed to increase when sodium was
added. This may be due to chain reactions involving sodium compounds, H atoms and OH radicals
which allow CO to escape oxidation. However, it was found that CO could be controlled by increasing
the OFA injection temperature. Emissions of N2O and NH3 showed the potential to increase under
low-temperature SNCR conditons. Adding the second N-agent at higher temperature was found to
minimize these emissions.
In summary, the promoted AR technologies demonstrated the ability to readily achieve NO reductions
of 95+% during gas firing and 90+% during coal firing. Byproduct emissions were found to be
manageable. Additional test work could be performed to further optimize variables such as N-
agent stoichiometric ratio and additive-furnace gas mixing requirements, as well as to provide
scale-up data for utility boiler application.
8-1
8.0 MECHANISM DEVELOPMENT AND KINETIC MODELING
The objective of this task is to develop a kinetic analytical model of the Advanced Reburning
technologies. A high temperature reaction mechanism has been developed for use in this model,
based on a standard natural gas combustion model (GRI-Mech) combined with nitrogen chemistry
as well as reactions of sodium, sulfur, and chlorine. The chemical kinetic model has been implemented
using chemical kinetics codes CHEMKIN-II and SENKIN, developed at Sandia National
Laboratories, and EER’s One Dimensional Flame (ODF) code. The experimentally validated model
is used as a tool to investigate the process analytically.
The chemical kinetic model has been applied to an expirimentally feasible range of conditions,
with appropriate variations in controllable conditions including initial species concentrations,
temperature, and residence time. Rate constants fo the reactions in the mechanism have not been
varied, and the model does not describe quantitatively the experimental data. However, the predicted
exit concentrations do provide qualitative insight into expected performance trends. The predicted
species histories also provide insight into internal details of the process which are not readily
measured. In addition, sensitivity analysis has been applied to selected cases to identify the relative
importance of specific reactions in the process as modeled. The mechanism development and
modeling has extended the understanding of AR and provides a tool for future development and
implementation of the process.
8.1 Mechanism Development
A high temperature kinetic mechanism has been developed and tested to model the AR systems
process. This mechanism includes reactions of C-H-O species applicable to both rich and lean
combustion chemistry. It also includes N-containing species reactions reflective of variations in
stoichiometry (reburning), and the effect of additives (N-agents and/or promoters) on the species
pool. To model the effect of promotion, the most important reactions of Na-containing compounds
have been analyzed and incorporated. In addition, reactions of S- and Cl-containing compounds
have been included to assist in future modeling of AR processes applied to coal combustion.
The resulting mechanism, which has been used in modeling, is presented in Appendix 1. The reaction
numbers assigned there are used througout this section for reference. Reversible rate data also
requires thermodynamic properties for the participating species. To complete the description of the
model mechanism, the thermodynamic database is presented in Appendix 2.
8-2
8.1.1 GRI-Mech
GRI-Mech (Bowman et al., 1995, and Frenklach, et. al., 1994) was selected for the basic C-H-ON
mechanism as it represents the current industry standard in natural gas combustion chemistry. The
mechanism includes the elementary chemical reactions, the rate coefficients and parameters
describing the thermodynamic properties of the included species. The basic combustion mechanism
has been validated extensively against available experimental data, listed in the cited references.
The most current version as of the initiation of the modeling task is version 2.11, which contains
276 reactions with 49 species containing C, H, O, N, as well as Ar as a third body species. These are
presented in Appendix 1 as reactions 1-278 (two duplicate reactions being added for compatibility
with the kinetics software). Version 2.11 is an extension of the earlier Version 1.2, which was
optimized specifically for accurate prediction of C, H, O combustions, in particular natural gas
flames and ignition, with nitrogen included only as inert N2. The nitrogen chemistry introduced in
versions 2.11 is optimized specifically for natural gas flames and reburning. GRIMech by itself has
not yet been optimized for other NOx control technologies. The authors also caution that the
agreement with nitrogen chemistry and reburning data is not as close as for C-HO chemistry, and
therefore is subject to further development. Nevertheless, this mechanism represents the state of the
art in these aspects of nitrogen chemistry, representing a significant improvement over previously
published mechanisms such as Miller and Bowman (1989).
Due to these limitations in the current GRI-Mech, additional nitrogen reactions must be incorporated
to obtain a mechanism capable of predicting AR processes which extend beyond conventional
reburning, such as the SNCR chemistry inherent in N-agent addition.
8.1.2 SNCR Reactions
The analysis of available kinetic information resulted in preliminary selection of two reaction
mechanisms for modeling the chemical behavior in the C-H-O-N system. Both mechanisms are
based on GRI-Mech, with SNCR reactions added from other sources. The selection process is
described in further detail in Zamansky and Maly (1996a).
Two variants of the C-H-O-N mechanism, denoted here as A and B, were considered. Mechanism
A includes all GRI-Mech Version 2.11 reactions and reactions selected from the SNCR scheme
suggested by Bowman, 1996. Mechanism B consists of the C-H-O system of GRI-Mech-1.2, N-
chemistry reactions proposed by Glarborg et al., 1993, and reactions of CHi radicals with nitrogenous
8-3
species (“C-N chemistry”) selected from GRI-Mech Version 2.11. Either scheme could be considered
to be state of the art for C-H-O-N chemistry modeling.
The two selected mechanisms include the complete GRI-Mech Version 1.2, which was verified by
its authors against multiple C-H-O experimental data from various sources. The N-chemistry from
GRI-Mech-2.11 and the Glarborg’s N-mechanism were also verified against experimental data on
reburning. However, because both mechanisms were broadened to include SNCR submechanisms,
they required verification associated with the SNCR nitrogen chemistry. Calculations were performed
based on available experimental data for the Thermal DeNOx process. Two sets of experiments
were selected for comparison with modeling:
1. Laboratory-scale data presented by Lyon and Hardy, 1986. Conditions: flow system tests,
variation of reactor temperature, residence time 0.1 s. Mixture composition: 225 ppm NO -
450 ppm NH3 - balance He.
2. EER’s recent pilot-scale experimental data. Conditions: BSF natural gas combustion tests,
variation of NH3 injection temperature, quenching rate 167 K/s. Flue gas composition: 200
ppm NO - 300 ppm NH3 - 3.8% O
2 (dry measure) - 8% CO
2 - 15% H
2O - balance N
2.
The CHEMKIN-II kinetic program developed at the Sandia National Laboratories (Kee et al., 1991)
was used for modeling. Figure 8.1.1 demonstrates comparison of the experimental results and
modeling by the use of the mechanisms A and B. Although both mechanisms show some difference
from the experimental data and there is a shift in temperature, they both qualitatively model the
temperature window of the Thermal DeNOx process. The differences can be explained by the
values of rate constants, by errors in experimental temperature measurements, and by influence of
mixing effects on NO removal. Calculations with both mechanisms were performed without any
adjustments in rate constants taking into account an actual BSF temperature profile. Both models
qualitatively described the most substantial feature of the SNCR process: the temperature window
of NO reduction. However, this validation also shows that differences in quantitative comparison
of modeling and AR experiments are to be expected.
Since both mechanisms show about the same performance in modeling experimental data, it is
difficult to prefer one of them. Mechanism A was selected for further calculations since it includes
less constituent parts (sub-mechanisms) and all of them were suggested by the same group of
authors. The SNCR reactions which are added to GRI-Mech 2.11 are included in Appendix A as
reactions 279-312.
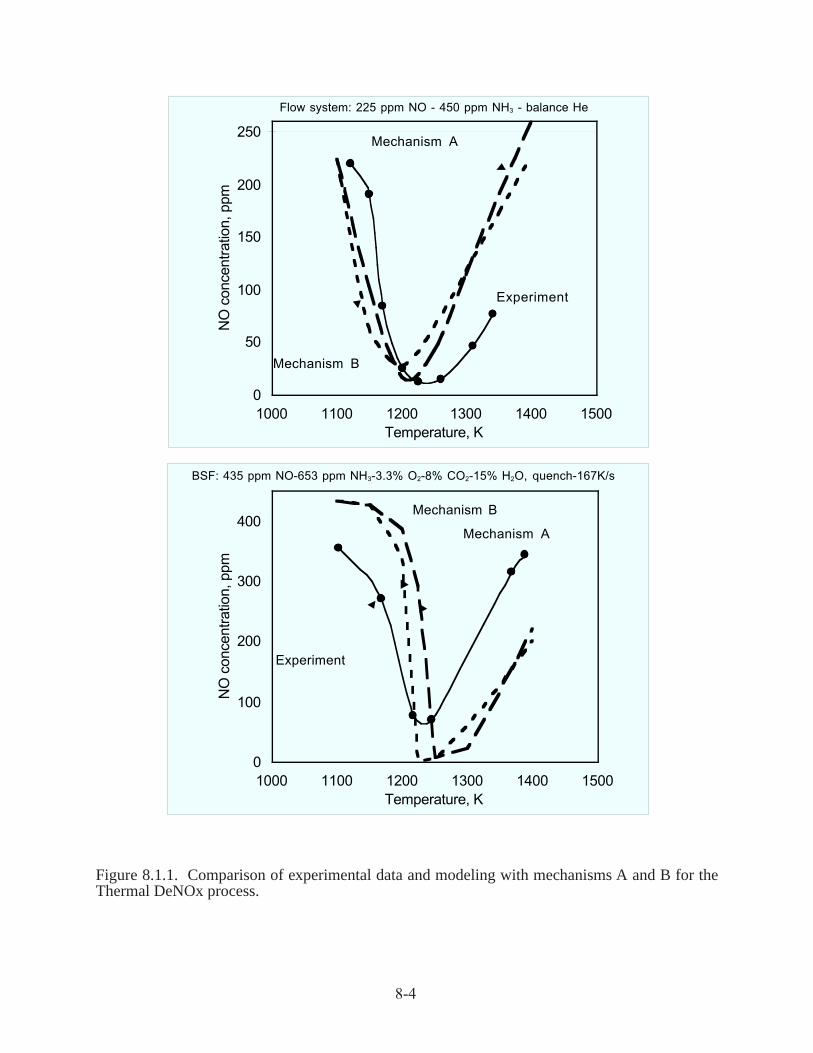
8-4
Figure 8.1.1. Comparison of experimental data and modeling with mechanisms A and B for theThermal DeNOx process.
0
50
100
150
200
250
1000 1100 1200 1300 1400 1500Temperature, K
NO
con
cent
ratio
n, p
pm
Mechanism A
Experiment
Mechanism B
Flow system: 225 ppm NO - 450 ppm NH3 - balance He
0
100
200
300
400
1000 1100 1200 1300 1400 1500Temperature, K
NO
con
cent
ratio
n, p
pm
Mechanism A
Mechanism B
Experiment
BSF: 435 ppm NO-653 ppm NH3-3.3% O2-8% CO2-15% H2O, quench-167K/s
8-5
8.1.3 Reactions of Sodium
Experimental data demonstrate that the addition of sodium compounds, such as sodium carbonate
and sodium hydroxide, can increase reburning efficiency. However, the high temperature chemistry
of sodium compounds is not well understood. Only a few rate constants have been measured
directly, and kinetic information on many reactions is absent. However, estimates are available for
several other rate constants.
Sodium carbonate was used as a promoter in most CTT and BSF experiments. It was also shown
that sodium hydroxide has about the same efficiency as sodium carbonate. When sodium carbonate
is injected into flue gas, it decomposes into oxides. The mechanism of Na2CO3 thermal decomposition
and the corresponding rate constants are the subject of an experimental task at the University of
Texas, as documented in Section 5.
Most likely, sodium carbonate dissociates at high temperatures to different oxides. The oxides react
with water molecules which are available in flue gas to form sodium hydroxide. The specific reactions
considered here (numbered corresponding to Appendix 1), based on the University of Texas study,
are:
Na2CO3 → Na2O + CO2 (317)
Na2O + CO2 → Na2CO3 (318)
Na2O + CO2 <=> 2 NaOH (319)
The conversion from Na2CO3 to NaOH is rapid, and it is most likely the reason for the equal
promotion efficiency of Na2CO3 and NaOH.
Since the modeling effort was conducted in parallel with the University of Texas experimental
effort, it was necessary to develop the modeling mechanism based on preliminary estimates of the
reaction rates. For this reason, the rate constant used in modeling for Reaction 319 may not exactly
match those reported for the experimental task (Section 5). For this reaction, rate expression used in
modeling was 1.00E13 exp(+35390/RT), rather than the later experimental result of 9.18E12 exp(-
3120/RT), which is now recommended. However, both versions of the rate constants predict rapid
initial conversion of Na2CO3 to NaOH for example. The estimated rate constants in the model
mechanism result in a characteristic decay time of 3 ms at 1400 K, while the University of Texas
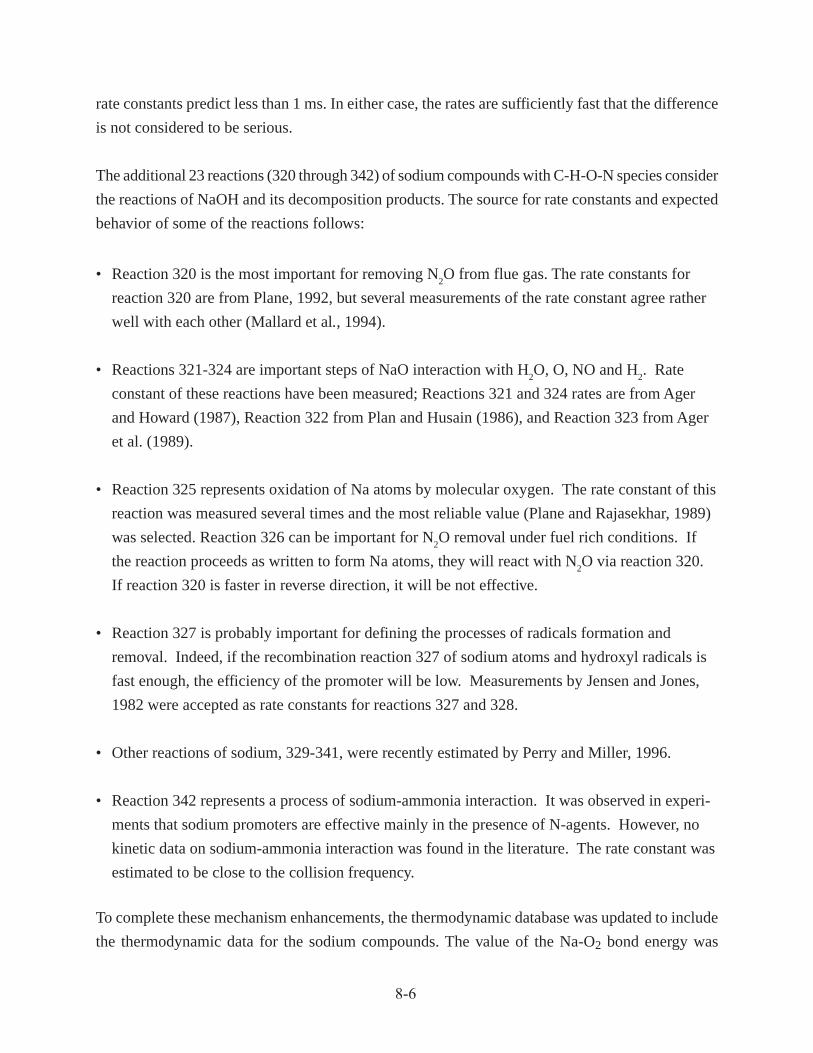
8-6
rate constants predict less than 1 ms. In either case, the rates are sufficiently fast that the difference
is not considered to be serious.
The additional 23 reactions (320 through 342) of sodium compounds with C-H-O-N species consider
the reactions of NaOH and its decomposition products. The source for rate constants and expected
behavior of some of the reactions follows:
• Reaction 320 is the most important for removing N2O from flue gas. The rate constants for
reaction 320 are from Plane, 1992, but several measurements of the rate constant agree rather
well with each other (Mallard et al., 1994).
• Reactions 321-324 are important steps of NaO interaction with H2O, O, NO and H
2. Rate
constant of these reactions have been measured; Reactions 321 and 324 rates are from Ager
and Howard (1987), Reaction 322 from Plan and Husain (1986), and Reaction 323 from Ager
et al. (1989).
• Reaction 325 represents oxidation of Na atoms by molecular oxygen. The rate constant of this
reaction was measured several times and the most reliable value (Plane and Rajasekhar, 1989)
was selected. Reaction 326 can be important for N2O removal under fuel rich conditions. If
the reaction proceeds as written to form Na atoms, they will react with N2O via reaction 320.
If reaction 320 is faster in reverse direction, it will be not effective.
• Reaction 327 is probably important for defining the processes of radicals formation and
removal. Indeed, if the recombination reaction 327 of sodium atoms and hydroxyl radicals is
fast enough, the efficiency of the promoter will be low. Measurements by Jensen and Jones,
1982 were accepted as rate constants for reactions 327 and 328.
• Other reactions of sodium, 329-341, were recently estimated by Perry and Miller, 1996.
• Reaction 342 represents a process of sodium-ammonia interaction. It was observed in experi-
ments that sodium promoters are effective mainly in the presence of N-agents. However, no
kinetic data on sodium-ammonia interaction was found in the literature. The rate constant was
estimated to be close to the collision frequency.
To complete these mechanism enhancements, the thermodynamic database was updated to include
the thermodynamic data for the sodium compounds. The value of the Na-O2 bond energy was

8-7
selected to be Do = 37.2 kcal/mol as was determined theoretically by Partridge et al., 1992 and
recommended by Perry and Miller, 1996.
Additional sodium reactions include interactions with sulfur-containing species (reactions 343
through 346) and chlorine-containing species (374 through 350).
8.1.4 Reactions of Sulfur and Chlorine
It has been found that sodium promoters are less effective in flue gas from coal combustion flue gas
compared to that from natural gas. Coal includes sulfur and chlorine compounds which can react
with sodium, decreasing its efficiency. The submechanisms for reactions of S- and Cl- compounds
with Na-O-H species have been added to the mechanism for future modeling of the effect of sulfur
and chlorine compounds on reburning efficiency and to understand the chemistry of sodium
promotion under different conditions. All selected reactions are presented in Appendix 1 as reactions
312-316 and 343-355.
Rate constants for SO2/SO3 reactions, 312-316, were taken from the literature review by Atkinson
et al., 1992 and direct measurements by Armitage and Cullis, 1971 (for reaction 312) and Smith et
al., 1982 (for reaction 316). Though many kinetic measurements of these reactions were reported
in the literature, most of them were performed at relatively low temperatures, mainly below 400 K.
Therefore, there is a significant uncertainty in high temperature kinetic data for SO2/SO3 interaction.
Reactions 343-346 represent interaction of sodium and sulfur compounds. Reaction 343 was
suggested by Fenimore, 1973; the rate constant for this reaction was estimated to be k = 1013 exp
(-17700/T) cm3/mol.s where the activation energy is equal to the reaction endothermicity. A single
rate constant measurement for reaction 344 was reported by Shi and Marshall, 1991. Rate constants
for reactions 345 and 346 were assumed to be close to that measurement.
During the combustion process, most chlorinated compounds are converted into HCl. Therefore, to
model the effect of chlorine on reburning efficiency and Na promotion, it is logical to perform
modeling using the initial concentration of HCl in flue gas corresponding the amount of chlorine in
coal. For this reason, chlorine reactions have been added which address the reactions of HCl and its
products.
Nine reactions of chlorine were included in the mechanism. The first four, 347-350, represent the
reactions of sodium compounds (Na, NaO, NaO2, and NaOH) with HCl. All these reactions are
8-8
fast, and available experimental measurements of the rate constants were selected (Silver et al.,
1984; Husain and Marshall, 1986; DeMore et al., 1987; and Silver and Kolb et al., 1986, respectively).
Five other chlorine reactions, 351-355, include the well known steps of Cl2-H2 interaction. Their
rate constants were taken from kinetic tables by Baulch et al., 1981.
The thermodynamic database was updated to include data for the sulfur and chlorine
containingcompounds. Thermodynamic data for NaSO2 were calculated by using the Na-SO2 bond
energy Do = 47.1 kcal/mol defined by Steinberg and Schofield, 1990. This value corresponds to the
heat of formation of NaSO2, ∆Hf,0 = -92 kcal/mol.
Thermodynamic analysis. To verify which species are important to include in the sulfur and chlorine
mechanisms, an analysis of equilibrium flue gas compositions was performed. This predicts the
species concentrations if the thermodynamic state of the gas (e.g., temperature, pressure) were held
uniform indefinitely. Although actual conditions are far from invariant, the analysis is still useful.
Species participating in reactions which are fast relative to the rate of change in temperature (e.g.
natural gas combustion) may establish a partial equilibrium in the mixture, and thermodynamic
analysis can indicate the relative amounts to expect. Furthermore, products which are favored
thermodynamically are important to include in the reaction mechanism so that all likely products
are considered.
The calculations were performed using the latest version of the NASA Chemical Equilibrium
program, CET93 (McBride et al., 1994). To ensure that all potentially important species are
considered, the completeness of the code’s species database (which identifies species to consider
and their thermodynamic properties) is crucial. The standard CET93 database includes over 1000
compounds mostly from the JANAF tables, including combustion products as well as alkali metals.
EER has extended this by adding data from other sources, including the Barin (1989) tables and
current research at Lawrence Livermore National Laboratories (Ebbinghaus, 1993). Several metals
and radionuclides are thus incorporated, as well as their oxides, hydroxides, oxyhydroxides, chlorides,
metal-sulfur compounds, and other species. A list of sodium compounds included in the updated
CET93 thermodynamic database, and sample properties, is presented in Appendix 3.
CET93 was used to predict concentrations of sodium compounds in the reburning and overfire air
zones at various conditions, including different temperatures, stoichiometries, quantities of sodium,
and the presence of sulfur and chlorine. Equilibrium was calculated for each composition for a
range of temperatures from 1100 to 1900 K. Zamansky et al. (1997a) provides further details of the
calculations.

8-9
For stoichiometric ratios ranging from 0.9 to 1.25, with 10 ppm Na in the mixture, the most favored
sodium species are NaOH and Na, with all other sodium species at less than 0.1 ppm. The same
species dominate with 50 ppm Na at an SR of 0.99. The major species as a function of temperature
are shown in Figure 8.1.2(a) for 10 ppm Na and SR=0.99. When 2000 ppm SO2 is included in this
mixture, the presence of sulfur does not result in formation of significant amounts of sodium sulfate
over the temperature range considered, as shown in Figure 8.1.2(b). However, Na2SO4 increases as
temperature is reduced and could be significant in modeling the interaction between sodium and
sulfur. If 50 ppm Cl2 is included instead of sulfur, sodium chloride becomes the most stable sodium
compound, as shown in Figure 8.1.2(c). It must be cautioned, however, that thermodynamic data
for gaseous sodium salts are not considered reliable, and so these results should not be considered
conclusive without future validation. Nevertheless, these results establish NaOH, Na, Na2SO4 and
NaCl as potentially important species in a C-H-O-N-Na-S-Cl mechanism. Appropriately, reactions
involving these species have been included in the current mechanism.
8.1.5 Mechanism Development: Summary
The mechanism developed based on the above considerations consists of 355 reactions and 66
species. It has been developed based on the best existing data for mechanisms and individual reactions
as of the time of its development. The core of the mechanism is based on the industry standard for
natural gas combustion and reburning, GRI-Mech 2.11. The mechanism was then extended to include
reactions for the prediction of N-agent chemistry.
The resulting C-H-O-N mechanism was further extended to include Na compounds in order to
model processes involving sodium carbonate or sodium hydroxide promoters. The sodium reactions
were developed in parallel with the experimental effort at the University of Texas.
The addition of sulfur and chlorine reactions enable predictions of the behavior of promoted AR in
coal combustion. Thermodynamic analysis shows that the most significant species for interaction
of S and Cl with with Na have been included. The rates for reactions involving S and Cl species
were estimated based on published data, and have not yet been tested against experimental results.
8.2 Modeling with Instantaneous Mixing Times
Initial modeling focused on the chemistry of individual AR processes after premixing the combustion
gases with the reactant stream being introduced. This approximation represents instantaneous mixing
of the reactants, thus removing the details of the physical mixing process from the model. Once

a (10 ppm Na)
1E-05
1E-04
1E-03
1E-02
1E-01
1E+00
1E+01
1E+02
1000 1200 1400 1600 1800 2000
Temperature, K
Co
nce
ntr
atio
n,
ppm
NaOH
Na
NaH
NaO
NaO2
b (10 ppm Na,
2000 ppm SO2)
1E-05
1E-04
1E-03
1E-02
1E-01
1E+00
1E+01
1E+02
1000 1200 1400 1600 1800 2000
Temperature, K
Co
nce
ntr
atio
n,
pp
m NaOH
Na
NaH
NaO
NaO2
Na2SO4
c (10 ppm Na,
50 ppm Cl2)
1E-05
1E-04
1E-03
1E-02
1E-01
1E+00
1E+01
1E+02
1000 1200 1400 1600 1800 2000
Temperature, K
Co
nce
ntr
atio
n,
ppm
NaOH
Na
NaH
NaO
NaO2
NaCl
8-10
Figure 8.1.2. Effect of sulfur and chlorine on equilibrium concentrations of sodium species influe gas.

8-11
premixed, the reactions proceed along a one-dimensional (plug flow) reactor, which again allows
the reactions to proceed in time without any fluid dynamic effects. Thus, this approach focuses on
the chemistry of the process.
Individual AR injection processes include reburning, N-agent injection in the reburning zone
(ARRich) or with OFA (AR-Lean), addition of promoters with the N-agent, and OFA addition.
Each injection involves different parameters which affect its performance. One of these parameters
is the location of injection, characterized either by time from the point of reburn fuel or OFA
injection, or by temperature at the point of injection. Another is the amount of added reactants,
characterized by concentration, stoichiometric ratio following addition (for fuel or air addition), or
NSR (for N-agent addition).
In these modeling studies, the reburning fuel is CH4, the N-agent is NH3, and the promoter is
Na2CO3. In all cases the pressure is held constant at 1 atm. The temperature profile was specified at
a constant quench rate of 300 K/s, reflective of the actual reburning zone environment in the BSF.
The CHEMKIN-II kinetic program developed at the Sandia National Laboratories (Kee et al., 1991)
was used for most instantaneous modeling. CHEMKIN-II is used to predict the kinetic curves of
major components in the reaction zone (concentration vs. time) for comparison with experimental
data. However, the kinetic curves do not provide information about the importance of specific
elementary reactions with respect to increasing or decreasing concentrations of certain components.
The next step, sensitivity analysis, was done to obtain this information. Sensitivity analysis is a
procedure to quantitatively determine the dependence of the model solution on the elementary
reaction rate constants. It provides insight about how important certain reactions are to the model’s
predictions. The sensitivity analysis was performed with the use of the SENKIN code developed by
Sandia National Laboratory (Lutz et al., 1987). SENKIN is a FORTRAN computer program for
predicting the species and temperature histories and for calculating the first order sensitivity
coefficients of each species with respect to the elementary reaction rate parameters.
In addition to species mole fraction histories (kinetic curves) which are also available from Chemkin-
II, Senkin provides information about contribution and sensitivity factors. Contribution factors for
a selected species show the effect of elementary reactions with participation of the species on its
concentration. Sensitivity factors for a selected species show the effect of each elementary reaction
in the mechanism on the concentration of the species.

8-12
The chief difference between these two parameters is that contribution factors show the direct
influence of specific reactions on a given species. Sensitivity factors show indirect influences hidden
in the complex reaction mechanism, to show how a change in the rate for a given reaction would
affect the production or removal of a given species. Both measures are important. While contribution
factors show the reactions directly involved in formation and destruction, often groups of reactions
work rapidly and in opposition to each other, masking the net influence of another reaction which is
driving them. Sodium promotion, in which injected sodium species significantly affect NO but
have very little direct interaction with it, is an example of a process where sensitivity analysis is
particularly useful. By ranking reactions with respect to these factors, the most important direct and
indirect influences on a given species can be determined, along the length of the reactor.
The contribution factor ci,k is defined as the contribution of reaction i to the net production rate of
species k at a given instant, and may be calculated as:
ci,k = vk,i qi
vk,i is the net stoichiometric coefficient of species k in reaction i (the number of molecules of
species k on the right side of the reaction minus the number of molecules on the left side, the net
number of molecules of k produced as the reaction proceeds to the right). qi is the rate of progress
variable, calculated as:
qi = kf,i ∏k [xk]v’k,i - kr,i ∏k [xk]v’’ k,i
where kf,i is the forward rate constant and kr,i is the reverse rate constant for reaction i, v’ k,i and v’’ k,i
are the stoichiometric coefficients of species k on the left and right hand side of reaction i, respectively,
and xk is the mole fraction of species k. Note that vk,i = v’’ k,i -v’ k,i.
The sensitivity of species k to reaction i is defined as
(dxk / dAi) (Ai / xk,max)
where Ai is the frequency factor from the Arrhenius rate expression for reaction i, and xk,max is the
maximum value of xk over all points in time which are processed by Senkin. (In other words, the
normalizing value of xk,max is somewhat dependent on the timestep resolution of the Senkin
calculation if the species undergoes a very rapid transient).

8-13
The histories of concentration, contribution factors, and sensitivities provide information useful
for understanding chemistry of the processes under investigation. This is a valuable tool in optimizing
NO removal while ensuring that other emissions such as NH3 remain low.
8.2.1 Modeling of the Basic Reburning Process
Stoichiometric ratio SR1 in the primary zone was kept at SR1=1.1 for all calculations. This SR1
corresponds to methane combustion with the following mixture composition:
8.72% CH4 - 19.18% O2 - balance N2
If the combustion process in the primary zone is complete, it generates about 8% CO2 and 15%
H2O. At the same time, 1.74% O2 is left which is available for oxidation of the reburning fuel.
Therefore, the premixed reactants for reburning can be described as:
[CH4] - 1.74% O2 - 600 ppm NO - 8% CO2 - 15% H2O - balance N2,
where [CH4] is the molar percent of reburning fuel. For example, [CH4] is 1.94% for reburning
zone stoichiometry SR2=0.90, 1.37% for SR2=0.95, and 0.967% for SR2=0.99.
An initial NO concentration NOi = 600 ppm was used for calculations. Figures 8.2.1-8.2.3
demonstrate concentration profiles of main species in the reburning zone at an injection temperature
T1 = 1700 K and SR2 equals 0.99, 0.95, and 0.90, respectively. Comparison of these graphs shows
that CH4 is rapidly converted to CO and H2. Only at SR2=0.90, about 300 ppm CH4 is present in
the mixture. At SR2=0.99 and 0.95, the amount of CH4 is lower than 1 ppm.
At SR2 = 0.99 (Figure 8.2.1), NO concentration drops during a very short period of time from 600
ppm to about 540 ppm and then, slowly decreases to 502 ppm. Concentrations of NH3 and HCN are
lower than 1 ppm, though some O2 is still present.
At SR2 = 0.95 (Figure 8.2.2), oxygen disappears within 0.05 s, and NH3 concentration slowly
increases. NO again rapidly drops to about 430 ppm and decay slowly to 330 ppm. Total Fixed
Nitrogen (mole fraction of N in species other than N2, approximated by NO+NH3+HCN) is a
measure of the total unreacted nitrogen in the mixture. In this case, TFN concentration is 332 ppm
by 0.5 s.

8-14
Figure 8.2.1. Kinetic curves of the main species in the reburning zone at SR2 = 0.99 and injectiontemperature T1 = 1700 K.
Figure 8.2.2. Kinetic curves of the main species in the reburning zone at SR2 = 0.95 and injectiontemperature T1 = 1700 K.
1E-1
1E+0
1E+1
1E+2
1E+3
1E+4
5E+4
0 0.1 0.2 0.3 0.4 0.5
Con
cent
ratio
n (p
pm)
Time (s)
CO
O2
H
NH3
NO
H2
HCN
OH
1E-1
1E+0
1E+1
1E+2
1E+3
1E+4
5E+4
0 0.1 0.2 0.3 0.4 0.5
Con
cent
ratio
n (p
pm)
Time (s)
CO
O2
H
NO
H2
OH

8-15
At SR2 = 0.90 (Figure 8.2.3), NO rapidly and more efficiently decreases from 600 to 160 ppm, and
then slowly to 67 ppm. However, in this case, the mixture contains 75 ppm HCN and 115 ppm NH3
at t = 0.5 s. Hence, TFN equals 257 ppm.
Chemistry at Short Time Scales. The results show that there are two steps of NO reduction in the
reburning process: the first very fast step and the second slow step. The cause of these fast and slow
decreases in NO concentration is of primary interest for understanding the reburning phenomenon.
To clarify the main processes in the fast NO reduction zone, calculations were carried out over a
reaction time interval of 5 msec for SR2 = 0.99 and 0.90. Figures 8.2.4 and 8.2.5 represent the
results.
Figure 8.2.4 demonstrates kinetic curves in the reburning zone at SR2 = 0.99, T1 = 1700 K, and t =
5 ms. The NO concentration has a little minimum at about 2 ms. This minimum is explained by
reactions of NO with C-containing radicals: CH3, CH2, HCCO, CH2(S), CH, and C. The radicals
are formed from CH3 which, in turn, is formed from CH4. The radicals participate also in
recombination reactions with each other and in reactions with oxygen and other species. As a result
of these processes, concentrations of the radicals increase within 2 ms, and then, since all CH4 is
Figure 8.2.3. Kinetic curves of the main species in the reburning zone at SR2 = 0.90 and injectiontemperature T1 = 1700 K.
1E-1
1E+0
1E+1
1E+2
1E+3
1E+4
5E+4
0 0.1 0.2 0.3 0.4 0.5
Con
cent
ratio
n (p
pm)
Time (s)
CO
O2
H
NH3
NO
H2
HCN
OH
CH4
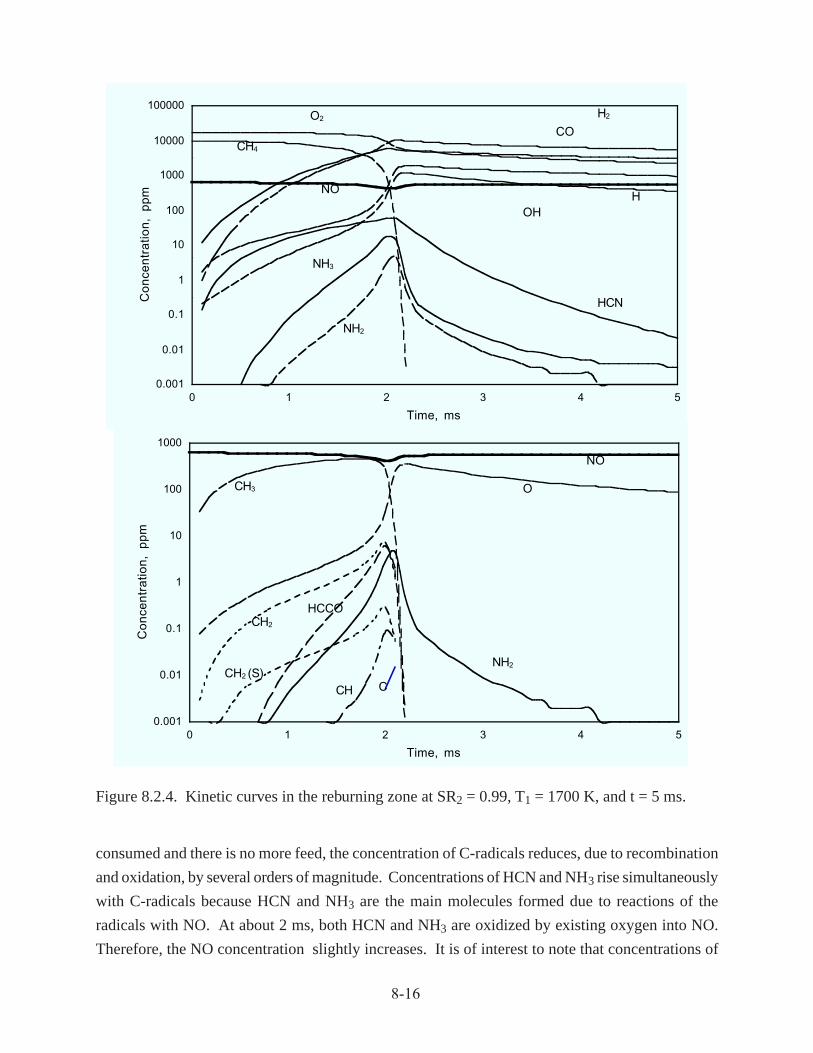
8-16
consumed and there is no more feed, the concentration of C-radicals reduces, due to recombination
and oxidation, by several orders of magnitude. Concentrations of HCN and NH3 rise simultaneously
with C-radicals because HCN and NH3 are the main molecules formed due to reactions of the
radicals with NO. At about 2 ms, both HCN and NH3 are oxidized by existing oxygen into NO.
Therefore, the NO concentration slightly increases. It is of interest to note that concentrations of
0.001
0.01
0.1
1
10
100
1000
0 1 2 3 4 5
Time, ms
Co
nce
ntr
atio
n,
pp
m
NO
CH3 O
CH2
HCCO
NH2CH2 (S)
CH C
0.001
0.01
0.1
1
10
100
1000
10000
100000
0 1 2 3 4 5
Time, ms
Co
nce
ntr
atio
n,
pp
m NO
CH4
COO2
NH3
NH2
H2
HOH
HCN
Figure 8.2.4. Kinetic curves in the reburning zone at SR2 = 0.99, T1 = 1700 K, and t = 5 ms.

8-17
CH2 and HCCO reach 8-9 ppm, though CH concentration does not exceed 0.1 ppm. Main reactions
of NO removal can be compared by considering their rates at the maximum point of radical
concentrations. Table 8.2.1 presents the NO reactions with C-radicals and their rates in arbitrary
units at 2 ms.
This comparison shows that HCCO radicals, followed by CH2 radicals, are the most important
species depleting NO concentration. Thus, the reactions of HCCO and CH2 radicals are dominant
pathways (in the scope of the assumed mechanism) for NO consumption during the initial fast NO
removal after reburn fuel injection under the conditions examined.
Table 8.2.1. Comparison of NO reaction rates with C-radicals at SR2 = 0.99, T1=1700K andt = 2 ms.
C- Reaction Rate, Total rate, Rank
radical arb. units a. u.C C + NO = CN + O 1 2.6 6 = CO + N 1.6CH CH + NO = HCN + O 25 51 4 = H + NCO 10 = N + HCO 16CH2 CH2 + NO = H + HNCO 560 900 2 = OH + HCN 140 = H + HCNO 200CH2(S) CH2(S) + NO = H + HNCO 14 22.6 5 = OH + HCN 3.6 = H + HCNO 5CH3 CH3 + NO = HCN + H2O 71 76.6 3 = H2CN + OH 5.6HCCO HCCO + NO = HCNO + CO 1860 1860 1
Figure 8.2.5 shows kinetic curves in the reburning zone within first 5 ms at SR2 = 0.90 and T1 =
1700 K. NO concentration decreases from 600 to 165 ppm, and this is explained by reactions of
NO with the same C-containing radicals. Concentrations of the radicals also have a maximum, in
this case at about 3 ms, but they are removed not so rapidly since CH4 concentration is much higher,
and the source of the radicals (CH4 and CH3) still exists within 5 ms. Concentrations of HCN and
NH3 again rise simultaneously with C-radicals, but, in this case, HCN and NH3 are almost not
oxidized since O2 concentration drops rapidly (only 1 ppm O2 exists in the mixture in 30 ms).

8-18
Figure 8.2.5. Kinetic curves in the reburning zone at SR2 = 0.90, T1 = 1700 K, and t = 5 ms.
0.001
0.01
0.1
1
10
100
1000
10000
100000
0 1 2 3 4 5
Time, ms
Co
nce
ntr
atio
n,
pp
m
CO
H2
NO
O2
CH4
HCN OH
H NH3
NH2
0.001
0.01
0.1
1
10
100
1000
0 1 2 3 4 5
Time, ms
Co
nce
ntr
atio
n,
pp
m
NO
CH3
O
CH2
HCCO
NH2
CH2 (S)
CHC
Analysis of reaction rates for the NO reactions with C-radicals at SR2 = 0.90 has been performed at
the maximum point of radical concentrations (3 ms). The same conclusion can be made as for
SR2=0.99: the primary NO-removing radicals in decreasing order of importance is HCCO, CH2,
CH3, CH, CH2(S), and C.

8-19
Dependence on Reburn Zone Stoichiometry. Figure 8.2.6 compares modeling and experimental
data on concentrations of NO, NH3, HCN, and TFN in the reburning zone (t = 0.5 s) at T1 = 1700 K
for different reburn fuel concentrations (various SR2). The main difference between the experimental
and modeling data sets is observed at low SR2 where modeling predicts higher NH3 concentration,
but experiment demonstrates higher HCN level.
However, at SR2 = 0.90-0.99, experimental and modeling concentrations are close to each other. It
worth noting that experimental data can, of course, be affected by the rate of mixing. For this
reason, mixing rates will be introduced as a variable in Section 8.3. However, Figure 8.2.6
demonstrates the current level of confidence in kinetic mechanisms developed for modeling of
reburning. Even for the simplified treatment of mixing, the model can predict major reaction trends
and can help to find prospective conditions of NO removal, for verification by experiment.
Dependence on Reburn Fuel Injection Temperature. Figure 8.2.7 compares performance of the
reburning process at different temperatures for SR2 = 0.99, 0.95, and 0.90. Under conditions close
to stoichiometry, SR2 = 0.99, concentrations of NH3 and HCN in the reburning zone are less than 1
ppm, and all TFN is in the form of NO. TFN concentration in the reburning zone is decreased by
20-30%, and it is smaller at lower temperatures where C-radicals exist longer. Since they do not
disappear too fast, more C-radicals are available for the reactions with NO. For instance, as shown
in Figure 8.2.4, the first, fast reburning stage proceeds within 5 ms at T = 1700 K, mainly within 2
ms. At 1500 K, C-radicals do not disappear so fast, and the first stage proceeds longer, within about
20 ms. As a result, NO concentration drops in this fast stage from 600 to 535 ppm at 1700 K, but at
1500 K the process is more efficient: NO decreases from 600 to 450 ppm.
At SR2 = 0.95 (Figure 8.2.7), only small amounts of NH3 and HCN are formed at about 1500 K,
and most of TFN exists in the form of NO. TFN concentration again lower at low temperatures, and
it is within 40-65% TFN reduction range. At T1 = 1500 K, the fast reburning stage proceeds in
about 30-40 ms, much slower than at 1700 K (5 ms). The slower reactions of C-radicals cause more
efficient first reburning stage: NO concentration decreases from 600 to 475 ppm and from 600 to
300 ppm at 1700 and 1500 K, respectively.
At higher reburn fuel injection rate (Figure 8.2.7, SR2 = 0.90) most of NO is converted to NH3 and
HCN. Efficiency of TFN removal is 20-55%, and, in the contrary to the previous cases, TFN
removal is more efficient at higher temperatures. Explanation of this effect is straightforward. At
SR2 = 0.90, the efficiency of NO removal continues to increase, as seen in Figure 8.2.7, and NO
level is smaller at low temperatures. However, concentrations of NH3 and HCN are much higher
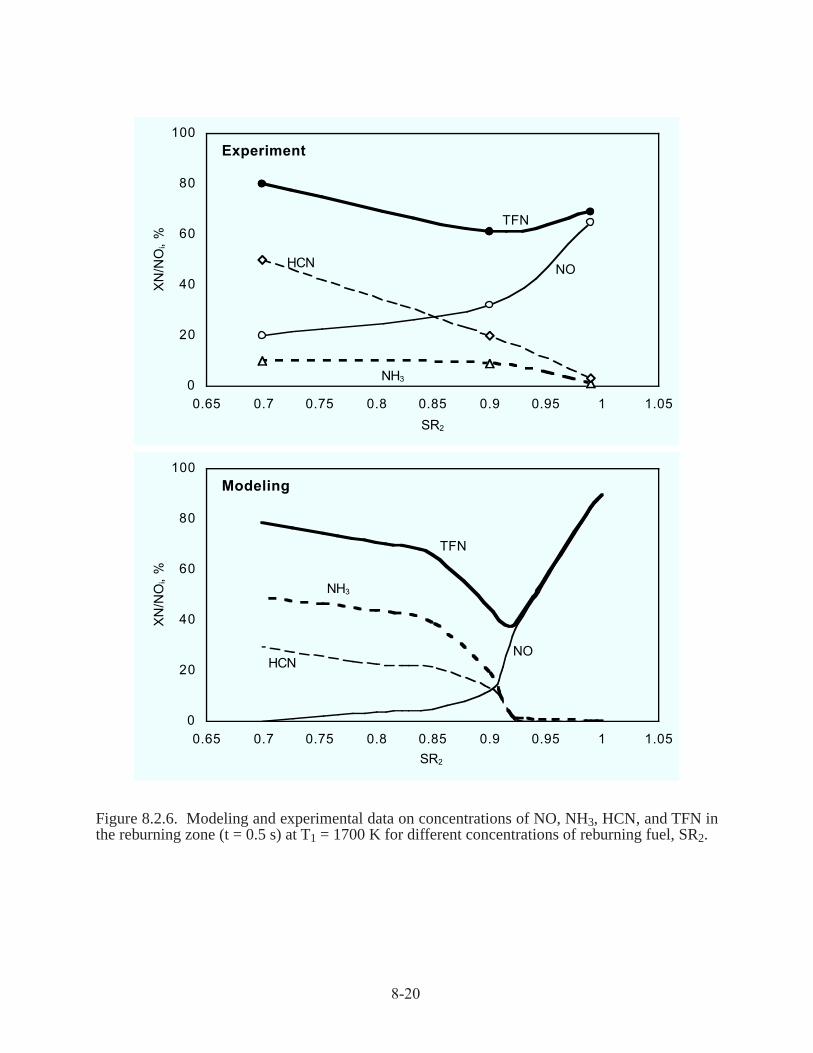
8-20
Figure 8.2.6. Modeling and experimental data on concentrations of NO, NH3, HCN, and TFN inthe reburning zone (t = 0.5 s) at T1 = 1700 K for different concentrations of reburning fuel, SR2.
0
20
40
60
80
100
0.65 0.7 0.75 0.8 0.85 0.9 0.95 1 1.05
SR2
XN
/NO
i, %
Experiment
TFN
NOHCN
NH3
0
20
40
60
80
100
0.65 0.7 0.75 0.8 0.85 0.9 0.95 1 1.05
SR2
XN
/NO
i, %
Modeling
TFN
NOHCN
NH3

8-21
Figure 8.2.7. Modeling data on concentrations of NO, NH3, HCN, and TFN in the reburning zone(t = 0.5 s) at T1 = 1500-1700 K for different concentrations of reburning fuel, SR2.
0
20
40
60
80
100
1450 1500 1550 1600 1650 1700 1750
Injection Temperature, K
XN
/NO
i, %
SR2 = 0.99
TFNNO
HCNNH3
0
20
40
60
80
100
1450 1500 1550 1600 1650 1700 1750
Injection Temperature, K
XN
/NO
i, %
SR2 = 0.95
TFN
NO
HCNNH3
0
20
40
60
80
100
1450 1500 1550 1600 1650 1700 1750
Injection Temperature, K
XN
/NO
i, %
SR2 = 0.90
TFN
NO
HCN
NH3

8-22
than NO, and they decrease at higher temperatures since they react faster. Therefore, TFN decreases
at T = 1700 K.
Thus, modeling shows that at higher reburn fuel mass flow rates (SR2 at about 0.90), higher
temperatures results in higher efficiency of TFN removal. At lower injection rates (SR2 = 0.950.99),
reburning efficiency is higher at lower temperatures.
Sensitivity Analysis at SR2=0.99. Sensitivity analysis was performed for reburn fuel injection at
1700 K, for SR2=0.99 and 0.90, to better understand the important reactions for these conditions.
The following is a summary of the reburn zone analysis. A more detailed analysis appears in
Zamansky et al. (1997a). Results for SR2=0.99 will be addressed first, followed by those for
SR2=0.90.
The kinetic curves for SR2=0.99 are presented in Figure 8.2.1. As previously discussed, there are
two regions of NO reduction: the initial fast decrease (from 600 to 540 ppm) which lasts for a very
short period of time (about 2-3 ms), followed by a slow decrease (to 502 ppm). Figures 8.2.8 and
8.2.9 present reactions which contribute to NO reduction during the fast and slow NO reduction
regions, respectively. (In these and other plots which follow, some curve labels overlap near the y-
axis. Note that the reactions of interest are those with large positive or negative contribution or
sensitivity factors; it is not important to read values close to the axis.) The most important steps of
NO reduction in the fast region (Figure 8.2.8) are reactions (273) and (248):
HCCO + NO = HCNO + CO (273)
CH2 + NO = H + HNCO (248)
Simultaneously, some HNO and NO2 are formed which can contribute to both NO formation
H + NO + M = HNO + M (-211)
HNO + H = H2 + NO (213)
HNO + OH = NO + H2O (214)
NO2 + H = NO + OH (188)
and NO reduction via reaction (211) and (186):
NO + O + M = NO2 + M (186)

0 0.001 0.002 0.003 0.004
Time (sec)
-4 x 10⁻⁶
-3 x 10⁻⁶
-2 x 10⁻⁶
-1 x 10⁻⁶
0
1 x 10⁻⁶C
ontr
ibut
ion
Fac
tor
(mol
e/cm
3 sec
)
273
273 HCCO+NO<=>HCNO+CO
248
248 CH2+NO<=>H+HNCO
211
211 H+NO+M<=>HNO+M
213
213 HNO+H<=>H2+NO
214
214 HNO+OH<=>NO+H2O
188
188 NO2+H<=>NO+OH
186
186 NO+O+M<=>NO2+M
249
249 CH2+NO<=>OH+HCN
179
179 N+OH<=>NO+H
254
254 CH3+NO<=>HCN+H2O
185
185 HO2+NO<=>NO2+OH
250
250 CH2+NO<=>H+HCNO
198
198 NH+NO<=>N2O+H
245
245 CH+NO<=>HCN+O
Σ
8-23
Figure 8.2.8. NO contribution factors at SR = 0.99 in the fast NO decrease region.2
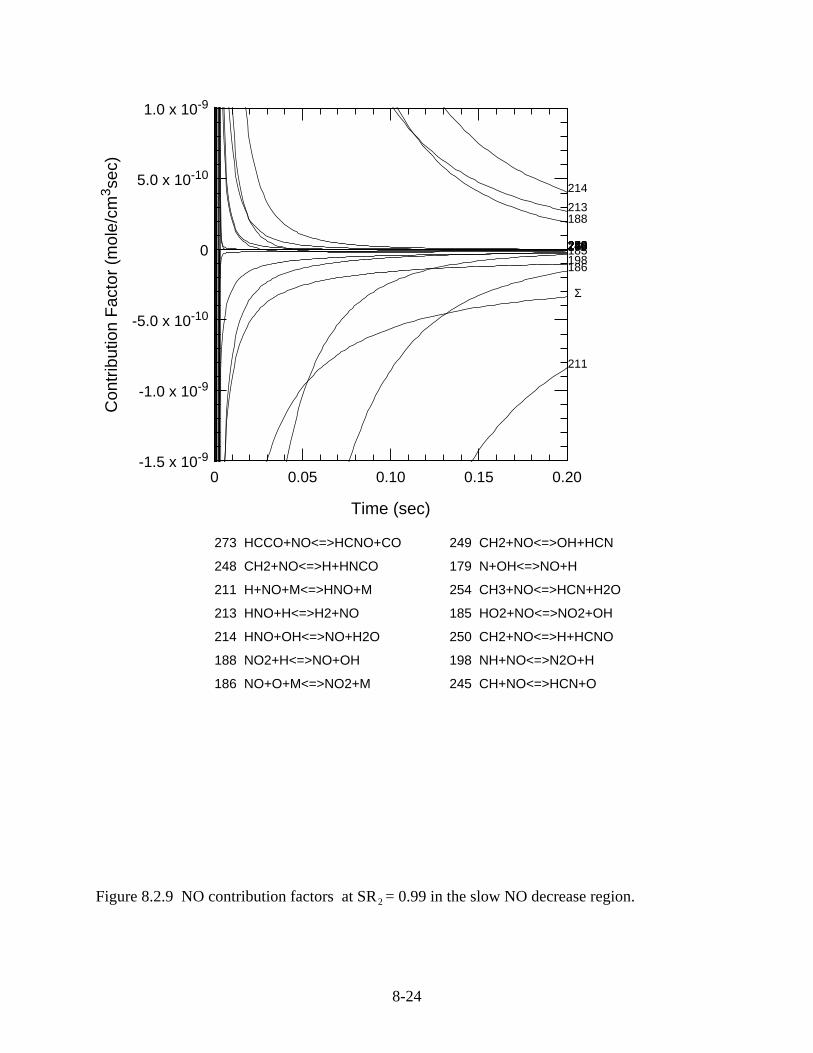
0 0.05 0.10 0.15 0.20
Time (sec)
-1.5 x 10⁻⁹
-1.0 x 10⁻⁹
-5.0 x 10⁻¹⁰
0
5.0 x 10⁻¹⁰
1.0 x 10⁻⁹C
ontr
ibut
ion
Fac
tor
(mol
e/cm
3 sec
)
273
273 HCCO+NO<=>HCNO+CO
248
248 CH2+NO<=>H+HNCO
211
211 H+NO+M<=>HNO+M
213
213 HNO+H<=>H2+NO
214
214 HNO+OH<=>NO+H2O
188
188 NO2+H<=>NO+OH
186
186 NO+O+M<=>NO2+M
249
249 CH2+NO<=>OH+HCN
179
179 N+OH<=>NO+H
254
254 CH3+NO<=>HCN+H2O
185
185 HO2+NO<=>NO2+OH
250
250 CH2+NO<=>H+HCNO
198
198 NH+NO<=>N2O+H
245
245 CH+NO<=>HCN+O
R
Σ
8-24
Figure 8.2.9 NO contribution factors at SR = 0.99 in the slow NO decrease region.2
8-25
Reactions (211) and (186) are mainly responsible for the slow NO decrease as shown in Figure
8.2.9. The NO decrease is slow since these reactions compete with NO formation via (188), (213),
and (214).
Figures 8.2.10 and 8.2.11 show sensitivity coefficients for NO formation and reduction in the
reburning zone with SR2=0.99 in the fast and slow NO reduction regions, respectively. Figure
8.2.10 clearly demonstrates that the chain branching steps
H + O2 = O + OH (38)
CH3 + O2 = O + CH3O (155)
2 CH3 = H + C2H5 (159)
are responsible for the boost of radicals. In these reactions, each H atom and CH3 radical forms
several active species. Reaction (159) is also a chain branching step since C2H5 instantly decomposes
into C2H4 and H. The increased radical pool generates carbon-containing radicals (HCCO and
CH2) which reduce NO via reactions (273) and (248).
Figure 8.2.11 shows that two reactions
N + NO = N2 + O (177)
and NH + NO = N2O + H (198)
primarily contribute to NO removal in the slow region. Reaction (177) competes with reaction
N + OH = NO + H (179)
Interestingly, the major chain branching step, reaction (38), behaves differently in the fast and slow
reduction regions. In the fast region, this reaction supports formation of the radical pool and increases
concentrations of carbon-containing radicals, such as HCCO, CH2, etc. As a result, the radicals
react with NO, and its concentration decreases. At a certain point, concentrations of carbon-containing
radicals decrease since all methane is oxidized, and NO removal becomes slow. However, in this
slow region, concentrations of N and NH are relatively high, and reactions (177) and (198) are
responsible for NO reduction. The decrease of NO concentration is slow since reaction (38) results
in an increase of the OH level that causes acceleration of NO formation via (179).

0 0.05 0.10 0.15 0.20
Time (sec)
-1.0
-0.5
0
0.5S
ensi
tivity
38
38
38 H+O2<=>O+OH
155
155
155 CH3+O2<=>O+CH3O
159
159
159 2CH3<=>H+C2H5
10
10
10 O+CH3<=>H+CH2O
153
153
153 CH2(S)+CO2<=>CO+CH2O
53
53
53 H+CH4<=>CH3+H2
84
84
84 OH+H2<=>H+H2O
135
135
135 CH2+O2<=>OH+HCO
21 21
21 O+C2H2<=>H+HCCO
273273
273 HCCO+NO<=>HCNO+CO
86 86
86 2OH<=>O+H2O
98 98
98 OH+CH4<=>CH3+H2O
11 11
11 O+CH4<=>OH+CH3
99 99
99 OH+CO<=>H+CO2
113113
248248
112112
158158
52 52
145145
61 61 254254 198198138138
177177175175 156156 119119179179 166166 142142 79 79 101101 144144 95 95 78 78 196196 3 3 75 75 32 32 23 23 250250 126126 172172 148148 58 58 43 43118118 211211160160 161161 197197249249 62 62
8-26
Figure 8.2.10. NO sensitivity coefficients at SR =0.99 in the fast NO decrease region. Graph shows2
imporant reactions at early reaction times. Sensitivities for long reaction times (over lapping here)are shown in Figure 8.2.11.

0 0.05 0.10 0.15 0.20
Time (sec)
-0.04
-0.02
0
0.02
0.04S
ensi
tivity
38
38 H+O2<=>O+OH
10
10 O+CH3<=>H+CH2O
153
153 CH2(S)+CO2<=>CO+CH2O
135
135 CH2+O2<=>OH+HCO
21 O+C2H2<=>H+HCCO
273
273 HCCO+NO<=>HCNO+CO
98
98 OH+CH4<=>CH3+H2O
61
61 H+CH2OH<=>OH+CH3
254
254 CH3+NO<=>HCN+H2O
198198
198 NH+NO<=>N2O+H
177
177 N+NO<=>N2+O
175
175 HCCO+O2<=>OH+2CO
179
179 N+OH<=>NO+H
196
196 NH+H2O<=>HNO+H2
211197
8-27
Figure 8.2.11. NO sensitivity coefficients at SR =0.99 in the slow NO decrease region.2
8-28
Sensitivity Analysis at SR2=0.90. The kinetic curves for SR2=0.90 are presented in Figure 8.2.3. In
this case, the NO concentration decreases from 600 to 160 ppm, and then slowly to 67 ppm. At
t=0.5 s, the mixture contains 75 ppm HCN and 115 ppm NH3. Methane is even more rapidly
converted to CO and H2. Again there are two steps of NO reduction: the fast short and slow long
regions.
Figures 8.2.12 and 8.2.13 show NO contribution coefficients for the fast and slow NO reduction
regions, respectively, at SR2=0.90. The same as at SR2=0.99, the most important step of NO reduction
in the fast region (Figure 8.2.12) is reaction (273). Reactions (248) and:
CH3 + NO = HCN + H2O (254)
are less important, and some NO is formed from HNO via (-211).
At longer reaction times (Figure 8.2.13), reaction (281) is of primary importance for NO reduction
NH2 + NO = N2 + H2O (281)
followed by reactions (254) and (273). In this region, the NO is also formed from HNO (-211).
Sensitivity coefficients in the reburning zone at SR2=0.90 in the fast NO reduction regions shows
that chain branching reactions (38), (155), and (159) are primarily responsible for increasing the
radical pool and initially reducing NO, the same as for SR2=0.99.
In the slow region (Figure 8.2.14), there are many elementary processes which affect the NO
concentration. The main NO reducing reactions include interaction of NO with NH2 and HCCO
radicals, via (281) and (273), and reaction (281) becomes increasingly important at longer times.
Reaction
NH2 + H = NH + H2 (201)
decreases the NH2 concentration and consequently contributes to increasing NO.
Contribution and sensitivity factors have also been calculated at SR2=0.90 for NH3, HCN, and
HNO. Contribution factors are dominated by transients occuring in about the first 10 ms. Reverse
reactions
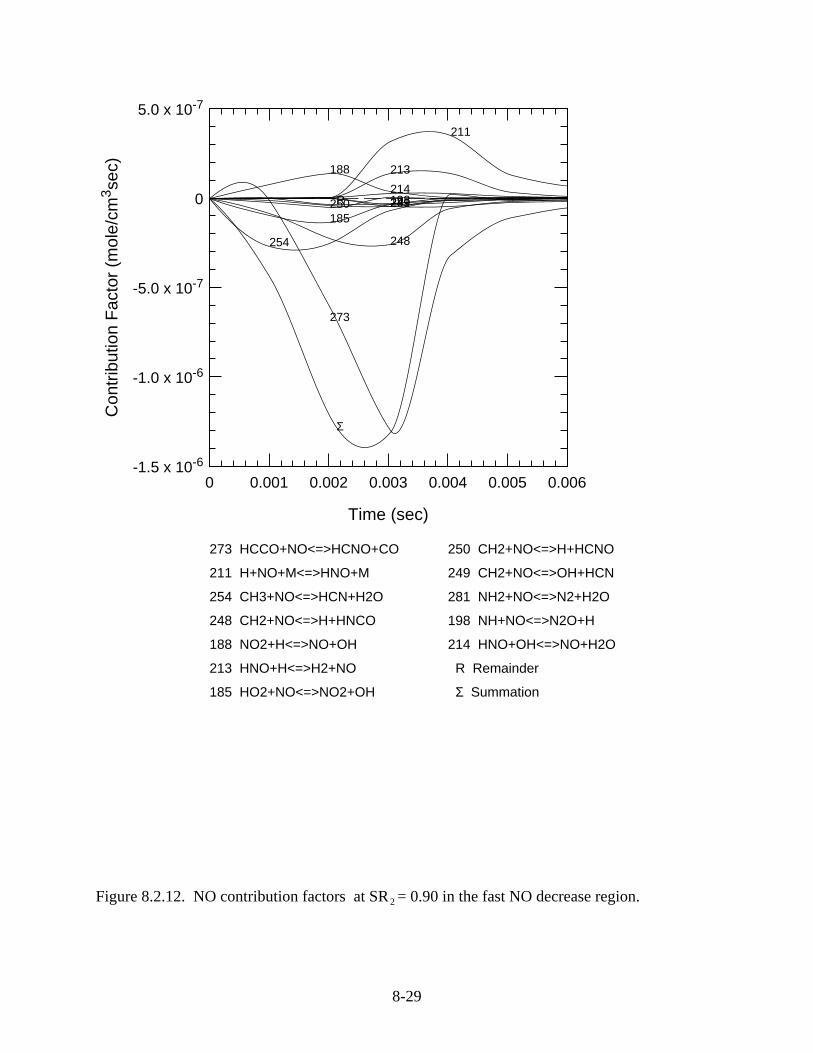
0 0.001 0.002 0.003 0.004 0.005 0.006
Time (sec)
-1.5 x 10⁻⁶
-1.0 x 10⁻⁶
-5.0 x 10⁻⁷
0
5.0 x 10⁻⁷C
ontr
ibut
ion
Fac
tor
(mol
e/cm
3 sec
)
273
273 HCCO+NO<=>HCNO+CO
211
211 H+NO+M<=>HNO+M
254
254 CH3+NO<=>HCN+H2O
248
248 CH2+NO<=>H+HNCO
188
188 NO2+H<=>NO+OH
213
213 HNO+H<=>H2+NO
185
185 HO2+NO<=>NO2+OH
250
250 CH2+NO<=>H+HCNO
249
249 CH2+NO<=>OH+HCN
281
281 NH2+NO<=>N2+H2O
198
198 NH+NO<=>N2O+H
214
214 HNO+OH<=>NO+H2O
R
R Remainder
Σ
Σ Summation
8-29
Figure 8.2.12. NO contribution factors at SR = 0.90 in the fast NO decrease region.2

0 0.05 0.10 0.15 0.20
Time (sec)
-2 x 10⁻⁹
-1 x 10⁻⁹
0
1 x 10⁻⁹
2 x 10⁻⁹C
ontr
ibut
ion
Fac
tor
(mol
e/cm
3 sec
)
273
273 HCCO+NO<=>HCNO+CO
211
211 H+NO+M<=>HNO+M
254
254 CH3+NO<=>HCN+H2O
248
248 CH2+NO<=>H+HNCO
188
188 NO2+H<=>NO+OH
213
213 HNO+H<=>H2+NO
185
185 HO2+NO<=>NO2+OH
250
250 CH2+NO<=>H+HCNO
249
249 CH2+NO<=>OH+HCN
281
281 NH2+NO<=>N2+H2O
198
198 NH+NO<=>N2O+H
214
214 HNO+OH<=>NO+H2O
R
R Remainder
Σ
Σ Summation
8-30
Figure 8.2.13. NO contribution factors at SR = 0.90 in the slow NO decrease region.2

0 0.05 0.10 0.15 0.20
Time (sec)
-0.05
0
0.05
Sen
sitiv
ity
38
38 H+O2<=>O+OH
159
159 2CH3<=>H+C2H5
273
273 HCCO+NO<=>HCNO+CO
21
21 O+C2H2<=>H+HCCO
10 O+CH3<=>H+CH2O
153
153 CH2(S)+CO2<=>CO+CH2O
254
254 CH3+NO<=>HCN+H2O
53
53 H+CH4<=>CH3+H2
281
281 NH2+NO<=>N2+H2O
201
201 NH2+H<=>NH+H2
79
79 H+HCCO<=>CH2(S)+CO
196
52
282
282 NH2+NO<=>N2+H2O
280
280 NH2+NO<=>NNH+OH
99
99 OH+CO<=>H+CO2
61202
198
8-31
Figure 8.2.14. NO sensitivity coefficients at SR =0.90 in the slow NO decrease region.2

8-32
NH3 + OH = NH2 + H2O (-277) and
NH3 + H = NH2 + H2 (-276)
are important contributors to NH3 formation. HCN is mainly formed via (254) and
HCNO + H = OH + HCN (270)
HNO radicals are important intermediate species in the fast reaction region. They are rapidly
formed from NH
NH + H2O = HNO + H2 (196)
and decompose via reaction (211).
Sensitivity analysis for NH3 at SR=0.90 show an initial fast transient where the same chain branching
steps (38, 155, 159) which influence NO also result in a higher NH2 level and a faster rate of NH3
formation via reverse reactions (-276) and (-277). In the slow region, NH3 removal is enhanced by
reactions (159), (281), and
NH2 + H = NH + H2 (201).
The HCN concentration is initially increased due to reactions (254) and (38), and then reduced
mainly due to reaction
HCN + OH = HOCN + H (233)
8.2.2 Injection of Ammonia into the Reburning Zone (AR-Rich)
When fuel is added into the reburning zone, the oxygen disappears very fast in the reaction with the
fuel to form CO and H2. If N-agents (ammonia, urea, etc.) are injected into the reburning zone,
they form NHi radicals (NH2, NH, N) which are active in NO removal reactions. The NHi radicals
can react either with O2 into NO or with NO into N2. The NO reduction process is effective if the
NHi precursors (N-agents) appear in the gas mixture when concentration of oxygen has been
significantly depleted by the reburning fuel, thus preventing oxidation of Nagents into NO. Calculated
characteristic times for O2 disappearance after reburn fuel injection are less than 0.01 s at 1700 K

8-33
and about 0.1 s at 1450 K. The delay time between reburn fuel injection and the formation of NHi
species should be close to these times for effective NO reduction.
Results of calculations which demonstrate the effect of the delayed ammonia injection on NO
reduction by CH4 reburning are presented in Figure 8.2.15. The first graph shows concentrations of
NO, NH3, HCN, and TFN after 0.5 s as a function of SR2 for injection of 600 ppm NH3 without
delay, i.e. co-injection with the reburning fuel. At SR2 = 0.90, ammonia co-injection causes a
decrease in TFN from 1200 ppm (600 ppm NO and 600 ppm NH3) to 327 ppm. At SR2 = 0.90, the
concentration of the reburning fuel is high, and its reaction with the oxygen forms a large radical
pool. The radicals initiate a rapid reaction between NH3 and NO, and the TFN concentration is
depleted. This reaction requires a small amount of oxygen to support the radical pool, and this
amount is available in the mixture during the first rapid reaction stage. The concentration of ammonia
decreases slowly at SR2 = 0.90 since most of the oxygen reacts with the high concentration of CH4.
Some CH4 (about 400 ppm) remains unreacted in the reburning zone. At SR2 = 0.99, all NH3 and
CH4 are instantly oxidized since the concentration of O2 is the same, but the [CH4] level is much
lower. In this oxidation process, ammonia forms some additional NO, and this NO cannot be
decreased in the reaction with ammonia since it is no longer present in the mixture. Therefore, TFN
= NO = 742 ppm, i.e. the NO concentration increases.
The picture is completely different if ammonia is injected with a 0.1 s delay time, as shown in the
second graph in Figure 8.2.15. In this case, at SR2 = 0.90, ammonia is injected when the O2
concentration is already very low (about 0.01 ppm). Concentration of NO is reduced in the first
rapid reburning stage within the delay time of 0.1 s and it decreases further utilizing some ammonia.
However, in 0.5 s the NH3 concentration is still high, about 420 ppm, and it does not react rapidly
with NO since there is no oxygen to feed the radical pool. At SR2 = 0.99, NH3 is injected when the
O2 concentration is about 50 ppm (see Figure 8.2.1) and the OH concentration is still high. Therefore,
in the presence of this oxygen level, NH3 and NO are capable of reacting with each other, and TFN
concentration efficiently decreases. Thus, at the right conditions, delayed ammonia injection can
result in more effective NO removal. These conditions require the presence of both reagents and
some oxygen, and so is most effective under near-stoichiometric conditions.
Parametric Dependencies. The effect of the delayed ammonia injection depends on many factors,
including the value of SR2, the delay time, ammonia concentration, oxygen concentration, etc.
Figure 8.2.16 presents concentrations of fuel-N species in the reburning zone at SR2 = 0.99 as a
function of ammonia injection delay time. If ammonia is injected along with the reburning fuel, it
rapidly disappears in the reaction with the high amount of oxygen and causes some NO formation.
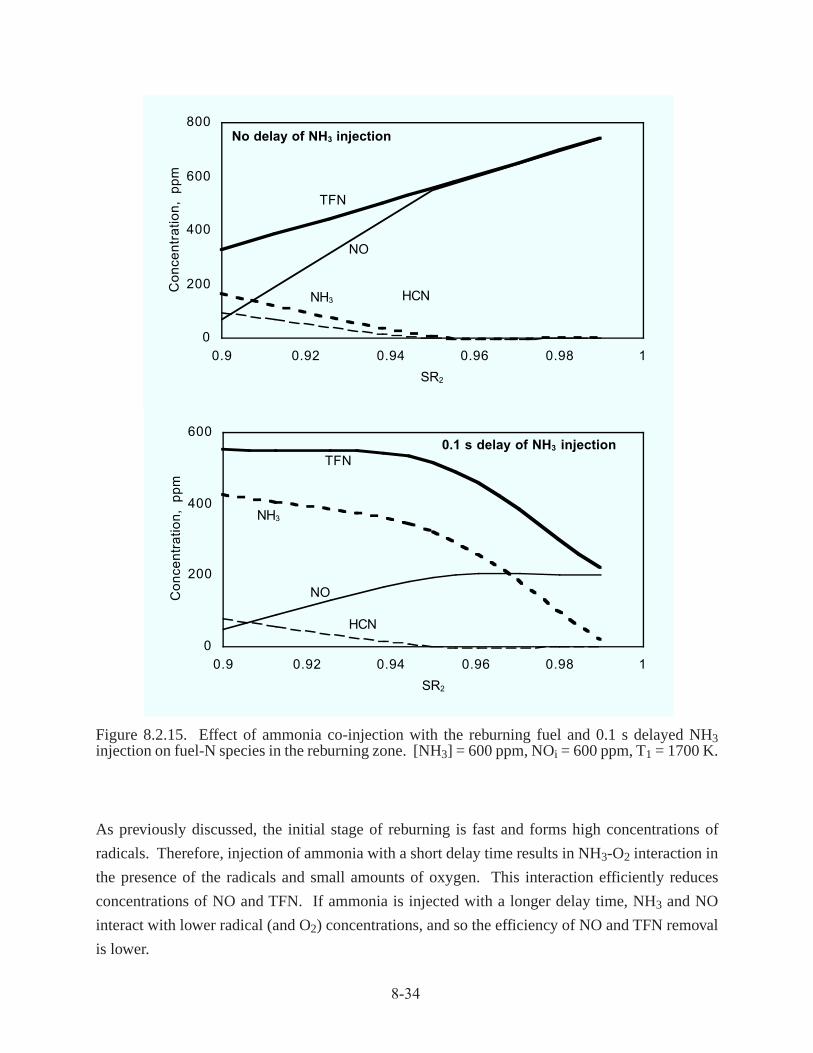
8-34
Figure 8.2.15. Effect of ammonia co-injection with the reburning fuel and 0.1 s delayed NH3injection on fuel-N species in the reburning zone. [NH3] = 600 ppm, NOi = 600 ppm, T1 = 1700 K.
0
200
400
600
800
0.9 0.92 0.94 0.96 0.98 1
SR2
Co
nce
ntr
atio
n,
pp
m
TFN
NO
NH3
No delay of NH3 injection
HCN
0
200
400
600
0.9 0.92 0.94 0.96 0.98 1
SR2
Co
nce
ntr
atio
n,
pp
m
TFN
NO
NH3
0.1 s delay of NH3 injection
HCN
As previously discussed, the initial stage of reburning is fast and forms high concentrations of
radicals. Therefore, injection of ammonia with a short delay time results in NH3-O2 interaction in
the presence of the radicals and small amounts of oxygen. This interaction efficiently reduces
concentrations of NO and TFN. If ammonia is injected with a longer delay time, NH3 and NO
interact with lower radical (and O2) concentrations, and so the efficiency of NO and TFN removal
is lower.

8-35
Figure 8.2.17 shows the dependence of NO and TFN on the quantity of NH3 injected with a 0.1 s
delay time at SR2 = 0.99. As injected [NH3] increases, the resulting NO concentration decreases,
but the residual [NH3] increases. The TFN concentration has a minimum which approximately
corresponds to equimolecular amounts of NO and NH3 in the gas mixture (NSR = 1.0 - 1.3).
Figure 8.2.16. Effect of the delay time of NH3 injection into the reburning zone at SR2 = 0.99.Other conditions are the same as in Figure 8.2.15.
0
200
400
600
800
1000
0 0.1 0.2 0.3 0.4 0.5
Delay time, s
Co
nce
ntr
atio
n,
pp
m
TFN
NO
NH3
HCN
0
50
100
150
200
250
300
350
450 500 550 600 650 700 750 800 850
[NH3]i, ppm (at 0.1 s)
Co
nce
ntr
atio
n,
pp
m TFN
NO
NH3 HCN
Figure 8.2.17. Effect of the NH3 concentration injected into the reburning zone at SR2 = 0.99 and0.1 s delay time. Other conditions are the same as in Figure 8.2.15.

8-36
Although the concentrations in the reburn zone are presented here, post-burnout concentrations
remain consistent with this observation. Zamansky (1996b) includes further discussion and
comparison of the concentration histories for different ammonia injection scenarios.
Sensitivity Analysis. Figure 8.2.18 shows kinetic curves of major components for injection of 800
ppm ammonia with the reburning fuel at SR2=0.99 and T1=1700 K. The predictions are similar to
those for reburning without ammonia injection (Figure 8.2.1) except that NO concentration jumps
from 600 to about 900 ppm and then slowly decreases to 800 ppm. Thus, part of the ammonia is
converted to molecular nitrogen and another part to NO. Figure 8.2.19 presents NO contribution
factors for the first 10 ms at these conditions. Reaction (211) is primarily responsible for the NO
decrease, but the NO is formed via reaction (213) and to lesser extent via (214) and (188). Sensitivity
analysis shows that as for reburning without N-agent (Figure 8.2.11), reaction (38) accelerates NO
formation by increasing the radical pool. Reactions of NHi radicals with NO ((198), (281), and
(177)) decrease the NO level. The most notable difference from conventional reburning is the
increased importance of reaction 281, which involves NH2, compared to those involving NH and N.
Figure 8.2.20 shows the concentration curves for the same conditions as in Figure 8.2.18, but with
the 800 ppm NH3 injected with a 0.1 s delay after the reburning fuel. This delay dramatically
changed the NO concentration as well as concentrations of other species. NO was reduced to
slightly above 100 ppm and about 150 ppm NH3 is present in the mixture at t=0.5 s. Significant
amounts of HNCO and O2 are present at t=0.5 s. Figure 8.2.21 shows the main reactions contributing
to NO formation and reduction in the first 0.10 s under these conditions. Reactions (281) and (282)
represent one elementary step which was formally written as two reactions in the mechanism. The
code calculated the sum of these reactions which result in NO reduction. Another important NO
reducing step is the reaction
NH2 + NO = NNH + OH (280)
NO formation is largely via reaction (-211). Figure 8.2.22 presents NO sensitivity coefficients
which also demonstrate the importance of the sum (281+282). Interestingly, this reaction reduces
NO at early reaction stages (t<0.03 s), then increases the NO concentration at about 0.04-0.16 s,
and finally reduces NO again. The reason for this “strange” behavior is that reaction (280) includes
the same reagents, NH2 and NO, and it is a single process which is mainly responsible for NO
reduction under these conditions. Indeed, though reaction (281+282) forms molecular nitrogen
from NO, it removes the NH2 radical from the reaction media thus decreasing the radical pool.

0 0.1 0.2 0.3 0.4 0.5 0.6
Time (sec)
10-7
10-6
10-5
10-4
10-3
10-2
10-1
Mol
e F
ract
ion
48
48 N2
6
6 H2O
16
16 CO2
4
4 O2
14 CH4
15
15 CO
1
1 H2
5
5 OH
2
2 H
36
36 NO
34 NH3
3
3 O
41
41 HCN
46
46 HNCO
7
8-37
Figure 8.2.18. Kinetic curves of species in the reburning zone at SR = 0.99 for injection of 800 ppm2
ammonia along with the reburning fuel at 1700 K.

0 0.002 0.004 0.006 0.008 0.010
Time (sec)
-2 x 10⁻⁶
-1 x 10⁻⁶
0
1 x 10⁻⁶
Con
trib
utio
n F
acto
r (m
ole/
cm3 s
ec)
211
211 H+NO+M<=>HNO+M
213
213 HNO+H<=>H2+NO
214
214 HNO+OH<=>NO+H2O
188
188 NO2+H<=>NO+OH
186
186 NO+O+M<=>NO2+M
179
179 N+OH<=>NO+H
185
185 HO2+NO<=>NO2+OH
212
212 HNO+O<=>NO+OH
177
177 N+NO<=>N2+O
189
189 NH+O<=>NO+H
R
R Remainder
Σ
Σ Summation
8-38
Figure 8.2.19. NO contribution factors for conditions of Figure 8.2.18.

0 0.1 0.2 0.3 0.4 0.5 0.6
Time (sec)
10-7
10-6
10-5
10-4
10-3
10-2
10-1
Mol
e F
ract
ion
48
48 N2
6
6 H2O
16
16 CO2
15
15 CO
1
1 H2
34
34 NH3
36
36
36 NO
5
5
5 OH
4
4
4 O2
2
2
2 H
46
46
46 HNCO
33
33 NH2
38
38 N2O
8-39
Figure 8.2.20. Kinetic curves of species in the reburning zone at SR = 0.99 for injection of 800 ppm2
ammonia with a 0.1 s delay after the reburning fuel injected at 1700 K.

0 0.02 0.04 0.06 0.08 0.10
Time (sec)
-2.0 x 10⁻⁷
-1.5 x 10⁻⁷
-1.0 x 10⁻⁷
-5.0 x 10⁻⁸
0
5.0 x 10⁻⁸
1.0 x 10⁻⁷
Con
trib
utio
n F
acto
r (m
ole/
cm3 s
ec)
281
281 NH2+NO<=>N2+H2O
282
282 NH2+NO<=>N2+H2O
280
280 NH2+NO<=>NNH+OH
211
211 H+NO+M<=>HNO+M
198
198 NH+NO<=>N2O+H
R
R Remainder
Σ
Σ Summation
8-40
Figure 8.2.21. NO contribution factors for conditions of Figure 8.2.20.

0 0.1 0.2 0.3 0.4 0.5 0.6
Time (sec)
-0.4
-0.2
0
0.2
Sen
sitiv
ity
280
280
280 NH2+NO<=>NNH+OH
281
281
281 NH2+NO<=>N2+H2O
202
202
202 NH2+OH<=>NH+H2O
38 38
38 H+O2<=>O+OH
196
196
196 NH+H2O<=>HNO+H2
282
282
282 NH2+NO<=>N2+H2O
198
198
198 NH+NO<=>N2O+H
201201
201 NH2+H<=>NH+H2
43 43
43 H+OH+M<=>H2O+M
226226
226 NCO+M<=>N+CO+M
310310
310 2NH2<=>NH+NH3
8-41
Figure 8.2.22. NO sensitivity coefficients for conditions of Figure 8.2.20.
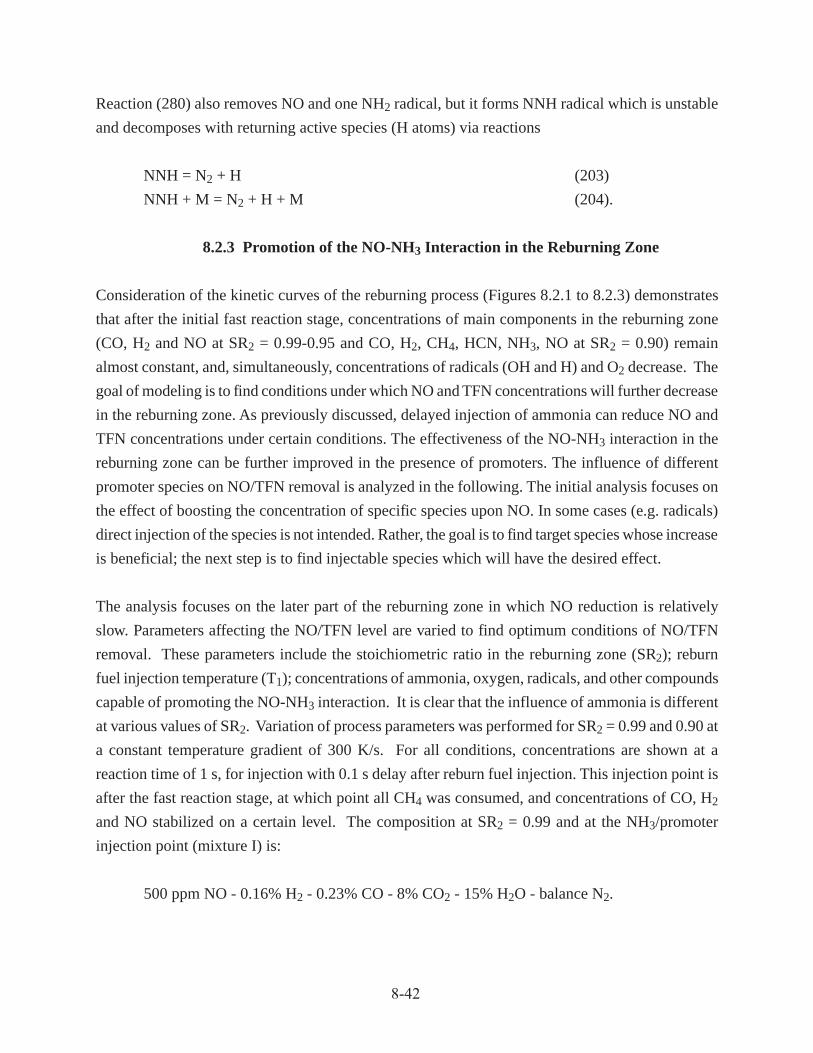
8-42
Reaction (280) also removes NO and one NH2 radical, but it forms NNH radical which is unstable
and decomposes with returning active species (H atoms) via reactions
NNH = N2 + H (203)
NNH + M = N2 + H + M (204).
8.2.3 Promotion of the NO-NH3 Interaction in the Reburning Zone
Consideration of the kinetic curves of the reburning process (Figures 8.2.1 to 8.2.3) demonstrates
that after the initial fast reaction stage, concentrations of main components in the reburning zone
(CO, H2 and NO at SR2 = 0.99-0.95 and CO, H2, CH4, HCN, NH3, NO at SR2 = 0.90) remain
almost constant, and, simultaneously, concentrations of radicals (OH and H) and O2 decrease. The
goal of modeling is to find conditions under which NO and TFN concentrations will further decrease
in the reburning zone. As previously discussed, delayed injection of ammonia can reduce NO and
TFN concentrations under certain conditions. The effectiveness of the NO-NH3 interaction in the
reburning zone can be further improved in the presence of promoters. The influence of different
promoter species on NO/TFN removal is analyzed in the following. The initial analysis focuses on
the effect of boosting the concentration of specific species upon NO. In some cases (e.g. radicals)
direct injection of the species is not intended. Rather, the goal is to find target species whose increase
is beneficial; the next step is to find injectable species which will have the desired effect.
The analysis focuses on the later part of the reburning zone in which NO reduction is relatively
slow. Parameters affecting the NO/TFN level are varied to find optimum conditions of NO/TFN
removal. These parameters include the stoichiometric ratio in the reburning zone (SR2); reburn
fuel injection temperature (T1); concentrations of ammonia, oxygen, radicals, and other compounds
capable of promoting the NO-NH3 interaction. It is clear that the influence of ammonia is different
at various values of SR2. Variation of process parameters was performed for SR2 = 0.99 and 0.90 at
a constant temperature gradient of 300 K/s. For all conditions, concentrations are shown at a
reaction time of 1 s, for injection with 0.1 s delay after reburn fuel injection. This injection point is
after the fast reaction stage, at which point all CH4 was consumed, and concentrations of CO, H2
and NO stabilized on a certain level. The composition at SR2 = 0.99 and at the NH3/promoter
injection point (mixture I) is:
500 ppm NO - 0.16% H2 - 0.23% CO - 8% CO2 - 15% H2O - balance N2.

8-43
The effect of ammonia addition alone to mixture I is shown in Figure 8.2.23. Without NH3 injection
(the upper graph), NO is slightly reduced at lower temperatures. Injections of 500 and 800 ppm
NH3 cause an increase in TFN at lower temperatures and significant NO/TFN reduction at higher
temperatures.
Performance of candidate promoter species was modeled by co-injection with ammonia in different
amounts into mixture I at 1600 K. Figure 8.2.24 compares effect of different additives: O2, OH, H,
O, O2+OH, and O2+H2O2. Different promoters show different degrees of TFN removal, some with
a clear optimum.
Carbon-containing compounds can also provide radicals which promote the NO-NH3 interaction in
the reburning zone. Effect of different potential promoters on concentrations of NO, NH3 and TFN
is shown in Figure 8.2.25. This graph compares the effect of 500 ppm NH3 injection into mixture
I at 1600 K with co-injection of 100 ppm promoter: oxygen, methanol, methane, ethylene or ethane.
Of the hydrocarbons considered, only ethane results in much TFN reduction beyond the original
NO level. This screening of hydrocarbon promoters does not reveal a significant performance benefit.
Of the promoters considered in figures 8.2.24 and 8.2.25, the best performance is shown for O2
injection. Oxygen participates in formation of different radicals via reactions with CO, H2 and
NH3, shows better or about the same performance as the other additives tested. The next section
will discuss the effect of oxygen in some additional detail.
All promotive additives presented so far were co-injected with ammonia and appeared instantly in
the gas phase. However, under real conditions, the promoter species may be formed in the mixture
with a certain rate constant. As has been proven by Zamansky and Borisov, 1992, the rate of
promoter formation may be optimum, i.e. formation of promoters with a certain optimum rate
constant results in maximum promotion effect. It was assumed for modeling that a hypothetic
promoter X dissociates with formation of radicals or oxygen in the gas mixture. The following
reaction was added to the mechanism:
X + M => OH + H + M or
X + M => O2 + M.
These equations simulate fast interaction of the hypothetic promoter X with water molecules or
other species in flue gas with formation of OH, H, and O2. The initial concentration of X was

8-44
Figure 8.2.23. Effect of NH3 injection temperature and NH3 concentration in mixture I on NO/TFN reduction.
0
200
400
600
800
1000
1300 1400 1500 1600 1700 1800 1900
Temperature, K
Co
nce
ntr
atio
n,
pp
m TFN
NO
NH3
[NH3]i = 500 ppm
0
200
400
600
800
1000
1200
1400
1300 1400 1500 1600 1700 1800 1900
Temperature, K
Co
nce
ntr
atio
n,
pp
m TFN
NO
NH3
[NH3]i = 800 ppm
0
200
400
600
1300 1400 1500 1600 1700 1800 1900
Temperature, K
Co
nce
ntr
atio
n,
pp
m
NO = TFN[NH3]i = 0 ppm

8-45
Figure 8.2.24. Effect of radicals co-injection with 500 ppm NH3 into mixture I, T2 = 1600 K.
0
200
400
600
800
1000
0 50 100 150 200 250
[O2], ppm
Co
nce
ntr
atio
n,
pp
m
TFN
NO
NH3
O2 addition
0
200
400
600
800
1000
0 50 100 150 200 250
[OH], ppm
Co
nce
ntr
atio
n,
pp
m
TFN
NO
NH3
OH addition
0
200
400
600
800
1000
0 50 100 150 200 250
[H], ppm
Co
nce
ntr
atio
n,
pp
m
TFN
NO
NH3
H addition
0
200
400
600
800
1000
0 50 100 150 200 250
[O], ppm
Co
nce
ntr
atio
n,
pp
mTFN
NO
NH3
O addition
0
200
400
600
800
1000
0 50 100 150 200 250
[O2 + OH], ppm
Co
nce
ntr
atio
n,
pp
m
TFN
NO
NH3
O2 + OH addition
0
200
400
600
800
1000
0 50 100 150 200 250
[O2 + H2O2], ppm
Co
nce
ntr
atio
n,
pp
m
TFN
NO
NH3
O2 + H2O2 addition

8-46
assumed to be 50 ppm in modeling. The rate constant for X decomposition was selected in the
Arrenius form
k = A.exp(-20,000/T) cm3/mol.s
where the predexponential factor A was varied in the range from 109 to 1013. These values of the
rate constant provided formation of radicals and O2 with characteristic times between approximately
0.1 and 100 s.
Figure 8.2.26 compares the results of modeling NO, NH3 and TFN concentrations at different
values of the factor A (i.e. depending on the rate of active species formation in the mixture) for
three different cases: formation of OH+H radicals, formation of O2, and formation of the OH/H
radicals with co-injection of NH3 and 75 ppm O2. In a wide range of the promoter decomposition
rate, NO and TFN concentrations are substantially lower than their values without promoter. In all
cases, an optimum rate constant exists which results in minimum TFN concentration. The optimum
factor A is in the range logA = 10.5-12.0. Oxygen formation and co-injection present the most
attractive cases because the TFN minimum is lower.
Figure 8.2.25. Comparison of the promotion effect of different compounds. The promoter (100ppm) is co-injected with 500 ppm NH3 into mixture I at T1 = 1600 K and SR2 = 0.99.
0
100
200
300
400
500
600
700
800
900
CH3OH CH4 C2H4 C2H6 O2
Co
nce
ntr
atio
n,
pp
m
NO
NH3
TFN
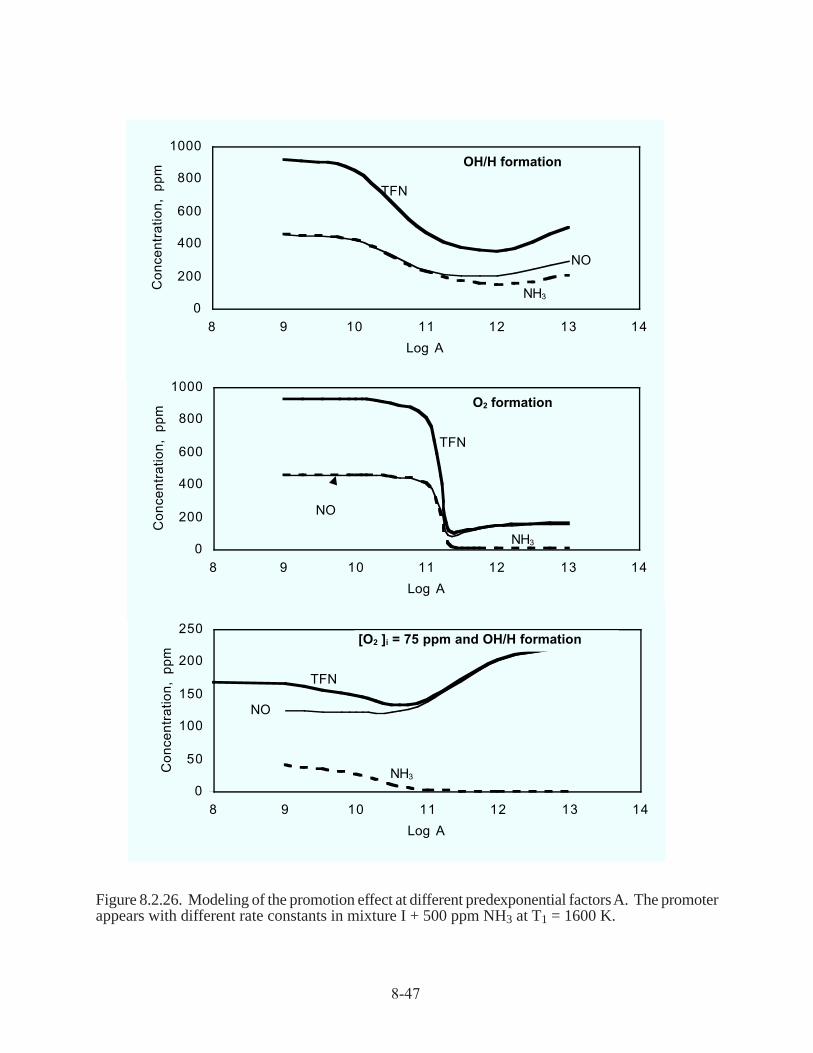
8-47
Figure 8.2.26. Modeling of the promotion effect at different predexponential factors A. The promoterappears with different rate constants in mixture I + 500 ppm NH3 at T1 = 1600 K.
0
200
400
600
800
1000
8 9 10 11 12 13 14
Log A
Co
nce
ntr
atio
n,
pp
m
TFN
NO
NH3
OH/H formation
0
50
100
150
200
250
8 9 10 11 12 13 14
Log A
Co
nce
ntr
atio
n,
pp
m
TFN
NO
NH3
[O2 ]i = 75 ppm and OH/H formation
0
200
400
600
800
1000
8 9 10 11 12 13 14
Log A
Co
nce
ntr
atio
n,
pp
m
TFN
NO
NH3
O2 formation
8-48
8.2.4 Effect of Different Factors on the NO-NH3 Interaction in the Reburn Zone
Effect of Oxygen. Performance of ammonia in the reburning zone greatly depends on the level of
oxygen. If the oxygen concentration is high, NH3 is partially converted to NO. If oxygen
concentration is low, active radicals are not formed in oxidation processes. Thus, a maximum
performance of NO/TFN removal should correspond to a certain optimum O2 concentration. When
sufficient O2 is available, CO and H2 react with O2 via chain branching reactions producing radicals,
which in turn participate in reactions with ammonia to form NH2 followed by the reaction of NH2and NO.
To determine the optimum O2 concentration, calculations were performed with injection of 500
ppm NH3 with various amounts of oxygen into mixture I, as shown in Figure 8.2.27. The optimum
O2 amounts, and the resulting TFN removal performance, increase as injection temperature decreases.
O2 promotion provides a means for promoting the NH3-NO interaction at lower temperatures in the
reburning zone, where it would normally not be effective due to low oxygen and radical
concentrations.
At lower temperatures, there is a certain threshold level of oxygen below which NO does not react
with NH3. This threshold depends on temperature, CO/H2 concentrations, and initial NO and NH3
concentrations. At [O2] above the optimum, the efficiency of NO removal decreases slowly. At
sufficiently high O2 concentrations the NO level will actually increase.
Effect of CO and H2. NO reduction efficiency is controlled by active radicals formed in CO and H2
interaction with oxygen. Therefore, concentrations of CO and H2 are important factors affecting
NO-NH3 interaction. The amounts of CO and H2 in the mixture depend on composition of the main
and reburning fuels and on the stoichiometric ratios, SR1 and SR2. For the current modeling study,
with natural gas as both the primary and reburning fuel, the dependence is only on SR2. Variations
in SR2 for 500 ppm NH3 injection into Mixture I at 1300-1500 K, accompanied by the optimum
level of O2, show that there is an optimum SR2 in the neighborhood of 0.99 to 1.0 (depending on
injection temperature) for TFN reduction. Both CO and H2 generate radicals in the oxidation process
and help to reduce NO. The relative importance of each compound depends on conditions:
temperature and concentrations of main components. For example, CO is more efficient than H2 in
reducing NO concentration at 1500 K, but H2 has higher efficiency at 1300 K. Thus, modeling
predicts that at the low temperature end of the reburning zone, NO/TFN removal is more efficient at
lower temperatures with an optimum CO/H2 level in the mixture as well as oxygen.

8-49
Figure 8.2.27. Effect of O2 co-injection with 500 ppm NH3 into mixture I at different injectiontemperatures.
0
200
400
600
800
1000
0 100 200 300 400 500 600 700 800 900 1000
[O2], ppm
Co
nce
ntr
atio
n,
pp
m
TFN
NH3
NO
1500 K
NO initial
0
200
400
600
800
1000
0 100 200 300 400 500 600 700 800 900 1000
[O2], ppm
Co
nce
ntr
atio
n,
pp
m
TFN
NH3
NO
1300 K
NO initial
0
100
200
300
400
500
600
0 50 100 150 200 250
[O2], ppm
Co
nce
ntr
atio
n,
pp
m
TFNNO
NH3
T = 1700 K

8-50
Effect of Initial NO. Modeling suggests that injection of ammonia and oxygen into the reburning
zone is less efficient at lower initial NO concentrations. This has been confirmed by modeling with
200 ppm NO and 200 ppm NH3 in the reburning zone at SR2 = 0.99 and T2 = 1300-1000 K.
Comparing performance with previous results at 500 ppm, a substantial decrease was noted in both
the NO removal efficiency (from 80% to 50%) and in the range of effective O2 concentrations. It
was also found that a decrease in the injection temperature is capable of widening the O2 window,
but the NO removal efficiency is about the same.
8.2.5 Injection of Ammonia into the Burnout Zone (AR-Lean)
Modeling suggests that injection of OFA at different values of SR2, SR3, and temperature results in
a final NO concentration which is near the TFN level in the mixture before OFA injection. Only at
relatively high values of SR2 (about 0.9) and at low OFA injection temperatures (about 1250 K), a
small decrease of final NO concentration was observed (about 15%) compared with the TFN
concentration upstream of OFA injection.
If ammonia is injected along with OFA in the reburning zone at SR2 = 0.99, the NO reduction
process is not effective at injection temperatures above 1100 K. Figure 8.2.28 (Curve 1) demonstrates
the effect of OFA injection at different locations with co-injection of ammonia at NSR2 = 1.0 on the
final NO concentration. The initial NO concentration (100%, i.e. 350-500 ppm depending on the
residence time in the reburning zone) increases when OFA is injected at 1120 K or higher. At these
temperatures, some ammonia reacts with NO, but some is converted to NO, resulting in a final NO
concentration (NOf) higher than the initial NO concentration at the point of OFA injection. The
concentration of NH3 decreases to less than 1 ppm after the OFA/NH3 injection. In the temperature
range of 950-1050 K, the NO concentration is decreased, but this range is too low for OFA injection
since all CO from the reburning zone remains unreacted.
Curve 1 represents the conditions of NO removal via the Thermal DeNOx process in the presence
of high concentrations of CO and H2. It is well known (for instance, Lyon and Hardy, 1986) that the
presence of CO and/or H2 shifts the temperature window of NO removal by the SNCR process to
lower temperatures. In order to avoid that shift, ammonia can be injected into flue gas with a short
delay after injection of the OFA or in the aqueous form to allow some time for evaporation of the
water. In this case, the OFA rapidly reacts with CO and H2, and the NH3 appears in the gas mixture
when all CO and H2 are already oxidized. Modeling shows that a delay time of about 0.1 s is
enough for complete CO and H2 removal. The results of calculations are shown in Figure 8.2.28,

8-51
Figure 8.2.28. Effect OFA co-injection with NH3 on the final NO concentration. NSR = 1.0.
Curve 2 which represents the effect of NH3 injection temperature (NH3 is injected with a 0.1 s
delay time after the OFA) on NO concentrations. Under these conditions, the ammonia reacts with
NO in the presence of oxygen and in the absence of CO and H2, and the optimum temperature for
NH3 injection is about 1200 K, which is typical for the Thermal DeNOx process.
If the reburning fuel is injected with SR2 = 0.90 at T1 = 1700 K, modeling shows that the concentration
of ammonia in the reburning zone is higher than the NO concentration. For example, at T3 = 1400
K, concentrations of fuel-N species are: 71 ppm HCN, 50 ppm NO, and 113 ppm NH3. Injection of
OFA converts all fuel-N species to NO. Therefore, co-injection of gaseous ammonia with OFA
does not make sense for these conditions either. Variation of the O2 concentration in OFA does not
change the final NO level.
8.2.6 Modeling with Instantaneous Mixing Times: Summary
The performance of individual AR processes has been considered using a time-dependent chemistry
calculation, putting aside the influence of finite-rate mixing effects. Some of the most important
points are summarized here.
0
20
40
60
80
100
120
140
160
850 950 1050 1150 1250 1350
Temperature of OFA/NH3 or NH3 injection, K
NO
re
ma
inin
g,
%
1 - Injection of OFA with NH3
2 - Delayed injection of NH3
Initial NO level
8-52
Reburning zone chemistry has been examined over the range of stoichiometric ratios from 0.90 to
0.99. It has been shown that there is a short, fast initial reduction in NO followed by slower reduction
over the remainder of the reburning zone. This effect is linked to the disappearance of oxygen and
radicals, and highlights an opportunity for introduction of species which can reestablish optimum
concentrations for NO removal.
Injection of N-agents is effective at reducing NO when temperatures and concentrations of oxygen
and other radicals are conducive. Conditions are more favorable at reburn SRs close to stoichiometric.
Mixing of the N-agent with flue gas must occur in a window downstream of reburn fuel injection to
encounter the correct environment for effective NO reduction. This delay may be achieved by
locating injectors downstream of fuel injectors, or by use of aqueous N-agent solutions with associated
evaporation delays.
Introduction of promoter species along with the N-agent may enhance its performance by making
the reactant mixture more favorable to NO reduction by NH3 and associated species. Injection of
ammonia with small amounts of oxygen upstream of the OFA improves NO reduction. The efficiency
of NO removal depends mainly on SR2 and concentrations of oxygen, CO/H2, and NO. The optimal
oxygen concentration depends on the injection temperature. The efficiency is lower at lower NO
initial concentrations. Radical species also exhibit a promotion effect, calling for the injection of
species which provide them in the proper amounts and at the proper rates.
Injection of OFA into the fuel-rich reburning zone converts all fuel-nitrogen species into NO as
long as the temperature of OFA injection is adequately high.
Co-injection of ammonia with the OFA significantly shifts the temperature window of the Thermal
DeNOx process to lower temperatures because of the CO and H2 present. To avoid this shift, ammonia
should be injected after a short delay time relatively to the OFA location. This delay can be provided
by evaporation of aqueous ammonia or urea co-injected with OFA.
8.3 Evaluation of Mixing Effects
8.3.1 Approach
The modeling discussed above treated the AR process as a one-dimensional plug flow reactor with
instantanous mixing at each injection point. This approach simplifies the analysis by focusing on
chemistry, but puts aside the effect of finite rate mixing. The results demonstrated qualitative trends
8-53
but did not quantitatively reproduce experimental data. Indeed, quantitative predictions are
challenging even in the most sophisticated (and computationally demanding) three dimensional
model coupling chemistry and fluid dynamic effects, as ongoing research continues to develop
understanding of chemical reaction mechanisms and turbulent mixing. However, the basic one
dimensional model which has already proven useful may be incrementally improved by incorporating
a simplified treatment of finite-rate mixing of an injected stream into the main flow.
The tool chosen for this study is a one dimensional chemical kinetics code developed at EER. This
program is known as “ODF,” for “One Dimensional Flame,” although the code is applicable to any
gas phase system. ODF contains the same basic capabilities as Chemkin, including the evaluation
of pressure-dependent and reversible Arrhenius rate expressions, and the specification of time-
dependent profiles of temperature and pressure. Most importantly for the current study, the solution
algorithm has been formulated to allow for the introduction of an arbitrary profile of mass injection
along the length of the reactor.
ODF has been applied to basic and advanced reburning scenarios. The reburning system is treated
as a plug flow reactor, beginning with the introduction of reburning fuel into primary combustion
products at 1700 K. The reacting flow is cooled at a uniform rate of -300 K/s. Overfire air and (for
AR) gaseous ammonia are introduced at different locations along this temperature ramp, and the
reactions continue until the system reaches a temperature of about 600 K, at which point the reaction
rates may be considered negligible.
The primary mixture is at a stoichiometric ratio of about 1.1, with initial (wet) concentrations of
600 ppm NO, 1.74% O2, 8% CO2, 15% H2O, after mixing with methane which is the reburn fuel.
The two reburning stoichiometries are nominally 0.90 (1.94% CH4), and 0.99 (0.967% CH4). The
OFA is added for a final stoichiometry of 1.15. Unless otherwise noted, OFA injection is at 1300 K,
based on previous modeling suggesting that this is a good temperature for effective NO reduction
as well as burnout of other fixed nitrogen species and incomplete combustion products. Some cases
were also run with OFA introduced at 1200 K or 1400 K for comparison.
In each AR case presented here, the ammonia addition was adjusted to NSR=1.0, matching the
concentration of added NH3 to the concentration of NO at the start of N-agent injection. Because
NO varied with injection location, the quantity of added ammonia varied. Additional calculations
with a uniform quantities of ammonia, with NSRs greater than equal to 1.0, is discussed in Zamansky
et al. (1997a and 1997b).
8-54
To evaluate the effect of mixing time, three mixing scenarios were applied to each basic or advanced
reburning condition modeled: instantaneous mixing, 30 ms mixing, and 300 ms mixing. The same
mixing time was applied to all external streams (reburn fuel, N-agent, and OFA), and mixing over
30 or 300 ms was applied at a uniform rate of mass addition. The instantaneous mixing case is the
limiting case corresponding to the approach in earlier Chemkin modeling. 30 ms mixing may be
considered fast, corresponding to bench and small pilot scale systems such as EER’s combustion
facilities CTT and BSF. 300 ms mixing is more typical of large pilot-scale systems such as EER’s
Tower Furnace (10 MMBTU/hr) and full-scale industrial combustion systems.
8.3.2 Effect of Mixing Times on Basic Reburning
The kinetic behavior of the model during and after reburning fuel addition was examined closely to
determine the effects of finite mixing time on kinetic behavior in the reburning zone. Figures 8.3.1
through 8.3.4 show the concentrations of important species as a function of time from the start of
the reburning fuel injection, for nominal reburning stoichiometries of 0.99 and 0.90, and for the
finite rate mixing scenarios (30 ms, and 300 ms mixing). In addition to the individual species
concentrations, there is also a curve for TFN (total fixed nitrogen), which in these four figures
includes not only NO, NH3, and HCN, but all sources of N-atom except N2.
The case with instantaneous mixing was also run, and results correspond to those already presented
in Figures 8.2.1 (for SR2=0.99) and 8.2.3 (for SR2=0.90). Comparison with the figures generated
by Chemkin shows that the same trends are predicted. This serves to validate the ODF model setup
against the equivalent modeling previously done in Chemkin. However, note that Figures 8.2.1 and
8.2.3 cover a different range of time and concentration than the other plots presented here.
As mixing time is increased to 30 ms (Figure 8.3.1) and to 300 ms (Figure 8.3.2) for a nominal
reburn stoichiometry of 0.99, the behavior in the mixing zone is modified by the slower rate of fuel
addition and the accompanying slower rate of stoichiometry change. At 30 ms, distributed mixing
of the reburn fuel results in a spike in CH4 concentration along with other species, which persists on
about the same time scale as the mass addition interval. Also present but less obvious are increases
in the concentrations of other species including O2, OH, and H for a couple of hundred milliseconds
following the end of reburn fuel injection. These species are then more available for the reactions
involved in reburning and so NO reduction is more effective as mixing time is increased. In Figure
8.3.2, the 0.3 injection interval is now more obvious and reflects a more dramatic impact on all
species concentrations. Several species, including O2, HCN and NH3 persist in higher quantities
throughout the reburning zone. The net effect is a decrease in NO.
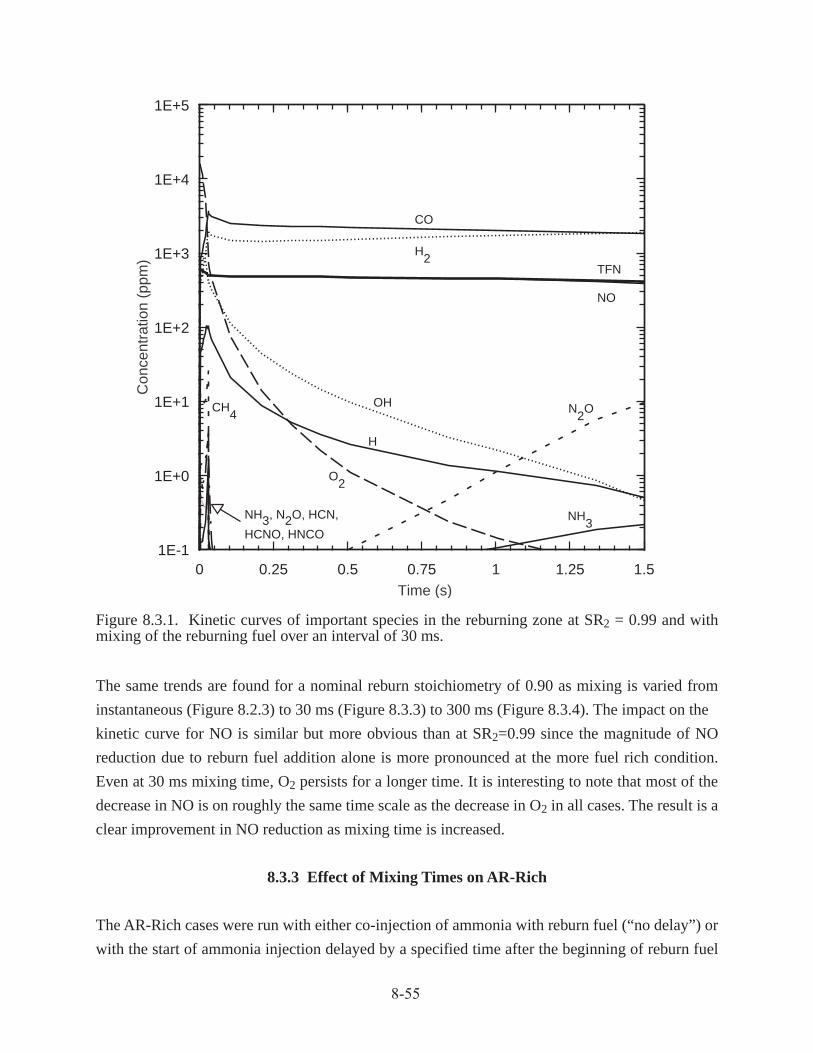
8-55
1E-1
1E+0
1E+1
1E+2
1E+3
1E+4
1E+5
0 0.25 0.5 0.75 1 1.25 1.5
Con
cent
ratio
n (p
pm)
Time (s)
O2
H
OHCH4
NO
H2
CO
NH3
TFN
N2
O
NH3, N2O, HCN,
HCNO, HNCO
Figure 8.3.1. Kinetic curves of important species in the reburning zone at SR2 = 0.99 and withmixing of the reburning fuel over an interval of 30 ms.
The same trends are found for a nominal reburn stoichiometry of 0.90 as mixing is varied from
instantaneous (Figure 8.2.3) to 30 ms (Figure 8.3.3) to 300 ms (Figure 8.3.4). The impact on the
kinetic curve for NO is similar but more obvious than at SR2=0.99 since the magnitude of NO
reduction due to reburn fuel addition alone is more pronounced at the more fuel rich condition.
Even at 30 ms mixing time, O2 persists for a longer time. It is interesting to note that most of the
decrease in NO is on roughly the same time scale as the decrease in O2 in all cases. The result is a
clear improvement in NO reduction as mixing time is increased.
8.3.3 Effect of Mixing Times on AR-Rich
The AR-Rich cases were run with either co-injection of ammonia with reburn fuel (“no delay”) or
with the start of ammonia injection delayed by a specified time after the beginning of reburn fuel
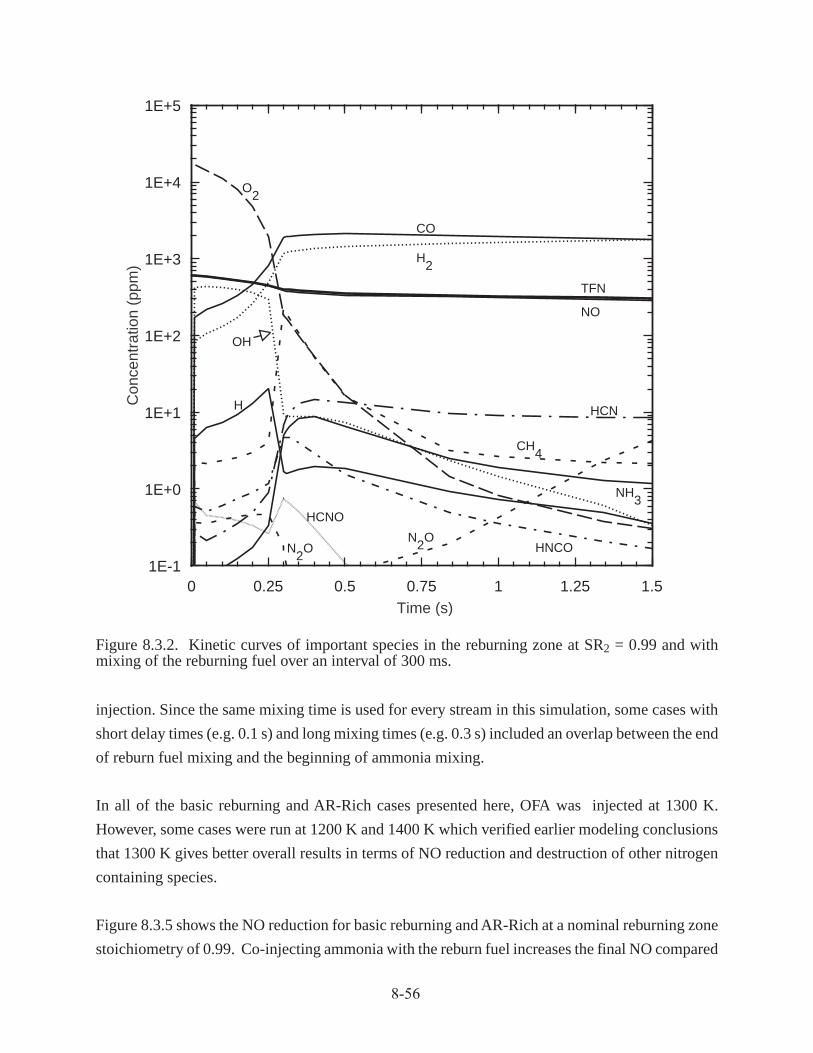
8-56
1E-1
1E+0
1E+1
1E+2
1E+3
1E+4
1E+5
0 0.25 0.5 0.75 1 1.25 1.5
Con
cent
ratio
n (p
pm)
Time (s)
O2
H
OH
CH4
H2
CO
NH3
N2
O
HCN
N2
O
HCNO
HNCO
NO
TFN
Figure 8.3.2. Kinetic curves of important species in the reburning zone at SR2 = 0.99 and withmixing of the reburning fuel over an interval of 300 ms.
injection. Since the same mixing time is used for every stream in this simulation, some cases with
short delay times (e.g. 0.1 s) and long mixing times (e.g. 0.3 s) included an overlap between the end
of reburn fuel mixing and the beginning of ammonia mixing.
In all of the basic reburning and AR-Rich cases presented here, OFA was injected at 1300 K.
However, some cases were run at 1200 K and 1400 K which verified earlier modeling conclusions
that 1300 K gives better overall results in terms of NO reduction and destruction of other nitrogen
containing species.
Figure 8.3.5 shows the NO reduction for basic reburning and AR-Rich at a nominal reburning zone
stoichiometry of 0.99. Co-injecting ammonia with the reburn fuel increases the final NO compared

8-57
1E-1
1E+0
1E+1
1E+2
1E+3
1E+4
1E+5
0 0.25 0.5 0.75 1 1.25 1.5
Con
cent
ratio
n (p
pm)
Time (s)
O2
H
OH
CH4
NO
H2
CO
NH3
TFN
N2
O
HCNO
HCN
HNCO
Figure 8.3.3. Kinetic curves of important species in the reburning zone at SR2 = 0.99 and withmixing of the reburning fuel over an interval of 30 ms.
to basic reburning, but a delay of 0.1 s causes the final NO to decrease substantially. An additional
condition with a longer delay time (0.833 s) returns to the higher final NO concentrations. These
results show that there is clearly an optimum delay time for ammonia injection, in the neighborhood
of 0.1 s. This optimum delay time effect is shown in Figure 8.2.16; note that the results there are
before burnout, for which TFN is the best indicator of postburnout NO. At 0.1 s delay time, shorter
mixing times actually yield slightly better results than longer mixing times, but the difference is
small. These results also make it clear that there is a distinction between delay of the start of injection
and the duration of mixing, underscoring the importance of both parameters in this system.
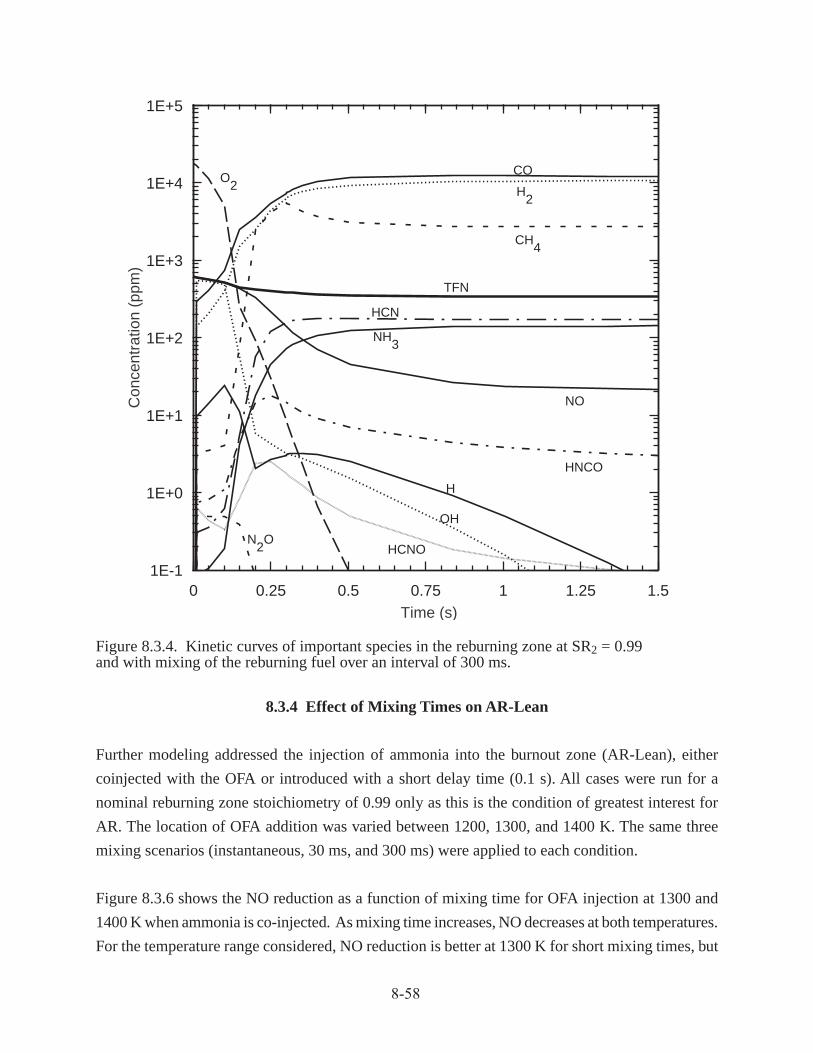
8-58
1E-1
1E+0
1E+1
1E+2
1E+3
1E+4
1E+5
0 0.25 0.5 0.75 1 1.25 1.5
Con
cent
ratio
n (p
pm)
Time (s)
O2
H
OH
CH4
NO
H2
CO
NH3
TFN
N2
OHCNO
HCN
HNCO
Figure 8.3.4. Kinetic curves of important species in the reburning zone at SR2 = 0.99and with mixing of the reburning fuel over an interval of 300 ms.
8.3.4 Effect of Mixing Times on AR-Lean
Further modeling addressed the injection of ammonia into the burnout zone (AR-Lean), either
coinjected with the OFA or introduced with a short delay time (0.1 s). All cases were run for a
nominal reburning zone stoichiometry of 0.99 only as this is the condition of greatest interest for
AR. The location of OFA addition was varied between 1200, 1300, and 1400 K. The same three
mixing scenarios (instantaneous, 30 ms, and 300 ms) were applied to each condition.
Figure 8.3.6 shows the NO reduction as a function of mixing time for OFA injection at 1300 and
1400 K when ammonia is co-injected. As mixing time increases, NO decreases at both temperatures.
For the temperature range considered, NO reduction is better at 1300 K for short mixing times, but
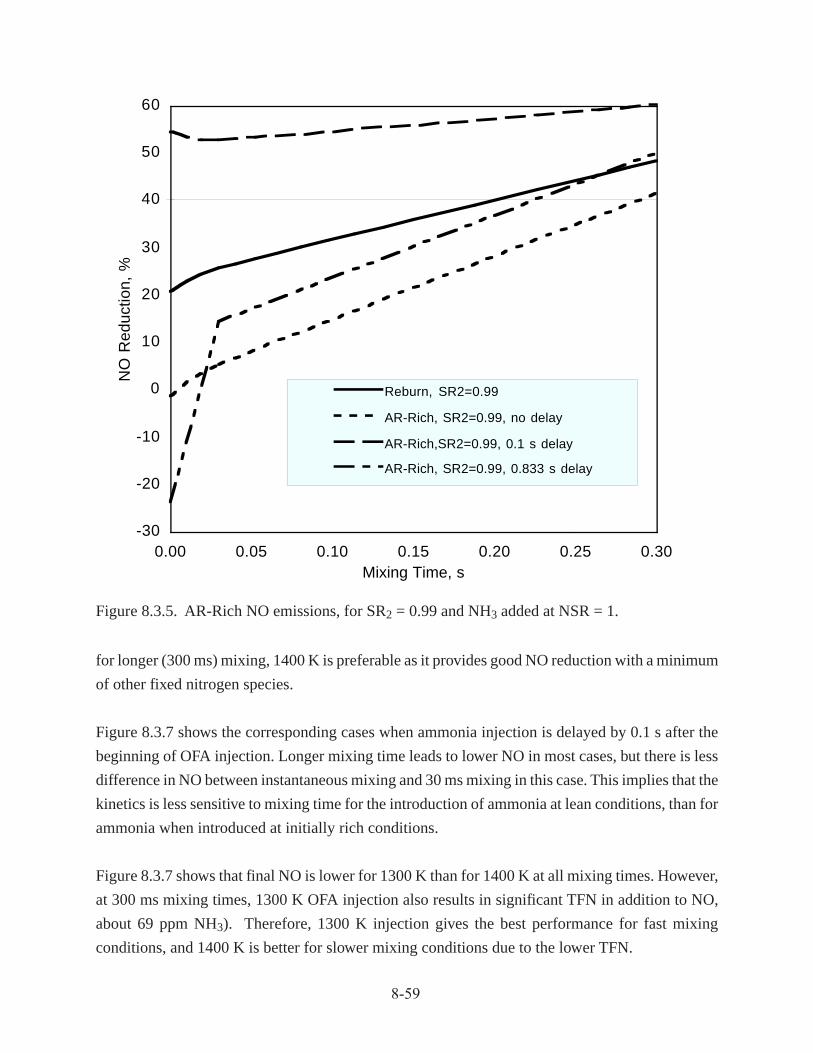
8-59
for longer (300 ms) mixing, 1400 K is preferable as it provides good NO reduction with a minimum
of other fixed nitrogen species.
Figure 8.3.7 shows the corresponding cases when ammonia injection is delayed by 0.1 s after the
beginning of OFA injection. Longer mixing time leads to lower NO in most cases, but there is less
difference in NO between instantaneous mixing and 30 ms mixing in this case. This implies that the
kinetics is less sensitive to mixing time for the introduction of ammonia at lean conditions, than for
ammonia when introduced at initially rich conditions.
Figure 8.3.7 shows that final NO is lower for 1300 K than for 1400 K at all mixing times. However,
at 300 ms mixing times, 1300 K OFA injection also results in significant TFN in addition to NO,
about 69 ppm NH3). Therefore, 1300 K injection gives the best performance for fast mixing
conditions, and 1400 K is better for slower mixing conditions due to the lower TFN.
Figure 8.3.5. AR-Rich NO emissions, for SR2 = 0.99 and NH3 added at NSR = 1.
-30
-20
-10
0
10
20
30
40
50
60
0.00 0.05 0.10 0.15 0.20 0.25 0.30Mixing Time, s
NO
Red
uctio
n, %
Reburn, SR2=0.99
AR-Rich, SR2=0.99, no delay
AR-Rich,SR2=0.99, 0.1 s delay
AR-Rich, SR2=0.99, 0.833 s delay
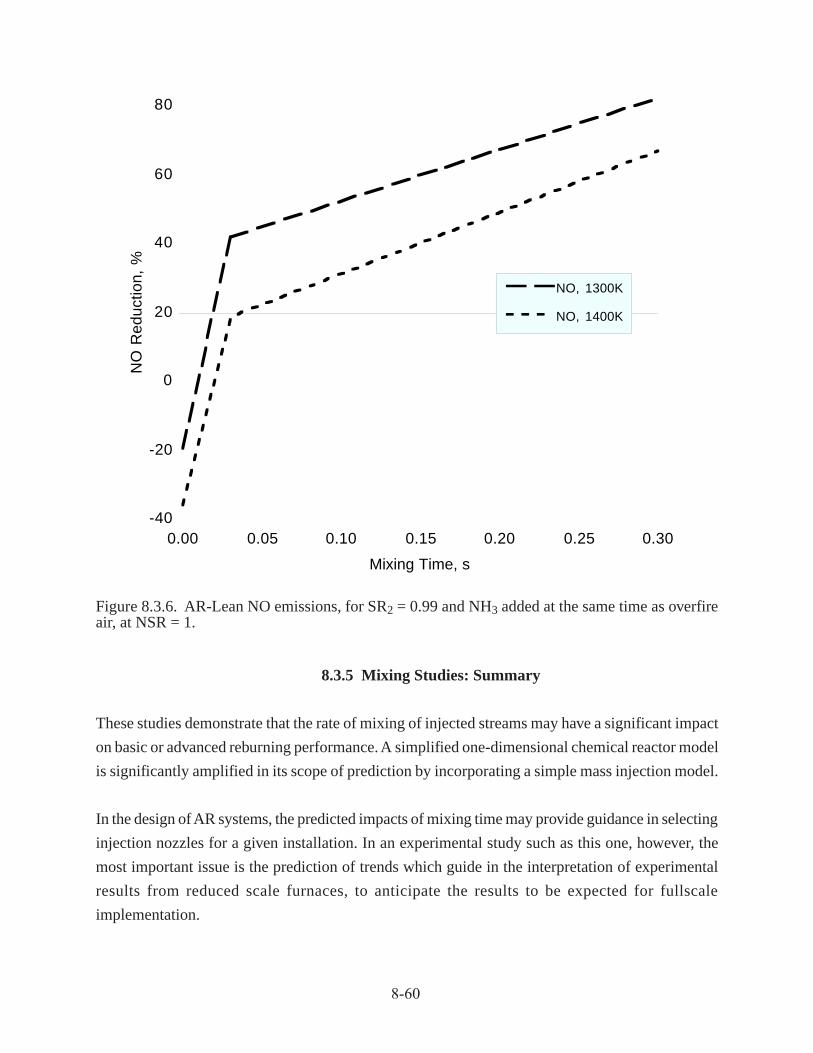
8-60
8.3.5 Mixing Studies: Summary
These studies demonstrate that the rate of mixing of injected streams may have a significant impact
on basic or advanced reburning performance. A simplified one-dimensional chemical reactor model
is significantly amplified in its scope of prediction by incorporating a simple mass injection model.
In the design of AR systems, the predicted impacts of mixing time may provide guidance in selecting
injection nozzles for a given installation. In an experimental study such as this one, however, the
most important issue is the prediction of trends which guide in the interpretation of experimental
results from reduced scale furnaces, to anticipate the results to be expected for fullscale
implementation.
Figure 8.3.6. AR-Lean NO emissions, for SR2 = 0.99 and NH3 added at the same time as overfireair, at NSR = 1.
-40
-20
0
20
40
60
80
0.00 0.05 0.10 0.15 0.20 0.25 0.30
Mixing Time, s
NO
Red
uctio
n, %
NO, 1300K
NO, 1400K

8-61
For the basic and advanced reburning conditions considered here, four major parameters were
varied: the reburn zone stoichiometry, the OFA injection temperature, the location of ammonia
injection, and the mixing time. In general, good results were obtained with longer mixing times and
with about 0.1 s delay in ammonia injection for both AR-Rich and AR-Lean systems. Very long
delays in ammonia injection led to poor performance.
8.4 Effect of Sodium
Of immediate interest is gas-fired AR with sodium promotion. As discussed in Section 8.1.3, the
kinetic mechanism has been extended to include reactions of sodium so that this process may be
examined.
Figure 8.3.7. AR-Lean NO emissions, for SR2 = 0.99 and NH3 added 0.1 s after burnout air atNSR = 1.
0
10
20
30
40
50
60
70
80
90
100
0.00 0.05 0.10 0.15 0.20 0.25 0.30
Mixing Time, s
NO
Red
uctio
n, %
NO, 1300K
NO, 1400K
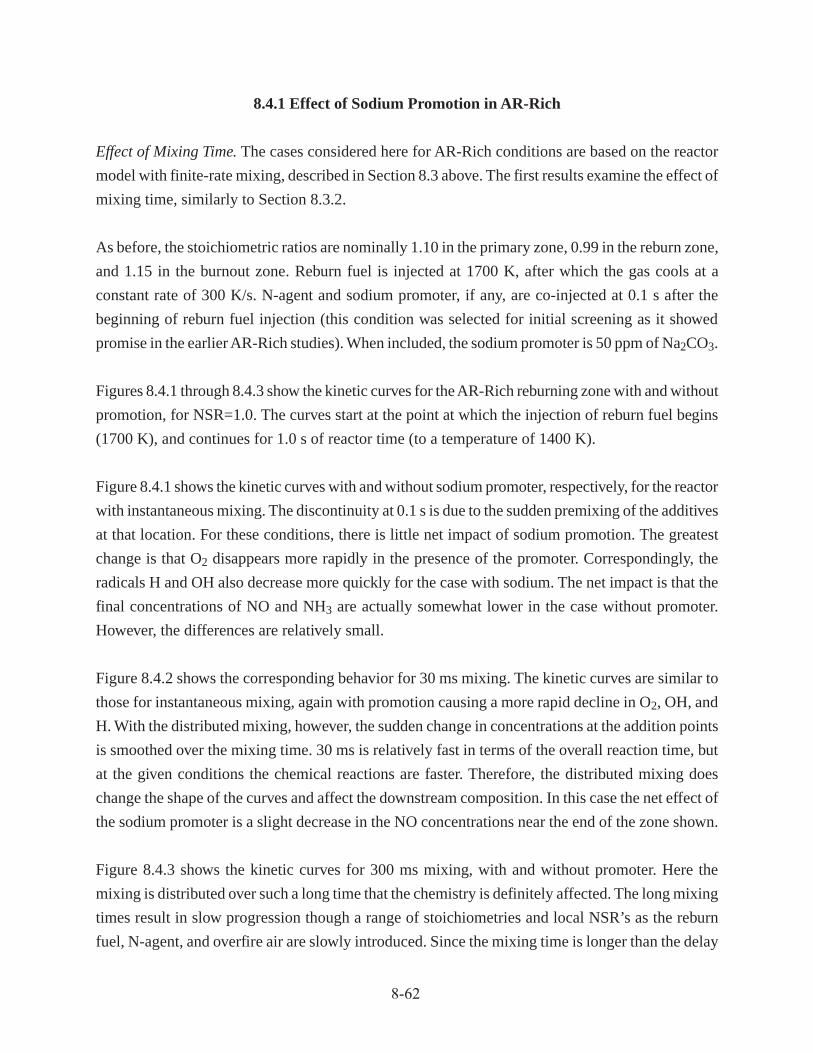
8-62
8.4.1 Effect of Sodium Promotion in AR-Rich
Effect of Mixing Time. The cases considered here for AR-Rich conditions are based on the reactor
model with finite-rate mixing, described in Section 8.3 above. The first results examine the effect of
mixing time, similarly to Section 8.3.2.
As before, the stoichiometric ratios are nominally 1.10 in the primary zone, 0.99 in the reburn zone,
and 1.15 in the burnout zone. Reburn fuel is injected at 1700 K, after which the gas cools at a
constant rate of 300 K/s. N-agent and sodium promoter, if any, are co-injected at 0.1 s after the
beginning of reburn fuel injection (this condition was selected for initial screening as it showed
promise in the earlier AR-Rich studies). When included, the sodium promoter is 50 ppm of Na2CO3.
Figures 8.4.1 through 8.4.3 show the kinetic curves for the AR-Rich reburning zone with and without
promotion, for NSR=1.0. The curves start at the point at which the injection of reburn fuel begins
(1700 K), and continues for 1.0 s of reactor time (to a temperature of 1400 K).
Figure 8.4.1 shows the kinetic curves with and without sodium promoter, respectively, for the reactor
with instantaneous mixing. The discontinuity at 0.1 s is due to the sudden premixing of the additives
at that location. For these conditions, there is little net impact of sodium promotion. The greatest
change is that O2 disappears more rapidly in the presence of the promoter. Correspondingly, the
radicals H and OH also decrease more quickly for the case with sodium. The net impact is that the
final concentrations of NO and NH3 are actually somewhat lower in the case without promoter.
However, the differences are relatively small.
Figure 8.4.2 shows the corresponding behavior for 30 ms mixing. The kinetic curves are similar to
those for instantaneous mixing, again with promotion causing a more rapid decline in O2, OH, and
H. With the distributed mixing, however, the sudden change in concentrations at the addition points
is smoothed over the mixing time. 30 ms is relatively fast in terms of the overall reaction time, but
at the given conditions the chemical reactions are faster. Therefore, the distributed mixing does
change the shape of the curves and affect the downstream composition. In this case the net effect of
the sodium promoter is a slight decrease in the NO concentrations near the end of the zone shown.
Figure 8.4.3 shows the kinetic curves for 300 ms mixing, with and without promoter. Here the
mixing is distributed over such a long time that the chemistry is definitely affected. The long mixing
times result in slow progression though a range of stoichiometries and local NSR’s as the reburn
fuel, N-agent, and overfire air are slowly introduced. Since the mixing time is longer than the delay
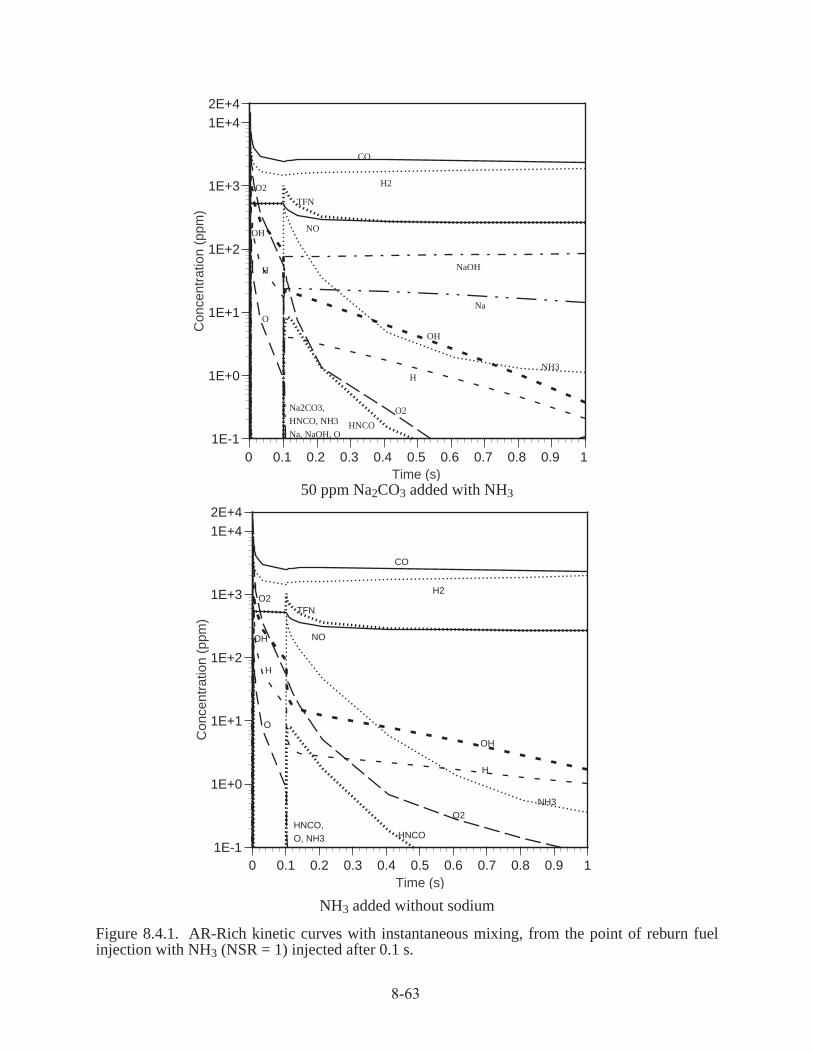
8-63
Figure 8.4.1. AR-Rich kinetic curves with instantaneous mixing, from the point of reburn fuelinjection with NH3 (NSR = 1) injected after 0.1 s.
50 ppm Na2CO3 added with NH3
NH3 added without sodium
1E-1
1E+0
1E+1
1E+2
1E+3
1E+42E+4
0 0.1 0.2 0.3 0.4 0.5 0.6 0.7 0.8 0.9 1
Con
cent
ratio
n (p
pm)
Time (s)
TFN
Na
NaOH
HNCO
NO
NH3
CO
OH
O2
O
H
H2
OH
H
O2
Na2CO3,
HNCO, NH3
Na, NaOH, O
1E-1
1E+0
1E+1
1E+2
1E+3
1E+42E+4
0 0.1 0.2 0.3 0.4 0.5 0.6 0.7 0.8 0.9 1
Con
cent
ratio
n (p
pm)
Time (s)
CO
O2
H
OH
NH3
NO
TFN
H2
H
O
HNCO
O2
OH
HNCO,O, NH3

8-64
Figure 8.4.2. AR-Rich kinetic curves with 30 ms mixing, from the point of reburn fuel injectionwith NH3 (NSR = 1) injected after 0.1 s.
50 ppm Na2CO3 added with NH3
NH3 added without sodium
1E-1
1E+0
1E+1
1E+2
1E+3
1E+42E+4
0 0.1 0.2 0.3 0.4 0.5 0.6 0.7 0.8 0.9 1
Con
cent
ratio
n (p
pm)
Time (s)
CO
H
OH
Na
NaOH
NH3
NO
TFN
H2
Na2CO3O2
HNCO
O2
OH
O2
H
O
1E-1
1E+0
1E+1
1E+2
1E+3
1E+42E+4
0 0.1 0.2 0.3 0.4 0.5 0.6 0.7 0.8 0.9 1
Con
cent
ratio
n (p
pm)
Time (s)
CO
HNCO N2O
O2
NH3
HOH
NO
TFN
H2
N2O
O2
H
O
OH
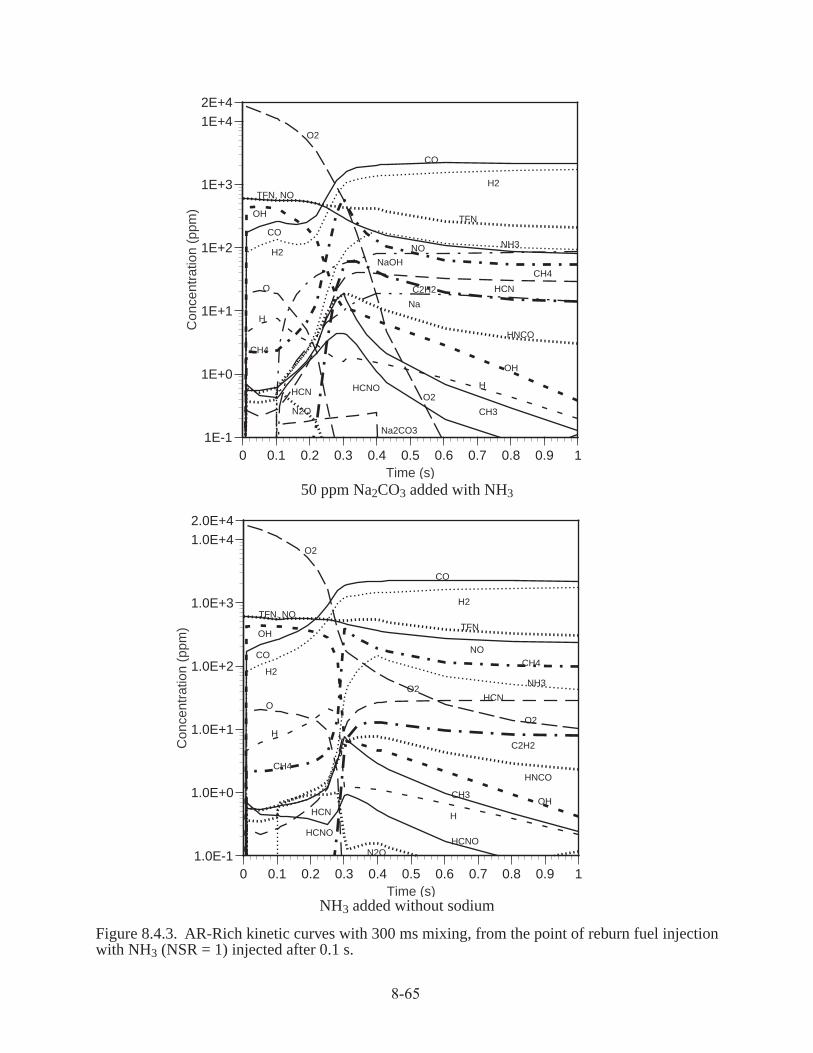
8-65
Figure 8.4.3. AR-Rich kinetic curves with 300 ms mixing, from the point of reburn fuel injectionwith NH3 (NSR = 1) injected after 0.1 s.
50 ppm Na2CO3 added with NH3
NH3 added without sodium
1E-1
1E+0
1E+1
1E+2
1E+3
1E+42E+4
0 0.1 0.2 0.3 0.4 0.5 0.6 0.7 0.8 0.9 1
Con
cent
ratio
n (p
pm)
Time (s)
CO
H
OH
HNCO
Na
C2H2 HCN
NaOHCH4
NH3NO
TFN
H2
HCNOO2
CH3
Na2CO3
O2
TFN, NO
OH
CO
H2
O
H
CH4
HCN
N2O
1.0E-1
1.0E+0
1.0E+1
1.0E+2
1.0E+3
1.0E+42.0E+4
0 0.1 0.2 0.3 0.4 0.5 0.6 0.7 0.8 0.9 1
Con
cent
ratio
n (p
pm)
Time (s)
CO
H
CH3OH
HNCO
C2H2
O2
HCN
NH3
CH4NO
TFN
H2
HCNON2O
O2
O2
TFN, NO
OH
CO
H2
O
H
CH4
HCNO
HCN

8-66
between reburn fuel and N-agent addition, these two mixing zones actually overlap. At 0.3 s, the
supply of reburn fuel is out and the pool of radicals and unburned fuel that it helps to sustain now
begins to disappear, changing the direction of the kinetic curves at that point. With sodium promotion,
even this transition is spread out, suggesting that in this case the sodium promoter helps to sustain
the radical pool and has a definite beneficial effect on NO and TFN emissions.
The net impact of promotion is illustrated in Figure 8.4.4, which shows the concentration of NO
and TFN in the reburn zone at 1300 K (1.33 s after the start of reburn fuel injection), with and
without sodium promotion. At instantaneous mixing, the promoter has a very slight negative effect
on emissions. However, for mixing times as short as 30 ms, promotion begins to show a beneficial
effect. For longer mixing times representative of industrial installations, the effect is quite pronounced.
Longer mixing times also show very large TFN concentrations aside from NO, but it should be
remembered that this is before burnout.
As discussed before, the quantity of N-agent can have a significant impact on system performance.
To illustrate this, Figure 8.4.5 shows the results of AR-Rich calculations with the same conditions
as for Figure 8.4.4, except that the injected N-agent is 800 ppm in all cases. This guarantees an NSR
greater than 1 since the initial NO is 600 ppm. The actual NSR is approximately 1.5 based on NO
at the point of injection. As would be expected, the NO concentration decreases as more N-agent is
added, but note that the effect is non-linear. For instant mixing, the adverse effect of the sodium
promoter within the reburning zone increases, but systems with finite mixing times still perform
better with sodium promotion. The differences in the effect of promotion at different mixing times
reflect the difference in kinetic behavior with mixing time, as illustrated in Figures 8.4.1 through
8.4.3. These changes in characteristic behavior are due to the effect of distributing mass addition,
and at long mixing times the shift in temperature due to gas cooling also has an impact. Figures
8.4.4 and 8.4.5 demonstrate the potential improvement in NO and TFN reduction due to the inclusion
of a promoter at finite mixing times characteristic of real combustion systems.
Effect of Delay Time.To better understand the temperature dependence of promoted AR-Rich,
variations were run varying the delay time with a fixed mixing time of 30 ms and NSR=1.0. Cases
were run with NH3 only, with NH3+50 ppm Na2CO3, with 50 ppm Na2CO3 only, and with no
additives (basic reburning). The delay time was varied from 0 s (co-injection with the reburning
fuel) to 1 s.

8-67
0
10
20
30
40
50
60
0.00 0.05 0.10 0.15 0.20 0.25 0.30Mixing Time, s
XN
/ N
Oi,
%
NO without promoterTFN without promoterNO with promoterTFN with promoter
Figure 8.4.4. NO and total fuel nitrogen before burnout for AR-Rich vs. mixing time. NH3 addedat NSR = 1.0 with and without 50 ppm Na2CO3 promoter.
Figure 8.4.5. NO and total fuel nitrogen before burnout for AR-Rich vs. mixing time. 800 ppmNH3 added (NSR approximtely 1.5), with and without 50 ppm Na2CO3 promoter.
0
10
20
30
40
50
60
0.00 0.05 0.10 0.15 0.20 0.25 0.30Mixing Time, s
XN
/ N
Oi,
%
NO without promoterTFN without promoterNO with promoterTFN with promoter

8-68
Figure 8.4.6 and 8.4.7 respectively show the NO and TFN concentration just before the addition of
OFA at 1300 K. TFN includes all nitrogen-containing species except N2, weighted by the number
of N-atoms. From these curves there is an obvious difference due to the addition of promoter along
with NH3, considerably broadening the interval over which high levels of NOx reduction are achieved.
Figure 8.4.8 shows the final concentration of NO after OFA addition and completion of burnout, at
600 K. There is very little TFN other than NO at this point, so a TFN plot would appear the same.
Comparing with Figure 8.4.6, it is seen that NO has improved for the case with N-agent and promoter
added, particularly at late delay times. However, there is relatively less improvement due to burnout
for the case in which N-agent is added without promoter.
Figure 8.4.8 indicates a very broad optimum for delayed addition of NH3+Na2CO3. The optimum
delay time for NO reduction is at about 0.4 s. However, the maximum effect of Na addition (that is,
the greatest difference between Reburn+NH3 and Reburn+NH3+Na2CO3 results) is at somewhat
higher delay times. To better understand the role of sodium promotion at a condition where the
effect is maximized, the cases with delay times of 0.5 s were selected for further analysis. The
kinetic curves for 0.5 s delay, with and without Na promoter, are shown in Figure 8.4.9.
Results at 0.5 s delay (shown in Figure 8.4.8), compared with those at 0.1 s delay (shown in Figure
8.4.2) provide a picture of the effect of sodium under conditions where it has a significant impact
(at 0.5 s) versus conditions where the impact is minor (0.1 s), consistent with results in Figures
8.4.6 through 8.4.8. At 0.5 s, Figure 8.4.8 shows that the NH3 concentration stays high in the AR-
Rich zone, compared with it’s fairly rapid decline at 0.1s. This may be attributed to the reduced
temperature at which the NH3 is added. Without promoter present, the radical populations at 0.5 s
are also very low, and so NH3 and NO coexist without reacting. The addition of promoter at these
conditions increases the radical population, allowing NH3 to react with NO while the radicals persist
in adequate concentrations.
Table 8.4.1 provides a summary of the parameters and results of the promoted and unpromoted AR-
Rich cases at 0.1 s and 0.5 s delay time. These conditions have been labeled as Cases 1 through 4,
and are analyzed for further insight into the chemical basis for the differences between them. Table
8.4.1, in conjunction with Figures 8.4.2 and 8.4.9 with the corresponding kinetic curves, shows an
important correlation between TFN species (NO and NH3) and radicals (OH an H). All cases have
similar NO concentrations just prior to N-agent injection.

8-69
Figure 8.4.6. NO concentration prior to start of overfire air injection at 1300 K, as a function of N-agent/promoter injection delay time.
Figure 8.4.7. TFN concentration prior to start of overfire air injection at 1300 K, as a function of N-agent/promoter injection delay time.
0
100
200
300
400
500
600
0 0.2 0.4 0.6 0.8 1
NO
Bef
ore
Bur
nout
, ppm
Agent Injection Delay, s
Reburn + NH3+ Na2CO3
Reburn
+ NH3
Reburn + Na2CO3
Reburn only
0
100
200
300
400
500
600
700
800
900
1000
0 0.2 0.4 0.6 0.8 1
TF
N B
efor
e B
urno
ut, p
pm
Agent Injection Delay, s
Reburn +
Na2CO3
Reburn
+ NH3
Reburn only
Reburn + NH3+ Na2CO3

8-70
Figure 8.4.8. Final NO concentration at 600 K, as a function of N-agent/promoter injection delaytime.
0
100
200
300
400
500
600
0 0.2 0.4 0.6 0.8 1
Exi
t NO
, ppm
Agent Injection Delay, s
Reburn +
Na2CO3
Reburn
+ NH3
Reburn only
Reburn + NH3+ Na2CO3
Cases 1 and 2 represent a delay of 0.1 s between the injection of reburn fuel and N-agent, with and
without sodium added to the NH3. For these cases, the OH and H concentrations are relatively high
before injection, and are still several ppm at 0.1 s after N-agent injection, but have dropped an order
of magnitude from the pre-injection values and are rapidly declining. NH3, which is added in the
same amount as NO at the point of injection (so that NSR=1.0), is also rapidly declining. As a
result, these species are only available to react with NO over a limited time, and by 0.1 s after the
start of injection most of the ultimate NO reduction is achieved. The remaining rich zone residence
time is not as effectively utilized because the necessary reactants are not available in the proper
quantities.
The presence of sodium (Case 1) appears to enhance this trend somewhat, compared to the same
conditions without sodium (Case 2). After 0.1 s, somewhat higher concentrations of OH, H and
NH3 are present for Case 1 than at the same point in Case 2, and NO reduction is more effective in
this interval. As shown in Figure 8.4.2, in the remainder of the rich zone OH and H decline more
rapidly and NH3 less rapidly with sodium than without. However, sodium is unable to provide any

8-71
beneficial effect without a sufficient amount of NH3. The resulting NO reduction in the last part of
the reburning zone (after 0.1 s) is less with sodium than without. The net effect of sodium promotion
in this case, however, is a modest improvement of 30 ppm in NO removal, by increasing NO
destruction rates at earlier times, where the reaction is most effective.
These results imply that at the high temperature conditions of Case 1, that increasing the quantity of
NH3 added would beneficial, particularly in the presence of sodium. The more N-agent present in
Table 8.4.1. Results of AR-Rich at Different Delay Times.
Case 1 2 3 4Injection Conditions
Delay time (s) 0.1 0.1 0.5 0.5Temperature (K) 1670 1670 1550 1550Na2CO3 added (ppm) 50 0 50 0
Concentrations (ppm)Just Before NH3 added
NO 490. 490. 473. 473.OH 111.4 111.4 9.7 9.7H 20.3 20.3 2.6 2.6
0.1 s after start of NH3 AdditionNO 284. 342. 309. 429.NH3 59. 52. 287. 423.OH 15. 11. 2.8 0.06H 3.2 2.4 0.9 0.02
Before OFA added NO 243. 274. 168. 420.NH3 1.3 0.3 140.2 413.8
After burnoutNO 210. 237. 121. 403.NH3 <0.001 <0.001 0.02 <0.001
Notes: Delay time is defined as time from start of Reburn Fuel injectionto the start of NH3 injection
For all cases, mixing time is 30 ms for all injected streams, and SR2 = 0.99.NSR = 1.0 based on NO concentration at point of NH3 injection.Na2CO3, when added, is always premixed with the added NH3.Temperature profile is -300 K/s from start of reburn fuel addition at 1700 K.Initial (primary zone) NO before reburn fuel injection is 606 ppm for all cases.OFA is added at 1300 K in all cases.

8-72
Figure 8.4.9. AR-Rich kinetic curves with 30 ms mixing from the point of reburn fuel injectionwith NH3 (NSR = 1) injected after 0.5 s.
50 ppm Na2CO3 added with NH3
NH3 added without sodium
1E-1
1E+0
1E+1
1E+2
1E+3
1E+4
5E+4
0 0.2 0.4 0.6 0.8 1 1.2
Con
cent
ratio
n (p
pm)
Time (s)
Na
O2
H
NH3
NO
Na2CO3
HNCO,
NH3OH
NaOH
HNCO
H
OH
O2
NO
1E-1
1E+0
1E+1
1E+2
1E+3
1E+4
5E+4
0 0.2 0.4 0.6 0.8 1 1.2
Con
cent
ratio
n (p
pm)
Time (s)
O2
H
NH3
NO
HNCO,
NH3
HNCO
OH
O2
O2
NH3
NO

8-73
the initial, fast-reaction interval, the more NO reduction may be expected. Further, under these
conditions, particularly with sodium added, NH3 is effectively destroyed in the last part of the
reburning zone, so that little ammonia slip would be expected even at higher NSR’s. This approach
provides a means of improving AR-Rich performance at higher injection temperatures. Comparison
of Figures 8.4.4 and 8.4.5 supports this hypothesis and also indicates that it is true over a wide range
of mixing times as well.
Cases 3 and 4 represent a delay of 0.5 s between the injection of reburn fuel and N-agent, with and
without sodium added to the NH3. In these cases, the OH and H concentrations are not as high
before injection as in Cases 1 and 2. In Case 3, in which sodium is included, OH and H have
decreased after 0.1 s, but not as quickly as in Cases 1 and 2, and are still present in quantities on the
order of 1 ppm. After 0.1 s in the presence of sodium, NH3 has not declined as much as in Case 1.
NO also declines somewhat less in the first 0.1 s, but continues to decline over the remainder of the
rich zone and achieves a lower final concentration (168 ppm) than for Case 1 (243 ppm). The TFN
at the end of the rich zone for Case 3 is high because NH3 is still present in substantial quantities.
However, this TFN is effectively burned out when OFA is added at 1300 K, as indicated by Figures
8.4.7 and 8.4.8.
In Case 4, OH and H decrease to very low concentrations (0.06 and 0.02 ppm) in the first 0.1 s from
the start of NH3 injection, while NO and NH3 have declined only by about 50 ppm. In the remainder
of the rich zone, NO and NH3 decline by only about another 10 ppm. Apparently the concentration
of radicals was inadequate to sustain reactions of NO and NH3 in the rich zone. Although burnout
does reduce the high level of rich zone TFN, the final NO is still on the order of 400 ppm as shown
in Figure 8.4.8.
These results show the importance of maintaining the proper concentrations of important reactants
for effective NO reduction. High initial levels of NH3 and radicals promote rapid initial reduction,
but the NO reduction rate is not sustained if the NH3 concentration declines too quickly, as in Cases
1 and 2. In Case 4, it is seen that a sustained high level of NH3 is also ineffective if radicals are not
sustained in sufficient quantities. Case 3 represents the most desirable situation: even though the
initial radical levels are the same as for Case 4, in the presence of sodium the radicals are sustained

8-74
at those levels for a longer time. Even though the initial reaction rate is slower in Case 3 than Case
1, it is effective for a longer time and results in better overall performance.
The implication of these observations is that NO reduction is optimized by sustaining radical
populations at the proper concentrations to maintain a steady rate of reaction of NO with NH3 and
its decomposition products. In these cases, sodium is only partially successful at short delay times/
higher temperatures, but is very successful at longer delay times/lower temperatures.
Sensitivity Analysis. The results shown so far strongly imply a correlation between radical
concentrations and NO-NH3 chemistry, but do not show what specific reactions are involved. Analysis
of sensitivity and contribution factors, as discussed in Section 8.2, provides specific information
about the relative importance of different reactions in the mechanism. This analysis has been
performed for Cases 1 through 4 defined in Table 8.4.1, examining the rich zone from the end of
NH3/Na2CO3 injection to just before OFA injection at 1300 K.
Contribution factors for all four cases show the same predominant reactions involving NO as
discussed earlier (see Figure 8.2.21). Reaction (280) and the combined Reaction (281+282) dominate
NO removal:
NH2 + NO <=> N2 + H2O (281+282)
NH2 + NO <=> NNH + OH (280)
Opposing these, the reverse of Reaction (211) is the predominant source of NO formation during
the fast reaction stage:
HNO + M <=> H + NO + M (-211)
At the lower temperatures corresponding to longer delay times (Cases 3 and 4), Reaction (-211) has
smaller effect relative to Reactions (280-282) than at higher temperatures. This indicates that NO
formation reactions, which compete with the NO removal process, are less effective at lower
temperatures.
8-75
Sensitivity analysis for the four cases shows that Reactions (280-282) are also among the most
important from a sensitivity perspective. The net effect of Reaction (281-282) generally dominates,
with a net negative impact on NO (that is, an increase in the rates of reactions (281-282) increases
the rate of NO reduction).
In Case 1, the sensitivity impact of Reactions (280-282) is opposed significantly, particularly after
the initial fast NO reduction period, by Reaction (202):
NH2 + OH <=> NH + H2O (202)
This reaction acts as a chain termination step because it converts NH2 to NH, which is less reactive
in NO reduction.
A review of sensitivity coefficients for several species in the mechanism, under conditions where
sodium is added (Cases 1 and 3), indicate that Reaction (327) has the most significant effect among
the reactions involving sodium, and that Reaction (326) is important as well. This combination of
reactions is believed to be especially significant because of its impact on the radical pool:
NaOH + H <=> Na + H2O (326)
Na + OH + M <=> NaOH + M (327)
The net effect of these two reactions acting together is H + OH <=> H2O. If both reactions proceed
forward, they are removing OH and H radicals, and if both proceed in reverse they contribute these
radicals. While these reactions are significant among the reactions of sodium whose presence has a
significant impact on NO reduction, they do not show the largest sensitivity factors. This reflects
the nature of these reactions as moderating the fast-reacting radical species, rather than reacting
directly with the high concentration, slowly reacting species such as NO and NH3.
In both Cases 1 and 3, Reactions (326-327) both proceed in the reverse direction, thus boosting the
radical pool by converting H2O to OH and H. In Case 1, their rates diminish rapidly after about 0.1
s following the end of N-agent addition, while in Case 3 they also diminish with time but less
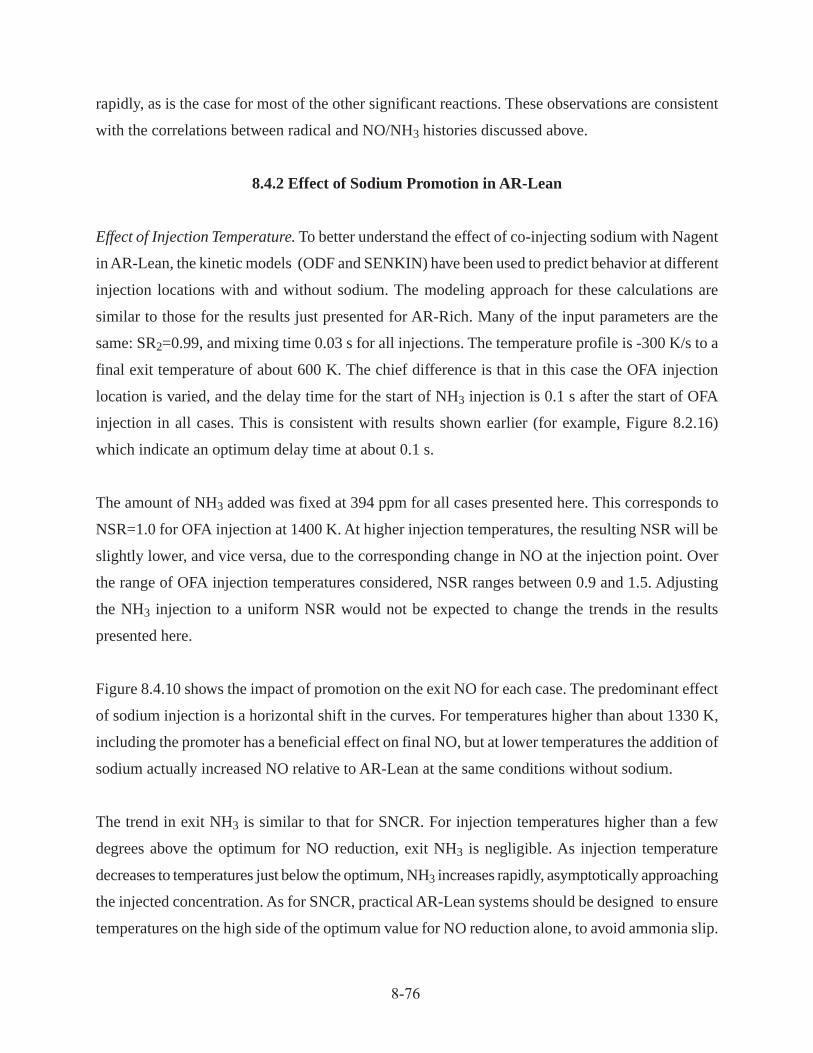
8-76
rapidly, as is the case for most of the other significant reactions. These observations are consistent
with the correlations between radical and NO/NH3 histories discussed above.
8.4.2 Effect of Sodium Promotion in AR-Lean
Effect of Injection Temperature. To better understand the effect of co-injecting sodium with Nagent
in AR-Lean, the kinetic models (ODF and SENKIN) have been used to predict behavior at different
injection locations with and without sodium. The modeling approach for these calculations are
similar to those for the results just presented for AR-Rich. Many of the input parameters are the
same: SR2=0.99, and mixing time 0.03 s for all injections. The temperature profile is -300 K/s to a
final exit temperature of about 600 K. The chief difference is that in this case the OFA injection
location is varied, and the delay time for the start of NH3 injection is 0.1 s after the start of OFA
injection in all cases. This is consistent with results shown earlier (for example, Figure 8.2.16)
which indicate an optimum delay time at about 0.1 s.
The amount of NH3 added was fixed at 394 ppm for all cases presented here. This corresponds to
NSR=1.0 for OFA injection at 1400 K. At higher injection temperatures, the resulting NSR will be
slightly lower, and vice versa, due to the corresponding change in NO at the injection point. Over
the range of OFA injection temperatures considered, NSR ranges between 0.9 and 1.5. Adjusting
the NH3 injection to a uniform NSR would not be expected to change the trends in the results
presented here.
Figure 8.4.10 shows the impact of promotion on the exit NO for each case. The predominant effect
of sodium injection is a horizontal shift in the curves. For temperatures higher than about 1330 K,
including the promoter has a beneficial effect on final NO, but at lower temperatures the addition of
sodium actually increased NO relative to AR-Lean at the same conditions without sodium.
The trend in exit NH3 is similar to that for SNCR. For injection temperatures higher than a few
degrees above the optimum for NO reduction, exit NH3 is negligible. As injection temperature
decreases to temperatures just below the optimum, NH3 increases rapidly, asymptotically approaching
the injected concentration. As for SNCR, practical AR-Lean systems should be designed to ensure
temperatures on the high side of the optimum value for NO reduction alone, to avoid ammonia slip.
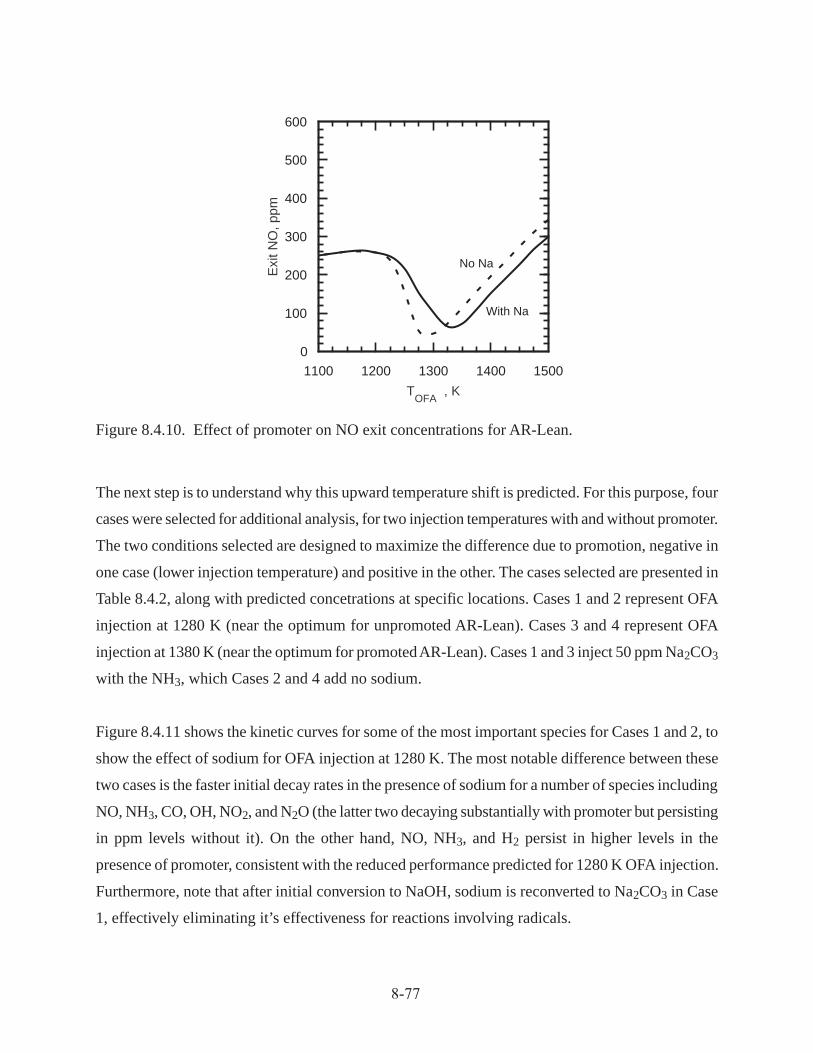
8-77
The next step is to understand why this upward temperature shift is predicted. For this purpose, four
cases were selected for additional analysis, for two injection temperatures with and without promoter.
The two conditions selected are designed to maximize the difference due to promotion, negative in
one case (lower injection temperature) and positive in the other. The cases selected are presented in
Table 8.4.2, along with predicted concetrations at specific locations. Cases 1 and 2 represent OFA
injection at 1280 K (near the optimum for unpromoted AR-Lean). Cases 3 and 4 represent OFA
injection at 1380 K (near the optimum for promoted AR-Lean). Cases 1 and 3 inject 50 ppm Na2CO3
with the NH3, which Cases 2 and 4 add no sodium.
Figure 8.4.11 shows the kinetic curves for some of the most important species for Cases 1 and 2, to
show the effect of sodium for OFA injection at 1280 K. The most notable difference between these
two cases is the faster initial decay rates in the presence of sodium for a number of species including
NO, NH3, CO, OH, NO2, and N2O (the latter two decaying substantially with promoter but persisting
in ppm levels without it). On the other hand, NO, NH3, and H2 persist in higher levels in the
presence of promoter, consistent with the reduced performance predicted for 1280 K OFA injection.
Furthermore, note that after initial conversion to NaOH, sodium is reconverted to Na2CO3 in Case
1, effectively eliminating it’s effectiveness for reactions involving radicals.
Figure 8.4.10. Effect of promoter on NO exit concentrations for AR-Lean.
0
100
200
300
400
500
600
1100 1200 1300 1400 1500
Exi
t NO
, ppm
TOFA
, K
With Na
No Na

8-78
Table 8.4.2. Results of AR-Lean at Different Injection Temperatures, with and without sodium.
Case 1 2 3 4Injection Conditions
T at start of OFA injection (K) 1280 1280 1380 1380T at start of NH3 injection (K) 1250 1250 1350 1350Na2CO3 added (ppm) 50 0 50 0
Concentrations (ppm)Just Before NH3 added
NO 353. 353. 388. 388.OH 9.4 9.4 17.8 17.8H 0.001 0.001 0.003 0.003
0.03 s after start of NH3 Addition(End of Mixing Zone)NO 269. 254. 242. 232.NH3 303. 290. 187. 160.OH 2. 3.2 15. 22.H 0.007 0.015 0.033 0.068
0.1 s after start of NH3 AdditionNO 196. 119. 141. 167.NH3 224. 141. 27. 2.OH 0.8 2.9 10. 18.H 0.002 0.005 0.003 0.004
Exit (at 600 K)NO 146. 52. 121. 165.NH3 173. 64. 0.02 0.NO2 0.01 7. 1. 1.N2O <0.001 7. 0.01 4.
Notes: Delay time is 0.1s from start of OFA injection in all cases.For all cases, mixing time is 30 ms for all injected streams, and SR2 = 0.99.394 ppm NH3 added in all cases (NSR = 1.0 to 1.1)Na2CO3, when added, is always premixed with the added NH3.Temperature profile is -300 K/s from start of reburn fuel addition at 1700 K.Initial (primary zone) NO before reburn fuel injection is 606 ppm for all cases.

8-79
Figure 8.4.11. AR-Lean kinetic curves with 30 ms mixing from the point of NH3 injection, whichis 0.1 s after OFA injection at 1280 K.
50 ppm Na2CO3 added with NH3
NH3 added without sodium
1E-1
1E+0
1E+1
1E+2
6E+2
0 0.2 0.4 0.6 0.8 1
Con
cent
ratio
n (p
pm)
Time (s)
Na2O
NO2
H2
NH3
Na2CO3
OH
NaOH
CO
NO
N2O
1E-1
1E+0
1E+1
1E+2
6E+2
0 0.2 0.4 0.6 0.8 1
Con
cent
ratio
n (p
pm)
Time (s)
NO2
H2
NH3
OH
CO
NO
N2O
8-80
Figure 8.4.12 shows the kinetic curves for Cases 3 and 4, to show the effect of sodium for OFA
injection at 1380 K. These curves show faster decay for many species (notably excepting NH3 and
H2) in the presence of promoter. The initial decay rate for NO appears to be similar with and
without promoter for about the first 20 ms. The difference in NO appears to occur over the time
span from about 20 to 200 ms, during which NO decay continues (albeit at a reduced rate) with
promoter, but essentially stops without it. These time scales appear to reflect the difference in decay
time of NH3. As previously discussed for AR-Rich, an important element in the sodium promotion
mechanism is persistence in the availability of the N-agent (or intermediate species generated by
it).
The NO concentration immediate after the end of N-agent injection (0.03 s) is better without promoter,
for both injection temperatures. At the lower temperature, the gap widens, while at the higher
temperature the promoter eventually results in lower NO and TFN at the exit. As for the optimum
case in AR-Rich, the beneficial effect in sodium addition lies in the prolonging of significant NO
reduction rates over a longer interval in the NH3 reaction zone.
Sensitivity Analysis. The ODF results immediately following the end of N-agent mass addition was
used as the initial condition for SENKIN sensitivity calculations. This analysis provides further
insight into the source of the differences between these cases.
Comparing the NO contribution and sensitivity factors, it is seen that reactions 280, 281 and 282
are the most significant reactions in all cases. All of these reactions involve NH2+NO, with final
products NNH+OH for Reaction (280) and N2+H2O for Reactions (281-282).
Other reactions with significant sensitivity effects include reaction (38) and (202):
H + O2 <=> O + OH (38)
NH2 + OH <=> NH + H2O (202)
Reaction (38) has a negative influence at the lower temperature and (after an initial negative transient)
a positive influence on NO at the higher temperature. Reaction (202) has a notable positive sensitivity
effect on NO at the higher temperature, as it competes with other NH2 reactions (280-282) which

8-81
Figure 8.4.12. AR-Lean kinetic curves with 30 ms mixing from the point of NH3 injection, whichis 0.1 s after OFA injection at 1380 K.
50 ppm Na2CO3 added with NH3
NH3 added without sodium
1E-1
1E+0
1E+1
1E+2
6E+2
0 0.1 0.2 0.3 0.4 0.5
Con
cent
ratio
n (p
pm)
Time (s)
Na2ONO2
H2
NH3
Na2CO3
OH
NaOH
CO
NO
N2O
1E-1
1E+0
1E+1
1E+2
6E+2
0 0.1 0.2 0.3 0.4 0.5
Con
cent
ratio
n (p
pm)
Time (s)
NO2H2
NH3
OH
CO
NO
N2O

8-82
remove NO, and at the same time converts NH2 to less reactive NH.
The importance of radicals in the NO removal mechanism begins with the removal of NH3, which
is dominated by Reaction (277):
NH3 + OH <=> NH2 + H2O (277)
Therefore, the availability of OH controls the rate of NH3 reaction. It is NH2 which predominates in
reactions (280-281) which remove NO, and so control of the rate of NH3 affects the availability of
NH2.
For both cases with sodium, the Na reactions with the largest contribution effect for NO is (323)
NaO + NO = Na + NO2 (323)
The contribution to NO is positive, indicating that the reaction is proceeding in reverse. The sodium
reaction with the greatest sensitivity is (326)
NaOH + H = Na + H2O (326)
. In fact, reaction (326) is also the most significant sodium reaction for several other species, including
NH3 and NH2. Reaction (326) shows positive sensitivity for NO at all times in Case 1, while for
Case 3, it peaks positive at about 20 ms, then declines and goes negative. In other words, NO
formation is favored by Reaction (326) in Case 1, but NO destruction is favored by Reaction (326)
for most of Case 3. This is consistent with the positive and negative influence of the presence of
sodium in those cases.
Having identified reactions with major contribution and sensitivity influences, a more complete
picture of the role of sodium may be drawn. The initial steps of the sodium mechanism can be
summarized by Reactions (317-319):
Na2CO3 <=> Na2O + CO2 (317-318)
8-83
Na2O+ H2O <=> 2 NaOH (319)
Since Reaction (317) is the only one involving Na2CO3, it is seen that Na2CO3 is ineffective at
managing the radical pool, adding to the ineffectiveness of sodium at later times in Case 1, when
Na2CO3 is the dominant species.
When NaOH is available, it reacts predominantly through Reaction (326) to remove H:
NaOH + H <=> Na + H2O (326)
If reaction (327)
Na+OH+M<=>NaOH+M (327)
is running in the same direction, it works with Reaction (326) to either recombine H + OH into
H2O, or in reverse to increase these radicals. In Case 3, both reactions move forward, while in Case
1 they oppose each other. In both cases, the rate of (326) is larger in magnitude. Its main importance
may lie in the indirect influence of the OH concentration through other reactions such as Reaction
(38):
H + O2 <=> O + OH (38)
By reducing the concentration of H, Reaction (326) slows Reaction (38) and therefore reduces the
availability of OH. Other sodium reactions affect the radical pool, but to a lesser extent than (326).
However, at the higher temperature the OH concentration is much higher, resulting in more rapid
and complete NH3 destruction than at the lower temperature, where a significant NH3 concentration
persists.
When NH3 removal is incomplete (as for 1280 K OFA injection), the reduction of NH3 at early
times is all that contributes to NO removal, so faster NH3 removal during that time period is more
beneficial to NO reduction. When NH3 removal is complete (as for 1380 K OFA injection), then

8-84
spreading it out over a longer time provides a more consistent stream of reactants to reduce NO, and
so is able to do so more effectively. The role of sodium in slowing NH3 removal rates appears to be
the primary difference in the behavior for 1280 K versus 1380 K OFA injection.
8.5 Summary of Modeling Studies
The GRI-Mech combustion mechanism has been extended based on literature and experimental
data to include SNCR chemistry, as well as reactions involving compounds of Na, S, and Cl. The
sodium mechanism has been used to evaluate the performance of AR-Rich and AR-Lean scenarios,
promoted by Na2CO3.
The individual AR injection processes have been investigated using one-dimensional chemical
kinetics models, to determine their behavior over time and as a result of parametric variations.
Analysis of sensitivity and contribution factors identifies specific reactions in the mechanism which
affect the results.
Analysis of the basic reburning process revealed an initial fast NO reduction zone followed by a
longer, slower NO reduction zone. This provides an opportunity for improvement through AR-
Rich, by enhancing the rate of reaction in the latter zone.
The effect of ammonia in both AR-Rich and AR-Lean was investigated. In both cases, it is possible
to optimize NO reduction with respect to the injection temperature and/or delay time of N-agent
injection. Optimization of the amount of N-agent is also important to system performance. The
quantity must be adequate for the degree of NO reduction but more is not necessarily better. Designing
the injection system to promote uniform mixing should help minimize the quantity of N-agent
needed but the performance also depends on the characteristic time of mixing. The NSR and mixing
time both affect the net NO reduction as well as the net concentration of other TFN species. In most
cases, the trend is toward better performance at longer mixing times, which implies that the results
at full scale should be able to at least match pilot scale experimental results. The chief drawback of
larger scales is increased potential unmixedness of the reburn fuel, as well as N-agents with flue
gas. This may create zones with too high and too low SR2 that will reduce AR performance.

8-85
The effect of promoters was also investigated. First, the effect and influence of various types of
promoting species, including radicals, was considered. Later, more attention was paid to the use of
specific promoters of current interest for field implementation, notably Na2CO3. In AR-Rich the
effect of Na2CO3 is to broaden the range of injection locations with good NO reduction performance.
In AR-Lean, the primary effect is to shift the optimum in NO reduction to higher temperatures.
Sodium promotion can improve AR-Rich performance by sustaining the radical pool when it is
needed. As for unpromoted AR, this effect is most pronounced in systems with long characteristic
mixing times, and so promoted advanced reburning continues to show promise for commercial
implementation. Similarly, sodium promotion can improve AR-Lean, in this case by limiting the
radical pool to moderate the reaction rate of NH3.
In both AR-Rich and AR-Lean, it should be noted that optimization involves managing both the
concentrations of important species (such as NH3 and OH), and their rate of removal. Generally,
concentrations and rates which are too high are undesirable as well as those which are too low. In
general, optimum solutions tend to be those with slow but steady NO removal using as much of the
reaction zone as possible.
9-1
9.0 DESIGN METHODOLOGY AND APPLICATION
This task was included in the project to provide a conduit for translation of the analytical and
experimental SGAR configurations into practical full scale designs. The task includes the extension
of EER’s reburning design methodology to AR and SGAR configurations and the evaluation of
SGAR economics and market potential for US utility boilers. The original work scope for this task
was based on use of a hypothetical case study. However, it was hoped that an initial AR demonstration
could be developed in parallel with Phase I (outside the scope of this DOE project) and could be
used to evaluate some of the elements of SGAR during the later portion of Phase I and in Phase II.
EER has been successful in developing an initial AR demonstration project. In 1995 EER installed
the original AR configuration (now termed AR-Lean) on a 105 MW tangentially fired boiler.
Accordingly, this unit was used as the basis for extending the design methodology. Testing is being
conducted in three phases during the summer of 1996, 97, and 98. In this task, this unit was used as
a case study for extending the reburn design methodology to SGAR. It also was used to test some
elements of the various SGAR configurations during summer 1997. If the project proceeds through
Phase II, additional elements will be tested in 1998.
The following section describes the extension of EER’s reburning design methodology to AR and
SGAR. The general approach is outlined and then applied to the 105 MW tangentially fired
demonstration unit. Section 9.2 discusses the application of AR-Lean to this unit which was
conducted as part of a separate project, and the initial testing of some SGAR elements. Finally,
Section 9.3 discusses the application of SGAR to the US utility industry including the regulatory
drivers, economics and market potential.
9.1 AR Design Methodology
9.1.1 General Approach
EER’s general methodology for application of AR technologies to utility boilers is shown in Figure
9.1.1. The design methodology uses various experimental and analytical tools to develop the injector
specifications and operating characteristics of the AR system with the objective of meeting specific
process requirements for optimum emissions control performance while maintaining boiler operation
and performance at normal levels. The primary elements of the methodology consist of:
• Collection of system design and operating data to quantify the characteristics of the

9-2
full-scale system, and to obtain data for use in model set up and calibration. This
information typically includes the range of typical operation, specific unit limita-
tions that should be taken into account in the design, and emissions controls require-
ments.
• Heat transfer modelling of the unit to predict the boiler’s thermal characteristics as
functions of various input and operational variables. This analysis is focussed on
studying the impacts of the process on boiler performance, and on identification of
possible remedies for any adverse impacts which are expected to occur.
• Isothermal flow modelling of the unit to simulate the full-scale furnace flow field,
and to optimize the injection parameters of the reburning/AR systems. A key objec-
tive of the flow model studies is to develop injection systems which provide rapid
and uniform mixing of the reburning fuel, OFA, and N-agents.
• Development of performance predictions for full-scale applications of the reburn-
ing process using process and kinetic models developed from the results of subscale
tests and the fundamental chemistry involved in the process. Model predictions un-
der ideal mixing conditions are used in conjunction with the results of isothermal
model mixing studies to assess the impacts of mixing on reburning/AR performance.
Figure 9.1.1 Generalized design methodology for AR technologies.
Thermal History
Flow Field
Jet MixingProcess
Application
Injection SystemDesign
Physical FlowModeling
Cold Flow Model
PerformancePrediction
Heat Transfer ModelingHeat Transfer Model
Boiler Performance Model
Process ModelingProcess/Kinetics
Models
FurnacePerformance
SystemOptimization
Host Site EvaluationFurnace Design/Operational
Details
PreliminaryInjector Design
Jet Entraimentand Trajectory
Models
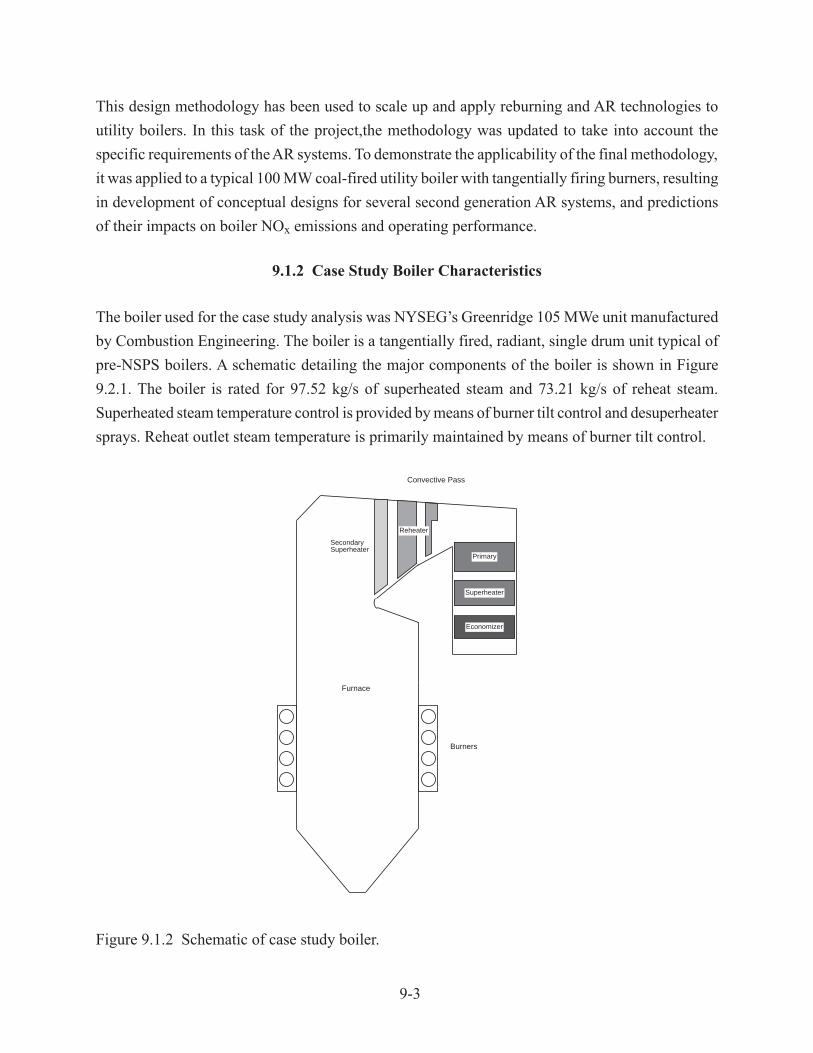
9-3
This design methodology has been used to scale up and apply reburning and AR technologies to
utility boilers. In this task of the project,the methodology was updated to take into account the
specific requirements of the AR systems. To demonstrate the applicability of the final methodology,
it was applied to a typical 100 MW coal-fired utility boiler with tangentially firing burners, resulting
in development of conceptual designs for several second generation AR systems, and predictions
of their impacts on boiler NOx emissions and operating performance.
9.1.2 Case Study Boiler Characteristics
The boiler used for the case study analysis was NYSEG’s Greenridge 105 MWe unit manufactured
by Combustion Engineering. The boiler is a tangentially fired, radiant, single drum unit typical of
pre-NSPS boilers. A schematic detailing the major components of the boiler is shown in Figure
9.2.1. The boiler is rated for 97.52 kg/s of superheated steam and 73.21 kg/s of reheat steam.
Superheated steam temperature control is provided by means of burner tilt control and desuperheater
sprays. Reheat outlet steam temperature is primarily maintained by means of burner tilt control.
Figure 9.1.2 Schematic of case study boiler.
Burners
Furnace
Convective Pass
Economizer
Primary
Superheater
Reheater
SecondarySuperheater

9-4
The unit is currently fired with the eastern bituminous coal which has a higher heating value of
29.94 J/kg. Four bowl type mills pulverize the coal to a maximum fineness of 83 percent through a
#200 U.S.S. sieve. The pulverized coal is transported by heated primary air at a temperature of 344
K to one of four rows of coal burners on each corner of the boiler. Each pulverizer serves a row of
burners for a total of sixteen burners on the unit. The burners have tilting mechanisms with a
maximum range of ±27° from the horizontal. Heated secondary air at a temperature of 533 K is
supplied to the furnace windbox which distributes the air to the burner air registers. At each corner,
the fuel and air nozzles are directed along lines tangent to an imaginary circle located in the center
of the furnace. The fuel and air streams combine to form a single swirling “fireball” in the furnace
area. The resulting swirl action effectively mixes the fuel and air, resulting in near complete
combustion of the fuel. Exiting the furnace, the hot combustion gases pass through a secondary
superheater, reheater, primary superheater, economizer, and two regenerative air heaters.
For baseline operation of the unit at full load (104 MW), NOx emissions are 512 ppm, dry, corrected
to 3% O2. Corresponding CO emissions at these conditions are 4 ppm, dry, corrected to 3% O2. As
boiler load drops, the firing intensity of each level of burners is reduced resulting in lower NOx
with a slight increase in CO emissions. As the boiler load is reduced further, the top row of burners
are taken out of service resulting in increased firing rate for the remaining burners and the excess
air is increased, resulting in an increase in NOx emissions. Unburned carbon-in-ash is less than 4
percent over this load range.
9.1.3 Heat Transfer Analysis
A heat transfer analysis of the case study boiler was performed to identify appropriate locations for
injection of the streams involved in SGAR processes (i.e, reburning fuel, OFA, and N-agents), and
to assess the impacts of the process on unit performance. The heat transfer analysis consisted of
setting up a two-dimensional heat transfer model simulation of the radiant furnace and a one-
dimensional model simulation of the convective pass sections. The model was calibrated against
available field data and design and operating data. The results of the furnace predictions for baseline
operating conditions was used to identify appropriate locations for the reburning fuel, OFA, and
reagent streams associated with the SGAR processes. Next, a parametric study of the impacts of the
SGAR processes on boiler performance was performed. The models used in the analysis and the
results of the study are summarized below.
For this study, EER’s two-dimensional furnace combustion and heat transfer code (2DHT) was
applied to evaluate thermal characteristics in a radiation-dominated boiler furnace. A key element
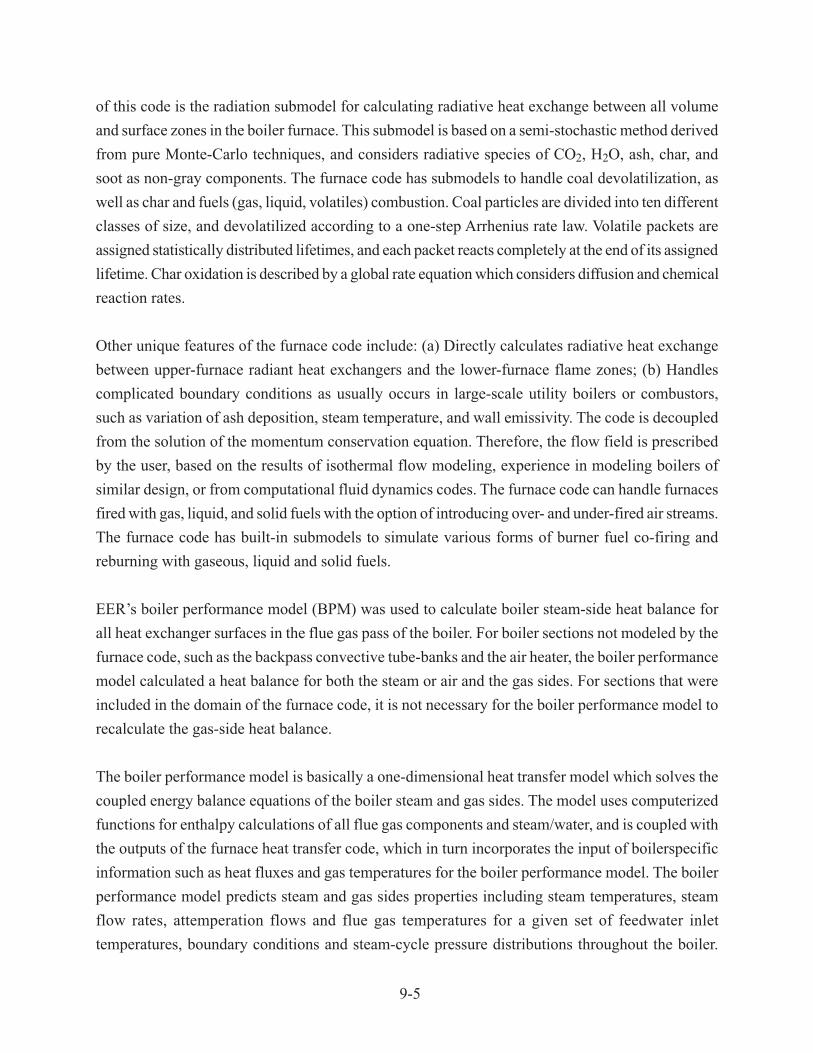
9-5
of this code is the radiation submodel for calculating radiative heat exchange between all volume
and surface zones in the boiler furnace. This submodel is based on a semi-stochastic method derived
from pure Monte-Carlo techniques, and considers radiative species of CO2, H2O, ash, char, and
soot as non-gray components. The furnace code has submodels to handle coal devolatilization, as
well as char and fuels (gas, liquid, volatiles) combustion. Coal particles are divided into ten different
classes of size, and devolatilized according to a one-step Arrhenius rate law. Volatile packets are
assigned statistically distributed lifetimes, and each packet reacts completely at the end of its assigned
lifetime. Char oxidation is described by a global rate equation which considers diffusion and chemical
reaction rates.
Other unique features of the furnace code include: (a) Directly calculates radiative heat exchange
between upper-furnace radiant heat exchangers and the lower-furnace flame zones; (b) Handles
complicated boundary conditions as usually occurs in large-scale utility boilers or combustors,
such as variation of ash deposition, steam temperature, and wall emissivity. The code is decoupled
from the solution of the momentum conservation equation. Therefore, the flow field is prescribed
by the user, based on the results of isothermal flow modeling, experience in modeling boilers of
similar design, or from computational fluid dynamics codes. The furnace code can handle furnaces
fired with gas, liquid, and solid fuels with the option of introducing over- and under-fired air streams.
The furnace code has built-in submodels to simulate various forms of burner fuel co-firing and
reburning with gaseous, liquid and solid fuels.
EER’s boiler performance model (BPM) was used to calculate boiler steam-side heat balance for
all heat exchanger surfaces in the flue gas pass of the boiler. For boiler sections not modeled by the
furnace code, such as the backpass convective tube-banks and the air heater, the boiler performance
model calculated a heat balance for both the steam or air and the gas sides. For sections that were
included in the domain of the furnace code, it is not necessary for the boiler performance model to
recalculate the gas-side heat balance.
The boiler performance model is basically a one-dimensional heat transfer model which solves the
coupled energy balance equations of the boiler steam and gas sides. The model uses computerized
functions for enthalpy calculations of all flue gas components and steam/water, and is coupled with
the outputs of the furnace heat transfer code, which in turn incorporates the input of boilerspecific
information such as heat fluxes and gas temperatures for the boiler performance model. The boiler
performance model predicts steam and gas sides properties including steam temperatures, steam
flow rates, attemperation flows and flue gas temperatures for a given set of feedwater inlet
temperatures, boundary conditions and steam-cycle pressure distributions throughout the boiler.

9-6
The boiler efficiency is calculated based on the ASME heat loss method.
To set up the furnace code to simulate the boiler performance under baseline operation and with
retrofit of the SGAR processes, the furnace was first divided into a computational grid for input to
the model. Figure 9.1.3 illustrates how the three-dimensional boiler is represented in the furnace
code as an axisymmetric cylindrical grid, and how the boiler furnace was divided into 26 layers in
the direction of the gas flow. The length and radius of each section up to the nose plane were chosen
such that the volume, furnace height, and cross-sectional area were matched to those of the
corresponding section in the full-scale unit. For the sections above the nose plane until the exit of
the low temperature reheater section, the ratio of heat sink surface to zonal volume was preserved.
This geometric transformation was performed to maintain the heat transfer similarity between the
model and the actual boiler. Since the momentum conservation equation was not solved in the
furnace heat transfer code, the flow field was prescribed using flow patterns acquired from an
isothermal flow modeling study.
Figure 9.1.3 Furnace heat transfer model set up.
Screen Tubes
LTRH
HTRH
SSH
Air Heater
J=1 2
I=1
2
3
4
5
6
7
8
9
10
11
12
13
1415
16
17
18
19
20
212223242526
Centerline
ScreenTubes
OFA(AGR)
SSH
HTRH
LTRH
PSH
ECOOFA (GR)
RF
{Burners } Burners } Burners
OFA (GR)
RF
3456
OFA(AGR)
26
25
24
23
I=22
21
Nose Point
1
2
I=3
4
5
6
7
8
9
10
11
12
13
1415
16
17
18
19
I=20
(a) (b)

9-7
Since it is not possible to fully describe a complicated three-dimensional object using only two
dimensions, and since some model parameters cannot be easily assessed without comprehensive
boiler data, the model was initially calibrated against existing data to verify that the models were
properly simulating the boiler performance at full load with two levels of tilt. The model was
calibrated against field data collected by EER in a previous project and boiler design data provided
by the boiler owner. The field data include flue gas temperatures, unburned fixed carbon-in-ash
value, steam generation, attemperation flows, and water/steam temperatures for the major heat
transfer components.
Mean gas temperatures predicted by the furnace code for the furnace section before the exit of low-
temperature reheater section are shown in Figure 9.1.4, where burner locations, nose plane and
upper-furnace heat exchanger sections are labeled. The plot identifies the first few banks of the
convective pass simulated in the furnace code: secondary superheater (SSH), hightemperature
reheater (HTRH), and low-temperature reheater (LTRH). The predicted mean gas temperatures
basically fall in the range of the measured data, except for the temperatures at the nose plane. The
differences between predicted gas temperatures and measurement at the nose plane are believed to
be primarily due to the temperature stratification, since no measurement close to the center of the
plane was taken. Therefore, these differences are considered within the prediction accuracy.
Figure 9.1.4 Comparison of predicted and measured furnace gas temperatures.
900
1,100
1,300
1,500
1,700
1,900
0 10 20 30
Mea
n G
as T
emp
erat
ure
, K
Model Axial Distance, m
Bur
ner
Bur
ner
Bur
ner
Bur
ner
Nos
e
SS
H In
let
HT
RH
Inle
t
LTR
H In
let

9-8
Three processes are being considered for application to the case study boiler: AR-Lean, AR-Rich,
and MIAR. The results of the pilot scale studies (Section 7) indicate that optimum performance of
the AR-Lean process requires injection of the OFA and N-agent at approximately 1300 K. For the
AR-Rich process, the OFA is injected at this temperature, but the N-agent is injected upstream at a
temperature of about 1370 K. For optimum performance of the MIAR process, the OFA is again
injected at close to 1300 K, but the N-agent is divided into two streams and injected at temperatures
of 1300 K and 1370 K, which correspond to the point of OFA introduction and to a plane upstream
of the overfire air. In each of these processes, the reburning fuel is injected in the lower furnace
above the main burners.
Figure 9.1.5 shows the bulk mean temperatures predicted in the upper furnace of the case study
boiler by the heat transfer model. As shown in this figure, the optimum location for overfire air
injection for each of the AR processes occurs within the first tube bank of the reheater, and the
optimum location for reagent injection for AR-Rich and MIAR occurs between the secondary
superheater and the reheater. Therefore, one approach for implementation of these processes on
this boiler would be to inject the fuel-rich reagent into the cavity between the secondary superheater
and reheater and the overfire air into the cavity between the reheater tube banks. As shown in
Figures 9.1.4 and 9.1.5, the temperature in the reheater cavity is on the order of 1,120 K, which is
expected to be too cold for overfire air injection and for injection of reagent in the AR-Lean and
MIAR processes. Installation of OFA/N-agent injection systems in this region would also interfere
with the plant sootblowing equipment in this region.
Figure 9.1.5 Predicted bulk mean temperatures in upper furnace of case study boiler.
1,590 K
1,420 K
1,370 K
Economizer
Primary
Superheater
SecondarySuperheater
Flue Gasto Air Heater
1,120 K
Reheater
9-9
The preferred approach for implementation of the OFA and N-agents stages of the AR processes on
the case study boiler is shown in Figure 9.1.6. For the AR-Lean process, natural gas is injected in
the furnace, and OFA and N-agent are injected into the cavity in between the secondary superheater
platen and the first reheater platen. This location is on the high side of the optimum temperature,
but should be adequate to ensure burnout of the carbon monoxide in the flue gases during AR-Lean
operation. For the AR-Rich process, natural gas is injected in the furnace, Nagent is injected upstream
of the secondary superheater, and OFA is injected into the cavity in between the secondary superheater
platen and the first reheater platen. Injection of both of these streams at a higher than optimum
temperature represents a compromise between practical implementation of the process on the case
study boiler, and achieving optimum performance. Implementation of the MIAR process on the
case study boiler consists of natural gas injection into the furnace, reagent injection upstream of the
secondary superheater, and OFA and N-agent injection into the cavity in between the secondary
superheater platen and the first reheater platen.
Figure 9.1.6 Implementation of AR technologies on case study boiler.
(a) AR-Lean (b) AR-Rich
(c) MIAR
OFAPorts
Economizer
Primary
Superheater
Reheater
N Reagent
OFAPorts
Economizer
Primary
Superheater
Reheater
N Reagent
OFAPorts
Economizer
Primary
Superheater
Reheater
N Reagent

9-10
To study the impacts of the AR process configurations shown in Figure 9.1.6 on unit performance
and efficiency, a parametric study was performed using the heat transfer models. Injection of the N-
agent was assumed to have a negligible impact on boiler performance, therefore, the analysis was
concentrated on evaluating the effects of stoichiometric ratio changes in conjunction with OFA
injection into the secondary superheater/reheater cavity. In the analysis, the reburning fuel was
assumed to be natural gas. The primary operating variables under study were the zone stoichiometries
and the burner tilt settings. Two sets of zone stoichiometries were evaluated. The first set of zone
stoichiometries consisted of using stoichiometric ratios (SR) of 1.1, 0.99, and 1.15 for, respectively,
the primary (SR1), reburning (SR2), and burnout zones (SR3). This set of zone stoichiometries
represents assumed operating conditions for optimum NOx reduction performance with each of the
AR processes. The second set of zone stoichiometries consisted of using stoichiometric ratios of
1.2, 1.05, and 1.2 for, respectively, the primary, reburning, and burnout zones. This set of zone
stoichiometries represents operating conditions assumed to reduce the impacts of AR on carbon in
ash and boiler thermal performance. Both of these cases were ran with the burner tilt at its baseline
or normal setting. A final case was run with the burner tilt set higher than the normal setting to
assess the ability to minimize the impacts of the AR processes on boiler performance by modifying
boiler operation. For comparison, the model was also used to predict the impacts of basic reburning
on boiler performance as well. The thermal performance impacts evaluated in this study include
furnace exit gas temperature (FEGT), unburned fixed carbon in ash, main and reheat steam
temperatures, and attemperation requirements. The FEGT is defined as the mean flue gas temperature
located at the nose plane.
Figures 9.1.7 and 9.1.8 show the predicted impacts of gas reburning and advanced reburning processes
on furnace exit gas temperature and carbon in ash. For implementation of gas reburning, the model
predicts a slight decrease in furnace exit gas temperature, and an increase in carbon loss. The
change in furnace exit gas temperature with reburning is due to a slight modification of the boiler
heat absorption distribution. Carbon loss is expected to increase by close to 3.5% over baseline
conditions with reburning due to operation of the burners at a lower than baseline excess air level.
In the proposed AR process configurations, the overfire air is injected into the secondary superheater/
reheater cavity. This reduces the mass loading to the furnace at the nose plane by approximately
20% in comparison to basic reburning. As shown in Figure 9.1.7, the reduction in mass loading in
the furnace results in an increase in furnace exit gas temperatures with AR operation. For baseline
AR operation (i.e, primary SR ~ 1.1, reburning SR ~ 0.99), delaying the addition of OFA until the
convective pass is predicted to increase carbon loss by approximately 9% over normal reburning
operation. Increasing the primary zone stoichiometry from 1.1 to 1.2 while maintaining close to
10% reburning fuel, results in an increase in furnace exit gas temperature, but reduces the impact of

9-11
OFA injection into the convective pass on carbon loss. For the case of AR operation with 20%
excess air in the burners, carbon loss is expected to increase by only 1.5% over reburning operation.
Figure 9.1.7 Projected impacts of AR processes on furnace exit gas temperature.
Figure 9.1.8 Projected impacts of AR processes on carbon in ash.
Bas
elin
e
GR
AR
Bas
e
AR
Hig
h B
urne
r S
R
AR
Mod
ified
Ope
ratio
n
0
200
400
600
800
1,000
1,200
1,400
1,600
1,800
2,000
Fu
rnac
e E
xit
Gas
Tem
per
atu
re, K 1,590 1,553 1,581 1,611
1,700
Full Load
Bas
elin
e
GR
AR
Bas
e
AR
Hig
h B
urne
r S
R
AR
Mod
ified
Ope
ratio
n
0
2
4
6
8
10
12
14
16
18
20
Car
bo
n in
Ash
, %
4.00
7.43
16.70
9.089.99
Full Load
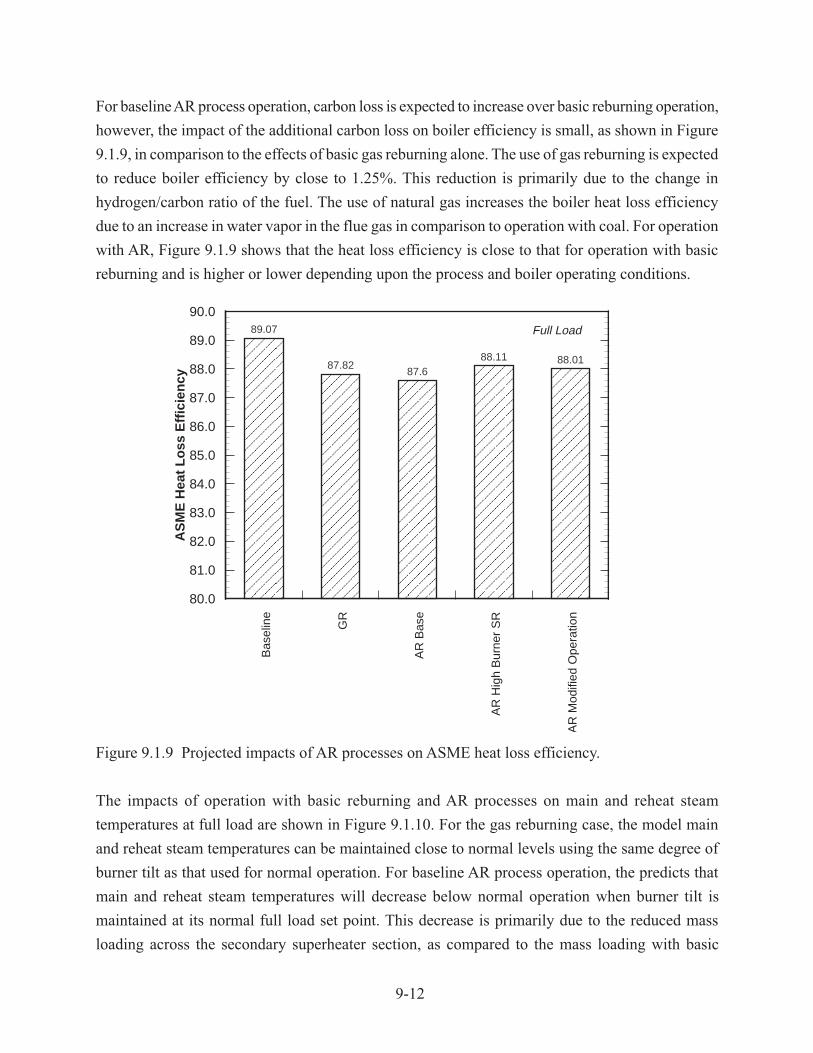
9-12
For baseline AR process operation, carbon loss is expected to increase over basic reburning operation,
however, the impact of the additional carbon loss on boiler efficiency is small, as shown in Figure
9.1.9, in comparison to the effects of basic gas reburning alone. The use of gas reburning is expected
to reduce boiler efficiency by close to 1.25%. This reduction is primarily due to the change in
hydrogen/carbon ratio of the fuel. The use of natural gas increases the boiler heat loss efficiency
due to an increase in water vapor in the flue gas in comparison to operation with coal. For operation
with AR, Figure 9.1.9 shows that the heat loss efficiency is close to that for operation with basic
reburning and is higher or lower depending upon the process and boiler operating conditions.
Figure 9.1.9 Projected impacts of AR processes on ASME heat loss efficiency.
The impacts of operation with basic reburning and AR processes on main and reheat steam
temperatures at full load are shown in Figure 9.1.10. For the gas reburning case, the model main
and reheat steam temperatures can be maintained close to normal levels using the same degree of
burner tilt as that used for normal operation. For baseline AR process operation, the predicts that
main and reheat steam temperatures will decrease below normal operation when burner tilt is
maintained at its normal full load set point. This decrease is primarily due to the reduced mass
loading across the secondary superheater section, as compared to the mass loading with basic
Bas
elin
e
GR
AR
Bas
e
AR
Hig
h B
urne
r S
R
AR
Mod
ified
Ope
ratio
n
80.0
81.0
82.0
83.0
84.0
85.0
86.0
87.0
88.0
89.0
90.0
AS
ME
Hea
t L
oss
Eff
icie
ncy
89.07
87.8287.6
88.11 88.01
Full Load
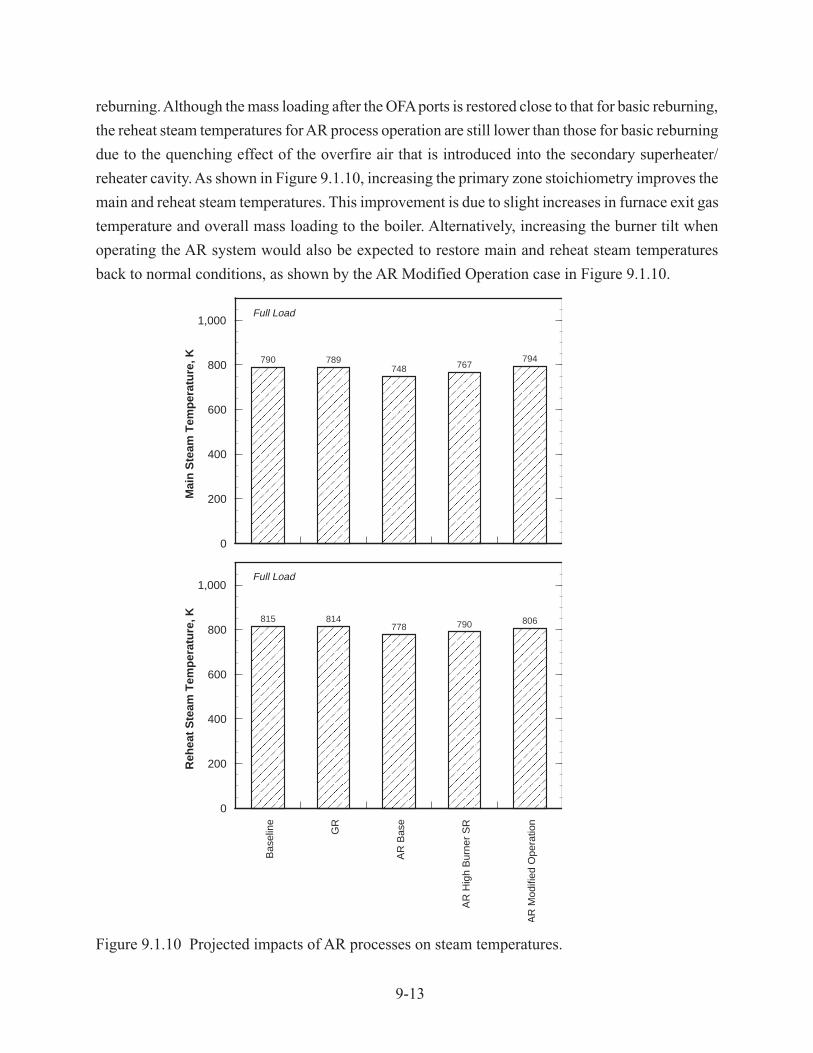
9-13
reburning. Although the mass loading after the OFA ports is restored close to that for basic reburning,
the reheat steam temperatures for AR process operation are still lower than those for basic reburning
due to the quenching effect of the overfire air that is introduced into the secondary superheater/
reheater cavity. As shown in Figure 9.1.10, increasing the primary zone stoichiometry improves the
main and reheat steam temperatures. This improvement is due to slight increases in furnace exit gas
temperature and overall mass loading to the boiler. Alternatively, increasing the burner tilt when
operating the AR system would also be expected to restore main and reheat steam temperatures
back to normal conditions, as shown by the AR Modified Operation case in Figure 9.1.10.
Figure 9.1.10 Projected impacts of AR processes on steam temperatures.
0
200
400
600
800
1,000
Mai
n S
team
Tem
per
atu
re, K 790 789
748 767794
Full Load
Bas
elin
e
GR
AR
Bas
e
AR
Hig
h B
urne
r S
R
AR
Mod
ified
Ope
ratio
n
0
200
400
600
800
1,000
Reh
eat
Ste
am T
emp
erat
ure
, K 815 814778 790 806
Full Load

9-14
In summary, thermal performance models were used to evaluate the impacts of implementing AR
processes on the thermal performance of a nominally 100 MW tangentially fired boiler. For
implementation of AR-Lean, AR-Rich, or MIAR processes on this boiler, the reburning fuel would
be injected into the lower furnace and the overfire air would be injected into the upper furnace in a
cavity between the first two tube banks of the convective pass. The model results indicate that the
this configuration is expected to increase carbon loss and reduce main and reheat steam temperatures
in comparison to baseline or gas reburning operation. Changes in the operating settings of the AR
process can be used to mitigate some of the increase in carbon loss. However, the overall boiler
efficiency for operation with an AR system is similar to that for operation with a basic gas reburning
system. Changes in the operating settings of the AR process or in the boiler operating settings can
be used to mitigate the impacts of AR on main and reheat steam temperatures. It should be noted
that the results of this analysis are specific to the boiler configuration evaluated and should not be
generalized to other boiler designs.
9.1.4 Injection System Studies
To assist in the design of injection systems for the reburning fuel and overfire air used in
implementation of the AR processes, a physical model of the case study boiler was constructed.
The model was a 1:12 geometric scale replica of the boiler furnace from the hopper to the primary
superheater. Following construction of the model, flow visualization was performed to study the
characteristics of the furnace flow field. Next, simulated injection system were installed on the
model. Jet penetration and mixing studies were performed to develop injection systems which
resulted in optimum dispersion of the advanced reburning process streams. The results of these
studies are summarized below.
The major characteristics of the case study boiler flow field under baseline conditions are shown in
Figure 9.1.11. During baseline operation, the burners are tilted -15° with respect to the horizontal.
It should be noted that the natural swirl for the tangentially fired unit is counter clockwise. The two
planes represented in the figure are with respect to the right-hand side wall. Flow in the near field is
front to back and is supplied from the left-hand side burner packs. As the flow approaches the nose
elevation, gases flow from the front wall and enter the convective sections without contributing
much mass to the recirculations zones in the upper furnace. Flow in the far plane is supplied from
the right-hand side burner packs. The flow field on the far plane is more heavily effected by the
nose and provides some mass in the upper furnace recirculation zones. From the right-hand side,
gases flow under the nose and enter the far plane from back to front. Gases are then distributed into
the center and left side portions of the convective pass entrance. Some mass is entrained into the
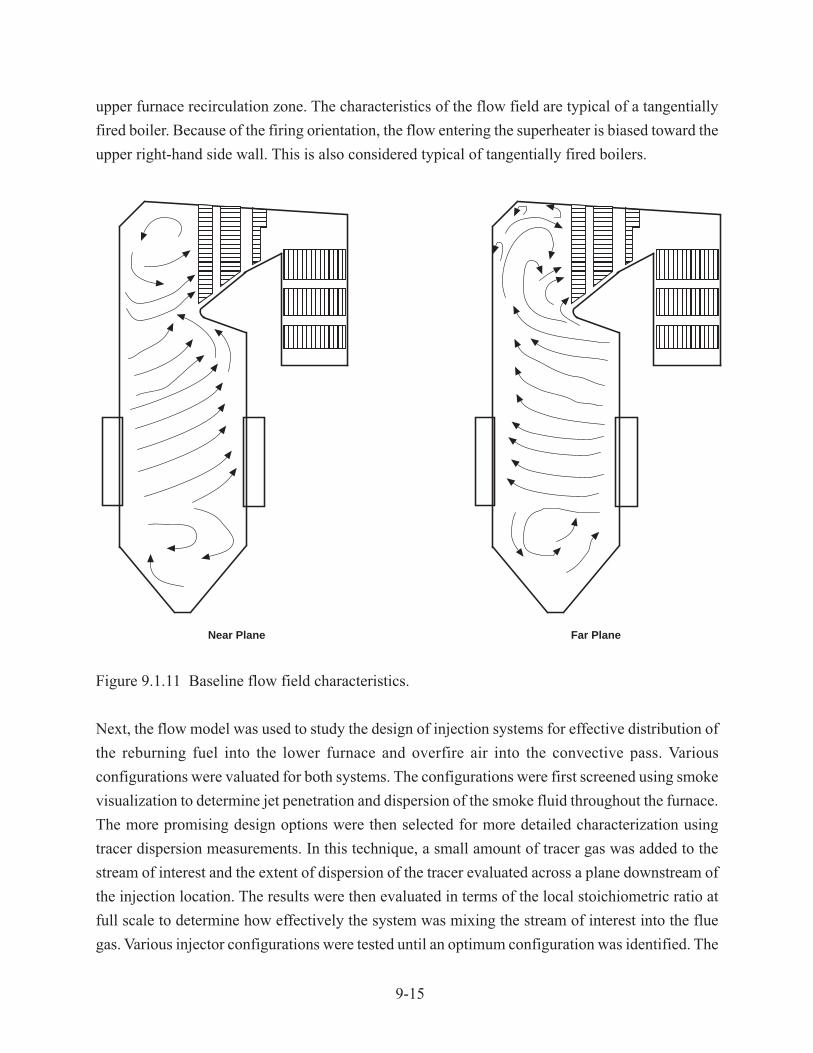
9-15
upper furnace recirculation zone. The characteristics of the flow field are typical of a tangentially
fired boiler. Because of the firing orientation, the flow entering the superheater is biased toward the
upper right-hand side wall. This is also considered typical of tangentially fired boilers.
Figure 9.1.11 Baseline flow field characteristics.
Next, the flow model was used to study the design of injection systems for effective distribution of
the reburning fuel into the lower furnace and overfire air into the convective pass. Various
configurations were valuated for both systems. The configurations were first screened using smoke
visualization to determine jet penetration and dispersion of the smoke fluid throughout the furnace.
The more promising design options were then selected for more detailed characterization using
tracer dispersion measurements. In this technique, a small amount of tracer gas was added to the
stream of interest and the extent of dispersion of the tracer evaluated across a plane downstream of
the injection location. The results were then evaluated in terms of the local stoichiometric ratio at
full scale to determine how effectively the system was mixing the stream of interest into the flue
gas. Various injector configurations were tested until an optimum configuration was identified. The
Near Plane Far Plane
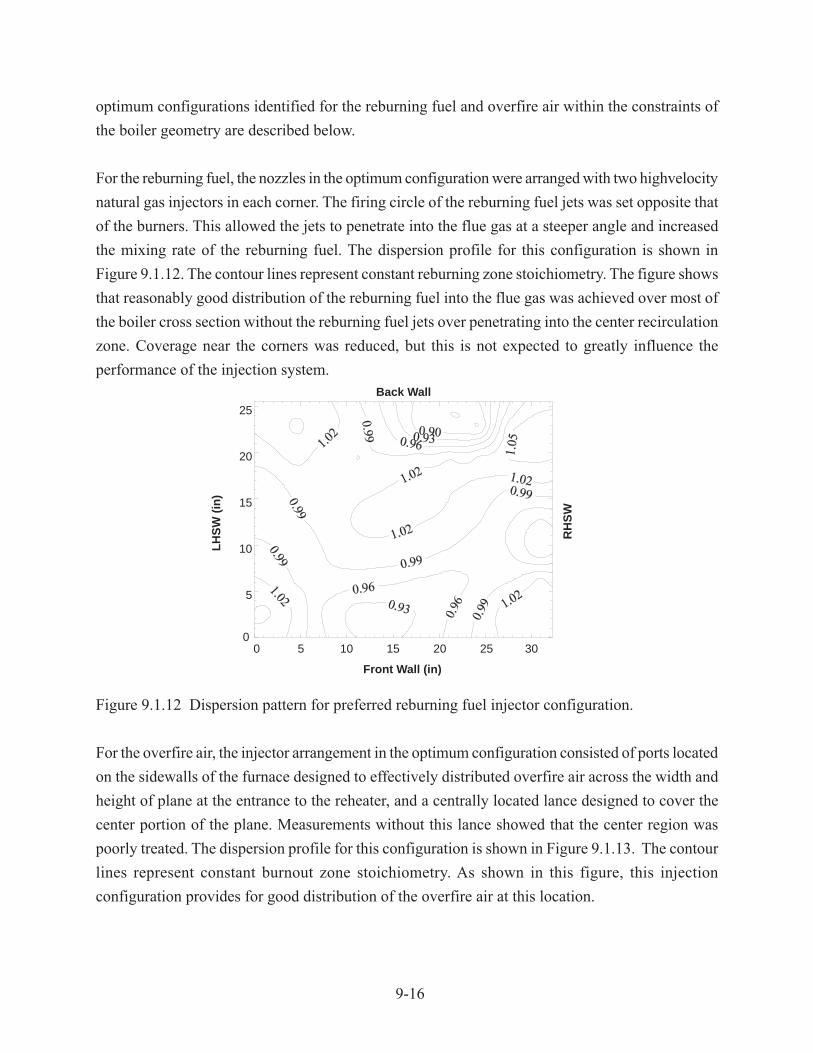
9-16
optimum configurations identified for the reburning fuel and overfire air within the constraints of
the boiler geometry are described below.
For the reburning fuel, the nozzles in the optimum configuration were arranged with two highvelocity
natural gas injectors in each corner. The firing circle of the reburning fuel jets was set opposite that
of the burners. This allowed the jets to penetrate into the flue gas at a steeper angle and increased
the mixing rate of the reburning fuel. The dispersion profile for this configuration is shown in
Figure 9.1.12. The contour lines represent constant reburning zone stoichiometry. The figure shows
that reasonably good distribution of the reburning fuel into the flue gas was achieved over most of
the boiler cross section without the reburning fuel jets over penetrating into the center recirculation
zone. Coverage near the corners was reduced, but this is not expected to greatly influence the
performance of the injection system.
Figure 9.1.12 Dispersion pattern for preferred reburning fuel injector configuration.
For the overfire air, the injector arrangement in the optimum configuration consisted of ports located
on the sidewalls of the furnace designed to effectively distributed overfire air across the width and
height of plane at the entrance to the reheater, and a centrally located lance designed to cover the
center portion of the plane. Measurements without this lance showed that the center region was
poorly treated. The dispersion profile for this configuration is shown in Figure 9.1.13. The contour
lines represent constant burnout zone stoichiometry. As shown in this figure, this injection
configuration provides for good distribution of the overfire air at this location.
0 5 10 15 20 25 300
5
10
15
20
25
Front Wall (in)
Back Wall
RH
SW
LHS
W (
in)

9-17
Figure 9.1.13 Dispersion pattern for preferred overfire air port configuration.
For injection of the nitrogen-based reagent in the AR processes, the approach used to inject the
reagent depends upon the process used. For the AR-Lean process, the preferred approach would be
to inject the reagent with the overfire air stream thereby allowing the momentum of the air jets to
transport and mix the reagent with the flue gas. For the AR-Rich process, the regent would need to
be injected in front of the secondary superheater either from lances placed into the gas flow or from
high-velocity wall jets. For the MIAR process, a portion of the reagent would be injected with the
overfire air, and a portion would be injected using lances or wall jets. For the case study boiler,
injection of the reagent along with the overfire air would be an effective means of mixing the
reagent into the flue gas. As shown in Figure 9.1.13, good mixing of the overfire air can be achieved
with a design that consists of wall injectors and an in-furnace distribution header. Therefore, it is
expected that any reagent injected with the overfire air would be mixed well into the flue gas.
Effective distribution of reagent into the flue gases entering the secondary superheater on the case
study boiler is complicated by the complex structure of the flue gas flow in this region. Although
wall jets have been effectively used for injection of SNCR agents on utility boilers, it is not believed
that this approach is applicable to the features of the flow field shown in Figure 9.1.11. In addition,
the use of air to assist with injection of the reagent would be detrimental to the process and the use
of steam would be undesirable from a boiler performance standpoint. Therefore, for this application,
the use of lances inserted into the flow would be the preferred means of injecting reagent for the
AR-Rich and MIAR processes. It should be noted that lance-based SNCR systems have been used
successfully in a number of utility applications. For the case study boiler, design calculations suggest
that a lance system consisting of five lances inserted into the gas flow from each sidewall in front of
0 5 10 15 20 25 30Distance Along Nose (in)
0
2
4
6
8
10
12Le
ft S
ide
Wal
l (in
)

9-18
the secondary superheater could achieve adequate distribution of the reagent. Each lance would be
equipped with approximately six nozzles for reagent atomization. The nozzles would need to generate
droplets with a size less than 100 microns in order to ensure rapid droplet evaporation.
In summary, the results of injection system analysis indicate that good mixing of the process streams
necessary to implement advanced reburning (AR-Lean, AR-Rich, and MIAR) on the case study
boiler can be achieved. Natural gas can be injected from each wall in a pattern which achieves good
distribution of the reburning fuel. Overfire air injection into a cavity in the convective pass, needed
for implementation of each of the AR processes under consideration, can be achieved using high
pressure wall jets. For the AR-Lean and MIAR processes, these ports can also be used to inject the
reagent. Injection of reagent into the upper furnace, needed for the AR-Rich and MIAR processes,
can be achieved using a lance-based system.
9.1.5 Full Scale Performance Prediction
This section of the report presents the results of an analysis of the potential NOx reduction levels
which are expected to be achievable by the application of the SGAR processes to the case study
boiler. The NOx projections presented herein were developed based upon the boiler emissions
characteristics (i.e., sensitivity towards load, excess air and boiler operating conditions), the results
of the flow model studies, and the estimated thermal characteristics of the boiler. These projections
were developed by applying EER’s process models and database on performance of SGAR processes
at pilot scale to the information generated in this study. The NOx projections attempt to take into
account all of the various parameters (temperature, residence time, stoichiometry, initial NOx level,
reburning fuel and reagent mixing, etc.) which are believed to have the most significant influence
on the performance of the reburning process.
Baseline NOx emissions for the case study boiler at full load are approximately 340 ppm, 3% O2.
For the use of 10% natural gas as a reburning fuel, NOx emissions could be reduced to 187 ppm,
which represents a reduction in baseline emissions of 45%. By applying AR-Lean, EER projects
that NOx emissions could be reduced to approximately 74 ppm, which represents a reduction in
baseline emissions of 78%. The use of AR-Rich and MIAR on this unit is expected to result in NOx
emissions levels of respectively, 45 and 30 ppm. For AR-Rich, this emissions level corresponds to
87% control from baseline conditions, and for MIAR, it corresponds to 91% control. Additional
NOx reduction can be achieved with the use of promoters. These estimates of the potential NOx
control levels achievable with the implementation of AR processes on the case study boiler are
expected to be representative of the levels which could potentially be achieved with a properly
designed and operating reburning system on the unit used in the study. The performance achievable
9-19
on other units would be sensitive to the NOx emissions and operating characteristics of the boiler,
and would need to be evaluated on a site specific basis.
9.2 AR Application
This subsection discusses the conversion of the process design presented in the previous subsection
into retrofit hardware for the AR-Lean system and discusses the results of initial AR-Lean tests as
well as tests of some of the SGAR components.
The unit is Greenidge Unit 4, which is owned and operated by New York State Electric and Gas
(NYSEG). All of NYSEG’s units are located within the North East Ozone Transport Region
(NEOTR) and as a result are subject to Title 1 NOx control requirements. (See subsection 9.3 for
additional information on the regulations.) NYSEG’s compliance plan involves a system-wide
daily cap on NOx emissions. After considering a number of alternatives, NYSEG decided to utilize
reburning and AR-Lean for NOx control at Greenidge. EER installed the gas reburning system as
part of a commercial project with guaranteed performance. The upgrade to AR-Lean was conducted
as a cooperatively funded demonstration project with the support of NYSEG and a number of
cofunding organizations including the Electric Power Research Institute, Empire State Electric
Energy Research Corporation, Gas Research Institute, Gaz de France, New York State Energy
Research & Development Authority, and Orange & Rockland Utilities.
The AR-Lean process design specifications for the location and size of the reburning gas, furnace
overfire air, and convective pass overfire air (discussed in the previous section) were utilized to
prepare an engineering retrofit design. Figure 9.2.1 is an isometric view of the unit showing the
arrangement of the gas reburning and AR-Lean components external to the furnace.

9-20
Figure 9.2.1 Isometric view of Greenridge Unite 4 showing gas reburning and AR-Lean componentsexternal to the boiler.
The gas injectors were corner mounted and consisted of multiple injectors in each corner with a
surrounding cooling air passage. The multiple gas injector approach allows independent control of
the quantity of reburn fuel and the injection velocity. The natural gas valve train included pressure
reduction, double block and bleed shutoff control, and flowrate control valves.
The furnace OFA ports were corner mounted above the reburn injectors but below the furnace nose.
The OFA for these ports was supplied by takeoffs from the top of the burner windbox. Although
this tangentially fired unit operates at a relatively low windbox to furnace pressure differential, the
differential was sufficient to achieve the design air injection velocities. The overfire air flow was
controlled by dampers.
To achieve the required rapid and complete mixing of the convective pass OFA with the furnace
gases in the narrow space between the convective surfaces, air was injected from side wall ports as
well as a header in the center extending downward from the boiler penthouse. The windbox to
furnace pressure differential was insufficient to produce the design point velocity. To boost the
pressure, two fans were installed between the windbox and the convective pass overfire air supply
headers.
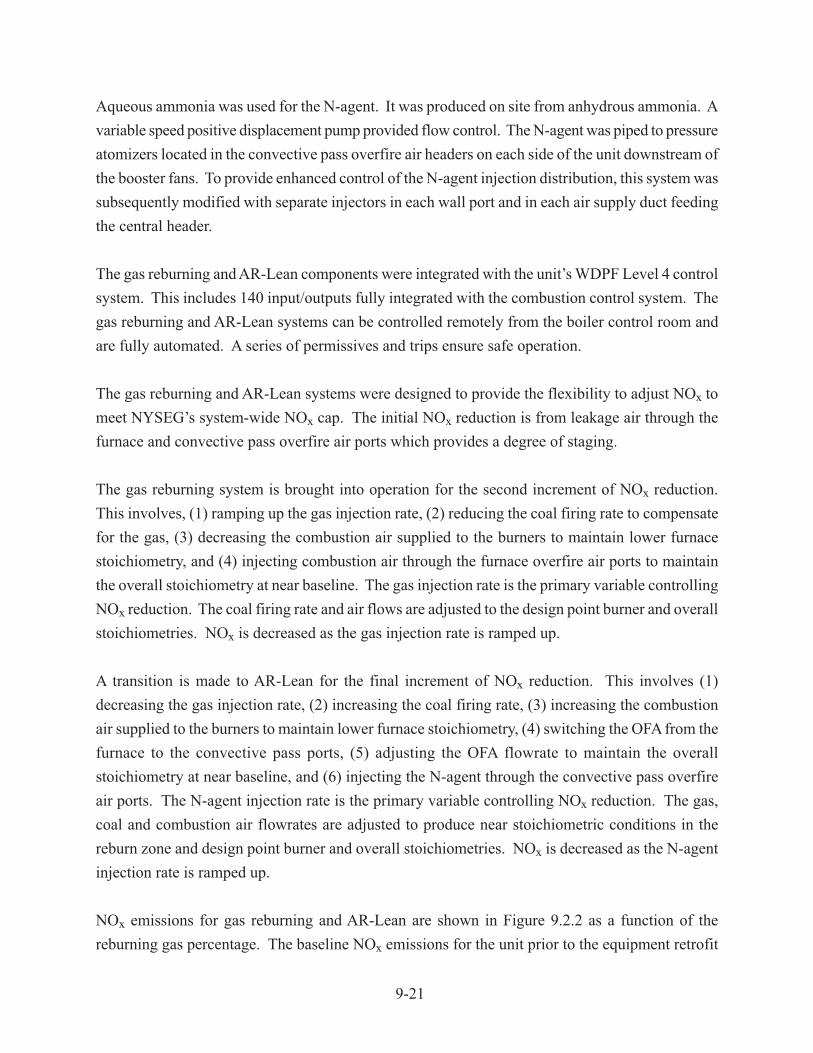
9-21
Aqueous ammonia was used for the N-agent. It was produced on site from anhydrous ammonia. A
variable speed positive displacement pump provided flow control. The N-agent was piped to pressure
atomizers located in the convective pass overfire air headers on each side of the unit downstream of
the booster fans. To provide enhanced control of the N-agent injection distribution, this system was
subsequently modified with separate injectors in each wall port and in each air supply duct feeding
the central header.
The gas reburning and AR-Lean components were integrated with the unit’s WDPF Level 4 control
system. This includes 140 input/outputs fully integrated with the combustion control system. The
gas reburning and AR-Lean systems can be controlled remotely from the boiler control room and
are fully automated. A series of permissives and trips ensure safe operation.
The gas reburning and AR-Lean systems were designed to provide the flexibility to adjust NOx to
meet NYSEG’s system-wide NOx cap. The initial NOx reduction is from leakage air through the
furnace and convective pass overfire air ports which provides a degree of staging.
The gas reburning system is brought into operation for the second increment of NOx reduction.
This involves, (1) ramping up the gas injection rate, (2) reducing the coal firing rate to compensate
for the gas, (3) decreasing the combustion air supplied to the burners to maintain lower furnace
stoichiometry, and (4) injecting combustion air through the furnace overfire air ports to maintain
the overall stoichiometry at near baseline. The gas injection rate is the primary variable controlling
NOx reduction. The coal firing rate and air flows are adjusted to the design point burner and overall
stoichiometries. NOx is decreased as the gas injection rate is ramped up.
A transition is made to AR-Lean for the final increment of NOx reduction. This involves (1)
decreasing the gas injection rate, (2) increasing the coal firing rate, (3) increasing the combustion
air supplied to the burners to maintain lower furnace stoichiometry, (4) switching the OFA from the
furnace to the convective pass ports, (5) adjusting the OFA flowrate to maintain the overall
stoichiometry at near baseline, and (6) injecting the N-agent through the convective pass overfire
air ports. The N-agent injection rate is the primary variable controlling NOx reduction. The gas,
coal and combustion air flowrates are adjusted to produce near stoichiometric conditions in the
reburn zone and design point burner and overall stoichiometries. NOx is decreased as the N-agent
injection rate is ramped up.
NOx emissions for gas reburning and AR-Lean are shown in Figure 9.2.2 as a function of the
reburning gas percentage. The baseline NOx emissions for the unit prior to the equipment retrofit
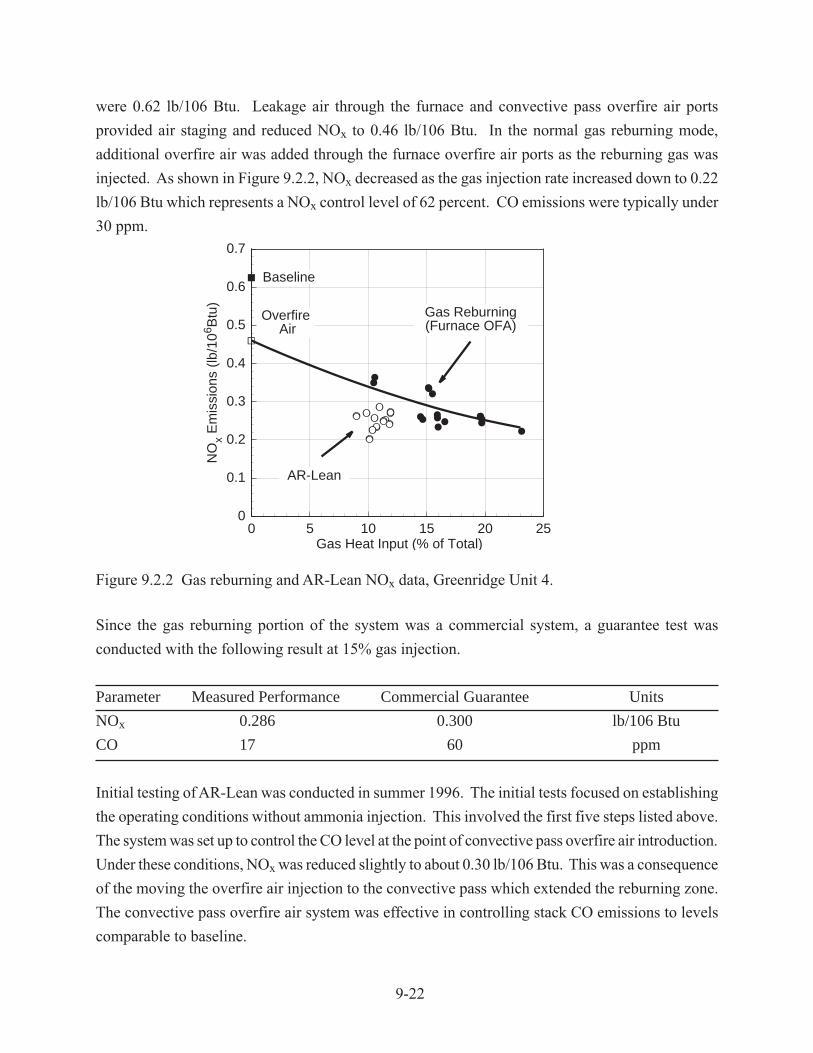
9-22
were 0.62 lb/106 Btu. Leakage air through the furnace and convective pass overfire air ports
provided air staging and reduced NOx to 0.46 lb/106 Btu. In the normal gas reburning mode,
additional overfire air was added through the furnace overfire air ports as the reburning gas was
injected. As shown in Figure 9.2.2, NOx decreased as the gas injection rate increased down to 0.22
lb/106 Btu which represents a NOx control level of 62 percent. CO emissions were typically under
30 ppm.
Figure 9.2.2 Gas reburning and AR-Lean NOx data, Greenridge Unit 4.
Since the gas reburning portion of the system was a commercial system, a guarantee test was
conducted with the following result at 15% gas injection.
Parameter Measured Performance Commercial Guarantee Units
NOx 0.286 0.300 lb/106 Btu
CO 17 60 ppm
Initial testing of AR-Lean was conducted in summer 1996. The initial tests focused on establishing
the operating conditions without ammonia injection. This involved the first five steps listed above.
The system was set up to control the CO level at the point of convective pass overfire air introduction.
Under these conditions, NOx was reduced slightly to about 0.30 lb/106 Btu. This was a consequence
of the moving the overfire air injection to the convective pass which extended the reburning zone.
The convective pass overfire air system was effective in controlling stack CO emissions to levels
comparable to baseline.
B
J
J
J
J
J JJJ
J
JJ
JJ
J
J
J
G
0
0.1
0.2
0.3
0.4
0.5
0.6
0.7
0 5 10 15 20 25
NO
x E
mis
sion
s (lb
/106 B
tu)
Gas Heat Input (% of Total)
AR-Lean
Baseline
Overfire Air
Gas Reburning(Furnace OFA)
9-23
The next test series involved ramping up the N-agent injection (step six in the list above). As the N-
agent injection was increased, NOx decreased, as expected. Figure 9.2.2 shows the AR-Lean NOx
data superimposed on the gas reburning data illustrating the lower NOx emissions achieved at
nominally 10% gas firing. In these AR-Lean tests, minimum NOx was constrained by NH3 emissions
to 0.19 lb/106 Btu. This was unexpected and was traced to non-uniform conditions in the reburning
zone as discussed below.
In conventional N-agent injection without reburning, the temperature window is narrow: injection
within the window reduces NOx with minimum NH3 emissions; injection on the hot side of the
temperature window may increase NOx but with minimal NH3 emissions; injection on the cold side
of the temperature window achieves less NOx reduction and produces NH3 emissions. With AR-
Lean, CO oxidation occurs in parallel with the NH3 reactions effectively broadening the temperature
window on the cold side. During these AR-Lean tests, the CO level in the reburning zone was in
the range expected to broaden the temperature window to lower temperatures, on the order of
several thousand ppm. CO measured in the boiler exhaust was typically less than 50 ppm indicating
excellent CO burnout. While the overall CO levels and burnout were on design, probe measurements
in the upper furnace showed considerable CO stratification. In some regions the furnace gases had
low CO and excess O2. In other areas while CO was on design, O2 was also present indicating
streamwise stratification or poor micro-mixing. This stratification accounts for the NOx emission
reduction and NH3 emissions. That portion of the furnace flow with low CO and excess O2 was not
producing the temperature window broadening and this resulted in excess NH3 emissions limiting
the maximum NH3 injection rate and hence NOx reduction.
These Greenidge tests have revealed an important AR issue: the uniformity of conditions in the
reburning zone is important to the optimization of the AR process. In small scale tests, the furnace
flow is fairly well mixed so that this stratification effect is not significant. However, stratification
may be the limiting factor in full scale applications.
Once this stratification effect was understood, additional tests were conducted at Greenidge to
improve performance. The focus of testing in summer 1997 was on adjusting the AR-Lean system
to provide more uniform reburn zone conditions. This included: (1) burner balancing, (2)
modification of the gas injectors to reduce stratification and enhance the micro-mixing of the fuel
and air so as to avoid regions of excessively rich or lean conditions, and (3) reduction of leakage air
through the furnace overfire air ports. In addition, the N-agent injectors were modified to allow the
tailoring of the distribution of the N-agent among the convective pass overfire air injectors. These
changes have resulted in improved performance and additional NOx reduction with lower NH3 slip.
9-24
In addition to these AR-Lean tests, opportunity was taken to obtain larger scale data on several of
the SGAR components. It should be noted that the Greenidge unit was set up only for AR-Lean and
the furnace penetrations available in the unit were not optimum for the other SGAR configurations.
A series of tests were conducted in Summer 1997 to evaluate the following SGAR components:
• N-agent injection downstream of the overfire air In these tests, the gas reburning
system was operated in the normal mode using the furnace overfire air. The N-
agent was injected through a series of lances on the front wall above the overfire air
ports. Based on the process design studies, it was expected that these temporary N-
agent injectors would not produce a uniform distribution of N-agent across the fur-
nace and that the furnace temperature would be too hot for effective SNCR opera-
tion. The tests confirmed these predictions. Only modest NOx reduction was achieved
and NH3 slip was minimal.
• N-agent Injection into the reburn zone This SGAR component was tested by oper-
ating the system in the AR-Lean configuration using the convective pass overfire air
ports. The N-agent was injected through the same furnace lances described above.
While this injection location was not optimum, it provided some initial data on AR-
Rich conditions. These tests will continue through fall 1997.
• Multiple N-agent injection Limited tests were also conducted with injection both
through the furnace lances and through the convective pass injectors. Again, the
tests do not represent an optimum MIAR configuration. However, they allow a
preliminary evaluation of multiple injection and the ability to stratify the N-agent
injection for the stratified furnace flow conditions.
If this project proceeds to Phase II, these large scale tests will continue in summer 1998. Alternate
injection arrangements and promoters are expected to be tested.
9.3 Economic and Market Analysis
This section discusses the economics of NOx control via AR and the potential market for the AR
technologies in the US for compliance under the 1990 CAAA. The following subsection 9.3.1
discusses the market drivers and the nominal NOx control requirements to meet existing and projected
regulations (see also Section 3.1). Then, Section 9.3.2 outlines an economic methodology for
comparing cost effectiveness of conventional and AR technologies and defines two representative

9-25
applications, cyclone and wall-fired boilers. The methodology was uses to compare the costs of
conventional NOx controls (SNCR, SCR and OFA) with the costs of reburning based technologies
including basic reburning and the full range of AR technologies being developed in this project.
Subsection 9.3.3 discusses the cost and performance of each NOx control technology and Subsection
9.3.4 presents the results. The results show a considerable economic advantage for the AR
technologies particularly for deep NOx control with cost savings in the range of 50%. The resulting
market for these AR technologies is discussed in Subsection 9.3.5.
9.3.1 NOx Control Drivers
The Clean Air Act Amendment of 1990 (CAAA), established the framework for NOx emission
regulations to mitigate ozone non-attainment areas and acid rain. Over the last seven years, EPA
has developed most of the specific NOx regulations authorized by the CAAA. The most stringent
NOx controls are required in ozone non-attainment areas or areas which transport pollutants into
ozone non-attainment areas. In the Northeast, EPA has defined the Northeast Ozone Transport
Region (NEOTR) consisting of Pennsylvania and the States North and East. In that zone, NOx
reductions of up to 75% are required by 2003 with the potential for even deeper controls depending
on the results of modeling over the next few years. EPA is now considering expanding the NEOTR
to include Texas and all states North and East. In this 37 state region, it is projected that NOx
emissions may need to be reduced by as much as 85%.
As these specific regulations have developed, the trend has been towards cost effective emission
controls. Rather than setting specific limits for each plant, in many areas the regulations have been
established to provide the flexibility to over-control on some units and under-control on others if
that approach is cost effective. This can be of considerable advantage since the cost of NOx control
for some units (particularly smaller units) may be much higher than for others, on a $/ton basis.
This bubbling approach depends on the availability of NOx control technologies which can achieve
NOx reductions greater than the nominal control levels (75-85%) with low costs.
The NOx control requirements developed by EPA to date were based on the current National Ambient
Air Quality Standards (NAAQS). EPA has issued revised NAAQS for ozone and fine particulate
which are substantially lower. Since NOx is a precursor of both pollutants, achieving the new
NAAQS will require even greater NOx reductions.
Therefore, the goal established by DOE for this project, 95% NOx control down to 0.06 lb/106 Btu,
is appropriate. NOx control technologies which meet this goal will only be employed if their costs

9-26
are competitive with conventional controls on a $/ton basis. At present, the only commercial NOx
control technology capable of achieving such deep NOx control is SCR. The advantage of the AR
technologies being developed on this project is that they can provide the deep NOx control of SCR
at a considerable cost reduction.
9.3.2 Methodology and Cases Evaluated
To evaluate the cost effectiveness of the AR technologies, an economic analysis has been conducted
using the EPRI Technology Assessment Guide (TAG) methodology, which is widely used in the
utility industry to evaluate advanced emission control technologies. The TAG methodology calculates
the total levelized annual costs including capital and operating cost components. This can be expressed
in terms of $/ton of NOx controlled. The total installed cost (capital cost) of the NOX control
technology is estimated and distributed over the operating life in a series of uniform annual costs by
applying a Capital Recovery Factor (CRV). The CRV depends on the operating life, time value of
money, depreciation, etc. In this analysis, a CRV of 0.131 was utilized. This is equivalent to simple
amortization at an annual interest rate of 10% over a 15 year operating life. The annual operating
costs for the technology are calculated for the first year and then levelized over the life of the
technology by applying an annual levelization factor. In this TAG analysis, a constant dollar approach
was utilized so that the levelization factor is 1.0.
AR technologies can be applied to all types of combustion systems including the three most common
utility boilers (wall, tangential and cyclone fired). Two applications have been selected for the
economic evaluation: A cyclone fired boiler and a dry bottom wall fired unit equipped with low
NOx burners.
Reburning applications on cyclones are particularly attractive for several reasons:
1. The baseline NOx levels are high. Since NO
x is a reactant in the reburning reactions,
high baseline NOx increases the rate of NO
x reduction. Thus, the cost of NO
x con-
trol for units with high baseline NOx is low for reburning based technologies.
2. Furnace temperatures are high. High furnace temperatures improve reburning NOx
control since the reduction reactions are kinetically limited.
3. No other combustion modification NOx controls. Low NO
x burners and OFA ports
cannot be used with cyclones. This makes reburning based controls SNCR, and
SCR the only alternatives.
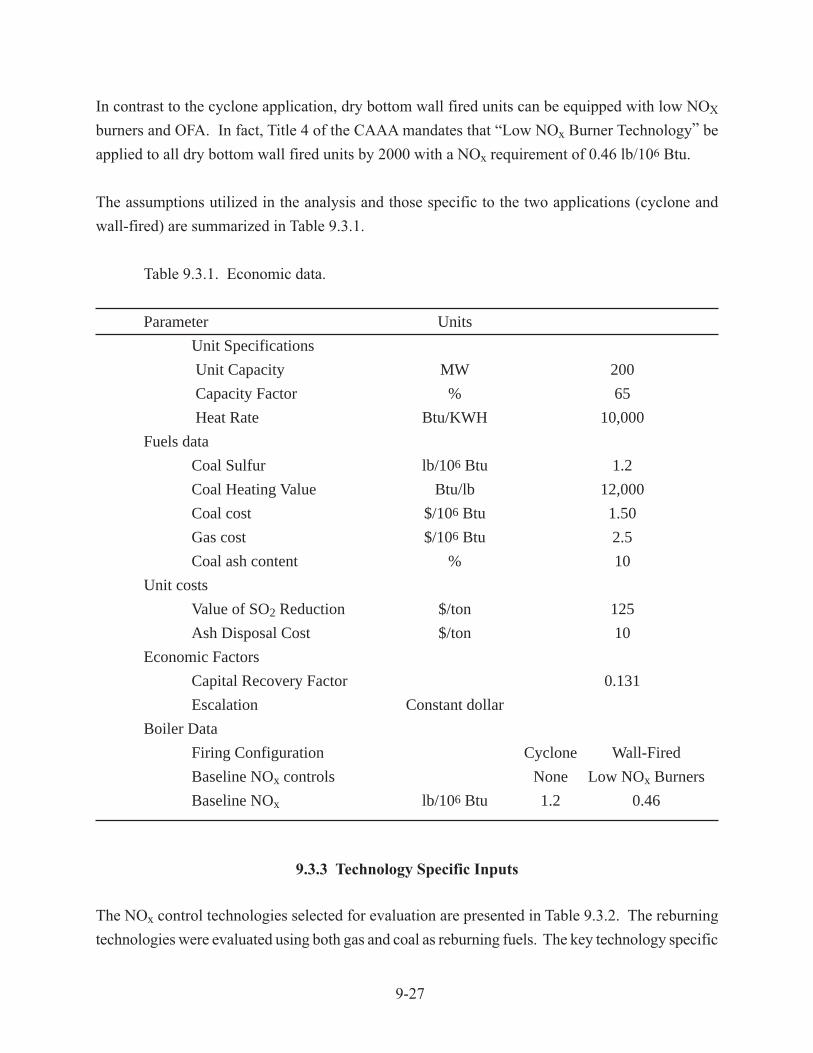
9-27
In contrast to the cyclone application, dry bottom wall fired units can be equipped with low NOX
burners and OFA. In fact, Title 4 of the CAAA mandates that “Low NOx Burner Technology” be
applied to all dry bottom wall fired units by 2000 with a NOx requirement of 0.46 lb/106 Btu.
The assumptions utilized in the analysis and those specific to the two applications (cyclone and
wall-fired) are summarized in Table 9.3.1.
Table 9.3.1. Economic data.
Parameter Units
Unit Specifications
Unit Capacity MW 200
Capacity Factor % 65
Heat Rate Btu/KWH 10,000
Fuels data
Coal Sulfur lb/106 Btu 1.2
Coal Heating Value Btu/lb 12,000
Coal cost $/106 Btu 1.50
Gas cost $/106 Btu 2.5
Coal ash content % 10
Unit costs
Value of SO2 Reduction $/ton 125
Ash Disposal Cost $/ton 10
Economic Factors
Capital Recovery Factor 0.131
Escalation Constant dollar
Boiler Data
Firing Configuration Cyclone Wall-Fired
Baseline NOx controls None Low NOx Burners
Baseline NOx lb/106 Btu 1.2 0.46
9.3.3 Technology Specific Inputs
The NOx control technologies selected for evaluation are presented in Table 9.3.2. The reburning
technologies were evaluated using both gas and coal as reburning fuels. The key technology specific
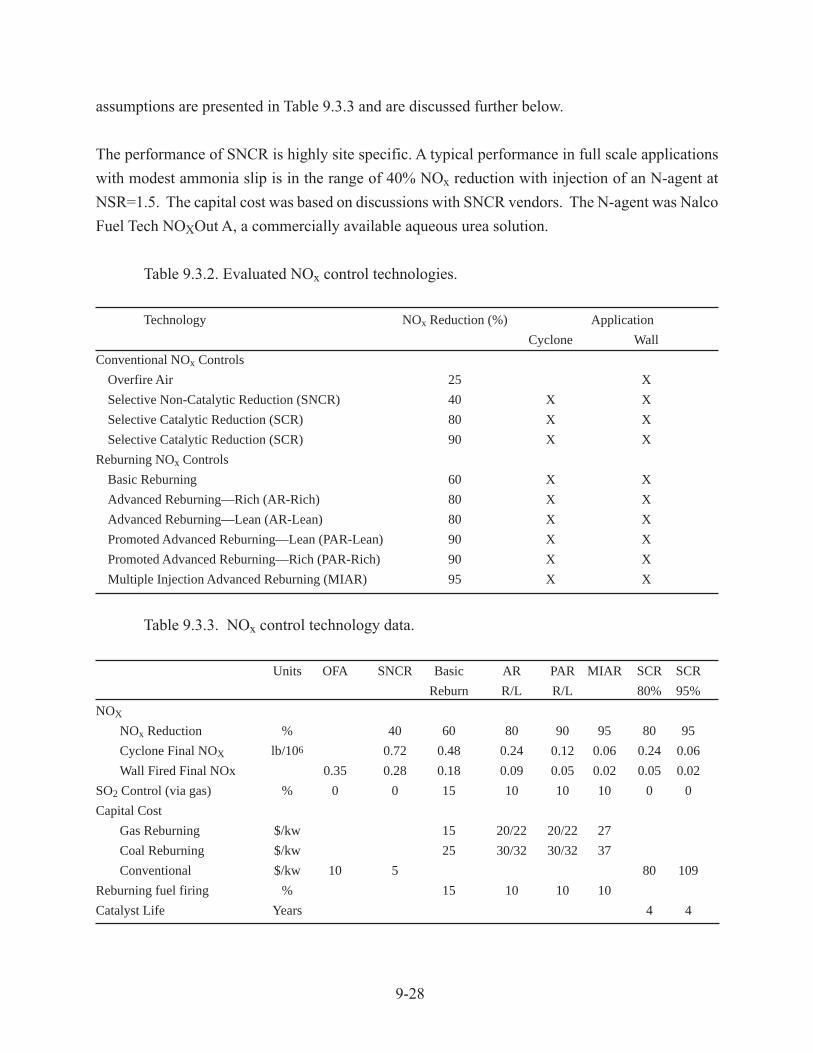
9-28
assumptions are presented in Table 9.3.3 and are discussed further below.
The performance of SNCR is highly site specific. A typical performance in full scale applications
with modest ammonia slip is in the range of 40% NOx reduction with injection of an N-agent at
NSR=1.5. The capital cost was based on discussions with SNCR vendors. The N-agent was Nalco
Fuel Tech NOXOut A, a commercially available aqueous urea solution.
Table 9.3.2. Evaluated NOx control technologies.
Technology NOx Reduction (%) Application
Cyclone Wall
Conventional NOx Controls
Overfire Air 25 X
Selective Non-Catalytic Reduction (SNCR) 40 X X
Selective Catalytic Reduction (SCR) 80 X X
Selective Catalytic Reduction (SCR) 90 X X
Reburning NOx Controls
Basic Reburning 60 X X
Advanced Reburning—Rich (AR-Rich) 80 X X
Advanced Reburning—Lean (AR-Lean) 80 X X
Promoted Advanced Reburning—Lean (PAR-Lean) 90 X X
Promoted Advanced Reburning—Rich (PAR-Rich) 90 X X
Multiple Injection Advanced Reburning (MIAR) 95 X X
Table 9.3.3. NOx control technology data.
Units OFA SNCR Basic AR PAR MIAR SCR SCR
Reburn R/L R/L 80% 95%
NOX
NOx Reduction % 40 60 80 90 95 80 95
Cyclone Final NOX lb/106 0.72 0.48 0.24 0.12 0.06 0.24 0.06
Wall Fired Final NOx 0.35 0.28 0.18 0.09 0.05 0.02 0.05 0.02
SO2 Control (via gas) % 0 0 15 10 10 10 0 0
Capital Cost
Gas Reburning $/kw 15 20/22 20/22 27
Coal Reburning $/kw 25 30/32 30/32 37
Conventional $/kw 10 5 80 109
Reburning fuel firing % 15 10 10 10
Catalyst Life Years 4 4
9-29
Costs and performance for SCR were obtained from an EPA report (Phase II NOx Control, 1996)
which presented DOE estimates for a high sulfur coal fired unit of 200 MW capacity with initial
NOx of 1.0 lb/106 Btu and 80% NOx reduction. These conditions were scaled to those utilized here.
Reburning costs and performance were based on EER’s extensive data base and the projected
performance of AR systems developed in this project. For the coal reburning systems, costs were
included for the pulverizers to produce the fine-grind (micronized) coal necessary to minimize
carbon loss. There is no incremental fuel cost (except for efficiency penalty) since the normal plant
coal is used for reburning. For gas reburning systems, no pulverizers are required, but the gas cost
is greater than coal. A differential of 1.00 $/106 Btu was assumed. It is assumed that coal and gas
reburning technologies can achieve comparable NOx reduction.
9.3.4 Economic Results
Figures 9.3.1 and 9.3.2 show the results of the economic comparison as plots of the total annual
cost of NOx reduction versus percentage NOx reduction. Lines of constant unit cost of NOx control
($/ton of NOx reduced) are also plotted as fans. As discussed above, the unit cost of NOx control is
the appropriate figure of merit since utilities will apply controls to a number of units, bubbling to
achieve the lowest total cost.
Figure 9.3.1 shows the cyclone results. The conventional NOx controls, SNCR and SCR have the
highest unit cost of NOx control in the range of 800-1100 $/ton. The reburning based technologies
are considerably lower in cost. Based on the assumptions used for this study, the costs for coal as
the reburning fuel are lower than for gas. However, it should be noted that site specific considerations
may favor gas in some situations. Factors favoring gas include a low gas-coal cost differential,
problems related to carbon loss which are more significant with coal as the reburning fuel, and
space limitations which make pulverizer installation expensive, difficult or impossible.
Figure 9.3.2 shows the wall fired results. Since the baseline NOx is lower than for the cyclone
application (0.46 versus 1.2 lb/106 Btu), the unit cost of NOx control is higher. As with the cyclone
results, the reburn technologies have a considerable cost advantage. OFA has been included for
this application (it cannot be applied to cyclone fired units). While the total annual cost of OFA is
low, the low NOx reduction (25%) results in higher unit cost of NOx control than all except the SCR
technologies. The lower baseline NOx for this application reduces the amount of N-agent required
improving the unit cost of NOx control for SNCR.
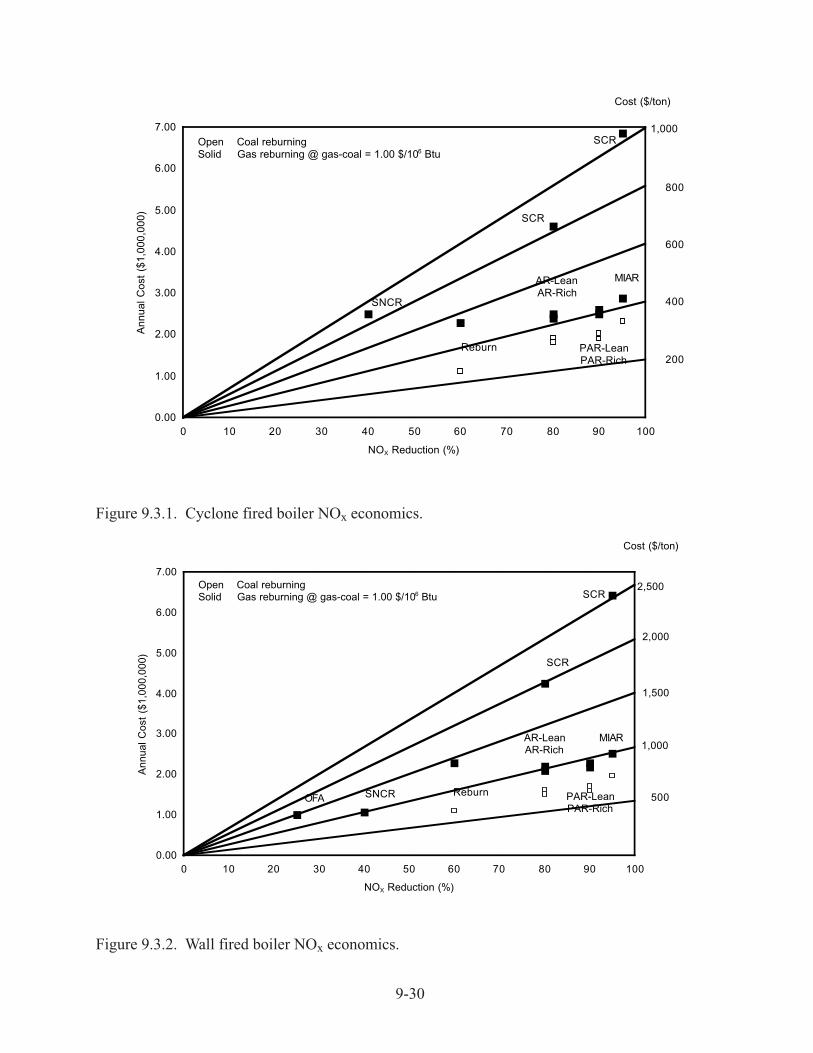
9-30
Figure 9.3.1. Cyclone fired boiler NOx economics.
Figure 9.3.2. Wall fired boiler NOx economics.
0.00
1.00
2.00
3.00
4.00
5.00
6.00
7.00
0 10 20 30 40 50 60 70 80 90 100
NOX Reduction (%)
An
nu
al
Co
st (
$1
,00
0,0
00
)
SCR
SNCR
PAR-LeanPAR-Rich
MIAR
Reburn
SCR
AR-LeanAR-Rich
200
400
600
800
1,000
Cost ($/ton)
Open Coal reburningSolid Gas reburning @ gas-coal = 1.00 $/106 Btu
Figure 11. Cyclone fired boiler NOx economics.
0.00
1.00
2.00
3.00
4.00
5.00
6.00
7.00
0 10 20 30 40 50 60 70 80 90 100
NOX Reduction (%)
An
nu
al
Co
st (
$1
,00
0,0
00
)
SCR
SNCR PAR-LeanPAR-Rich
MIAR
Reburn
SCR
AR-LeanAR-Rich
500
1,000
1,500
2,000
2,500
Cost ($/ton)
Open Coal reburningSolid Gas reburning @ gas-coal = 1.00 $/106 Btu
OFA
Figure 12. Wall fired boiler NOX control economics.

9-31
These results show the significant economic advantage of the technologies developed on this project
for the projected NOx control market characterized by deep NOx control and the potential for
bubbling. For example, in the cyclone application, the total annual cost of SNCR is comparable to
MIAR, but MIAR provides more than twice the NOx reduction.
Table 9.3.4 compares the deep control techniques for 80 and 95% NOx reduction. Both the coal
and gas reburning based AR technologies have considerable cost advantages over SCR in the range
of 48 to 69%. Under conditions of this analysis, 80% NOx reduction via AR is 1.9-2.9 times less
expensive than SCR, and 95% AR NOx reduction is 2.0-3.2 times less expensive than SCR.
Table 9.3.4. Comparing cost effectiveness for deep NOx control.
9.3.5 Market Assessment
The size of the market for AR technologies has been estimated by considering the existing and
projected CAAA regulations, the power plants affected by the regulations, and industry projections
for the mix of NOx control technologies necessary for cost effective compliance with these
regulations. The results are presented in Table 9.3.5 and are discussed below.
Cyclone, Baseline NOX 1.2 lb/106 Btu Wall, Baseline NOX 0.46 lb/106 BtuNOX Control 80% 95% 80% 95%
AR Technology AR-Rich MIAR AR-Rich MIAR106 $/yr $/ton NOX 106 $/yr $/ton NOX 106 $/yr $/ton NOX 106 $/yr $/ton NOX
CostsSCR 4.61 836 6.84 1,034 4.26 2,011 6.41 2,527AR (gas reburning) 2.39 433 2.88 440 2.08 986 2.52 1,000AR (coal reburning) 1.81 328 2.33 355 1.51 712 1.96 780
Cost ReductionAR (gas reburning) 48 58 51 61AR (coal reburning) 61 66 65 69
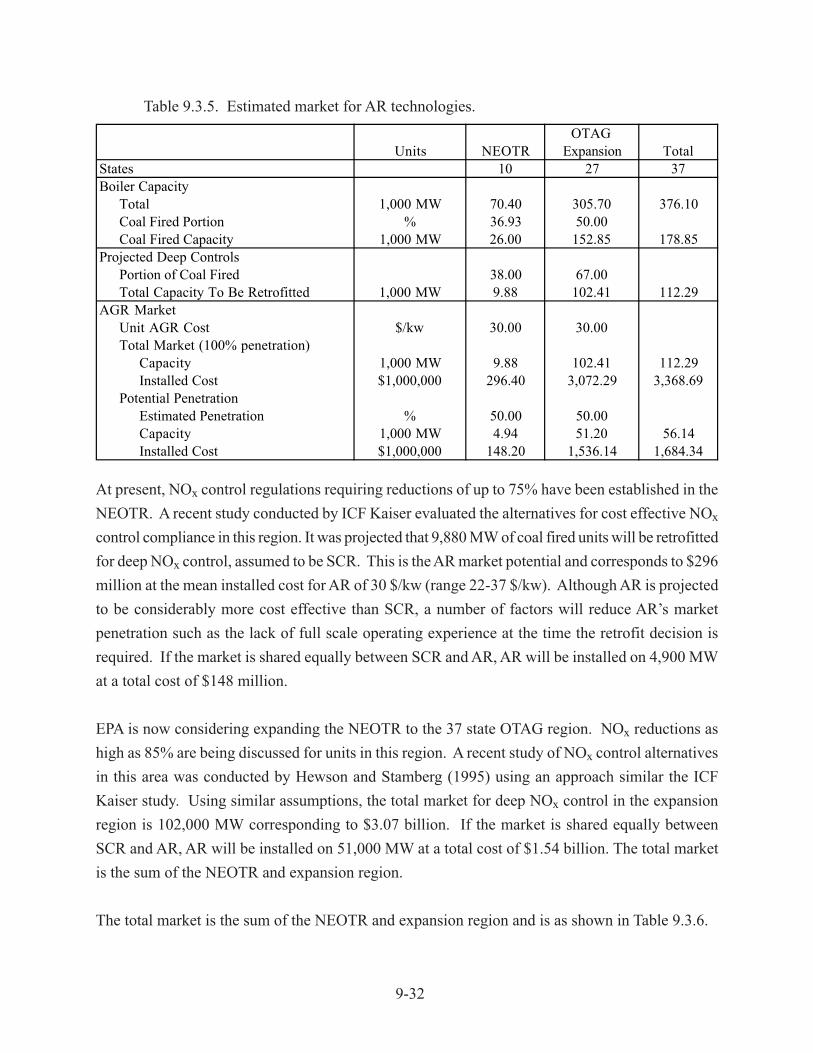
9-32
Table 9.3.5. Estimated market for AR technologies.
At present, NOx control regulations requiring reductions of up to 75% have been established in the
NEOTR. A recent study conducted by ICF Kaiser evaluated the alternatives for cost effective NOx
control compliance in this region. It was projected that 9,880 MW of coal fired units will be retrofitted
for deep NOx control, assumed to be SCR. This is the AR market potential and corresponds to $296
million at the mean installed cost for AR of 30 $/kw (range 22-37 $/kw). Although AR is projected
to be considerably more cost effective than SCR, a number of factors will reduce AR’s market
penetration such as the lack of full scale operating experience at the time the retrofit decision is
required. If the market is shared equally between SCR and AR, AR will be installed on 4,900 MW
at a total cost of $148 million.
EPA is now considering expanding the NEOTR to the 37 state OTAG region. NOx reductions as
high as 85% are being discussed for units in this region. A recent study of NOx control alternatives
in this area was conducted by Hewson and Stamberg (1995) using an approach similar the ICF
Kaiser study. Using similar assumptions, the total market for deep NOx control in the expansion
region is 102,000 MW corresponding to $3.07 billion. If the market is shared equally between
SCR and AR, AR will be installed on 51,000 MW at a total cost of $1.54 billion. The total market
is the sum of the NEOTR and expansion region.
The total market is the sum of the NEOTR and expansion region and is as shown in Table 9.3.6.
Units NEOTROTAG
Expansion TotalStates 10 27 37Boiler Capacity
Total 1,000 MW 70.40 305.70 376.10Coal Fired Portion % 36.93 50.00Coal Fired Capacity 1,000 MW 26.00 152.85 178.85
Projected Deep ControlsPortion of Coal Fired 38.00 67.00Total Capacity To Be Retrofitted 1,000 MW 9.88 102.41 112.29
AGR MarketUnit AGR Cost $/kw 30.00 30.00Total Market (100% penetration)
Capacity 1,000 MW 9.88 102.41 112.29Installed Cost $1,000,000 296.40 3,072.29 3,368.69
Potential PenetrationEstimated Penetration % 50.00 50.00Capacity 1,000 MW 4.94 51.20 56.14Installed Cost $1,000,000 148.20 1,536.14 1,684.34
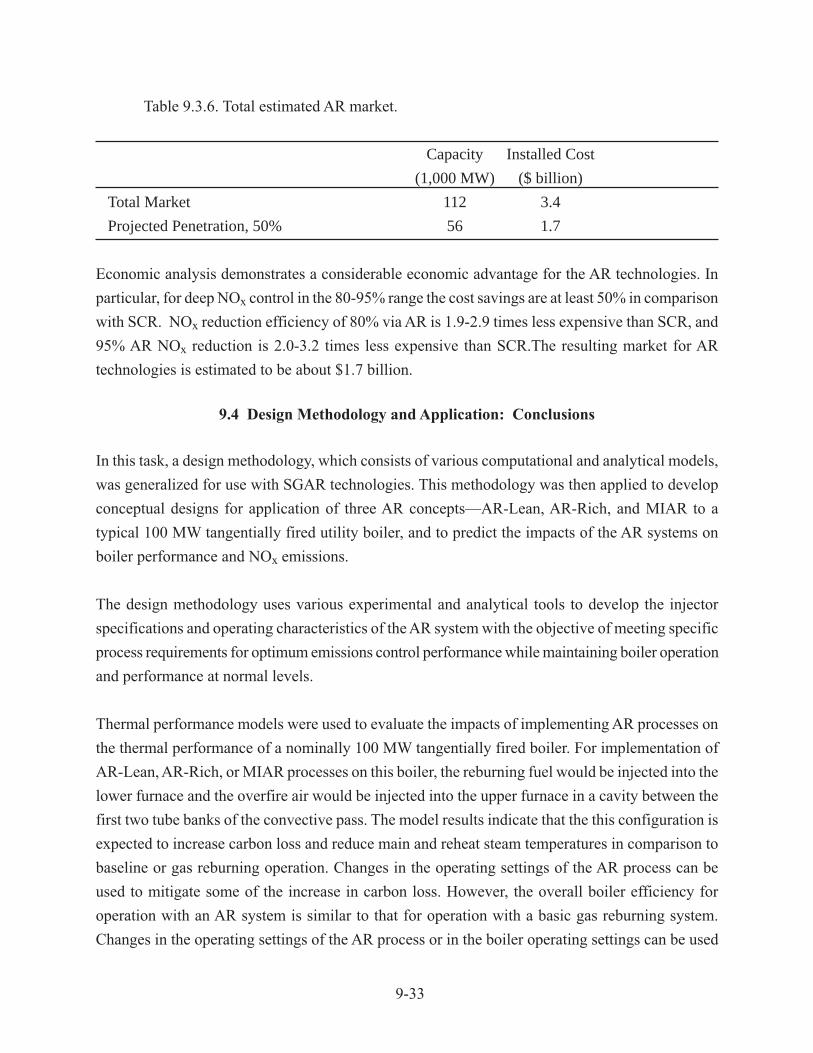
9-33
Table 9.3.6. Total estimated AR market.
Capacity Installed Cost
(1,000 MW) ($ billion)
Total Market 112 3.4
Projected Penetration, 50% 56 1.7
Economic analysis demonstrates a considerable economic advantage for the AR technologies. In
particular, for deep NOx control in the 80-95% range the cost savings are at least 50% in comparison
with SCR. NOx reduction efficiency of 80% via AR is 1.9-2.9 times less expensive than SCR, and
95% AR NOx reduction is 2.0-3.2 times less expensive than SCR.The resulting market for AR
technologies is estimated to be about $1.7 billion.
9.4 Design Methodology and Application: Conclusions
In this task, a design methodology, which consists of various computational and analytical models,
was generalized for use with SGAR technologies. This methodology was then applied to develop
conceptual designs for application of three AR concepts—AR-Lean, AR-Rich, and MIAR to a
typical 100 MW tangentially fired utility boiler, and to predict the impacts of the AR systems on
boiler performance and NOx emissions.
The design methodology uses various experimental and analytical tools to develop the injector
specifications and operating characteristics of the AR system with the objective of meeting specific
process requirements for optimum emissions control performance while maintaining boiler operation
and performance at normal levels.
Thermal performance models were used to evaluate the impacts of implementing AR processes on
the thermal performance of a nominally 100 MW tangentially fired boiler. For implementation of
AR-Lean, AR-Rich, or MIAR processes on this boiler, the reburning fuel would be injected into the
lower furnace and the overfire air would be injected into the upper furnace in a cavity between the
first two tube banks of the convective pass. The model results indicate that the this configuration is
expected to increase carbon loss and reduce main and reheat steam temperatures in comparison to
baseline or gas reburning operation. Changes in the operating settings of the AR process can be
used to mitigate some of the increase in carbon loss. However, the overall boiler efficiency for
operation with an AR system is similar to that for operation with a basic gas reburning system.
Changes in the operating settings of the AR process or in the boiler operating settings can be used
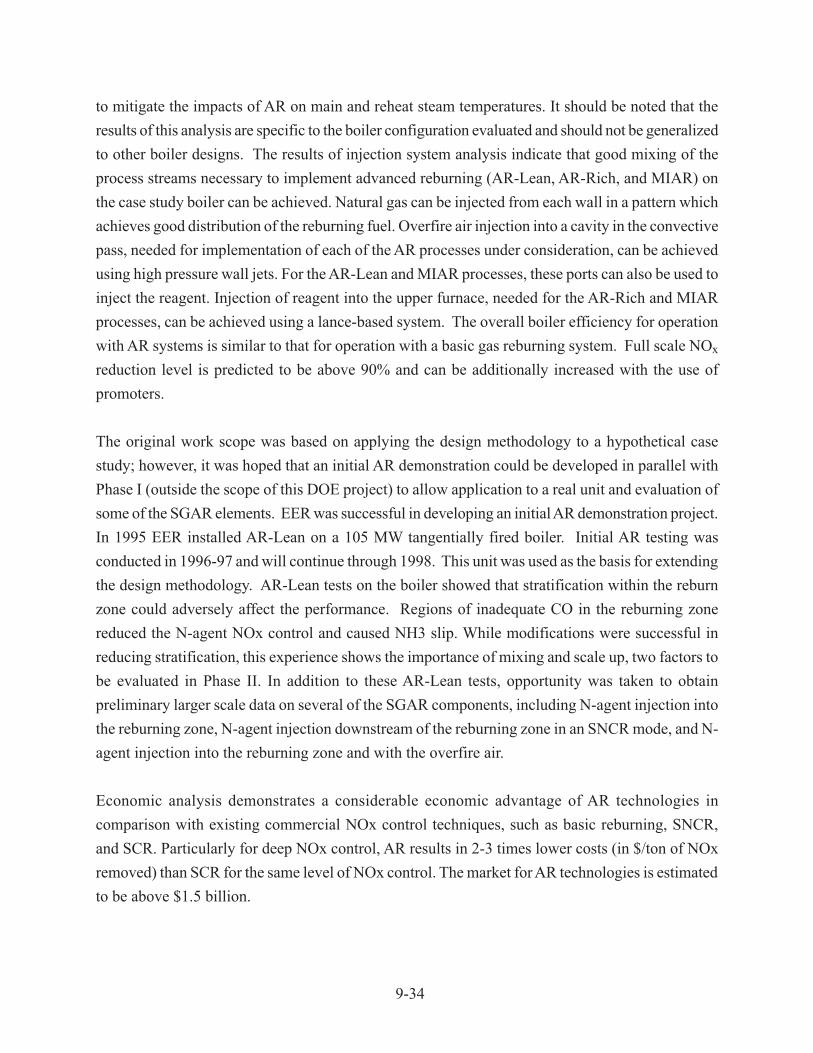
9-34
to mitigate the impacts of AR on main and reheat steam temperatures. It should be noted that the
results of this analysis are specific to the boiler configuration evaluated and should not be generalized
to other boiler designs. The results of injection system analysis indicate that good mixing of the
process streams necessary to implement advanced reburning (AR-Lean, AR-Rich, and MIAR) on
the case study boiler can be achieved. Natural gas can be injected from each wall in a pattern which
achieves good distribution of the reburning fuel. Overfire air injection into a cavity in the convective
pass, needed for implementation of each of the AR processes under consideration, can be achieved
using high pressure wall jets. For the AR-Lean and MIAR processes, these ports can also be used to
inject the reagent. Injection of reagent into the upper furnace, needed for the AR-Rich and MIAR
processes, can be achieved using a lance-based system. The overall boiler efficiency for operation
with AR systems is similar to that for operation with a basic gas reburning system. Full scale NOx
reduction level is predicted to be above 90% and can be additionally increased with the use of
promoters.
The original work scope was based on applying the design methodology to a hypothetical case
study; however, it was hoped that an initial AR demonstration could be developed in parallel with
Phase I (outside the scope of this DOE project) to allow application to a real unit and evaluation of
some of the SGAR elements. EER was successful in developing an initial AR demonstration project.
In 1995 EER installed AR-Lean on a 105 MW tangentially fired boiler. Initial AR testing was
conducted in 1996-97 and will continue through 1998. This unit was used as the basis for extending
the design methodology. AR-Lean tests on the boiler showed that stratification within the reburn
zone could adversely affect the performance. Regions of inadequate CO in the reburning zone
reduced the N-agent NOx control and caused NH3 slip. While modifications were successful in
reducing stratification, this experience shows the importance of mixing and scale up, two factors to
be evaluated in Phase II. In addition to these AR-Lean tests, opportunity was taken to obtain
preliminary larger scale data on several of the SGAR components, including N-agent injection into
the reburning zone, N-agent injection downstream of the reburning zone in an SNCR mode, and N-
agent injection into the reburning zone and with the overfire air.
Economic analysis demonstrates a considerable economic advantage of AR technologies in
comparison with existing commercial NOx control techniques, such as basic reburning, SNCR,
and SCR. Particularly for deep NOx control, AR results in 2-3 times lower costs (in $/ton of NOx
removed) than SCR for the same level of NOx control. The market for AR technologies is estimated
to be above $1.5 billion.

10.0 CONCLUSIONS
1. This project is developing novel AR concepts for high efficiency and low cost NOx
control from coal fired utility boilers. AR technologies are based on a combination of basic
reburning and N-agent/promoter injection. All Phase I project objectives have been met or
exceeded, and it was demonstrated that the AR technologies can provide effective NOx control
for coal fired combustors. Three technologies were originally envisioned for development:
AR-Lean, AR-Rich, and MIAR. Along with these, three additional technologies were identified
during the project: reburning plus promoted SNCR, AR-Lean plus promoted SNCR, and
AR-Rich plus promoted SNCR. These six SGAR configurations differ primarily in the
N-agent/promoter injection components. Various components can be selected to tailor the SGAR
system to site specific boiler design and NOx control requirements.
2. Bench scale combustion tests in the 20 kW facility demonstrated NOx reduction of
86%, 88%, and 91% for AR-Lean, AR-Rich, and MIAR, respectively. These levels of NOx
control can be achieved with only 15 ppm Na2CO3 in flue gas. Pilot scale studies in the 200 kW
combustion facility demonstrated the ability of the AR technologies to achieve NOx reductions of
95+% during gas firing and 90+% during coal firing. Byproduct emissions were found to be
lower than those generated by commercial reburning and SNCR technologies. Sodium
compounds promote NOx reduction more effectively during gas firing than coal firing; however,
NOx control without sodium addition is more effective for coal than for gas firing. The maximum
NOx reductions achieved by the SGAR configurations were 95-98% during gas firing and 90-95%
during coal firing.
3. A flow system decomposition study revealed that the primary gas-phase
decomposition products of Na2CO3 are Na atoms, NaOH and C O 2. The observed
decomposition rate of Na2CO3 can be described kinetically in terms of two irreversible Na2CO3
10-1

→ Na2O + CO2 and Na2O + CO2 → Na2CO3 and one reversible Na2O + H2O <=> 2NaOH
chemical reactions. The corresponding rate coefficients were measured or estimated to describe
the rate of Na2CO3 decomposition in the temperature range of 900-1190 K. Extrapolating the
results to higher temperatures shows that Na2CO3 decomposition at temperatures over 1400 K
produces NaOH and CO2 very quickly . NaOH then decomposes more slowly. Experiments
show no chemical reaction between Na2CO3 decomposition products and H2, CO, CH4 or NO at
1150 K. This confirms that sodium has little or no reactivity with major flue gas components in
the absence of ammonia.
4. A detailed reaction mechanism was developed to model the AR chemical processes.
The mechanism (355 reactions of 65 species) includes the following submechanisms:
GRI-Mech-2.11, SNCR chemistry, sodium chemistry with Na2CO3 decomposition reactions,
SO2/SO3 reactions, and interaction of HCl with flue gas components. Kinetic modeling provided
insight into the controlling factors of the process and qualitatively described the observed
reaction trends. The following factors mainly define the efficiency of AR systems: equivalence
ratio in the reburning zone, process streams injection temperatures (reburning fuel, N-agents,
promoters, and OFA), concentrations of N-agents and promoters, delay times for injection of
N-agents into the reburning and burnout zones, and characteristic mixing times of the injection
streams with flue gas. The modeling predicted and explained the NOx reduction enhancement of
sodium promotion under both fuel-rich and fuel-lean conditions. The promotion effect is most
pronounced in systems with long characteristic mixing times which are typical of full scale
industrial and utility boilers. A sensitivity analysis revealed the most significant elementary
reactions affecting formation and destruction of NO and other N-containing compounds in the
reburning and burnout zones.
5. The AR design methodology was upgraded by using experiments and analytical
models to include the second generation improvements. This work took advantage of a full scale
application of the original AR configuration in progress on a 105 MW tangentially fired boiler
10-2
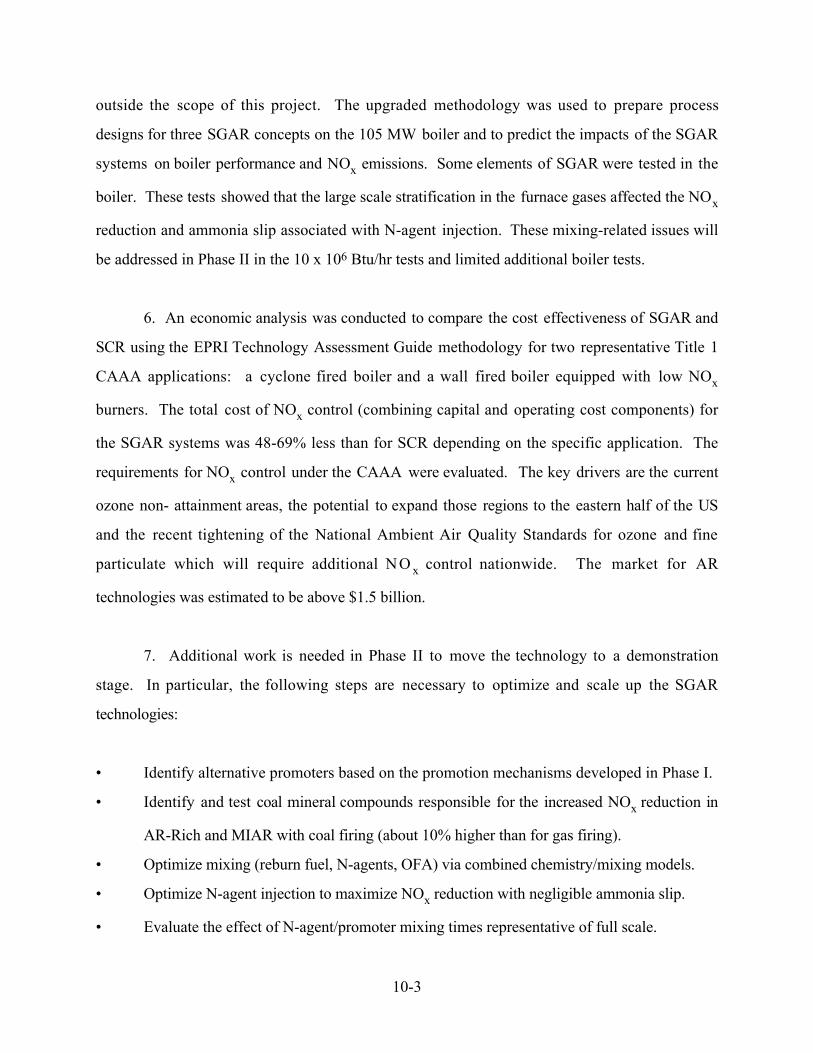
outside the scope of this project. The upgraded methodology was used to prepare process
designs for three SGAR concepts on the 105 MW boiler and to predict the impacts of the SGAR
systems on boiler performance and NOx emissions. Some elements of SGAR were tested in the
boiler. These tests showed that the large scale stratification in the furnace gases affected the NOx
reduction and ammonia slip associated with N-agent injection. These mixing-related issues will
be addressed in Phase II in the 10 x 106 Btu/hr tests and limited additional boiler tests.
6. An economic analysis was conducted to compare the cost effectiveness of SGAR and
SCR using the EPRI Technology Assessment Guide methodology for two representative Title 1
CAAA applications: a cyclone fired boiler and a wall fired boiler equipped with low NOx
burners. The total cost of NOx control (combining capital and operating cost components) for
the SGAR systems was 48-69% less than for SCR depending on the specific application. The
requirements for NOx control under the CAAA were evaluated. The key drivers are the current
ozone non- attainment areas, the potential to expand those regions to the eastern half of the US
and the recent tightening of the National Ambient Air Quality Standards for ozone and fine
particulate which will require additional NO x control nationwide. The market for AR
technologies was estimated to be above $1.5 billion.
7. Additional work is needed in Phase II to move the technology to a demonstration
stage. In particular, the following steps are necessary to optimize and scale up the SGAR
technologies:
¥ Identify alternative promoters based on the promotion mechanisms developed in Phase I.
¥ Identify and test coal mineral compounds responsible for the increased NOx reduction in
AR-Rich and MIAR with coal firing (about 10% higher than for gas firing).
¥ Optimize mixing (reburn fuel, N-agents, OFA) via combined chemistry/mixing models.
¥ Optimize N-agent injection to maximize NOx reduction with negligible ammonia slip.
¥ Evaluate the effect of N-agent/promoter mixing times representative of full scale.
10-3

¥ Optimize SGAR with new promoters and mixing regimes at 1 x 10⁶ Btu/hr scale.
¥ Scale up and confirm the design methodology via 10 x 106 Btu/hr Proof-of- Concept tests
and limited component tests during the ongoing boiler AR tests.
¥ Update the economic and market analysis to confirm the advantages of SGAR.
10-4
11.0 ACKNOWLEDGMENTS
The authors of this report would like to acknowledge the input and support of FETC
Contracting Officer's Representatives, Lori D. Gould, William P. Barnett, and current COR
Thomas J. Feeley. We appreciate the effort of EER engineers (Don Engelhardt, Quang Nguyen
and Bruce Li) and the dedication of EER combustion research technicians (Brian Jacobs, Andy
Furlong, Robert Elliot, Sr. and Robert Elliot, Jr.) who significantly contributed to this project by
generating high quality combustion test data. A continuing support of EER secretaries, Laura
Rogers and Jody Reeder, is also gratefully acknowledged.
11-1

12.0 REFERENCES
Ager, J.W., III and Howard, C.J. (1987). Gas Phase Kinetics of the Reactions of NaO with H2,D2, H2O, and D2O, J. Chem. Phys., V. 87, p. 921.
Ager, J.W., III and Talcott, C.L., Howard, C.J. (1986). Gas Phase Kinetics of the Reactions ofNa and NaO with O3 and N2O, J. Chem. Phys., V. 85, p. 5584.
Arand, J.K., Muzio, L.J. and Sotter, J.G., U.S. Patent 4,208,386, June 17, 1980.
Armitage, J. W. and Cullis, C. F. (1971). Studies of the Reaction between Nitrogen Dioxide andSulfur Dioxide, Combust. Flame, V. 16, p. 125.
Atkinson, R., Baulch, D.L., Cox, R.A., Hampson, R.F., Jr., Kerr, J.A. and Troe, J. (1992). Evaluated Kinetic and Photochemical Data for Atmospheric Chemistry, J. Phys. Chem. Ref.Data, V. 21, pp. 1125-1568.
Bailar, J.C. Jr., Emeleus, H.J. Nyholm, R. and Trotman-Dickenson, A.F. (1973). ComprehensiveInorganic Chemistry, Pergamon Press.
Ball, M.C., Snelling, C.M., Strachan, A.N. and Strachan, R.M. (1992). Thermal Decompositionof Solid Sodium Sesquicarbonate, Na2CO3.NaHCO3.2H2O. J. Chem. Soc. Faraday Trans. 88, pp.631-636.
Barin, I. (1989). Thermodynamic Data of Pure Substances, VCH Verlagsgesellschaft mbH, D-6940 Weinheim, Germany.
Baulch, D.L., Duxbury, J., Grant, S.J. and Montague, D.C. (1981). Evaluated Kinetic Data forHigh Temperature Reactions. Volume 4. Homogeneous Gas Phase Reactions of Halogen- andCyanide-Containing Species, J. Phys. Chem. Ref. Data, V. 10, Suppl. 1, 1-1.
Bowman, C.T. (1996). In Physical and Chemical Aspects of Combustion: A Tribute to IrvineGlassman (F.L. Dryer, R.F. Sawyer, Eds), Gordon and Breach.
Bowman, C.T., Hanson, R.K., Davidson, D.F., Gardiner, W.C.Jr., Lissianski, V.V., Smith, G.P.,Golden, D.M., Frenklach, M., Wang, H. and Goldenberg, M. ( 1995). http://www.gri.org.
Carabetta, R. and Kaskan, W.E. (1968). The Oxidation of Sodium, Potassium, and Cesium inFlames. J. Phys. Chem. 72, No. 7, pp. 2483-2489.
12-1

Chase, M.W. Jr., Davies, C.A., Downey, J.R. Jr., Frurip, D.J., McDonald, R.A. and Syverud,A.N. (1985). JANAF Thermochemical Tables, Third Edition. Journal of Physical and ChemicalReference Data, 14, Suppl. 1.
Chen, S.L., Ho, L., Cole, J.A and Seeker, W.R., 1989, "An Investigation to Define thePhysical/Chemical Constraints Which Limit NOx Emission Reduction Achievable by Reburning",EER Final Report, DOE contract No. DE-AC22-86PC91025.
Chen, S.L., Lyon, R.K. and Seeker, W.R. (1991). Environ. Progress, V. 10, P. 182, August,1991.
Chen, S.L., Seeker, W.R., Lyon, R.K. and Ho, L. (1993). N2O Decomposition Catalyzed in theGas Phase by Sodium, 205th ACS National Meeting, Denver, CO, March 28 - April 2, 1993.
Cohen, N. (1996) J. Phys. Chem. Ref. Data 25, 1411.
Cotton, D.H. and Jenkins, D.R. (1971). Trans. Faraday Soc. 67, 730, 1971.
DeMore, W.B., Golden, D.M., Hampson, R.F., Howard, C.J., Kurylo, M.J., Molina, M.J.,Ravishankara, A.R. and Sander, S.P. (1987). Chemical Kinetics and Photochemical Data for Usein Stratospheric Modeling, Evaluation Number 8, JPL Publication 87-41, 1.
Ebbinghaus, B.B. (1993). Thermodynamics of Gas Phase Chromium Species, Combust. Flame,93, pp. 119-137.
Feitelberg, A.S. (1994). CET89 for the Macintosh: A Chemical Equilibrium and TransportProperties Calculator. General Electric Company.
Fenimore, C.P. (1973). Two Modes of Interaction of NaOH and SO2 in Gases From Fuel-LeanH2-Air Flames, 14th Symposium (Intern.) on Combustion, The Combustion Institute,Pittsburgh, pp. 955-963.
Frenklach, M., Wang, H., Bowman, C.T., Hanson, R.K., Smith, G.P., Golden, D.M., Gardiner,W.C., and Lissianski, V. (1994). An Optimized Kinetics Model for Natural Gas Combustion,25th International Symposium on Combustion, Irvine, California, Work-In-Progress PosterSession 3, Number 26.
Galwey, A.K. and Hood, W.J. (1979). Thermal Decomposition of Sodium Carbonate Perhydratein the Solid State. J. Phys. Chem. 83, pp. 1810-1815.
Gardiner, W.C. Jr., Walker, B.F. and Wakefield, C.B. (1981). In Shock Waves in Chemistry, A.Lifshitz., Ed.; Marcel Dekker: New York; p. 319.
12-2
Glarborg, P., Dam-Johansen, K. and Kristensen, P.G. (1993). Reburning Rich-Lean Kinetics,Final Report to GRI, Contract No. 5091-260-2126.
Heda, P.K. Dollimore, D., Alexander, K.S., Chen, D., Law, E. and Bicknell, P. (1995). A Methodof Assessing Solid State Reactivity Illustrated by Thermal Decomposition Experiments onSodium Bicarbonate. Thermochimica Acta 255, pp. 255-272.
Hewson, T.A. and Stamberg, J.B. (1995) Evaluation of Proposed 37 State Seasonal NOx ControlProgram. Compliance Costs and Issues, Report by Energy Ventures Analysis, Inc., Arlington,VA.
Hildenbrand, D.L. And Murad, E. (1970). Dissociation Energy of NaO(g) and the Heat ofAtomization of Na2O(g), J. Chem. Phys. 53, 3403-3408.
Ho, L. Chen, S.L., Seeker, W.R. and Maly, P.M. (1993). U.S. Patent No. 5,270,025.
Husain, D. and Plane, J.M.C. (1982). Kinetic Investigation of the Reaction Between Na + O2 +M by Time-Resolved Atomic Resonance Absorption Spectroscopy. J. Chem. Soc. FaradayTrans. 2 78, pp. 163-178.
Husain, D. and Marshall, P. (1986). Determination of Absolute Rate Data for the Reactions ofAtomic Sodium with CH3F, CH3Cl, CH3Br, HCl, and HBr as a Function of Temperature byTime-Resolved Atomic Resonance Spectroscopy, Int. J. Chem. Kinet., V. 18, p. 83.
Hynes, A.J., Steinberg, M. and Schofield, K., The Chemical Kinetics and Thermodynamics ofSodium Species in Oxygen-Rich Hydrogen Flames, J. Chem. Phys. 80, 1984, pp. 2585-2597.
Jensen, D.E. and Jones, G.A. (1982). Kinetics of Flame Inhibition by Sodium, J. Chem. Soc.Faraday Trans. 1, V. 78, p. 2843.
Kaskan, W.E. (1971). The Reaction of Alkali Atoms in Lean Flames. 10th Symposium(International) on Combustion, The Combustion Institute, pp.4 1-45.
Kee, R.J., Rupley, F.M. and Miller, J.A. (1992). Chemkin II: a Fortran Chemical KineticsPackage for the Analysis of Gas Phase Chemical Kinetics, Sandia National Laboratories, ReportSAND89-8009.
Lay, T.H., Bozzelli, J.W., Dean, A.M., and Ritter, E.R. (1995) J. Phys. Chem. 99, 14514.
Lutz, A.E., Kee, R.J. and Miller, J.A. (1987). SENKIN: a Fortran Program for Predicting GasPhase Chemical Kinetics with Sensitivity Analysis, Sandia National Laboratories Report No.
12-3

SAND87-8248.
Lyon, R. K. U.S. Patent 3,900,554, August 19, 1975.
Lyon, R.K. and Hardy, J.E. (1986). Ind. Eng. Chem. Fundam. 25, 19.
Mallard, W.G., Westley, F., Herron, J.T., Hampson, R.F., and Frizzell, D.H. (1994). NISTChemical Kinetics Database: Version 6.0, National Institute of Standards and Technology,Gaithersburg, MD.
Marshall, P., Narayan, A.S., and Fontijn, A. (1990) J. Phys. Chem. 94, 2998.
McBride, B.J., Gordon, S., and Reno, M.A. (1993). Coefficients for Calculating Thermodynamicand Transport Properties of Individual Species, NASA Technical Memorandum 4513, October,1993.
McBride, B.J., M.A. Reno, and S. Gordon (1994), CET93 and CETPC: An Interim UpdatedVersion of the NASA Lewis Computer Program for Calculating Complex Chemical Equilibriawith Applications, NASA Lewis Research Center, Cleveland, Ohio, NASA technicalMemorandum 4557; program distributed by COSMIC, NASAÕs Software Technology Center,The University of Georgia, GA.
McEwan, M.J. and Phillips, L.F. (1965). Trans. Faraday Soc. 62, p. 1717.
Miller, J.A. and Bowman, C.T. (1989). Mechanism and Modeling of Nitrogen Chemistry inCombustion, Progr. Energy Combust. Sci., 15, 287-338.
Mitani, T. and Nioka, T. (1984). Extinction Phenomenon of Premixed Flames with Alkali MetalCompounds. Combust. Flame 55, pp. 13-21.
Partridge, H., Bauschlichter, C.W., Jr., Sodupe, M. and Langhoff, S.R. (1992). Chem. Phys.Lett., V. 195, p. 200.
Perry, R.A. and Miller, J.A. (1995). An Exploratory Investigation of the Use of Alkali Metals inNitrous Oxide Control. Int. J. Chem. Kinetics 28, pp. 217-234.
Phase II NOx Controls for the MARAMA and NESCAUM Regions, EPA-453/R-96-002, 1996.
Plane, J.M.C. and Rajasekhar, B. (1989). Kinetic Study of the Reactions Na + O2 and Na + N2Oover an Extended Temperature Range, J. Phys. Chem., V. 93, p. 3135.
Plane, J.M.C. and Husain, D. (1986). Determination of the Absolute Rate Constant for the
12-4

Reaction O+NaO = Na+O2 by Time-Resolved Atomic Chemiluminescence, J. Chem. Soc.Faraday Trans. 2, V. 82, p. 2047.
Plane, J.M.C. (1991) Int. Reviews Phys. Chem. 10, 55.
Plane, J.M.C. (1992). A Comparison Between the Oxidation Reactions of the Alkali andAlkaline Earth Atoms, Gas-Phase Metal Reactions, ed. A. Fontijn, Elsevier Science Publ.,Amsterdam, Netherlands, pp. 29-56.
Schofield, K., and Steinberg, M. (1992) J. Phys. Chem. 96, 715.
Seeker, W.R., Proc. of the Reburning Workshop, Orenas Slott, Sweden, Nov. 26-27, 1990.
Seeker, W.R., Chen, S.L. and Kramlich, J.C., 1992, "Advanced Reburning for Reduction of NOx
Emissions in Combustion Systems", U.S. Patent 5,139,755.
Shi, Y. and Marshall, P. (1991). A Kinetic Study of the Recombination Reaction Na + SO2 + Ar,J. Phys. Chem., V. 95, p. 1654.
Silver, J.A. and Kolb, C.E. (1986). Gas-Phase Reaction Rate of Sodium Superoxide withHydrochloric Acid, J. Phys. Chem., V. 90, p. 3267.
Silver, J.A., Stanton, A.C., Zahniser, M.S. and Kolb, C.E. (1984). Gas-Phase Reaction Rate ofSodium Hydroxide with Hydrochloric Acid, J. Phys. Chem., V. 88, p. 3123.
Smith, O. I., Tseregounis, S. and Wang, S-N. (1982). High-Temperature Kinetics of theReactions of SO2 and SO3 with Atomic Oxygen, Int. J. Chem. Kinet., V. 14, p. 679.
Srinivasachar, S., Helble, J.J., Ham, D.O. and Domazetis, G. (1990). A Kinetic Description ofVapor Phase Alkali Transformations in Combustion Systems. Progr. Energy Combust. Sci. 16,pp. 303-309.
Steinberg, M. and Schofield, K. (1990). The Chemistry of Sodium with Sulfur in Flames, Prog.Energy Combust. Sci., Vol. 16, pp. 311-317.
Terai, R., Sugae, I., Hayami, R. (1968). Kinetics and Mechanism of the Solid State Reaction ofAlkali Carbonate and Silica. Zairyo, 17(177) 527.
United States Environmental Protection Agency. (1977). Process Measurement Procedures -Sulfuric Acid Emissions.
Wendt, J.O.L., Sterling, C.V. and Matovich, M.A. (1973). 14th Symposium (International) on
12-5

Combustion, P. 897, 1973.
Westley, F., Frizzell, D.H., Herron, J.T., Hampson, R.F. and Mallard, W.G. (1994). NISTChemical Kinetics Database, version 5.0. NIST.
Wu, Y.-L. and Shih, S.-M. (1993). Instrinsic Kinetics of the Thermal Decomposition of SodiumBicarbonate. Thermochimica Acta 223, pp. 177-186.
Zamansky, V.M. and Borisov, A.A. (1992). Promotion of High-Temperature Self-Ignition, Prog.Energy Combust. Sci., V. 18, pp. 297-325.
Zamansky, V.M. and Maly, P.M. (1996a). Second Generation Advanced Reburning for HighEfficiency NOx Control, EER 1st Quarterly Report, DOE Contract No. DE-AC22-95PC95251,January, 1996.
Zamansky, V.M. (1996). Second Generation Advanced Reburning for High Efficiency NOxControl, EER 2nd Quarterly Report, DOE Contract No. DE-AC22-95PC95251, April, 1996.
Zamansky, V.M. and Maly, P.M. (1996b). Second Generation Advanced Reburning for HighEfficiency NOx Control, EER 3d Quarterly Report, DOE Contract No. DE-AC22-95PC95251,July, 1996.
Zamansky, V.M. and Maly, P.M. (1996c). Second Generation Advanced Reburning for HighEfficiency NOx Control, EER 4th Quarterly Report, DOE Contract No. DE-AC22-95PC95251,October, 1996.
Zamansky, V.M. and Maly, P.M. (1997a). Second Generation Advanced Reburning for HighEfficiency NOx Control, EER 5th Quarterly Report, DOE Contract No. DE-AC22-95PC95251,January, 1997.
Zamansky, V.M. et al. (1997b). Second Generation Advanced Reburning for High EfficiencyNOx Control, EER 6th Quarterly Report, DOE Contract No. DE-AC22-95PC95251, April,1997.
12-6

Appendix 1. Reaction Mechanism in Chemkin/Senkin Interpreter Format
CHEMKIN INTERPRETER OUTPUT: CHEMKIN-II Version 3.1 Feb. 1993; DOUBLE PRECISION -------------------- ELEMENTS ATOMIC CONSIDERED WEIGHT -------------------- 1. O 15.9994 2. H 1.00797 3. C 12.0112 4. N 14.0067 5. AR 39.9480 6. S 32.0640 7. NA 22.9898 8. CL 35.4530 -------------------- ------------------------------------------------------------------------------ C P H H A A R SPECIES S G MOLECULAR TEMPERATURE ELEMENT COUNT CONSIDERED E E WEIGHT LOW HIGH O H C N AR S NA CL ------------------------------------------------------------------------------ 1. H2 G 0 2.01594 200.0 3500.0 0 2 0 0 0 0 0 0 2. H G 0 1.00797 200.0 3500.0 0 1 0 0 0 0 0 0 3. O G 0 15.99940 200.0 3500.0 1 0 0 0 0 0 0 0 4. O2 G 0 31.99880 200.0 3500.0 2 0 0 0 0 0 0 0 5. OH G 0 17.00737 200.0 3500.0 1 1 0 0 0 0 0 0 6. H2O G 0 18.01534 200.0 3500.0 1 2 0 0 0 0 0 0 7. HO2 G 0 33.00677 200.0 3500.0 2 1 0 0 0 0 0 0 8. H2O2 G 0 34.01474 200.0 3500.0 2 2 0 0 0 0 0 0 9. C G 0 12.01115 200.0 3500.0 0 0 1 0 0 0 0 0 10. CH G 0 13.01912 200.0 3500.0 0 1 1 0 0 0 0 0 11. CH2 G 0 14.02709 200.0 3500.0 0 2 1 0 0 0 0 0 12. CH2(S) G 0 14.02709 200.0 3500.0 0 2 1 0 0 0 0 0 13. CH3 G 0 15.03506 200.0 3500.0 0 3 1 0 0 0 0 0 14. CH4 G 0 16.04303 200.0 3500.0 0 4 1 0 0 0 0 0 15. CO G 0 28.01055 200.0 3500.0 1 0 1 0 0 0 0 0 16. CO2 G 0 44.00995 200.0 3500.0 2 0 1 0 0 0 0 0 17. HCO G 0 29.01852 200.0 3500.0 1 1 1 0 0 0 0 0 18. CH2O G 0 30.02649 200.0 3500.0 1 2 1 0 0 0 0 0 19. CH2OH G 0 31.03446 200.0 3500.0 1 3 1 0 0 0 0 0 20. CH3O G 0 31.03446 300.0 3000.0 1 3 1 0 0 0 0 0 21. CH3OH G 0 32.04243 200.0 3500.0 1 4 1 0 0 0 0 0 22. C2H G 0 25.03027 200.0 3500.0 0 1 2 0 0 0 0 0 23. C2H2 G 0 26.03824 200.0 3500.0 0 2 2 0 0 0 0 0 24. C2H3 G 0 27.04621 200.0 3500.0 0 3 2 0 0 0 0 0 25. C2H4 G 0 28.05418 200.0 3500.0 0 4 2 0 0 0 0 0 26. C2H5 G 0 29.06215 200.0 3500.0 0 5 2 0 0 0 0 0 27. C2H6 G 0 30.07012 200.0 3500.0 0 6 2 0 0 0 0 0 28. HCCO G 0 41.02967 300.0 4000.0 1 1 2 0 0 0 0 0 29. CH2CO G 0 42.03764 200.0 3500.0 1 2 2 0 0 0 0 0 30. HCCOH G 0 42.03764 300.0 5000.0 1 2 2 0 0 0 0 0 31. N G 0 14.00670 200.0 6000.0 0 0 0 1 0 0 0 0 32. NH G 0 15.01467 200.0 6000.0 0 1 0 1 0 0 0 0 33. NH2 G 0 16.02264 200.0 6000.0 0 2 0 1 0 0 0 0 34. NH3 G 0 17.03061 200.0 6000.0 0 3 0 1 0 0 0 0 35. NNH G 0 29.02137 200.0 6000.0 0 1 0 2 0 0 0 0 36. NO G 0 30.00610 200.0 6000.0 1 0 0 1 0 0 0 0 37. NO2 G 0 46.00550 200.0 6000.0 2 0 0 1 0 0 0 0 38. N2O G 0 44.01280 200.0 6000.0 1 0 0 2 0 0 0 0 39. HNO G 0 31.01407 200.0 6000.0 1 1 0 1 0 0 0 0 40. CN G 0 26.01785 200.0 6000.0 0 0 1 1 0 0 0 0 41. HCN G 0 27.02582 200.0 6000.0 0 1 1 1 0 0 0 0 42. H2CN G 0 28.03379 300.0 4000.0 0 2 1 1 0 0 0 0 43. HCNN G 0 41.03252 300.0 5000.0 0 1 1 2 0 0 0 0 44. HCNO G 0 43.02522 300.0 5000.0 1 1 1 1 0 0 0 0 45. HOCN G 0 43.02522 300.0 5000.0 1 1 1 1 0 0 0 0 46. HNCO G 0 43.02522 300.0 5000.0 1 1 1 1 0 0 0 0 47. NCO G 0 42.01725 200.0 6000.0 1 0 1 1 0 0 0 0 48. N2 G 0 28.01340 300.0 5000.0 0 0 0 2 0 0 0 0 49. AR G 0 39.94800 300.0 5000.0 0 0 0 0 1 0 0 0 50. N2H2 G 0 30.02934 300.0 5000.0 0 2 0 2 0 0 0 0 51. SO2 G 0 64.06280 300.0 5000.0 2 0 0 0 0 1 0 0 52. SO3 G 0 80.06220 300.0 5000.0 3 0 0 0 0 1 0 0 53. HSO3 G 0 81.07017 300.0 2000.0 3 1 0 0 0 1 0 0
A-1
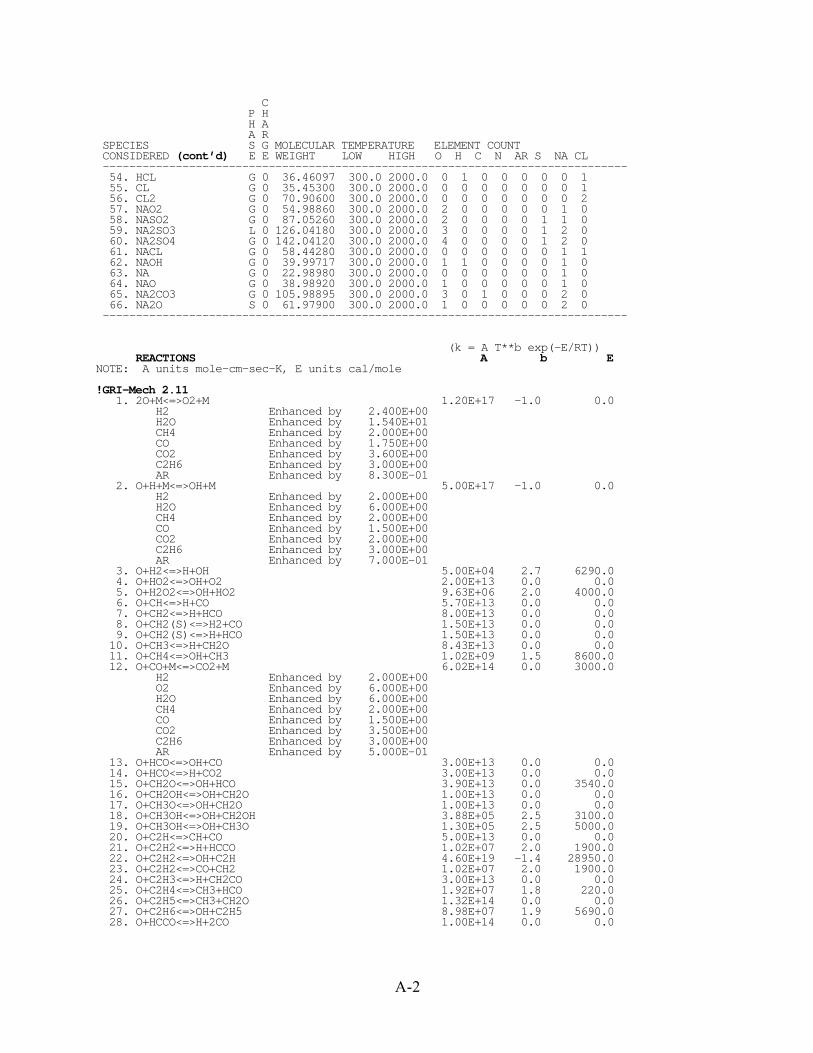
C P H H A A R SPECIES S G MOLECULAR TEMPERATURE ELEMENT COUNT CONSIDERED (cont’d) E E WEIGHT LOW HIGH O H C N AR S NA CL ------------------------------------------------------------------------------- 54. HCL G 0 36.46097 300.0 2000.0 0 1 0 0 0 0 0 1 55. CL G 0 35.45300 300.0 2000.0 0 0 0 0 0 0 0 1 56. CL2 G 0 70.90600 300.0 2000.0 0 0 0 0 0 0 0 2 57. NAO2 G 0 54.98860 300.0 2000.0 2 0 0 0 0 0 1 0 58. NASO2 G 0 87.05260 300.0 2000.0 2 0 0 0 0 1 1 0 59. NA2SO3 L 0 126.04180 300.0 2000.0 3 0 0 0 0 1 2 0 60. NA2SO4 G 0 142.04120 300.0 2000.0 4 0 0 0 0 1 2 0 61. NACL G 0 58.44280 300.0 2000.0 0 0 0 0 0 0 1 1 62. NAOH G 0 39.99717 300.0 2000.0 1 1 0 0 0 0 1 0 63. NA G 0 22.98980 300.0 2000.0 0 0 0 0 0 0 1 0 64. NAO G 0 38.98920 300.0 2000.0 1 0 0 0 0 0 1 0 65. NA2CO3 G 0 105.98895 300.0 2000.0 3 0 1 0 0 0 2 0 66. NA2O S 0 61.97900 300.0 2000.0 1 0 0 0 0 0 2 0 -------------------------------------------------------------------------------
(k = A T**b exp(-E/RT)) REACTIONS A b ENOTE: A units mole-cm-sec-K, E units cal/mole
!GRI-Mech 2.11 1. 2O+M<=>O2+M 1.20E+17 -1.0 0.0 H2 Enhanced by 2.400E+00 H2O Enhanced by 1.540E+01 CH4 Enhanced by 2.000E+00 CO Enhanced by 1.750E+00 CO2 Enhanced by 3.600E+00 C2H6 Enhanced by 3.000E+00 AR Enhanced by 8.300E-01 2. O+H+M<=>OH+M 5.00E+17 -1.0 0.0 H2 Enhanced by 2.000E+00 H2O Enhanced by 6.000E+00 CH4 Enhanced by 2.000E+00 CO Enhanced by 1.500E+00 CO2 Enhanced by 2.000E+00 C2H6 Enhanced by 3.000E+00 AR Enhanced by 7.000E-01 3. O+H2<=>H+OH 5.00E+04 2.7 6290.0 4. O+HO2<=>OH+O2 2.00E+13 0.0 0.0 5. O+H2O2<=>OH+HO2 9.63E+06 2.0 4000.0 6. O+CH<=>H+CO 5.70E+13 0.0 0.0 7. O+CH2<=>H+HCO 8.00E+13 0.0 0.0 8. O+CH2(S)<=>H2+CO 1.50E+13 0.0 0.0 9. O+CH2(S)<=>H+HCO 1.50E+13 0.0 0.0 10. O+CH3<=>H+CH2O 8.43E+13 0.0 0.0 11. O+CH4<=>OH+CH3 1.02E+09 1.5 8600.0 12. O+CO+M<=>CO2+M 6.02E+14 0.0 3000.0 H2 Enhanced by 2.000E+00 O2 Enhanced by 6.000E+00 H2O Enhanced by 6.000E+00 CH4 Enhanced by 2.000E+00 CO Enhanced by 1.500E+00 CO2 Enhanced by 3.500E+00 C2H6 Enhanced by 3.000E+00 AR Enhanced by 5.000E-01 13. O+HCO<=>OH+CO 3.00E+13 0.0 0.0 14. O+HCO<=>H+CO2 3.00E+13 0.0 0.0 15. O+CH2O<=>OH+HCO 3.90E+13 0.0 3540.0 16. O+CH2OH<=>OH+CH2O 1.00E+13 0.0 0.0 17. O+CH3O<=>OH+CH2O 1.00E+13 0.0 0.0 18. O+CH3OH<=>OH+CH2OH 3.88E+05 2.5 3100.0 19. O+CH3OH<=>OH+CH3O 1.30E+05 2.5 5000.0 20. O+C2H<=>CH+CO 5.00E+13 0.0 0.0 21. O+C2H2<=>H+HCCO 1.02E+07 2.0 1900.0 22. O+C2H2<=>OH+C2H 4.60E+19 -1.4 28950.0 23. O+C2H2<=>CO+CH2 1.02E+07 2.0 1900.0 24. O+C2H3<=>H+CH2CO 3.00E+13 0.0 0.0 25. O+C2H4<=>CH3+HCO 1.92E+07 1.8 220.0 26. O+C2H5<=>CH3+CH2O 1.32E+14 0.0 0.0 27. O+C2H6<=>OH+C2H5 8.98E+07 1.9 5690.0 28. O+HCCO<=>H+2CO 1.00E+14 0.0 0.0
A-2

(k = A T**b exp(-E/RT)) REACTIONS A b E 29. O+CH2CO<=>OH+HCCO 1.00E+13 0.0 8000.0 30. O+CH2CO<=>CH2+CO2 1.75E+12 0.0 1350.0 31. O2+CO<=>O+CO2 2.50E+12 0.0 47800.0 32. O2+CH2O<=>HO2+HCO 1.00E+14 0.0 40000.0 33. H+O2+M<=>HO2+M 2.80E+18 -0.9 0.0 O2 Enhanced by 0.000E+00 H2O Enhanced by 0.000E+00 CO Enhanced by 7.500E-01 CO2 Enhanced by 1.500E+00 C2H6 Enhanced by 1.500E+00 N2 Enhanced by 0.000E+00 AR Enhanced by 0.000E+00 34. H+2O2<=>HO2+O2 3.00E+20 -1.7 0.0 35. H+O2+H2O<=>HO2+H2O 9.38E+18 -0.8 0.0 36. H+O2+N2<=>HO2+N2 3.75E+20 -1.7 0.0 37. H+O2+AR<=>HO2+AR 7.00E+17 -0.8 0.0 38. H+O2<=>O+OH 8.30E+13 0.0 14413.0 39. 2H+M<=>H2+M 1.00E+18 -1.0 0.0 H2 Enhanced by 0.000E+00 H2O Enhanced by 0.000E+00 CH4 Enhanced by 2.000E+00 CO2 Enhanced by 0.000E+00 C2H6 Enhanced by 3.000E+00 AR Enhanced by 6.300E-01 40. 2H+H2<=>2H2 9.00E+16 -0.6 0.0 41. 2H+H2O<=>H2+H2O 6.00E+19 -1.2 0.0 42. 2H+CO2<=>H2+CO2 5.50E+20 -2.0 0.0 43. H+OH+M<=>H2O+M 2.20E+22 -2.0 0.0 H2 Enhanced by 7.300E-01 H2O Enhanced by 3.650E+00 CH4 Enhanced by 2.000E+00 C2H6 Enhanced by 3.000E+00 AR Enhanced by 3.800E-01 44. H+HO2<=>O+H2O 3.97E+12 0.0 671.0 45. H+HO2<=>O2+H2 2.80E+13 0.0 1068.0 46. H+HO2<=>2OH 1.34E+14 0.0 635.0 47. H+H2O2<=>HO2+H2 1.21E+07 2.0 5200.0 48. H+H2O2<=>OH+H2O 1.00E+13 0.0 3600.0 49. H+CH<=>C+H2 1.10E+14 0.0 0.0 50. H+CH2(+M)<=>CH3(+M) 2.50E+16 -0.8 0.0 Low pressure limit: 0.32000E+28 -0.31400E+01 0.12300E+04 TROE centering: 0.68000E+00 0.78000E+02 0.19950E+04 0.55900E+04 H2 Enhanced by 2.000E+00 H2O Enhanced by 6.000E+00 CH4 Enhanced by 2.000E+00 CO Enhanced by 1.500E+00 CO2 Enhanced by 2.000E+00 C2H6 Enhanced by 3.000E+00 AR Enhanced by 7.000E-01 51. H+CH2(S)<=>CH+H2 3.00E+13 0.0 0.0 52. H+CH3(+M)<=>CH4(+M) 1.27E+16 -0.6 383.0 Low pressure limit: 0.24770E+34 -0.47600E+01 0.24400E+04 TROE centering: 0.78300E+00 0.74000E+02 0.29410E+04 0.69640E+04 H2 Enhanced by 2.000E+00 H2O Enhanced by 6.000E+00 CH4 Enhanced by 2.000E+00 CO Enhanced by 1.500E+00 CO2 Enhanced by 2.000E+00 C2H6 Enhanced by 3.000E+00 AR Enhanced by 7.000E-01 53. H+CH4<=>CH3+H2 6.60E+08 1.6 10840.0 54. H+HCO(+M)<=>CH2O(+M) 1.09E+12 0.5 -260.0 Low pressure limit: 0.13500E+25 -0.25700E+01 0.14250E+04 TROE centering: 0.78240E+00 0.27100E+03 0.27550E+04 0.65700E+04 H2 Enhanced by 2.000E+00 H2O Enhanced by 6.000E+00 CH4 Enhanced by 2.000E+00 CO Enhanced by 1.500E+00 CO2 Enhanced by 2.000E+00 C2H6 Enhanced by 3.000E+00 AR Enhanced by 7.000E-01 55. H+HCO<=>H2+CO 7.34E+13 0.0 0.0 56. H+CH2O(+M)<=>CH2OH(+M) 5.40E+11 0.5 3600.0
A-3

(k = A T**b exp(-E/RT)) REACTIONS A b E Low pressure limit: 0.12700E+33 -0.48200E+01 0.65300E+04 TROE centering: 0.71870E+00 0.10300E+03 0.12910E+04 0.41600E+04 H2 Enhanced by 2.000E+00 H2O Enhanced by 6.000E+00 CH4 Enhanced by 2.000E+00 CO Enhanced by 1.500E+00 CO2 Enhanced by 2.000E+00 C2H6 Enhanced by 3.000E+00 57. H+CH2O(+M)<=>CH3O(+M) 5.40E+11 0.5 2600.0 Low pressure limit: 0.22000E+31 -0.48000E+01 0.55600E+04 TROE centering: 0.75800E+00 0.94000E+02 0.15550E+04 0.42000E+04 H2 Enhanced by 2.000E+00 H2O Enhanced by 6.000E+00 CH4 Enhanced by 2.000E+00 CO Enhanced by 1.500E+00 CO2 Enhanced by 2.000E+00 C2H6 Enhanced by 3.000E+00 58. H+CH2O<=>HCO+H2 2.30E+10 1.1 3275.0 59. H+CH2OH(+M)<=>CH3OH(+M) 1.80E+13 0.0 0.0 Low pressure limit: 0.30000E+32 -0.48000E+01 0.33000E+04 TROE centering: 0.76790E+00 0.33800E+03 0.18120E+04 0.50810E+04 H2 Enhanced by 2.000E+00 H2O Enhanced by 6.000E+00 CH4 Enhanced by 2.000E+00 CO Enhanced by 1.500E+00 CO2 Enhanced by 2.000E+00 C2H6 Enhanced by 3.000E+00 60. H+CH2OH<=>H2+CH2O 2.00E+13 0.0 0.0 61. H+CH2OH<=>OH+CH3 1.20E+13 0.0 0.0 62. H+CH2OH<=>CH2(S)+H2O 6.00E+12 0.0 0.0 63. H+CH3O(+M)<=>CH3OH(+M) 5.00E+13 0.0 0.0 Low pressure limit: 0.86000E+29 -0.40000E+01 0.30250E+04 TROE centering: 0.89020E+00 0.14400E+03 0.28380E+04 0.45569E+05 H2 Enhanced by 2.000E+00 H2O Enhanced by 6.000E+00 CH4 Enhanced by 2.000E+00 CO Enhanced by 1.500E+00 CO2 Enhanced by 2.000E+00 C2H6 Enhanced by 3.000E+00 64. H+CH3O<=>H+CH2OH 3.40E+06 1.6 0.0 65. H+CH3O<=>H2+CH2O 2.00E+13 0.0 0.0 66. H+CH3O<=>OH+CH3 3.20E+13 0.0 0.0 67. H+CH3O<=>CH2(S)+H2O 1.60E+13 0.0 0.0 68. H+CH3OH<=>CH2OH+H2 1.70E+07 2.1 4870.0 69. H+CH3OH<=>CH3O+H2 4.20E+06 2.1 4870.0 70. H+C2H(+M)<=>C2H2(+M) 1.00E+17 -1.0 0.0 Low pressure limit: 0.37500E+34 -0.48000E+01 0.19000E+04 TROE centering: 0.64640E+00 0.13200E+03 0.13150E+04 0.55660E+04 H2 Enhanced by 2.000E+00 H2O Enhanced by 6.000E+00 CH4 Enhanced by 2.000E+00 CO Enhanced by 1.500E+00 CO2 Enhanced by 2.000E+00 C2H6 Enhanced by 3.000E+00 AR Enhanced by 7.000E-01 71. H+C2H2(+M)<=>C2H3(+M) 5.60E+12 0.0 2400.0 Low pressure limit: 0.38000E+41 -0.72700E+01 0.72200E+04 TROE centering: 0.75070E+00 0.98500E+02 0.13020E+04 0.41670E+04 H2 Enhanced by 2.000E+00 H2O Enhanced by 6.000E+00 CH4 Enhanced by 2.000E+00 CO Enhanced by 1.500E+00 CO2 Enhanced by 2.000E+00 C2H6 Enhanced by 3.000E+00 AR Enhanced by 7.000E-01 72. H+C2H3(+M)<=>C2H4(+M) 6.08E+12 0.3 280.0 Low pressure limit: 0.14000E+31 -0.38600E+01 0.33200E+04 TROE centering: 0.78200E+00 0.20750E+03 0.26630E+04 0.60950E+04 H2 Enhanced by 2.000E+00 H2O Enhanced by 6.000E+00 CH4 Enhanced by 2.000E+00 CO Enhanced by 1.500E+00 CO2 Enhanced by 2.000E+00 C2H6 Enhanced by 3.000E+00 AR Enhanced by 7.000E-01 73. H+C2H3<=>H2+C2H2 3.00E+13 0.0 0.0
A-4

(k = A T**b exp(-E/RT)) REACTIONS A b E
74. H+C2H4(+M)<=>C2H5(+M) 1.08E+12 0.5 1820.0 Low pressure limit: 0.12000E+43 -0.76200E+01 0.69700E+04 TROE centering: 0.97530E+00 0.21000E+03 0.98400E+03 0.43740E+04 H2 Enhanced by 2.000E+00 H2O Enhanced by 6.000E+00 CH4 Enhanced by 2.000E+00 CO Enhanced by 1.500E+00 CO2 Enhanced by 2.000E+00 C2H6 Enhanced by 3.000E+00 AR Enhanced by 7.000E-01 75. H+C2H4<=>C2H3+H2 1.32E+06 2.5 12240.0 76. H+C2H5(+M)<=>C2H6(+M) 5.21E+17 -1.0 1580.0 Low pressure limit: 0.19900E+42 -0.70800E+01 0.66850E+04 TROE centering: 0.84220E+00 0.12500E+03 0.22190E+04 0.68820E+04 H2 Enhanced by 2.000E+00 H2O Enhanced by 6.000E+00 CH4 Enhanced by 2.000E+00 CO Enhanced by 1.500E+00 CO2 Enhanced by 2.000E+00 C2H6 Enhanced by 3.000E+00 AR Enhanced by 7.000E-01 77. H+C2H5<=>H2+C2H4 2.00E+12 0.0 0.0 78. H+C2H6<=>C2H5+H2 1.15E+08 1.9 7530.0 79. H+HCCO<=>CH2(S)+CO 1.00E+14 0.0 0.0 80. H+CH2CO<=>HCCO+H2 5.00E+13 0.0 8000.0 81. H+CH2CO<=>CH3+CO 1.13E+13 0.0 3428.0 82. H+HCCOH<=>H+CH2CO 1.00E+13 0.0 0.0 83. H2+CO(+M)<=>CH2O(+M) 4.30E+07 1.5 79600.0 Low pressure limit: 0.50700E+28 -0.34200E+01 0.84350E+05 TROE centering: 0.93200E+00 0.19700E+03 0.15400E+04 0.10300E+05 H2 Enhanced by 2.000E+00 H2O Enhanced by 6.000E+00 CH4 Enhanced by 2.000E+00 CO Enhanced by 1.500E+00 CO2 Enhanced by 2.000E+00 C2H6 Enhanced by 3.000E+00 AR Enhanced by 7.000E-01 84. OH+H2<=>H+H2O 2.16E+08 1.5 3430.0 85. 2OH(+M)<=>H2O2(+M) 7.40E+13 -0.4 0.0 Low pressure limit: 0.23000E+19 -0.90000E+00 -0.17000E+04 TROE centering: 0.73460E+00 0.94000E+02 0.17560E+04 0.51820E+04 H2 Enhanced by 2.000E+00 H2O Enhanced by 6.000E+00 CH4 Enhanced by 2.000E+00 CO Enhanced by 1.500E+00 CO2 Enhanced by 2.000E+00 C2H6 Enhanced by 3.000E+00 AR Enhanced by 7.000E-01 86. 2OH<=>O+H2O 3.57E+04 2.4 -2110.0 87. OH+HO2<=>O2+H2O 2.90E+13 0.0 -500.0 88. OH+H2O2<=>HO2+H2O 1.75E+12 0.0 320.0 Declared duplicate reaction... 89. OH+H2O2<=>HO2+H2O 5.80E+14 0.0 9560.0 Declared duplicate reaction... 90. OH+C<=>H+CO 5.00E+13 0.0 0.0 91. OH+CH<=>H+HCO 3.00E+13 0.0 0.0 92. OH+CH2<=>H+CH2O 2.00E+13 0.0 0.0 93. OH+CH2<=>CH+H2O 1.13E+07 2.0 3000.0 94. OH+CH2(S)<=>H+CH2O 3.00E+13 0.0 0.0 95. OH+CH3(+M)<=>CH3OH(+M) 6.30E+13 0.0 0.0 Low pressure limit: 0.27000E+39 -0.63000E+01 0.31000E+04 TROE centering: 0.21050E+00 0.83500E+02 0.53980E+04 0.83700E+04 H2 Enhanced by 2.000E+00 H2O Enhanced by 6.000E+00 CH4 Enhanced by 2.000E+00 CO Enhanced by 1.500E+00 CO2 Enhanced by 2.000E+00 C2H6 Enhanced by 3.000E+00 96. OH+CH3<=>CH2+H2O 5.60E+07 1.6 5420.0 97. OH+CH3<=>CH2(S)+H2O 2.50E+13 0.0 0.0 98. OH+CH4<=>CH3+H2O 1.00E+08 1.6 3120.0 99. OH+CO<=>H+CO2 4.76E+07 1.2 70.0 100. OH+HCO<=>H2O+CO 5.00E+13 0.0 0.0 101. OH+CH2O<=>HCO+H2O 3.43E+09 1.2 -447.0 102. OH+CH2OH<=>H2O+CH2O 5.00E+12 0.0 0.0
A-5

(k = A T**b exp(-E/RT)) REACTIONS A b E
103. OH+CH3O<=>H2O+CH2O 5.00E+12 0.0 0.0 104. OH+CH3OH<=>CH2OH+H2O 1.44E+06 2.0 -840.0 105. OH+CH3OH<=>CH3O+H2O 6.30E+06 2.0 1500.0 106. OH+C2H<=>H+HCCO 2.00E+13 0.0 0.0 107. OH+C2H2<=>H+CH2CO 2.18E-04 4.5 -1000.0 108. OH+C2H2<=>H+HCCOH 5.04E+05 2.3 13500.0 109. OH+C2H2<=>C2H+H2O 3.37E+07 2.0 14000.0 110. OH+C2H2<=>CH3+CO 4.83E-04 4.0 -2000.0 111. OH+C2H3<=>H2O+C2H2 5.00E+12 0.0 0.0 112. OH+C2H4<=>C2H3+H2O 3.60E+06 2.0 2500.0 113. OH+C2H6<=>C2H5+H2O 3.54E+06 2.1 870.0 114. OH+CH2CO<=>HCCO+H2O 7.50E+12 0.0 2000.0 115. 2HO2<=>O2+H2O2 1.30E+11 0.0 -1630.0 Declared duplicate reaction... 116. 2HO2<=>O2+H2O2 4.20E+14 0.0 12000.0 Declared duplicate reaction... 117. HO2+CH2<=>OH+CH2O 2.00E+13 0.0 0.0 118. HO2+CH3<=>O2+CH4 1.00E+12 0.0 0.0 119. HO2+CH3<=>OH+CH3O 2.00E+13 0.0 0.0 120. HO2+CO<=>OH+CO2 1.50E+14 0.0 23600.0 121. HO2+CH2O<=>HCO+H2O2 1.00E+12 0.0 8000.0 122. C+O2<=>O+CO 5.80E+13 0.0 576.0 123. C+CH2<=>H+C2H 5.00E+13 0.0 0.0 124. C+CH3<=>H+C2H2 5.00E+13 0.0 0.0 125. CH+O2<=>O+HCO 3.30E+13 0.0 0.0 126. CH+H2<=>H+CH2 1.11E+08 1.8 1670.0 127. CH+H2O<=>H+CH2O 1.71E+13 0.0 -755.0 128. CH+CH2<=>H+C2H2 4.00E+13 0.0 0.0 129. CH+CH3<=>H+C2H3 3.00E+13 0.0 0.0 130. CH+CH4<=>H+C2H4 6.00E+13 0.0 0.0 131. CH+CO(+M)<=>HCCO(+M) 5.00E+13 0.0 0.0 Low pressure limit: 0.26900E+29 -0.37400E+01 0.19360E+04 TROE centering: 0.57570E+00 0.23700E+03 0.16520E+04 0.50690E+04 H2 Enhanced by 2.000E+00 H2O Enhanced by 6.000E+00 CH4 Enhanced by 2.000E+00 CO Enhanced by 1.500E+00 CO2 Enhanced by 2.000E+00 C2H6 Enhanced by 3.000E+00 AR Enhanced by 7.000E-01 132. CH+CO2<=>HCO+CO 3.40E+12 0.0 690.0 133. CH+CH2O<=>H+CH2CO 9.46E+13 0.0 -515.0 134. CH+HCCO<=>CO+C2H2 5.00E+13 0.0 0.0 135. CH2+O2<=>OH+HCO 1.32E+13 0.0 1500.0 136. CH2+H2<=>H+CH3 5.00E+05 2.0 7230.0 137. 2CH2<=>H2+C2H2 3.20E+13 0.0 0.0 138. CH2+CH3<=>H+C2H4 4.00E+13 0.0 0.0 139. CH2+CH4<=>2CH3 2.46E+06 2.0 8270.0 140. CH2+CO(+M)<=>CH2CO(+M) 8.10E+11 0.5 4510.0 Low pressure limit: 0.26900E+34 -0.51100E+01 0.70950E+04 TROE centering: 0.59070E+00 0.27500E+03 0.12260E+04 0.51850E+04 H2 Enhanced by 2.000E+00 H2O Enhanced by 6.000E+00 CH4 Enhanced by 2.000E+00 CO Enhanced by 1.500E+00 CO2 Enhanced by 2.000E+00 C2H6 Enhanced by 3.000E+00 AR Enhanced by 7.000E-01 141. CH2+HCCO<=>C2H3+CO 3.00E+13 0.0 0.0 142. CH2(S)+N2<=>CH2+N2 1.50E+13 0.0 600.0 143. CH2(S)+AR<=>CH2+AR 9.00E+12 0.0 600.0 144. CH2(S)+O2<=>H+OH+CO 2.80E+13 0.0 0.0 145. CH2(S)+O2<=>CO+H2O 1.20E+13 0.0 0.0 146. CH2(S)+H2<=>CH3+H 7.00E+13 0.0 0.0 147. CH2(S)+H2O(+M)<=>CH3OH(+M) 2.00E+13 0.0 0.0 Low pressure limit: 0.27000E+39 -0.63000E+01 0.31000E+04 TROE centering: 0.15070E+00 0.13400E+03 0.23830E+04 0.72650E+04 H2 Enhanced by 2.000E+00 H2O Enhanced by 6.000E+00 CH4 Enhanced by 2.000E+00 CO Enhanced by 1.500E+00 CO2 Enhanced by 2.000E+00 C2H6 Enhanced by 3.000E+00 148. CH2(S)+H2O<=>CH2+H2O 3.00E+13 0.0 0.0 149. CH2(S)+CH3<=>H+C2H4 1.20E+13 0.0 -570.0
A-6
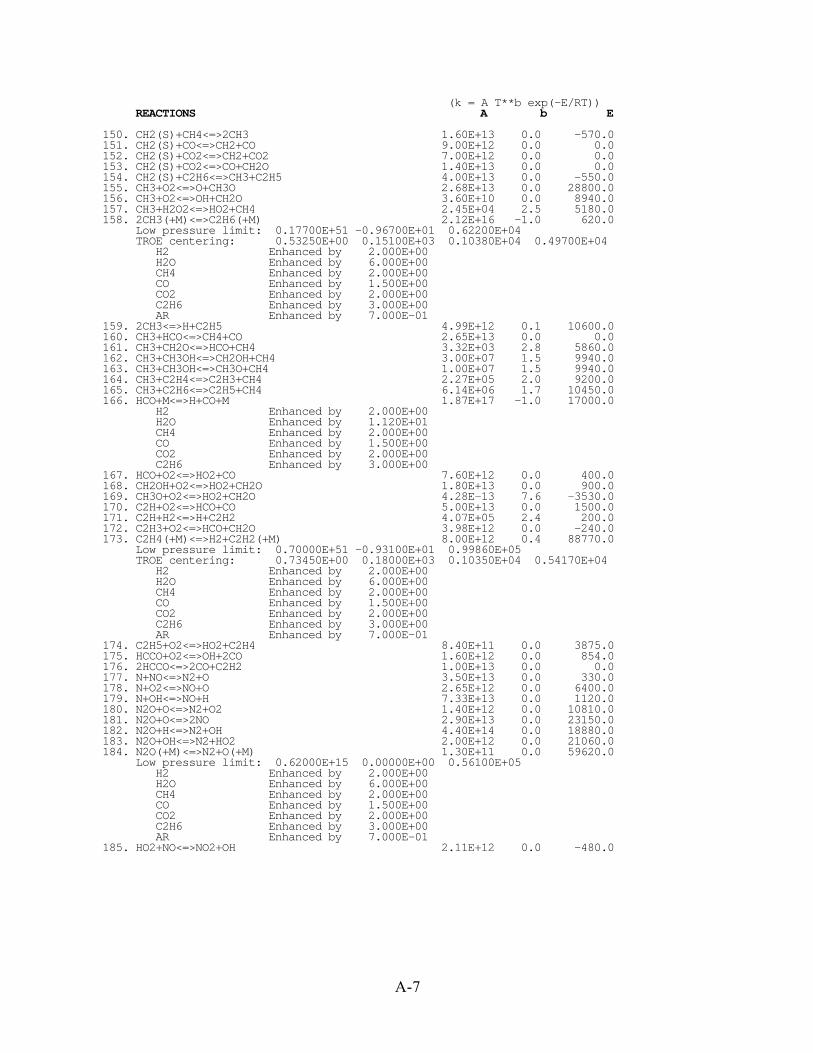
(k = A T**b exp(-E/RT)) REACTIONS A b E
150. CH2(S)+CH4<=>2CH3 1.60E+13 0.0 -570.0 151. CH2(S)+CO<=>CH2+CO 9.00E+12 0.0 0.0 152. CH2(S)+CO2<=>CH2+CO2 7.00E+12 0.0 0.0 153. CH2(S)+CO2<=>CO+CH2O 1.40E+13 0.0 0.0 154. CH2(S)+C2H6<=>CH3+C2H5 4.00E+13 0.0 -550.0 155. CH3+O2<=>O+CH3O 2.68E+13 0.0 28800.0 156. CH3+O2<=>OH+CH2O 3.60E+10 0.0 8940.0 157. CH3+H2O2<=>HO2+CH4 2.45E+04 2.5 5180.0 158. 2CH3(+M)<=>C2H6(+M) 2.12E+16 -1.0 620.0 Low pressure limit: 0.17700E+51 -0.96700E+01 0.62200E+04 TROE centering: 0.53250E+00 0.15100E+03 0.10380E+04 0.49700E+04 H2 Enhanced by 2.000E+00 H2O Enhanced by 6.000E+00 CH4 Enhanced by 2.000E+00 CO Enhanced by 1.500E+00 CO2 Enhanced by 2.000E+00 C2H6 Enhanced by 3.000E+00 AR Enhanced by 7.000E-01 159. 2CH3<=>H+C2H5 4.99E+12 0.1 10600.0 160. CH3+HCO<=>CH4+CO 2.65E+13 0.0 0.0 161. CH3+CH2O<=>HCO+CH4 3.32E+03 2.8 5860.0 162. CH3+CH3OH<=>CH2OH+CH4 3.00E+07 1.5 9940.0 163. CH3+CH3OH<=>CH3O+CH4 1.00E+07 1.5 9940.0 164. CH3+C2H4<=>C2H3+CH4 2.27E+05 2.0 9200.0 165. CH3+C2H6<=>C2H5+CH4 6.14E+06 1.7 10450.0 166. HCO+M<=>H+CO+M 1.87E+17 -1.0 17000.0 H2 Enhanced by 2.000E+00 H2O Enhanced by 1.120E+01 CH4 Enhanced by 2.000E+00 CO Enhanced by 1.500E+00 CO2 Enhanced by 2.000E+00 C2H6 Enhanced by 3.000E+00 167. HCO+O2<=>HO2+CO 7.60E+12 0.0 400.0 168. CH2OH+O2<=>HO2+CH2O 1.80E+13 0.0 900.0 169. CH3O+O2<=>HO2+CH2O 4.28E-13 7.6 -3530.0 170. C2H+O2<=>HCO+CO 5.00E+13 0.0 1500.0 171. C2H+H2<=>H+C2H2 4.07E+05 2.4 200.0 172. C2H3+O2<=>HCO+CH2O 3.98E+12 0.0 -240.0 173. C2H4(+M)<=>H2+C2H2(+M) 8.00E+12 0.4 88770.0 Low pressure limit: 0.70000E+51 -0.93100E+01 0.99860E+05 TROE centering: 0.73450E+00 0.18000E+03 0.10350E+04 0.54170E+04 H2 Enhanced by 2.000E+00 H2O Enhanced by 6.000E+00 CH4 Enhanced by 2.000E+00 CO Enhanced by 1.500E+00 CO2 Enhanced by 2.000E+00 C2H6 Enhanced by 3.000E+00 AR Enhanced by 7.000E-01 174. C2H5+O2<=>HO2+C2H4 8.40E+11 0.0 3875.0 175. HCCO+O2<=>OH+2CO 1.60E+12 0.0 854.0 176. 2HCCO<=>2CO+C2H2 1.00E+13 0.0 0.0 177. N+NO<=>N2+O 3.50E+13 0.0 330.0 178. N+O2<=>NO+O 2.65E+12 0.0 6400.0 179. N+OH<=>NO+H 7.33E+13 0.0 1120.0 180. N2O+O<=>N2+O2 1.40E+12 0.0 10810.0 181. N2O+O<=>2NO 2.90E+13 0.0 23150.0 182. N2O+H<=>N2+OH 4.40E+14 0.0 18880.0 183. N2O+OH<=>N2+HO2 2.00E+12 0.0 21060.0 184. N2O(+M)<=>N2+O(+M) 1.30E+11 0.0 59620.0 Low pressure limit: 0.62000E+15 0.00000E+00 0.56100E+05 H2 Enhanced by 2.000E+00 H2O Enhanced by 6.000E+00 CH4 Enhanced by 2.000E+00 CO Enhanced by 1.500E+00 CO2 Enhanced by 2.000E+00 C2H6 Enhanced by 3.000E+00 AR Enhanced by 7.000E-01 185. HO2+NO<=>NO2+OH 2.11E+12 0.0 -480.0
A-7

(k = A T**b exp(-E/RT)) REACTIONS A b E
186. NO+O+M<=>NO2+M 1.06E+20 -1.4 0.0 H2 Enhanced by 2.000E+00 H2O Enhanced by 6.000E+00 CH4 Enhanced by 2.000E+00 CO Enhanced by 1.500E+00 CO2 Enhanced by 2.000E+00 C2H6 Enhanced by 3.000E+00 AR Enhanced by 7.000E-01 187. NO2+O<=>NO+O2 3.90E+12 0.0 -240.0 188. NO2+H<=>NO+OH 1.32E+14 0.0 360.0 189. NH+O<=>NO+H 5.00E+13 0.0 0.0 190. NH+H<=>N+H2 3.20E+13 0.0 330.0 191. NH+OH<=>HNO+H 2.00E+13 0.0 0.0 192. NH+OH<=>N+H2O 2.00E+09 1.2 0.0 193. NH+O2<=>HNO+O 4.61E+05 2.0 6500.0 194. NH+O2<=>NO+OH 1.28E+06 1.5 100.0 195. NH+N<=>N2+H 1.50E+13 0.0 0.0 196. NH+H2O<=>HNO+H2 2.00E+13 0.0 13850.0 197. NH+NO<=>N2+OH 2.16E+13 -0.2 0.0 198. NH+NO<=>N2O+H 4.16E+14 -0.5 0.0 199. NH2+O<=>OH+NH 7.00E+12 0.0 0.0 200. NH2+O<=>H+HNO 4.60E+13 0.0 0.0 201. NH2+H<=>NH+H2 4.00E+13 0.0 3650.0 202. NH2+OH<=>NH+H2O 9.00E+07 1.5 -460.0 203. NNH<=>N2+H 3.30E+08 0.0 0.0 Declared duplicate reaction... 204. NNH+M<=>N2+H+M 1.30E+14 -0.1 4980.0 H2 Enhanced by 2.000E+00 H2O Enhanced by 6.000E+00 CH4 Enhanced by 2.000E+00 CO Enhanced by 1.500E+00 CO2 Enhanced by 2.000E+00 C2H6 Enhanced by 3.000E+00 AR Enhanced by 7.000E-01 Declared duplicate reaction... 205. NNH+O2<=>HO2+N2 5.00E+12 0.0 0.0 206. NNH+O<=>OH+N2 2.50E+13 0.0 0.0 207. NNH+O<=>NH+NO 7.00E+13 0.0 0.0 208. NNH+H<=>H2+N2 5.00E+13 0.0 0.0 209. NNH+OH<=>H2O+N2 2.00E+13 0.0 0.0 210. NNH+CH3<=>CH4+N2 2.50E+13 0.0 0.0 211. H+NO+M<=>HNO+M 8.95E+19 -1.3 740.0 H2 Enhanced by 2.000E+00 H2O Enhanced by 6.000E+00 CH4 Enhanced by 2.000E+00 CO Enhanced by 1.500E+00 CO2 Enhanced by 2.000E+00 C2H6 Enhanced by 3.000E+00 AR Enhanced by 7.000E-01 212. HNO+O<=>NO+OH 2.50E+13 0.0 0.0 213. HNO+H<=>H2+NO 4.50E+11 0.7 660.0 214. HNO+OH<=>NO+H2O 1.30E+07 1.9 -950.0 215. HNO+O2<=>HO2+NO 1.00E+13 0.0 13000.0 216. CN+O<=>CO+N 7.70E+13 0.0 0.0 217. CN+OH<=>NCO+H 4.00E+13 0.0 0.0 218. CN+H2O<=>HCN+OH 8.00E+12 0.0 7460.0 219. CN+O2<=>NCO+O 6.14E+12 0.0 -440.0 220. CN+H2<=>HCN+H 2.10E+13 0.0 4710.0 221. NCO+O<=>NO+CO 2.35E+13 0.0 0.0 222. NCO+H<=>NH+CO 5.40E+13 0.0 0.0 223. NCO+OH<=>NO+H+CO 2.50E+12 0.0 0.0 224. NCO+N<=>N2+CO 2.00E+13 0.0 0.0 225. NCO+O2<=>NO+CO2 2.00E+12 0.0 20000.0 226. NCO+M<=>N+CO+M 8.80E+16 -0.5 48000.0 H2 Enhanced by 2.000E+00 H2O Enhanced by 6.000E+00 CH4 Enhanced by 2.000E+00 CO Enhanced by 1.500E+00 CO2 Enhanced by 2.000E+00 C2H6 Enhanced by 3.000E+00 AR Enhanced by 7.000E-01 227. NCO+NO<=>N2O+CO 2.85E+17 -1.5 740.0 228. NCO+NO<=>N2+CO2 5.70E+18 -2.0 800.0
A-8

(k = A T**b exp(-E/RT)) REACTIONS A b E
229. HCN+M<=>H+CN+M 1.04E+29 -3.3 126600.0 H2 Enhanced by 2.000E+00 H2O Enhanced by 6.000E+00 CH4 Enhanced by 2.000E+00 CO Enhanced by 1.500E+00 CO2 Enhanced by 2.000E+00 C2H6 Enhanced by 3.000E+00 AR Enhanced by 7.000E-01 230. HCN+O<=>NCO+H 1.11E+04 2.6 4980.0 231. HCN+O<=>NH+CO 2.77E+03 2.6 4980.0 232. HCN+O<=>CN+OH 2.13E+09 1.6 26600.0 233. HCN+OH<=>HOCN+H 1.10E+06 2.0 13370.0 234. HCN+OH<=>HNCO+H 4.40E+03 2.3 6400.0 235. HCN+OH<=>NH2+CO 1.60E+02 2.6 9000.0 236. H+HCN+M<=>H2CN+M 1.40E+26 -3.4 1900.0 H2 Enhanced by 2.000E+00 H2O Enhanced by 6.000E+00 CH4 Enhanced by 2.000E+00 CO Enhanced by 1.500E+00 CO2 Enhanced by 2.000E+00 C2H6 Enhanced by 3.000E+00 AR Enhanced by 7.000E-01 237. H2CN+N<=>N2+CH2 6.00E+13 0.0 400.0 238. C+N2<=>CN+N 6.30E+13 0.0 46020.0 239. CH+N2<=>HCN+N 2.86E+08 1.1 20400.0 240. CH+N2(+M)<=>HCNN(+M) 3.10E+12 0.1 0.0 Low pressure limit: 0.13000E+26 -0.31600E+01 0.74000E+03 TROE centering: 0.66700E+00 0.23500E+03 0.21170E+04 0.45360E+04 H2 Enhanced by 2.000E+00 H2O Enhanced by 6.000E+00 CH4 Enhanced by 2.000E+00 CO Enhanced by 1.500E+00 CO2 Enhanced by 2.000E+00 C2H6 Enhanced by 3.000E+00 AR Enhanced by 7.000E-01 241. CH2+N2<=>HCN+NH 1.00E+13 0.0 74000.0 242. CH2(S)+N2<=>NH+HCN 1.00E+11 0.0 65000.0 243. C+NO<=>CN+O 1.90E+13 0.0 0.0 244. C+NO<=>CO+N 2.90E+13 0.0 0.0 245. CH+NO<=>HCN+O 5.00E+13 0.0 0.0 246. CH+NO<=>H+NCO 2.00E+13 0.0 0.0 247. CH+NO<=>N+HCO 3.00E+13 0.0 0.0 248. CH2+NO<=>H+HNCO 3.10E+17 -1.4 1270.0 249. CH2+NO<=>OH+HCN 2.90E+14 -0.7 760.0 250. CH2+NO<=>H+HCNO 3.80E+13 -0.4 580.0 251. CH2(S)+NO<=>H+HNCO 3.10E+17 -1.4 1270.0 252. CH2(S)+NO<=>OH+HCN 2.90E+14 -0.7 760.0 253. CH2(S)+NO<=>H+HCNO 3.80E+13 -0.4 580.0 254. CH3+NO<=>HCN+H2O 9.60E+13 0.0 28800.0 255. CH3+NO<=>H2CN+OH 1.00E+12 0.0 21750.0 256. HCNN+O<=>CO+H+N2 2.20E+13 0.0 0.0 257. HCNN+O<=>HCN+NO 2.00E+12 0.0 0.0 258. HCNN+O2<=>O+HCO+N2 1.20E+13 0.0 0.0 259. HCNN+OH<=>H+HCO+N2 1.20E+13 0.0 0.0 260. HCNN+H<=>CH2+N2 1.00E+14 0.0 0.0 261. HNCO+O<=>NH+CO2 9.80E+07 1.4 8500.0 262. HNCO+O<=>HNO+CO 1.50E+08 1.6 44000.0 263. HNCO+O<=>NCO+OH 2.20E+06 2.1 11400.0 264. HNCO+H<=>NH2+CO 2.25E+07 1.7 3800.0 265. HNCO+H<=>H2+NCO 1.05E+05 2.5 13300.0 266. HNCO+OH<=>NCO+H2O 4.65E+12 0.0 6850.0 267. HNCO+OH<=>NH2+CO2 1.55E+12 0.0 6850.0 268. HNCO+M<=>NH+CO+M 1.18E+16 0.0 84720.0 H2 Enhanced by 2.000E+00 H2O Enhanced by 6.000E+00 CH4 Enhanced by 2.000E+00 CO Enhanced by 1.500E+00 CO2 Enhanced by 2.000E+00 C2H6 Enhanced by 3.000E+00 AR Enhanced by 7.000E-01 269. HCNO+H<=>H+HNCO 2.10E+15 -0.7 2850.0 270. HCNO+H<=>OH+HCN 2.70E+11 0.2 2120.0 271. HCNO+H<=>NH2+CO 1.70E+14 -0.8 2890.0 272. HOCN+H<=>H+HNCO 2.00E+07 2.0 2000.0 273. HCCO+NO<=>HCNO+CO 2.35E+13 0.0 0.0
A-9

(k = A T**b exp(-E/RT)) REACTIONS A b E
274. CH3+N<=>H2CN+H 6.10E+14 -0.3 290.0 275. CH3+N<=>HCN+H2 3.70E+12 0.1 -90.0 276. NH3+H<=>NH2+H2 5.40E+05 2.4 9915.0 277. NH3+OH<=>NH2+H2O 5.00E+07 1.6 955.0 278. NH3+O<=>NH2+OH 9.40E+06 1.9 6460.0!End GRI-Mech 2.1
!Bowman's SNCR mechanism 279. NH2+O=NO+H2 5.00E+12 0.0 0.0 280. NH2+NO=NNH+OH 2.80E+13 -0.6 0.0 281. NH2+NO=N2+H2O 1.30E+16 -1.2 0.0 Declared duplicate reaction... 282. NH2+NO=N2+H2O -2.80E+13 -0.6 0.0 Declared duplicate reaction... 283. NNH+NO=N2+HNO 5.00E+13 0.0 0.0 284. NNH+NH2=N2+NH3 5.00E+13 0.0 0.0 285. NNH+NH=N2+NH2 5.00E+13 0.0 0.0 286. NNH+O=N2O+H 1.00E+14 0.0 0.0 287. HNO+NH2=NH3+NO 2.00E+13 0.0 1000.0 288. HNO+HNO=N2O+H2O 3.95E+12 0.0 5000.0 289. HNO+NO=N2O+OH 2.00E+12 0.0 26000.0 290. NH2+NH=N2H2+H 1.50E+15 -0.5 0.0 291. NH+NH=N2+H+H 2.50E+13 0.0 0.0 292. NH2+N=N2+H+H 7.20E+13 0.0 0.0 293. N2H2+M=NNH+H+M 5.00E+16 0.0 50000.0 H2O Enhanced by 1.500E+01 O2 Enhanced by 2.000E+00 N2 Enhanced by 2.000E+00 H2 Enhanced by 2.000E+00 294. N2H2+H=NNH+H2 5.00E+13 0.0 1000.0 295. N2H2+O=NH2+NO 1.00E+13 0.0 0.0 296. N2H2+O=NNH+OH 2.00E+13 0.0 1000.0 297. N2H2+OH=NNH+H2O 1.00E+13 0.0 1000.0 298. N2H2+NO=N2O+NH2 3.00E+12 0.0 0.0 299. N2H2+NH=NNH+NH2 1.00E+13 0.0 1000.0 300. N2H2+NH2=NH3+NNH 1.00E+13 0.0 1000.0 301. NH2+NH2=N2H2+H2 5.00E+11 0.0 0.0 302. NH2+O2=HNO+OH 4.50E+12 0.0 25000.0 303. NCO+NO2=N2O+CO2 5.80E+14 -0.7 0.0 304. NH+HNCO=NH2+NCO 3.00E+13 0.0 23700.0 305. NH2+HNCO=NH3+NCO 1.00E+12 0.0 6955.0 306. HO2+HNCO=NCO+H2O2 3.00E+11 0.0 29000.0 307. NH3+HO2=NH2+H2O2 3.00E+11 0.0 22000.0 308. NH2+NO2=N2O+H2O 2.84E+18 -2.2 0.0 309. NH+NO2=N2O+OH 1.00E+13 0.0 0.0 310. NH2+NH2=NH+NH3 5.00E+13 0.0 10000.0 311. NH2+HO2=NH3+O2 4.30E+13 0.0 0.0 312. NO2+SO2=NO+SO3 6.31E+12 0.0 27000.0!End of Bowman's SNCR mechanism
!Reactions of sulfur oxides 313. SO2+O+M=SO3+M 1.45E+16 0.0 2000.0 314. SO2+OH+M=HSO3+M 2.12E+25 -3.3 0.0 315. HSO3+O2=HO2+SO3 7.83E+11 0.0 656.0 316. O+SO3=SO2+O2 1.32E+12 0.0 6100.0
!Reactions of sodium 317. NA2CO3=>NA2O+CO2 2.54E+06 0.0 25820.0 318. NA2O+CO2=>NA2CO3 1.11E+05 0.0 -15000.0 319. NA2O+H2O<=>2NAOH 9.18E+12 0.0 3120.0 320. NA+N2O=NAO+N2 1.69E+14 0.0 3159.0 321. NAO+H2O=NAOH+OH 1.32E+13 0.0 0.0 322. NAO+O=NA+O2 2.23E+14 0.0 0.0 323. NAO+NO=NA+NO2 9.04E+13 0.0 0.0 324. NAO+H2=NAOH+H 1.25E+13 0.0 0.0 325. NA+O2+M=NAO2+M 1.74E+21 -1.3 0.0 H2O Enhanced by 5.000E+00 CO2 Enhanced by 3.000E+00 CO Enhanced by 2.000E+00 H2 Enhanced by 2.000E+00 326. NAOH+H=NA+H2O 5.00E+13 0.0 0.0 327. NA+OH+M=NAOH+M 1.82E+21 -1.0 0.0 328. NAO+OH=NAOH+O 2.00E+13 0.0 0.0 329. NAO+HO2=NAOH+O2 5.00E+13 0.0 0.0 330. NAO+H2=NA+H2O 3.13E+12 0.0 0.0
A-10
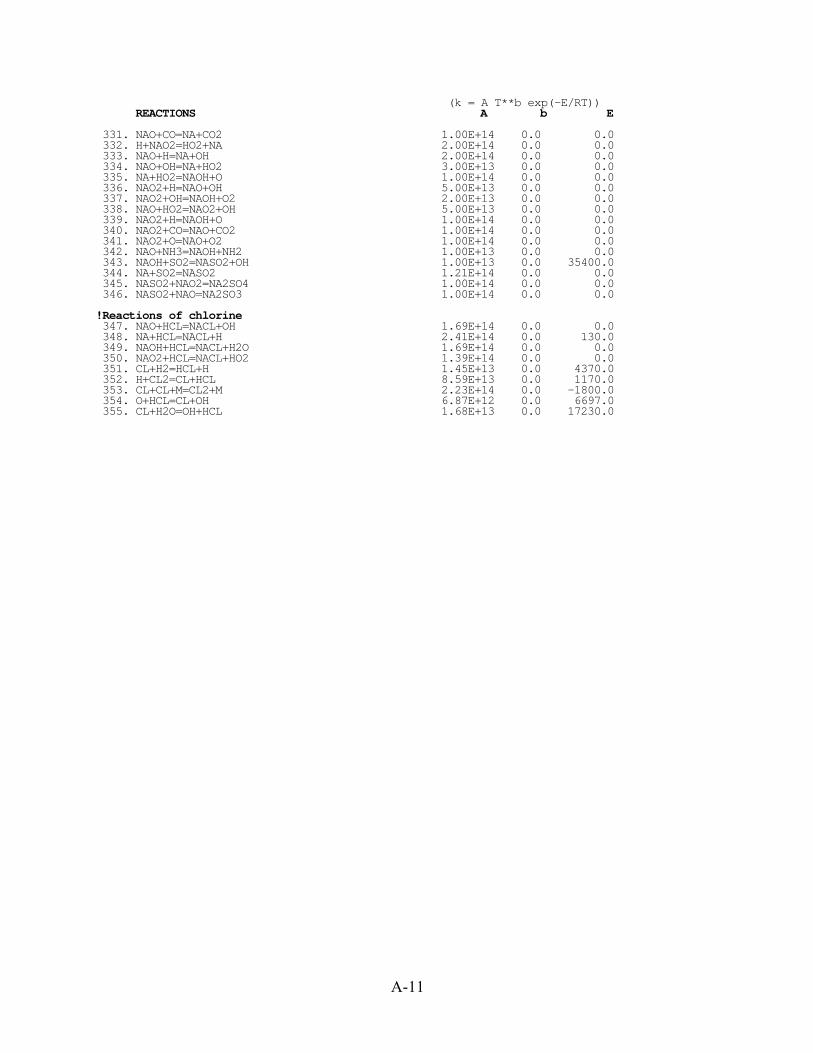
(k = A T**b exp(-E/RT)) REACTIONS A b E
331. NAO+CO=NA+CO2 1.00E+14 0.0 0.0 332. H+NAO2=HO2+NA 2.00E+14 0.0 0.0 333. NAO+H=NA+OH 2.00E+14 0.0 0.0 334. NAO+OH=NA+HO2 3.00E+13 0.0 0.0 335. NA+HO2=NAOH+O 1.00E+14 0.0 0.0 336. NAO2+H=NAO+OH 5.00E+13 0.0 0.0 337. NAO2+OH=NAOH+O2 2.00E+13 0.0 0.0 338. NAO+HO2=NAO2+OH 5.00E+13 0.0 0.0 339. NAO2+H=NAOH+O 1.00E+14 0.0 0.0 340. NAO2+CO=NAO+CO2 1.00E+14 0.0 0.0 341. NAO2+O=NAO+O2 1.00E+14 0.0 0.0 342. NAO+NH3=NAOH+NH2 1.00E+13 0.0 0.0 343. NAOH+SO2=NASO2+OH 1.00E+13 0.0 35400.0 344. NA+SO2=NASO2 1.21E+14 0.0 0.0 345. NASO2+NAO2=NA2SO4 1.00E+14 0.0 0.0 346. NASO2+NAO=NA2SO3 1.00E+14 0.0 0.0
!Reactions of chlorine 347. NAO+HCL=NACL+OH 1.69E+14 0.0 0.0 348. NA+HCL=NACL+H 2.41E+14 0.0 130.0 349. NAOH+HCL=NACL+H2O 1.69E+14 0.0 0.0 350. NAO2+HCL=NACL+HO2 1.39E+14 0.0 0.0 351. CL+H2=HCL+H 1.45E+13 0.0 4370.0 352. H+CL2=CL+HCL 8.59E+13 0.0 1170.0 353. CL+CL+M=CL2+M 2.23E+14 0.0 -1800.0 354. O+HCL=CL+OH 6.87E+12 0.0 6697.0 355. CL+H2O=OH+HCL 1.68E+13 0.0 17230.0
A-11
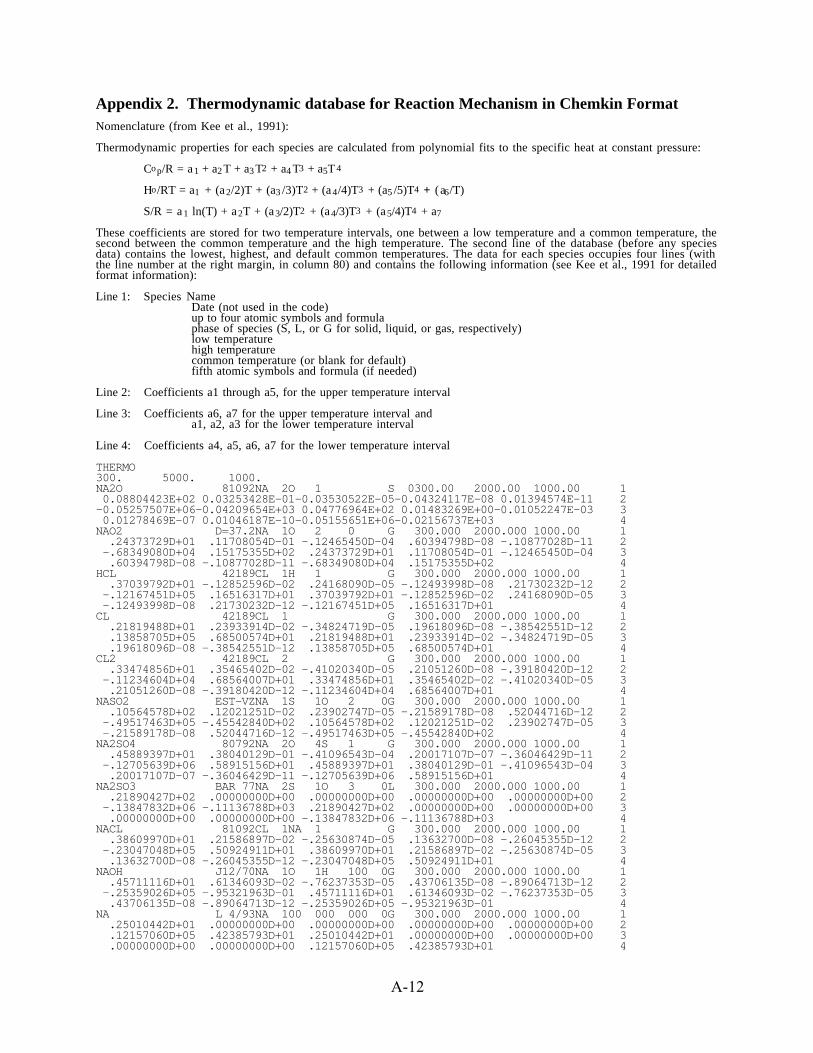
Appendix 2. Thermodynamic database for Reaction Mechanism in Chemkin FormatNomenclature (from Kee et al., 1991):
Thermodynamic properties for each species are calculated from polynomial fits to the specific heat at constant pressure:
Cop/R = a 1 + a2 T + a3 T2 + a4 T3 + a5T 4
Ho/RT = a1 + (a2/2)T + (a3 /3)T2 + (a4/4)T3 + (a5 /5)T4 + (a6/T)
S/R = a 1 ln(T) + a2T + (a3/2)T2 + (a4/3)T3 + (a5/4)T4 + a7
These coefficients are stored for two temperature intervals, one between a low temperature and a common temperature, thesecond between the common temperature and the high temperature. The second line of the database (before any speciesdata) contains the lowest, highest, and default common temperatures. The data for each species occupies four lines (withthe line number at the right margin, in column 80) and contains the following information (see Kee et al., 1991 for detailedformat information):
Line 1: Species NameDate (not used in the code) up to four atomic symbols and formulaphase of species (S, L, or G for solid, liquid, or gas, respectively)low temperaturehigh temperaturecommon temperature (or blank for default)fifth atomic symbols and formula (if needed)
Line 2: Coefficients a1 through a5, for the upper temperature interval
Line 3: Coefficients a6, a7 for the upper temperature interval anda1, a2, a3 for the lower temperature interval
Line 4: Coefficients a4, a5, a6, a7 for the lower temperature interval
THERMO 300. 5000. 1000.NA2O 81092NA 2O 1 S 0300.00 2000.00 1000.00 1 0.08804423E+02 0.03253428E-01-0.03530522E-05-0.04324117E-08 0.01394574E-11 2-0.05257507E+06-0.04209654E+03 0.04776964E+02 0.01483269E+00-0.01052247E-03 3 0.01278469E-07 0.01046187E-10-0.05155651E+06-0.02156737E+03 4NAO2 D=37.2NA 1O 2 0 G 300.000 2000.000 1000.00 1 .24373729D+01 .11708054D-01 -.12465450D-04 .60394798D-08 -.10877028D-11 2 -.68349080D+04 .15175355D+02 .24373729D+01 .11708054D-01 -.12465450D-04 3 .60394798D-08 -.10877028D-11 -.68349080D+04 .15175355D+02 4HCL 42189CL 1H 1 G 300.000 2000.000 1000.00 1 .37039792D+01 -.12852596D-02 .24168090D-05 -.12493998D-08 .21730232D-12 2 -.12167451D+05 .16516317D+01 .37039792D+01 -.12852596D-02 .24168090D-05 3 -.12493998D-08 .21730232D-12 -.12167451D+05 .16516317D+01 4CL 42189CL 1 G 300.000 2000.000 1000.00 1 .21819488D+01 .23933914D-02 -.34824719D-05 .19618096D-08 -.38542551D-12 2 .13858705D+05 .68500574D+01 .21819488D+01 .23933914D-02 -.34824719D-05 3 .19618096D-08 -.38542551D-12 .13858705D+05 .68500574D+01 4CL2 42189CL 2 G 300.000 2000.000 1000.00 1 .33474856D+01 .35465402D-02 -.41020340D-05 .21051260D-08 -.39180420D-12 2 -.11234604D+04 .68564007D+01 .33474856D+01 .35465402D-02 -.41020340D-05 3 .21051260D-08 -.39180420D-12 -.11234604D+04 .68564007D+01 4NASO2 EST-VZNA 1S 1O 2 0G 300.000 2000.000 1000.00 1 .10564578D+02 .12021251D-02 .23902747D-05 -.21589178D-08 .52044716D-12 2 -.49517463D+05 -.45542840D+02 .10564578D+02 .12021251D-02 .23902747D-05 3 -.21589178D-08 .52044716D-12 -.49517463D+05 -.45542840D+02 4NA2SO4 80792NA 2O 4S 1 G 300.000 2000.000 1000.00 1 .45889397D+01 .38040129D-01 -.41096543D-04 .20017107D-07 -.36046429D-11 2 -.12705639D+06 .58915156D+01 .45889397D+01 .38040129D-01 -.41096543D-04 3 .20017107D-07 -.36046429D-11 -.12705639D+06 .58915156D+01 4NA2SO3 BAR 77NA 2S 1O 3 0L 300.000 2000.000 1000.00 1 .21890427D+02 .00000000D+00 .00000000D+00 .00000000D+00 .00000000D+00 2 -.13847832D+06 -.11136788D+03 .21890427D+02 .00000000D+00 .00000000D+00 3 .00000000D+00 .00000000D+00 -.13847832D+06 -.11136788D+03 4NACL 81092CL 1NA 1 G 300.000 2000.000 1000.00 1 .38609970D+01 .21586897D-02 -.25630874D-05 .13632700D-08 -.26045355D-12 2 -.23047048D+05 .50924911D+01 .38609970D+01 .21586897D-02 -.25630874D-05 3 .13632700D-08 -.26045355D-12 -.23047048D+05 .50924911D+01 4NAOH J12/70NA 1O 1H 100 0G 300.000 2000.000 1000.00 1 .45711116D+01 .61346093D-02 -.76237353D-05 .43706135D-08 -.89064713D-12 2 -.25359026D+05 -.95321963D-01 .45711116D+01 .61346093D-02 -.76237353D-05 3 .43706135D-08 -.89064713D-12 -.25359026D+05 -.95321963D-01 4NA L 4/93NA 100 000 000 0G 300.000 2000.000 1000.00 1 .25010442D+01 .00000000D+00 .00000000D+00 .00000000D+00 .00000000D+00 2 .12157060D+05 .42385793D+01 .25010442D+01 .00000000D+00 .00000000D+00 3 .00000000D+00 .00000000D+00 .12157060D+05 .42385793D+01 4
A-12

NAO J12/67NA 1O 100 000 0G 300.000 2000.000 1000.00 1 .36192660D+01 .29441938D-02 -.35206654D-05 .18827273D-08 -.36198896D-12 2 .88821327D+04 .62033018D+01 .36192660D+01 .29441938D-02 -.35206654D-05 3 .18827273D-08 -.36198896D-12 .88821327D+04 .62033018D+01 4NA2CO3(S) J 3/66NA 2C 1O 3 0S 300.000 2000.000 1000.00 1 .12014036D+02 -.50536347D-02 .25519440D-04 -.13688606D-07 .27714728D-11 2 -.13815566D+06 -.48715125D+02 .12014036D+02 -.50536347D-02 .25519440D-04 3 -.13688606D-07 .27714728D-11 -.13815566D+06 -.48715125D+02 4NA2CO3(L) J 3/66NA 2C 1O 3 0L 300.000 2000.000 1000.00 1 .22796238D+02 .00000000D+00 .00000000D+00 .00000000D+00 .00000000D+00 2 -.14229112D+06 -.11622189D+03 .22796238D+02 .00000000D+00 .00000000D+00 3 .00000000D+00 .00000000D+00 -.14229112D+06 -.11622189D+03 4NA2CO3 BENSONNA 2C 1O 3 0G 300.000 2000.000 1000.00 1 .56157861D+01 .25916438D-01 .25963740D-05 -.15866667D-07 .51192999D-11 2 -.13627651D+06 -.21019356D+02 .56157861D+01 .25916438D-01 .25963740D-05 3 -.15866667D-07 .51192999D-11 -.13627651D+06 -.21019356D+02 4HSO3 T 3/96H 1S 1O 3 0G 300.000 2000.00 1000.00 1 .29221355D+01 .24537632D-01 -.28258748D-04 .14728290D-07 -.28007910D-11 2 -.48042084D+05 .12532987D+02 .29221355D+01 .24537632D-01 -.28258748D-04 3 .14728290D-07 -.28007910D-11 -.48042084D+05 .12532987D+02 4SO2 121286S 1O 2 G 0300.00 5000.00 1000.00 1 0.05254498E+02 0.01978545E-01-0.08204226E-05 0.15763830E-09-0.11204512E-13 2-0.03756885E+06-0.11460563E+01 0.02911438E+02 0.08103022E-01-0.06906710E-04 3 0.03329015E-07-0.08777121E-11-0.03687881E+06 0.11117403E+02 4SO3 121286S 1O 3 G 0300.00 5000.00 1000.00 1 0.07050668E+02 0.03246560E-01-0.14088974E-05 0.02721535E-08-0.01942364E-12 2-0.05020667E+06-0.11064426E+02 0.02575282E+02 0.15150916E-01-0.12298717E-04 3 0.04240257E-07-0.05266812E-11-0.04894410E+06 0.12195116E+02 4CH3O2 L184 C 1H 3O 2 G 300.000 5000.00 1000.00 1 0.66812963E 01 0.80057271E-02-0.27188507E-05 0.40631365E-09-0.21927725E-13 2 0.52621851E 03-0.99423847E 01 0.20986490E 01 0.15786357E-01 0.75683261E-07 3-0.11274587E-07 0.56665133E-11 0.20695879E 04 0.15007068E 02 4CH3O2H BENSON/Vit C 1H 4O 2 G 300.000 2000.000 1000.00 1 .70880631D+02 -.34336913D+00 .54005126D-03 -.32136525D-06 .65219886D-10 2 -.24541521D+05 -.29072672D+03 .70880631D+02 -.34336913D+00 .54005126D-03 3 -.32136525D-06 .65219886D-10 -.24541521D+05 -.29072672D+03 4CH2* L S/93C 1H 2 00 00G 200.000 3500.000 1000.000 1 2.29203842E+00 4.65588637E-03-2.01191947E-06 4.17906000E-10-3.39716365E-14 2 5.09259997E+04 8.62650169E+00 4.19860411E+00-2.36661419E-03 8.23296220E-06 3-6.68815981E-09 1.94314737E-12 5.04968163E+04-7.69118967E-01 9.93967200E+03 4HNO2 120186H 1N 1O 2 G 0200.00 6000.00 1000.00 1 0.57900059E+01 0.36505061E-02-0.12902803E-05 0.20751067E-09-0.12300051E-13 2-0.11563080E+05-0.40550308E+01 0.32100428E+01 0.81300665E-02 0.16621031E-05 3-0.95328431E-08 0.48700696E-11-0.10700764E+05 0.98200995E+01 4HNO3 121286H 1N 1O 3 G 0300.00 5000.00 1000.00 1 0.07003844E+02 0.05811493E-01-0.02333788E-04 0.04288814E-08-0.02959385E-12 2-0.01889952E+06-0.10478628E+02 0.13531850E+01 0.02220024E+00-0.01978811E-03 3 0.08773908E-07-0.16583844E-11-0.01738562E+06 0.01851868E+03 4H2O2+ 120186H 2O 2 G 0300.00 5000.00 1000.00 1 0.04573167E+02 0.04336136E-01-0.14746888E-05 0.02348903E-08-0.14316536E-13 2-0.01800696E+06 0.05011369E+01 0.03388753E+02 0.06569226E-01-0.14850125E-06 3-0.04625805E-07 0.02471514E-10-0.01766314E+06 0.06785363E+02 4O L 1/90O 1 00 00 00G 200.000 3500.000 1000.000 1 2.56942078E+00-8.59741137E-05 4.19484589E-08-1.00177799E-11 1.22833691E-15 2 2.92175791E+04 4.78433864E+00 3.16826710E+00-3.27931884E-03 6.64306396E-06 3-6.12806624E-09 2.11265971E-12 2.91222592E+04 2.05193346E+00 6.72540300E+03 4O2 TPIS89O 2 00 00 00G 200.000 3500.000 1000.000 1 3.28253784E+00 1.48308754E-03-7.57966669E-07 2.09470555E-10-2.16717794E-14 2-1.08845772E+03 5.45323129E+00 3.78245636E+00-2.99673416E-03 9.84730201E-06 3-9.68129509E-09 3.24372837E-12-1.06394356E+03 3.65767573E+00 8.68010400E+03 4H L 7/88H 1 00 00 00G 200.000 3500.000 1000.000 1 2.50000001E+00-2.30842973E-11 1.61561948E-14-4.73515235E-18 4.98197357E-22 2 2.54736599E+04-4.46682914E-01 2.50000000E+00 7.05332819E-13-1.99591964E-15 3 2.30081632E-18-9.27732332E-22 2.54736599E+04-4.46682853E-01 6.19742800E+03 4H2 TPIS78H 2 00 00 00G 200.000 3500.000 1000.000 1 3.33727920E+00-4.94024731E-05 4.99456778E-07-1.79566394E-10 2.00255376E-14 2-9.50158922E+02-3.20502331E+00 2.34433112E+00 7.98052075E-03-1.94781510E-05 3 2.01572094E-08-7.37611761E-12-9.17935173E+02 6.83010238E-01 8.46810200E+03 4
A-13
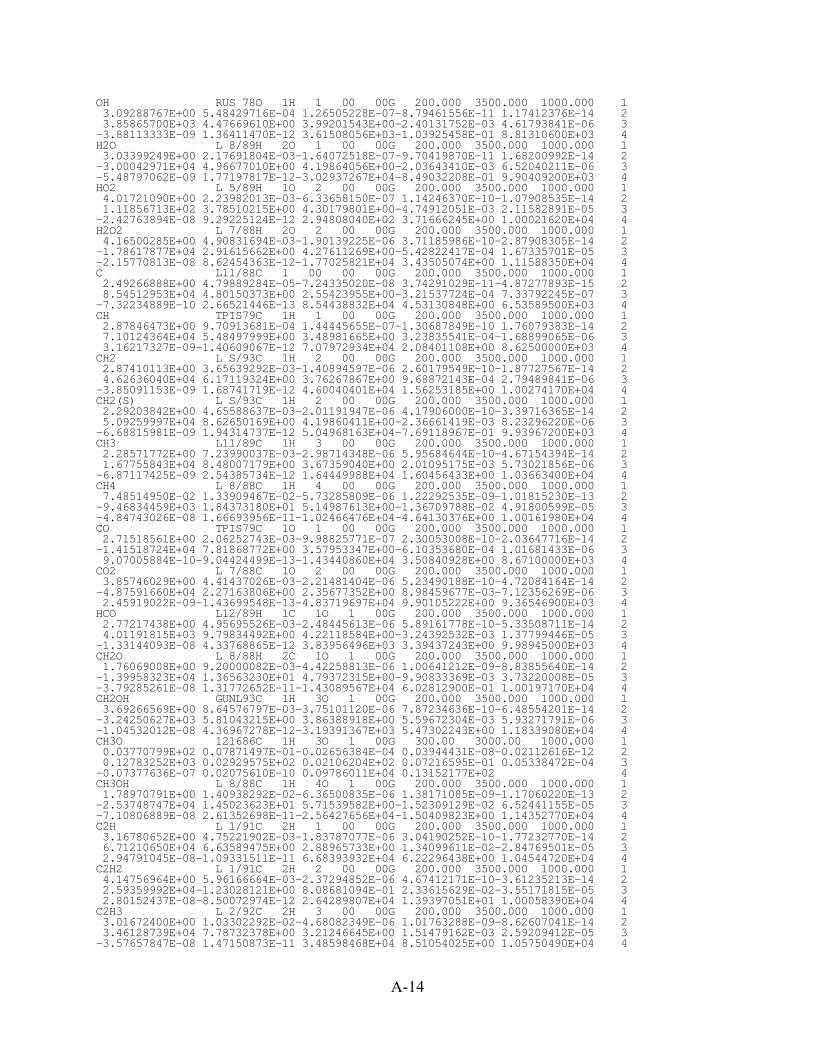
OH RUS 78O 1H 1 00 00G 200.000 3500.000 1000.000 1 3.09288767E+00 5.48429716E-04 1.26505228E-07-8.79461556E-11 1.17412376E-14 2 3.85865700E+03 4.47669610E+00 3.99201543E+00-2.40131752E-03 4.61793841E-06 3-3.88113333E-09 1.36411470E-12 3.61508056E+03-1.03925458E-01 8.81310600E+03 4H2O L 8/89H 2O 1 00 00G 200.000 3500.000 1000.000 1 3.03399249E+00 2.17691804E-03-1.64072518E-07-9.70419870E-11 1.68200992E-14 2-3.00042971E+04 4.96677010E+00 4.19864056E+00-2.03643410E-03 6.52040211E-06 3-5.48797062E-09 1.77197817E-12-3.02937267E+04-8.49032208E-01 9.90409200E+03 4HO2 L 5/89H 1O 2 00 00G 200.000 3500.000 1000.000 1 4.01721090E+00 2.23982013E-03-6.33658150E-07 1.14246370E-10-1.07908535E-14 2 1.11856713E+02 3.78510215E+00 4.30179801E+00-4.74912051E-03 2.11582891E-05 3-2.42763894E-08 9.29225124E-12 2.94808040E+02 3.71666245E+00 1.00021620E+04 4H2O2 L 7/88H 2O 2 00 00G 200.000 3500.000 1000.000 1 4.16500285E+00 4.90831694E-03-1.90139225E-06 3.71185986E-10-2.87908305E-14 2-1.78617877E+04 2.91615662E+00 4.27611269E+00-5.42822417E-04 1.67335701E-05 3-2.15770813E-08 8.62454363E-12-1.77025821E+04 3.43505074E+00 1.11588350E+04 4C L11/88C 1 00 00 00G 200.000 3500.000 1000.000 1 2.49266888E+00 4.79889284E-05-7.24335020E-08 3.74291029E-11-4.87277893E-15 2 8.54512953E+04 4.80150373E+00 2.55423955E+00-3.21537724E-04 7.33792245E-07 3-7.32234889E-10 2.66521446E-13 8.54438832E+04 4.53130848E+00 6.53589500E+03 4CH TPIS79C 1H 1 00 00G 200.000 3500.000 1000.000 1 2.87846473E+00 9.70913681E-04 1.44445655E-07-1.30687849E-10 1.76079383E-14 2 7.10124364E+04 5.48497999E+00 3.48981665E+00 3.23835541E-04-1.68899065E-06 3 3.16217327E-09-1.40609067E-12 7.07972934E+04 2.08401108E+00 8.62500000E+03 4CH2 L S/93C 1H 2 00 00G 200.000 3500.000 1000.000 1 2.87410113E+00 3.65639292E-03-1.40894597E-06 2.60179549E-10-1.87727567E-14 2 4.62636040E+04 6.17119324E+00 3.76267867E+00 9.68872143E-04 2.79489841E-06 3-3.85091153E-09 1.68741719E-12 4.60040401E+04 1.56253185E+00 1.00274170E+04 4CH2(S) L S/93C 1H 2 00 00G 200.000 3500.000 1000.000 1 2.29203842E+00 4.65588637E-03-2.01191947E-06 4.17906000E-10-3.39716365E-14 2 5.09259997E+04 8.62650169E+00 4.19860411E+00-2.36661419E-03 8.23296220E-06 3-6.68815981E-09 1.94314737E-12 5.04968163E+04-7.69118967E-01 9.93967200E+03 4CH3 L11/89C 1H 3 00 00G 200.000 3500.000 1000.000 1 2.28571772E+00 7.23990037E-03-2.98714348E-06 5.95684644E-10-4.67154394E-14 2 1.67755843E+04 8.48007179E+00 3.67359040E+00 2.01095175E-03 5.73021856E-06 3-6.87117425E-09 2.54385734E-12 1.64449988E+04 1.60456433E+00 1.03663400E+04 4CH4 L 8/88C 1H 4 00 00G 200.000 3500.000 1000.000 1 7.48514950E-02 1.33909467E-02-5.73285809E-06 1.22292535E-09-1.01815230E-13 2-9.46834459E+03 1.84373180E+01 5.14987613E+00-1.36709788E-02 4.91800599E-05 3-4.84743026E-08 1.66693956E-11-1.02466476E+04-4.64130376E+00 1.00161980E+04 4CO TPIS79C 1O 1 00 00G 200.000 3500.000 1000.000 1 2.71518561E+00 2.06252743E-03-9.98825771E-07 2.30053008E-10-2.03647716E-14 2-1.41518724E+04 7.81868772E+00 3.57953347E+00-6.10353680E-04 1.01681433E-06 3 9.07005884E-10-9.04424499E-13-1.43440860E+04 3.50840928E+00 8.67100000E+03 4CO2 L 7/88C 1O 2 00 00G 200.000 3500.000 1000.000 1 3.85746029E+00 4.41437026E-03-2.21481404E-06 5.23490188E-10-4.72084164E-14 2-4.87591660E+04 2.27163806E+00 2.35677352E+00 8.98459677E-03-7.12356269E-06 3 2.45919022E-09-1.43699548E-13-4.83719697E+04 9.90105222E+00 9.36546900E+03 4HCO L12/89H 1C 1O 1 00G 200.000 3500.000 1000.000 1 2.77217438E+00 4.95695526E-03-2.48445613E-06 5.89161778E-10-5.33508711E-14 2 4.01191815E+03 9.79834492E+00 4.22118584E+00-3.24392532E-03 1.37799446E-05 3-1.33144093E-08 4.33768865E-12 3.83956496E+03 3.39437243E+00 9.98945000E+03 4CH2O L 8/88H 2C 1O 1 00G 200.000 3500.000 1000.000 1 1.76069008E+00 9.20000082E-03-4.42258813E-06 1.00641212E-09-8.83855640E-14 2-1.39958323E+04 1.36563230E+01 4.79372315E+00-9.90833369E-03 3.73220008E-05 3-3.79285261E-08 1.31772652E-11-1.43089567E+04 6.02812900E-01 1.00197170E+04 4CH2OH GUNL93C 1H 3O 1 00G 200.000 3500.000 1000.000 1 3.69266569E+00 8.64576797E-03-3.75101120E-06 7.87234636E-10-6.48554201E-14 2-3.24250627E+03 5.81043215E+00 3.86388918E+00 5.59672304E-03 5.93271791E-06 3-1.04532012E-08 4.36967278E-12-3.19391367E+03 5.47302243E+00 1.18339080E+04 4CH3O 121686C 1H 3O 1 00G 300.00 3000.00 1000.000 1 0.03770799E+02 0.07871497E-01-0.02656384E-04 0.03944431E-08-0.02112616E-12 2 0.12783252E+03 0.02929575E+02 0.02106204E+02 0.07216595E-01 0.05338472E-04 3-0.07377636E-07 0.02075610E-10 0.09786011E+04 0.13152177E+02 4CH3OH L 8/88C 1H 4O 1 00G 200.000 3500.000 1000.000 1 1.78970791E+00 1.40938292E-02-6.36500835E-06 1.38171085E-09-1.17060220E-13 2-2.53748747E+04 1.45023623E+01 5.71539582E+00-1.52309129E-02 6.52441155E-05 3-7.10806889E-08 2.61352698E-11-2.56427656E+04-1.50409823E+00 1.14352770E+04 4C2H L 1/91C 2H 1 00 00G 200.000 3500.000 1000.000 1 3.16780652E+00 4.75221902E-03-1.83787077E-06 3.04190252E-10-1.77232770E-14 2 6.71210650E+04 6.63589475E+00 2.88965733E+00 1.34099611E-02-2.84769501E-05 3 2.94791045E-08-1.09331511E-11 6.68393932E+04 6.22296438E+00 1.04544720E+04 4C2H2 L 1/91C 2H 2 00 00G 200.000 3500.000 1000.000 1 4.14756964E+00 5.96166664E-03-2.37294852E-06 4.67412171E-10-3.61235213E-14 2 2.59359992E+04-1.23028121E+00 8.08681094E-01 2.33615629E-02-3.55171815E-05 3 2.80152437E-08-8.50072974E-12 2.64289807E+04 1.39397051E+01 1.00058390E+04 4C2H3 L 2/92C 2H 3 00 00G 200.000 3500.000 1000.000 1 3.01672400E+00 1.03302292E-02-4.68082349E-06 1.01763288E-09-8.62607041E-14 2 3.46128739E+04 7.78732378E+00 3.21246645E+00 1.51479162E-03 2.59209412E-05 3-3.57657847E-08 1.47150873E-11 3.48598468E+04 8.51054025E+00 1.05750490E+04 4
A-14

C2H4 L 1/91C 2H 4 00 00G 200.000 3500.000 1000.000 1 2.03611116E+00 1.46454151E-02-6.71077915E-06 1.47222923E-09-1.25706061E-13 2 4.93988614E+03 1.03053693E+01 3.95920148E+00-7.57052247E-03 5.70990292E-05 3-6.91588753E-08 2.69884373E-11 5.08977593E+03 4.09733096E+00 1.05186890E+04 4C2H5 L12/92C 2H 5 00 00G 200.000 3500.000 1000.000 1 1.95465642E+00 1.73972722E-02-7.98206668E-06 1.75217689E-09-1.49641576E-13 2 1.28575200E+04 1.34624343E+01 4.30646568E+00-4.18658892E-03 4.97142807E-05 3-5.99126606E-08 2.30509004E-11 1.28416265E+04 4.70720924E+00 1.21852440E+04 4C2H6 L 8/88C 2H 6 00 00G 200.000 3500.000 1000.000 1 1.07188150E+00 2.16852677E-02-1.00256067E-05 2.21412001E-09-1.90002890E-13 2-1.14263932E+04 1.51156107E+01 4.29142492E+00-5.50154270E-03 5.99438288E-05 3-7.08466285E-08 2.68685771E-11-1.15222055E+04 2.66682316E+00 1.18915940E+04 4CH2CO L 5/90C 2H 2O 1 00G 200.000 3500.000 1000.000 1 4.51129732E+00 9.00359745E-03-4.16939635E-06 9.23345882E-10-7.94838201E-14 2-7.55105311E+03 6.32247205E-01 2.13583630E+00 1.81188721E-02-1.73947474E-05 3 9.34397568E-09-2.01457615E-12-7.04291804E+03 1.22156480E+01 1.17977430E+04 4HCCO SRIC91H 1C 2O 1 00G 300.00 4000.00 1000.000 1 0.56282058E+01 0.40853401E-02-0.15934547E-05 0.28626052E-09-0.19407832E-13 2 0.19327215E+05-0.39302595E+01 0.22517214E+01 0.17655021E-01-0.23729101E-04 3 0.17275759E-07-0.50664811E-11 0.20059449E+05 0.12490417E+02 4HCCOH SRI91C 2O 1H 2 00G 300.000 5000.000 1000.000 1 0.59238291E+01 0.67923600E-02-0.25658564E-05 0.44987841E-09-0.29940101E-13 2 0.72646260E+04-0.76017742E+01 0.12423733E+01 0.31072201E-01-0.50866864E-04 3 0.43137131E-07-0.14014594E-10 0.80316143E+04 0.13874319E+02 4H2CN 41687H 2C 1N 1 00G 300.00 4000.000 1000.000 1 0.52097030E+01 0.29692911E-02-0.28555891E-06-0.16355500E-09 0.30432589E-13 2 0.27677109E+05-0.44444780E+01 0.28516610E+01 0.56952331E-02 0.10711400E-05 3-0.16226120E-08-0.23511081E-12 0.28637820E+05 0.89927511E+01 0.00000000E+00 4HCN L 7/88H 1C 1N 1 00G 200.000 6000.000 1000.000 1 0.38022392E+01 0.31464228E-02-0.10632185E-05 0.16619757E-09-0.97997570E-14 2 0.14910512E+05 0.15754601E+01 0.22589886E+01 0.10051170E-01-0.13351763E-04 3 0.10092349E-07-0.30089028E-11 0.15215853E+05 0.89164419E+01 0.16236675E+05 4HNO And93 H 1N 1O 1 00G 200.000 6000.000 1000.000 1 0.29792509E+01 0.34944059E-02-0.78549778E-06 0.57479594E-10-0.19335916E-15 2 0.11750582E+05 0.86063728E+01 0.45334916E+01-0.56696171E-02 0.18473207E-04 3-0.17137094E-07 0.55454573E-11 0.11548297E+05 0.17498417E+01 0.12271667E+05 4N L 6/88N 1 00 00 00G 200.000 6000.000 1000.000 1 0.24159429E+01 0.17489065E-03-0.11902369E-06 0.30226245E-10-0.20360982E-14 2 0.56133773E+05 0.46496096E+01 0.25000000E+01 0.00000000E+00 0.00000000E+00 3 0.00000000E+00 0.00000000E+00 0.56104637E+05 0.41939087E+01 0.56850012E+05 4NNH T07/93N 2H 1 00 00G 200.000 6000.000 1000.000 1 0.37667544E+01 0.28915082E-02-0.10416620E-05 0.16842594E-09-0.10091896E-13 2 0.28650697E+05 0.44705067E+01 0.43446927E+01-0.48497072E-02 0.20059459E-04 3-0.21726464E-07 0.79469539E-11 0.28791973E+05 0.29779410E+01 0.30009828E+05 4N2O L 7/88N 2O 1 00 00G 200.000 6000.000 1000.000 1 0.48230729E+01 0.26270251E-02-0.95850874E-06 0.16000712E-09-0.97752303E-14 2 0.80734048E+04-0.22017207E+01 0.22571502E+01 0.11304728E-01-0.13671319E-04 3 0.96819806E-08-0.29307182E-11 0.87417744E+04 0.10757992E+02 0.98141680E+04 4NH And94 N 1H 1 00 00G 200.000 6000.000 1000.000 1 0.27836928E+01 0.13298430E-02-0.42478047E-06 0.78348501E-10-0.55044470E-14 2 0.42120848E+05 0.57407799E+01 0.34929085E+01 0.31179198E-03-0.14890484E-05 3 0.24816442E-08-0.10356967E-11 0.41880629E+05 0.18483278E+01 0.40758266E+05 4NH2 And89 N 1H 2 00 00G 200.000 6000.000 1000.000 1 0.28347421E+01 0.32073082E-02-0.93390804E-06 0.13702953E-09-0.79206144E-14 2 0.22171957E+05 0.65204163E+01 0.42040029E+01-0.21061385E-02 0.71068348E-05 3-0.56115197E-08 0.16440717E-11 0.21885910E+05-0.14184248E+00 0.22851617E+05 4NH3 J 6/77N 1H 3 00 00G 200.000 6000.000 1000.000 1 0.26344521E+01 0.56662560E-02-0.17278676E-05 0.23867161E-09-0.12578786E-13 2-0.65446958E+04 0.65662928E+01 0.42860274E+01-0.46605230E-02 0.21718513E-04 3-0.22808887E-07 0.82638046E-11-0.67417285E+04-0.62537277E+00-0.55202866E+04 4NO RUS 78N 1O 1 00 00G 200.000 6000.000 1000.000 1 0.32606056E+01 0.11911043E-02-0.42917048E-06 0.69457669E-10-0.40336099E-14 2 0.99209746E+04 0.63693027E+01 0.42184763E+01-0.46389760E-02 0.11041022E-04 3-0.93361354E-08 0.28035770E-11 0.98446230E+04 0.22808464E+01 0.10976594E+05 4NO2 L 7/88N 1O 2 00 00G 200.000 6000.000 1000.000 1 0.48847542E+01 0.21723956E-02-0.82806906E-06 0.15747510E-09-0.10510895E-13 2 0.23164983E+04-0.11741695E+00 0.39440312E+01-0.15854290E-02 0.16657812E-04 3-0.20475426E-07 0.78350564E-11 0.28966179E+04 0.63119917E+01 0.41124702E+04 4HCNO BDEA94H 1N 1C 1O 1G 300.000 5000.000 1382.000 1 6.59860456E+00 3.02778626E-03-1.07704346E-06 1.71666528E-10-1.01439391E-14 2 1.79661339E+04-1.03306599E+01 2.64727989E+00 1.27505342E-02-1.04794236E-05 3 4.41432836E-09-7.57521466E-13 1.92990252E+04 1.07332972E+01 4HOCN BDEA94H 1N 1C 1O 1G 300.000 5000.000 1368.000 1 5.89784885E+00 3.16789393E-03-1.11801064E-06 1.77243144E-10-1.04339177E-14 2-3.70653331E+03-6.18167825E+00 3.78604952E+00 6.88667922E-03-3.21487864E-06 3 5.17195767E-10 1.19360788E-14-2.82698400E+03 5.63292162E+00 4HNCO BDEA94H 1N 1C 1O 1G 300.000 5000.000 1478.000 1 6.22395134E+00 3.17864004E-03-1.09378755E-06 1.70735163E-10-9.95021955E-15 2-1.66599344E+04-8.38224741E+00 3.63096317E+00 7.30282357E-03-2.28050003E-06 3-6.61271298E-10 3.62235752E-13-1.55873636E+04 6.19457727E+00 4
A-15
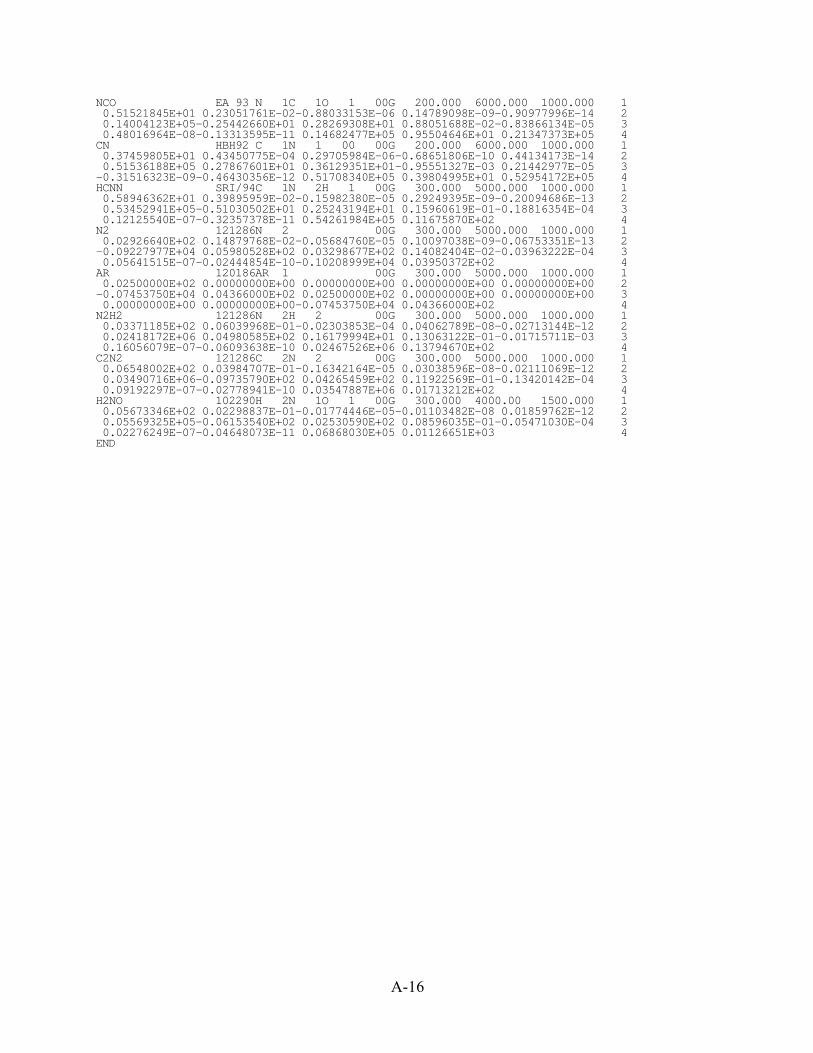
NCO EA 93 N 1C 1O 1 00G 200.000 6000.000 1000.000 1 0.51521845E+01 0.23051761E-02-0.88033153E-06 0.14789098E-09-0.90977996E-14 2 0.14004123E+05-0.25442660E+01 0.28269308E+01 0.88051688E-02-0.83866134E-05 3 0.48016964E-08-0.13313595E-11 0.14682477E+05 0.95504646E+01 0.21347373E+05 4CN HBH92 C 1N 1 00 00G 200.000 6000.000 1000.000 1 0.37459805E+01 0.43450775E-04 0.29705984E-06-0.68651806E-10 0.44134173E-14 2 0.51536188E+05 0.27867601E+01 0.36129351E+01-0.95551327E-03 0.21442977E-05 3-0.31516323E-09-0.46430356E-12 0.51708340E+05 0.39804995E+01 0.52954172E+05 4HCNN SRI/94C 1N 2H 1 00G 300.000 5000.000 1000.000 1 0.58946362E+01 0.39895959E-02-0.15982380E-05 0.29249395E-09-0.20094686E-13 2 0.53452941E+05-0.51030502E+01 0.25243194E+01 0.15960619E-01-0.18816354E-04 3 0.12125540E-07-0.32357378E-11 0.54261984E+05 0.11675870E+02 4N2 121286N 2 00G 300.000 5000.000 1000.000 1 0.02926640E+02 0.14879768E-02-0.05684760E-05 0.10097038E-09-0.06753351E-13 2-0.09227977E+04 0.05980528E+02 0.03298677E+02 0.14082404E-02-0.03963222E-04 3 0.05641515E-07-0.02444854E-10-0.10208999E+04 0.03950372E+02 4AR 120186AR 1 00G 300.000 5000.000 1000.000 1 0.02500000E+02 0.00000000E+00 0.00000000E+00 0.00000000E+00 0.00000000E+00 2-0.07453750E+04 0.04366000E+02 0.02500000E+02 0.00000000E+00 0.00000000E+00 3 0.00000000E+00 0.00000000E+00-0.07453750E+04 0.04366000E+02 4N2H2 121286N 2H 2 00G 300.000 5000.000 1000.000 1 0.03371185E+02 0.06039968E-01-0.02303853E-04 0.04062789E-08-0.02713144E-12 2 0.02418172E+06 0.04980585E+02 0.16179994E+01 0.13063122E-01-0.01715711E-03 3 0.16056079E-07-0.06093638E-10 0.02467526E+06 0.13794670E+02 4C2N2 121286C 2N 2 00G 300.000 5000.000 1000.000 1 0.06548002E+02 0.03984707E-01-0.16342164E-05 0.03038596E-08-0.02111069E-12 2 0.03490716E+06-0.09735790E+02 0.04265459E+02 0.11922569E-01-0.13420142E-04 3 0.09192297E-07-0.02778941E-10 0.03547887E+06 0.01713212E+02 4H2NO 102290H 2N 1O 1 00G 300.000 4000.00 1500.000 1 0.05673346E+02 0.02298837E-01-0.01774446E-05-0.01103482E-08 0.01859762E-12 2 0.05569325E+05-0.06153540E+02 0.02530590E+02 0.08596035E-01-0.05471030E-04 3 0.02276249E-07-0.04648073E-11 0.06868030E+05 0.01126651E+03 4END
A-16
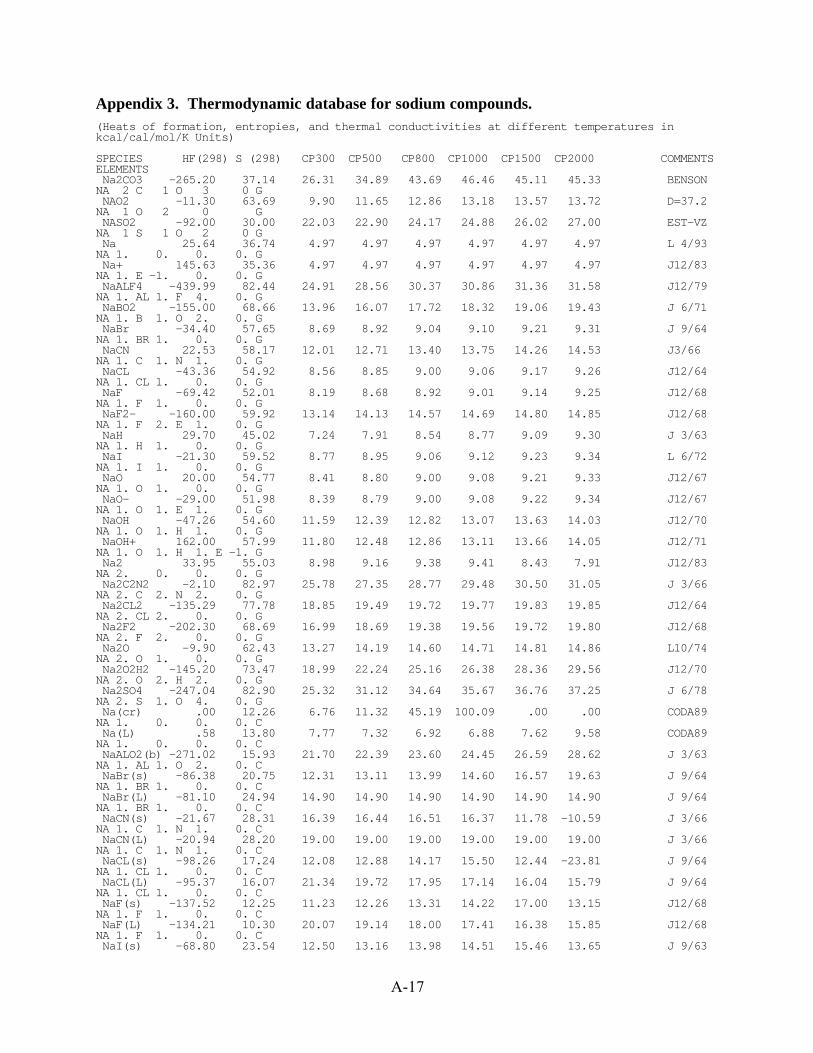
Appendix 3. Thermodynamic database for sodium compounds.(Heats of formation, entropies, and thermal conductivities at different temperatures inkcal/cal/mol/K Units)
SPECIES HF(298) S (298) CP300 CP500 CP800 CP1000 CP1500 CP2000 COMMENTSELEMENTS Na2CO3 -265.20 37.14 26.31 34.89 43.69 46.46 45.11 45.33 BENSONNA 2 C 1 O 3 0 G NAO2 -11.30 63.69 9.90 11.65 12.86 13.18 13.57 13.72 D=37.2NA 1 O 2 0 G NASO2 -92.00 30.00 22.03 22.90 24.17 24.88 26.02 27.00 EST-VZNA 1 S 1 O 2 0 G Na 25.64 36.74 4.97 4.97 4.97 4.97 4.97 4.97 L 4/93NA 1. 0. 0. 0. G Na+ 145.63 35.36 4.97 4.97 4.97 4.97 4.97 4.97 J12/83NA 1. E -1. 0. 0. G NaALF4 -439.99 82.44 24.91 28.56 30.37 30.86 31.36 31.58 J12/79NA 1. AL 1. F 4. 0. G NaBO2 -155.00 68.66 13.96 16.07 17.72 18.32 19.06 19.43 J 6/71NA 1. B 1. O 2. 0. G NaBr -34.40 57.65 8.69 8.92 9.04 9.10 9.21 9.31 J 9/64NA 1. BR 1. 0. 0. G NaCN 22.53 58.17 12.01 12.71 13.40 13.75 14.26 14.53 J3/66NA 1. C 1. N 1. 0. G NaCL -43.36 54.92 8.56 8.85 9.00 9.06 9.17 9.26 J12/64NA 1. CL 1. 0. 0. G NaF -69.42 52.01 8.19 8.68 8.92 9.01 9.14 9.25 J12/68NA 1. F 1. 0. 0. G NaF2- -160.00 59.92 13.14 14.13 14.57 14.69 14.80 14.85 J12/68NA 1. F 2. E 1. 0. G NaH 29.70 45.02 7.24 7.91 8.54 8.77 9.09 9.30 J 3/63NA 1. H 1. 0. 0. G NaI -21.30 59.52 8.77 8.95 9.06 9.12 9.23 9.34 L 6/72NA 1. I 1. 0. 0. G NaO 20.00 54.77 8.41 8.80 9.00 9.08 9.21 9.33 J12/67NA 1. O 1. 0. 0. G NaO- -29.00 51.98 8.39 8.79 9.00 9.08 9.22 9.34 J12/67NA 1. O 1. E 1. 0. G NaOH -47.26 54.60 11.59 12.39 12.82 13.07 13.63 14.03 J12/70NA 1. O 1. H 1. 0. G NaOH+ 162.00 57.99 11.80 12.48 12.86 13.11 13.66 14.05 J12/71NA 1. O 1. H 1. E -1. G Na2 33.95 55.03 8.98 9.16 9.38 9.41 8.43 7.91 J12/83NA 2. 0. 0. 0. G Na2C2N2 -2.10 82.97 25.78 27.35 28.77 29.48 30.50 31.05 J 3/66NA 2. C 2. N 2. 0. G Na2CL2 -135.29 77.78 18.85 19.49 19.72 19.77 19.83 19.85 J12/64NA 2. CL 2. 0. 0. G Na2F2 -202.30 68.69 16.99 18.69 19.38 19.56 19.72 19.80 J12/68NA 2. F 2. 0. 0. G Na2O -9.90 62.43 13.27 14.19 14.60 14.71 14.81 14.86 L10/74NA 2. O 1. 0. 0. G Na2O2H2 -145.20 73.47 18.99 22.24 25.16 26.38 28.36 29.56 J12/70NA 2. O 2. H 2. 0. G Na2SO4 -247.04 82.90 25.32 31.12 34.64 35.67 36.76 37.25 J 6/78NA 2. S 1. O 4. 0. G Na(cr) .00 12.26 6.76 11.32 45.19 100.09 .00 .00 CODA89NA 1. 0. 0. 0. C Na(L) .58 13.80 7.77 7.32 6.92 6.88 7.62 9.58 CODA89NA 1. 0. 0. 0. C NaALO2(b) -271.02 15.93 21.70 22.39 23.60 24.45 26.59 28.62 J 3/63NA 1. AL 1. O 2. 0. C NaBr(s) -86.38 20.75 12.31 13.11 13.99 14.60 16.57 19.63 J 9/64NA 1. BR 1. 0. 0. C NaBr(L) -81.10 24.94 14.90 14.90 14.90 14.90 14.90 14.90 J 9/64NA 1. BR 1. 0. 0. C NaCN(s) -21.67 28.31 16.39 16.44 16.51 16.37 11.78 -10.59 J 3/66NA 1. C 1. N 1. 0. C NaCN(L) -20.94 28.20 19.00 19.00 19.00 19.00 19.00 19.00 J 3/66NA 1. C 1. N 1. 0. C NaCL(s) -98.26 17.24 12.08 12.88 14.17 15.50 12.44 -23.81 J 9/64NA 1. CL 1. 0. 0. C NaCL(L) -95.37 16.07 21.34 19.72 17.95 17.14 16.04 15.79 J 9/64NA 1. CL 1. 0. 0. C NaF(s) -137.52 12.25 11.23 12.26 13.31 14.22 17.00 13.15 J12/68NA 1. F 1. 0. 0. C NaF(L) -134.21 10.30 20.07 19.14 18.00 17.41 16.38 15.85 J12/68NA 1. F 1. 0. 0. C NaI(s) -68.80 23.54 12.50 13.16 13.98 14.51 15.46 13.65 J 9/63
A-17
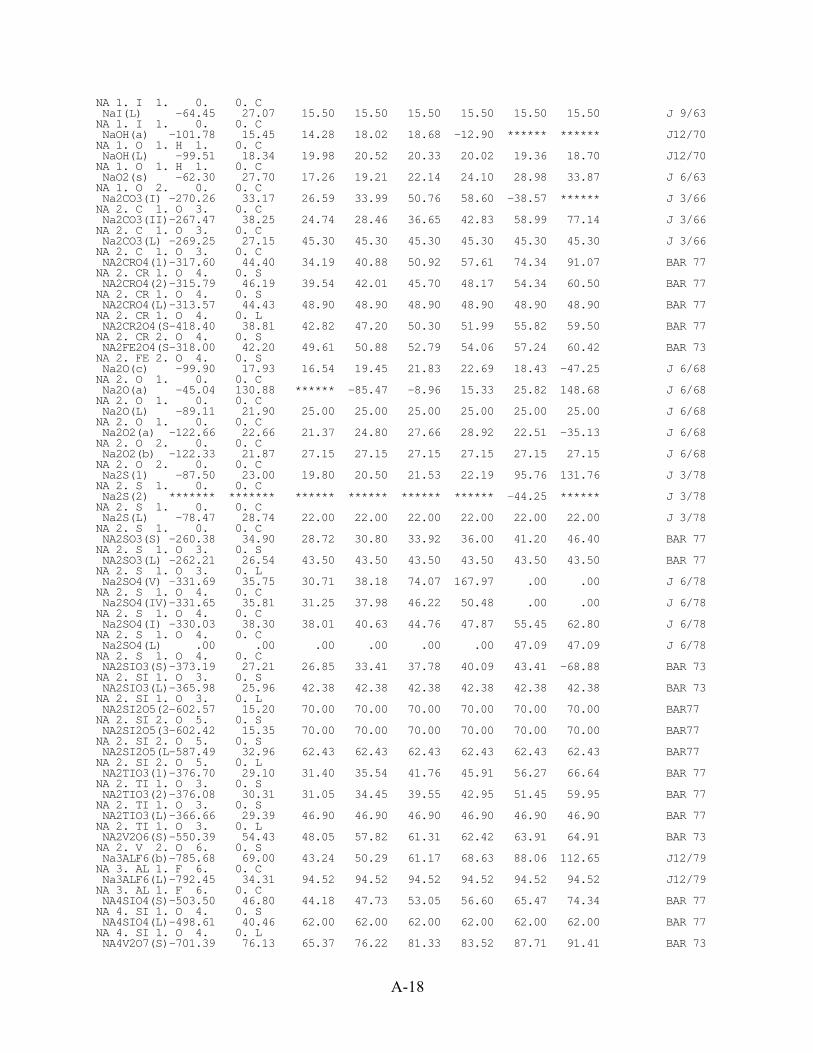
NA 1. I 1. 0. 0. C NaI(L) -64.45 27.07 15.50 15.50 15.50 15.50 15.50 15.50 J 9/63NA 1. I 1. 0. 0. C NaOH(a) -101.78 15.45 14.28 18.02 18.68 -12.90 ****** ****** J12/70NA 1. O 1. H 1. 0. C NaOH(L) -99.51 18.34 19.98 20.52 20.33 20.02 19.36 18.70 J12/70NA 1. O 1. H 1. 0. C NaO2(s) -62.30 27.70 17.26 19.21 22.14 24.10 28.98 33.87 J 6/63NA 1. O 2. 0. 0. C Na2CO3(I) -270.26 33.17 26.59 33.99 50.76 58.60 -38.57 ****** J 3/66NA 2. C 1. O 3. 0. C Na2CO3(II)-267.47 38.25 24.74 28.46 36.65 42.83 58.99 77.14 J 3/66NA 2. C 1. O 3. 0. C Na2CO3(L) -269.25 27.15 45.30 45.30 45.30 45.30 45.30 45.30 J 3/66NA 2. C 1. O 3. 0. C NA2CRO4(1)-317.60 44.40 34.19 40.88 50.92 57.61 74.34 91.07 BAR 77NA 2. CR 1. O 4. 0. S NA2CRO4(2)-315.79 46.19 39.54 42.01 45.70 48.17 54.34 60.50 BAR 77NA 2. CR 1. O 4. 0. S NA2CRO4(L)-313.57 44.43 48.90 48.90 48.90 48.90 48.90 48.90 BAR 77NA 2. CR 1. O 4. 0. L NA2CR2O4(S-418.40 38.81 42.82 47.20 50.30 51.99 55.82 59.50 BAR 77NA 2. CR 2. O 4. 0. S NA2FE2O4(S-318.00 42.20 49.61 50.88 52.79 54.06 57.24 60.42 BAR 73NA 2. FE 2. O 4. 0. S Na2O(c) -99.90 17.93 16.54 19.45 21.83 22.69 18.43 -47.25 J 6/68NA 2. O 1. 0. 0. C Na2O(a) -45.04 130.88 ****** -85.47 -8.96 15.33 25.82 148.68 J 6/68NA 2. O 1. 0. 0. C Na2O(L) -89.11 21.90 25.00 25.00 25.00 25.00 25.00 25.00 J 6/68NA 2. O 1. 0. 0. C Na2O2(a) -122.66 22.66 21.37 24.80 27.66 28.92 22.51 -35.13 J 6/68NA 2. O 2. 0. 0. C Na2O2(b) -122.33 21.87 27.15 27.15 27.15 27.15 27.15 27.15 J 6/68NA 2. O 2. 0. 0. C Na2S(1) -87.50 23.00 19.80 20.50 21.53 22.19 95.76 131.76 J 3/78NA 2. S 1. 0. 0. C Na2S(2) ******* ******* ****** ****** ****** ****** -44.25 ****** J 3/78NA 2. S 1. 0. 0. C Na2S(L) -78.47 28.74 22.00 22.00 22.00 22.00 22.00 22.00 J 3/78NA 2. S 1. 0. 0. C NA2SO3(S) -260.38 34.90 28.72 30.80 33.92 36.00 41.20 46.40 BAR 77NA 2. S 1. O 3. 0. S NA2SO3(L) -262.21 26.54 43.50 43.50 43.50 43.50 43.50 43.50 BAR 77NA 2. S 1. O 3. 0. L Na2SO4(V) -331.69 35.75 30.71 38.18 74.07 167.97 .00 .00 J 6/78NA 2. S 1. O 4. 0. C Na2SO4(IV)-331.65 35.81 31.25 37.98 46.22 50.48 .00 .00 J 6/78NA 2. S 1. O 4. 0. C Na2SO4(I) -330.03 38.30 38.01 40.63 44.76 47.87 55.45 62.80 J 6/78NA 2. S 1. O 4. 0. C Na2SO4(L) .00 .00 .00 .00 .00 .00 47.09 47.09 J 6/78NA 2. S 1. O 4. 0. C NA2SIO3(S)-373.19 27.21 26.85 33.41 37.78 40.09 43.41 -68.88 BAR 73NA 2. SI 1. O 3. 0. S NA2SIO3(L)-365.98 25.96 42.38 42.38 42.38 42.38 42.38 42.38 BAR 73NA 2. SI 1. O 3. 0. L NA2SI2O5(2-602.57 15.20 70.00 70.00 70.00 70.00 70.00 70.00 BAR77NA 2. SI 2. O 5. 0. S NA2SI2O5(3-602.42 15.35 70.00 70.00 70.00 70.00 70.00 70.00 BAR77NA 2. SI 2. O 5. 0. S NA2SI2O5(L-587.49 32.96 62.43 62.43 62.43 62.43 62.43 62.43 BAR77NA 2. SI 2. O 5. 0. L NA2TIO3(1)-376.70 29.10 31.40 35.54 41.76 45.91 56.27 66.64 BAR 77NA 2. TI 1. O 3. 0. S NA2TIO3(2)-376.08 30.31 31.05 34.45 39.55 42.95 51.45 59.95 BAR 77NA 2. TI 1. O 3. 0. S NA2TIO3(L)-366.66 29.39 46.90 46.90 46.90 46.90 46.90 46.90 BAR 77NA 2. TI 1. O 3. 0. L NA2V2O6(S)-550.39 54.43 48.05 57.82 61.31 62.42 63.91 64.91 BAR 73NA 2. V 2. O 6. 0. S Na3ALF6(b)-785.68 69.00 43.24 50.29 61.17 68.63 88.06 112.65 J12/79NA 3. AL 1. F 6. 0. C Na3ALF6(L)-792.45 34.31 94.52 94.52 94.52 94.52 94.52 94.52 J12/79NA 3. AL 1. F 6. 0. C NA4SIO4(S)-503.50 46.80 44.18 47.73 53.05 56.60 65.47 74.34 BAR 77NA 4. SI 1. O 4. 0. S NA4SIO4(L)-498.61 40.46 62.00 62.00 62.00 62.00 62.00 62.00 BAR 77NA 4. SI 1. O 4. 0. L NA4V2O7(S)-701.39 76.13 65.37 76.22 81.33 83.52 87.71 91.41 BAR 73
A-18

NA 4. V 2. O 7. 0. S NA6SI2O7(S-856.30 83.32 73.34 83.73 94.75 101.60 118.20 134.60 BAR 73NA 6. SI 2. O 7. 0. S NA6V2O8(S)-845.10 90.63 82.69 94.62 101.35 104.62 111.51 117.91 BAR 73NA 6. V 2. O 8. 0. S
A-19