Embed Size (px)
Citation preview
Direct observation of stepped proteolipid ringrotation in E. coli FoF1-ATP synthase
Robert Ishmukhametov1,Tassilo Hornung1, David Spetzler1
and Wayne D Frasch*
Faculty of Biomedicine and Biotechnology, School of Life Sciences,Arizona State University, Tempe, AZ, USA
Although single-molecule experiments have provided
mechanistic insight for several molecular motors, these
approaches have proved difficult for membrane bound
molecular motors like the FoF1-ATP synthase, in which
proton transport across a membrane is used to synthesize
ATP. Resolution of smaller steps in Fo has been particularly
hampered by signal-to-noise and time resolution. Here, we
show the presence of a transient dwell between Fo sub-
units a and c by improving the time resolution to 10 ls at
unprecedented S/N, and by using Escherichia coli FoF1
embedded in lipid bilayer nanodiscs. The transient dwell
interaction requires 163 ls to form and 175 ls to dissociate,
is independent of proton transport residues aR210 and
cD61, and behaves as a leash that allows rotary motion
of the c-ring to a limit of B361 while engaged. This leash
behaviour satisfies a requirement of a Brownian ratchet
mechanism for the Fo motor where c-ring rotational
diffusion is limited to 361.
The EMBO Journal (2010) 29, 3911–3923. doi:10.1038/
emboj.2010.259; Published online 29 October 2010
Subject Categories: membranes & transport; cellular metabolism
Keywords: Brownian ratchet mechanism; FoF1-ATP synthase;
gold nanorods; nanodiscs; single-molecule measurements
Introduction
The FoF1-ATP synthase is composed of two opposed rotary
molecular motors connected by a common axle of ge-sub-
units (Stock et al, 1999). The integral membrane Fo motor,
which has a subunit stoichiometry of ab2c10 in Escherichia
coli (Jiang et al, 2001), uses the electrochemical potential-
driven flux of protons across a membrane (proton-motive
force (PMF)) to drive clockwise rotation of the ring of 10
c-subunits as viewed from the periplasm (Borsch et al, 2002).
The c-ring is docked to the ge-subunits that extend into the
hexameric ring of a- and b-subunits in the F1 peripheral
membrane motor. Rotation of this axle drives conformational
changes in each of the three catalytic ab heterodimers
resulting in ATP synthesis (Boyer, 1997). The F1 motor can
also hydrolyze ATP resulting in counterclockwise ge-subunit
rotation and proton translocation via Fo (Borsch et al, 2002).
When solubilized away from Fo and the membrane, E. coli
F1-ATPase-driven rotation at saturating ATP concentrations
occurs in three 1201 power strokes (Sabbert et al, 1996; Noji
et al, 1999; Spetzler et al, 2006), separated by 8.3 ms dwells
comparable to the turnover time of the rate-limiting step of
ATP hydrolysis (Spetzler et al, 2006; Hornung et al, 2008). In
the absence of drag on the F1 motor, the velocity of the power
stroke is B0.51ms�1 (Spetzler et al, 2006).
In vivo, FoF1 uses the PMF across the membrane to main-
tain the [ATP]/[ADP][Pi] ratio (Q) far from equilibrium so
that the high-ATP concentration provides an energy source to
drive other cellular processes. Energetically, this means that
at steady state, cellular PMFD2.3RTlogQ. In other words, the
driving force of the Fo motor (PMF) is in equilibrium with the
driving force of the F1 motor (logQ). In E. coli, the cytoplasm
typically contains 3 mM ATP, 0.4 mM ADP, and 6 mM Pi such
that logQD0.1 (Weber and Senior, 1997).The maximum reported rate of E. coli FoF1 ATP synthesis
(Senior et al, 2002) is about 100 s�1 (10 ms ATP�1), although
rates of 27 s�1 (37 ms ATP�1) are more common with E. coli
FoF1 in proteolipisomes (Fischer et al, 1994). Proton translo-
cation can occur at faster rates when powered by ATP
hydrolysis (Feniouk and Junge, 2008), or by membrane
potentials imposed on E. coli Fo-embedded membranes after
removal of F1 (Franklin et al, 2004; Wiedenmann et al, 2008).
In the absence of F1 there is no indication that the proton
translocation rate of Fo saturates at high-driving force
(Feniouk and Junge, 2008), which suggests that the proton
translocation step is not rate limiting to the mechanism.Proton translocation across the membrane occurs in Fo
when subunit-a residue aR210 deprotonates the cD61 carbox-
yl on each c-subunit as the c-ring rotates (Fillingame et al,
1984; Lightowlers et al, 1987; Angevine et al, 2003;
Ishmukhametov et al, 2008). A Brownian ratchet mechanism
has been postulated to power Fo rotation that must meet two
requirements to function (Junge et al, 1997; Oster et al,
2000): first, that there are two noncolinear proton access
half-channels from each side of the membrane leading to the
cD61 carboxyl; and second, that rotational diffusion of the
c-ring relative to subunit-a is periodically restricted in some
manner. However, experimental evidence that provides a
molecular basis for the latter requirement is scarce.
Initial single-molecule c-ring rotation measurements of
FoF1 driven by ATP hydrolysis, or by an electrochemical
potential, resolved only 1201 steps (Sambongi et al, 1999;
Panke et al, 2000; Borsch et al, 2002; Kaim et al, 2002; Nishio
et al, 2002; Ueno et al, 2005). C-ring rotation with step sizes
of 361, 721, 1081, and 1441 occurring 48, 37, 12, and 3% of the
time, respectively, have now been observed using E. coli FoF1
proteoliposomes that synthesized an ATP every 37 ms in
response to a membrane potential of 4200 mV (Duser et al,
2009). As the proton translocation rate of Fo does not saturate
at high-driving force (Feniouk and Junge, 2008), the move-
ment of c-subunits past subunit-a during the 721, 1081, and
1441 steps may not have caused a dwell in rotation.Received: 19 April 2010; accepted: 21 September 2010; publishedonline: 29 October 2010
*Corresponding author. School of Life Sciences, Arizona StateUniversity, Box 874501, Tempe, AZ 85287 USA. Tel.: þ 1 480 965 8663;Fax: þ 1 480 965 6899; E-mail: [email protected] authors contributed equally to this work
The EMBO Journal (2010) 29, 3911–3923 | & 2010 European Molecular Biology Organization | All Rights Reserved 0261-4189/10
www.embojournal.org
&2010 European Molecular Biology Organization The EMBO Journal VOL 29 | NO 23 | 2010
EMBO
THE
EMBOJOURNAL
THE
EMBOJOURNAL
3911
We now report the observation of a previously unknown
interaction between Fo subunits a and c of FoF1 when ATPase-
driven rotation is slowed by a viscosity-induced load.
A striking feature of this interaction is that it forms a leash
that limits rotation to B361 in a manner that can satisfy the
restricted motion requirement in the Fo Brownian ratchet
mechanism. As the transient dwells do not form when
c-ring rotation and proton transport occur at high rates, the
practical advantage of using the leash is anticipated to be
under steady-state conditions in which the cellular ATP
concentration is high relative to ADP and Pi. Under these
conditions, when the free energy of the proton gradient
approaches equilibrium with the chemical potential of ATP,
the Fo motor could use this leash as part of a Brownian
ratchet to bias rotation for ATP synthesis (clockwise) against
an F1 motor-imposed load.
Results
FoF1 nanodiscs are fully assembled and retain complete
activity during single-molecule measurements
To stabilize the hydrophobic Fo complex, we inserted solubi-
lized FoF1 into phospholipid bilayer nanodiscs. The particle
size of nanodiscs is constrained by the membrane scaffold
protein (MSP) construct MSP-1E3D1 that forms a 13-nm
diameter ring of a-helices around a bilayer of phospholipid
molecules, and has been shown to provide a good model for
lipid bilayers (Bayburt et al, 2007). The nanodiscs are large
enough to allow the incorporation of the Fo complex and a
few hundred lipid molecules, yet are on the same scale as the
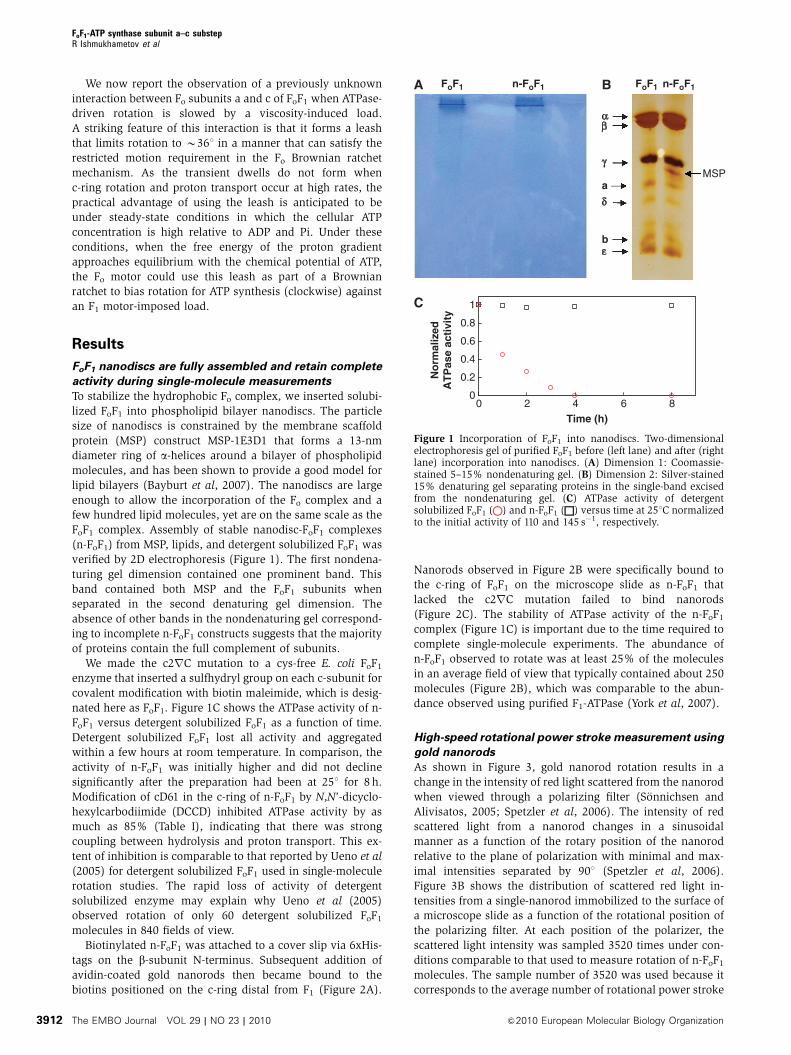
FoF1 complex. Assembly of stable nanodisc-FoF1 complexes
(n-FoF1) from MSP, lipids, and detergent solubilized FoF1 was
verified by 2D electrophoresis (Figure 1). The first nondena-
turing gel dimension contained one prominent band. This
band contained both MSP and the FoF1 subunits when
separated in the second denaturing gel dimension. The
absence of other bands in the nondenaturing gel correspond-
ing to incomplete n-FoF1 constructs suggests that the majority
of proteins contain the full complement of subunits.
We made the c2rC mutation to a cys-free E. coli FoF1
enzyme that inserted a sulfhydryl group on each c-subunit for
covalent modification with biotin maleimide, which is desig-
nated here as FoF1. Figure 1C shows the ATPase activity of n-
FoF1 versus detergent solubilized FoF1 as a function of time.
Detergent solubilized FoF1 lost all activity and aggregated
within a few hours at room temperature. In comparison, the
activity of n-FoF1 was initially higher and did not decline
significantly after the preparation had been at 251 for 8 h.
Modification of cD61 in the c-ring of n-FoF1 by N,N’-dicyclo-
hexylcarbodiimide (DCCD) inhibited ATPase activity by as
much as 85% (Table I), indicating that there was strong
coupling between hydrolysis and proton transport. This ex-
tent of inhibition is comparable to that reported by Ueno et al
(2005) for detergent solubilized FoF1 used in single-molecule
rotation studies. The rapid loss of activity of detergent
solubilized enzyme may explain why Ueno et al (2005)
observed rotation of only 60 detergent solubilized FoF1
molecules in 840 fields of view.
Biotinylated n-FoF1 was attached to a cover slip via 6xHis-
tags on the b-subunit N-terminus. Subsequent addition of
avidin-coated gold nanorods then became bound to the
biotins positioned on the c-ring distal from F1 (Figure 2A).
Nanorods observed in Figure 2B were specifically bound to
the c-ring of FoF1 on the microscope slide as n-FoF1 that
lacked the c2rC mutation failed to bind nanorods
(Figure 2C). The stability of ATPase activity of the n-FoF1
complex (Figure 1C) is important due to the time required to
complete single-molecule experiments. The abundance of
n-FoF1 observed to rotate was at least 25% of the molecules
in an average field of view that typically contained about 250
molecules (Figure 2B), which was comparable to the abun-
dance observed using purified F1-ATPase (York et al, 2007).
High-speed rotational power stroke measurement using
gold nanorods
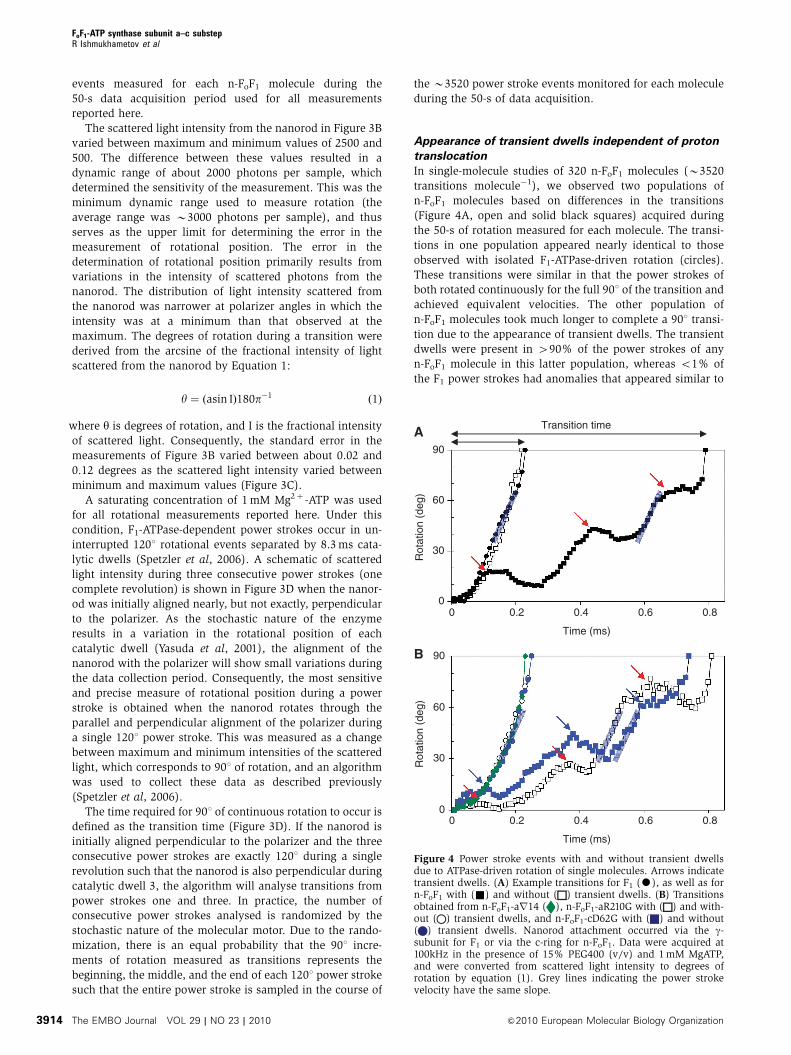
As shown in Figure 3, gold nanorod rotation results in a
change in the intensity of red light scattered from the nanorod
when viewed through a polarizing filter (Sonnichsen and
Alivisatos, 2005; Spetzler et al, 2006). The intensity of red
scattered light from a nanorod changes in a sinusoidal
manner as a function of the rotary position of the nanorod
relative to the plane of polarization with minimal and max-
imal intensities separated by 901 (Spetzler et al, 2006).
Figure 3B shows the distribution of scattered red light in-
tensities from a single-nanorod immobilized to the surface of
a microscope slide as a function of the rotational position of
the polarizing filter. At each position of the polarizer, the
scattered light intensity was sampled 3520 times under con-
ditions comparable to that used to measure rotation of n-FoF1
molecules. The sample number of 3520 was used because it
corresponds to the average number of rotational power stroke
C
0
0.2
0.4
0.6
0.8
1
0 2 4 6 8Time (h)
No
rmal
ized
AT
Pas
e ac
tivi
ty
A BFoF1 FoF1n-FoF1 n-FoF1
MSPa
b
Figure 1 Incorporation of FoF1 into nanodiscs. Two-dimensionalelectrophoresis gel of purified FoF1 before (left lane) and after (rightlane) incorporation into nanodiscs. (A) Dimension 1: Coomassie-stained 5–15% nondenaturing gel. (B) Dimension 2: Silver-stained15% denaturing gel separating proteins in the single-band excisedfrom the nondenaturing gel. (C) ATPase activity of detergentsolubilized FoF1 ( ) and n-FoF1 ( ) versus time at 251C normalizedto the initial activity of 110 and 145 s�1, respectively.
FoF1-ATP synthase subunit a–c substepR Ishmukhametov et al
The EMBO Journal VOL 29 | NO 23 | 2010 &2010 European Molecular Biology Organization3912
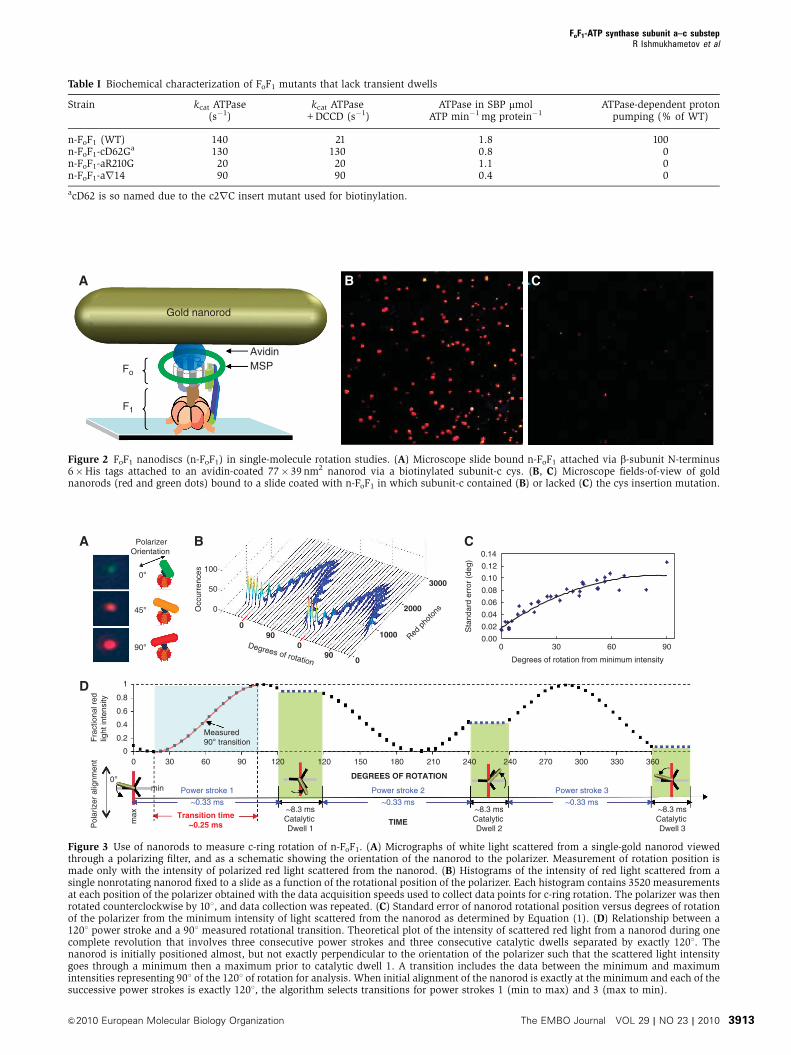
Table I Biochemical characterization of FoF1 mutants that lack transient dwells
Strain kcat ATPase(s�1)
kcat ATPase+DCCD (s�1)
ATPase in SBP mmolATP min�1 mg protein�1
ATPase-dependent protonpumping (% of WT)
n-FoF1 (WT) 140 21 1.8 100n-FoF1-cD62Ga 130 130 0.8 0n-FoF1-aR210G 20 20 1.1 0n-FoF1-ar14 90 90 0.4 0
acD62 is so named due to the c2rC insert mutant used for biotinylation.
B C
FoMSPAvidin
F1
Gold nanorod
A
Figure 2 FoF1 nanodiscs (n-FoF1) in single-molecule rotation studies. (A) Microscope slide bound n-FoF1 attached via b-subunit N-terminus6�His tags attached to an avidin-coated 77� 39 nm2 nanorod via a biotinylated subunit-c cys. (B, C) Microscope fields-of-view of goldnanorods (red and green dots) bound to a slide coated with n-FoF1 in which subunit-c contained (B) or lacked (C) the cys insertion mutation.
0.00
0.02
0.04
0.06
0.08
0.10
0.12
0.14
0 30 60 90
C
Sta
ndar
d er
ror
(deg
)
Degrees of rotation from minimum intensity
900
0
Occ
urre
nces
90
1000
2000
0
3000
B
120 150 180 210 240 240 270 300 330 360
0.2
0.4
0.6
0.8
0
1
0 30 60 90 120
Fra
ctio
nal r
edlig
ht in
tens
ity
DEGREES OF ROTATION
Power stroke 1 Power stroke 2 Power stroke 3
~0.33 ms ~0.33 ms ~0.33 ms
TIMETransition time
~0.25 msmax
0°
Pol
ariz
er a
lignm
ent
~8.3 msCatalytic Dwell 1
~8.3 msCatalytic Dwell 2
~8.3 msCatalytic Dwell 3
Measured90° transition
D
min
Degrees of rotation
Red p
hoto
ns
0°
45°
50
100
0
90°
A PolarizerOrientation
Figure 3 Use of nanorods to measure c-ring rotation of n-FoF1. (A) Micrographs of white light scattered from a single-gold nanorod viewedthrough a polarizing filter, and as a schematic showing the orientation of the nanorod to the polarizer. Measurement of rotation position ismade only with the intensity of polarized red light scattered from the nanorod. (B) Histograms of the intensity of red light scattered from asingle nonrotating nanorod fixed to a slide as a function of the rotational position of the polarizer. Each histogram contains 3520 measurementsat each position of the polarizer obtained with the data acquisition speeds used to collect data points for c-ring rotation. The polarizer was thenrotated counterclockwise by 101, and data collection was repeated. (C) Standard error of nanorod rotational position versus degrees of rotationof the polarizer from the minimum intensity of light scattered from the nanorod as determined by Equation (1). (D) Relationship between a1201 power stroke and a 901 measured rotational transition. Theoretical plot of the intensity of scattered red light from a nanorod during onecomplete revolution that involves three consecutive power strokes and three consecutive catalytic dwells separated by exactly 1201. Thenanorod is initially positioned almost, but not exactly perpendicular to the orientation of the polarizer such that the scattered light intensitygoes through a minimum then a maximum prior to catalytic dwell 1. A transition includes the data between the minimum and maximumintensities representing 901 of the 1201 of rotation for analysis. When initial alignment of the nanorod is exactly at the minimum and each of thesuccessive power strokes is exactly 1201, the algorithm selects transitions for power strokes 1 (min to max) and 3 (max to min).
FoF1-ATP synthase subunit a–c substepR Ishmukhametov et al
&2010 European Molecular Biology Organization The EMBO Journal VOL 29 | NO 23 | 2010 3913
events measured for each n-FoF1 molecule during the
50-s data acquisition period used for all measurements
reported here.
The scattered light intensity from the nanorod in Figure 3B
varied between maximum and minimum values of 2500 and
500. The difference between these values resulted in a
dynamic range of about 2000 photons per sample, which
determined the sensitivity of the measurement. This was the
minimum dynamic range used to measure rotation (the
average range was B3000 photons per sample), and thus
serves as the upper limit for determining the error in the
measurement of rotational position. The error in the
determination of rotational position primarily results from
variations in the intensity of scattered photons from the
nanorod. The distribution of light intensity scattered from
the nanorod was narrower at polarizer angles in which the
intensity was at a minimum than that observed at the
maximum. The degrees of rotation during a transition were
derived from the arcsine of the fractional intensity of light
scattered from the nanorod by Equation 1:
y ¼ ðasin IÞ180p�1 ð1Þ
where y is degrees of rotation, and I is the fractional intensity
of scattered light. Consequently, the standard error in the
measurements of Figure 3B varied between about 0.02 and
0.12 degrees as the scattered light intensity varied between
minimum and maximum values (Figure 3C).
A saturating concentration of 1 mM Mg2þ -ATP was used
for all rotational measurements reported here. Under this
condition, F1-ATPase-dependent power strokes occur in un-
interrupted 1201 rotational events separated by 8.3 ms cata-
lytic dwells (Spetzler et al, 2006). A schematic of scattered
light intensity during three consecutive power strokes (one
complete revolution) is shown in Figure 3D when the nanor-
od was initially aligned nearly, but not exactly, perpendicular
to the polarizer. As the stochastic nature of the enzyme
results in a variation in the rotational position of each
catalytic dwell (Yasuda et al, 2001), the alignment of the
nanorod with the polarizer will show small variations during
the data collection period. Consequently, the most sensitive
and precise measure of rotational position during a power
stroke is obtained when the nanorod rotates through the
parallel and perpendicular alignment of the polarizer during
a single 1201 power stroke. This was measured as a change
between maximum and minimum intensities of the scattered
light, which corresponds to 901 of rotation, and an algorithm
was used to collect these data as described previously
(Spetzler et al, 2006).
The time required for 901 of continuous rotation to occur is
defined as the transition time (Figure 3D). If the nanorod is
initially aligned perpendicular to the polarizer and the three
consecutive power strokes are exactly 1201 during a single
revolution such that the nanorod is also perpendicular during
catalytic dwell 3, the algorithm will analyse transitions from
power strokes one and three. In practice, the number of
consecutive power strokes analysed is randomized by the
stochastic nature of the molecular motor. Due to the rando-
mization, there is an equal probability that the 901 incre-
ments of rotation measured as transitions represents the
beginning, the middle, and the end of each 1201 power stroke
such that the entire power stroke is sampled in the course of
the B3520 power stroke events monitored for each molecule
during the 50-s of data acquisition.
Appearance of transient dwells independent of proton
translocation
In single-molecule studies of 320 n-FoF1 molecules (B3520
transitions molecule�1), we observed two populations of
n-FoF1 molecules based on differences in the transitions
(Figure 4A, open and solid black squares) acquired during
the 50-s of rotation measured for each molecule. The transi-
tions in one population appeared nearly identical to those
observed with isolated F1-ATPase-driven rotation (circles).
These transitions were similar in that the power strokes of
both rotated continuously for the full 901 of the transition and
achieved equivalent velocities. The other population of
n-FoF1 molecules took much longer to complete a 901 transi-
tion due to the appearance of transient dwells. The transient
dwells were present in 490% of the power strokes of any
n-FoF1 molecule in this latter population, whereas o1% of
the F1 power strokes had anomalies that appeared similar to
0 0.2 0.4 0.6 0.8
Time (ms)
Transition time
0
30
60
90
Rot
atio
n (d
eg)
A
0 0.2 0.4 0.6 0.8
Time (ms)
Rot
atio
n (d
eg)
B
0
30
60
90
Figure 4 Power stroke events with and without transient dwellsdue to ATPase-driven rotation of single molecules. Arrows indicatetransient dwells. (A) Example transitions for F1 (K), as well as forn-FoF1 with (&) and without ( ) transient dwells. (B) Transitionsobtained from n-FoF1-ar14 ( ), n-FoF1-aR210G with ( ) and with-out ( ) transient dwells, and n-FoF1-cD62G with ( ) and without( ) transient dwells. Nanorod attachment occurred via the g-subunit for F1 or via the c-ring for n-FoF1. Data were acquired at100kHz in the presence of 15% PEG400 (v/v) and 1 mM MgATP,and were converted from scattered light intensity to degrees ofrotation by equation (1). Grey lines indicating the power strokevelocity have the same slope.
FoF1-ATP synthase subunit a–c substepR Ishmukhametov et al
The EMBO Journal VOL 29 | NO 23 | 2010 &2010 European Molecular Biology Organization3914
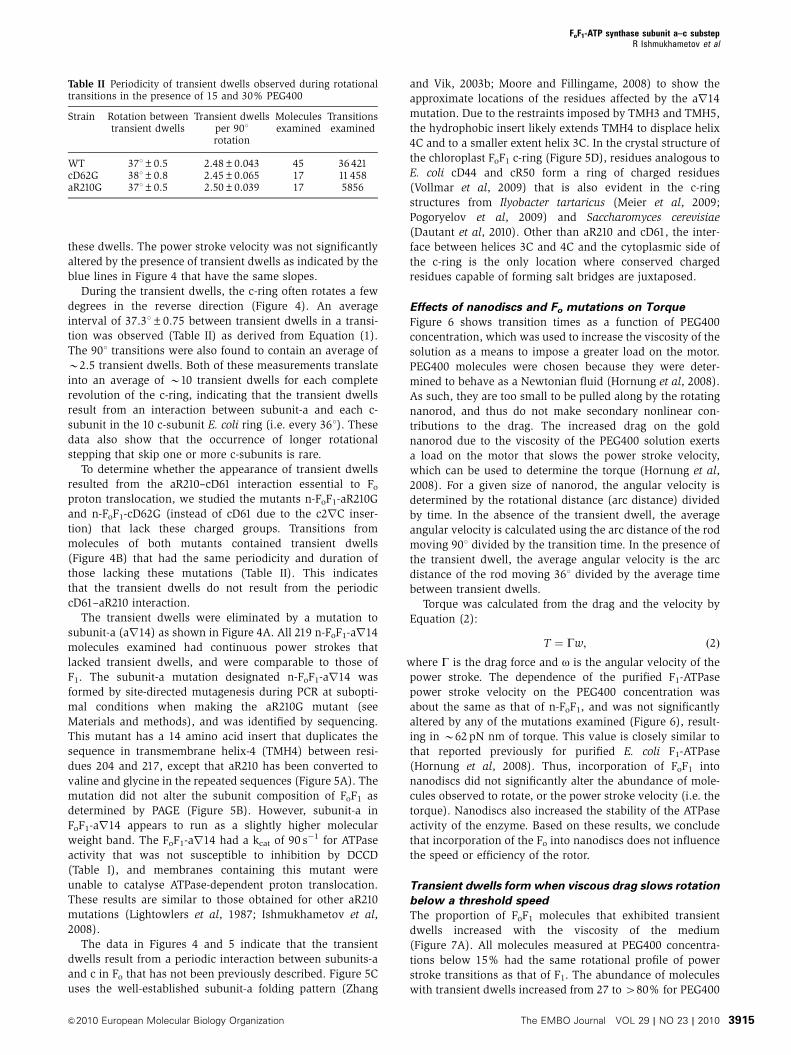
these dwells. The power stroke velocity was not significantly
altered by the presence of transient dwells as indicated by the
blue lines in Figure 4 that have the same slopes.
During the transient dwells, the c-ring often rotates a few
degrees in the reverse direction (Figure 4). An average
interval of 37.31±0.75 between transient dwells in a transi-
tion was observed (Table II) as derived from Equation (1).
The 901 transitions were also found to contain an average of
B2.5 transient dwells. Both of these measurements translate
into an average of B10 transient dwells for each complete
revolution of the c-ring, indicating that the transient dwells
result from an interaction between subunit-a and each c-
subunit in the 10 c-subunit E. coli ring (i.e. every 361). These
data also show that the occurrence of longer rotational
stepping that skip one or more c-subunits is rare.
To determine whether the appearance of transient dwells
resulted from the aR210–cD61 interaction essential to Fo
proton translocation, we studied the mutants n-FoF1-aR210G
and n-FoF1-cD62G (instead of cD61 due to the c2rC inser-
tion) that lack these charged groups. Transitions from
molecules of both mutants contained transient dwells
(Figure 4B) that had the same periodicity and duration of
those lacking these mutations (Table II). This indicates
that the transient dwells do not result from the periodic
cD61–aR210 interaction.
The transient dwells were eliminated by a mutation to
subunit-a (ar14) as shown in Figure 4A. All 219 n-FoF1-ar14
molecules examined had continuous power strokes that
lacked transient dwells, and were comparable to those of
F1. The subunit-a mutation designated n-FoF1-ar14 was
formed by site-directed mutagenesis during PCR at subopti-
mal conditions when making the aR210G mutant (see
Materials and methods), and was identified by sequencing.
This mutant has a 14 amino acid insert that duplicates the
sequence in transmembrane helix-4 (TMH4) between resi-
dues 204 and 217, except that aR210 has been converted to
valine and glycine in the repeated sequences (Figure 5A). The
mutation did not alter the subunit composition of FoF1 as
determined by PAGE (Figure 5B). However, subunit-a in
FoF1-ar14 appears to run as a slightly higher molecular
weight band. The FoF1-ar14 had a kcat of 90 s�1 for ATPase
activity that was not susceptible to inhibition by DCCD
(Table I), and membranes containing this mutant were
unable to catalyse ATPase-dependent proton translocation.
These results are similar to those obtained for other aR210
mutations (Lightowlers et al, 1987; Ishmukhametov et al,
2008).
The data in Figures 4 and 5 indicate that the transient
dwells result from a periodic interaction between subunits-a
and c in Fo that has not been previously described. Figure 5C
uses the well-established subunit-a folding pattern (Zhang
and Vik, 2003b; Moore and Fillingame, 2008) to show the
approximate locations of the residues affected by the ar14
mutation. Due to the restraints imposed by TMH3 and TMH5,
the hydrophobic insert likely extends TMH4 to displace helix
4C and to a smaller extent helix 3C. In the crystal structure of
the chloroplast FoF1 c-ring (Figure 5D), residues analogous to
E. coli cD44 and cR50 form a ring of charged residues
(Vollmar et al, 2009) that is also evident in the c-ring
structures from Ilyobacter tartaricus (Meier et al, 2009;
Pogoryelov et al, 2009) and Saccharomyces cerevisiae
(Dautant et al, 2010). Other than aR210 and cD61, the inter-
face between helices 3C and 4C and the cytoplasmic side of
the c-ring is the only location where conserved charged
residues capable of forming salt bridges are juxtaposed.
Effects of nanodiscs and Fo mutations on Torque
Figure 6 shows transition times as a function of PEG400
concentration, which was used to increase the viscosity of the
solution as a means to impose a greater load on the motor.
PEG400 molecules were chosen because they were deter-
mined to behave as a Newtonian fluid (Hornung et al, 2008).
As such, they are too small to be pulled along by the rotating
nanorod, and thus do not make secondary nonlinear con-
tributions to the drag. The increased drag on the gold
nanorod due to the viscosity of the PEG400 solution exerts
a load on the motor that slows the power stroke velocity,
which can be used to determine the torque (Hornung et al,
2008). For a given size of nanorod, the angular velocity is
determined by the rotational distance (arc distance) divided
by time. In the absence of the transient dwell, the average
angular velocity is calculated using the arc distance of the rod
moving 901 divided by the transition time. In the presence of
the transient dwell, the average angular velocity is the arc
distance of the rod moving 361 divided by the average time
between transient dwells.
Torque was calculated from the drag and the velocity by
Equation (2):
T ¼ Gw; ð2Þ
where G is the drag force and o is the angular velocity of the
power stroke. The dependence of the purified F1-ATPase
power stroke velocity on the PEG400 concentration was
about the same as that of n-FoF1, and was not significantly
altered by any of the mutations examined (Figure 6), result-
ing in B62 pN nm of torque. This value is closely similar to
that reported previously for purified E. coli F1-ATPase
(Hornung et al, 2008). Thus, incorporation of FoF1 into
nanodiscs did not significantly alter the abundance of mole-
cules observed to rotate, or the power stroke velocity (i.e. the
torque). Nanodiscs also increased the stability of the ATPase
activity of the enzyme. Based on these results, we conclude
that incorporation of the Fo into nanodiscs does not influence
the speed or efficiency of the rotor.
Transient dwells form when viscous drag slows rotation
below a threshold speed
The proportion of FoF1 molecules that exhibited transient
dwells increased with the viscosity of the medium
(Figure 7A). All molecules measured at PEG400 concentra-
tions below 15% had the same rotational profile of power
stroke transitions as that of F1. The abundance of molecules
with transient dwells increased from 27 to 480% for PEG400
Table II Periodicity of transient dwells observed during rotationaltransitions in the presence of 15 and 30% PEG400
Strain Rotation betweentransient dwells
Transient dwellsper 901rotation
Moleculesexamined
Transitionsexamined
WT 371±0.5 2.48±0.043 45 36 421cD62G 381±0.8 2.45±0.065 17 11 458aR210G 371±0.5 2.50±0.039 17 5856
FoF1-ATP synthase subunit a–c substepR Ishmukhametov et al
&2010 European Molecular Biology Organization The EMBO Journal VOL 29 | NO 23 | 2010 3915
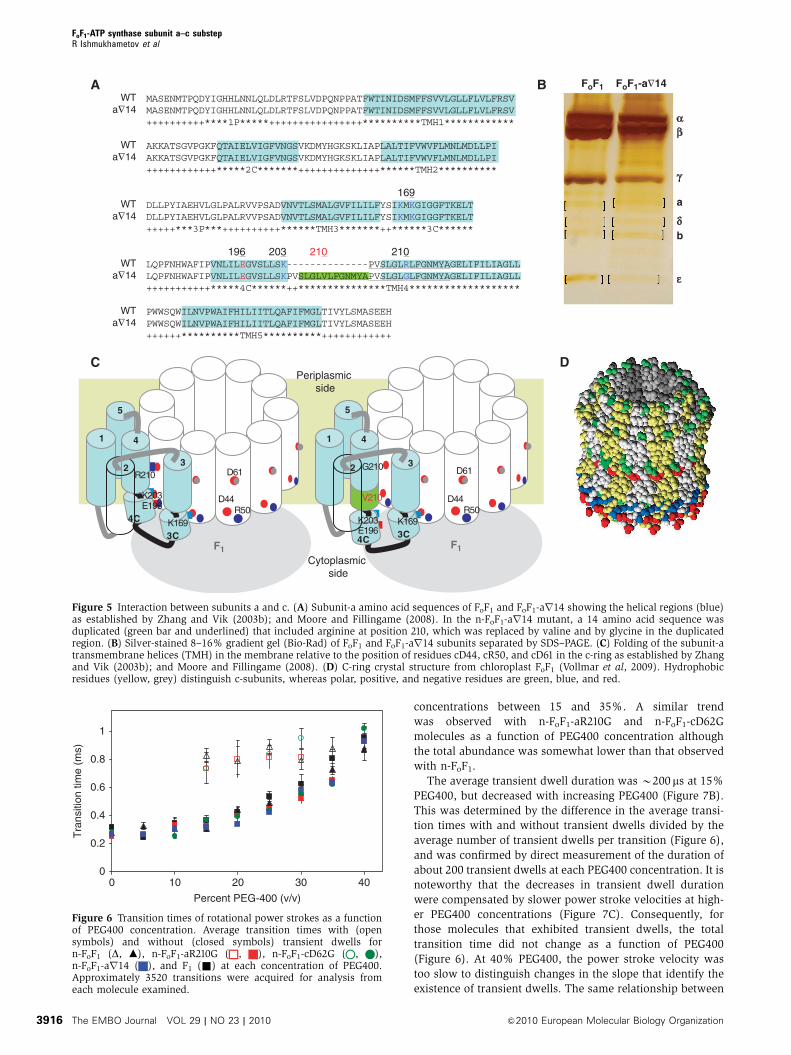
concentrations between 15 and 35%. A similar trend
was observed with n-FoF1-aR210G and n-FoF1-cD62G
molecules as a function of PEG400 concentration although
the total abundance was somewhat lower than that observed
with n-FoF1.
The average transient dwell duration was B200 ms at 15%
PEG400, but decreased with increasing PEG400 (Figure 7B).
This was determined by the difference in the average transi-
tion times with and without transient dwells divided by the
average number of transient dwells per transition (Figure 6),
and was confirmed by direct measurement of the duration of
about 200 transient dwells at each PEG400 concentration. It is
noteworthy that the decreases in transient dwell duration
were compensated by slower power stroke velocities at high-
er PEG400 concentrations (Figure 7C). Consequently, for
those molecules that exhibited transient dwells, the total
transition time did not change as a function of PEG400
(Figure 6). At 40% PEG400, the power stroke velocity was
too slow to distinguish changes in the slope that identify the
existence of transient dwells. The same relationship between
0
0.2
0.4
0.6
0.8
1
0 10 20 30 40
Percent PEG-400 (v/v)
Tra
nsiti
on ti
me
(ms)
Figure 6 Transition times of rotational power strokes as a functionof PEG400 concentration. Average transition times with (opensymbols) and without (closed symbols) transient dwells forn-FoF1 (D, m), n-FoF1-aR210G ( , ), n-FoF1-cD62G ( , ),n-FoF1-ar14 ( ), and F1 (&) at each concentration of PEG400.Approximately 3520 transitions were acquired for analysis fromeach molecule examined.
A BMASENMTPQDYIGHHLNNLQLDLRTFSLVDPQNPPATFWTINIDSMFFSVVLGLLFLVLFRSVMASENMTPQDYIGHHLNNLQLDLRTFSLVDPQNPPATFWTINIDSMFFSVVLGLLFLVLFRSV++++++++++****1P*****++++++++++++++++**********TMH1************
AKKATSGVPGKFQTAIELVIGFVNGSVKDMYHGKSKLIAPLALTIFVWVFLMNLMDLLPIAKKATSGVPGKFQTAIELVIGFVNGSVKDMYHGKSKLIAPLALTIFVWVFLMNLMDLLPI++++++++++++*****2C*******++++++++++++++******TMH2**********
169DLLPYIAEHVLGLPALRVVPSADVNVTLSMALGVFILILFYSIKMKGIGGFTKELTDLLPYIAEHVLGLPALRVVPSADVNVTLSMALGVFILILFYSIKMKGIGGFTKELT+++++***3P***++++++++++******TMH3*******++******3C******
196 203 210 210WT
a∇14
WTa∇14
WTa∇14
WTa∇14
WTa∇14
LQPFNHWAFIPVNLILEGVSLLSK--------------PVSLGLRLFGNMYAGELIFILIAGLLLQPFNHWAFIPVNLILEGVSLLSKPVSLGLVLFGNMYAPVSLGLGLFGNMYAGELIFILIAGLL+++++++++++*****4C******++***************TMH4*******************
PWWSQWILNVPWAIFHILIITLQAFIFMGLTIVYLSMASEEHPWWSQWILNVPWAIFHILIITLQAFIFMGLTIVYLSMASEEH++++++**********TMH5**********++++++++++++
FoF1 FoF1-a∇14
a
b
C DPeriplasmic
side
F1
3
4
5
1
2 D61
D44R50
3C
4C
R210
K169
K203E196
F1
3
5
1
3C4C
K203E196
K169
D61
4
2
D44R50
G210
V210
2
4
Cytoplasmic side
Figure 5 Interaction between subunits a and c. (A) Subunit-a amino acid sequences of FoF1 and FoF1-ar14 showing the helical regions (blue)as established by Zhang and Vik (2003b); and Moore and Fillingame (2008). In the n-FoF1-ar14 mutant, a 14 amino acid sequence wasduplicated (green bar and underlined) that included arginine at position 210, which was replaced by valine and by glycine in the duplicatedregion. (B) Silver-stained 8–16% gradient gel (Bio-Rad) of FoF1 and FoF1-ar14 subunits separated by SDS–PAGE. (C) Folding of the subunit-atransmembrane helices (TMH) in the membrane relative to the position of residues cD44, cR50, and cD61 in the c-ring as established by Zhangand Vik (2003b); and Moore and Fillingame (2008). (D) C-ring crystal structure from chloroplast FoF1 (Vollmar et al, 2009). Hydrophobicresidues (yellow, grey) distinguish c-subunits, whereas polar, positive, and negative residues are green, blue, and red.
FoF1-ATP synthase subunit a–c substepR Ishmukhametov et al
The EMBO Journal VOL 29 | NO 23 | 2010 &2010 European Molecular Biology Organization3916
transient dwell duration and transition time was also ob-
served with the n-FoF1-aR210G and n-FoF1-cD62G mutants.
The appearance of transient dwells is not an effect of the
binding of PEG400 to the enzyme as none of the n-FoF1-ar14
molecules contained these dwells regardless of the PEG400
concentration. Alternatively, the transient dwells may appear
when PEG400 increases the viscous drag on the motor
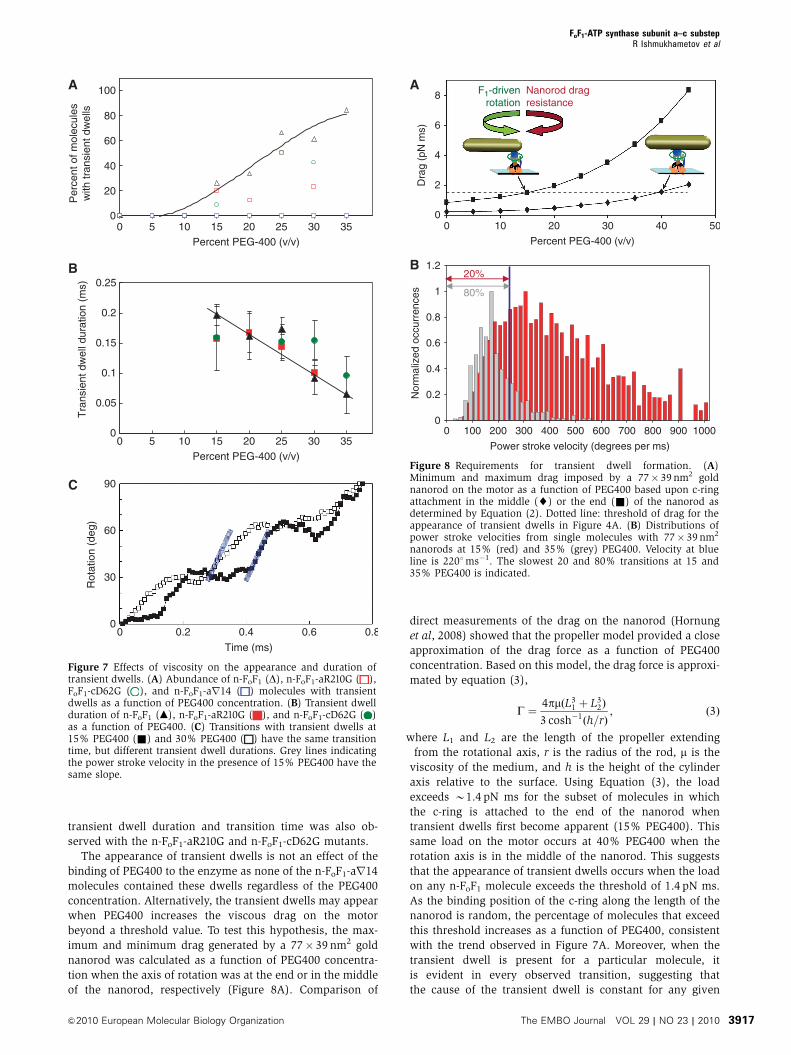
beyond a threshold value. To test this hypothesis, the max-
imum and minimum drag generated by a 77� 39 nm2 gold
nanorod was calculated as a function of PEG400 concentra-
tion when the axis of rotation was at the end or in the middle
of the nanorod, respectively (Figure 8A). Comparison of
direct measurements of the drag on the nanorod (Hornung
et al, 2008) showed that the propeller model provided a close
approximation of the drag force as a function of PEG400
concentration. Based on this model, the drag force is approxi-
mated by equation (3),
G ¼4pmðL3
1 þ L32Þ
3 cosh�1ðh=rÞ; ð3Þ
where L1 and L2 are the length of the propeller extending
from the rotational axis, r is the radius of the rod, m is the
viscosity of the medium, and h is the height of the cylinder
axis relative to the surface. Using Equation (3), the load
exceeds B1.4 pN ms for the subset of molecules in which
the c-ring is attached to the end of the nanorod when
transient dwells first become apparent (15% PEG400). This
same load on the motor occurs at 40% PEG400 when the
rotation axis is in the middle of the nanorod. This suggests
that the appearance of transient dwells occurs when the load
on any n-FoF1 molecule exceeds the threshold of 1.4 pN ms.
As the binding position of the c-ring along the length of the
nanorod is random, the percentage of molecules that exceed
this threshold increases as a function of PEG400, consistent
with the trend observed in Figure 7A. Moreover, when the
transient dwell is present for a particular molecule, it
is evident in every observed transition, suggesting that
the cause of the transient dwell is constant for any given
0
30
60
90
0 0.2 0.4 0.6 0.8
Time (ms)
Rot
atio
n (d
eg)
0
20
40
60
80
100
0 5 10 15 20 25 30 35Percent PEG-400 (v/v)
Per
cent
of m
olec
ules
with
tran
sien
t dw
ells
0 5 10 15 20 25 30 35Percent PEG-400 (v/v)
0
0.05
0.1
0.15
0.2
0.25
Tra
nsie
nt d
wel
l dur
atio
n (m
s)
B
A
C
Figure 7 Effects of viscosity on the appearance and duration oftransient dwells. (A) Abundance of n-FoF1 (D), n-FoF1-aR210G ( ),FoF1-cD62G ( ), and n-FoF1-ar14 ( ) molecules with transientdwells as a function of PEG400 concentration. (B) Transient dwellduration of n-FoF1 (m), n-FoF1-aR210G ( ), and n-FoF1-cD62G ( )as a function of PEG400. (C) Transitions with transient dwells at15% PEG400 (&) and 30% PEG400 ( ) have the same transitiontime, but different transient dwell durations. Grey lines indicatingthe power stroke velocity in the presence of 15% PEG400 have thesame slope.
0
2
4
6
8
0 10 20 30 40 50
Percent PEG-400 (v/v)
Dra
g (p
N m
s)
A
0
0.2
0.4
0.6
0.8
1
1.2
0 100 200 300 400 500 600 700 800 900 1000
Power stroke velocity (degrees per ms)
Nor
mal
ized
occ
urre
nces
B20%
80%
F1-drivenrotation
Nanorod drag resistance
Figure 8 Requirements for transient dwell formation. (A)Minimum and maximum drag imposed by a 77� 39 nm2 goldnanorod on the motor as a function of PEG400 based upon c-ringattachment in the middle (~) or the end (&) of the nanorod asdetermined by Equation (2). Dotted line: threshold of drag for theappearance of transient dwells in Figure 4A. (B) Distributions ofpower stroke velocities from single molecules with 77� 39 nm2
nanorods at 15% (red) and 35% (grey) PEG400. Velocity at blueline is 2201ms�1. The slowest 20 and 80% transitions at 15 and35% PEG400 is indicated.
FoF1-ATP synthase subunit a–c substepR Ishmukhametov et al
&2010 European Molecular Biology Organization The EMBO Journal VOL 29 | NO 23 | 2010 3917
molecule, as is the case for the binding orientation of the rod
to the motor.
The distributions of power stroke velocities observed in the
presence of 15 (red bars) and 35% (grey bars) PEG400 is
shown in Figure 8B, where the fraction of molecules that
exhibit transient dwells was 20 and 80%, respectively. Thus,
the molecules subject to the drag on the motor exceeding the
1.4 pN ms threshold will have power stroke velocities in the
slowest 20 and 80% of the two distributions at these PEG400
concentrations. This corresponds to molecules with velocities
o2201ms�1 (blue line) for both distributions. At this velo-
city, the c-ring rotates 361 in about 163 ms. As the interaction
responsible for the transient dwells occurs about every 361
(i.e. between subunit-a and each c-subunit, Table II), the time
constant for formation of the transient interaction is B160 ms.
Thus, the drag threshold needed to observe transient dwells
is actually the extent to which the power stroke velocity must
be decreased in order to allow the interaction to form within
the time that the c-ring rotates 361. Any molecule that rotates
361 in o163 ms does not exhibit transient dwells.
The interaction responsible for the transient dwell
behaves as a leash
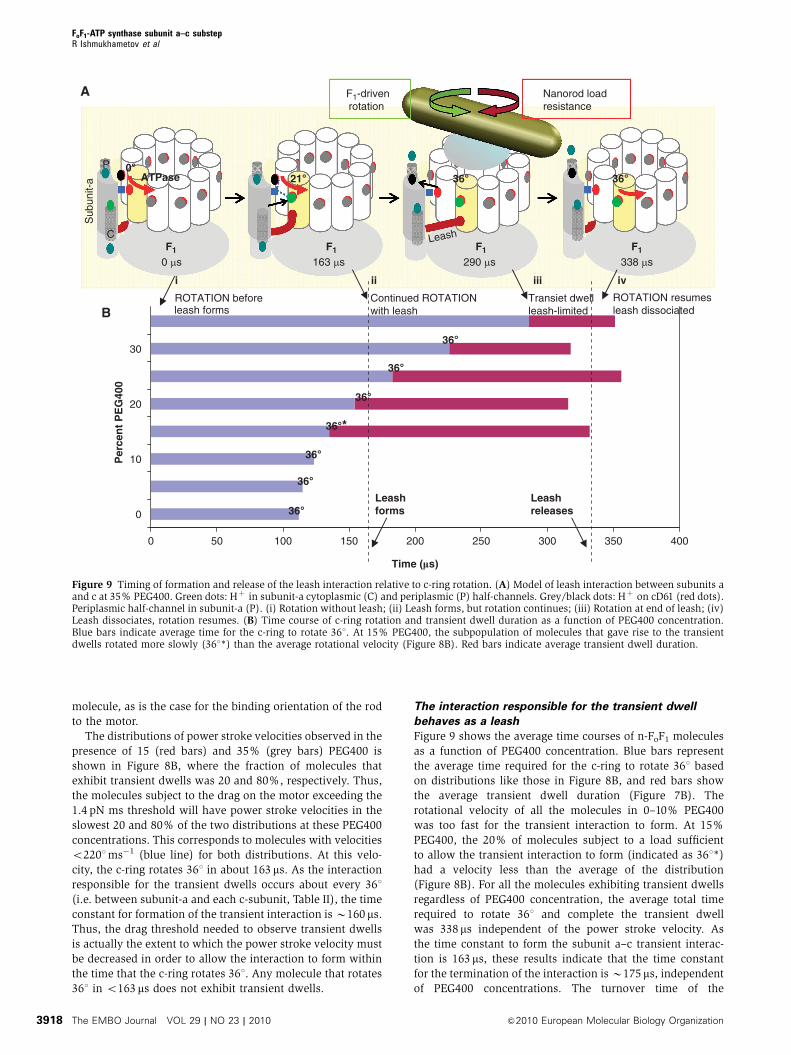
Figure 9 shows the average time courses of n-FoF1 molecules
as a function of PEG400 concentration. Blue bars represent
the average time required for the c-ring to rotate 361 based
on distributions like those in Figure 8B, and red bars show
the average transient dwell duration (Figure 7B). The
rotational velocity of all the molecules in 0–10% PEG400
was too fast for the transient interaction to form. At 15%
PEG400, the 20% of molecules subject to a load sufficient
to allow the transient interaction to form (indicated as 361*)
had a velocity less than the average of the distribution
(Figure 8B). For all the molecules exhibiting transient dwells
regardless of PEG400 concentration, the average total time
required to rotate 361 and complete the transient dwell
was 338 ms independent of the power stroke velocity. As
the time constant to form the subunit a–c transient interac-
tion is 163 ms, these results indicate that the time constant
for the termination of the interaction is B175 ms, independent
of PEG400 concentrations. The turnover time of the
0 50 100 150 200 250 300 350 400
0
10
20
30
Per
cen
t P
EG
400
Leashforms
Time (�s)
Leashreleases36°
36°
36°
36°
36°
36°
B
F1 F1 F1F1
0°36°ATPase
0 µs 163 µs 290 µs 338 µs
C
21°
Leash
Sub
unit-
a
P36°
iviiiiii
ROTATION before Continued ROTATIONwith leash
Transiet dwellleash-limited
ROTATION resumesleash dissociated
A F1-drivenrotation
Nanorod loadresistance
leash forms
36°*
Figure 9 Timing of formation and release of the leash interaction relative to c-ring rotation. (A) Model of leash interaction between subunits aand c at 35% PEG400. Green dots: Hþ in subunit-a cytoplasmic (C) and periplasmic (P) half-channels. Grey/black dots: Hþ on cD61 (red dots).Periplasmic half-channel in subunit-a (P). (i) Rotation without leash; (ii) Leash forms, but rotation continues; (iii) Rotation at end of leash; (iv)Leash dissociates, rotation resumes. (B) Time course of c-ring rotation and transient dwell duration as a function of PEG400 concentration.Blue bars indicate average time for the c-ring to rotate 361. At 15% PEG400, the subpopulation of molecules that gave rise to the transientdwells rotated more slowly (361*) than the average rotational velocity (Figure 8B). Red bars indicate average transient dwell duration.
FoF1-ATP synthase subunit a–c substepR Ishmukhametov et al
The EMBO Journal VOL 29 | NO 23 | 2010 &2010 European Molecular Biology Organization3918
interaction responsible for the transient dwells is then
B338 ms.
The extent to which the c-ring has rotated after 163 ms
(transient interaction formation time) decreases as the
rotational velocity is slowed by increased load on the
motor. For example, at 25 and 35% PEG400, the interaction
forms after the c-ring has rotated B31 and 211, respectively
(Figure 9A). As transient dwells appear about every 361, the
decrease in observed transient dwell duration (161 and 59 ms
at 25 and 35% PEG400, respectively) indicates that formation
of the transient interaction acts as a leash. At the slowest
velocities in the distribution of any given molecule (e.g.
Figure 8B), the transient interaction forms after the c-ring
has rotated only a few degrees such that the leash must allow
rotation to continue to a limit of B361.
Discussion
Model for the leash mechanism
A schematic of FoF1 illustrating the steps in the Fo leash
mechanism is summarized in Figure 9A for F1-ATPase-driven
rotation in 35% PEG400 based on the data presented here. In
this model, all cD61 carboxyl groups (red) dots are proto-
nated (grey/black dots) except in the yellow c-subunit where
cD61 interacts with aR210 (blue square). (i) At the start of an
F1-ATPase 1201 power stroke, constant torque is applied to
the c-ring, which begins to rotate in the absence of the leash.
Residue cD61 of the yellow c-subunit becomes protonated
(green dot) from the cytoplasmic half-channel (C) as it rotates
away from aR210. (ii) Formation of the transient leash occurs
at B163 ms, at which point the c-ring has rotated 211, which
does not interfere with rotation. (iii) Rotation is interrupted at
290 ms when the leash becomes fully extended upon rotation
of the c-ring by 361, at which point the transient dwell
becomes apparent. A proton (black dot) moves to the peri-
plasmic half-channel (P) as aR210 deprotonates cD61 on the
adjacent c-subunit. (iv) Rotation resumes at 338 ms upon
dissociation of the leash.
As the E. coli F1-ATPase generates 62 pN nm of torque
(Hornung et al, 2008), the leash is likely comprised of multi-
ple salt bridges between subunit-a and the c-ring to be of
sufficient strength to cause the transient dwells. With the
exception of aR210 and cD61, conserved charged residues on
both subunit-a and the c-ring that could participate in such
intersubunit salt bridges occur only on the cytoplasmic side
of the membrane (Figure 5). At this location, available crystal
structures of c-rings (Meier et al, 2009; Pogoryelov et al, 2009;
Vollmar et al, 2009; Dautant et al, 2010) all show a band of
charged residues analogous to cD44 and cR50 in E. coli.
Cross-linking studies between subunits-a and c support the
juxtaposition of aE196 and cR50 (Jiang and Fillingame, 1998;
Zhang and Vik, 2003a, b), and aqueous accessibility studies
position aK169, aK203, aE196, and cR50 close to the cyto-
plasmic surface of the membrane facing subunit-a
(Fillingame et al, 2000; Zhang and Vik, 2003b; Steed and
Fillingame, 2009). This suggests that the axis of subunit-a,
helix 4C may be more parallel to the membrane surface than
is represented in Figure 5C. At this location, the deprotonated
aE196 and cD44 carboxyl groups that could participate in salt
bridges between subunits-a and c are not subjected to the
large free energy penalty that would result if they were buried
in the hydrophobic core of the membrane-like cD61 (Elston
et al, 1998). Thus, the formation/dissociation kinetics of salt
bridges formed from these groups is anticipated to be
consistent with the transient dwells observed here.
Site-directed mutations that altered the charge of aE196
were found to significantly alter E. coli Fo-dependent proton
translocation (Vik et al, 1988), and aE196 has been identified
as one of three sites leading to oligomycin resistance in
mitochondria (Breen et al, 1986; John and Nagley, 1986;
Ray et al, 1988). Mutational studies have implicated that
aE196 (Zhang and Vik, 2003a; Moore et al, 2008) and aK203
(Moore et al, 2008) participate in the proton half-channel
between cD61 and the cytoplasm. Mutations aK203C
(Angevine et al, 2007), aK167Q, and/or aK169Q
(Lightowlers et al, 1987) do not effect the activity of FoF1
significantly. However, in each case, polar groups were
created by these mutations, which would not eliminate the
ability to form hydrogen bonds between subunits-a and c.
It is noteworthy that participation in a proton half-channel and
in the formation of the transient dwells observed here need not
be mutually exclusive functions of a particular residue. These
functions could be linked under conditions where the free energy
from the PMF and the logQ are close to equilibrium. The results
of the FoF1-ar14 mutant reported here (Figure 4B) that eliminate
the transient dwells are consistent with the juxtaposition of these
residues on subunits-a and c. However, given that this mutant
includes a 14 amino acid insertion, more experiments are
required to pinpoint the specific interaction responsible for the
transient dwells.
The results presented here support a mechanism for c-ring
rotation when the F1 motor is subjected to a load (Figure 9A).
Under these conditions, the cycle of Figure 9A repeats with
each c-subunit in 361 increments until the F1-ATPase power
stroke completes 1201 to begin the next catalytic dwell
(Figure 10A). This conclusion is supported by the observa-
tions of 2.5 transient dwells per transition with an average of
371 between transient dwells within a transition (Table II).
These data suggest that double, triple, or multiple steps
between transient dwells are rare. This means that on aver-
age, each 1201 power stroke includes rotation of the c-ring by
three complete c-subunit steps (361 each) and 121 of a fourth
step. This partial fourth step can be accommodated by the
observation presented here that the leash can form before the
c-subunit has rotated the full 361. The well-established com-
pliance of the g-subunit drive shaft (Sielaff et al, 2008) and
the stochastic nature of F1-ATPase-driven rotation (Yasuda
et al, 1998) will also mediate the stoichiometric differences
between Fo and F1.
The lack of an effect of aR210G and cD62G mutations on
the transient dwells reported here demonstrates that proton
translocation is independent of, and not rate limiting to, the
interactions responsible for the transient dwells during
ATPase-driven rotation. Thus, even though the power stroke
velocity at p10% PEG400 occurs too quickly for the transient
dwell to form (Figure 7A), ATPase-driven proton transloca-
tion across the lipid bilayer of the nanodisc can still occur
(Figure 10B). This conclusion is consistent with the much
higher rates of Fo-dependent proton translocation that can
occur in response to a PMF after F1 has been removed
(Franklin et al, 2004; Wiedenmann et al, 2008), and the
fact that the proton translocation rate of Fo does not saturate
at high-driving force (Feniouk and Junge, 2008). Based on the
leash formation rate of 163 ms/Hþ reported here, the leash
FoF1-ATP synthase subunit a–c substepR Ishmukhametov et al
&2010 European Molecular Biology Organization The EMBO Journal VOL 29 | NO 23 | 2010 3919
will form until Fo proton translocation rates exceed 6135 Hþ
s�1. Chloroplast Fo was observed to exceed this rate, and a
PMF could not be found that was large enough to maximize
the proton translocation rate (Feniouk and Junge, 2008).
However, direct comparison of chloroplast and E. coli Fo
indicates that the latter translocates protons more slowly
(Wiedenmann et al, 2008), such that leash engagement will
occur in E. coli FoF1 even at the highest reported rates of 3100
Hþ s�1 (Franklin et al, 2004).
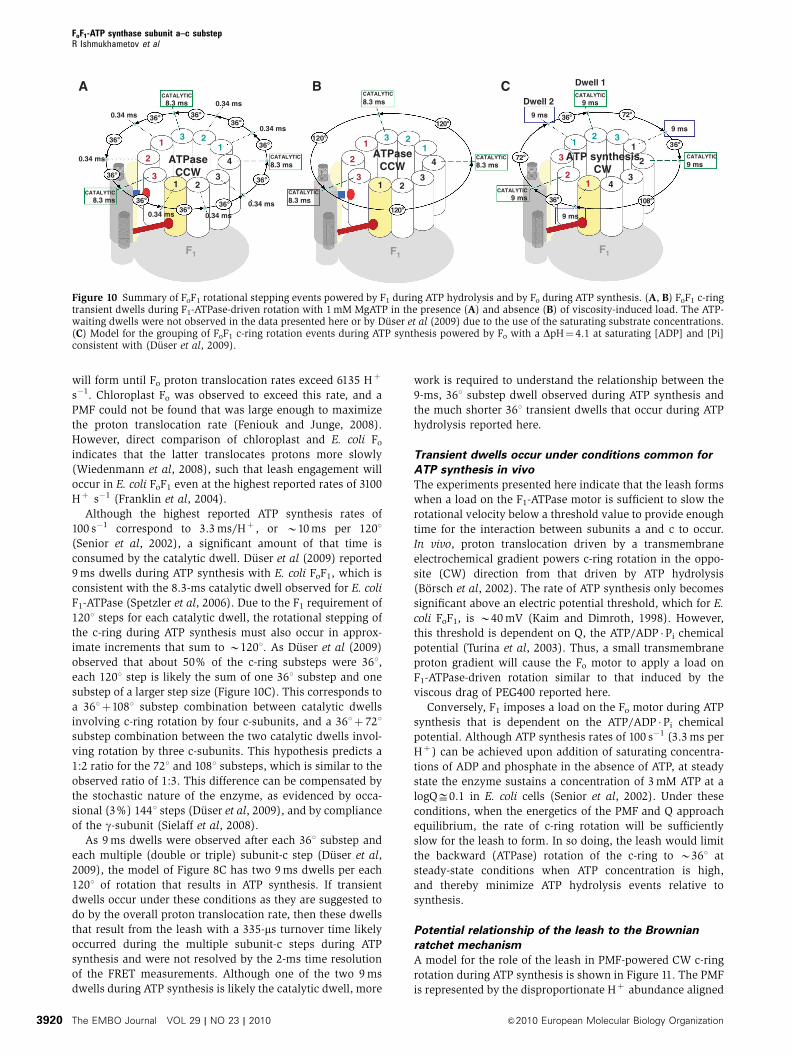
Although the highest reported ATP synthesis rates of
100 s�1 correspond to 3.3 ms/Hþ , or B10 ms per 1201
(Senior et al, 2002), a significant amount of that time is
consumed by the catalytic dwell. Duser et al (2009) reported
9 ms dwells during ATP synthesis with E. coli FoF1, which is
consistent with the 8.3-ms catalytic dwell observed for E. coli
F1-ATPase (Spetzler et al, 2006). Due to the F1 requirement of
1201 steps for each catalytic dwell, the rotational stepping of
the c-ring during ATP synthesis must also occur in approx-
imate increments that sum to B1201. As Duser et al (2009)
observed that about 50% of the c-ring substeps were 361,
each 1201 step is likely the sum of one 361 substep and one
substep of a larger step size (Figure 10C). This corresponds to
a 361þ1081 substep combination between catalytic dwells
involving c-ring rotation by four c-subunits, and a 361þ 721
substep combination between the two catalytic dwells invol-
ving rotation by three c-subunits. This hypothesis predicts a
1:2 ratio for the 721 and 1081 substeps, which is similar to the
observed ratio of 1:3. This difference can be compensated by
the stochastic nature of the enzyme, as evidenced by occa-
sional (3%) 1441 steps (Duser et al, 2009), and by compliance
of the g-subunit (Sielaff et al, 2008).
As 9 ms dwells were observed after each 361 substep and
each multiple (double or triple) subunit-c step (Duser et al,
2009), the model of Figure 8C has two 9 ms dwells per each
1201 of rotation that results in ATP synthesis. If transient
dwells occur under these conditions as they are suggested to
do by the overall proton translocation rate, then these dwells
that result from the leash with a 335-ms turnover time likely
occurred during the multiple subunit-c steps during ATP
synthesis and were not resolved by the 2-ms time resolution
of the FRET measurements. Although one of the two 9 ms
dwells during ATP synthesis is likely the catalytic dwell, more
work is required to understand the relationship between the
9-ms, 361 substep dwell observed during ATP synthesis and
the much shorter 361 transient dwells that occur during ATP
hydrolysis reported here.
Transient dwells occur under conditions common for
ATP synthesis in vivo
The experiments presented here indicate that the leash forms
when a load on the F1-ATPase motor is sufficient to slow the
rotational velocity below a threshold value to provide enough
time for the interaction between subunits a and c to occur.
In vivo, proton translocation driven by a transmembrane
electrochemical gradient powers c-ring rotation in the oppo-
site (CW) direction from that driven by ATP hydrolysis
(Borsch et al, 2002). The rate of ATP synthesis only becomes
significant above an electric potential threshold, which for E.
coli FoF1, is B40 mV (Kaim and Dimroth, 1998). However,
this threshold is dependent on Q, the ATP/ADP �Pi chemical
potential (Turina et al, 2003). Thus, a small transmembrane
proton gradient will cause the Fo motor to apply a load on
F1-ATPase-driven rotation similar to that induced by the
viscous drag of PEG400 reported here.
Conversely, F1 imposes a load on the Fo motor during ATP
synthesis that is dependent on the ATP/ADP �Pi chemical
potential. Although ATP synthesis rates of 100 s�1 (3.3 ms per
Hþ ) can be achieved upon addition of saturating concentra-
tions of ADP and phosphate in the absence of ATP, at steady
state the enzyme sustains a concentration of 3 mM ATP at a
logQD0.1 in E. coli cells (Senior et al, 2002). Under these
conditions, when the energetics of the PMF and Q approach
equilibrium, the rate of c-ring rotation will be sufficiently
slow for the leash to form. In so doing, the leash would limit
the backward (ATPase) rotation of the c-ring to B361 at
steady-state conditions when ATP concentration is high,
and thereby minimize ATP hydrolysis events relative to
synthesis.
Potential relationship of the leash to the Brownian
ratchet mechanism
A model for the role of the leash in PMF-powered CW c-ring
rotation during ATP synthesis is shown in Figure 11. The PMF
is represented by the disproportionate Hþ abundance aligned
A B C
F1
1 2
3
4
1 12
2
3 3
ATPaseCCW
120°
120°
120°
CATALYTIC
8.3 ms
CATALYTIC
8.3 ms
CATALYTIC
8.3 ms
CATALYTIC
9 ms
CATALYTIC
9 ms
F1
1
2
3
41
1
2
2
3
3
9 ms
9 ms
9 ms
36°
36°
36°
72°
72°
108°
ATP synthesisCW
Dwell 2
Dwell 1
CATALYTIC
9 ms
F1
1 2
3
4
1 12
2
3 3
0.34 ms
0.34 ms
0.34 ms
0.34 ms
0.34 ms
0.34 ms
36°
36°
36°
36°36°36°
36°
36°
36°36°
ATPaseCCW
CATALYTIC
8.3 ms
CATALYTIC
8.3 ms
CATALYTIC
8.3 ms
0.34 ms
Figure 10 Summary of FoF1 rotational stepping events powered by F1 during ATP hydrolysis and by Fo during ATP synthesis. (A, B) FoF1 c-ringtransient dwells during F1-ATPase-driven rotation with 1 mM MgATP in the presence (A) and absence (B) of viscosity-induced load. The ATP-waiting dwells were not observed in the data presented here or by Duser et al (2009) due to the use of the saturating substrate concentrations.(C) Model for the grouping of FoF1 c-ring rotation events during ATP synthesis powered by Fo with a DpH¼ 4.1 at saturating [ADP] and [Pi]consistent with (Duser et al, 2009).
FoF1-ATP synthase subunit a–c substepR Ishmukhametov et al
The EMBO Journal VOL 29 | NO 23 | 2010 &2010 European Molecular Biology Organization3920
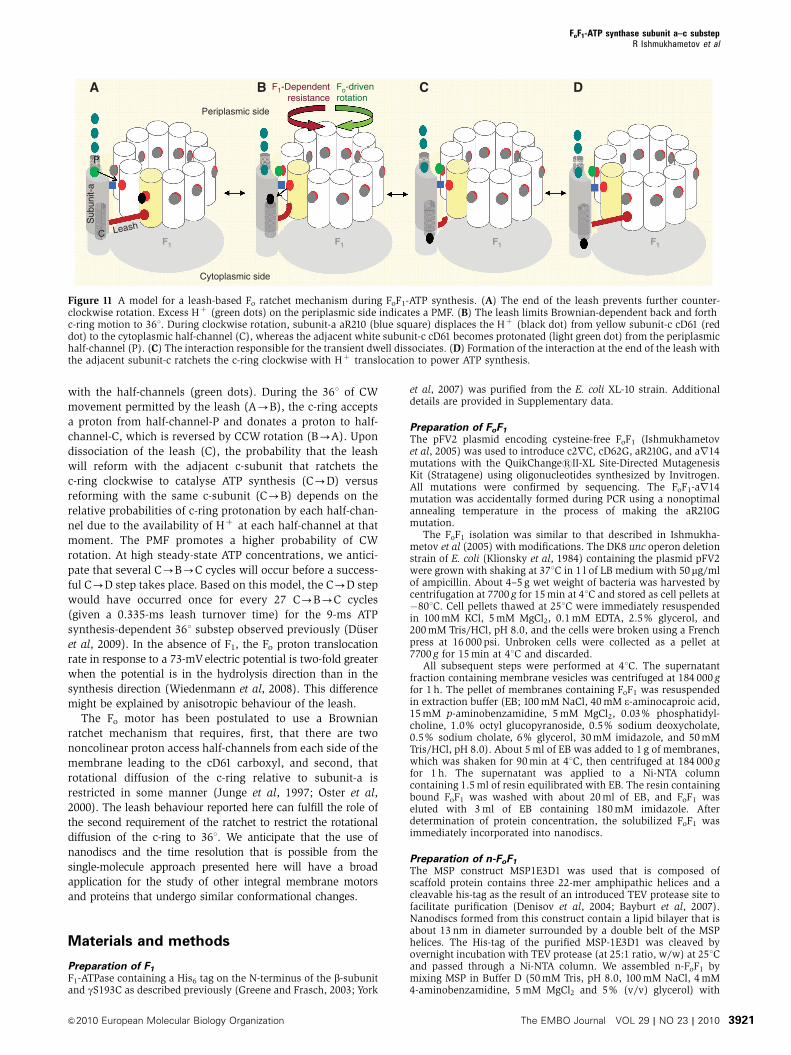
with the half-channels (green dots). During the 361 of CW
movement permitted by the leash (A-B), the c-ring accepts
a proton from half-channel-P and donates a proton to half-
channel-C, which is reversed by CCW rotation (B-A). Upon
dissociation of the leash (C), the probability that the leash
will reform with the adjacent c-subunit that ratchets the
c-ring clockwise to catalyse ATP synthesis (C-D) versus
reforming with the same c-subunit (C-B) depends on the
relative probabilities of c-ring protonation by each half-chan-
nel due to the availability of Hþ at each half-channel at that
moment. The PMF promotes a higher probability of CW
rotation. At high steady-state ATP concentrations, we antici-
pate that several C-B-C cycles will occur before a success-
ful C-D step takes place. Based on this model, the C-D step
would have occurred once for every 27 C-B-C cycles
(given a 0.335-ms leash turnover time) for the 9-ms ATP
synthesis-dependent 361 substep observed previously (Duser
et al, 2009). In the absence of F1, the Fo proton translocation
rate in response to a 73-mVelectric potential is two-fold greater
when the potential is in the hydrolysis direction than in the
synthesis direction (Wiedenmann et al, 2008). This difference
might be explained by anisotropic behaviour of the leash.
The Fo motor has been postulated to use a Brownian
ratchet mechanism that requires, first, that there are two
noncolinear proton access half-channels from each side of the
membrane leading to the cD61 carboxyl, and second, that
rotational diffusion of the c-ring relative to subunit-a is
restricted in some manner (Junge et al, 1997; Oster et al,
2000). The leash behaviour reported here can fulfill the role of
the second requirement of the ratchet to restrict the rotational
diffusion of the c-ring to 361. We anticipate that the use of
nanodiscs and the time resolution that is possible from the
single-molecule approach presented here will have a broad
application for the study of other integral membrane motors
and proteins that undergo similar conformational changes.
Materials and methods
Preparation of F1
F1-ATPase containing a His6 tag on the N-terminus of the b-subunitand gS193C as described previously (Greene and Frasch, 2003; York
et al, 2007) was purified from the E. coli XL-10 strain. Additionaldetails are provided in Supplementary data.
Preparation of FoF1
The pFV2 plasmid encoding cysteine-free FoF1 (Ishmukhametovet al, 2005) was used to introduce c2rC, cD62G, aR210G, and ar14mutations with the QuikChangesII-XL Site-Directed MutagenesisKit (Stratagene) using oligonucleotides synthesized by Invitrogen.All mutations were confirmed by sequencing. The FoF1-ar14mutation was accidentally formed during PCR using a nonoptimalannealing temperature in the process of making the aR210Gmutation.
The FoF1 isolation was similar to that described in Ishmukha-metov et al (2005) with modifications. The DK8 unc operon deletionstrain of E. coli (Klionsky et al, 1984) containing the plasmid pFV2were grown with shaking at 371C in 1 l of LB medium with 50mg/mlof ampicillin. About 4–5 g wet weight of bacteria was harvested bycentrifugation at 7700 g for 15 min at 41C and stored as cell pellets at�801C. Cell pellets thawed at 251C were immediately resuspendedin 100 mM KCl, 5 mM MgCl2, 0.1 mM EDTA, 2.5% glycerol, and200 mM Tris/HCl, pH 8.0, and the cells were broken using a Frenchpress at 16 000 psi. Unbroken cells were collected as a pellet at7700 g for 15 min at 41C and discarded.
All subsequent steps were performed at 41C. The supernatantfraction containing membrane vesicles was centrifuged at 184 000 gfor 1 h. The pellet of membranes containing FoF1 was resuspendedin extraction buffer (EB; 100 mM NaCl, 40 mM e-aminocaproic acid,15 mM p-aminobenzamidine, 5 mM MgCl2, 0.03% phosphatidyl-choline, 1.0% octyl glucopyranoside, 0.5% sodium deoxycholate,0.5% sodium cholate, 6% glycerol, 30 mM imidazole, and 50 mMTris/HCl, pH 8.0). About 5 ml of EB was added to 1 g of membranes,which was shaken for 90 min at 41C, then centrifuged at 184 000 gfor 1 h. The supernatant was applied to a Ni-NTA columncontaining 1.5 ml of resin equilibrated with EB. The resin containingbound FoF1 was washed with about 20 ml of EB, and FoF1 waseluted with 3 ml of EB containing 180 mM imidazole. Afterdetermination of protein concentration, the solubilized FoF1 wasimmediately incorporated into nanodiscs.
Preparation of n-FoF1
The MSP construct MSP1E3D1 was used that is composed ofscaffold protein contains three 22-mer amphipathic helices and acleavable his-tag as the result of an introduced TEV protease site tofacilitate purification (Denisov et al, 2004; Bayburt et al, 2007).Nanodiscs formed from this construct contain a lipid bilayer that isabout 13 nm in diameter surrounded by a double belt of the MSPhelices. The His-tag of the purified MSP-1E3D1 was cleaved byovernight incubation with TEV protease (at 25:1 ratio, w/w) at 251Cand passed through a Ni-NTA column. We assembled n-FoF1 bymixing MSP in Buffer D (50 mM Tris, pH 8.0, 100 mM NaCl, 4 mM4-aminobenzamidine, 5 mM MgCl2 and 5% (v/v) glycerol) with
F1 F1 F1 F1
A B C D
Periplasmic side
Cytoplasmic side
LeashC
Sub
unit-
a
P
Fo-drivenrotation
F1-Dependentresistance
Figure 11 A model for a leash-based Fo ratchet mechanism during FoF1-ATP synthesis. (A) The end of the leash prevents further counter-clockwise rotation. Excess Hþ (green dots) on the periplasmic side indicates a PMF. (B) The leash limits Brownian-dependent back and forthc-ring motion to 361. During clockwise rotation, subunit-a aR210 (blue square) displaces the Hþ (black dot) from yellow subunit-c cD61 (reddot) to the cytoplasmic half-channel (C), whereas the adjacent white subunit-c cD61 becomes protonated (light green dot) from the periplasmichalf-channel (P). (C) The interaction responsible for the transient dwell dissociates. (D) Formation of the interaction at the end of the leash withthe adjacent subunit-c ratchets the c-ring clockwise with Hþ translocation to power ATP synthesis.
FoF1-ATP synthase subunit a–c substepR Ishmukhametov et al
&2010 European Molecular Biology Organization The EMBO Journal VOL 29 | NO 23 | 2010 3921
10% sodium cholate in Buffer D, and FoF1 in Elution Buffer toachieve a 1:7 molar ratio of FoF1:MSP in 1% sodium cholate with afinal volume not exceeding 1 ml, and adjusted with Buffer D. Tomake biotinylated n-FoF1, a 10-fold molar excess of biotinmaleimide was added to this mixture. The mixture was incubatedat 41C for 15 min with gentle shaking, then passed through a 2-mlSephadex G-50 column equilibrated with Buffer D from which 3 mlof effluent were collected. The effluent was diluted with Buffer D to6 ml to decrease the imidazole concentration to o30 mM, andpassed through a 1.5-ml Ni-NTA column. The column was washedwith 15 ml of Buffer D and eluted with Buffer D, containing 150 mMimidazole. The yield of n-FoF1 was B60–70% of the amount of FoF1
starting material as measured with the BCA protein assay (Sigma).
2D electrophoresisProteins (6 mg total per sample) were first separated on a 5–15%native polyacrylamide gradient gel for 4.5 h at room temperature.The gel slice with the single-dominant band was excised from thegel and transferred to a glass plate, which was covered with 12%denaturing gel (SDS–PAGE). The sample was run for 4.5 h at 251Cand silver stained as described (Nesterenko et al, 1994).
ATP hydrolysis assay and DCCD modification conditionsTo modify the enzyme by DCCD, 10–30 mg of protein was incubatedwith 50mM DCCD at pH 6.5. at 281C in a 2-ml cuvette for 30 min.This solution was diluted into the reaction mixture used to measureATPase activity. The rate of ATP hydrolysis was measured with anATP-regenerating coupled assay that resulted in a final concentra-tion of 50 mM Tris–HCl (pH 8.0), 10 mM KCl, 2.5 mM phosphoe-nolpyruvate, 0.3 mM NADH, 50mg/ml pyruvate kinase, 50mg/mllactate dehydrogenase, and 2 mM MgCl2 and 1 mM ATP. The ratewas determined as the change in absorbance at 340 nm using a Cary100 spectrophotometer with Peltier temperature control. ATPase-driven proton translocation was measured by ACMA quenchingusing FoF1 containing membranes as described (Ishmukhametovet al, 2005).
Single-molecule studiesTo assemble n-FoF1 with a nanorod on the slide, the slide wasspotted with 5 ml of about 85mg/ml of n-FoF1 and incubated for5 min. The slide was washed with assay buffer (10 mM KCl and50 mM Tris, pH 8.0) for 30 s, and excess liquid was removed.Immobilized n-FoF1 was exposed to 5ml avidin-coated goldnanorods prepared as described (Spetzler et al, 2006) for 5 min,then washed with assay buffer. After excess liquid was removed,5 ml of assay buffer containing the desired amount of PEG400,
2 mM ATP and 1 mM MgCl2 was added, a cover slip was applied,and the slide was placed on the microscope.
Rotation measurements were performed as described in Spetzleret al (2009) and Spetzler et al (2006) using a Leica DMIRE IIinverted dark field microscope illuminated with a Sutter LB-17Xenon light source with a custom Chroma cold mirror coupled witha series 2000 Lumatec light guide to deliver 400–925 nm collimatedlight to the dark field condenser. Light not scattered by goldnanorods was blocked by an iris in the � 63 variable apertureobjective. Colour photos of fields of view under the microscopewere obtained with a Zeiss Axiocam HSC series-2 camera with arefresh rate of 53 fps.
To measure transitions, a nanorod observed to blink red andgreen was positioned to a 100-mm pinhole to allow light scatteredfrom that nanorod passed through a polarizing filter and a high pass600 nm cutoff filter (to permit only red light), and focused onto asingle-photon counting avalanche photodiode (Perkin Elmer SPCM-AQR-15) that has a dark count of B50 photons s�1 with a temporalresolution of 50 ns. Detector output was fed to a NationalInstruments DAQ PCI-6602 counter/timer board. Photons wererecorded and binned into different time intervals that providedrotational data with various time resolutions. The rotation of eachmolecule was monitored for 50 s at a data acquisition speed of 100–200 kHz to provide a minimal time resolution of 20–10 ms. Customsoftware was written in LabView 7.1 to control data acquisition andstorage. Additional custom software was written in Matlab 6.5 tocompute transition times.
Supplementary dataSupplementary data are available at The EMBO Journal Online(http://www.embojournal.org).
Acknowledgements
We thank Stephen Sligar for providing MSP1E3D1 and YelenaGrinkova for advice in its handling. We thank R Fillingame, WJunge, P Graber, and P Dimroth for helpful comments in thepreparation of this manuscript. This project was supported byR01GM50202 to WDF. The content is solely the responsibility ofthe authors and does not necessarily represent the official views ofthe NIGMS or the NIH.
Conflict of interest
The authors declare that they have no conflict of interest.
References
Angevine CM, Herold KA, Fillingame RH (2003) Aqueous accesspathways in subunit a of rotary ATP synthase extend to both sidesof the membrane. Proc Natl Acad Sci USA 100 (23): 13179–13183
Angevine CM, Herold KA, Vincent OD, Fillingame RH (2007)Aqueous access pathways in ATP synthase subunit a. Reactivityof cysteine substituted into transmembrane helices 1, 3, and 5.J Biol Chem 282: 9001–9007
Bayburt TH, Leitz AJ, Xie G, Oprian DD, Sligar SG (2007)Transducin activation by nanoscale lipid bilayers containingone and two rhodopsins. J Biol Chem 282: 14875–14881
Borsch M, Diez M, Zimmermann B, Reuter R, Graber P (2002)Stepwise rotation of the gamma-subunit of EFoF1-ATP synthaseobserved by intramolecular single-molecule fluorescence reso-nance energy transfer. FEBS Lett 527: 147–152
Boyer PD (1997) The ATP synthase–a splendid molecular machine.Annu Rev Biochem 66: 717–749
Breen GA, Miller DL, Holmans PL, Welch G (1986) MitochondrialDNA of two independent oligomycin-resistant Chinese hamsterovary cell lines contains a single nucleotide change in the ATPase6 gene. J Biol Chem 261: 11680–11685
Dautant A, Velours J, Giraud MF (2010) Crystal structure of theMg.ADP-inhibited state of the yeast F1c10-ATP synthase. J BiolChem 285: 29502–29510
Denisov IG, Grinkova YV, Lazarides AA, Sligar SG (2004) Directedself-assembly of monodisperse phospholipid bilayer nanodiscswith controlled size. J Am Chem Soc 126: 3477–3487
Duser MG, Zarrabi N, Cipriano DJ, Ernst S, Glick GD,Dunn SD, Borsch M (2009) 36 degrees step size of proton-drivenc-ring rotation in FoF1-ATP synthase. EMBO J 28: 2689–2696
Elston T, Wang H, Oster G (1998) Energy transduction in ATPsynthase. Nature 391: 510–513
Feniouk BA, Junge W (2008) Proton translocation and ATP synth-esis by the FoF1-ATPase of purple bacteria. In The PurplePhototrophic Bacteria, Hunter CN, Daldal F, Thurnauer MC,Beatty JT (eds), Vol. 24, pp 475–494. The Netherlands: Springer
Fillingame RH, Jiang W, Dmitriev OY, Jones PC (2000)Structural interpretations of Fo rotary function in theEscherichia coli F1Fo ATP synthase. Biochim Biophys Acta 1458:387–403
Fillingame RH, Peters LK, White LK, Mosher ME, Paule CR (1984)Mutations altering aspartyl-61 of the omega subunit (uncE pro-tein) of Escherichia coli H+ -ATPase differ in effect on coupledATP hydrolysis. J Bacteriol 158: 1078–1083
Fischer S, Etzold C, Turina P, Deckers-Hebestreit G, Altendorf K,Graber P (1994) ATP synthesis catalyzed by the ATP synthase ofEscherichia coli reconstituted into liposomes. Eur J Biochem 225:167–172
Franklin MJ, Brusilow WS, Woodbury DJ (2004) Determination ofproton flux and conductance at pH 6.8 through single Fo sectorsfrom Escherichia coli. Biophys J 87: 3594–3599
Greene MD, Frasch WD (2003) Interactions among gamma R268,gamma Q269, and the beta subunit catch loop of Escherichia coli
FoF1-ATP synthase subunit a–c substepR Ishmukhametov et al
The EMBO Journal VOL 29 | NO 23 | 2010 &2010 European Molecular Biology Organization3922
F1-ATPase are important for catalytic activity. J Biol Chem 278:51594–51598
Hornung T, Ishmukhametov R, Spetzler D, Martin J, Frasch WD(2008) Determination of torque generation from the power stroke ofEscherichia coli F1-ATPase. Biochim Biophys Acta 1777: 579–582
Ishmukhametov RR, Galkin MA, Vik SB (2005) Ultrafast purifica-tion and reconstitution of His-tagged cysteine-less Escherichia coliF1Fo ATP synthase. Biochim Biophys Acta 1706: 110–116
Ishmukhametov RR, Pond JB, Al-Huqail A, Galkin MA, Vik SB(2008) ATP synthesis without R210 of subunit a in the Escherichiacoli ATP synthase. Biochim Biophys Acta 1777: 32–38
Jiang W, Fillingame RH (1998) Interacting helical faces of subunits aand c in the F1Fo ATP synthase of Escherichia coli defined bydisulfide cross-linking. Proc Natl Acad Sci USA 95: 6607–6612
Jiang WP, Hermolin J, Fillingame RH (2001) The preferred stoichio-metry of c subunits in the rotary motor sector of Escherichia coliATP synthase is 10. Proc Natl Acad Sci USA 98: 4966–4971
John UP, Nagley P (1986) Amino acid substitutions in mitochon-drial ATPase subunit 6 of Saccharomyces cerevisiae leading tooligomycin resistance. FEBS Lett 207: 79–83
Junge W, Lill H, Engelbrecht S (1997) ATP synthase: an electro-chemical transducer with rotatory mechanics. Trends Biochem Sci22: 420–423
Kaim G, Dimroth P (1998) ATP synthesis by the F1Fo ATP synthaseof Escherichia coli is obligatorily dependent on the electricpotential. FEBS Lett 434: 57–60
Kaim G, Prummer M, Sick B, Zumofen G, Renn A, Wild UP,Dimroth P (2002) Coupled rotation within single FoF1 enzymecomplexes during ATP synthesis or hydrolysis. FEBS Lett 525:156–163
Klionsky DJ, Brusilow WS, Simoni RD (1984) In vivo evidence forthe role of the epsilon subunit as an inhibitor of the proton-translocating ATPase of Escherichia coli. J Bacteriol 160: 1055–1060
Lightowlers RN, Howitt SM, Hatch L, Gibson F, Cox GB (1987) Theproton pore in the Escherichia coli FoF1-ATPase: a requirement forarginine at position 210 of the a-subunit. Biochim Biophys Acta894: 399–406
Meier T, Krah A, Bond PJ, Pogoryelov D, Diederichs K,Faraldo-Gomez JD (2009) Complete ion-coordination structure in therotor ring of Na+-dependent F-ATP synthases. J Mol Biol 391: 498–507
Moore KJ, Angevine CM, Vincent OD, Schwem BE, Fillingame RH(2008) The cytoplasmic loops of subunit a of Escherichia coli ATPsynthase may participate in the proton translocating mechanism.J Biol Chem 283: 13044–13052
Moore KJ, Fillingame RH (2008) Structural interactions betweentransmembrane helices 4 and 5 of subunit a and the subunit c ringof Escherichia coli ATP synthase. J Biol Chem 283: 31726–31735
Nesterenko MV, Tilley M, Upton SJ (1994) A simple modification ofBlum’s silver stain method allows for 30minute detection of proteinsin polyacrylamide gels. J Biochem Biophys Methods 28: 239–242
Nishio K, Iwamoto-Kihara A, Yamamoto A, Wada Y, Futai M (2002)Subunit rotation of ATP synthase embedded in membranes: a orbeta subunit rotation relative to the c subunit ring. Proc Natl AcadSci U S A 99: 13448–13452
Noji H, Hasler K, Junge W, Kinosita Jr K, Yoshida M, Engelbrecht S(1999) Rotation of Escherichia coli F1-ATPase. Biochem BiophysRes Commun 260: 597–599
Oster G, Wang H, Grabe M (2000) How Fo-ATPase generates rotarytorque. Philos Trans R Soc Lond B Biol Sci 355: 523–528
Panke O, Gumbiowski K, Junge W, Engelbrecht S (2000) F-ATPase:specific observation of the rotating c subunit oligomer of EFoEF1.FEBS Lett 472: 34–38
Pogoryelov D, Yildiz O, Faraldo-Gomez JD, Meier T (2009) High-resolution structure of the rotor ring of a proton-dependent ATPsynthase. Nat Struct Mol Biol 16: 1068–1073
Ray MK, Connerton IF, Griffiths DE (1988) DNA sequence analysisof the Olir2-76 and Ossr1-92 alleles of the Oli-2 region of the yeast
Saccharomyces cerevisiae. Analysis of related amino-acid substi-tutions and protein-antibiotic interaction. Biochim Biophys Acta951: 213–219
Sabbert D, Engelbrecht S, Junge W (1996) Intersubunit rotation inactive F-ATPase. Nature 381: 623–625
Sambongi Y, Iko Y, Tanabe M, Omote H, Iwamoto-Kihara A, Ueda I,Yanagida T, Wada Y, Futai M (1999) Mechanical rotation of thec subunit oligomer in ATP synthase (FoF1): direct observation.Science 286: 1722–1724
Senior AE, Nadanaciva S, Weber J (2002) The molecular mechan-ism of ATP synthesis by F1Fo-ATP synthase. Biochim Biophys Acta1553: 188–211
Sielaff H, Rennekamp H, Wachter A, Xie H, Hilbers F, Feldbauer K,Dunn SD, Engelbrecht S, Junge W (2008) Domain complianceand elastic power transmission in rotary FOF1-ATPase. Proc NatlAcad Sci U S A 105: 17760–17765
Sonnichsen C, Alivisatos AP (2005) Gold nanorods as novelnonbleaching plasmon-based orientation sensors for polarizedsingle-particle microscopy. Nano Lett 5: 301–304
Spetzler D, Ishmukhametov R, Hornung T, Day LJ, Martin J, FraschWD (2009) Single molecule measurements of F1-ATPase reveal aninterdependence between the power stroke and the dwell dura-tion. Biochemistry 48: 7979–7985
Spetzler D, York J, Daniel D, Fromme R, Lowry D, Frasch W (2006)Microsecond time scale rotation measurements of singleF1-ATPase molecules. Biochemistry 45: 3117–3124
Steed PR, Fillingame RH (2009) Aqueous accessibility to the trans-membrane regions of subunit c of the Escherichia coli F1Fo ATPsynthase. J Biol Chem 284: 23243–23250
Stock D, Leslie AG, Walker JE (1999) Molecular architecture of therotary motor in ATP synthase. Science 286: 1700–1705
Turina P, Samoray D, Graber P (2003) H+/ATP ratio of protontransport-coupled ATP synthesis and hydrolysis catalysed byCFoF1-liposomes. EMBO J 22: 418–426
Ueno H, Suzuki T, Kinosita K, Yoshida M (2005) ATP-drivenstepwise rotation of FoF1,-ATP synthase. Proc Natl Acad Sci USA102: 1333–1338
Vik SB, Cain BD, Chun KT, Simoni RD (1988) Mutagenesisof the alpha subunit of the F1Fo-ATPase from Escherichia coli.Mutations at Glu-196, Pro-190, and Ser-199. J Biol Chem 263:6599–6605
Vollmar M, Schlieper D, Winn M, Buchner C, Groth G (2009)Structure of the c14 rotor ring of the proton translocatingchloroplast ATP synthase. J Biol Chem 284: 18228–18235
Weber J, Senior AE (1997) Catalytic mechanism of F1-ATPase.Biochim Biophys Acta 1319: 19–58
Wiedenmann A, Dimroth P, von Ballmoos C (2008) Deltapsi andDeltapH are equivalent driving forces for proton transportthrough isolated Fo complexes of ATP synthases. BiochimBiophys Acta 1777: 1301–1310
Yasuda R, Noji H, Kinosita Jr K, Yoshida M (1998) F1-ATPase is ahighly efficient molecular motor that rotates with discrete 120degree steps. Cell 93: 1117–1124
Yasuda R, Noji H, Yoshida M, Kinosita K, Itoh H (2001) Resolution ofdistinct rotational substeps by submillisecond kinetic analysis ofF1-ATPase. Nature 410: 898–904
York J, Spetzler D, Hornung T, Ishmukhametov R, Martin J,Frasch WD (2007) Abundance of Escherichia coli F1-ATPasemolecules observed to rotate via single-molecule microscopywith gold nanorod probes. J Bioenerg Biomembr 39: 435–439
Zhang D, Vik SB (2003a) Close proximity of a cytoplasmic loop ofsubunit a with c subunits of the ATP synthase from Escherichiacoli. J Biol Chem 278: 12319–12324
Zhang D, Vik SB (2003b) Helix packing in subunit a of theEscherichia coli ATP synthase as determined by chemical labelingand proteolysis of the cysteine-substituted protein. Biochemistry42: 331–337
FoF1-ATP synthase subunit a–c substepR Ishmukhametov et al
&2010 European Molecular Biology Organization The EMBO Journal VOL 29 | NO 23 | 2010 3923