Embed Size (px)
Citation preview

Direction of Change in Consumers’Use of Information and Lifestyles—Suggestions based on a three-country survey in Japan,
the U.S. and China (Volume 2)—
Hiroyuki NITTO, Ikko SOGA, Sonia SUSANTO and Shiraki KATOKU
No. 209 July 1, 2016

1Copyright 2016 by Nomura Research Institute, Ltd.
Direction of Change in Consumers’Use of Information and Lifestyles
—Suggestions based on a three-country survey in Japan,
the U.S. and China (Volume 2)—
Hiroyuki NITTO, Ikko SOGA, Sonia SUSANTO and Shiraki KATOKU
I ICTUseandAttitudestowardProgressofInternetSociety
II InformationUseandConsumptionBehavior
III LeisureActivitiesandLifestyles
IV SummaryofSurveyResultsandFutureOutlook
A merican consumers make the most of new Internet-based services. In terms of spending
consciousness, they tend to divide purchases into two groups – price-sensitive purchases vs.
preference-oriented, quality-focused purchases. Other distinctive tendencies include placing high
priority on one’s personality and lifestyle and emphasizing experiences over tangible goods. The
new generation known as “millennials,” which is drawing increased attention in the U.S., is the
country’s first “always connected” generation. At the same time, they prefer to live in urban areas,
where no need for cars and “walkability” are the key factors in deciding where to live.
In China, even though the overall rate of Internet use is still low, given the rapid spread of smart-
phones, some early adopters are extremely active in taking advantage of Internet-based services.
Nevertheless the sharply increasing number of cybercrimes and inferior quality of products/ser-
vices are causing consumers to have high degrees of interest in safety and security.
While the percentage of individuals using the Internet is over 80 percent in Japan, about the
same as in the U.S., Japanese consumers tend to use the Internet only as a tool for communication
such as sending/receiving email and exchanging messages. Another notable tendency is that they
have a strong concern over privacy leakage and new types of cybercrimes.
Japanese consumers are sensitive to information affecting their buying decisions, and actively
gather information before making purchases. Nevertheless, they seem to be unable to use the in-
formation sufficiently and skillfully. Even among young people, there is a low level of awareness
regarding the Internet as a tool for social participation and social change, albeit their active use of
SNS. In the future, it is expected that new innovation will happen at a consumer level that is
driven by increased opportunities to engage in new things actively such as innovative ICT-based
products and services.
NRI Papers No. 209July 1, 2016

2
Direction of Change in Consumers’ Use of Information and Lifestyles
Copyright 2016 by Nomura Research Institute, Ltd.
NRI Papers No. 209 July 1, 2016
Based on our hypothesis that having a proper under-standing of value orientations and culture models that give rise to the characteristics of the Japanese consumer market in comparison with those in other countries would serve as a “foundation” in any attempt to consider the future of the Japanese market, Nomura Research In-stitute (NRI) conducted online surveys in Japan, the U.S. and China to compare consumers’ value orienta-tions, lifestyles and consumption trends among the three countries. Following NRI Papers No. 208 Note 1, this pa-per reports the results of these surveys with a focus on information use, consumer value and lifestyle.
Most data used in this paper were derived from the “Online Consumer Survey in Japan, the U.S. and China” conducted by NRI in August 2014 Note 2.
In this chapter, a comparison is made among the three countries in terms of the use of ICT (information and communications technology) and attitudes toward Inter-net society.
1 ICT penetration in Japan, the U.S. and China
Based on the statistics provided by the International Telecommunication Union (ITU), the percentages of in-dividuals using the Internet in the three countries in 2013 were compared. The results revealed that while the percentages in Japan (86.3 percent) and the U.S. (84.2 percent) stood at almost the same level, the percentage in China was 45.8 percent even though the percentage nearly doubled as compared to five years ago.
The proportion of Internet users in Japan and the U.S. was less than 50 percent around the year 2000. Subse-quently, the use of the Internet gained momentum and the proportion steadily increased to nearly 90 percent in 2013 (Figure 1). In Japan and the U.S., broadband and mobile-cellular telephone penetration increased by al-most the same percentages as those of Internet use.
On the other hand, in China, the uptake of mobile-cel-lular telephones has been growing at a fast pace, and the proportion of subscribers reached 88.7 percent in 2013. According to Google’s Our Mobile Planet data, smart-phone penetration in 2013 was 24.7 percent in Japan, 56.4 percent in the U.S. and 46.9 percent in China. These data indicate that more and more Chinese people access the Internet mostly through mobile communications and smartphones, rather than through fixed lines Note 3.
Please note that because this three-country survey conducted by NRI in August 2014 was an online survey, survey subjects in China were those who use the Internet and have a new sense of value. For example, our survey revealed that a larger proportion (41.0 percent) of Chi-nese respondents use PC-based Internet to purchase
I ICT Use and Attitudes toward Progress of Internet Society
Percentage of individuals using the Internet
Broadband subscribers per 100 population
Mobile-cellular telephone subscribers per 100 population
0
10
20
30
40
50
60
70
80
90
100
0
10
20
30
40
50
0
20
40
60
80
100
120
2000 01 02 03 04 05 06 07 08 09 10 11 12 13
2000 01 02 03 04 05 06 07 08 09 10 11 12 13
2000 01 02 03 04 05 06 07 08 09 10 11 12 13
(%)
(Persons)
(Persons)
(Year)
(Year)
(Year)
U.S.
U.S.
U.S.
Japan
Japan
Japan
China
China
China
Figure 1. ICT penetration in Japan, the U.S. and China
Source: Compiled based on ITU’s “ICT Indicators Database.”

3
Direction of Change in Consumers’ Use of Information and Lifestyles
Copyright 2016 by Nomura Research Institute, Ltd.
NRI Papers No. 209 July 1, 2016
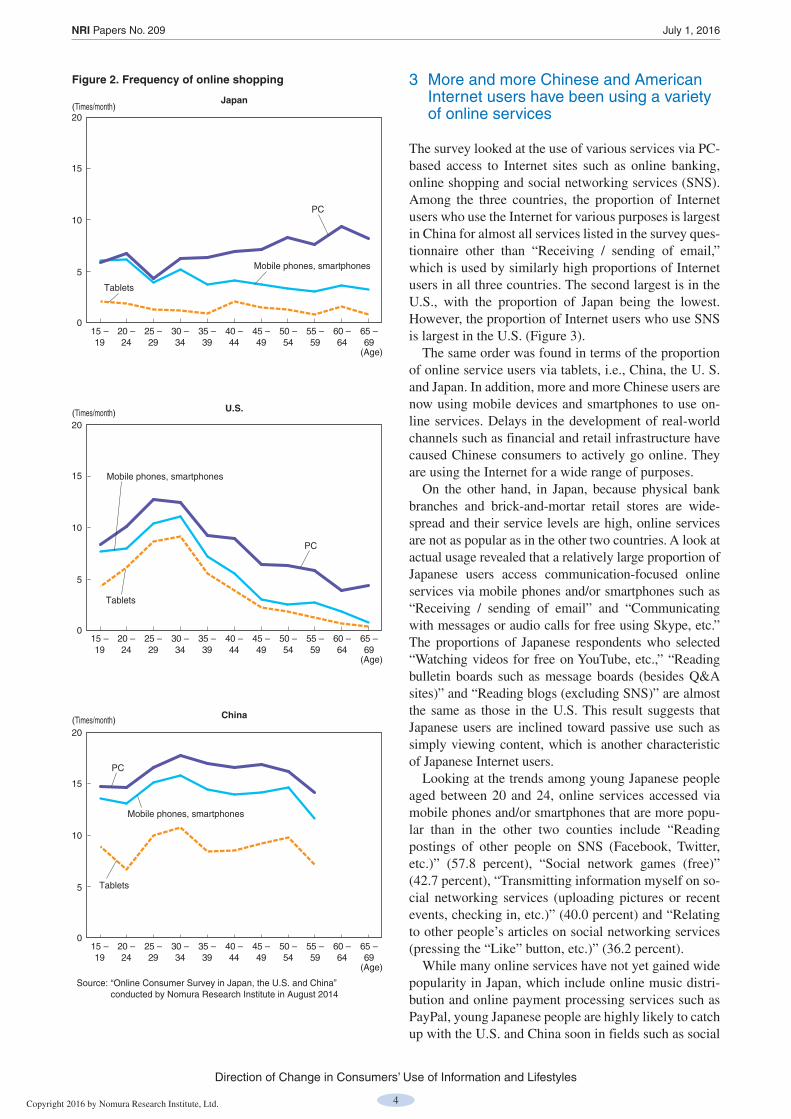
– 34 who are classified as millennials make purchases online most often (Figure 2).
(2)CharacteristicsofChineseyoung(post-80sandpost-90s)generations
In China, young people known as the “post-80s” and “post-90s” generations have been drawing attention. The term “post-80s” refers to people born in the 1980s just after the introduction of the one-child policy in 1979 under the leadership of Deng Xiaoping who advocated reform and open door policies. They are considered as a new generation of Chinese consumers who have a to-tally different sense of values from their parents and who are the driving force of a market economy. The post-80s are China’s first one-child policy generation. Because they had no siblings, they were the center of attention in the family and were spoiled by their parents and grandparents. These pampered singletons were giv-en the nickname “little emperors” because of their selfishness.
The post-90s generation is alleged to be even more self-assertive than the post-80s generation with a sense of freedom and a new sense of values. They are a digital generation and have been surfing the Internet and using mobile phones since they were in childhood. According to a survey conducted by the China Internet Network Information Center (CNNIC), by the end of June 2014, Internet users aged between 20 and 29 had accounted for 30.7 percent of all users, which was the largest pro-portion of the total, with those aged between 10 and 19 amounting to 24.5 percent and those aged between 30 and 39 occupying 23.4 percent. These age groups are classified as either post-80s or post-90s Note 4. CNNIC’s survey on online shopping revealed that the post-90s have a particularly stronger inclination to go online via mobile devices rather than PCs Note 5.
products “almost every day” in comparison to 18.8 per-cent in Japan and 21.4 percent in the U.S.
2 Characteristics of ICT use by generation
(1)Characteristicsof“millennials,”anewgenerationintheU.S.
In Japan, in the early stages of Internet use, most Inter-net users were primarily early adopters and younger consumers. Subsequently, as the number of Internet us-ers has increased, consumers in the middle and upper age brackets have also started to use the Internet. How-ever, because the penetration of smartphone use among these middle-aged and older consumers is still low, they mostly use their PCs to access the Internet. In contrast, younger consumers frequently use mobile devices and smartphones to connect to the Internet.
Then, what is the situation in the U.S.? Currently, people who were born between the early 1980s and the early 2000s, known as “millennials,” have been gaining attention. They are the first generation who started to use smartphones in their teens and grew up with the In-ternet. Around the time of entering the workforce, they experienced the economic recession triggered by the collapse of Lehman Brothers in 2008. This experience has given them a different set of consumer behaviors from those of previous generations such as Generation X, anyone born between 1965 and 1980 (Table 1).
For millennials, living an “always on” digital life is the natural order of things. They are active in accessing social media. They place greater emphasis on the achievement of personal desire and personal fulfillment. At the same time, they value staying connected with community, frequently participate in volunteer activities and have a strong sense of social responsibility.
The comparison of the online shopping frequency by age group in the U.S. revealed that consumers aged 25
Table 1. Characteristics of four U.S. generations
GenerationItem
Traditionalists(Born 1925 – 1945)
Baby boomers(Born 1946 – 1964)
Generation X(Born 1965 – 1980)
Millennials(Born 1981 – 2006)
Value • Family and community• Loyalty
• Success• Equal opportunity
• Time• Education
• Individuality and diversity• Technology
Motivator • Self-worth • Money • Security • Personal fulfillment
Attitude toward work • Dedicated and take on re-sponsibilities
• Job security is important and many men prioritized work (since it was not common for women in the labor force)
• Driven, and very hard-working
• Great focus on improving imbalance between work and life.
• Focus on productivity• Self-reliant and seek work-
life balance and flexibility in terms of place and time of work
• Began adopting new tech-nology (ICT)
• Experience a variety of work
• Everything – work, family, friends and self-develop-ment – is important
• Staying connected is key
Family structure • Traditional nuclear family structure
• Traditional nuclear family structure
• But divorce became com-mon
• Because women began to work outside more often, is known as the first “day care” generation
• Dual income families• Higher dependency on
other family members but more time is spent on per-sonal achievement
Sources: Compiled based on material published by United Nations, West Midland Family Center (WMFC) and others.
4
Direction of Change in Consumers’ Use of Information and Lifestyles
Copyright 2016 by Nomura Research Institute, Ltd.
NRI Papers No. 209 July 1, 2016
3 More and more Chinese and American Internet users have been using a variety of online services
The survey looked at the use of various services via PC-based access to Internet sites such as online banking, online shopping and social networking services (SNS). Among the three countries, the proportion of Internet users who use the Internet for various purposes is largest in China for almost all services listed in the survey ques-tionnaire other than “Receiving / sending of email,” which is used by similarly high proportions of Internet users in all three countries. The second largest is in the U.S., with the proportion of Japan being the lowest. However, the proportion of Internet users who use SNS is largest in the U.S. (Figure 3).
The same order was found in terms of the proportion of online service users via tablets, i.e., China, the U. S. and Japan. In addition, more and more Chinese users are now using mobile devices and smartphones to use on-line services. Delays in the development of real-world channels such as financial and retail infrastructure have caused Chinese consumers to actively go online. They are using the Internet for a wide range of purposes.
On the other hand, in Japan, because physical bank branches and brick-and-mortar retail stores are wide-spread and their service levels are high, online services are not as popular as in the other two countries. A look at actual usage revealed that a relatively large proportion of Japanese users access communication-focused online services via mobile phones and/or smartphones such as “Receiving / sending of email” and “Communicating with messages or audio calls for free using Skype, etc.” The proportions of Japanese respondents who selected “Watching videos for free on YouTube, etc.,” “Reading bulletin boards such as message boards (besides Q&A sites)” and “Reading blogs (excluding SNS)” are almost the same as those in the U.S. This result suggests that Japanese users are inclined toward passive use such as simply viewing content, which is another characteristic of Japanese Internet users.
Looking at the trends among young Japanese people aged between 20 and 24, online services accessed via mobile phones and/or smartphones that are more popu-lar than in the other two counties include “Reading postings of other people on SNS (Facebook, Twitter, etc.)” (57.8 percent), “Social network games (free)” (42.7 percent), “Transmitting information myself on so-cial networking services (uploading pictures or recent events, checking in, etc.)” (40.0 percent) and “Relating to other people’s articles on social networking services (pressing the “Like” button, etc.)” (36.2 percent).
While many online services have not yet gained wide popularity in Japan, which include online music distri-bution and online payment processing services such as PayPal, young Japanese people are highly likely to catch up with the U.S. and China soon in fields such as social
15 –19
20 –24
25 –29
30 –34
35 –39
40 –44
45 –49
50 –54
55 –59
60 –64
65 –69
15 –19
20 –24
25 –29
30 –34
35 –39
40 –44
45 –49
50 –54
55 –59
60 –64
65 –69
15 –19
20 –24
25 –29
30 –34
35 –39
40 –44
45 –49
50 –54
55 –59
60 –64
65 –69
0
20
15
10
5
15
10
5
0
20
0
20
15
10
5
Japan
U.S.
China
(Times/month)
(Age)
(Age)
(Age)
(Times/month)
(Times/month)
PC
PC
PC
Mobile phones, smartphones
Mobile phones, smartphones
Mobile phones, smartphones
Tablets
Tablets
Tablets
Figure 2. Frequency of online shopping
Source: “Online Consumer Survey in Japan, the U.S. and China” conducted by Nomura Research Institute in August 2014

5
Direction of Change in Consumers’ Use of Information and Lifestyles
Copyright 2016 by Nomura Research Institute, Ltd.
NRI Papers No. 209 July 1, 2016
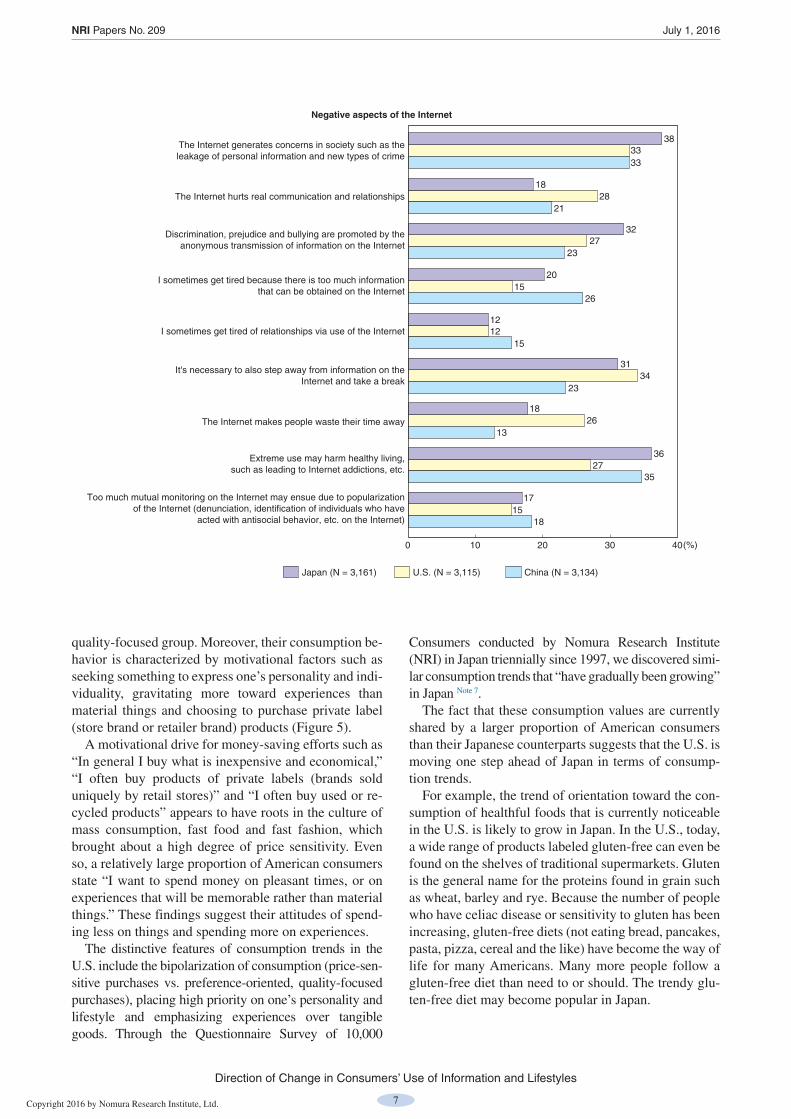
This tendency was evidenced by a smaller proportion of Japanese respondents selecting items such as “The In-ternet creates new encounters and opportunities,” “The Internet promotes the social participation of vulnerable people and minorities making society a fairer place” and “It’s fun presenting my work and thoughts on the Inter-net.”
In terms of the negative aspects of the Internet, com-pared to their American and Chinese counterparts, a larger proportion of Japanese respondents select items such as “The Internet generates concerns in society such as the leakage of personal information and new types of crime” and “Discrimination, prejudice and bullying are promoted by the anonymous transmission of informa-tion on the Internet.” These findings indicate that Japanese users are generally more cautious about the drawbacks of Internet use.
Looking at the characteristics of Japanese users by age group, a larger proportion of younger users agree to “The Internet creates new encounters and opportunities” and “It’s fun presenting my work and thoughts on the
network games and use of SNSs.4 Japanese Internet users are most
cautious regarding the progress of Internet society
The survey revealed that a smaller proportion of Japa-nese Internet users appreciate the advantages of the Internet such as it being a new tool for communication. They have a strong tendency to be concerned about its disadvantages such as privacy leakage and Internet ad-diction (Figure 4).
In terms of the positive aspects of the Internet, a great-er proportion of Japanese users appreciate the convenience offered by the Internet than do their Ameri-can and Chinese counterparts as suggested by many Japanese respondents selecting items such as “The In-ternet provides convenience / comfort to my life” and “I can’t think of life without the Internet.” On the other hand, as compared to the U.S. and China, Japanese users generally think little of the Internet as a tool for social involvement and social change.
0
20
40
60
80
100
Japan (N = 3,161)
U.S. (N = 3,115)China (N = 3,134)
(%)
Balance m
anagement, receiving and conducting transfers,
payments using settlem
ent services such as PayP
al
Watching m
ovies, TV
programs, etc. using fee-based video
streaming services
Reading bulletin boards such as m
essage boards (besides Q
&A
sites)
Paym
ent of shopping or transportation fares using a mobile
payment system
Transm
itting information m
yself on social networking services
(uploading pictures or recent events, checking in, etc.)R
elating to other people's articles on social networking services
(pressing the “Like” button, etc.)R
eading postings of other people on social networking services
(Facebook, T
witter, etc.)
Com
municating w
ith messages or audio calls for free using
Skype, etc.
Receiving / sending of em
ail
Online banking / balance inquiries of bank accounts
Online shopping (other than online superm
arkets)
Online superm
arkets
Watching videos for free on Y
ouTube, etc.
Selling and buying of products via online auctions
Online storage services for files such as m
y pictures and videos
Posting questions or asking for advice on Q
&A
sites
Writing on m
essage boards (besides Q&
A sites)
Electronic new
spapers / magazines / books subscriptions
Social netw
ork games (free)
Social netw
ork games (not free)
View
ing product review sites
Writing on product review
sites
None of the above; don’t have such devices
Online hospital m
edical examinations
Making hospital appointm
ents
Ordering m
eal deliveries
Reserving taxis or tables at restaurants
Music distribution service (subscription type)
Music distribution service (dow
nload type)
Maps that show
where I am
Updating m
y website
Reading blogs (excluding social netw
orking services)
Writing blogs (excluding social netw
orking services)
Online trading such as stocks / F
X (foreign exchange)
Figure 3. PC-based use of online services (multiple answers allowed)
Note: Please note that because this survey was conducted online, survey subjects are Internet users.Source: “Online Consumer Survey in Japan, the U.S. and China” conducted by Nomura Research Institute in August 2014

6
Direction of Change in Consumers’ Use of Information and Lifestyles
Copyright 2016 by Nomura Research Institute, Ltd.
NRI Papers No. 209 July 1, 2016
Internet.” As such, young people are likely to be active in driving Internet usage in the future. On the other hand, there was little difference among age groups in terms of the tendency to be cautious about the negative effects of the Internet such as “The Internet generates concerns in society such as the leakage of personal information and new types of crime” and “Discrimination, prejudice and bullying are promoted by the anonymous transmission of information on the Internet.” In particular, it should be noted that the proportion of persons worrying about such disadvantages is higher among women over a wide range of age groups (in their teens to thirties).
In China, cybercrime has become a serious problem. According to a report of the People’s Public Security University of China, the number of people arrested by public security agencies for cybercrimes has sharply in-creased in recent years. At the same time, various types of cybercrimes have been appearing such as online fraud, sale of personal information, online gambling, sale of counterfeit goods and drug trafficking. The re-search also indicates an increasing trend of cybercrimes committed by younger age groups Note 6.
In the U.S., as explained in Chapter II, the survey re-sults revealed that the trend of information fatigue
caused by the presence of too much information on products and services is less conspicuous among American respondents. Nevertheless, a larger proportion of Ameri-can respondents agree to the items “It’s necessary to also step away from information on the Internet and take a break.” “Digital detox” services and products, which limit the use of digital devices and facilitate real human interactions, are starting to grow in the U.S.
II Information Use andConsumption Behavior
1 Features of consumption values in each of the three countries
(1)TheU.S.isleadingJapaninthatconsumptionvaluesheldbymanyAmericanconsumersarelikelytobecomepopularamongJapaneseconsumersinthefuture
A notable trend of consumption among American con-sumers is that they tend to divide products/services to be purchased into two groups, that is, one is a price-sensi-tive group and the other is a preference-oriented,
0 0 10 20 30 40
The Internet generates concerns in society such as theleakage of personal information and new types of crime
The Internet hurts real communication and relationships
Discrimination, prejudice and bullying are promoted by theanonymous transmission of information on the Internet
I sometimes get tired because there is too much informationthat can be obtained on the Internet
I sometimes get tired of relationships via use of the Internet
It's necessary to also step away from information on theInternet and take a break
The Internet makes people waste their time away
Extreme use may harm healthy living,such as leading to Internet addictions, etc.
Too much mutual monitoring on the Internet may ensue due to popularizationof the Internet (denunciation, identification of individuals who have
acted with antisocial behavior, etc. on the Internet)
The Internet provides convenience / comfort to my life
The Internet promotes communication between people
The Internet promotes the social participation of vulnerable people andminorities making society a fairer place
I can't think of life without the Internet
The Internet creates new encounters and opportunities
It's fun presenting my work and thoughts on the Internet
It's fun viewing the work and thoughts of others on the Internet
The Internet is a cost-effective way to kill time
I want to enjoy an Internet life that has furtherdeveloped with wearable devices, etc.
10 20 30 40 50 60
57
21
9
40
18
12
30
29
5
47
43
18
33
39
19
33
34
13
50
38
27
34
38
33
34
34
24
38
18
32
20
12
31
18
36
17
33
28
27
15
12
34
26
27
15
33
21
23
26
15
23
13
35
18
Japan (N = 3,161) U.S. (N = 3,115) China (N = 3,134) Japan (N = 3,161) U.S. (N = 3,115) China (N = 3,134)
Positive aspects of the Internet Negative aspects of the Internet
(%) (%)
Figure 4. Views on advantages and disadvantages of the Internet (multiple answers allowed; items with large differences in proportion among Japan, the U.S. and China were extracted)
Source: “Online Consumer Survey in Japan, the U.S. and China” conducted by Nomura Research Institute in August 2014
7
Direction of Change in Consumers’ Use of Information and Lifestyles
Copyright 2016 by Nomura Research Institute, Ltd.
NRI Papers No. 209 July 1, 2016
Consumers conducted by Nomura Research Institute (NRI) in Japan triennially since 1997, we discovered simi-lar consumption trends that “have gradually been growing” in Japan Note 7.
The fact that these consumption values are currently shared by a larger proportion of American consumers than their Japanese counterparts suggests that the U.S. is moving one step ahead of Japan in terms of consump-tion trends.
For example, the trend of orientation toward the con-sumption of healthful foods that is currently noticeable in the U.S. is likely to grow in Japan. In the U.S., today, a wide range of products labeled gluten-free can even be found on the shelves of traditional supermarkets. Gluten is the general name for the proteins found in grain such as wheat, barley and rye. Because the number of people who have celiac disease or sensitivity to gluten has been increasing, gluten-free diets (not eating bread, pancakes, pasta, pizza, cereal and the like) have become the way of life for many Americans. Many more people follow a gluten-free diet than need to or should. The trendy glu-ten-free diet may become popular in Japan.
quality-focused group. Moreover, their consumption be-havior is characterized by motivational factors such as seeking something to express one’s personality and indi-viduality, gravitating more toward experiences than material things and choosing to purchase private label (store brand or retailer brand) products (Figure 5).
A motivational drive for money-saving efforts such as “In general I buy what is inexpensive and economical,” “I often buy products of private labels (brands sold uniquely by retail stores)” and “I often buy used or re-cycled products” appears to have roots in the culture of mass consumption, fast food and fast fashion, which brought about a high degree of price sensitivity. Even so, a relatively large proportion of American consumers state “I want to spend money on pleasant times, or on experiences that will be memorable rather than material things.” These findings suggest their attitudes of spend-ing less on things and spending more on experiences.
The distinctive features of consumption trends in the U.S. include the bipolarization of consumption (price-sen-sitive purchases vs. preference-oriented, quality-focused purchases), placing high priority on one’s personality and lifestyle and emphasizing experiences over tangible goods. Through the Questionnaire Survey of 10,000
0 0 10 20 30 40
The Internet generates concerns in society such as theleakage of personal information and new types of crime
The Internet hurts real communication and relationships
Discrimination, prejudice and bullying are promoted by theanonymous transmission of information on the Internet
I sometimes get tired because there is too much informationthat can be obtained on the Internet
I sometimes get tired of relationships via use of the Internet
It's necessary to also step away from information on theInternet and take a break
The Internet makes people waste their time away
Extreme use may harm healthy living,such as leading to Internet addictions, etc.
Too much mutual monitoring on the Internet may ensue due to popularizationof the Internet (denunciation, identification of individuals who have
acted with antisocial behavior, etc. on the Internet)
The Internet provides convenience / comfort to my life
The Internet promotes communication between people
The Internet promotes the social participation of vulnerable people andminorities making society a fairer place
I can't think of life without the Internet
The Internet creates new encounters and opportunities
It's fun presenting my work and thoughts on the Internet
It's fun viewing the work and thoughts of others on the Internet
The Internet is a cost-effective way to kill time
I want to enjoy an Internet life that has furtherdeveloped with wearable devices, etc.
10 20 30 40 50 60
57
21
9
40
18
12
30
29
5
47
43
18
33
39
19
33
34
13
50
38
27
34
38
33
34
34
24
38
18
32
20
12
31
18
36
17
33
28
27
15
12
34
26
27
15
33
21
23
26
15
23
13
35
18
Japan (N = 3,161) U.S. (N = 3,115) China (N = 3,134) Japan (N = 3,161) U.S. (N = 3,115) China (N = 3,134)
Positive aspects of the Internet Negative aspects of the Internet
(%) (%)
Figure 4. Views on advantages and disadvantages of the Internet (multiple answers allowed; items with large differences in proportion among Japan, the U.S. and China were extracted)
Source: “Online Consumer Survey in Japan, the U.S. and China” conducted by Nomura Research Institute in August 2014

8
Direction of Change in Consumers’ Use of Information and Lifestyles
Copyright 2016 by Nomura Research Institute, Ltd.
NRI Papers No. 209 July 1, 2016
40
35
30
25
20
15
10
5
0Japan (N = 3,161)
Japan (N = 3,161)
U.S. (N = 3,115)U.S. (N = 3,115)
China (N = 3,134)
China (N = 3,134)
Japan (N = 3,161) Japan (N = 3,161)
U.S. (N = 3,115)
U.S. (N = 3,115)
China (N = 3,134) China (N = 3,134)
Added value for which I’m willing to pay Money saving/consumption restriction
40
35
30
25
20
15
10
5
0
40
35
30
25
20
15
10
5
0
Important factors when selecting a productOthers (environmental friendliness, social contribution,
rewards point programs, etc.)
40
35
30
25
20
15
10
5
0
(%)(%)
(%)(%)
I buy what is high quality even if it's a little m
ore expensive
If it's a product of a well-know
n brand or m
anufacturer, it's okay if it's a little more expensive
I buy products of well-know
n manufacturers
rather than of unheard-of manufacturers
I buy what is convenient even if it's a little m
ore expensive
There is a brand that I alw
ays buy
If it's something I really like, I w
ill buy it by saving up m
oney even if it's expensive
It's better when there is full after-sales service
even if it's a little more expensive
In general I buy what is inexpensive and
economical
I choose casual and simple product designs
I often buy used or recycled products
I want to spend m
oney on pleasant times, or on experiences
that will be m
emorable rather than m
aterial things
I often buy products of private labels (brands sold uniquely by retail stores)
I want to know
the opinions of those who
actually use it
I buy products after gathering all sorts of inform
ation first
I pick products by comparing them
at the stores as well
as making use of a m
obile phone / smartphone
I often choose things that people around me
say are good
I buy after really considering if the price is com
mensurate w
ith the quality
I tend to give advice to other people or share inform
ation on products and stores
I choose products that match m
y lifestyle
I buy products, even TV
s and computers, etc.
by placing importance on color and design
I choose products that use natural raw
materials as m
uch as possible
I buy products that are beneficial for environm
ental protection or social contribution
I buy products upon considering safety
I sometim
es choose stores to shop at depending on w
hether I can get loyalty points for the purchases
I sometim
es choose products / services depending on w
hether I can get loyalty points for it
I often buy disposable products
I buy what can be used as long as possible
I give priority to and buy domestic products
rather than foreign products
I feel guilty when I buy things that I ultim
ately find to not like, or things that w
ere not that necessary
Figure 5. Comparison of consumption values
Note: Proportions indicated in the above line graphs are the total of “agree” and “somewhat agree” responsesSource: “Online Consumer Survey in Japan, the U.S. and China” conducted by Nomura Research Institute in August 2014

9
Direction of Change in Consumers’ Use of Information and Lifestyles
Copyright 2016 by Nomura Research Institute, Ltd.
NRI Papers No. 209 July 1, 2016
2 Collection/use of information has a great influence on consumer behavior
(1)ImpactofmediaonconsumptioninJapanlargelydiffersbyage
Regarding a channel used to collect information when choosing a product or service, the proportion of respon-dents who get information from TV commercials still remains large in all three countries. In particular, this trend is noticeable in Japan. In China, the proportion of respondents who get information from websites is larger than those who rely on TV commercials; in the U.S., the opposite is the case. The proportion of respondents who see a product first hand on the shelves of stores and get information from displays is similarly high in all three countries.
If information gathering behavior is seen by age group, in Japan, the survey found that somewhat higher proportions of older respondents get information from TV commercials, whereas higher proportions of young-er respondents rely on product review websites, blogs and SNS. In the U.S. and China, there is little variation across age groups in the trends of getting information from TV commercials and relying on product review websites, blogs and SNS (Figure 6).
As to the proportion of respondents who get informa-tion from newspaper articles, the percentage of younger respondents is low in all three countries, indicating no-table age differences.
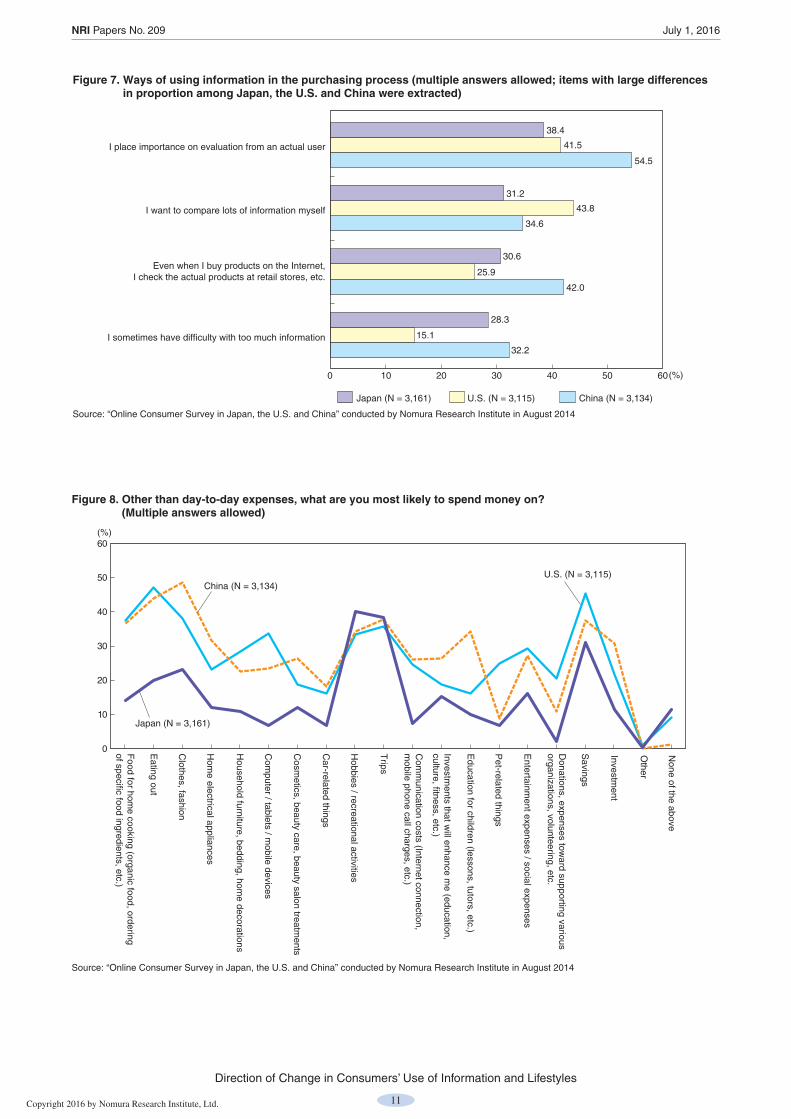
(2)Attitudestowarduseofinformationinthepurchasingprocess
The survey examined attitudes toward use of informa-tion in the process of purchasing a product or service. The proportion of respondents who place emphasis on the opinions of people who are actually using the prod-uct/service to be purchased is high in all three countries. In particular, the proportion of Chinese respondents se-lecting this item is the highest at 54.5 percent. About 30 percent of Japanese and Chinese respondents experi-ence stress from too much information and require information that is tailored to meet their needs. In con-trast, about 43.8 percent of American respondents “I want to compare lots of information myself” (Figure 7).
To the question of “Which source of information do you use in order to compare different products / services before making a purchase: retail stores or the Internet?,” Chinese respondents show a strong tendency toward us-ing both, whereas American respondents have a greater tendency to use only one of them than do their Japanese and Chinese counterparts.
The benefits that physical retail stores offer as an in-formation source include “That I can judge it with my five senses: actually look at the product, touch it, smell it, hear it, etc.” The tendency to rely on five senses is particularly noticeable among Japanese respondents. Larger proportions of Chinese respondents select the
(2)Chineseconsumersarehighlybrandconsciousandhaveastronginterestinqualityandsafety
In China, generally, consumers are highly motivated to consume, revealing consumer attitudes that are similar to those seen during the period of Japan’s bubble econo-my. Notable trends include being highly brand conscious, paying attention to what other people think/say and pur-suing the latest trends.
In addition, an increasing number of younger Chinese consumers are now purchasing cars (expensive durable products). A survey indicated that the proportion of post-80s consumers who purchased cars, which was 18.0 percent in 2009, increased to 29.7 percent in 2012 Note 8. The reasons behind this increase seem to include that many Chinese women consider car ownership a prereq-uisite for marriage, needs for using a car for commuting and leisure have been increasing and automobile loans have become common. As such, Chinese post-80s con-sumers have become a major force driving consumption.
With respect to consumption attitudes that place im-portance on natural and organic materials as well as on environmental protection and social contribution, a far greater number of Chinese respondents have such atti-tudes than do their Japanese and American counterparts. A significantly high proportion of Chinese respondents agree with “I buy products upon considering safety.” In China, where consumers have serious concerns about quality and safety, high quality and safety are the values that they are willing to pay more for.
(3)Japaneseconsumersarelesswillingtobuy/usenewproducts/services
One of the features of Japanese consumers is that they are less motivated to buy/use new products/services ahead of other people. The proportion of respondents who agree with “I tend to use new products and servic-es, and go to new stores before other people” is 19.1 percent in the U.S. and 23.3 percent in China. Compared to these proportions of around 20 percent, the percent-age is considerably lower in Japan at 6.3 percent. If this trend is examined by age group, in Japan, the proportion is somewhat higher among consumers in their teens, but, overall, the proportion is low. In the U.S., the pro-portion is high among people in their 20s and 30s; in China, the proportion is high across all age groups.
As such, compared to the U.S. and China, Japan’s ten-dency is a smaller number of early adopters who rush out to buy new products/services. Nevertheless, Japanese consumers are strongly inclined to gather information from a wide variety of sources and carefully check to see whether the quality merits the price before buying. An-other feature of Japanese consumers is a very strong tendency to check to see whether rewards points are of-fered when choosing a store, product and/or service.

10
Direction of Change in Consumers’ Use of Information and Lifestyles
Copyright 2016 by Nomura Research Institute, Ltd.
NRI Papers No. 209 July 1, 2016
following benefits of physical retail stores: “That I can know intuitively whether I like it or not,” “That the salesperson will make recommendations and give me advice based on our dialogue,” “That I will find out what the trendy products are,” and “That I can choose prod-ucts based on the store’s atmosphere and aesthetics.”
As to the benefits of the Internet as an information source, large proportions of respondents select “That I can obtain lots of information” and “That I can compare the specs and prices in a list” in all three countries. In particular, noticeably high proportions of Japanese and Chinese respondents select “That I can refer to user word-of-mouth evaluations.”
In summary, Chinese respondents place relatively more emphasis on the Internet when gathering informa-tion to choose a product. This tendency appears to be associated with the consumption attitudes explained in Item (2), Section 1. Specifically, because Chinese con-sumers are strongly inclined toward staying abreast of the latest trends and keeping a close eye on prevailing consumption trends, they often use the Internet because they can access vast amounts of information with a high degree of browsability. In China, at physical retail stores as well, a large proportion of respondents give emphasis to gathering information on the products and services that are currently most popular.
Conversely, many American respondents place impor-tance on expressing one’s personality and individuality, and have a strong desire to compare diverse information on their own. Only a few experience stress from too much information. In addition, a relatively high propor-tion of American respondents expect to “use their five senses to choose a product” at a physical retail store. Actually, in the U.S., today, a greater emphasis is placed on customer experience in a brick-and-mortar store from the perspective of marketing strategy. Specifically, ef-forts are made to provide places/services that customers are unable to experience on the Internet.
III Leisure Activities and Lifestyles
1 Although Japanese consumers are willing to enjoy their hobbies and recreation, they are unable to achieve a healthy work-life balance
This chapter discusses the features of consumers in the three countries with regard to their leisure activities and lifestyles. Once day-to-day expenses have been covered, Japanese consumers are most likely to spend their mon-ey on “Hobbies / recreational activities” and “Trips.” While the proportion of Japanese respondents who se-lect these fields is as large as those of their American and Chinese counterparts, overall, they have relatively little interest in spending money on other fields (Figure 8).
15 –19
20 –24
25 –29
30 –34
35 –39
40 –44
45 –49
50 –54
55 –59
60 –64
65 –69
15 –19
20 –24
25 –29
30 –34
35 –39
40 –44
45 –49
50 –54
55 –59
60 –64
65 –69
Japan
China
0
10
20
30
40
50
60
0
10
20
30
40
50
60
(%)
(%)
(Age group)
15 –19
20 –24
25 –29
30 –34
35 –39
40 –44
45 –49
50 –54
55 –59
60 –64
65 –69
U.S.
0
10
20
30
40
50
60(%)
(Age group)
(Age group)
I refer to TV commercials
I read newspaper articles
I go to stores and look at the exhibited products, or refer to the displayed information
I examine user evaluations on review sites, blogs, and social networking sites on the Internet related to products, services and more
Figure 6. Major information sources used in the purchase decision-making process (multiple answers allowed)
Source: “Online Consumer Survey in Japan, the U.S. and China” conducted by Nomura Research Institute in August 2014
11
Direction of Change in Consumers’ Use of Information and Lifestyles
Copyright 2016 by Nomura Research Institute, Ltd.
NRI Papers No. 209 July 1, 2016
0 10 20 30 40 50 60
32.2
42.0
34.6
54.5
15.1
25.9
43.8
41.5
28.3
30.6
31.2
38.4
I sometimes have difficulty with too much information
Even when I buy products on the Internet,I check the actual products at retail stores, etc.
I want to compare lots of information myself
I place importance on evaluation from an actual user
Japan (N = 3,161) U.S. (N = 3,115) China (N = 3,134)
(%)
Figure 7. Ways of using information in the purchasing process (multiple answers allowed; items with large differences in proportion among Japan, the U.S. and China were extracted)
Source: “Online Consumer Survey in Japan, the U.S. and China” conducted by Nomura Research Institute in August 2014
60
50
40
30
20
10
0
Japan (N = 3,161)
U.S. (N = 3,115)China (N = 3,134)
(%)
None of the above
Other
Investment
Savings
Donations, expenses tow
ard supporting various organizations, volunteering, etc.
Entertainm
ent expenses / social expenses
Pet-related things
Education for children (lessons, tutors, etc.)
Investments that w
ill enhance me (education,
culture, fitness, etc.)
Com
munication costs (Internet connection,
mobile phone call charges, etc.)
Trips
Hobbies / recreational activities
Car-related things
Cosm
etics, beauty care, beauty salon treatments
Com
puter / tablets / mobile devices
Household furniture, bedding, hom
e decorations
Hom
e electrical appliances
Clothes, fashion
Eating out
Food for hom
e cooking (organic food, ordering of specific food ingredients, etc.)
Figure 8. Other than day-to-day expenses, what are you most likely to spend money on? (Multiple answers allowed)
Source: “Online Consumer Survey in Japan, the U.S. and China” conducted by Nomura Research Institute in August 2014

12
Direction of Change in Consumers’ Use of Information and Lifestyles
Copyright 2016 by Nomura Research Institute, Ltd.
NRI Papers No. 209 July 1, 2016
In China, in the same way as in the U.S., the propor-tions of respondents are relatively large with regard to spending money on various fields. Notably, the propor-tions of Chinese respondents are higher than are those of their Japanese and American counterparts in the fields of “Clothes, fashion,” “Investments that will enhance me (education, culture, fitness, etc.)” and “Education for children (lessons, tutors, etc.).”
In the U.S., the proportions of respondents are higher than are those of the Japanese and Chinese respondents in the fields of “Computer / tablets / mobile devices,” “Pet-related things,” “Donations, expenses toward sup-porting various organizations, volunteering, etc.” and “Savings.”
Regarding the hobbies and sports that people usually participate in on their days off and in their free time, Japanese consumers have almost no distinctive features other than the high proportion of respondents selecting “PCs and Internet,” which is basically the same as those of American and Chinese respondents. People in the U.S. actively pursue leisure activities such as “music ap-preciation,” “movie and theatrical performances,” “watching videos and DVDs” and “watching sports.” Meanwhile, in China, people actively pursue travel, with “domestic and overseas travel” being particularly popular pastimes.
From the viewpoint of achieving an ideal lifestyle, a larger proportion of respondents in all three countries se-lect the following three preferences: (1) live in suburban areas offering a combination of convenience and com-fort, (2) live in such a way so as to ensure a good work-life balance and (3) live a life that enables me to fully enjoy my hobbies. While these ideals are common among all three countries, the “gap” between the ideal and reality is largest in Japan and smallest in the U.S. Note 1. The reason for this gap can be attributed to frustration with the liv-ing environment and a lack of adequate leisure time in Japan.
While Japanese people are willing to spend their money on “Hobbies / recreational activities” and “Trips,” with the aim of attaining a good work-life balance and fully pursuing hobbies, the difference between the ideal and reality is considerable. If Japanese people were able to correct this situation and improve their work-life bal-ance by increasing the time they have available to enjoy their hobbies and enriching their leisure time, there is a possibility that consumption in Japan would be stimu-lated.
2 The possibility of new lifestyles in urban areas
In recent years, there have been several reports from the U.S. concerned with an increasing number of people moving away from the suburbs to live in urban areas. At the center of this trend are the “Millennials,” born be-tween 1980 and the early 2000s, who were introduced in
Chapter I. According to a survey conducted by the Rockefeller Foundation in 2014, 54 percent of millenni-als state that they would consider “moving to another city if it had more and better options for getting around.” One of the top criteria centers on high quality transpor-tation. Eighty-six (86) percent of millennials agree that it is important for their city to offer opportunities to live and work without relying on a car; 47 percent of them say that they would give up their cars if their city had robust public transportation Note 9.
Thus, there is a trend, particularly among young peo-ple including millennials, to abandon the suburban lifestyle featured by a car, pool, large dog and lawn, and opt instead for collective housing in urban areas that of-fers walkability (where residents can go almost anywhere on foot).
According to the results of a survey conducted in 2014 by the American Planning Association, 56 percent of millennials would prefer to live in a walkable com-munity (pedestrian-friendly community) Note 10. Table 1 in Chapter I compares the values of the four generations in the U.S. From the era of baby boomers, individuals have tended to emphasize being self-reliant and work-oriented, whereas the divorce rate has been gradually increasing. Families began transitioning away from once-typical nuclear family households. Today, millen-nials place much higher focus on personal fulfilment but also value staying connected with family and the com-munity around them.
In Japan, especially in urban areas and among young people, there is a trend toward “giving up owning a car.” It is very interesting to note that a similar trend can be observed in the U.S. Leading to this trend in the U.S. is the development of public transportation as well as the appearance of car-sharing services such as Zipcar and new types of taxi and hire services that help individuals move around such as Uber. Another factor behind this trend is a growing concern over environmental issues. Furthermore, millennials are extremely diverse with great interest in various activities. They prefer to live in mixed communities with a variety of family types in-cluding single-person households.
Many millennials are still living with their parents. When the time comes for them to create their own households, it is expected that many will seek a more settled suburban environment. To meet these needs, “ur-ban-burbs” (suburbs with the convenience of the city) has become a new keyword.
Two cases of the development of urban-burbs are in-troduced below.
Casestudy:JerseyCity(NewJersey,U.S.)Jersey City is an example of a new urban development, which is located across the Hudson River from Manhat-tan, New York. Despite its proximity to Manhattan, real estate costs are one-half to one-third of Manhattan’s. This has attracted companies such as Citigroup, Merrill

13
Direction of Change in Consumers’ Use of Information and Lifestyles
Copyright 2016 by Nomura Research Institute, Ltd.
NRI Papers No. 209 July 1, 2016
immigrants, there is strong resistance in the following situations: “myself or my family member such as my child or brother would marry an immigrant” (25.5 per-cent), followed by “an immigrant could hold a leadership role such as becoming a politician or assuming a top industry position” (22.0 percent). However, the propor-tions of respondents who select the following items are low: “I work or study together with immigrants/foreign-ers at work or school” (4.6 percent) and “I interact with foreign clerks at stores and other businesses” (6.2 per-cent). These findings suggest that resistance has become relatively weak in the scenes of daily life such as work, study and interaction with foreign clerks at stores and other businesses.
On the other hand, the proportion of Japanese respon-dents who agree to “in order for the country to grow, immigrants should be actively accepted” is considerably lower at 28.9 percent than in the U.S. (61.0 percent) and China (57.3 percent).
Thus, in Japan, day-to-day contact with foreigners and other countries is still limited, resulting in a lower degree of global awareness than that in the U.S. and China. Given that Japan’s economy has matured and has entered a shrinking period, any future growth in Japan will require the acceptance of overseas human resourc-es. Efforts must be made to raise public awareness regarding this necessity.
IV Summary of Survey Resultsand Future Outlook
1 Conservative Japanese consumers
The characteristics of Japanese, American and Chinese consumers have been identified. The characteristics of Japanese consumers are summarized below.
Regarding the use of ICT, the same level as that in the U.S. has been reached in terms of Internet use rate, broadband and mobile phone penetration rates. Never-theless, Japanese consumers are inclined towards using
Lynch and Goldman Sachs, and thousands of residents who cross the Hudson for work. In early 2014, Jersey City announced the construction of two new residential towers. Many older buildings are being revamped. Fu-ture development will focus on a more walkable scale with accessibility to shops and parks.
Casestudy:Portland(Oregon,U.S.)Portland is known as one of the pioneers in urban re-newal. The transit mall opened in 1988 and, until 2009, buses were the only transit vehicles using it, but in 2009, a light rail system was added. Currently, the “Central City 2035” project is under progress where roads and bridges making up a pedestrian/bicycle/transit-only loop, which will connect every district of the central city, are being developed (Figure 9). In parallel with this project, the state government has been promoting its “2040 Growth Concept” since the 1990s. Plans call for the development of a wide variety of housing, employ-ment and retail options in city centers, which are pedestrian oriented and well served by both roads and public transport. As a result of these efforts, Portland is being regenerated and is once again seeing growth with an increase in population.
3 Japan’s minimal daily interaction with foreigners and other countries
When Japanese respondents are asked about their con-tact with foreigners and other countries, the proportions of respondents who answer in the affirmative are low for all items listed. For example, 7.2 percent say that “they have family or relatives living overseas,” 10.9 percent state that “they have foreign friends” and 4.4 percent say that “they interact with foreign companies and people at work.” Meanwhile, 64.8 percent respond with “not ap-plicable” regarding their contact with foreigners and other countries, suggesting that basically two out of ev-ery three Japanese respondents have almost no contact with other countries in their day-to-day lives.
When a question is asked about the acceptance of
Central City 2035
• Roads and bridges making up a pedestrian/bicycle/transit-only loop, which will connect every district of the central city, are being developed
• Along with the above loop , development plans based on the characteristics of each district are under way ( indicates the district where research institutes and universities such as Portland State University are clustered; indicates the district developed primarily with high-rise housing; indicates the park envisioned along the Willamette River that runs through the city center; indicates the area being developed as “second downtown” and “eco-district;” indicates the areas being poised to become major corridors of growth)
Figure 9. Case study of urban planning in the U.S. (Portland)
Source: http://www.portlandmonthlymag.com/real-estate/articles/plotting-portlands-new-skyline-april-2014

14
Direction of Change in Consumers’ Use of Information and Lifestyles
Copyright 2016 by Nomura Research Institute, Ltd.
NRI Papers No. 209 July 1, 2016
the Internet as a tool for communication. They are not yet able to efficiently use new services such as music distribution and settlement services. Even if responses are limited to young people, there is a low level of awareness about the Internet as a tool for social partici-pation and social change, albeit their active usage of SNS.
With regard to consumption and leisure activities, Japanese consumers are weakly motivated to adopt new products and services ahead of others, exposing a con-servative tendency. While they actively gather information before making purchases, they sometimes suffer from fatigue caused by excessive information. As such, Japanese consumers are not yet able to sufficiently use ICT.
A look at the characteristics of American consumers reveals a tendency of moving ahead of Japan. For exam-ple, they make the most of new Internet-based services. At the same time, they tend to divide purchases into two groups – price-sensitive purchases vs. preference-orient-ed, quality-focused purchases. Other distinctive features include placing high priority on one’s personality and lifestyle and emphasizing experiences over tangible goods. These trends are notable in that they are moving one step ahead of Japanese consumers.
In China, even though the rate of Internet use overall is still low, given the rapid spread of smartphones, some early adopters are extremely active in taking advantage of online services. China has great potential to grow on-line services rapidly by taking steps different from those in Japan and the U.S., in which ever-increasing use of the Internet will boost further popularization of smart-phones without waiting for the spread of broadband networks. Meanwhile, a look at the Chinese consumer market reveals that much more must be done to ensure reliable supplies as typified by the sharply increasing number of cybercrimes, product/service quality that is not yet good enough and consumers’ high interest in safety and security.
One of the reasons for these differences among Japan, the U.S. and China can be attributed to the vitality of young people. Younger generations in their teens to ear-ly 30s, who are known as “millennials” in the U.S. and “post-80s” and “post-90s” in China, are the main driv-ing force of various aspects of consumption. Younger Chinese can be characterized by high motivation to con-sume, which is similar to that seen during the period of Japan’s bubble economy, as well as by being affected by the positive aspects of the Internet. Some common ten-dencies can be observed among millennials in the U.S. and their counterparts in Japan such as the trends to-wards preferring to live in urban areas and giving up cars. Future trends are worth noting.
2 Opportunities presented by globally synchronized consumption behaviors and lifestyles
Japanese consumers should shift away from their con-servative attitudes, and instead actively adopt and use new products and services.
Today, new terminals and devices are often launched and disseminated across the globe almost simultane-ously. Examples include the latest smartphones, wearable terminals such as Apple Watch, and GoPro, a small and compact video camera. The same can be said for new Internet-based services such as Uber, a new type of taxi and hire service (app-based, on-call car service), and AirBnB, a type of shared living service (service that mediates the rental of private rooms). Being quick to adopt these new products and services or to operate such businesses may open up new consumption behaviors and lifestyles.
In the future, there is a growing possibility of moving in the direction where any new consumption behaviors and/or lifestyles are likely to be synchronized globally because of the increased development of the Internet en-vironment and the diffusion of easy-to-use terminals such as smartphones.
While many Japanese consumers place emphasis on convenience in their use of the Internet, they tend to lack proactivity in terms of their mindsets in that most of them are less motivated to try new things and be com-mitted to social change and social participation. As the fact that they have less daily contact with foreigners and other countries than the U.S. and China suggests, Japa-nese consumers currently face the need to increase their opportunities to openly try new ideas and things. We hope that with the initiative taken by consumers, people, especially the younger generations, will actively open new doors and do new things, which will eventually lead to innovation and change.
Notes:1 Motoko Matsushita, Kazumi Aoki and Shiraki Katoku,
“Effects of the Promotion of “Women’s Empowerment” – Suggestions based on a three-country survey in Japan, the U.S. and China (Volume 1), NRI Papers No. 208
2 An overview of “Online Consumer Survey in Japan, the U.S. and China” conducted by Nomura Research Insti-tute is as follows:
Major survey items:• Value orientations, ideal lifestyle• Employment status, thinking about ways of working• Basic consumer behavior• Current status of ICT use, services that respondents
want to use in the future• Basic attributesSurvey method: Online surveySurvey period: August 2014Survey subjects:
15
Direction of Change in Consumers’ Use of Information and Lifestyles
Copyright 2016 by Nomura Research Institute, Ltd.
NRI Papers No. 209 July 1, 2016
5 “China Online Shopping Market Research Report” pub-lished by the China Internet Network Information Center (CNNIC) (Based on the results of a telephone survey of people who used the Internet during the preceding six months in China, which was conducted in April 2013)
6 Sources include People’s Public Security University of China, “2012 Annual Report on Cybercrime in China”
7 Motoko Matsushita, Hiroyuki Nitto and Kenji Hamatani, “Naze, nihonjin ha mono wo kawanainoka? (Why don’t Japanese buy things?), Toyo Keizai Inc., 2013
8 “China National Resident Survey (CNRS)” data provid-ed by Video Research Ltd. (an interview survey of 94,100 Chinese aged 15 – 59, conducted in September 2013)
9 The Rockefeller Foundation and Transportation for America, “Rockefeller Millennials Survey” (a survey of 703 Americans aged 18 – 34, conducted in April 2014)
10 American Planning Association, “Investing in Place” (a survey of 91,040 Americans aged 21 65, conducted in 2014)
Hiroyuki NITTO is Senior Consultant at NRI’s Consumer Goods / Service & Healthcare Industry Consulting Depart-ment. His specialties include marketing strategy, formulating business strategy in the service industry and analyzing con-sumer perception and behavior. He is also Visiting Professor at the Japan Advanced Institute of Science & Technology.IkkoSOGA is Senior Consultant at NRI America’s Service and Healthcare Group, Research and Consulting Division. His specialties include creating business strategy and overseas business expansion strategy, and developing new businesses.SoniaSUSANTO is Senior Research Analyst at NRI Ameri-ca’s Service and Healthcare Group, Research and Consulting Division. Her specialties include developing new businesses, marketing and sales strategy, insurance and healthcare.ShirakiKATOKU is Director at NRI Shanghai’s Corporate Strategy Department. Her specialties include creating compa-nies’ mid- and long-term growth strategies, selecting partner companies and providing support for entering into partner-ships.
(1) Japan: 3,161 respondents aged 15 - 69• Gender and age distributions correspond to gender
and age compositions of the population based on Japan’s population census.
• The entire country was divided into 10 survey areas (Hokkaido, Tohoku, etc.). The sample size was de-termined according to the ratio of population in each area.
(2) U.S.: 3,115 respondents aged 15 - 69• Gender and age distributions correspond to gender
and age compositions of the population based on the U.S. census.
• Survey areas were determined in conformity with four census regions. The sample size was deter-mined according to the ratio of population by gender and by 10-year age group in each region.
(3) China: 3,134 respondents aged 15 – 59• In China, because the sample size of the 60 – 69 age
group in a survey panel was extremely small, this group was not included in the survey subjects.
• The subject cities and the sample size were deter-mined in consideration of the size of city and regional balance as follows:
Tier-0 cities: Beijing, Shanghai and Guangzhou (500 respondents in each city)Tier-1 cities: Dalian and Nanjing (300 respondents in each city)Tier-2 cities: Harbin, Xian and Chengdu (300 re-spondents in each city)• Based on Chinese statistics, the sample size was de-
termined according to gender and age compositions of the population in each city. (However, when the number of responses received fell short of the re-quired number of responses, responses were collected from those who were close in age in the same city.)
3 Google, “Our Mobile Planet,” May 20134 “Statistical Report on Internet Development in China”
published by the China Internet Network Information Center (CNNIC) in December 2014
As a leading think tank and system integrator in Japan, Nomura Research Institute is opening new perspectives for the social paradigm by creating intellectual property for the benefit of all industries. NRI’s services cover both public and private sectors around the world through knowledge creation and integration in the three creative spheres: “Research and Consulting,” “Knowledge Solutions” and “Systems Solutions.”
The world economy is facing thorough structural changes led by the dramatic growth of IT industries and the rapid expansion of worldwide Internet usage—the challenges of which require new concepts and improvement of current systems. NRI devotes all its efforts to equipping its clients with business strategies for success by providing the best in knowledge resources and solutions.
NRI Papers present selected works of NRI Group’s 9,000 professionals through its worldwide research network. The mission of NRI Papers is to contribute new ideas and insights into business management and future policy planning, which are indispensable for overcoming obstacles to the structural changes in our society.
All copyrights to NRI Papers are reserved by NRI. No part of this publication may be reproduced in any form without the prior written consent of NRI.
Inquiries to: Corporate Communications Department Nomura Research Institute, Ltd. E-mail: [email protected]