Embed Size (px)
Citation preview
Unclassified EDU/WKP(2007)9 Organisation de Coopération et de Développement Economiques Organisation for Economic Co-operation and Development 21-Dec-2007 ___________________________________________________________________________________________
English text only DIRECTORATE FOR EDUCATION
School Accountability, Autonomy, Choice, and the Equity of Student Achievement: International Evidence from PISA 2003 By Gabriela Schütz, Martin R. West and Ludger Wößmann
(Education Working Paper No. 14) This report provides new evidence on how national features of choice, autonomy and accountability are related to equality of opportunity across countries. It finds that that additional choice created by public funding for private schools is associated with a strong reduction in the dependence of school achievement on SES; external exit exams are associated with higher results for all students, though less for low SES students; subjective ratings by teachers of student performance is associated more strongly with low-SES students. Different aspects of school autonomy are associated with different outcomes. This report was prepared under the Education Policy Committee�s activities on Parental Choice, School Autonomy and System Accountability and Equity in Education. Financial support for this work was provided by the OECD and by additional voluntary contributions from Belgium (Flemish Community), New Zealand, Norway, Sweden, and Switzerland.
Gregory Wurzburg, Education and Training Policy Division, OECD Directorate for Education Tel: +33 1 45 24 92 95; E-mail: [email protected]
JT03238354
Document complet disponible sur OLIS dans son format d'origine Complete document available on OLIS in its original format
ED
U/W
KP(2007)9
Unclassified
English text only

EDU/WKP(2007)9
2
School Accountability, Autonomy, Choice, and the Equity of Student Achievement: International Evidence from PISA 2003
Gabriela Schütz, Martin R. West, Ludger Wößmann1,2
30 September 2007
1 We are grateful to Elke Lüdemann for her collaboration in the work on the underlying database. 2 The authors are from Ifo Institute for Economic Research at the University of Munich, Department Human
Capital and Innovation, Poschingerstr. 5, 81679 Munich, Germany, Phone: (+49) 89 / 9224-1692; E-mail: [email protected]; Internet: www.cesifo.de/woessmann. Martin R. West is affiliated with the Education Department, Brown University, Providence, RI.

EDU/WKP(2007)9
3
OECD DIRECTORATE FOR EDUCATION
OECD EDUCATION WORKING PAPERS SERIES
This series is designed to make available to a wider readership selected studies drawing on the work of the OECD Directorate for Education. Authorship is usually collective, but principal writers are named. The papers are generally available only in their original language (English or French) with a short summary available in the other.
Comment on the series is welcome, and should be sent to either [email protected] or the Directorate for Education, 2, rue André Pascal, 75775 Paris CEDEX 16, France.
The opinions expressed in these papers are the sole responsibility of the author(s) and do not necessarily reflect those of the OECD or of the governments of its member countries.
Applications for permission to reproduce or translate all, or part of, this material should be sent to OECD Publishing, [email protected] or by fax 33 1 45 24 99 30.
Copyright OECD 2007

EDU/WKP(2007)9
4
ABSTRACT
School systems aspire to provide equal opportunity for all, irrespective of socio-economic status (SES). Much of the criticism of recent school reforms that introduce accountability, autonomy, and choice emphasizes their potentially negative consequences for equity. This report provides new evidence on how national features of accountability, autonomy, and choice are related to the equality of opportunity across countries. We estimate whether student achievement depends more or less on SES in school systems employing these institutional features. The rigorous micro-econometric analyses are based on the PISA 2003 data for more than 180,000 students from 27 OECD countries.
The main empirical result is that rather than harming disadvantaged students, accountability, autonomy, and choice appear to be tides that lift all boats. The additional choice created by public funding for private schools in particular is associated with a strong reduction in the dependence of student achievement on SES.
External exit exams have a strong positive effect for all students that is slightly smaller for low-SES students. The positive effect of regularly using subjective teacher ratings to assess students is substantially larger for low-SES students. The effect of many other accountability devices does not differ significantly by student SES. School autonomy in determining course content is associated with higher equality of opportunity, while equality of opportunity is lower in countries where more schools have autonomy in hiring teachers. Autonomy in formulating the budget and in establishing starting salaries is not associated with the equity of student outcomes. Inequality of opportunity is substantially higher in school systems that track students at early ages.

EDU/WKP(2007)9
5
RÉSUMÉ
Les systèmes scolaires souhaitent offrir des chances égales pour tous les élèves, quel que soit leur milieu socio-économique d�origine. La plupart des critiques soulevées par les réformes récentes instaurant la responsabilité, l�autonomie et le choix mettent en avant leurs conséquences potentiellement négatives en termes d�équité. Ce rapport apporte de nouveaux éléments sur les liens existant entre les caractéristiques nationales en matière de responsabilité, d�autonomie et de choix et l�égalité des chances selon les pays. Des estimations sont faites afin de déterminer si les résultats des élèves dépendent plus ou moins de leur milieu socio-économique d�origine dans les systèmes scolaires qui reposent sur ces caractéristiques. Les analyses micro-économétriques rigoureuses s�appuient sur les données de l�enquête PISA 2003 pour plus de 180 000 étudiants de 27 pays Membres de l�OCDE.
Le principal résultat empirique est que, plutôt que de nuire aux élèves de milieux défavorisés, la responsabilité, l�autonomie et le choix semblent bénéficier à l�ensemble des élèves. En particulier, le choix supplémentaire généré par les fonds publics accordés aux établissements scolaires privés est associé à une forte diminution de la corrélation entre les résultats des élèves et leur milieu socio-économique d�origine.
Les examens de sortie externes ont un effet positif important pour tous les élèves, bien qu�il soit légèrement moindre pour les élèves de milieux modestes. Les retombées bénéfiques du recours régulier à des classements subjectifs d�enseignants pour évaluer les élèves sont nettement plus importantes pour les élèves de milieux modestes. Les effets de nombreux autres outils de responsabilisation ne diffèrent pas notablement selon le milieu d�origine des élèves. L�autonomie laissée aux établissements scolaires pour déterminer le contenu des programmes scolaires est associée à une plus grande égalité des chances, alors que celle-ci est moindre lorsque les établissements scolaires sont plus nombreux à pouvoir recruter librement leurs enseignants. L�autonomie accordée aux établissements pour établir le budget et les salaires de départ n�est pas liée à l�équité des résultats des élèves. L�inégalité des chances est nettement plus forte dans les systèmes scolaires qui favorisent l�orientation précoce des élèves.

EDU/WKP(2007)9
6
TABLE OF CONTENTS
ABSTRACT ................................................................................................................................................... 1
RÉSUMÉ ........................................................................................................................................................ 5
1. INTRODUCTION ................................................................................................................................... 8
2. A BASIC MODEL ................................................................................................................................ 12
2.1 The Model ...................................................................................................................................... 12 2.2 Interpretation of the Interaction Effects.......................................................................................... 14 2.3 Results ............................................................................................................................................ 15
3. ACCOUNTABILITY ............................................................................................................................ 19
3.1 Background .................................................................................................................................... 19 3.2 New Results .................................................................................................................................... 19
4. AUTONOMY ........................................................................................................................................ 25
4.1 Background .................................................................................................................................... 25 4.2 New Results .................................................................................................................................... 25
5. CHOICE ................................................................................................................................................ 28
5.1 Background .................................................................................................................................... 28 5.2 New Results .................................................................................................................................... 28 5.3 Choice-based Systems vs. Selection-based Systems: Early Tracking ............................................ 32
6. CONCLUSION ..................................................................................................................................... 34
APPENDIX A: DATABASE AND DESCRIPTIVE STATISTICS ............................................................ 36
A.1 The PISA 2003 Database and Its Measures of Cognitive Skills .................................................... 36 A.2 Construction of a Student-Level Micro Database for the Estimation............................................. 37 A.3 Data on Accountability, Autonomy, and Choice ............................................................................ 38 A.4 Background Controls ...................................................................................................................... 39 A.5 Tables of Descriptive Statistics ...................................................................................................... 40
APPENDIX B: ECONOMETRIC MODELING .......................................................................................... 44
B.1 Cross-Country Data and Potential Bias .......................................................................................... 44 B.2 Micro-Econometric Issues of Hierarchically Structured Data: Multi-Level Error Components and Sampling Weights ..................................................................................................................................... 45 B.3 Data Imputation and Its Implications for the Estimation Model .................................................... 46
APPENDIX C: ADDITIONAL TABLES .................................................................................................... 48
REFERENCES ............................................................................................................................................. 52

EDU/WKP(2007)9
7
List of Tables and Figures
Table 1: The basic model for mathematics achievement ........................................................................ 16 Table 2: The basic model for science achievement................................................................................. 17 Table 3: Accountability ........................................................................................................................... 20 Table 4: Autonomy ................................................................................................................................. 26 Table 5: Choice ....................................................................................................................................... 30 Table A.1: Descriptive statistics of the international dataset ..................................................................... 40 Table A.2: Country means of test scores, accountability, autonomy, and choice ...................................... 42 Table C.1: Full results of the basic model for mathematics achievement .................................................. 48 Table C.2: Full results of the basic model for science achievement .......................................................... 50 Figure 1: External exit exams and SES .................................................................................................... 21 Figure 2: Monitoring of teacher lessons by principal and SES ................................................................ 23 Figure 3: Student assessment by teachers� subjective ratings and SES.................................................... 24 Figure 4: Private school operation and SES ............................................................................................. 29 Figure 5: Difference in government funding between private and public schools and SES .................... 31 Figure 6: Tracking and SES ..................................................................................................................... 33

EDU/WKP(2007)9
8
1. INTRODUCTION
Accountability, autonomy, and choice are the watchwords of contemporary education reformers around the globe. Concerned with the efficiency of the educational process, many countries have implemented policies in each of these areas in the hopes of advancing the learning of all students in the system. And indeed, Wößmann, Lüdemann, Schütz, and West (2007) find that many different forms of school accountability, autonomy, and choice are strongly associated with higher levels of student achievement across countries.3
But societies and policymakers expect their education systems not only to promote efficiency, but also equity (cf., e.g., OECD 2007). School systems aspire to provide equal opportunity for all, irrespective of socio-economic or socio-cultural backgrounds. Equity goals are particularly salient in education because schooling decisions made on behalf of underage children by their parents have important consequences for their future wellbeing. School systems can therefore play a leading role in enhancing the equality of opportunity by providing equal starting points in life. In fact, leading examples of the recent reform wave, such as the No Child Left Behind Act introduced in the United States in 2001, are explicitly intended to improve the achievement of disadvantaged students. So how do accountability, autonomy, and choice affect the equity of student achievement? Do they raise the educational performance of children with high socio-economic status (SES) to the detriment of low-SES children? Or are they tides that lift all boats? Could they even provide an additional boost for disadvantaged children?
Much of the criticism of market-oriented education reforms emphasizes their potentially negative consequences for equity. This is most common in the area of school choice, where critics fear that choice and competition may induce cream-skimming, increase segregation, and have adverse effects on disadvantaged students (e.g., Ladd 2002; Cullen, Jacob, and Levitt 2005; Burgess, McConnell, Propper, and Wilson 2007). The possibility of cream-skimming within choice-based systems may be particularly acute when schools have considerable autonomy. Critics also argue that high-stakes accountability policies, in design and implementation, have ignored equity issues (e.g., Diamond and Spillane 2004). If school accountability policies are based on performance levels rather than value-added, they may give undue advantages to schools serving students from high socio-economic backgrounds (e.g., Ladd and Walsh 2002). Furthermore, teachers may respond strategically to accountability measures by sorting out or retaining disadvantaged students (Jacob 2005). Depending on their design, they may also induce teachers to concentrate primarily on achieving high average performance and neglect the performance of weak students, whose performance may be more difficult to improve. By contrast, proponents of all three institutional features argue that if properly designed, accountability, autonomy, and choice may be particularly important for the educational achievement of children who do not have the advantage of an educationally rich home environment.
In this report, we exploit cross-country variation in school accountability, autonomy, and choice in order to provide new evidence on whether the distribution of student achievement in school systems employing these institutional features is more or less equitable. The extent of accountability, autonomy,
3 Wößmann, Lüdemann, Schütz, and West (2007) also provide much more detail on the reform movements,
their theoretical background, and on the modelling approach and database used.
EDU/WKP(2007)9
9
and choice often does not vary substantially within school systems, and if it does, this variation is most likely to be intertwined with issues of self-selectivity that make it difficult to identify causal effects. The variation given between countries allows for the empirical evaluation of the effects of accountability, autonomy, and choice on international differences in the relative performance of children with high versus low socio-economic background.
The data we use to perform such an analysis come from the student achievement test of the 2003 Programme for International Student Assessment (PISA; cf. OECD 2004 for details). The student-level database that we derive from this study contains more than 180,000 students from 27 OECD countries. It contains student-level information on cognitive achievement and socio-economic background and school-level information on several aspects of accountability, autonomy, and choice, as well as information on additional student and school background characteristics. Appendix A provides general details on the database used in this report, including the construction of a workable student-level micro database and descriptive statistics of the international data and selected national means. The target population of the PISA test is 15-year-old students, of whom representative random samples were drawn in each participating country. This report concentrates mainly on student achievement in mathematics, the focus of the PISA 2003 study. Test scores are mapped on a scale with an international mean of 500 and an international standard deviation of 100 test-score points. The �grade-level equivalent� of the simple test-score difference between 9th graders and 10th graders is 22.1 mathematics test-score points, which provides a rough benchmark of how much students learn on average during one school year.
We operationalize equity by estimating how strongly the educational achievement measured by PISA test scores depends on the socio-economic background of the students� families in each country. Specifically, we use the Index of Economic, Social, and Cultural Status (ESCS) that was provided by PISA as our measure of SES. The size of the achievement difference between students with high and low values on the ESCS index provides a measure of how fair and inclusive each school system is: The smaller the difference, the more equally distributed is educational opportunity. This operationalization comports with the concept of equality of opportunity proposed by Roemer (1998; cf. Betts and Roemer 2007), who suggests that the educational achievement of children should be independent of family socio-economic background. Roemer�s concept suggests that inequality should be tolerated only if it results from differences in effort, not if it reflects circumstances that are beyond a person�s control � including the socio-economic background of their parents.
We therefore estimate how national features of accountability, autonomy, and choice are related to the (in)equality of opportunity achieved by a school system. Our econometric model expresses student achievement across countries as a function of numerous factors that include an interaction term between the institutional features of the school systems and the SES of the students. The estimated coefficient on this interaction term shows whether and how the institutional features are associated with the strength of the effect of SES on student achievement, i.e. with inequality of opportunity. In effect, such models reveal whether national features of accountability, autonomy, and choice affect students from different backgrounds differently.
A key problem with such models when estimated within individual countries is that students with different SES may self-select into specific schools with certain institutional features. For example, high-SES parents may be more likely to opt into schools with strong accountability systems, with autonomy over particular decisions, or under private management. This self-selection may affect how strongly student achievement depends on SES within countries and may also bias the estimated interaction coefficients. Throughout this report, we circumvent these issues by measuring all features of accountability, autonomy, and choice at the country level. This way, selection processes within each school system cancel out, and the estimated coefficients show how strongly inequality of opportunity depends on the average share of schools with each institutional feature in a specific school system. In order to exclude

EDU/WKP(2007)9
10
intervening effects of other student and school characteristics, our model also controls for a set of student characteristics such as gender, age, and immigration status, as well as school characteristics such as community location, class size, instructional time and material, and teacher education.
Questions of equity are of course intertwined with questions of efficiency. For example, it may be the case that some institutional features increase inequality but are nonetheless beneficial for all students. This would be the case if the achievement of low-SES students is raised, but the achievement of high-SES students is raised by an even larger amount. In such a case, everybody gains in absolute terms and efficiency is increased in the Pareto sense (that no-one is worse off while at least some-one is better off). Assessments of the relative merit in such cases require value judgments concerning the relative importance on equity and efficiency. While we abstain from such judgments in this report, our results can inform the discussion by illustrating the size of any potential tradeoffs. Thus, while a detailed efficiency analysis is provided in Wößmann, Lüdemann, Schütz, and West (2007), we will refer to results on efficiency as well as equity here as well whenever it is necessary for a comprehensive assessment.
Success within the school system is crucial for outcomes later in life. The labor-market returns to education, and in particular to the quality of education as measured by cognitive achievement tests, are very high (cf. Hanushek and Wößmann 2007a, 2007b for a survey). Several recent studies indicate that a one standard deviation increase in mathematics test scores at the end of high school is associated with about 12 percent higher annual earnings later in life (e.g., Mulligan 1999; Murnane, Willett, Duhaldeborde, and Tyler 2000; Lazear 2003). In addition, cognitive achievement is strongly related to employment (e.g., Bishop 1992; OECD 2000; McIntosh and Vignoles 2001).
Given these individual returns to education, it comes as no surprise that equality of educational opportunity is crucial for the extent of equality of opportunity and intergenerational mobility that societies achieve in general. Nickell (2004), for example, shows that most of the existing cross-country variation in earnings inequality can be attributed to cross-country variation in skill dispersion. Within-country studies for the United States (e.g., Juhn, Murphy, and Pierce 1993) have also concluded that skill differences have a strong and growing impact on the distribution of income. Understanding how the institutional structure of school systems � and in particular the changes in those institutions brought about by recent reforms � affects the equity of student achievement is therefore critical.
The remainder of this report is structured as follows. Chapter 2 discusses the empirical model in greater detail and presents results of a basic model that provides a first glimpse of the effects of accountability, autonomy, and choice on the equity of student achievement. Chapters 3 to 5 then present additional background, including discussions of previous cross-country evidence, and more detailed analyses of different aspects of accountability, autonomy, and choice, respectively. Chapter 6 concludes.
The main empirical results presented in the report are as follows:
− In general, there is very little evidence that those aspects of accountability, autonomy, and choice that are associated with higher levels of student achievement across countries in PISA 2003 have adverse consequences for the equity of student achievement. To the contrary, the choice created by public funding for private schools in particular is associated with a strong reduction in the dependence of student achievement on SES.
− In terms of accountability, external exit exams have a strong positive effect for all students that is slightly smaller for low-SES students, though (Chapter 3). Monitoring of teacher lessons by the school principal is also associated with higher performance across the distribution, although the effect is substantially smaller for low-SES students. By contrast, the positive effect of regularly using subjective teacher ratings to assess students is substantially larger for

EDU/WKP(2007)9
11
low-SES students. The effect of many other accountability devices, such as the monitoring of teacher lessons by external inspectors, the regular use of standardized tests, and the use of assessments to make decisions on student retention or promotion, to group students, to monitor school progress, or to compare the school to district or national performance or to other schools, does not differ significantly for students with different SES.
− Results on the relationship between school autonomy and equity are somewhat sensitive to the specification used (Chapter 4). Equality of opportunity is lower in countries where more schools have autonomy in hiring teachers, although there is a smaller opposing effect for school influence on staffing decisions more generally. School autonomy in determining course content is associated with slightly higher equality of opportunity. In our most elaborate specification, autonomy in formulating the budget and in establishing starting salaries are not associated with the equity of student outcomes.
− In terms of private school choice, the positive effects of both private school operation and government funding are substantially larger for low-SES students (Chapter 5). The equity-enhancing effect of private school operation can be attributed to international variation in the difference in government funding between public and private schools: The more similar privately operated schools are treated relative to publicly operated schools in terms of government funding, the less does student achievement depend on family background. Thus, the competition created by government funding for privately operated schools seems to be particularly helpful for students with low SES.
− These results on choice and competition contrast starkly with the results on effects of the selectivity of the school systems, as measured by the age at which children are first tracked into different types of schools. Inequality of opportunity is substantially higher in school systems that track students at early ages.

EDU/WKP(2007)9
12
2. A BASIC MODEL
This chapter presents a basic empirical model that provides a first overview of the effects of accountability, autonomy, and choice on the equality of educational opportunity within national education systems. First, we describe the key features of the modeling approach and econometric techniques we rely on throughout this report. We then explain how to interpret the key coefficient estimates indicating the relationship between institutions of the school system and equality of opportunity. Finally, we report and discuss the main results of the basic model.
2.1 The Model
In order to estimate the effects of accountability, autonomy, and choice on equality of educational opportunity, we exploit institutional variation across countries. More specifically, we examine how the relationship between student achievement and family background characteristics varies across countries with different accountability, autonomy, and choice policies in place. Because student achievement clearly depends on many factors that operate independently of schooling institutions, we estimate so-called �education production functions� (cf., e.g., Hanushek 1994) that control simultaneously for differences in various student, family, school, and country characteristics that may influence student achievement. For example, if systems with more autonomous schools also spent more on schools, and if resources were especially beneficial for students with low (or high) SES, our estimates of the effects of school autonomy on equity would be biased unless we control for educational spending. To control for such other influences as rigorously and efficiently as possible, we perform the cross-country regressions at the student level, which allows us to account for possible intervening effects at the level of each individual student. Thus, our empirical model has three important features: It uses cross-country variation, it estimates the effects of many variables simultaneously, and it is performed at the level of individual students.
Our international education production functions combine individual student-level data on educational achievement with extensive background information taken mostly from student and school background questionnaires in order to express student achievement on the PISA test as a function, f, of several determining factors:
Student achievement = f (student characteristics, family background,
school resources, country characteristics, accountability, autonomy, choice) (1a)
However, we are interested not only in how accountability, autonomy, and choice affect student performance, but also in how these institutions interact with family background. What we essentially want to know is whether the influence of family background on student achievement increases or decreases with higher degrees of accountability, autonomy, and choice. We therefore regress student test scores on student characteristics, family background, school resources, country characteristics, accountability, autonomy, and choice and on interactions between family background and accountability, autonomy, and choice.
More formally, the achievement test score Tisc of student i in school s in country c is regressed on several sets of potential influences:
EDU/WKP(2007)9
13
( ) isccisccscisciscisc IFIRBFT εηδγβα +×++++= (1b)
In this specification, F is a summary measure of family background described below. B is a vector of student and country characteristics consisting of 16 variables including the student�s gender and age, attendance of pre-primary education, immigration status, and the per-capita GDP of the country. R is a vector of data on schools� resource endowments and location, comprising 10 variables such as class size, availability of materials, instructional time, teacher education, city size, and average expenditure per student in the country. (Table C.1 in Appendix C provides a complete list of the control variables included in all the models presented in this report.) The vector I contains the institutional characteristics of interest, including several different measures of school accountability, autonomy, and choice, all of which are measured as averages at the country level.
Finally, the vector F × I represents the interaction terms between family background and the measures of school accountability, autonomy, and choice that are the main focus of the analyses in this report. Assuming that after having controlled for the set of observed effects at the level of students, schools, and systems there is no unobserved heterogeneity left across countries that might bias the estimates, the estimated coefficients η on the interaction terms between SES (measured at the student level) and the institutional features (measured at the country level) identify how the institutional features affect the size of the effect of SES on student achievement.
For each model presented in the report, we also estimate a second specification that relaxes the assumption that there is no unobserved cross-country heterogeneity in student achievement. This is achieved by including a whole set of country fixed effects in the model. Country-level variables such as GDP per capita, expenditure per student, and the averaged institutional variables for accountability, autonomy, and choice cannot be included in this specification, because they vary only at the country level. Instead, the model includes a vector of country dummies C that allows the education production function to have a unique intercept for each country:
( ) isccciscscisciscisc CIFRBFT εµηγβα ++×+++= (1c)
Despite the country fixed effect, the specification still identifies our main measure of interest, namely how the institutional features affect the effect of SES on student achievement, which is captured by the coefficients η on the interaction terms at the student level. To identify this specification, the assumption that there is no unobserved cross-country heterogeneity can be replaced by the less restrictive assumption that any remaining unobserved cross-country heterogeneity is unrelated to the size of the effect of SES on student achievement. Under this assumption, equation (1c) can still identify how institutional features of the school system relate to equality of educational opportunity. Since it requires the least restrictive assumptions on the cross-country distribution of test scores, the specification with country fixed effects is our preferred specification.
The parameter α and the parameter vectors β, γ, δ, η, and µ are estimated by least-squares regression at the level of individual students i, with a sample size of more than 180,000 students. The estimation of such micro-econometric models encompasses additional technical details, such as the weighting of student observations by their sampling probabilities, the addition of higher-level components to the error term ε to ensure proper statistical inferences in light of the hierarchical structure of the data, and the treatment of missing values in the background questionnaires. To be able to use a complete dataset of all students with data on achievement and at least some background characteristics, we imputed missing values for background variables using techniques as described in Appendix B.3. To ensure that imputed values do not bias our estimation results, all our models include a complete set of indicators identifying observations

EDU/WKP(2007)9
14
with imputed values for each variable. All technical details on the econometric modeling are discussed in Appendix B.4
We measure family background as the SES of the student�s family. Thus, we focus on how the influence of family SES on student achievement differs between countries with more or less accountability, autonomy, and choice in the schooling sector. The most encompassing measure of family SES provided in the PISA 2003 database is the Index of Economic, Social and Cultural Status (ESCS). The ESCS index is derived from the highest occupational status of each student�s parents, their highest educational level, and a summary measure of household possessions.5 Because we want to estimate the interactions between this measure of family background and the institutional characteristics of accountability, autonomy, and choice, in this analysis we refrain from including additional family background controls that are either components of the ESCS index (such as parental education or the number of books in the household) or that are likely to correlate with it (such as the employment status of parents).
Because SES is a key variable in our analysis, we dropped all student observations with missing information on the ESCS index from our sample. We also excluded Mexico and Turkey from the sample of countries because the average ESCS level for students in these countries was a full standard deviation below the international mean, suggesting that comparisons between these countries and the rest of the OECD in terms of equity may be unreliable.
Throughout this report, the institutional features are all measured as averages at the country level. The analyses thus use only between-country variation in accountability, autonomy, and choice to identify their effects on equity. The main reason for this aggregation, as discussed in Chapter 1, is to evade problems of within-country selectivity. The aggregate measurement also allows capturing potential systemic effects. The downside of using only country-level institutional measures is that the degrees of freedom at the country level are very limited. Specifically, with only 27 countries included in the sample and GDP per capita and educational expenditure per student included as country-level controls, there are only 24 degrees of freedom left at the country level for the analysis of institutional effects. Because of this limitation, we are unable to analyze potential interaction effects between accountability, autonomy, and choice.
Because our aim in this chapter is to provide an overview of the main results for accountability, autonomy, and choice, we use only one or two summary indicators of each of the three institutional features in our basic model. The indicators of accountability, autonomy, and choice are entered jointly in order to account for the possible effects of the other institutions. Even in the more detailed analyses of specific institutional dimensions presented in subsequent chapters, the summary measures of the other two institutions used in the basic model are included as control variables. Moreover, because the practice of tracking has proven to be one of the most important factors in determining inequality, all our models also include a tracking variable and the interaction between this tracking variable and ESCS.6
2.2 Interpretation of the Interaction Effects
A simple example helps to illustrate how the estimated coefficients are to be interpreted. Assume that we regressed test scores only on family background F, one single accountability measure A, and on the interaction term between these two variables F × A. The regression equation would then become:
4 See also Wößmann (2003a, 2003b), Schütz, Ursprung, and Wößmann (2005), and Fuchs and Wößmann
(2007) for methodological details of the econometric techniques. 5 For detailed information on the construction of the ESCS index, see OECD (2005a). 6 See Schütz, Ursprung, and Wößmann (2005) and Hanushek and Wößmann (2006) for the effects of
tracking on inequality.

EDU/WKP(2007)9
15
( ) iscciscciscisc AFAFT εηβα +∗++= (2a)
If we want to describe the effect of the accountability measure A on test scores, it is not sufficient to consider β on its own. Rather, the effect of A on test scores depends on family background F and the estimated coefficient η on the interaction term between the two variables. This can easily be seen by taking the first derivative of equation (2a) with respect to A:
ηβ FAT
+=∂∂
(2b)
Thus, β represents the effect of the accountability measure A on test scores only for students with a family background F of zero. In the same way, α only represents the effect of family background F on test scores for the case when accountability A is zero. In order to make the individual coefficients α and β meaningful, we have centered both the family background variable and all institutional variables in this report to have a mean of zero. As a result, the estimated α coefficient represents the effects of family background in the case of the international mean value of all institutional variables, while the estimated β coefficients represent the institutional effects in the case of the international mean value of family background.
To see how test scores vary with changes in family background, we can take the first derivative of equation (2a) with respect to F:
ηα AFT
+=∂∂
(2c)
This derivative demonstrates why we are interested in the sign of the coefficients on the interaction terms between the measures of accountability, autonomy, and choice and the family background variable. We want to know whether the influence of family background on student achievement becomes smaller or larger with increased accountability, autonomy, and choice in the schooling sector. Therefore, we are essentially interested in whether we can observe a significant effect of these interaction terms on student achievement and whether their signs are positive or negative. A positive relationship means that inequality increases with increasing accountability, autonomy or choice, while a negative relationship means that inequality is reduced.
2.3 Results
Tables 1 and 2 report results of the basic model. The model is estimated both for mathematics and for science achievement for the sample of OECD countries that participated in PISA 2003.7 Although we report results for science as a point of reference for the basic model, we discuss only the results for mathematics achievement, the main focus of the PISA 2003 study. Note that all models control for the 26 variables described above measuring student background and schooling resources; detailed results for these control variables are reported in Tables C.1 and C.2 in Appendix C.
7 In addition to Mexico and Turkey, France was also excluded from the analysis because the PISA 2003
database does not contain school-level information for any of its schools.

EDU/WKP(2007)9
16
Table 1: The basic model for mathematics achievement
Main effect Interaction with ESCS
Interaction with ESCS
(1) (2) External exit exams 16.840** 8.120*** 8.750*** (8.008)a (0.862) (0.799) Autonomy in formulating budget -29.740* 7.950*** 9.329*** (14.594)a (1.885) (1.645) School influence on staffing decisions 31.153* 1.870 0.798 (15.990)a (1.492) (1.348) Private operation 61.385*** -5.295*** -7.900*** (12.042)a (1.901) (1.755) Government funding 60.752** -18.065*** -13.137*** (28.731)a (4.480) (4.214) Years since first tracking 0.038 2.462*** 2.119*** (1.892)a (0.281) (0.260) ESCS 29.475*** � 28.661*** (0.405) (0.371)b Country fixed effects no yes Students 181,469 181,469 Schools (clustering units) 6,912 6,912 Countries 27 27 R2 0.318 0.353 Dependent variable: PISA 2003 international mathematics test score. ESCS = PISA index of economic, social, and cultural status. Sample: OECD countries (without France, Mexico, and Turkey). Least-squares regressions weighted by students� sampling probability. Controls include: 15 student characteristics, 9 measures of school location and resources, expenditure per student, GDP per capita, imputation dummies, and interaction terms between imputation dummies and the variables. Robust standard errors adjusted for clustering at the school level in parentheses. Significance level (based on clustering-robust standard errors): *** 1 percent, ** 5 percent, * 10 percent. a Clustering of standard errors at the country level. b Main effect of ESCS.

EDU/WKP(2007)9
17
Table 2: The basic model for science achievement
Main effect Interaction with ESCS
Interaction with ESCS
(1) (2) External exit exams 15.732* 11.541*** 9.672*** (7.675)a (1.054) (1.007) Autonomy in formulating budget -28.012* 3.212 4.667** (16.122)a (2.062) (1.924) School influence on staffing decisions 22.724 -3.037 -2.103 (17.256)a (1.872) (1.790) Private operation 39.643*** -4.066* -7.467*** (9.564)a (2.291) (2.213) Government funding 47.434 -3.532 0.340 (28.884)a (5.302) (5.087) Years since first tracking -1.126 1.585*** 1.217*** (1.616)a (0.315) (0.305) ESCS 31.222*** � 30.814*** (0.474) (0.458)b Country fixed effects no yes Students 98,009 98,009 Schools (clustering units) 6,868 6,868 Countries 27 27 R2 0.292 0.318 Dependent variable: PISA 2003 international science test score. ESCS = PISA index of economic, social, and cultural status. Sample: OECD countries (without France, Mexico, and Turkey). Least-squares regressions weighted by students� sampling probability. Controls include: 15 student characteristics, 9 measures of school location and resources, expenditure per student, GDP per capita, imputation dummies, and interaction terms between imputation dummies and the variables. Robust standard errors adjusted for clustering at the school level in parentheses. Significance level (based on clustering-robust standard errors): *** 1 percent, ** 5 percent, * 10 percent. a Clustering of standard errors at the country level. b Main effect of ESCS.
The first column of specification (1) of Table 1 confirms that the main effects of the institutional variables on student achievement in the basic model reported here have the same sign and are of roughly the same magnitude as in the basic model of their effects presented in the study of effects on the level of student achievement by Wößmann, Lüdemann, Schütz, and West (2007). The robustness of these results to the addition of interactions with student SES further validates the main findings of that analysis.
The summary accountability variable included in the basic model measures whether a country has external exit exams at the end of secondary school. The positive sign of the estimated coefficient on this variable indicates that students in countries that have external exit exams in mathematics perform better on the PISA mathematics test than students in countries without external exit exams. In terms of equity, however, external exit exams reduce the equality of educational opportunity insofar as they increase the influence of SES on student achievement. This is apparent from the statistically significant positive interaction term between external exit exams and SES reported in the second column of specification (1), which stems from one regression together with the first column. (Note that the qualitative results on the interaction of the different institutions with SES in the basic model are robust to the inclusion of country fixed effects, as reported in specification (2) of Table 1.)

EDU/WKP(2007)9
18
While these results suggest that accountability systems may enhance achievement but reduce equity, it is important to keep in mind that there are many different ways to implement accountability. External exit exams mainly provide incentives for individual students, although they may also create indirect accountability pressures for teachers and schools. Other accountability devices, such as monitoring of teachers� lessons and comparing schools� performance to district and national averages, focus instead on teachers and schools. Chapter 3 examines in greater detail the effects of these different forms of accountability policies on the equality of educational opportunity.
Two measures of autonomy are included in the basic model: the share of schools in a country having main responsibility for formulating the school budget, and the share of schools exerting a direct influence on decision-making about staffing. The effects of these two kinds of autonomy on average student achievement point in opposite directions: While autonomy in formulating the budget is negatively associated with student achievement, influence on staffing decisions is positively associated with student achievement. It seems that on average, schools that can formulate their own budget do so in ways that hinder student achievement. By contrast, schools that can decide about staffing issues use this autonomy to advance student achievement. With respect to the effects on equity, only the interaction between SES and autonomy in formulating the budget is statistically significantly estimated. The positive sign of the estimated coefficient indicates an equity-decreasing effect of autonomy in this area, while influence on staffing decisions does not appear to have a statistically significant effect on equality of educational opportunity in this specification. As we will see in Chapter 4 which probes the effects of different forms of autonomy in much greater, however, these results do not prove robust to the analysis of additional measures of school autonomy.
The summary measure of choice included in the basic model is the share of privately operated schools in a country. As is evident from Table 1, private school operation is strongly and significantly associated with higher student achievement and with greater equality of educational opportunity. Contrary to the concerns of many critics of private involvement in education, a large sector of privately operated schools does not reduce equality of outcomes for children from different social backgrounds; in fact, the opposite is true.
While in the operation of schools, private involvement is associated with better performance and more equity, the association is reversed in the case of school finance: Here, a larger average share of government (as opposed to private) funding of schools is associated with better student achievement and with greater equality. Larger government funding, in particular when it is available to privately operated schools, may create choice for a larger share of the population and thus increase competition and access to good schools for children with less favorable family backgrounds. Chapter 5 will examine the effects of choice on equity in greater detail.

EDU/WKP(2007)9
19
3. ACCOUNTABILITY
This chapter presents more detailed evidence on the effects of different measures of accountability on the equality of educational opportunity. We first provide background on the expected effects and then present and discuss the main findings from the analyses.
3.1 Background
One fear associated with the introduction of accountability into the education sector is linked to the perceived danger of strategic behavior of schools and teachers (cf., e.g., Jacob and Levitt 2003; Jacob 2005). Opponents argue that the introduction of typical high-stakes testing policies at the school and classroom level will lead teachers and schools to act strategically and concentrate on helping the strongest students or the students with the best short term prospects of academic improvement. Such behavior could indeed harm the equality within a schooling system (cf., e.g., Ladd and Walsh 2002). However, proponents argue that such effects can be circumvented by introducing the right testing practices and by incentivizing schools to raise the academic achievement of all their students. Thus, the effects of accountability systems on equity likely depend on the specific characteristics of the accountability system.
In an empirical cross-country study, Wößmann (2005) finds that immigrants benefit more than native-born students from the existence of external exit exams, suggesting a positive effect of the accountability feature on equity along this dimension. Using student-level data from three different international student achievement tests (TIMSS, TIMSS-Repeat, and PISA 2000), he finds that the effect of external exit exams does not differ substantially for most other measured family-background characteristics. This suggests that external exit exams may be mostly neutral with respect to equality of opportunity.
With respect to the level (as opposed to equity) of student achievement, the results of Wößmann, Lüdemann, Schütz, and West (2007) indicate that many common accountability measures are associated with better student achievement. This is true for measures such as external exit exams and the use of assessments for decisions on student promotion and retention which aim primarily at students. But it is also true for accountability measures aimed at teachers, such as internal and external monitoring of teacher lessons. Similarly, accountability measures aimed at schools, such as the use of assessments to compare their performance to that of the district or nation, are also shown to enhance efficiency. By contrast, if assessments are not used to provide incentives for better performance, but rather to group students by ability, this seems to have negative effects. In the following, we discuss how these different accountability measures affect the equality of educational achievement.
3.2 New Results
Table 3 reports the results for our specification on the effects of different measures of accountability on equality of educational opportunity. Our models include all variables that were already introduced in the basic model in Table 1 plus additional country-level measures of accountability. Specifically, the four additional accountability measures are the use of assessments for decisions on student promotion and retention and for the grouping of students, the monitoring of teacher lessons by the principal or senior staff, and the use of teacher subjective ratings to assess students.

EDU/WKP(2007)9
20
Table 3: Accountability
Main effect Interaction with ESCS
Interaction with ESCS
(1) (2) External exit exams 37.422*** 3.500** 3.656** (12.638)a (1.692) (1.506) Assessments used to make decisions about 38.274*** 3.549* -0.181 students� retention/promotion (12.323)a (1.824) (1.682) Assessments used to group students -52.478*** -1.409 -0.743 (14.895)a (2.361) (2.210) Monitoring of teacher lessons by principal 31.563** 11.859*** 11.006*** (13.148)a (1.670) (1.539) Teachers� subjective ratings used to assess 27.175 -12.242*** -5.385** students at least monthly (18.715)a (2.583) (2.331) ESCS 29.582*** � 28.941*** (0.397) (0.367)b Country fixed effects no yes Students 181,469 181,469 Schools (clustering units) 6,912 6,912 Countries 27 27 R2 0.329 0.353 Dependent variable: PISA 2003 international mathematics test score. ESCS = PISA index of economic, social, and cultural status. Sample: OECD countries (without France, Mexico, and Turkey). Least-squares regressions weighted by students� sampling probability. Controls include: autonomy in formulating budget, school influence on staffing decisions, private operation, government funding, years since first tracking, interaction terms between these institutional variables and ESCS, 15 student characteristics, 9 measures of school location and resources, expenditure per student, GDP per capita, imputation dummies, and interaction terms between imputation dummies and the variables. Robust standard errors adjusted for clustering at the school level in parentheses. Significance level (based on clustering-robust standard errors): *** 1 percent, ** 5 percent, * 10 percent. a Clustering of standard errors at the country level. b Main effect of ESCS.
As already shown in the basic specification in Table 1, external exit exams are strongly and positively related with student achievement. A student with socio-economic background equal to the OECD average of ESCS scores 37.4 test points higher on the PISA 2003 mathematics scale if the country employs external exit exams in this subject. At the same time, the use of external exit exams seems to strengthen the influence of socio-economic background on student achievement. The size of this association is, however, substantially reduced in this specification that accounts for the effects of several other accountability measures relative to the basic model.
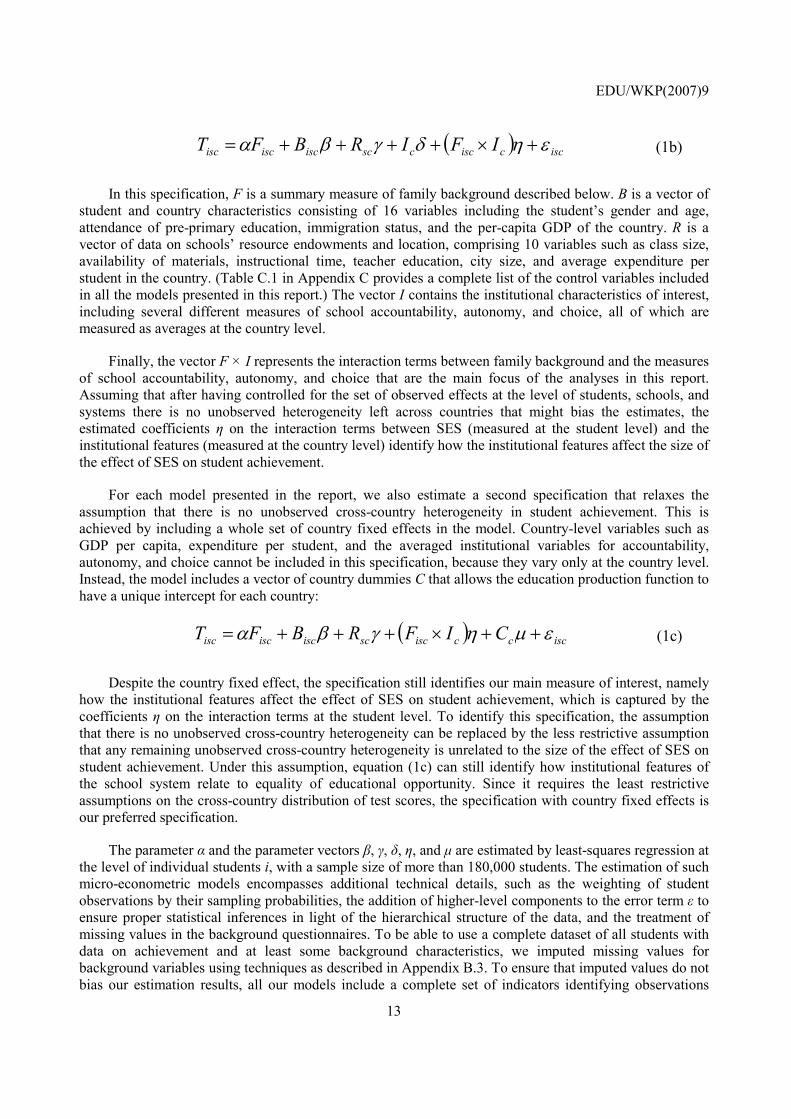
The relationship between external exit exams and equality of educational opportunity is illustrated by Figure 1. There, we distinguish between children with low SES, defined as children who are at the first decile of the OECD distribution of the ESCS index, and children with high SES, defined as children who are at the ninth decile of the OECD distribution of ESCS. Students at the first decile of the ESCS distribution have lower SES than all but 10 percent of the students in our sample, while students at the
EDU/WKP(2007)9
21
ninth decile have a higher SES than all but 10 percent of students.8 Figure 1 depicts the test scores of children with low and high SES that are associated with the presence or absence of external exit exams.
Figure 1: External exit exams and SES
Low SESHigh SES
No
Yes
33.2
111.2
0.0
69.2
0
20
40
60
80
100
120
External exit exams
Socio-economic status
Performance in PISA test
scores (relative to lowest category)
Low and high SES refer to the first and ninth decile on the PISA ESCS index, respectively. Source: Based on specification (1) of Table 3.
While both low- and high-SES students gain from the presence of external exit exams, high SES students gain slightly more. The presence of external exit exams is associated with a gain in test scores of 33.2 test score points (33.2 � 0.0) for low-SES students and with a gain of 42.0 points (111.2 � 69.2) for high-SES students. Contrary to previous findings, these results suggest that there may be a tradeoff between efficiency and equity narrowly defined when it comes to external exit exams. The effect of SES on student achievement is slightly larger in systems with external exit exams. However, even students with the lowest SES gain from external exit exams: Abolishing external exit exams would hurt even the most disadvantaged.
The first of the newly added measures of accountability is the percentage of schools using assessments to make decisions about students� retention or promotion, another accountability device aimed squarely at students. As in Wößmann, Lüdemann, Schütz, and West (2007), the results reveal that students
8 In all figures in this report, we will use the first and the ninth decile of the ESCS distribution to refer to students with
low and high SES.

EDU/WKP(2007)9
22
perform significantly better in countries with larger shares of schools using this accountability measure. With respect to equality of educational opportunity, the results differ between our two specifications. While specification (1) seems to support the hypothesis that the use of assessments for promotion decisions reduces equity, specification (2) does not. The results of the latter specification, which includes country fixed effects and therefore places fewer restrictions on the model, are more credible. The use of assessments to make decisions about student retention and promotion thus appears to be unrelated to equality of educational opportunity.
The next additional measure of accountability is the extent to which the schools in each of the countries report using assessments to group students. The use of assessments for student grouping can be regarded as a proxy for the extent of tracking that takes place within schools. As discussed in Wößmann, Lüdemann, Schütz, and West (2007), students in countries with a larger share of schools using assessments to group students perform substantially worse than in countries where fewer schools do so. This finding on the effects of tracking within schools is confirmed in the first column of specification (1) of Table 3. The coefficient of the interaction term between this variable and SES is negative but not statistically significant in both specifications; high-SES students seem to suffer as much from this practice as low-SES students. Equality of educational opportunity therefore does not seem to be affected by the presence or absence of the use of assessments for student grouping.
The PISA 2003 background questionnaires also provide information on the monitoring of teachers. Principals report whether they or other senior staff have, during the last year, observed lessons to monitor the practice of mathematics teachers at their school. Our results show that students in countries with more monitoring of teacher lessons by principals perform better but also that equity in these countries is reduced. The difference in test scores between low- and high-SES students becomes larger in countries where a large share of schools report using this type of teacher monitoring. Figure 2 displays the effects of having a high incidence of teacher monitoring by principals (as in the United States, 99.7% of students) as compared with a low incidence of such monitoring (as in Portugal, 4.9% of students) for low- and high SES students. Again, even low-SES students gain from the teacher-focused accountability, but now to a substantially smaller extent (16.3 test-score points) than high-SES students (44.8).

EDU/WKP(2007)9
23
Figure 2: Monitoring of teacher lessons by principal and SES
Low SESHigh SES
Low (Portugal, 5%)
High (USA, 100%)
16.3
103.5
0.0
58.7
0
20
40
60
80
100
120
Teacher monitoring
by principalSocio-economic status
Performance in PISA test
scores (relative to
lowest category)
Low and high SES refer to the first and ninth decile on the PISA ESCS index, respectively. Source: Based on specification (1) of Table 3.
An alternative measure of teacher monitoring available in the PISA 2003 database is whether inspectors or other persons external to the school have observed classes during the last year to monitor the practice of mathematics teachers. We used this measure as an alternative measure of teacher monitoring in the model reported above as well as entering it jointly with the measure monitoring by principal. In neither specification did this measure of teacher monitoring show a statistically significant effect on equity.
The result that external teacher monitoring is neutral with respect to equity may suggest that the equity-reducing pattern found for internal teacher monitoring by principals is due to the fact that in many countries it is foremost schools that cater high-SES students who are using internal teacher monitoring. If so, the equity-reducing effect of internal teacher monitoring may be more apparent than real.
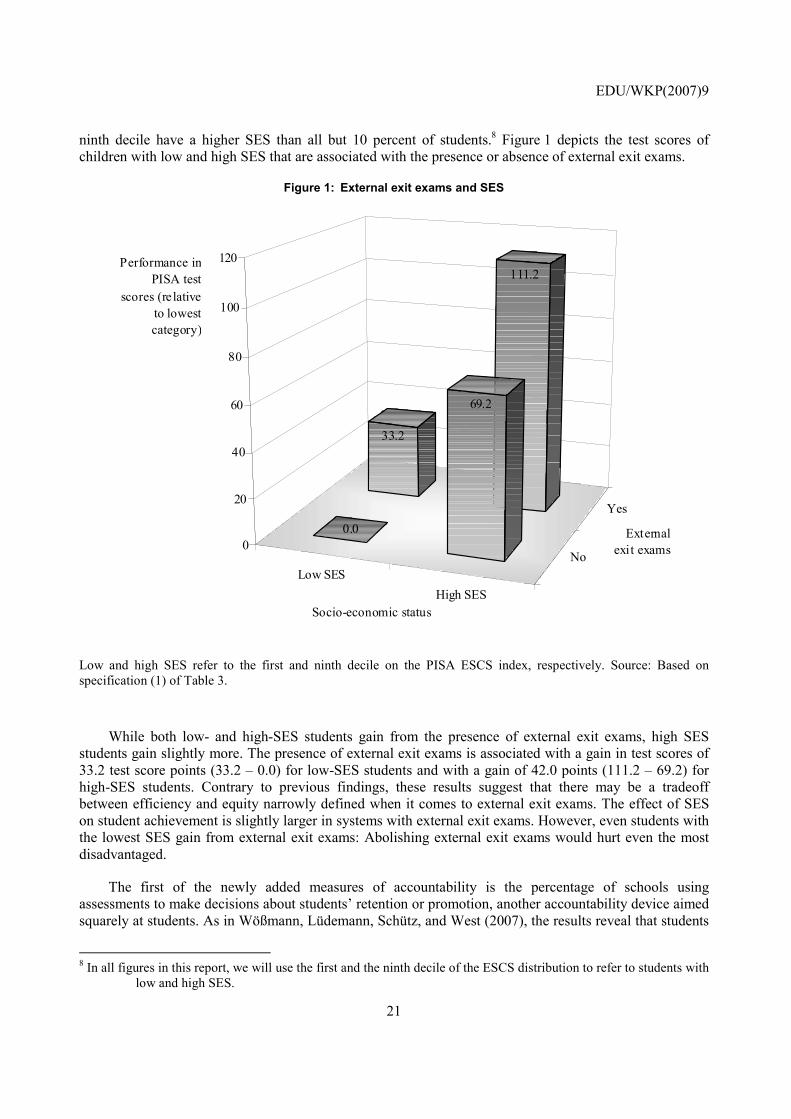
The final measure of accountability included in the model reported in Table 3 is the share of schools that report using teachers� subjective ratings to assess students at least monthly. This form of student assessment does not have a significant effect on student performance on average, but it reduces the inequality in a schooling system. Figure 3 illustrates the effects of this form of assessments graphically. All else equal, the gap between low- and high-SES students is very large (at 89.8 test-score points) in countries like Denmark that report very low levels of this form of assessment. But the gap becomes substantially smaller (at 61.4 test-score points) in countries like Portugal that report very high levels of this form of assessment. Thus, using teacher�s subjective ratings to judge the performance of students seems to be a
EDU/WKP(2007)9
24
helpful tool in reducing educational inequalities. This may be due to increased reflection by teachers on their students� performance and potential, something that might be less common when simply grading tests.
Figure 3: Student assessment by teachers� subjective ratings and SES
Low SESHigh SES
Low (Denmark, 3%)
High (Portugal, 94%)
38.4
99.8
0.0
89.8
0
10
20
30
40
50
60
70
80
90
100
Teachers� ratings at least monthly
Socio-economic status
Performance in PISA test
scores (relative to lowest category)
Low and high SES refer to the first and ninth decile on the PISA ESCS index, respectively. Source: Based on specification (1) of Table 3.
Similar equity-enhancing effects are found for the use of teacher-developed tests as an alternative form of student assessment. By contrast, the regular use of standardized tests is not significantly associated with the equality of educational opportunity.
Accountability measures can be targeted not only at teachers or students but also at schools as a whole. We therefore also examined within the same model the effects on equity of using student assessments to monitor the school�s progress from year to year, to compare the school to district or national performance, and to compare the school to other schools. None of these accountability measures aimed at schools shows a significant interaction with students� SES; they seem to be neutral with respect to equity.
In sum, accountability devices seem to be mostly tides that lift all boats. For most of them, there is no significant difference in how they affect low-SES versus high-SES students. External exit exams have a somewhat larger and internal teacher monitoring has a substantially larger positive effect for high-SES students, albeit both accountability measures have a positive effect even on students with very low SES. The regular use of teachers� subjective ratings to assess students increases the equality of educational opportunity.
EDU/WKP(2007)9
25
4. AUTONOMY
The following chapter presents evidence on the relationship between different forms of school autonomy and equity. We first discuss some background and then report the main findings of our analyses.
4.1 Background
There is little research on possible effects of school autonomy on equity, be it theoretical or empirical. It may be expected that autonomy of schools to admit students may facilitate cream-skimming. More generally, certain forms of school autonomy may provide a form of differentiation for schools which may affect students with different SES differently. Ammermüller (2005) hypothesizes that school autonomy may facilitate the transformation of parents� commitment to educational success into higher achievement for their children. Educational inequalities may increase when parents committed to their children�s education can exert additional influence on teachers and schools to further their children�s educational progress. On the other hand, additional autonomy may allow schools to focus particularly on students with low SES. Theoretical predictions on possible effects of autonomy on equity therefore seem limited.
Using data from the PISA 2000 international student achievement test and a combined index of school autonomy in different decision-making areas, Ammermüller (2005) provides evidence that the impact of high parental commitment to their children�s education on their children�s actual achievement is greater when schools are more autonomous, suggesting that school autonomy may increase parents� chances to influence their child�s educational achievement. However, he does not find an association between school autonomy and the impact of rural versus urban location of schools, and he does not report results on differential effects of autonomy on children with different SES.
Wößmann, Lüdemann, Schütz, and West (2007) found that average achievement is higher where schools have autonomy in hiring decisions, but not in formulating their budget. But the autonomy effects depend strongly on whether accountability policies are in place: The effect of school autonomy over the budget, over salaries, and over course contents is more beneficial in systems with external exit exams. In the following, we consider the effects of these different forms of autonomy on equality of educational opportunity by family SES.
4.2 New Results
Table 4 reports the main and interaction effects of five different forms of school autonomy on student achievement and on equality of educational opportunity in PISA 2003. Specification (1) displays the results for the model without country fixed effects, which therefore is also able to determine the main effects of the autonomy variables on average student achievement. Specification (2) presents the estimates for the model with country fixed effects, where main effects cannot be identified. Both regressions include the same institutional variables controlling for the effects of accountability and choice as the basic model presented in Chapter 2.

EDU/WKP(2007)9
26
Table 4: Autonomy
Main effect Interaction with ESCS
Interaction with ESCS
(1) (2) Autonomy in formulating budget -35.144* -4.222** 0.202 (20.181)a (2.104) (1.884) School influence on staffing decisions 25.705 -2.810* -3.980*** (16.911)a (1.560) (1.423) Autonomy in hiring teachers 17.164 17.231*** 15.232*** (19.501)a (1.814) (1.672) Autonomy in establishing starting salaries -6.418 4.122** 0.587 (18.037)a (1.960) (1.791) Autonomy in determining course content -0.223 -7.958*** -3.306* (23.814)a (2.282) (1.964) ESCS 29.559*** � 29.046*** (0.396) (0.365)b Country fixed effects no yes Students 181,469 181,469 Schools (clustering units) 6,912 6,912 Countries 27 27 R2 0.321 0.354 Dependent variable: PISA 2003 international mathematics test score. ESCS = PISA index of economic, social, and cultural status. Sample: OECD countries (without France, Mexico, and Turkey). Least-squares regressions weighted by students� sampling probability. Controls include: external exit exams, private operation, government funding, years since first tracking, interaction terms between these institutional variables and ESCS, 15 student characteristics, 9 measures of school location and resources, expenditure per student, GDP per capita, imputation dummies, and interaction terms between imputation dummies and the variables. Robust standard errors adjusted for clustering at the school level in parentheses. Significance level (based on clustering-robust standard errors): *** 1 percent, ** 5 percent, *
10 percent. a Clustering of standard errors at the country level. b Main effect of ESCS.
The results in the first column of specification (1) confirm findings on the effects of autonomy on student achievement by Wößmann, Lüdemann, Schütz, and West (2007). Autonomy in budget formulation is significantly negatively related to student achievement, while school influence on staffing decisions seems to be positively related to achievement (although the effect does not reach statistical significance in this specification). None of the other autonomy variables aggregated to the country level (autonomy in hiring teachers, autonomy in establishing starting salaries, and autonomy in determining course content) shows a significant effect on average student achievement. However, all of the autonomy variables show a significant association with equity in specification (1) that does not include country fixed effects. Two of the significant interactions are not robust to the inclusion of country fixed effects in specification (2), though, which requires the least restrictive assumptions on the model.
The interaction effect between autonomy in formulating the budget and ESCS is not statistically significantly different from zero in specification (2) with country fixed effects. While this interaction proves very sensitive to the specific model specification as long as no country fixed are included (being positive in the basic model of Table 1 and negative once additional autonomy measures are included in specification (1) of Table 4), the preferred specification with country fixed effects suggests that autonomy in formulating the school budget is not significantly associated with equality of opportunity.

EDU/WKP(2007)9
27
The coefficient on the interaction term between ESCS and the autonomy variable indicating that schools have a direct influence on decision making about staffing is significantly negative in both the model with and without country fixed effects. At the same time, the interaction between ESCS and autonomy in hiring teachers is significantly positive. This difference in results on the two measures of personnel autonomy may be due to the fact that they measure somewhat different aspects of personnel autonomy. The first measure asks about staff in general, while the second asks specifically about teachers. Perhaps more importantly, the measure of school influence on staffing decisions does not exclude the possibility that other bodies outside the school also influence staffing decisions, while the measure of autonomy in hiring teachers explicitly excludes that outside bodies have main responsibility.
Our findings suggest that equity is enhanced when schools have some influence on staffing decisions, but that it is reduced when schools have full autonomy in hiring teachers. That is, equality of educational opportunity seems to be furthered by allowing schools to take part in personnel decisions, but it seems to be harmed when these decisions are completely left to the schools. However, as in the case of internal teacher monitoring by principals discussed in Chapter 3, there is also the possibility that the positive interaction between SES and the share of schools with hiring autonomy says more about the type of students that schools with full autonomy in hiring teachers cater for, rather than about any direct effect of autonomy on equity.
The fourth autonomy variable included in the model of Table 4 measures autonomy in establishing starting salaries. In the model with country fixed effects, the interaction term between salary autonomy and SES is not statistically significant, which suggests that autonomy in establishing starting salaries is not significantly related to equality of educational opportunity.
Autonomy in determining course content is positively associated with equality of educational opportunity. Its interaction with SES is negative in both the regression with and without country fixed effects. At the same time, it is unrelated to average student achievement in our specification (1) model. Therefore, at least in the presence of external exams (which is controlled for in the model), giving more autonomy in the choice of content is equity-enhancing and does not have negative effects on efficiency.
In sum, some of the associations between school autonomy and equity prove sensitive to the specific model used. In our preferred model, however, equality of opportunity is lower in countries where more schools have full autonomy in hiring teachers. This negative effect of personnel autonomy on equity is attenuated (but not eliminated) by the fact that equality of opportunity is higher in countries where more schools have some influence on staffing decisions. Equality of opportunity is also higher in countries where more schools have autonomy in determining course content. Autonomy in formulating the budget and autonomy in establishing starting salaries do not show a significant association with the equity of student achievement. It should be borne in mind, though, that in our models of country-level institutional measures, the limited degrees of statistical freedom due to the restricted number of country observations does not allow us to analyze the possibility that the effects of school autonomy may depend on the extent of accountability, which proved to be an important aspect in the study of effects on the level of student achievement by Wößmann, Lüdemann, Schütz, and West (2007).

EDU/WKP(2007)9
28
5. CHOICE
This chapter examines the effects of choice within schooling systems on the equality of educational opportunity. We first discuss some background, including previous international evidence in the literature. We then present new results using the PISA 2003 database.
5.1 Background
The theoretical case on the effect of choice on equity is hotly debated. In general, issues of implementation seem crucial when choice is introduced in schooling. Without proper safeguards, choice and competition may reduce equity by increasing segregation, inducing cream-skimming, and neglecting disadvantaged students (e.g., Ladd 2002; Cullen, Jacob, and Levitt 2005; Burgess, McConnell, Propper, and Wilson 2007). By contrast, simulation studies by Nechyba (2000) show that a voucher system that provides choice for poor families can actually improve equity, among others by integrating neighborhoods. This is even more so when voucher choices are designed to explicitly target disadvantaged families. In particular, because existing systems already substantially segregated, introducing choice can decrease segregation due to mobility, and because existing schools for low-SES students are often of bad quality, providing them with choice can help them enter better schools. A lot depends on the specific design and implementation of school choice; measures such as the flow of information to parents and regulatory and financial frameworks and incentives can be devised to encourage socio-economic integration (cf. Betts and Loveless 2005).
The existing evidence on the effects of choice on equity from previous international student achievement tests focuses on the effects of private operation and government funding of schools. Based on data from TIMSS and TIMSS-Repeat, the results of Schütz, Ursprung, and Wößmann (2005) indicate that private operation is associated with higher equality of opportunity, while private funding is associated with lower equality of opportunity. Using PISA 2000 data, Ammermüller (2005) finds a positive association between private operation and inequality, which is likely to be due to the neglect of effects of the source of funding in the model specification, though.
In terms of efficiency, Wößmann, Lüdemann, Schütz, and West (2007) present effects of various measures of school choice on the level of student achievement. A higher share of privately operated schools is found to increase average student achievement, partly due to positive effects of private competition on the performance of public schools. At the same time, the results show that a higher share of government funding increases student achievement. In addition, a larger difference in the share of government funding between public and private schools is shown to decrease average achievement. Two proxies for choice among public schools � the share of students not attending their school because it is the local school and the share of students attending their school because they deem it better than alternatives � are not associated with higher student achievement on average across countries, although micro evidence reveals that measures of public school choice are associated with better performance in urban areas where there are schools to choose from.
5.2 New Results
Our basic model in Table 1 reports the effects of private operation on average student achievement and equity while controlling for the share of funding that comes from government sources. The results
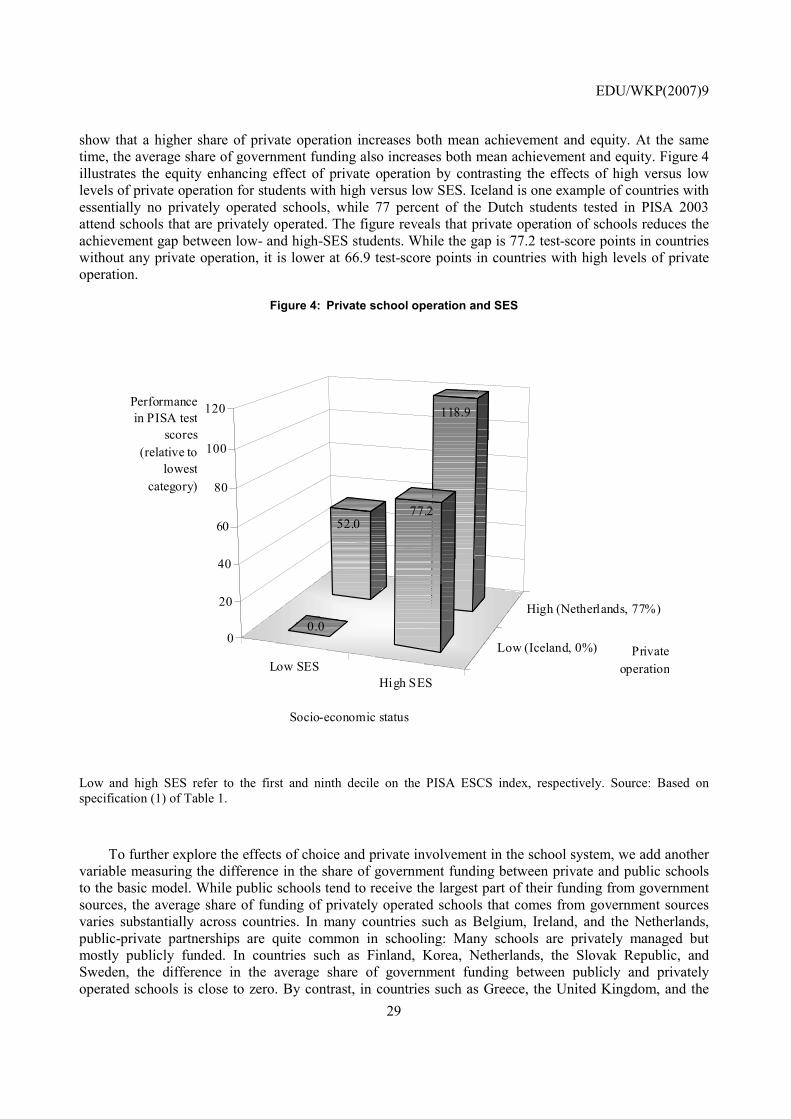
EDU/WKP(2007)9
29
show that a higher share of private operation increases both mean achievement and equity. At the same time, the average share of government funding also increases both mean achievement and equity. Figure 4 illustrates the equity enhancing effect of private operation by contrasting the effects of high versus low levels of private operation for students with high versus low SES. Iceland is one example of countries with essentially no privately operated schools, while 77 percent of the Dutch students tested in PISA 2003 attend schools that are privately operated. The figure reveals that private operation of schools reduces the achievement gap between low- and high-SES students. While the gap is 77.2 test-score points in countries without any private operation, it is lower at 66.9 test-score points in countries with high levels of private operation.
Figure 4: Private school operation and SES
Low SESHigh SES
Low (Iceland, 0%)
High (Netherlands, 77%)
52.0
118.9
0.0
77.2
0
20
40
60
80
100
120
Private operation
Socio-economic status
Performance in PISA test
scores (relative to
lowest category)
Low and high SES refer to the first and ninth decile on the PISA ESCS index, respectively. Source: Based on specification (1) of Table 1.
To further explore the effects of choice and private involvement in the school system, we add another variable measuring the difference in the share of government funding between private and public schools to the basic model. While public schools tend to receive the largest part of their funding from government sources, the average share of funding of privately operated schools that comes from government sources varies substantially across countries. In many countries such as Belgium, Ireland, and the Netherlands, public-private partnerships are quite common in schooling: Many schools are privately managed but mostly publicly funded. In countries such as Finland, Korea, Netherlands, the Slovak Republic, and Sweden, the difference in the average share of government funding between publicly and privately operated schools is close to zero. By contrast, in countries such as Greece, the United Kingdom, and the
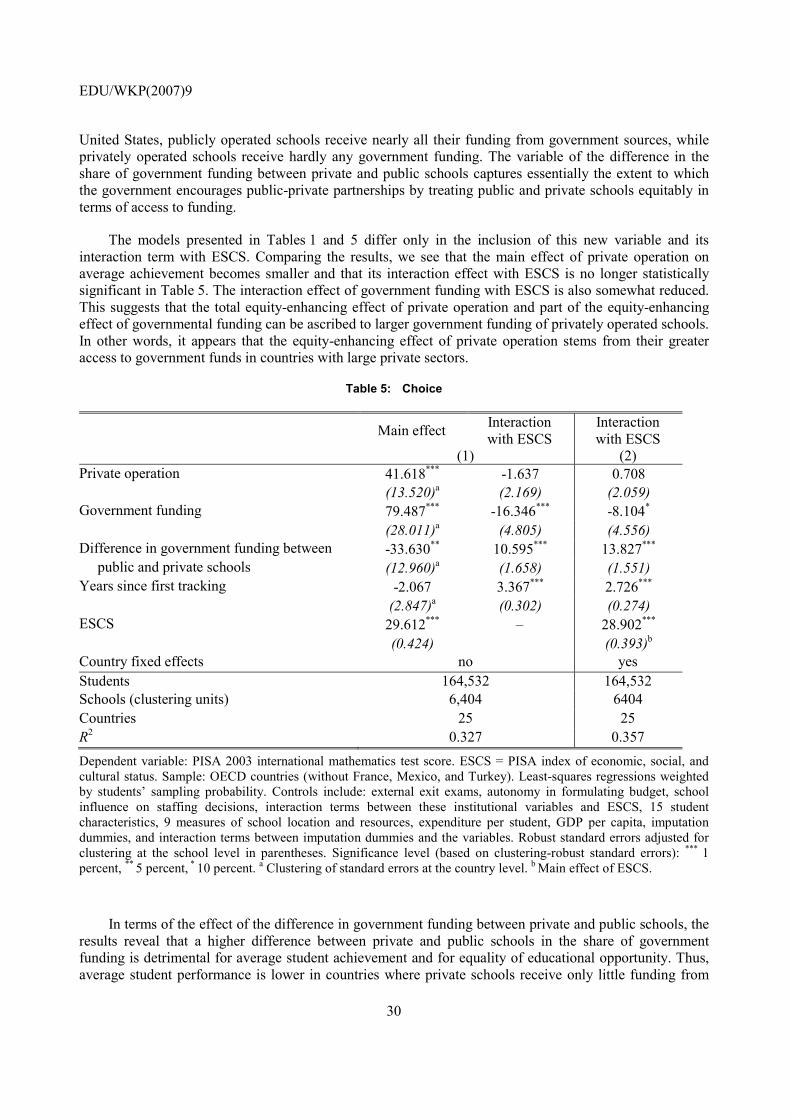
EDU/WKP(2007)9
30
United States, publicly operated schools receive nearly all their funding from government sources, while privately operated schools receive hardly any government funding. The variable of the difference in the share of government funding between private and public schools captures essentially the extent to which the government encourages public-private partnerships by treating public and private schools equitably in terms of access to funding.
The models presented in Tables 1 and 5 differ only in the inclusion of this new variable and its interaction term with ESCS. Comparing the results, we see that the main effect of private operation on average achievement becomes smaller and that its interaction effect with ESCS is no longer statistically significant in Table 5. The interaction effect of government funding with ESCS is also somewhat reduced. This suggests that the total equity-enhancing effect of private operation and part of the equity-enhancing effect of governmental funding can be ascribed to larger government funding of privately operated schools. In other words, it appears that the equity-enhancing effect of private operation stems from their greater access to government funds in countries with large private sectors.
Table 5: Choice
Main effect Interaction with ESCS
Interaction with ESCS
(1) (2) Private operation 41.618*** -1.637 0.708 (13.520)a (2.169) (2.059) Government funding 79.487*** -16.346*** -8.104* (28.011)a (4.805) (4.556) Difference in government funding between -33.630** 10.595*** 13.827*** public and private schools (12.960)a (1.658) (1.551) Years since first tracking -2.067 3.367*** 2.726*** (2.847)a (0.302) (0.274) ESCS 29.612*** � 28.902*** (0.424) (0.393)b Country fixed effects no yes Students 164,532 164,532 Schools (clustering units) 6,404 6404 Countries 25 25 R2 0.327 0.357 Dependent variable: PISA 2003 international mathematics test score. ESCS = PISA index of economic, social, and cultural status. Sample: OECD countries (without France, Mexico, and Turkey). Least-squares regressions weighted by students� sampling probability. Controls include: external exit exams, autonomy in formulating budget, school influence on staffing decisions, interaction terms between these institutional variables and ESCS, 15 student characteristics, 9 measures of school location and resources, expenditure per student, GDP per capita, imputation dummies, and interaction terms between imputation dummies and the variables. Robust standard errors adjusted for clustering at the school level in parentheses. Significance level (based on clustering-robust standard errors): *** 1 percent, ** 5 percent, * 10 percent. a Clustering of standard errors at the country level. b Main effect of ESCS.
In terms of the effect of the difference in government funding between private and public schools, the results reveal that a higher difference between private and public schools in the share of government funding is detrimental for average student achievement and for equality of educational opportunity. Thus, average student performance is lower in countries where private schools receive only little funding from

EDU/WKP(2007)9
31
the government. At the same time equality of educational opportunity is hindered by a large difference in governmental funding between private and public schools. It seems that government funding of private schools benefits in particular students with low SES.
This is depicted graphically in Figure 5. The lowest difference, in Korea, is actually slightly negative in the PISA 2003 sample, i.e. privately operated schools report receiving a slightly larger share of government funding. The difference is virtually zero in several other countries such as Finland, the Netherlands, the Slovak Republic, and Sweden. The highest difference is 91 percentage points in the United States, where private schools receive virtually no funding from government sources. Figure 5 shows that while both low- and high-SES students benefit from a smaller difference in government funding between private and public schools, low-SES students gain substantially more: Low-SES students gain 45.8 test-score points whereas high-SES students gain only 19.3 test-score points. Thus, the difference in achievement between high- and low-SES students becomes significantly smaller as the difference in government funding between private and public schools is reduced.
Figure 5: Difference in government funding between private and public schools and SES
Low SESHigh SES
High (USA, 91%)
Low (Korea, -8%)
45.8
109.6
0.0
90.3
0
20
40
60
80
100
120
Difference in government funding between public
and private schoolsSocio-economic status
Performance in PISA test
scores (relative to lowest category)
Low and high SES refer to the first and ninth decile on the PISA ESCS index, respectively. Source: Based on specification (1) of Table 5.
We have also experimented with the two proxies for public school choice at our disposal. The first one is the share of students in a country who report attending their school because it is the local school for students who live in their area, which may proxy for the fact that students are required to attend the school in their local catchment area. The second one is the share of students in a country who report attending their school because it is known to be a better school than others in the area, which may proxy for exerted

EDU/WKP(2007)9
32
choice among schools. Both proxies have substantial caveats, and they do not enter significantly in efficiency models (cf. Wößmann, Lüdemann, Schütz, and West 2007 for a discussion). The same is true when adding these two measures to the basic equity model with country fixed effects in this report: Neither the share of students attending their school because it is local nor the share of students attending their school because it is better are statistically significantly related to equality of educational opportunity.
When adding the two proxies of public school choice to the model of Table 5, the coefficient on the interaction between SES and the share of students in a country who attend their school because it is known to be better than alternatives actually turns weakly statistically significantly negative, indicating that effective choice among public schools may also be beneficial for equity. More persuasive results on the effects of public school choice on levels of student achievement were derived in Wößmann, Lüdemann, Schütz, and West (2007) by comparing the effects of micro measures of the two proxies between rural and urban areas, a specification that we refrain from in this report which restricts itself to country-level institutional measures to circumvent possible bias of the equity results from self-selection of students.
5.3 Choice-based Systems vs. Selection-based Systems: Early Tracking
Table 5 also reports the effects of tracking on average achievement and on equity. We define tracking as the systematic selection of students into schools with different curricula based on some measure of their (perceived) ability. The timing and extent of tracking varies widely across the OECD countries. While many countries like Sweden do not track their students at all during the years for which schooling is compulsory, Germany and Austria first track their students at age 10. Our measure of tracking is the number of years that have passed since the first stage of selection when students are 15 years old (the age at which they participated in the PISA 2003 study). Thus, the tracking variable will be zero if no selection has taken place by age 15 (in countries like Sweden), and it will be 15 minus the age of students at the time of the first selection in countries that do employ tracking � for example, the variable takes on a value of 5 in Germany and Austria.
Supporters of tracking regimes typically argue that instruction is more efficient in tracked systems because classrooms are more homogenous, which would lead to higher average achievement in tracked systems. However, critics of tracking argue that it harms low-ability children by depriving them of the positive influence of more able peers. Moreover, because the achievement tests on which selection is based provide a noisy signal of the students� true abilities, many students are likely to end up in the wrong tracks. Because high-SES parents tend to be particularly keen to place their children in high-track schools, this may mean that early tracking disadvantages low-SES students. In addition, when track decisions are made at an early stage, children who did not have much educational exposure at home have little time to be exposed to the educational environments of schools before tracking decisions are taken, whereas they would have more time to strive and prove their educational potential when the tracking decision were made later. Children from low-SES backgrounds may therefore be especially at a disadvantage in systems of early tracking. Previous cross-country evidence corroborates such an inequity-enhancing effect of tracking (Schütz, Ursprung, and Wößmann 2005; Hanushek and Wößmann 2006; Ammermüller 2005).
The results presented in Table 5 are inconsistent with the claims of supporters of tracking yet provide strong additional support for the concerns voiced by critics. Early tracking does not seem to influence average student achievement in OECD countries, but it does significantly reduce equality of educational opportunity. Figure 6 presents the results graphically. In countries where no selection has taken place up to age 15, the difference in performance between low- and high-SES students is 65.0 test-score points (95.8 � 30.8). By contrast, in countries like Austria and Germany where selection has taken place five years prior to the PISA testing age of 15, the difference in achievement between high- and low-SES children is 107.7 test-score points. Thus our analysis confirms the finding of previous studies that tracking has harmful

EDU/WKP(2007)9
33
effects for low-SES students while providing no benefits in terms of average student achievement. While low-SES students lose substantially from early tracking, only the highest-SES students seem to gain a little.
Figure 6: Tracking and SES
Low SESHigh SES
None
Five years0.0
107.7
30.8
95.8
0
20
40
60
80
100
120
Years since separation
Socio-economic status
Performance in PISA test
scores (relative to
lowest category)
Low and high SES refer to the first and ninth decile on the PISA ESCS index, respectively. Source: Based on specification (1) of Table 5.
These results highlight the importance of distinguishing ability-based selection from school choice. Choice refers to the ability of parents to choose from among different schools the one that is best for their children. In contrast, in tracked systems students are selected into different types of schools. While various forms of choice have been repeatedly shown to improve both the academic achievement of students and the equality of educational opportunity, the practice of selective tracking has been shown to be unrelated to average student achievement and strongly detrimental for equality of educational opportunity.9
In sum, larger shares of privately operated schools are beneficial for the equity of student achievement as long as they are treated in the same way as publicly operated schools in terms of government funding. Government (as opposed to private) funding has a general equity-enhancing effect, but this is particularly reinforced when government funding is not differentiated between private and public schools. Choice among publicly funded but privately operated schools is particularly beneficial for low-SES students. The available proxies of public school choice seem to be neutral with respect to equality of opportunity. In contrast to the beneficial equity effects of choice-based systems, selection-based systems of early tracking are detrimental for equality of opportunity.
9 In addition to the cross-country evidence, Wößmann (2007) provides evidence from across German states
corroborating the equity-enhancing effects of private school operation and later tracking.

EDU/WKP(2007)9
34
6. CONCLUSION
This report presents new evidence on the association between school accountability, autonomy, and choice and the equity of educational achievement as measured by performance on the international PISA 2003 student achievement test. In the midst of an ongoing wave of market-oriented reforms in school systems around the globe, observers in many countries worry about the implications of these strategies for the equality of opportunity essential for open societies. Critics of market-oriented reforms contend that additional choice and competition in schooling in particular are likely to reduce equity. Quite to the contrary, our results suggest that the additional choice resulting from government funding for privately operated schools enhances the equality of educational opportunity, benefiting low-SES students even more than high-SES students.
More generally, the results presented above suggest that rather than harming disadvantaged students, accountability, autonomy, and choice are tides that lift all boats. In some cases � in particular, external exams, internal teacher monitoring, and school autonomy in hiring teachers � the tides seem to lift the performance of high-SES students more than that of low-SES students, but even the latter score higher where these incentive-based policies are in place. In other cases, low-SES students profit more from accountability, autonomy, and choice than high-SES students. Policies that have additional benefits for low-SES students include the regular use of teachers� subjective ratings to assess students, school influence on staffing decisions, school autonomy in determining course content, private operation, government funding, and more equalized government funding between private and public schools. In each of these areas, market-oriented reforms simultaneously advance both efficiency and equity.
The remaining measures of accountability, autonomy, and choice analyzed in this report show no differential effect for children with different socio-economic backgrounds. They affect low-SES students in the same way they affect high-SES students. The institutions we find to be neutral with respect to equity include the monitoring of teacher lessons by external inspectors; the regular use of standardized tests; the use of assessments to make decisions on student retention or promotion, to group students, to monitor school progress, or to compare the school to district or national performance or to other schools; autonomy in budget formulation and in establishing starting salaries; and the two available proxies for public school choice.
The beneficial consequences of choice among privately operated schools for equity reveal that choice-based systems function quite differently from more traditional selection-based systems. Specifically, systems that track their students into different types of schools at an early age substantially reduce the equality of educational opportunity for children with different family backgrounds.
The most important caveat to the analyses presented in this report is that they draw on a limited number of observations at the country level. We measure all institutional variables at the country level in order to circumvent the problem of self-selection within countries. While this approach enhances the reliability of our findings, it also precludes more detailed analyses, for example of ways in which accountability, autonomy, and choice policies may interact with each other to influence equity.
The bottom line from our analyses, however, is that there is not a single case where a policy designed to introduce accountability, autonomy, or choice into schooling benefits high-SES students to the detriment of low-SES students, i.e. where the former gain but the latter suffer. This suggests that fears of equity-
EDU/WKP(2007)9
35
efficiency tradeoffs and cream-skimming in implementing market-oriented educational reforms are not merely exaggerated, but are largely mistaken. International evidence on the institutional determinants of efficiency and equity in schooling confirms that more efficient school systems can also be equitable if schools are induced to challenge all students to reach their full potential (cf. Arrow et al. 2000; Wößmann and Peterson 2007).
EDU/WKP(2007)9
36
APPENDIX A: DATABASE AND DESCRIPTIVE STATISTICS
This Appendix describes the PISA 2003 database and its measures of cognitive skills, how we used the PISA data to construct a student-level micro database for the estimation, details of the available measures of school accountability, autonomy, and choice, and an overview of the extensive background controls included in the analysis.
A.1 The PISA 2003 Database and Its Measures of Cognitive Skills
The 2003 round of the OECD Programme for International Student Assessment (PISA 2003) was conducted in 41 developed and emerging countries, 30 of which are OECD countries.10 PISA 2003 assessed the mathematical, scientific, and reading literacy as well as the problem solving skills of the student population in each participating country. The term �literacy� signifies that not only the knowledge of the students in each of the three domains, for example based on national curricula, is assessed but also their ability to use the acquired knowledge to meet real-life challenges. As in the first PISA study conducted in 2000, the target population was the 15-year-old students in each country, regardless of the grade they currently attended. Thus, in most of the countries assessed, the target population comprises young people near the end of their compulsory schooling, independent of how many years of schooling are foreseen for 15-year-olds by the structure of the national school systems. Table A.2 reports the countries participating in the PISA 2003 study.
The PISA sampling procedure ensured that a representative sample of the target population was tested in each country. Most countries employed a two-stage sampling technique. The first stage drew a (usually stratified) random sample of schools in which 15-year-old students were enrolled. In most countries, the probability of the schools to be selected was proportional to their size as measured by the estimated numbers of 15-year-old students enrolled in the school. The second stage randomly sampled 35 of the 15-year-old students in each of these schools, with each 15-year-old student in a school having equal selection probability. In schools with less than 35 students in the targeted age group, all of these students were selected into the sample. Generally, a minimum of 150 schools had to be sampled (or all schools if there were less than 150 schools in a country) and a minimum of 4,500 students had to be assessed in each country. The final sample size varied considerably between the participating countries, ranging 3,350 students in 129 schools in Iceland and 29,983 students in 1,124 schools in Mexico (Luxembourg tested all 3,923 target-aged students in all its 29 applicable schools).
The performance tests were paper and pencil tests, lasting a total of two hours for each student. Test items included both multiple-choice items and open ended questions. The PISA tests were constructed to test a range of relevant skills and competencies that reflected how well young adults are prepared to analyze, reason, and communicate their ideas effectively. Each subject was tested using a broad sample of tasks with differing levels of difficulty to represent a coherent and comprehensive indicator of the continuum of students� abilities. The main focus of the PISA 2003 study was on mathematical literacy, with about 70 per cent of the testing time devoted to this domain. The test items were presented to the
10 For detailed information on the PISA study and its database, see OECD (2004, 2005a, 2005b) and the
PISA homepage at http://www.pisa.oecd.org.
EDU/WKP(2007)9
37
students in the form of test booklets that consisted of different clusters of test items. Each student was given one of 13 different test booklets that varied in the composition of the test items representing the four tested domains. PISA used item response theory scaling and calculated five plausible values for proficiency in each of the tested domains for each participating student. The performance in each domain was mapped on a scale with an international mean of 500 and a standard deviation of 100 test-score points across the OECD countries.
A.2 Construction of a Student-Level Micro Database for the Estimation
PISA 2003 does not only provide achievement data for representative samples of students in the participating countries but also a rich array of background information on each student as well as on his or her school. In separate background questionnaires, students were asked to provide information on their personal characteristics and family backgrounds, and school principals provided information on their schools� resource endowments and institutional settings.
Combining the available data, we constructed a dataset containing 181,469 students in 27 OECD countries. Unfortunately, we had to discard three OECD countries from our sample. France had to be dropped from the sample because no school-level background information was provided for any of the schools sampled in this country. We had also to discard Mexico and Turkey from the sample because their average ESCS was one standard deviation below the international mean on the ESCS index, a central variable in our equity analysis, which might have distorted the estimations of effects.
The dataset combines students� test scores in mathematical literacy and the other testing domains with students� characteristics, family-background data, school-related variables of resource availability, and school-level measures of accountability, autonomy, and choice. For estimation purposes, a variety of qualitative variables were transformed into dummy variables. We imputed missing observations on the questionnaire items with advanced micro-econometric techniques (cf. Appendix B.3 for the imputation technique and how the imputations are controlled for in the actual estimations).
We combine the rich PISA data at the student and school level with additional country-level data. GDP per capita in 2003, measured in purchasing power parities (PPP), is provided by version 6.2 of the Penn World Tables (Heston, Summers, and Aten 2002). Cumulative educational expenditure per student between age 6 and 15 in 2002, measured in PPP are provided in OECD (2006) and other versions of the OECD�s Education at a Glance.11 The number of years spent in separate school systems after the occurrence of the first selection in the education process is taken from OECD (2006). The data on the existence of curriculum-based external exit exams is an updated version of the data used by Bishop (2006), Wößmann (2003b), and Fuchs and Wößmann (2007), which is collected from reviews of comparative-education studies and educational encyclopedia, interviews with representatives of the national education systems, government documents, and background papers.
Table A.1 reports international descriptive statistics for all the variables employed in this report. It also includes information on the amount of original versus missing data for each variable. Table A.2 presents country means of selected key variables for each participating country.
11 For the three countries with missing data in OECD (2006) or other versions of the OECD�s Education at a
Glance, we use comparable data for these countries based on information from the World Development Indicators of the World Bank and data from both sources for countries where both are available to predict the missing data for the three countries by ordinary least squares.

EDU/WKP(2007)9
38
A.3 Data on Accountability, Autonomy, and Choice
With the exception of the external exit exams, the measures of school accountability, autonomy, and choice are almost entirely taken from the school background questionnaires of the PISA 2003 study.
Measures of accountability include aspects of student testing, teacher monitoring, and school accountability. School principals report for different forms of assessment practices how often 15-year-old students are generally assessed in their school using each of these different forms of testing. We looked explicitly at the effects of three forms of assessments: assessments using teachers� judgmental ratings; assessments using teacher-developed tests; and assessments using standardized tests. Answer options range from never over 1 to 2 times a year and 3 to 5 times a year to monthly and more than once a month. As measures of regular student testing in a school, we use for each of the three forms of assessments an indicator of whether this kind of assessment is used at least monthly. School principals also report on whether assessments of 15-year-old students are used in their school for different purposes, including use to make decisions about students� retention or promotion; to group students for instructional purposes; to monitor the school�s progress from year to year; to compare the school to district or national performance; and to compare the school to other schools.12 In terms of teacher monitoring, principals report whether (a) principal or senior staff observations of lessons and whether (b) observation of classes by inspectors or other persons external to the school have been used during the last year to monitor the practice of mathematics teachers at their school.
Measures of school autonomy include responses of school principals to several items asking who has the main responsibility for different types of decisions regarding the management of the school. In particular, principals ticked whether any of the following was not a main responsibility of their school (as opposed to being a responsibility of either the school�s governing board, the principal, department heads, or teachers): formulating the school budget; selecting teachers for hire; establishing teachers� starting salaries; and determining course content.13 In addition, principals reported whether the school�s governing board exerts a direct influence on decision making about staffing in their school (with other non-exclusive answer possibilities including such bodies as regional education authorities, parent groups, and teacher groups, among others). We use this as a more general measure of autonomy in staffing decisions in addition to the measure of autonomy in hiring teachers.
Measures of school choice include the availability of private schools and the extent of governmental funding both overall and in private and public schools separately. Principals reported whether their schools is a public or a private school, where a public school was defined as �a school managed directly or indirectly by a public education authority, government agency, or governing board appointed by government or elected by public franchise�, while a private school was defined as �a school managed directly or indirectly by a non-government organization; e.g. a church, trade union, business, or other private institution.� Principals also reported about what percentage of their schools� total funding for a typical school year comes from government sources, including departments, local, regional, state, and national governments (as opposed to student fees or school charges paid by parents; contributions by benefactors, donations, bequests, sponsorships, and parent fund raising; and other sources). In addition,
12 Principals also report on whether assessments are used to inform parents about their child�s progress, but
with 97 percent replying positively, there is hardly any international variation in this variable. 13 There were also items on autonomy in firing teachers and in determining teachers� salary increases.
However, these two are extremely collinear with autonomy in hiring teachers and in establishing teachers� starting salaries, respectively, with cross-country correlations as high as 0.963 and 0.971, respectively. Therefore, only one autonomy variable each was used, and the results should be interpreted as capturing autonomy in the joint decision-making areas of hiring/firing teachers and determining starting salaries as well as salary increases, respectively.
EDU/WKP(2007)9
39
students were asked whether it were reasons why they attend the specific school (a) that this is the local school for students who live in this area, and (b) that this school is known to be a better school than others in the area. We use the former as an indicator of lack of parental choice among schools, and the latter as an indicator of exerted choice among schools. Finally, we measure the extent of tracking by the number of years spent in separate school systems after the occurrence of the first selection in the education process. Information for the construction of this variable was taken from OECD (2006).
A.4 Background Controls
Since PISA 2003 collected background information about the students, their families, and schools, it is possible to control for influencing factors at these levels. The 26 variables included as controls in the model are reported in Table C.1 (descriptive statistics are given in Table A.1). These include 15 measures of student characteristics, including student gender, student age, the age at which the student started primary education, a dummy indicating whether the student attended pre-primary education for more than one year,14 two dummies for grade repetition, a set of dummies representing the grade that the student currently attends, two indicators for the immigrant status of the student,15 and two indicators for the language spoken at home.16
The model includes 9 school-level measures of school location and resources: three indicators of the size of the community in which the school is located,17 the average class size in mathematics, two indicators of the availability of instructional material, instruction time in mathematics, and the shares of teachers in the school who are fully certified and who have a tertiary degree in pedagogy. In addition, the model includes the country-level variables GDP per capita and expenditure per student, as described above.
14 We also tested including an indicator for attending pre-primary education for one year or less, but the
coefficient estimate turned out to be not different from zero relative to no pre-primary attendance. 15 The immigrant status of the students was captured by the following categories: �native� students (those
students born in the country of assessment or who had at least one parent born in the country); �first generation� students (those born in the country of assessment but whose parent(s) were born in another country); and �non-native� students (those students born outside the country of assessment and whose parents were also born in another country). In the analysis, �native� students served as the residual category.
16. The language spoken at home most of the time was captured by the following four categories: �test language�; �other official national languages�; �other national dialects or languages�; and �other languages�. Only the latter two dummies were included in the analysis, with the first two serving as residual categories.
17 The coefficient estimates on location of the school in a small town (3,000 to 15,000 people) and in a town (15,000 to 100,000 people) turned out to be statistically non-distinguishable, so we combined these two categories into one.

EDU/WKP(2007)9
40
A.5 Tables of Descriptive Statistics Table A.1: Descriptive statistics of the international dataset
Incl. imputations Only original data Mean Std. Dev. Mean Std. Dev. Imputations
TEST SCORES Math 508.291 94.647 508.291 94.647 0.0% Science 506.781 102.225 506.781 102.225 0.0% Reading 501.443 95.805 501.443 95.805 0.0% ACCOUNTABILITY External exit exams In mathematics 0.661 0.661 0.0% In science 0.561 0.561 0.0% Assessments used to Decide about students� retention/promotion 0.777 0.781 6.8% Group students 0.467 0.466 3.5% Monitor the school�s progress from year to year 0.662 0.663 3.4% Compare school to district/national performance 0.469 0.469 3.4% Compare the school to other schools 0.399 0.400 3.7% Monitoring of teacher lessons By principal 0.591 0.591 3.5% By external inspectors 0.235 0.235 3.6% Teachers� subjective ratings used at least monthly 0.500 0.501 4.3% Teacher-developed tests used at least monthly 0.610 0.610 3.6% Standardized tests used at least monthly 0.049 0.049 4.4% AUTONOMY Autonomy in formulating budget 0.715 0.715 3.4% School influence on staffing decisions 0.409 0.408 3.7% Autonomy in hiring teachers 0.658 0.658 2.9% Autonomy in establishing starting salaries 0.255 0.255 3.4% Autonomy in determining course content 0.677 0.678 3.5% CHOICE Private operation (PISA) 0.185 0.182 5.9% Government funding 0.888 0.888 8.5% Diff. in gov. funding b/w public + private schools 0.343 0.343 0.0% STUDENT CHARACTERISTICS Female 0.498 0.498 0.0% Age (years) 15.776 0.290 15.776 0.290 0.0% Preprimary education (more than 1 year) 0.702 0.703 1.0% School starting age 5.992 0.836 5.999 0.867 9.9% Grade repetition in primary school 0.070 0.067 12.1% Grade repetition in secondary school 0.066 0.062 14.1% Grade 7th grade 0.004 0.004 0.1% 8th grade 0.043 0.043 0.1% 9th grade 0.369 0.368 0.1% 10th grade 0.532 0.532 0.1% 11th grade 0.051 0.051 0.1% 12th grade 0.001 0.001 0.1%
(continued on next page)

EDU/WKP(2007)9
41
Table A.1 (continued)
Incl. imputations Only original data Mean Std. Dev. Mean Std. Dev. Imputations
Immigration background Native student 0.911 0.911 1.3% First generation students 0.040 0.040 1.3% Non-native students 0.049 0.049 1.3% Language spoken at home Test language or other official national language 0.916 0.917 3.2% Other national dialect or language 0.035 0.034 3.2% None of above 0.049 0.049 3.2% FAMILY BACKGROUND Index of socio-economic & cultural status (ESCS) 0.002 1.007 0.002 1.007 0.0% SCHOOL LOCATION AND RESOURCES School�s community location Village or rural area (<3,000) 0.108 0.107 2.7% Town (3,000-100,000) 0.579 0.578 2.7% City (100,000-1,000,000) 0.211 0.211 2.7% Large city with > 1 million people 0.103 0.103 2.7% Class size (mathematics) 22.811 6.898 22.835 7.061 5.1% Shortage of instructional materials Not at all 0.398 0.397 3.2% Strongly 0.051 0.051 3.2% Instruction time (mathematics, minutes per week) 196.881 90.225 196.896 92.659 5.2% Teacher education (share at school) Fully certified teachers 0.911 0.178 0.910 0.191 13.6% Tertiary degree in pedagogy 0.640 0.321 0.656 0.377 31.8% GDP per capita (1,000 $) 24.211 8.187 24.211 8.187 0.0% Educational expenditure per student (1,000 $) 60.295 23.574 60.295 23.574 0.0% Years in separate school systems 1.185 1.798 1.185 1.798 0.0%
Sample: OECD countries (without France, Mexico, and Turkey). Number of observations in sample incl. imputations: 181,469 students. Mean: International mean (weighted by sampling probabilities). � Std. Dev.: International standard deviation (only for continuous variables). Imputations: Percentage of students with missing and thus imputed data, weighted by sampling probabilities.

EDU/WKP(2007)9
42
Table A.2: Country means of test scores, accountability, autonomy, and choice
TEST SCORES ESCS Years since first tracking
ACCOUNTABILITY Socio-economic status External exit exams Assessments for
Math Science Mean Std. Dev. Math Science promotion grouping monitoring school
comparing to district/nat.
comparing to other schools
Australia 525.02 526.47 0.15 0.88 0 0.81 0.81 0.62 0.78 0.76 0.55 0.39 Austria 506.85 492.80 -0.02 0.91 5 0.00 0.00 0.93 0.32 0.59 0.12 0.38 Belgium 534.54 512.90 0.07 1.01 3 0.00 0.00 0.99 0.20 0.38 0.10 0.07 Canada 536.40 522.24 0.40 0.89 0 0.51 0.51 0.95 0.72 0.79 0.70 0.53 Czech Republic 522.09 527.58 0.09 0.85 4 1.00 1.00 0.92 0.35 0.86 0.50 0.55 Denmark 514.45 475.30 0.13 0.92 0 1.00 1.00 0.04 0.14 0.08 0.06 0.03 Finland 544.49 547.87 0.18 0.89 0 1.00 1.00 0.95 0.17 0.65 0.56 0.35 Germany 512.60 512.92 0.08 1.06 5 0.44 0.44 0.96 0.36 0.44 0.21 0.17 Greece 444.89 480.95 -0.25 1.08 0 0.00 0.00 0.99 0.11 0.36 0.12 0.16 Hungary 490.49 504.31 -0.16 0.95 4 1.00 1.00 0.95 0.35 0.96 0.86 0.77 Iceland 515.30 495.15 0.65 0.87 0 1.00 0.00 0.15 0.56 0.88 0.84 0.66 Ireland 503.77 506.29 -0.17 0.95 0 1.00 1.00 0.44 0.78 0.50 0.17 0.09 Italy 465.85 486.53 -0.21 1.09 1 0.00 0.00 0.84 0.51 0.69 0.33 0.29 Japan 533.70 548.21 -0.17 0.78 0 1.00 1.00 0.90 0.45 0.48 0.18 0.12 Korea 541.85 538.66 -0.19 0.91 1 1.00 1.00 0.25 0.63 0.59 0.62 0.55 Luxembourg 494.01 483.75 0.11 1.17 2 1.00 1.00 1.00 0.30 0.26 0.22 0.10 Netherlands 543.84 529.38 0.02 0.92 3 1.00 1.00 0.97 0.89 0.63 0.63 0.47 New Zealand 526.07 523.64 0.14 0.97 0 1.00 1.00 0.78 0.74 0.96 0.87 0.74 Norway 496.25 485.99 0.56 0.84 0 1.00 0.30 � 0.38 0.68 0.64 0.47 Poland 490.16 497.93 -0.30 0.88 0 1.00 1.00 0.84 0.33 0.97 0.71 0.62 Portugal 466.70 469.10 -0.76 1.35 0 0.00 0.00 0.97 0.26 0.78 0.33 0.22 Slovak Republic 498.80 494.93 -0.18 0.88 4 1.00 1.00 0.97 0.55 0.95 0.46 0.48 Spain 485.76 487.72 -0.40 1.07 0 0.00 0.00 1.00 0.48 0.69 0.18 0.17 Sweden 510.47 507.14 0.18 0.94 0 1.00 0.00 0.39 0.45 0.85 0.73 0.65 Switzerland 526.63 513.67 -0.15 0.90 0 0.00 0.00 0.95 0.28 0.25 0.19 0.16 United Kingdom 508.37 519.13 0.04 0.96 0 1.00 1.00 0.68 0.94 0.97 0.89 0.84 United States 484.50 492.52 0.23 0.98 0 0.09 0.09 0.76 0.66 0.93 0.91 0.80 (continued on next page)

EDU/WKP(2007)9
43
Table A.2 (continued)
ACCOUNTABILITY AUTONOMY CHOICE Monitor. teacher lessons Teacher
ratings (monthly)
Teacher tests
(monthly)
Standardized tests
(monthly)
In formulating
budget
In staffing
decisions
In hiring teachers
In establish. starting salaries
In determin. course content
Private operation
Governmentfunding
Differ. in governm. funding by
principal by external inspectors
Australia 0.634 0.078 0.52 0.69 0.02 0.89 0.21 0.62 0.20 0.79 0.40 0.71 � Austria 0.779 0.371 0.76 0.43 0.01 0.14 0.03 0.22 0.00 0.61 0.08 � � Belgium 0.578 0.475 0.63 0.76 0.04 0.81 0.62 0.83 0.00 0.55 0.69 0.89 0.12 Canada 0.869 0.101 0.48 0.91 0.02 0.75 0.59 0.81 0.32 0.45 0.07 0.92 0.41 Czech Republic 0.993 0.315 0.57 0.63 0.02 0.83 0.05 0.98 0.69 0.75 0.07 0.95 0.33 Denmark 0.630 0.113 0.03 0.18 0.02 0.91 0.74 0.97 0.21 0.76 0.22 0.93 0.22 Finland 0.344 0.038 0.20 0.48 0.00 0.80 0.88 0.70 0.10 0.92 0.07 1.00 0.02 Germany 0.694 0.257 0.72 0.62 0.02 0.09 0.28 0.18 0.02 0.48 0.08 0.96 0.20 Greece 0.072 0.161 0.36 0.41 0.19 1.00 0.09 0.04 0.00 0.00 0.04 0.88 0.90 Hungary 0.958 0.260 0.72 0.75 0.02 0.87 0.79 1.00 0.38 0.80 0.11 0.91 0.15 Iceland 0.467 0.018 0.71 0.57 0.00 0.94 0.36 1.00 0.19 0.86 0.00 1.00 0.55 Ireland 0.066 0.047 0.40 0.31 0.03 0.77 0.52 0.86 0.04 0.38 0.61 0.93 0.08 Italy 0.161 0.012 0.71 0.67 0.17 0.26 0.16 0.07 0.02 0.84 0.05 0.72 0.61 Japan 0.559 0.151 0.20 0.10 0.03 0.47 0.22 0.29 0.27 1.00 0.27 0.74 0.57 Korea 0.901 0.619 0.31 0.01 0.04 0.92 0.26 0.33 0.15 0.99 0.56 0.52 -0.08 Luxembourg 0.422 0.073 0.28 0.74 0.02 0.05 0.51 0.00 0.05 0.05 0.14 0.97 0.10 Netherlands 0.584 0.333 0.18 0.92 0.13 1.00 0.71 1.00 0.88 0.97 0.77 0.96 -0.01 New Zealand 0.943 0.524 0.37 0.77 0.22 0.99 0.73 1.00 0.19 0.94 0.05 0.78 0.66 Norway 0.259 0.069 0.45 0.85 0.00 0.73 0.10 0.64 0.01 0.48 0.01 1.00 0.11 Poland 0.974 0.137 0.05 0.49 0.04 0.30 0.02 1.00 0.21 1.00 0.01 0.96 0.61 Portugal 0.049 0.096 0.94 0.74 0.00 0.83 0.28 0.08 0.01 0.36 0.06 0.84 0.21 Slovak Republic 0.978 0.246 0.74 0.59 0.03 0.84 0.23 1.00 0.60 0.65 0.12 0.93 -0.01 Spain 0.148 0.141 0.60 0.82 0.13 0.86 0.18 0.36 0.06 0.65 0.38 0.86 0.29 Sweden 0.584 0.157 0.78 0.83 0.05 0.88 0.11 1.00 0.71 0.92 0.04 1.00 0.01 Switzerland 0.418 0.588 0.65 0.89 0.02 0.64 0.81 0.93 0.13 0.39 0.06 0.95 0.77 United Kingdom 0.913 0.611 0.35 0.39 0.01 0.90 0.88 0.99 0.80 0.94 0.06 0.93 0.85 United States 0.997 0.372 0.87 0.99 0.02 0.85 0.77 0.98 0.69 0.81 0.06 0.88 0.91 Country means, based on non-imputed data for each variable, weighted by sampling probabilities. ESCS = PISA index of Economic, Social and Cultural Status. Institutional measures are shares within each country (in percent). � = not available.

EDU/WKP(2007)9
44
APPENDIX B: ECONOMETRIC MODELING
The basic setup of the empirical model, estimating international education production functions by cross-country student-level multiple regressions, and the estimation of interaction effects is described in Sections 2.1 and 2.2 in the main text. This Appendix discusses details of the econometric model, including the potential for bias when using cross-country data in cross-sectional analyses, econometric complications resulting from the hierarchical data structure such as the multi-level structure of the error term and the use of sampling weights, and model implications of data imputation.
B.1 Cross-Country Data and Potential Bias
The econometric estimation of the PISA dataset is restricted by its cross-sectional nature, which does not allow for panel or value-added estimations (cf., e.g., Hanushek 2002; Todd and Wolpin 2003). Because of unobserved student abilities, cross-sectional analyses can give rise to omitted variable bias when the variables of interest are correlated with the unobserved characteristics. In this report, we hope to minimize such biases due to unobserved student heterogeneity by including a huge set of observed abilities, characteristics, and institutions which reduce potential biases. Estimates based on cross-sectional data will be unbiased under the conditions that the explanatory variables of interest are unrelated to features that still remain unobserved, that they are exogenous to the dependent variable, and that they and their impact on the dependent variable do not vary over time. We view the variables of student characteristics and school location and resources included in our model as control variables which do not necessarily lend themselves to causal interpretation.
Many of the institutional features of an education system may be reasonably assumed to be exogenous to individual students� performance. The cross-country nature of the data allows the systematic utilization of country differences in institutional settings of the educational systems, which would be neglected in within-country specifications. At the country level, explanatory variables are included to control for country differences with respect to educational expenditure and the development stage of a country. However, a caveat applies here in that a country�s institutions may be related to unobserved, e.g. cultural, factors which in turn may be related to student performance. To the extent that this may be an important issue, caution should prevail in drawing causal inferences and policy conclusions from the presented results.
In terms of time variability, changes in institutions generally occur only gradually and evolutionary rather than radically, particularly in democratic societies. Consequently, the institutional structures of education systems are highly time-invariant and thus most likely constant, or at least rather similar, during a student�s life in secondary school. We therefore assume that the educational institutions observed at one point in time persist unchanged during the students� secondary-school life and thus contribute to students� achievement levels, and not only to the change from one grade to the next. A level-estimation approach thus seems well-suited for determining the total association between institutions and student achievements. Still, institutional structures may differ between primary and secondary school, so that issues of omitted prior inputs in a students� life may still bias estimated institutional effects, generally in an attenuating way.
EDU/WKP(2007)9
45
B.2 Micro-Econometric Issues of Hierarchically Structured Data: Multi-Level Error Components and Sampling Weights
The complex survey structure and design of the PISA 2003 study requires a non-trivial structure of the error term εisc of the estimation equation (see equation (1b) in the main text). Since PISA employed a two stage sampling design, where in the first stage schools and in the second stage a sample of students was drawn from these schools, the primary sampling unit (PSU) in PISA is the school. As shown by Moulton (1986), the hierarchical structure of the data requires the addition of higher-level error components to avoid spurious results. Therefore, the error term ε in all the econometric equations estimated in this report has a country-level and a school-level element in addition to the individual student element:
iscisc υνηε ++= (A1)
where η is a country-specific error component, ν is a school-specific error component, and υ is a student-specific error component.
Clustering-robust linear regression (CRLR) is used to estimate standard errors that recognize this clustering of the survey design by allowing any given amount of correlation within PSUs in the error variance-covariance matrices (cf. Deaton 1997). The CRLR method relaxes the classical assumption of independence across individual observations and requires only that the observations be independent across the PSUs, i.e. across schools.
This assumption results in a CRLR approach which employs a covariance matrix of the following form:
Σ
Σ
=
l
V
000000000000000000001
O
O
O
(A2)
with ∑i (i=1,�,l) as the covariance matrices of the least square regression within each school (PSU). Assuming that PSUs are independent from one another leads to the block diagonal matrix V with PSUs as diagonal elements and results in consistent and efficient coefficient estimates (cf. White 1984).
In addition, the PISA 2003 study uses a stratified sampling design in each country which demands the use of sampling weights to obtain consistent student population estimates (allowing for different sampling probabilities). This is a direct consequence of the fact that PISA over-samples some sub-groups of the student population and thus students have different sampling probabilities for different strata with respect to student or family characteristics.
By using a weighted least squares (WLS) regression approach with students� sampling probabilities as weights, the estimation produces coefficient estimates which are equal to the estimates for a complete census enumeration of the whole student population in a country (DuMouchel and Duncan 1983; Wooldridge 2001). To avoid that the coefficient estimates are driven by the student population size of a country, the sampling weight is normalized in a way that all countries contribute equally to the coefficient estimates of the international education production function.
EDU/WKP(2007)9
46
B.3 Data Imputation and Its Implications for the Estimation Model
Like in any survey dataset, there are missing data in the PISA 2003 dataset. Although this problem is minor for almost any single variable as can be seen from Table A.1, it becomes more problematic when estimating international educational productions. Given the large set of explanatory variables considered and given that each variable has missing values for some students, dropping all student observations that have a missing value on at least one variable would mean a severe reduction in sample size. Data on teacher education are not available for almost a third of the students, and data on school starting age and grade repetition are missing for 9.9 percent to 14.1 percent. While the percentage of missing values for the other variables individually ranges from 0.0 percent to 8.5 percent (cf. Table A.1), the percentage of students with a missing value on least one variable of the baseline model is 46.1%. That is, the sample size in the baseline model would be reduced to 83,595 students in 23 countries.
Apart from the general reduction in sample size which would reduce the statistical power of the estimation, dropping all students with a missing value on at least one variable would delete information available on other explanatory variables for these students and introduce bias if values are not missing at random. Thus, data imputation is the only viable way of performing the broad-based analyses of this report.
We impute missing values using a conditional mean imputation method (cf. Little and Rubin 1987), which predicts the conditional mean for each missing observation on the explanatory variables using non-missing values of the specific variables and a set of explanatory variables observed for all students. Specifically, in order to obtain a complete dataset for all students for whom performance data are available, we imputed missing values of explanatory variables using a set of �fundamental� explanatory variables F that were available for all students. These fundamental variables F include gender, age, five grade dummies, four dummies on the students� family structure, five dummies for the number of books at home, GDP per capita as a measure of the country�s level of economic development, and the country�s educational expenditure per student.18
For each student i with missing data on a specific variable M, the set of �fundamental� explanatory variables F with data available for all students was used to impute the missing data in the following way. Let S denote the set of students j with available data for M. Using the students in S, the variable M was regressed on F:
SjSjSj FM ∈∈∈ += εφ (A3)
Then, the coefficients φ from these regressions and the data on Fi were used to impute the value of Mi for the students with missing data:
φSiSi FM ∉∉ =~ (A4)
The imputation method for implied variables was WLS estimation for continuous variables, ordered probit estimation for ordinal variables, and probit estimation for dichotomous variables. For continuous variables, predicted values were then filled in for missing data. For ordinal and dichotomous variables, in each category the respective predicted probability was filled in for missing data. We perform the
18 The small amount of missing data on the variables in F was imputed by the use of median imputation on
the lowest available level (school or country).

EDU/WKP(2007)9
47
imputation once for the sample of OECD countries and once for the extended sample that includes non-OECD countries.
Generally, data imputation introduces measurement error in the explanatory variables, which should make it more difficult to observe statistically significant effects.19 However, if values are not missing conditionally at random, estimates could still be biased. For example, if among observationally similar students the probability of a missing value for a variable depends on an unobserved student characteristic that also influences achievement, imputation would predict the same value of the variable for students with a missing value that was observed for the other students, which would result in biased coefficient estimates.
To account for this possibility of non-randomly missing observations and to make sure that the results are not driven by imputed data, we include a vector of imputation dummy variables as controls in the estimation. This vector contains one dummy for each variable of the model that takes the value of 1 for observations with missing and thus imputed data and 0 for observations with original data. The vector allows the observations with missing data on each variable to have their own intercepts. We additionally include interaction terms between each variable and its imputation dummy, which allows observations with missing data to also have their own slopes for the respective variable. These imputation controls make the results robust against possible bias arising from imputation errors in the variables. Thus, the models actually estimated in this report have the following structure:
( ) ( ) ( ) iscscIsc
Iscsc
Rsc
Rscisc
Bisc
Bisc
scsciscisc
IDDRDDBDD
IRBT
εµµµµµµ
γβα
+++++++
++=
654321
(A5)
which adds the vectors of imputation dummies D and their interactions with the variables to equation (1b).
19 In an analysis of the PISA 2000 data, Fuchs and Wößmann (2007) employ an adjustment mechanism for
standard errors suggested by Schafer and Schenker (2000) that accounts for the degree of variability and uncertainty in the imputation process as well as for the share of missing data and find that all qualitative results are highly robust to the alternatively computed standard errors.

EDU/WKP(2007)9
48
APPENDIX C: ADDITIONAL TABLES Table C.1: Full results of the basic model for mathematics achievement
Without country
fixed effects With country fixed effects
(1) (2) INSTITUTIONS
External exit exams 16.840** n.i. (8.008)
External exit exams x ESCS 8.120*** 8.750*** (0.862) (0.799)
Autonomy in formulating budget -29.740* n.i. (14.594)
Autonomy in formulating budget x ESCS 7.950*** 9.329*** (1.885) (1.645)
School influence on staffing decisions 31.153* n.i. (15.990)
School influence on staffing decisions x ESCS 1.870 0.798 (1.492) (1.348)
Private operation 61.385*** n.i. (12.042)
Private operation x ESCS -5.295*** -7.900*** (1.901) (1.755)
Government funding 60.752** n.i. (28.731)
Government funding x ESCS -18.065*** -13.137*** (4.480) (4.214)
Years since first tracking 0.038 n.i. (1.892)
Years since first tracking x ESCS 2.462*** 2.119*** (0.281) (0.260)
STUDENT CHARACTERISTICS Female -16.502*** -16.891***
(0.660) (0.632) Age (years) 21.589*** 3.694***
(1.131) (1.006) Preprimary education (more than 1 year) 6.043*** 7.155***
(0.673) (0.613) School starting age -1.415*** -4.062***
(0.523) (0.453) Grade repetition in primary school -40.010*** -31.933***
(1.496) (1.530) Grade repetition in secondary school -35.670*** -23.796***
(1.668) (1.573) Grade -56.152*** -82.723***
7th grade (4.495) (4.295) -31.676*** -57.887***
8th grade (2.354) (2.252) -16.628*** -27.889***
9th grade (1.298) (1.322) -15.207*** 14.613***
11th grade (1.999) (1.743) -1.957 40.672***
12th grade (4.706) (4.743) -16.502*** -16.891***
(continued on next page)
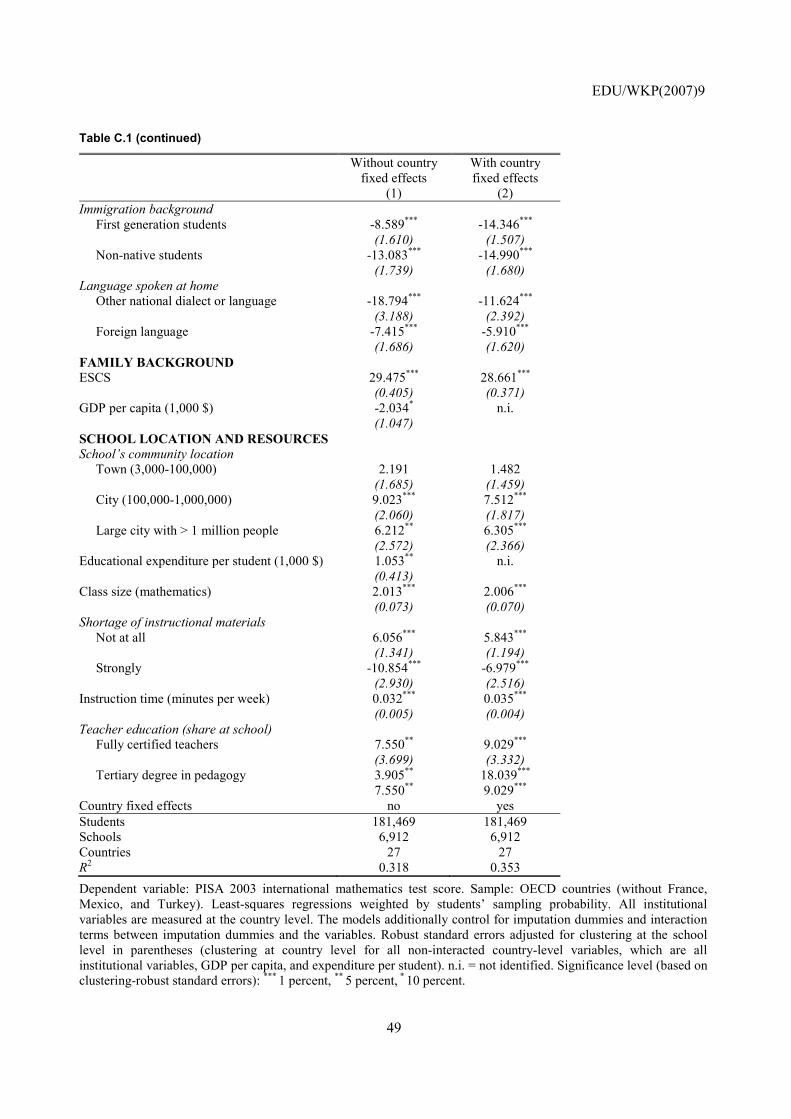
EDU/WKP(2007)9
49
Table C.1 (continued)
Without country
fixed effects With country fixed effects
(1) (2) Immigration background First generation students -8.589*** -14.346*** (1.610) (1.507) Non-native students -13.083*** -14.990*** (1.739) (1.680) Language spoken at home Other national dialect or language -18.794*** -11.624*** (3.188) (2.392) Foreign language -7.415*** -5.910*** (1.686) (1.620) FAMILY BACKGROUND ESCS 29.475*** 28.661*** (0.405) (0.371) GDP per capita (1,000 $) -2.034* n.i. (1.047) SCHOOL LOCATION AND RESOURCES School�s community location Town (3,000-100,000) 2.191 1.482 (1.685) (1.459) City (100,000-1,000,000) 9.023*** 7.512*** (2.060) (1.817) Large city with > 1 million people 6.212** 6.305*** (2.572) (2.366) Educational expenditure per student (1,000 $) 1.053** n.i. (0.413) Class size (mathematics) 2.013*** 2.006*** (0.073) (0.070) Shortage of instructional materials Not at all 6.056*** 5.843*** (1.341) (1.194) Strongly -10.854*** -6.979*** (2.930) (2.516) Instruction time (minutes per week) 0.032*** 0.035*** (0.005) (0.004) Teacher education (share at school) Fully certified teachers 7.550** 9.029*** (3.699) (3.332) Tertiary degree in pedagogy 3.905** 18.039*** 7.550** 9.029*** Country fixed effects no yes Students 181,469 181,469 Schools 6,912 6,912 Countries 27 27 R2 0.318 0.353 Dependent variable: PISA 2003 international mathematics test score. Sample: OECD countries (without France, Mexico, and Turkey). Least-squares regressions weighted by students� sampling probability. All institutional variables are measured at the country level. The models additionally control for imputation dummies and interaction terms between imputation dummies and the variables. Robust standard errors adjusted for clustering at the school level in parentheses (clustering at country level for all non-interacted country-level variables, which are all institutional variables, GDP per capita, and expenditure per student). n.i. = not identified. Significance level (based on clustering-robust standard errors): *** 1 percent, ** 5 percent, * 10 percent.

EDU/WKP(2007)9
50
Table C.2: Full results of the basic model for science achievement
Without country
fixed effects With country fixed effects
(1) (2) INSTITUTIONS External exit exams 15.732* n.i. (7.675) External exit exams x ESCS 11.541*** 9.672*** (1.054) (1.007) Autonomy in formulating budget -28.012* n.i. (16.122) Autonomy in formulating budget x ESCS 3.212 4.667** (2.062) (1.924) School influence on staffing decisions 22.724 n.i. (17.256) School influence on staffing decisions x ESCS -3.037 -2.103 (1.872) (1.790) Private operation 39.643*** n.i. (9.564) Private operation x ESCS -4.066* -7.467*** (2.291) (2.213) Government funding 47.434 n.i. (28.884) Government funding x ESCS -3.532 0.340 (5.302) (5.087) Years since first tracking -1.126 n.i. (1.616) Years since first tracking x ESCS 1.585*** 1.217*** (0.315) (0.305) STUDENT CHARACTERISTICS Female -11.069*** -11.562*** (0.835) (0.817) Age (years) 20.235*** 5.668*** (1.509) (1.442) Preprimary education (more than 1 year) 4.337*** 5.759*** (0.930) (0.900) School starting age -1.852*** -3.368*** (0.668) (0.649) Grade repetition in primary school -35.436*** -30.230*** (2.237) (2.240) Grade repetition in secondary school -35.747*** -24.978*** (2.237) (2.193) Grade 7th grade -48.578*** -72.006*** (6.121) (6.036) 8th grade -31.401*** -53.656*** (3.078) (3.022) 9th grade -15.749*** -27.561*** (1.475) (1.546) 11th grade -3.815 16.042*** (2.361) (2.232) 12th grade 5.630 36.375*** (6.033) (6.237) (continued on next page)
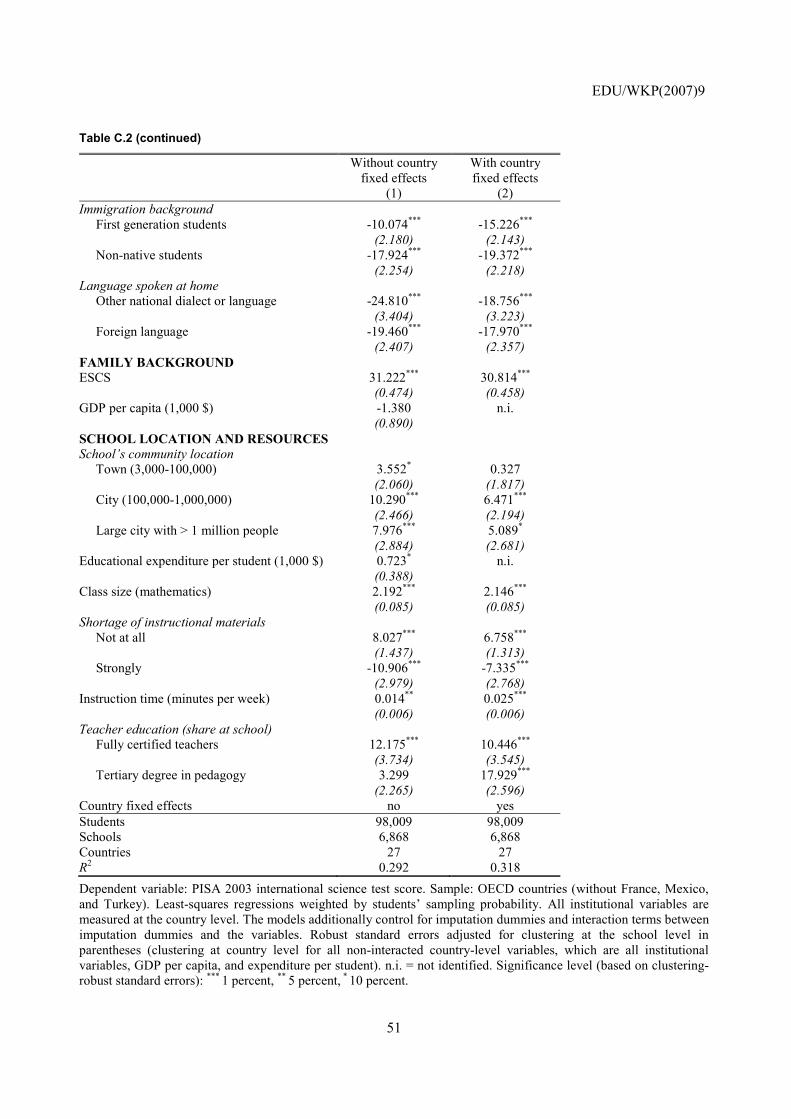
EDU/WKP(2007)9
51
Table C.2 (continued)
Without country
fixed effects With country fixed effects
(1) (2) Immigration background First generation students -10.074*** -15.226*** (2.180) (2.143) Non-native students -17.924*** -19.372*** (2.254) (2.218) Language spoken at home Other national dialect or language -24.810*** -18.756*** (3.404) (3.223) Foreign language -19.460*** -17.970*** (2.407) (2.357) FAMILY BACKGROUND ESCS 31.222*** 30.814*** (0.474) (0.458) GDP per capita (1,000 $) -1.380 n.i. (0.890) SCHOOL LOCATION AND RESOURCES School�s community location Town (3,000-100,000) 3.552* 0.327 (2.060) (1.817) City (100,000-1,000,000) 10.290*** 6.471*** (2.466) (2.194) Large city with > 1 million people 7.976*** 5.089* (2.884) (2.681) Educational expenditure per student (1,000 $) 0.723* n.i. (0.388) Class size (mathematics) 2.192*** 2.146*** (0.085) (0.085) Shortage of instructional materials Not at all 8.027*** 6.758*** (1.437) (1.313) Strongly -10.906*** -7.335*** (2.979) (2.768) Instruction time (minutes per week) 0.014** 0.025*** (0.006) (0.006) Teacher education (share at school) Fully certified teachers 12.175*** 10.446*** (3.734) (3.545) Tertiary degree in pedagogy 3.299 17.929*** (2.265) (2.596) Country fixed effects no yes Students 98,009 98,009 Schools 6,868 6,868 Countries 27 27 R2 0.292 0.318 Dependent variable: PISA 2003 international science test score. Sample: OECD countries (without France, Mexico, and Turkey). Least-squares regressions weighted by students� sampling probability. All institutional variables are measured at the country level. The models additionally control for imputation dummies and interaction terms between imputation dummies and the variables. Robust standard errors adjusted for clustering at the school level in parentheses (clustering at country level for all non-interacted country-level variables, which are all institutional variables, GDP per capita, and expenditure per student). n.i. = not identified. Significance level (based on clustering-robust standard errors): *** 1 percent, ** 5 percent, * 10 percent.

EDU/WKP(2007)9
52
REFERENCES
Ammermüller, Andreas (2005). Educational Opportunities and the Role of Institutions. ZEW Discussion Paper 05-44. Mannheim: Centre for European Economic Research.
Arrow, Kenneth, Samuel Bowles, Steven Durlauf (eds.) (2000). Meritocracy and Economic Inequality. Princeton, NJ: Princeton University Press.
Betts, Julian R., Tom Loveless (eds.) (2005). Getting Choice Right: Ensuring Equity and Efficiency in Education Policy. Washington, D.C.: Brookings Institution Press.
Betts, Julian R., John E. Roemer (2007). Equalizing Opportunity for Racial and Socioeconomic Groups in the United States through Educational-Finance Reform. In: Ludger Wößmann, Paul E. Peterson (eds.), Schools and the Equal Opportunity Problem, pp. 209-237. Cambridge, MA: MIT Press.
Bishop, John H. (1992). The Impact of Academic Competencies on Wages, Unemployment, and Job Performance. Carnegie-Rochester Conference Series on Public Policy 37: 127-194.
Bishop, John H. (2006). Drinking from the Fountain of Knowledge: Student Incentive to Study and Learn � Externalities, Information Problems and Peer Pressure. In: Eric A. Hanushek, Finis Welch (eds.), Handbook of the Economics of Education, Volume 2, pp. 909-944. Amsterdam: North-Holland.
Burgess, Simon, Brendon McConnell, Carol Propper, Deborah Wilson (2007). The Impact of School Choice on Sorting by Ability and Socioeconomic Factors in English Secondary Education. In: Ludger Wößmann, Paul E. Peterson (eds.), Schools and the Equal Opportunity Problem, pp. 273-291. Cambridge, MA: MIT Press.
Cullen, Julie B., Brian A. Jacob, Steven D. Levitt (2005). The Impact of School Choice on Student Outcomes: An Analysis of the Chicago Public Schools. Journal of Public Economics 89 (5-6): 729-760.
Deaton, Angus (1997). The Analysis of Household Surveys: A Microeconometric Approach to Development Policy. Baltimore: Johns Hopkins University Press.
Diamond, John B., James Spillane (2004). High-Stakes Accountability in Urban Elementary Schools: Challenging or Reproducing Inequality? Teachers College Record 106 (6): 1145-1176.
DuMouchel, William H., Greg J. Duncan (1983). Using Sample Survey Weights in Multiple Regression Analyses of Stratified Samples. Journal of the American Statistical Association 78 (383): 535-543.
Fuchs, Thomas, Ludger Wößmann (2007). What Accounts for International Differences in Student Performance? A Re-examination using PISA Data. Empirical Economics 32 (2-3): 433-464.
Hanushek, Eric A. (1994). Education Production Functions. In: Torsten Husén, T. Neville Postlethwaite (eds.), International Encyclopedia of Education, 2nd edition, Volume 3, pp. 1756-1762. Oxford: Pergamon.
EDU/WKP(2007)9
53
Hanushek, Eric A. (2002). Publicly Provided Education. In: Alan J. Auerbach, Martin Feldstein (eds.), Handbook of Public Economics, Volume 4, pp. 2045-2141. Amsterdam: North-Holland.
Hanushek, Eric A., Ludger Wößmann (2006). Does Early Tracking Affect Educational Inequality and Performance? Differences-in-Differences Evidence across Countries. Economic Journal 116 (510): C63-C76.
Hanushek, Eric A., Ludger Wößmann (2007a). The Role of School Improvement in Economic Development. NBER Working Paper 12832. Cambridge, MA: National Bureau of Economic Research.
Hanushek, Eric A., Ludger Wößmann (2007b). Education Quality and Economic Growth. Washington, DC: World Bank.
Heston, Alan, Robert Summers, Bettina Aten (2006). Penn World Table Version 6.2. Center for International Comparisons of Production, Income and Prices at the University of Pennsylvania. Philadelphia: University of Pennsylvania.
Jacob, Brian A. (2005). Accountability, Incentives and Behavior: The Impact of High-stakes Testing in the Chicago Public Schools. Journal of Public Economics 89 (5-6): 761-796.
Jacob, Brian A., Steven D. Levitt (2003). Rotten Apples: An Investigation of the Prevalence and Predictors of Teacher Cheating. Quarterly Journal of Economics 118 (3): 843-877.
Juhn, Chinhui, Kevin M. Murphy, Brooks Pierce (1993). Wage Inequality and the Rise in Returns to Skill. Journal of Political Economy 101 (3): 410-442.
Ladd, Helen F. (2002). School Vouchers: A Critical View. Journal of Economic Perspectives 16 (4): 3-24.
Ladd, Helen F., Randall P. Walsh (2002). Implementing Value-Added Measures of School Effectiveness: Getting the Incentives Right. Economics of Education Review 21 (1): 1-17.
Lazear, Edward P. (2003). Teacher Incentives. Swedish Economic Policy Review 10 (3): 179-214.
Little, Roderick J.A., Donald B. Rubin (1987). Statistical Analysis with Missing Data. New York: Wiley.
McIntosh, Steven, Anna Vignoles (2001). Measuring and Assessing the Impact of Basic Skills on Labour Market Outcomes. Oxford Economic Papers 53 (3): 453-481.
Moulton, Brent R. (1986). Random Group Effects and the Precision of Regression Estimates. Journal of Econometrics 32 (3): 385-397.
Mulligan, Casey B. (1999). Galton versus the Human Capital Approach to Inheritance. Journal of Political Economy 107 (6, pt. 2): S184-S224.
Murnane, Richard J., John B. Willett, Yves Duhaldeborde, John H. Tyler (2000). How Important Are the Cognitive Skills of Teenagers in Predicting Subsequent Earnings? Journal of Policy Analysis and Management 19 (4): 547-568.
Nechyba, Thomas J. (2000). Mobility, Targeting, and Private-School Vouchers. American Economic Review 90 (1): 130-146.
EDU/WKP(2007)9
54
Nickell, Stephen (2004). Poverty and Worklessness in Britain. Economic Journal 114 (494): C1-C25.
Organisation for Economic Co-operation and Development (OECD) (2000). Literacy in the Information Age: Final Report of the International Adult Literacy Survey. Paris: OECD.
Organisation for Economic Co-operation and Development (2004). Learning for Tomorrow�s World: First Results from PISA 2003. Paris: OECD.
Organisation for Economic Co-operation and Development (2005a). PISA 2003 Technical Report. Paris: OECD.
Organisation for Economic Co-operation and Development (2005b). PISA 2003 Data Analysis Manual. Paris: OECD.
Organisation for Economic Co-operation and Development (2006). Education at a Glance: OECD Indicators 2006. Paris: OECD.
Organisation for Economic Co-operation and Development (2007). No More Failures: Ten Steps to Equity in Education. Authored by Simon Field, Malgorzata Kuczera and Beatriz Pont (Advance Copy). Paris: OECD.
Roemer, John E. (1998). Equality of Opportunity. Cambridge, MA: Harvard University Press.
Schafer, Joseph L., Nathalie Schenker (2000). Inference With Imputed Conditional Means. Journal of the American Statistical Association 95 (449): 144-154.
Schütz, Gabriela, Heinrich W. Ursprung, Ludger Wößmann (2005). Education Policy and Equality of Opportunity. CESifo Working Paper 1518. Munich: CESifo.
Todd, Petra E., Kenneth I. Wolpin (2003). On the Specification and Estimation of the Production Function for Cognitive Achievement. Economic Journal 113 (485): F3-F33.
White, Halbert (1984). Asymptotic Theory for Econometricians. Orlando: Academic Press.
Wooldridge, Jeffrey M. (2001). Asymptotic Properties of Weighted M-Estimators for Standard Stratified Samples. Econometric Theory 17 (2): 451-470.
Wößmann, Ludger (2003a). Schooling Resources, Educational Institutions and Student Performance: the International Evidence. Oxford Bulletin of Economics and Statistics 65 (2): 117-170.
Wößmann, Ludger (2003b). Central Exit Exams and Student Achievement: International Evidence. In: Paul E. Peterson, Martin R. West (eds.), No Child Left Behind? The Politics and Practice of School Accountability, pp. 292-323. Washington, D.C.: Brookings Institution Press.
Wößmann, Ludger (2005). The Effect Heterogeneity of Central Exams: Evidence from TIMSS, TIMSS-Repeat and PISA. Education Economics 13 (2): 143-169.
Wößmann, Ludger (2007). Fundamental Determinants of School Efficiency and Equity: German States as a Microcosm for OECD Countries. Harvard University, Program on Education Policy and Governance Research Paper PEPG 07-02. Cambridge, MA: Harvard University.
EDU/WKP(2007)9
55
Wößmann, Ludger, Paul E. Peterson (eds.) (2007). Schools and the Equal Opportunity Problem. Cambridge, MA: MIT Press.
Wößmann, Ludger, Elke Lüdemann, Gabriela Schütz, Martin R. West (2007). School Accountability, Autonomy, Choice and the Level of Student Achievement: International Evidence from PISA 2003. OECD Education Working Paper No. 13, EDU/WKP(2007)8. Paris: OECD.