Embed Size (px)
Citation preview

Micro-Policies for Growth and Productivity Summary of Key Findings
February 2007
OECD Directorate for Science, Technology and Industry (STI)
ORGANISATION FOR ECONOMIC CO-OPERATION AND DEVELOPMENT
The OECD is a unique forum where the governments of 30 democracies work together to address the economic, social and environmental challenges of globalisation. The OECD is also at the forefront of efforts to understand and to help governments respond to new developments and concerns, such as corporate governance, the information economy and the challenges of an ageing population. The Organisation provides a setting where governments can compare policy experiences, seek answers to common problems, identify good practice and work to co-ordinate domestic and international policies.
The OECD member countries are: Australia, Austria, Belgium, Canada, the Czech Republic, Denmark, Finland, France, Germany, Greece, Hungary, Iceland, Ireland, Italy, Japan, Korea, Luxembourg, Mexico, the Netherlands, New Zealand, Norway, Poland, Portugal, the Slovak Republic, Spain, Sweden, Switzerland, Turkey, the United Kingdom and the United States. The Commission of the European Communities takes part in the work of the OECD.
This document is published on the responsibility of the OECD Committee on Industry, Innovation and Entrepreneurship (successor of the Committee on Industry and Business Environment).
© OECD 2007
No reproduction, copy, transmission or translation of this publication may be made without written permission. Applications should be sent to OECD Publishing: [email protected].

TABLE OF CONTENTS
FOREWORD...................................................................................................................................................4 MAIN POINTS ...............................................................................................................................................5 INTRODUCTION...........................................................................................................................................7 THE NEED FOR AN COHERENT GROWTH STRATEGY........................................................................8 IDENTIFYING GOOD PERFORMANCE...................................................................................................11 IDENTIFYING CRITICAL POLICY AREAS.............................................................................................18 IDENTIFYING EFFECTIVE MICRO-POLICIES.......................................................................................26 REFERENCES..............................................................................................................................................38 ANNEX 1. DOCUMENTING THE PERFORMANCE INDICATORS.....................................................40
3

FOREWORD
The 2001 OECD Ministerial report, The New Economy: Beyond the Hype, concluded that human capital, information and communications technology (ICT), innovation, and entrepreneurship were key elements for enhancing productivity and growth performance in knowledge-based economies (OECD, 2001). Despite the technology downturn in 2000, the OECD Growth Project concluded: “the evidence suggests that something new is taking place in the structure of OECD economies”. The very high growth in multifactor productivity (MFP) in some OECD countries in the 1990s fuelled speculation about a “New Economy” driven by investments in technology and high value-added intangibles. Understanding these micro-drivers of productivity and growth, and particularly the policies needed to create and sustain them, became essential.
The Committee on Industry and Business Environment (CIBE) embarked on a project Growth Follow-up: Micro-Policies for Growth and Productivity intended to develop and use new methodologies to further explore the new micro-drivers of growth and to identify effective micro-policy practices. CIBE was assisted by the Committee for Scientific and Technological Policy (CSTP) with regard to the innovation driver and by the Committee for Information, Computer and Communications Policy (ICCP) concerning ICT issues. The Directorate for Employment, Labour and Social Affairs and the Education Directorate provided inputs concerning performance and policies in the area of human capital. The project was initiated in response to the OECD Council Ministerial in 2001, where Ministers asked the OECD to strengthen benchmarking as part of the follow-up to the Growth Project and to strengthen its peer review of structural reforms. It also responds to the 2002 Council Ministerial request to monitor the implementation of the policy recommendations of the Growth Study.
The objective of this report is to summarise the key findings of the project. It builds on a technical report which explains the methodology, data sources and analyses in detail (OECD, 2005a) and on a user guide which explains how countries can apply the methodology at the country level (OECD, 2005b). The report illustrates the importance of the four micro-drivers for growth in the 1990s. The report also provides policy-makers with a prioritised list of micro-policies needed to increase growth and productivity. Finally, it supplies a framework that allows policy-makers to identify strong and weak areas in their country’s business environment. The provided policy insights should be seen as a first attempt to produce a coherent growth strategy for the micro-level of the economy, as the field of micro-policies is new and no agreed methodology exists. The policy insights will develop over time as the analysis and the underlying data improve. Continuous updating of the data and analysis will also allow countries to follow their progression over time, review the effects of their policy reforms, and exchange information about effective policies.
Anders Hoffmann is the principal author of the report. A draft of the report was discussed and approved by the Committee on Industry and Business Environment at its 109th session held on 10-11 October 2006.
4

MAIN POINTS
Four micro-level factors have been identified as key to successful knowledge-based economies … The 2001 OECD Ministerial report, The New Economy: Beyond the Hype, concludes that four micro-drivers (human capital, information and communications technology (ICT), innovation and entrepreneurship) are key drivers of productivity and economic growth performance in knowledge-based economies.
The links between good performance at the micro-level of the economy and economic growth are confirmed using a new methodology …
A new methodology confirms links between the functioning of the micro-level of the economy (the four micro-drivers) and economic growth. While a stable macro-economic environment and flexible labour market policies provide a good basis for growth, the four micro-drivers are critical to realising growth in knowledge-based economies.
A well-functioning business environment is crucial for good performance at the micro-level … The analysis shows a clear link between the functioning of the business environment and micro-level performance as measured by the included indicators. This is true for each of the four drivers measured both separately and combined.
Critical policy areas in the business environment are identified for each micro-driver…
For each of the four micro-drivers, critical policy areas are highlighted by linking performance in the micro-drivers with the functioning of the underlying business environment.
Enhancing human capital and realising its potential
Increasing the quality and relevance of educational attainment Providing incentives for continuous training/lifelong learning Fostering knowledge-based management and organisation in enterprises
Seizing the benefits of information and communications technology (ICT)
Developing ICT skills Stimulating competition in communication markets Implementing e-government Developing digital content
Exploiting and diffusing science and technology
Enhancing the quality of public research Promoting industry-science links Stimulating demand for new products, processes and services
Fostering firm creation and entrepreneurship
Increasing access to venture capital Ensuring efficient bankruptcy regimes Providing entrepreneurial education
5
The policy insights will develop over time as the analysis and underlying data gradually improve.
Specific micro-policy approaches for the critical policy areas are identified… By reviewing policy approaches in good performing countries, effective micro-policy measures are identified for each of the critical policy areas. While policy priorities may differ across countries, the identified micro-policies represent practical approaches to common policy challenges. These approaches can be adapted by other countries as means to increase growth and productivity.
A policy framework has been developed to assist governments in micro-policy reforms…. The report supplies a framework allowing policy-makers to identify strong and weak points in their country’s business environment by comparing their performance and business environment to that in other OECD countries. Countries can combine this comparison with the identified critical policy areas in order to come up with prioritised policy actions.
Governments need to adapt micro-policies in a coherent growth strategy... While the identified micro-policies affect productivity growth through the channels of the four micro-drivers, their contributions to growth are more significant when combined rather than dealt with separately. The four drivers - especially entrepreneurship and innovation - interact. Consequently, a coherent strategy is required to reap the full benefits of the four micro-drivers of productivity growth.
6

INTRODUCTION
1. The methodology is based on the idea that linking the micro-level and the macro-level of the economy through four micro-drivers of growth will allow for new policy insights. There are six main steps. First, performance on the four micro-drivers is defined and measured based on quantitative data and qualitative information. Second, the business environment for the four micro-drivers is defined and measured based on quantitative data and qualitative information. Third, the links between performance and the business environment are tested for each of the four drivers separately and jointly. Fourth, key policy areas for enhancing performance on the micro-drivers are identified by assessing the correlation between policy areas and performance combined with more qualitative analysis. Fifth, effective approaches used in the good performing countries in the key policy areas are identified. Sixth, the links between the micro-drivers and productivity growth are tested, alone and in combination, to help formulate an overall strategy.
2. This methodology allows countries to compare their own performance and business environment against other OECD countries. From this, they can obtain a snapshot of their strengths and weaknesses in the areas of ICT, innovation, entrepreneurship and human capital. They can then review the policy areas shown as critical to performance as well as the specific policy approaches in place in good performing countries. These can be used as inspiration for policy reforms and adopted and adapted as needed to the specific conditions and business environment of each country. It is important to stress that this work makes a slightly blurry distinction between policy areas and specific micro-policies. An example of a policy area is venture capital. The indicators for venture capital are correlated with the performance indicators and the best performing countries give high weight to their venture capital markets. The importance of venture capital for entrepreneurship is also supported by other studies. The report consequently concludes that venture capital is important and that countries should prioritise the development of these markets in their entrepreneurship policy. However, each country has to figure out what micro-policy initiatives they need to put in place in order to develop their national venture capital market. In this respect, they can learn from each other’s experience, but the initiative must to be tailored to each national context. This analysis has been supplemented by country peer reviews to delve further into selected micro-policies needed to maximise the four micro-drivers (Box 1).
Box 1. Country peer reviews of micro-policies The project on Micro-Policies for Growth and Productivity also consists of a series of country peer reviews of important micro-policy areas. Once a critical number of countries has been reviewed, a cross-country comparative synthesis is prepared containing agreed policy recommendations. Increasing access to venture capital is the policy domain for peer reviews on the driver “fostering firm creation and entrepreneurship”. Country reviews of Canada, Denmark, Israel, Korea, Portugal, Spain, Sweden, the United Kingdom, and the United States have been completed and the policy recommendations presented in the synthesis report have been agreed (OECD, 2004a). Enhancing public-private partnerships for innovation is the policy domain for peer reviews on the driver “harnessing the potential of innovation and technology diffusion”. Country reviews of the Netherlands, Australia, France and Austria have been completed. Promoting ICT diffusion to business is the policy domain for the driver “seizing the benefits of ICT”. Country reviews of Finland, Korea, Switzerland, Italy, the Netherlands and Norway have been completed (OECD, 2006) Developing highly-skilled workers for future industry needs is the policy domain for the driver “enhancing human capital and realising its potential”. Country reviews of Belgium, Canada, Denmark, Finland, the Netherlands, Norway and Sweden have been completed.
7

THE NEED FOR AN COHERENT GROWTH STRATEGY
3. Growth in the 1990s broke the well-known catching-up patterns of the 1960s and 1970s, where countries lagging in terms of labour productivity and GDP per capita gradually close the gap vis-à-vis the leading country (the United States). After stalling during the 1980s, the convergence process appears to have reversed during the 1990s among the largest OECD economies. GDP per capita grew faster in the United States than in Japan and the large EU member countries (OECD, 2003c). A few countries (Ireland, Korea, Australia, Norway, New Zealand and Canada), in contrast have seen GDP per capita rising faster than in the United States allowing them to narrow the income gap.
4. This new growth pattern was created by large increases in multifactor productivity (MFP) in some countries. Increases in MFP indicate more efficient use of resources, including capital and labour. MFP growth could explain more than 50% of the GDP growth in the last part of the 1990s in 8 of the 14 countries with comparable data. Higher MFP played a major role in Australia, Finland, Ireland and Portugal, where it accounted for more than 75% of increases in labour productivity (Figure 1).
Figure 1. Growth of labour productivity reflects capital deepening and multi-factor productivity (MFP) growth
Yearly changes in labour productivity split into capital deepening and MFP (1995-2002)
-2
-1
0
1
2
3
4
5
6
Spain*
Italy*
Denmark
*
Netherl
ands*
German
y
Canad
a
Belgium
*Jap
an
Swed
en*
United
States
France
United
King
dom*
Austral
ia
Portug
al*
Finlan
d*
Irelan
d*
%K/LMFP
Notes: MFP covers the total economy and is based on hedonic prices calculated by the OECD; *countries marked with asterix are 1995-2001. Source: OECD Productivity Database, 2003. 5. The critical barriers to MFP growth are often not in the overall functioning of the economy. MFP depends critically on the functioning of the micro-level of the economy. Do firms use new technology efficiently? Do ideas generated at universities get transferred to productive use in the market place? Do the
8
highly educated use their knowledge to organise production more effectively? Do new firms enter and grow? The important policies for MFP consequently are policies focusing on the micro-level of the economy – the four micro-drivers of productivity (human capital, information and communications technology (ICT), innovation, and entrepreneurship).
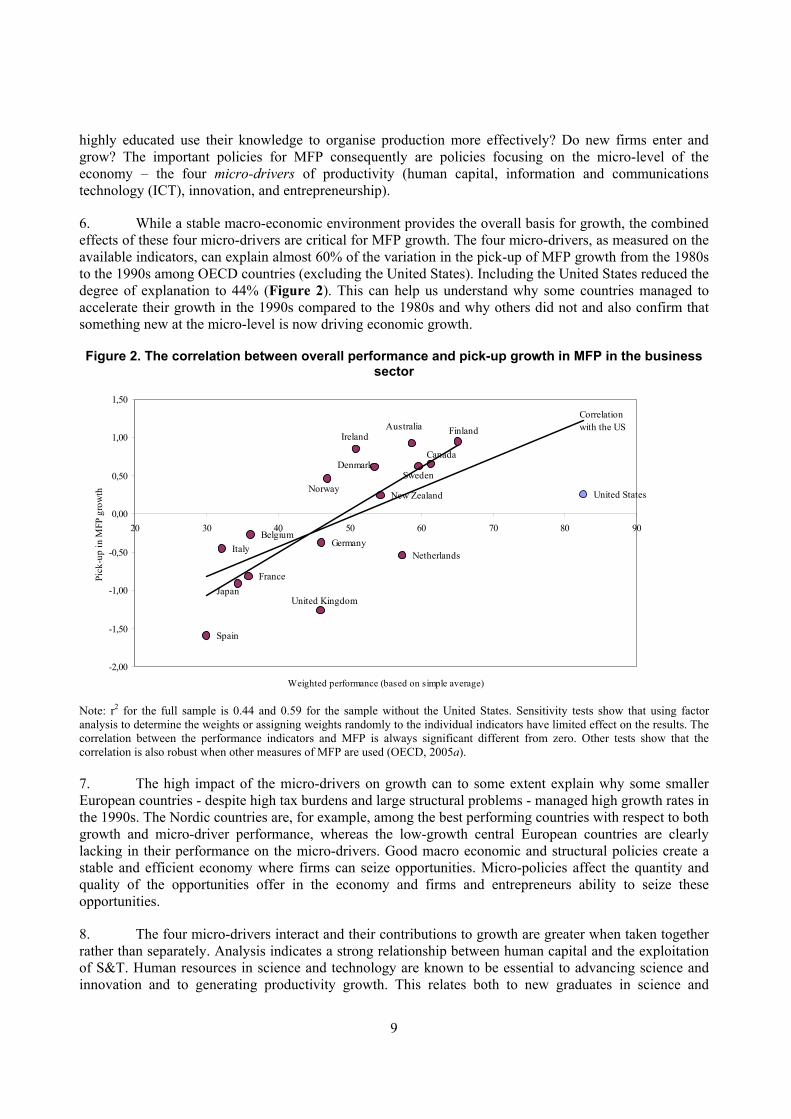
6. While a stable macro-economic environment provides the overall basis for growth, the combined effects of these four micro-drivers are critical for MFP growth. The four micro-drivers, as measured on the available indicators, can explain almost 60% of the variation in the pick-up of MFP growth from the 1980s to the 1990s among OECD countries (excluding the United States). Including the United States reduced the degree of explanation to 44% (Figure 2). This can help us understand why some countries managed to accelerate their growth in the 1990s compared to the 1980s and why others did not and also confirm that something new at the micro-level is now driving economic growth.
Figure 2. The correlation between overall performance and pick-up growth in MFP in the business
e without the United
sector
Note: r for the full sample is 0.44 and 0.59 for the sampl States. Sensitivity tests show that using factor
7. The high impact of the micro-drivers on growth can to some extent explain why some smaller
8. The four micro-drivers interact and their contributions to growth are greater when taken together
Australia
Belgium
CanadaDenmark
Finland
France
Germany
Ireland
Italy
Japan
Netherlands
New ZealandNorway
Spain
Sweden
United Kingdom
United States
-2,00
-1,50
-1,00
-0,50
0,00
0,50
1,00
1,50
20 30 40 50 60 70 80 90
Weighted performance (based on simple average)
Pick
-up
in M
FP g
row
th
Correlation with the US
2
analysis to determine the weights or assigning weights randomly to the individual indicators have limited effect on the results. The correlation between the performance indicators and MFP is always significant different from zero. Other tests show that the correlation is also robust when other measures of MFP are used (OECD, 2005a).
European countries - despite high tax burdens and large structural problems - managed high growth rates in the 1990s. The Nordic countries are, for example, among the best performing countries with respect to both growth and micro-driver performance, whereas the low-growth central European countries are clearly lacking in their performance on the micro-drivers. Good macro economic and structural policies create a stable and efficient economy where firms can seize opportunities. Micro-policies affect the quantity and quality of the opportunities offer in the economy and firms and entrepreneurs ability to seize these opportunities.
rather than separately. Analysis indicates a strong relationship between human capital and the exploitation of S&T. Human resources in science and technology are known to be essential to advancing science and innovation and to generating productivity growth. This relates both to new graduates in science and
9
technology and to the organisation of the existing workforce. The development and effective use of human capital is key to the ability of enterprises to improve their competitiveness by developing new products, processes and services. Human capital is also related to performance in entrepreneurship and in using ICT and could be seen as the essential foundation for growth strategies in knowledge-based economies.
9. Similarly, the successful exploitation of ICT requires skilled human capital. Training and
10. Finally, certain countries perform worse at the macro-level in terms of overall productivity
education are an important prerequisite for successful implementation of ICT. Previous research suggests that only 10% of an investment in ICT in firms should be spent on hardware, about 15% should be on technology compliments while the remainder (75%) should be on work practices, human capital and organisational restructuring (Brynjolfsson, 2003). For example, the high level of ICT skills in the Finnish population is the likely explanatory factor for the very high uptake of information technology in small Finnish firms relative other countries (OECD, 2004b).
growth than their performance on some micro-drivers would suggest because of weaknesses in other areas. For example, preliminary analysis shows that several countries might not reap the full benefits of science and technology (S&T) since they lack entrepreneurs to exploit and diffuse these outputs (OECD, 2005a). Since the micro-drivers, e.g. entrepreneurship and S&T, interact, countries like Japan, Germany and the Netherlands might not get the full benefits of science and technology as they lack entrepreneurs to turn ideas into profit. Other countries like New Zealand and Korea may lack the science and technology base needed to benefit fully from their many entrepreneurs. An integrated policy approach where science and technology is promoted together with entrepreneurship is consequently needed to enhance overall performance. Thus, the micro-policies discussed in this report should be seen as interrelated building blocks of an overall growth strategy.
10

IDENTIFYING GOOD PERFORMANCE
11. Performance in the four micro-drivers varies substantially both across and within the OECD countries. A few countries stand out. The United States, for example, are among the good performing countries in all four micro-drivers. Finland also has good performance in most drivers, whereas countries like Sweden, Canada and the Netherlands are doing well in some drivers but lack performance in other drivers. Theoretically, good performance on the micro-drivers should lead to good performance at the macro-level, particularly with regard to MFP growth. This is – as shown in the previous chapter - true of most of the good performing countries.
12. Good performance is in this study defined and measure by a series of indicators. These performance indicators measure the main determinates of growth in the each of the micro-drivers (Figure 3). For example, higher investments in ICT and more widespread use of ICT should allow countries to seize the benefits of ICT and increase their productivity growth. Similarly, developing more products, services and systems and diffusing innovation throughout the economy should allow countries to more fully exploit science and technology resulting in higher productivity.
Figure 3. Defining performance for the four drivers of growth
13. The performance indicators are mainly based on registrar data from the OECD and other international organisations but a few more qualitative indicators based on surveys carried out by groups such as the World Economic Forum are also included. Given the many methodological difficulties which surround the construction of simple composite indicators based on such information, distributions based on random weights have been generated to provide some performance comparisons (Box 2).
11

Box 2. Constructing and using composite indicators
The identification of good performance in the project on Micro-Policies for Growth and Productivity is based, in the first instance, on combining selected performance indicators for each micro-driver of growth for each country. Ideally, indicators should be selected on the basis of their analytical soundness and measurability, but the lack of data often leads to poor quality indicators and missing values. The indicators used in this study have been selected on the basis of their availability, country coverage and theoretical links to the growth process. These variables must also be standardised or normalised before they are aggregated, which can be done through a variety of techniques (e.g. deviation from the mean), each with its own advantages and disadvantages.
All indicators are then weighted, a process which can heavily influence the outcome of the composite. The methodological weaknesses of weighting indicators are substantial and caution should be paid in the interpretation of composites for this reason. In this analysis, weights are assigned randomly to each of the normalised indicators with calculations repeated 10 000 times. This is a safeguard intended to give a range of possible rankings for each country and provides guidance for the selection of good performing countries.
Composite indicators have advantages in terms of their ability to integrate large amounts of information into easily understood formats and are valued as a communication and political tool. However, many challenges exist in constructing and using composite indicators. The OECD and the EU Joint Research Centre have through joint work developed a handbook for the construction and application of composite indicators (OECD, 2005d).
14. The following sections examine performance in each of the four micro-drivers. The performance indicators are listed in Annex 1.
Enhancing human capital and realising its potential
15. With regard to human capital, this study focuses on one aspect -- the productive use of highly-skilled workers in the private sector – which is a main driver of productivity growth. This is proxied by two components that combine to foster productive use of the highly-skilled. The first is the stock of human capital in private firms measured as the number and quality of knowledge workers. Increases in MFP can be realised if either the number of knowledge workers increases and/or the quality of existing knowledge workers improves. Three indicators measure the stock of human capital (Annex 1). The second measure is the firm-level management and organisational structures that enable the productive use of knowledge workers. In this respect, a higher stock of knowledge workers is a necessary but not sufficient condition for higher productivity growth. The second measure is quantified by four indicators based on qualitative judgements from executive surveys (Annex 1).
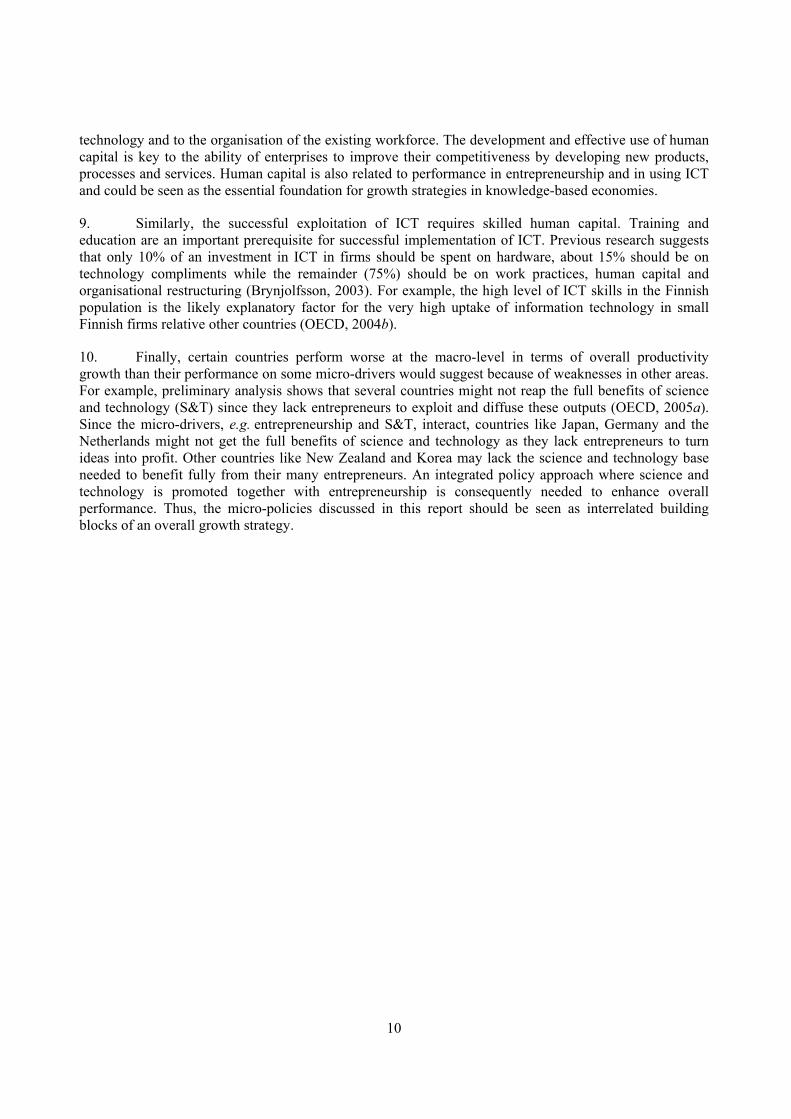
16. Distributions based on random weights assigned to these indicators suggest that Finland, the Netherlands, Sweden and the United States should be candidates for further analysis (Figure 4). Compared to other OECD countries, these four countries have the highest stock of employed highly-skilled people and also have the organisational and managerial practices in place in the private sector to benefit from these knowledge workers. Possible alternative countries include Denmark, Australia, Belgium and Canada.
12
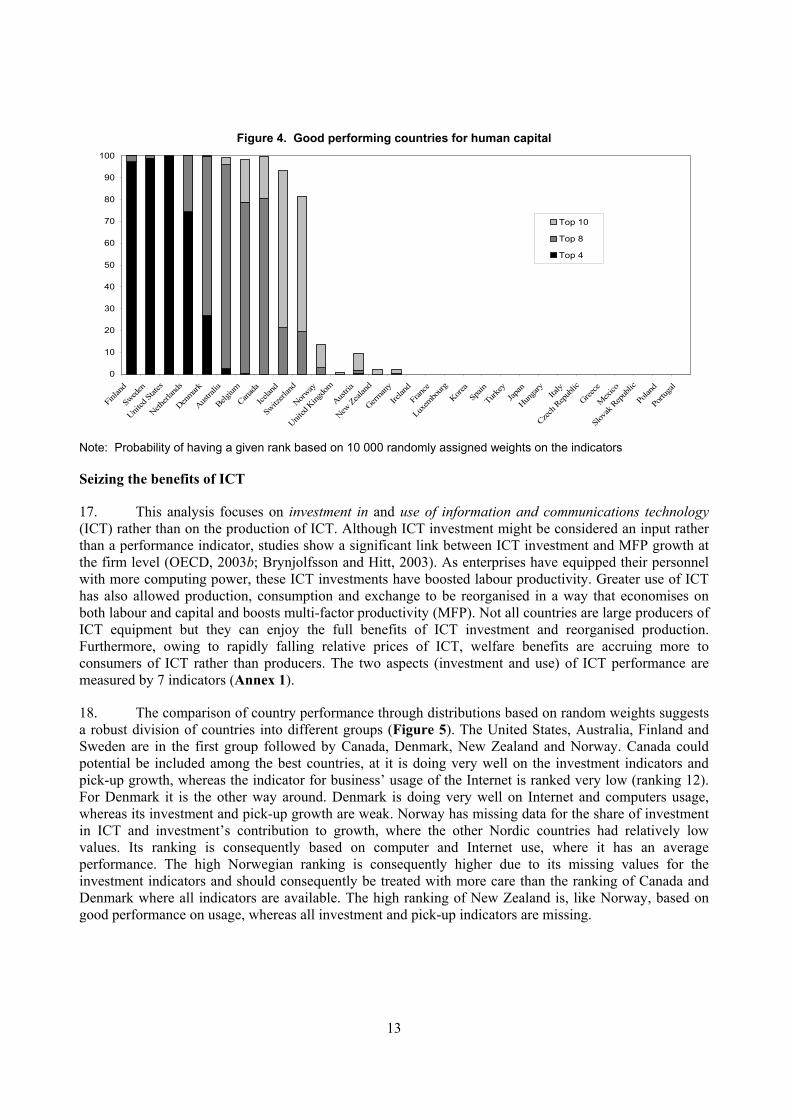
Figure 4. Good performing countries for human capital
0
10
20
30
40
50
60
70
80
90
100
Finlan
d
Swed
en
United
State
s
Netherl
ands
Denmark
Austra
lia
Belgium
Canad
a
Icelan
d
Switz
erlan
d
Norway
United
King
dom
Austri
a
New Zea
land
German
y
Irelan
d
Fran
ce
Luxem
bourg
Korea
Spain
Turkey
Japan
Hunga
ryIta
ly
Czech
Rep
ublic
Greece
Mex
ico
Slova
k Rep
ublic
Polan
d
Portu
gal
Top 10
Top 8
Top 4
Note: Probability of having a given rank based on 10 000 randomly assigned weights on the indicators
Seizing the benefits of ICT
17. This analysis focuses on investment in and use of information and communications technology (ICT) rather than on the production of ICT. Although ICT investment might be considered an input rather than a performance indicator, studies show a significant link between ICT investment and MFP growth at the firm level (OECD, 2003b; Brynjolfsson and Hitt, 2003). As enterprises have equipped their personnel with more computing power, these ICT investments have boosted labour productivity. Greater use of ICT has also allowed production, consumption and exchange to be reorganised in a way that economises on both labour and capital and boosts multi-factor productivity (MFP). Not all countries are large producers of ICT equipment but they can enjoy the full benefits of ICT investment and reorganised production. Furthermore, owing to rapidly falling relative prices of ICT, welfare benefits are accruing more to consumers of ICT rather than producers. The two aspects (investment and use) of ICT performance are measured by 7 indicators (Annex 1).
18. The comparison of country performance through distributions based on random weights suggests a robust division of countries into different groups (Figure 5). The United States, Australia, Finland and Sweden are in the first group followed by Canada, Denmark, New Zealand and Norway. Canada could potential be included among the best countries, at it is doing very well on the investment indicators and pick-up growth, whereas the indicator for business’ usage of the Internet is ranked very low (ranking 12). For Denmark it is the other way around. Denmark is doing very well on Internet and computers usage, whereas its investment and pick-up growth are weak. Norway has missing data for the share of investment in ICT and investment’s contribution to growth, where the other Nordic countries had relatively low values. Its ranking is consequently based on computer and Internet use, where it has an average performance. The high Norwegian ranking is consequently higher due to its missing values for the investment indicators and should consequently be treated with more care than the ranking of Canada and Denmark where all indicators are available. The high ranking of New Zealand is, like Norway, based on good performance on usage, whereas all investment and pick-up indicators are missing.
13

Figure 5. Good performing countries in seizing the benefits of ICT
0
10
20
30
40
50
60
70
80
90
100
United
States
Austral
ia
Finlan
d
Sweden
New Zeal
and
Denmark
Canad
a
Norway
Netherl
ands
United
King
dom
Irelan
d
German
yKore
aJap
an
Austria Ita
ly
Belgium Spa
in
Czech R
epub
licFran
ce
Hunga
ry
Poland
Greece
Portug
al
Slovak
Repub
lic
Top 10
Top 5
Top 3
Note: Probability of having a given rank based on 10 000 randomly assigned weights on the indicators Mexico and Switzerland have been excluded from the calculation due to outlier performance in growth-catch-up and lack of data on the other indicators.
Fostering development and exploitation of science and technology.
19. The innovation driver has been narrowed to focus on the development and exploitation of science and technology. Assessment of performance includes a country’s ability not only to develop new products, processes, services and systems, but also to diffuse technologies (both domestic and foreign) throughout the economy. Eight indicators are included to measure these two aspects of innovation (Annex 1). The development and exploitation of novel products, processes, services and systems and their constant upgrading is key to sustaining growth and productivity. Even more important is their subsequent diffusion. For all but the largest of OECD countries, the great majority of novel products and ideas will come from abroad, and countries must be effective at exploiting new science and technology appropriate to their needs. These measures are also based on a large amount of qualitative information obtained from surveys, such as the Community Innovation Survey (CIS).
20. Finland, Germany, Japan and the United States show consistently good performance based on the indicators relating to development of new products, processes, services and systems. Finland, Germany and the United States as well as Sweden and the Netherlands also do well on the indicators measuring technology diffusion. Taking these two groups together, Sweden, Switzerland, Germany, Finland, the United States, Japan and the Netherlands are indicated as candidates for further analysis (Figure 6).
14
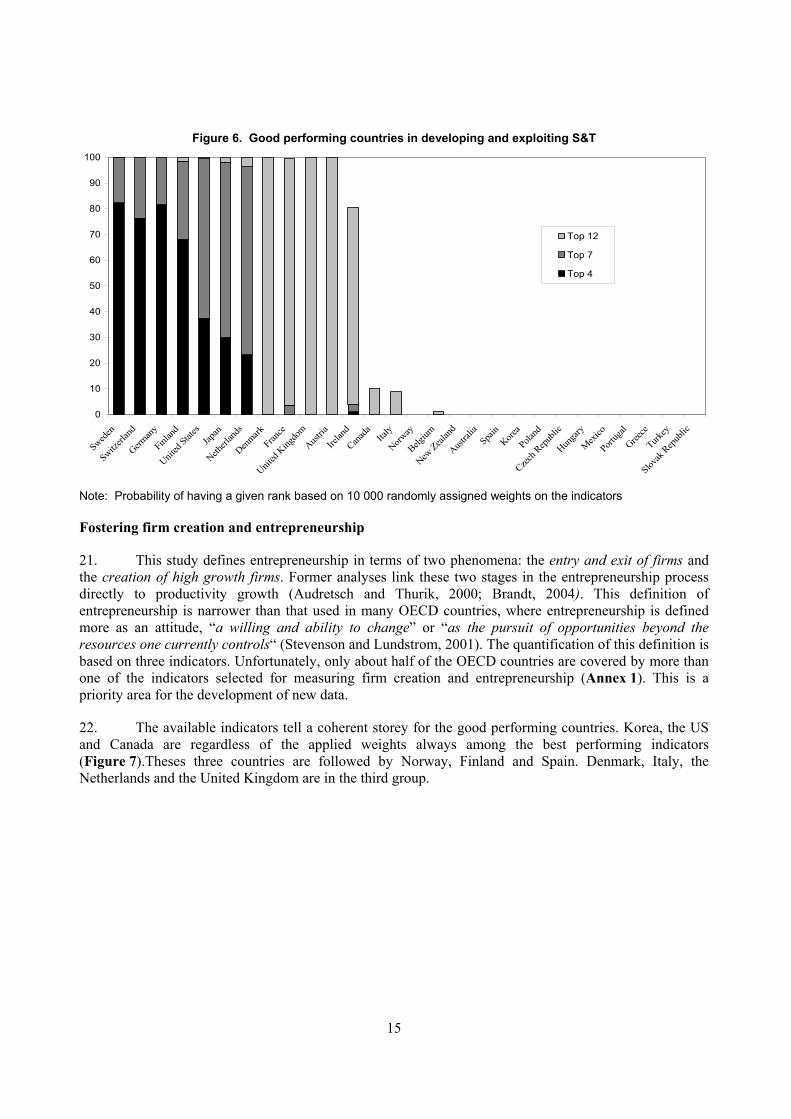
Figure 6. Good performing countries in developing and exploiting S&T
0
10
20
30
40
50
60
70
80
90
100
Sweden
Switzerl
and
German
y
Finlan
d
United
States
Japan
Netherl
ands
Denmark
France
United
King
dom
Austria
Irelan
d
Canad
aIta
ly
Norway
Belgium
New Zeal
and
Austral
iaSpa
inKore
a
Poland
Czech R
epub
lic
Hunga
ry
Mexico
Portug
al
Greece
Turkey
Slovak
Rep
ublic
Top 12
Top 7
Top 4
Note: Probability of having a given rank based on 10 000 randomly assigned weights on the indicators
Fostering firm creation and entrepreneurship
21. This study defines entrepreneurship in terms of two phenomena: the entry and exit of firms and the creation of high growth firms. Former analyses link these two stages in the entrepreneurship process directly to productivity growth (Audretsch and Thurik, 2000; Brandt, 2004). This definition of entrepreneurship is narrower than that used in many OECD countries, where entrepreneurship is defined more as an attitude, “a willing and ability to change” or “as the pursuit of opportunities beyond the resources one currently controls“ (Stevenson and Lundstrom, 2001). The quantification of this definition is based on three indicators. Unfortunately, only about half of the OECD countries are covered by more than one of the indicators selected for measuring firm creation and entrepreneurship (Annex 1). This is a priority area for the development of new data.
22. The available indicators tell a coherent storey for the good performing countries. Korea, the US and Canada are regardless of the applied weights always among the best performing indicators (Figure 7).Theses three countries are followed by Norway, Finland and Spain. Denmark, Italy, the Netherlands and the United Kingdom are in the third group.
15

Figure 7. Good performing countries in firm creation and entrepreneurship
0
1 0
2 0
3 0
4 0
5 0
6 0
7 0
8 0
9 0
1 0 0
Korea
Canad
a
United
States
Finlan
d
Norway
Spain
Netherl
ands Ita
ly
Denmark
United
King
dom
Sweden
Portug
al
German
yFran
ce
Belgium
T o p 1 0
T o p 6
T o p 3
Note: Probability of having a given rank based on 10 000 randomly assigned weights on the indicators
Selecting countries for further analysis
23. The analysis builds on the idea that countries can find inspiration for policy reforms within a given micro-driver by looking at policy initiatives implemented in countries that based on the available indicators are having superior performance. A total of eight countries are selected for further analysis based on their performance in the four drivers of growth (Table 2). In three of the drivers, the selected countries are simply the countries in the best performing group in the presented robustness analysis. In the last driver, developing and exploiting science and technology, assessment of performance and policies is best done within the framework of their national innovation systems (NIS) (OECD, 2004e). When countries are grouped according to their NIS characteristics, the following are identified as those whose policy approaches may prove most interesting: Finland (small country with mostly indigenous technologies, the Netherlands (small country with mostly imported technologies), Japan (large country with mostly imported technologies) and the United States (large country with mostly indigenous technologies).
24. A high degree of similarity exists among the countries selected. The United States, for example, are selected for all growth drivers. Finland is selected in three drivers. Sweden, Canada and the Netherlands are selected on two drivers. Theoretically, good performance on the micro-drivers should lead to good performance at the macro-level, particularly with regard to MFP growth. This is true of the selected countries with the exception of Japan. However, all in all, there is a good overlap between the selected good performing countries and their macro-level performance.
16

Table 2. Good performing countries selected for further analysis
Ensuring productive use of the highly-skilled
Seizing the benefits of ICT
Exploiting and diffusing science and technology
Fostering firm creation and
entrepreneurship
Selected countries for analysis
Finland, Netherlands Sweden United States
Australia Canada Finland Sweden United States
Finland Japan Netherlands United States
Canada Korea United States
17
IDENTIFYING CRITICAL POLICY AREAS
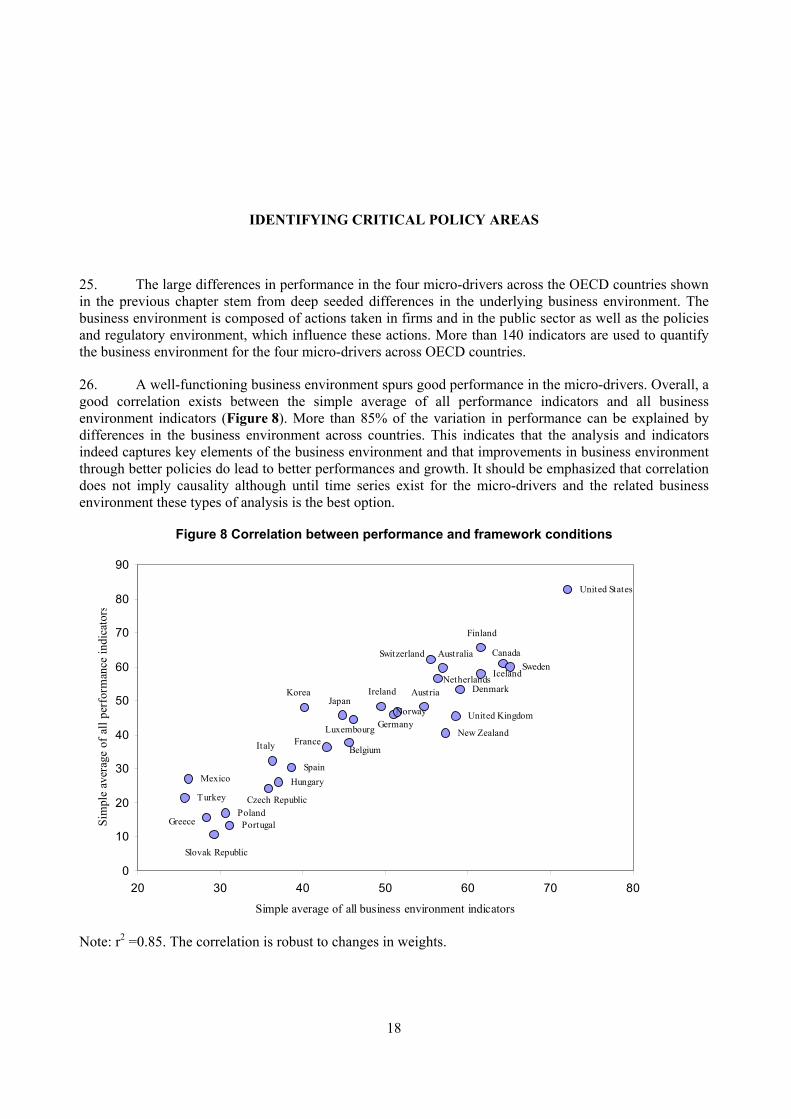
25. The large differences in performance in the four micro-drivers across the OECD countries shown in the previous chapter stem from deep seeded differences in the underlying business environment. The business environment is composed of actions taken in firms and in the public sector as well as the policies and regulatory environment, which influence these actions. More than 140 indicators are used to quantify the business environment for the four micro-drivers across OECD countries.
26. A well-functioning business environment spurs good performance in the micro-drivers. Overall, a good correlation exists between the simple average of all performance indicators and all business environment indicators (Figure 8). More than 85% of the variation in performance can be explained by differences in the business environment across countries. This indicates that the analysis and indicators indeed captures key elements of the business environment and that improvements in business environment through better policies do lead to better performances and growth. It should be emphasized that correlation does not imply causality although until time series exist for the micro-drivers and the related business environment these types of analysis is the best option.
Figure 8 Correlation between performance and framework conditions
United States
United Kingdom
Turkey
SwitzerlandSweden
Spain
Slovak Republic
PortugalPoland
Norway
New Zealand
Netherlands
Mexico
Luxembourg
KoreaJapan
Italy
Ireland
Iceland
Hungary
Greece
Germany
France
Finland
Denmark
Czech Republic
Canada
Belgium
Austria
Australia
0
10
20
30
40
50
60
70
80
90
20 30 40 50 60 70 80
Simple average of all business environment indicators
Sim
ple
aver
age
of a
ll pe
rfor
man
ce in
dica
tors
Note: r2 =0.85. The correlation is robust to changes in weights.
18
27. A well-functioning business environment does not develop by itself. Policy actions are needed but not all policy areas are equally important for growth. Priorities are needed. This chapter attempts to identify the critical policy areas for each micro-driver (Box 3).
Box 3: Identifying the critical policy areas
Based on various analytical and empirical methods, a hierarchy of priorities can be established. Two approaches are used in this work to determine the most important policy areas. First, correlation analyses are used to determine which policy areas have the highest correlation with performance. A high correlation between policy area indicators and the performance indicators implies that the policy in question is important for that specific driver. Secondly, analysis of the business environment in the good performing countries provides additional insights. If the top-performing countries have particularly strong framework conditions in specific policy areas it is taken as an indication that the policy area(s) in questions are highly important. A strong area is determined on the basis of the average value for the good performing countries. If the higher value of a policy area among the good performing countries are higher than the average for all framework conditions among the good performing countries then the area is said to be highly prioritised. Sensitivity analyses are performed on the importance of the applied weights for these results (OECD, 2005a).
Methods are still being developed, and any meaningful break down of policy areas should be supplemented by qualitative assessments and the inclusion of various studies. Furthermore, policy priorities change over time, so the conclusions in this chapter should not be taken as universal and unchangeable.
Enhancing human capital and realising its potential
28. Skilled human capital is essential to making the best use of the other micro-drivers of growth but does also have a direct effect on productivity. The business environment affecting the number and quality of highly-skilled people is comprised of several components, most of which are influenced by public policies, either directly (e.g. public expenditures on education) or indirectly (e.g. use of flexible work arrangements). Here, a total of 39 indicators in ten areas are used to quantify the business environment. Again, a high correlation exists between the business environment indicators and the performance indicators (Figure 9).
19
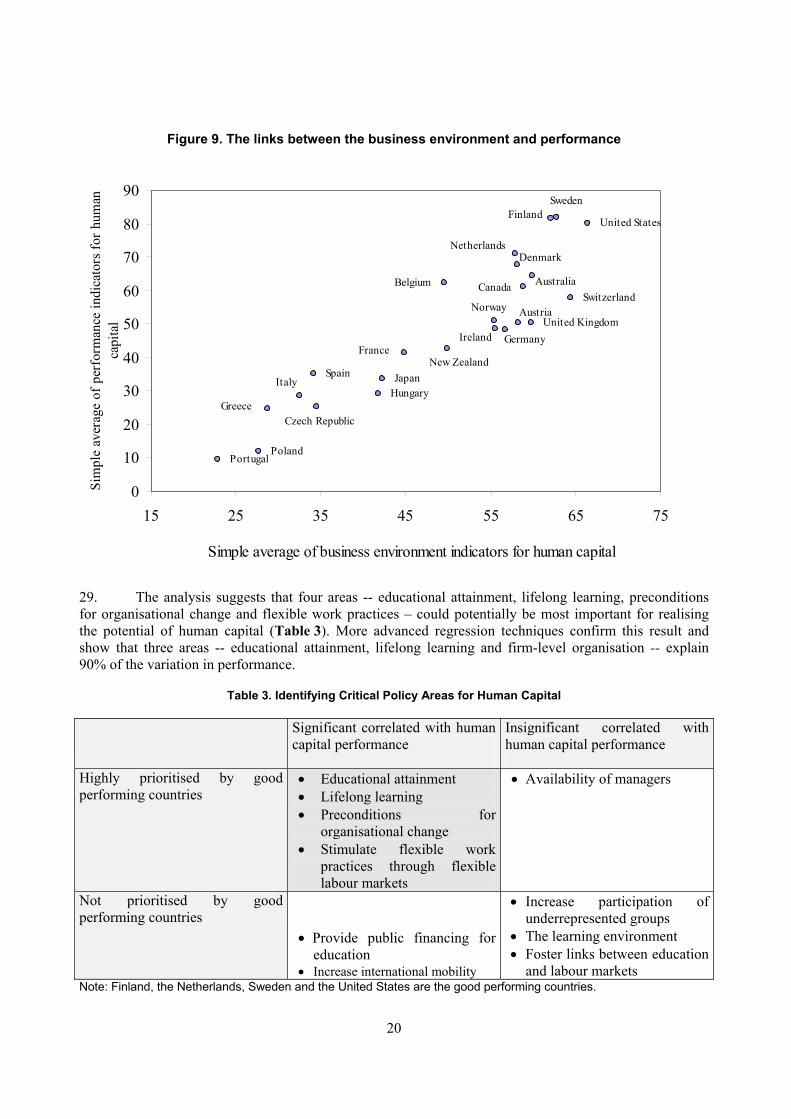
Figure 9. The links between the business environment and performance
United States
Australia
United Kingdom
Sweden
Switzerland
Denmark
Germany
Finland
Canada
New Zealand
Netherlands
AustriaNorway
Ireland
Belgium
France
JapanHungary
Czech Republic
Spain
Poland
Italy
Greece
Portugal
0
10
20
30
40
50
60
70
80
90
15 25 35 45 55 65 75
Simple average of business environment indicators for human capital
Sim
ple
aver
age
of p
erfo
rman
ce in
dica
tors
for h
uman
ca
pita
l
29. The analysis suggests that four areas -- educational attainment, lifelong learning, preconditions for organisational change and flexible work practices – could potentially be most important for realising the potential of human capital (Table 3). More advanced regression techniques confirm this result and show that three areas -- educational attainment, lifelong learning and firm-level organisation -- explain 90% of the variation in performance.
Table 3. Identifying Critical Policy Areas for Human Capital
Significant correlated with human capital performance
Insignificant correlated with human capital performance
Highly prioritised by good performing countries
• Educational attainment • Lifelong learning • Preconditions for
organisational change • Stimulate flexible work
practices through flexible labour markets
• Availability of managers
Not prioritised by good performing countries
• Provide public financing for education
• Increase international mobility
• Increase participation of underrepresented groups
• The learning environment • Foster links between education
and labour markets Note: Finland, the Netherlands, Sweden and the United States are the good performing countries.
20
Seizing the benefits of ICT
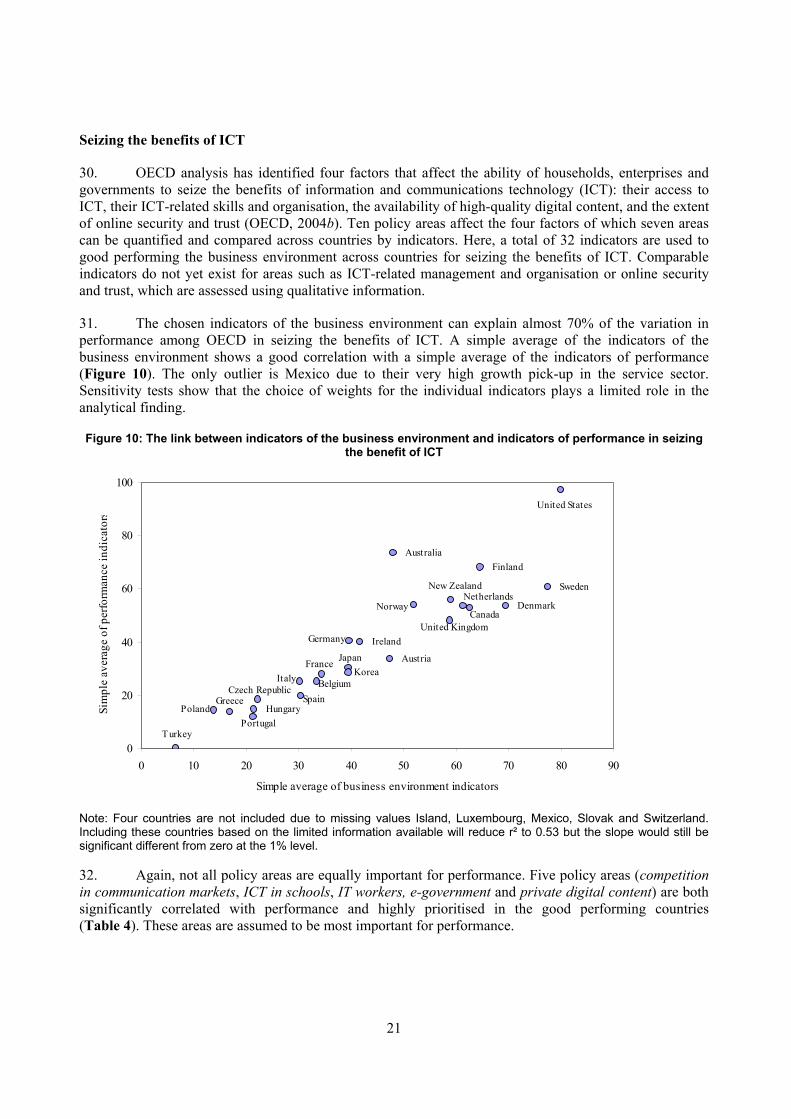
30. OECD analysis has identified four factors that affect the ability of households, enterprises and governments to seize the benefits of information and communications technology (ICT): their access to ICT, their ICT-related skills and organisation, the availability of high-quality digital content, and the extent of online security and trust (OECD, 2004b). Ten policy areas affect the four factors of which seven areas can be quantified and compared across countries by indicators. Here, a total of 32 indicators are used to good performing the business environment across countries for seizing the benefits of ICT. Comparable indicators do not yet exist for areas such as ICT-related management and organisation or online security and trust, which are assessed using qualitative information.
31. The chosen indicators of the business environment can explain almost 70% of the variation in performance among OECD in seizing the benefits of ICT. A simple average of the indicators of the business environment shows a good correlation with a simple average of the indicators of performance (Figure 10). The only outlier is Mexico due to their very high growth pick-up in the service sector. Sensitivity tests show that the choice of weights for the individual indicators plays a limited role in the analytical finding.
Figure 10: The link between indicators of the business environment and indicators of performance in seizing the benefit of ICT
Australia
Austria
Belgium
Canada
Czech Republic
Denmark
Finland
France
Germany
GreeceHungary
Ireland
Italy
JapanKorea
NetherlandsNew Zealand
Norway
PolandPortugal
Spain
Sweden
Turkey
United Kingdom
United States
0
20
40
60
80
100
0 10 20 30 40 50 60 70 80 90
Simple average of business environment indicators
Sim
ple
aver
age
of p
erfo
rman
ce in
dica
tors
Note: Four countries are not included due to missing values Island, Luxembourg, Mexico, Slovak and Switzerland. Including these countries based on the limited information available will reduce r² to 0.53 but the slope would still be significant different from zero at the 1% level. 32. Again, not all policy areas are equally important for performance. Five policy areas (competition in communication markets, ICT in schools, IT workers, e-government and private digital content) are both significantly correlated with performance and highly prioritised in the good performing countries (Table 4). These areas are assumed to be most important for performance.
21
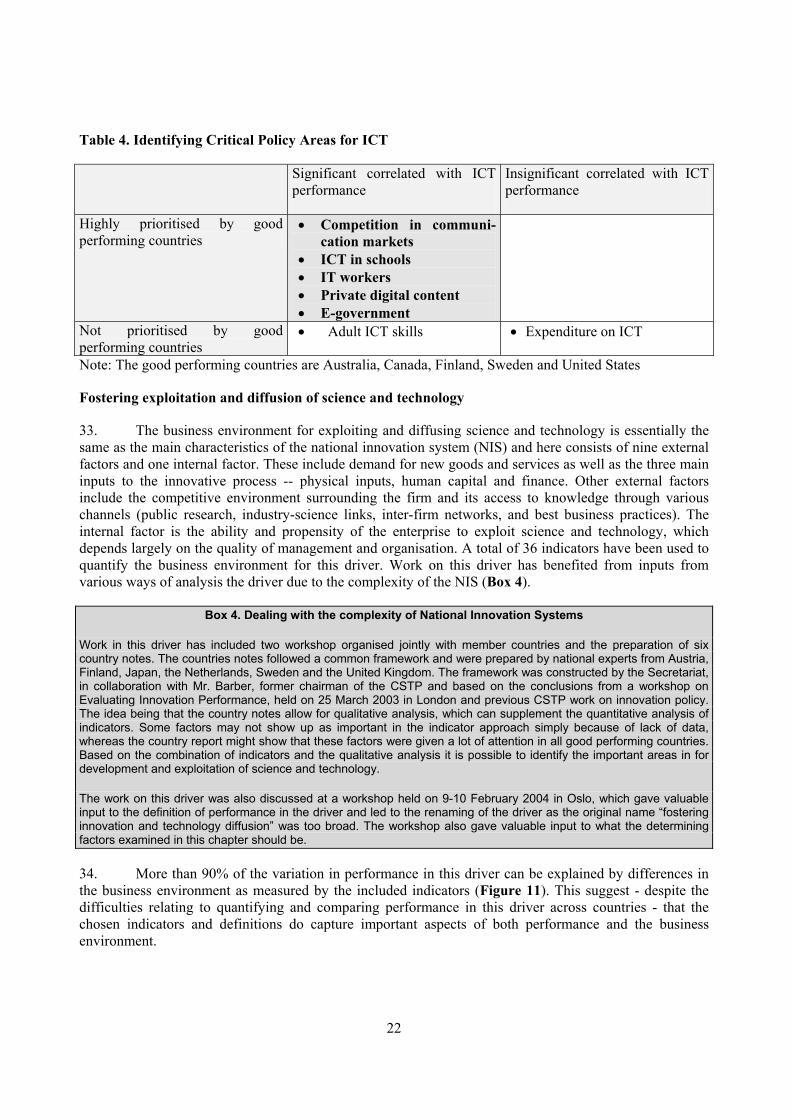
Table 4. Identifying Critical Policy Areas for ICT
Significant correlated with ICT performance
Insignificant correlated with ICT performance
Highly prioritised by good performing countries
• Competition in communi-cation markets
• ICT in schools • IT workers • Private digital content • E-government
Not prioritised by good performing countries
• Adult ICT skills • Expenditure on ICT
Note: The good performing countries are Australia, Canada, Finland, Sweden and United States
Fostering exploitation and diffusion of science and technology
33. The business environment for exploiting and diffusing science and technology is essentially the same as the main characteristics of the national innovation system (NIS) and here consists of nine external factors and one internal factor. These include demand for new goods and services as well as the three main inputs to the innovative process -- physical inputs, human capital and finance. Other external factors include the competitive environment surrounding the firm and its access to knowledge through various channels (public research, industry-science links, inter-firm networks, and best business practices). The internal factor is the ability and propensity of the enterprise to exploit science and technology, which depends largely on the quality of management and organisation. A total of 36 indicators have been used to quantify the business environment for this driver. Work on this driver has benefited from inputs from various ways of analysis the driver due to the complexity of the NIS (Box 4).
Box 4. Dealing with the complexity of National Innovation Systems
Work in this driver has included two workshop organised jointly with member countries and the preparation of six country notes. The countries notes followed a common framework and were prepared by national experts from Austria, Finland, Japan, the Netherlands, Sweden and the United Kingdom. The framework was constructed by the Secretariat, in collaboration with Mr. Barber, former chairman of the CSTP and based on the conclusions from a workshop on Evaluating Innovation Performance, held on 25 March 2003 in London and previous CSTP work on innovation policy. The idea being that the country notes allow for qualitative analysis, which can supplement the quantitative analysis of indicators. Some factors may not show up as important in the indicator approach simply because of lack of data, whereas the country report might show that these factors were given a lot of attention in all good performing countries. Based on the combination of indicators and the qualitative analysis it is possible to identify the important areas in for development and exploitation of science and technology.
The work on this driver was also discussed at a workshop held on 9-10 February 2004 in Oslo, which gave valuable input to the definition of performance in the driver and led to the renaming of the driver as the original name “fostering innovation and technology diffusion” was too broad. The workshop also gave valuable input to what the determining factors examined in this chapter should be.
34. More than 90% of the variation in performance in this driver can be explained by differences in the business environment as measured by the included indicators (Figure 11). This suggest - despite the difficulties relating to quantifying and comparing performance in this driver across countries - that the chosen indicators and definitions do capture important aspects of both performance and the business environment.
22

Figure 11. Correlation between performance and business environment
United States
United Kingdom
Turkey
Switzerland
Sweden
Spain
Slovak Republic
Portugal
Poland
Norway
New Zealand
Netherlands
Mexico
Korea
Japan
Italy
Ireland
Hungary
Greece
Germany
France
Finland
Denmark
Czech Republic
CanadaBelgium
Austria
Australia
0
10
20
30
40
50
60
70
80
90
0 10 20 30 40 50 60 70 8Simple average of business environment indicators for S&T
Sim
ple
aver
age
of p
erfo
rman
ce in
dica
tors
for S
&
0
T
35. Country performance depends not only on how it performs on each individual element of the NIS, but also on how these separate elements interact and their degree of cohesiveness (OECD, 2004e). There are several different configurations which can lead to successful overall performance in the exploitation and diffusion of science and technology. Based on the methodology applied in this project some areas do however seem to be more important than others (Table 5). Quality of public research, Promoting industry and science links and demand for new products, processes and services are both significant correlated with the performance indicators and highly prioritised in the good performing countries.
Table 5. Identifying Critical Policy Areas for Exploitation and Diffusion of S&T
Significant correlated with S&T performance
Insignificant correlated with S&T performance
Highly prioritised by good performing countries
• Quality of public research • Promoting industry and
science links • Demand for new products,
processes and services
• Skilled human resources, • Networks and clusters, • Business best practices
Not prioritised by good performing countries
• Venture capital • Subsidies and incentives • Market processes • Level of public research • Relevance of public research
Note: The good performing countries are Finland, Japan, the Netherlands and the United States
23
Fostering firm creation and entrepreneurship
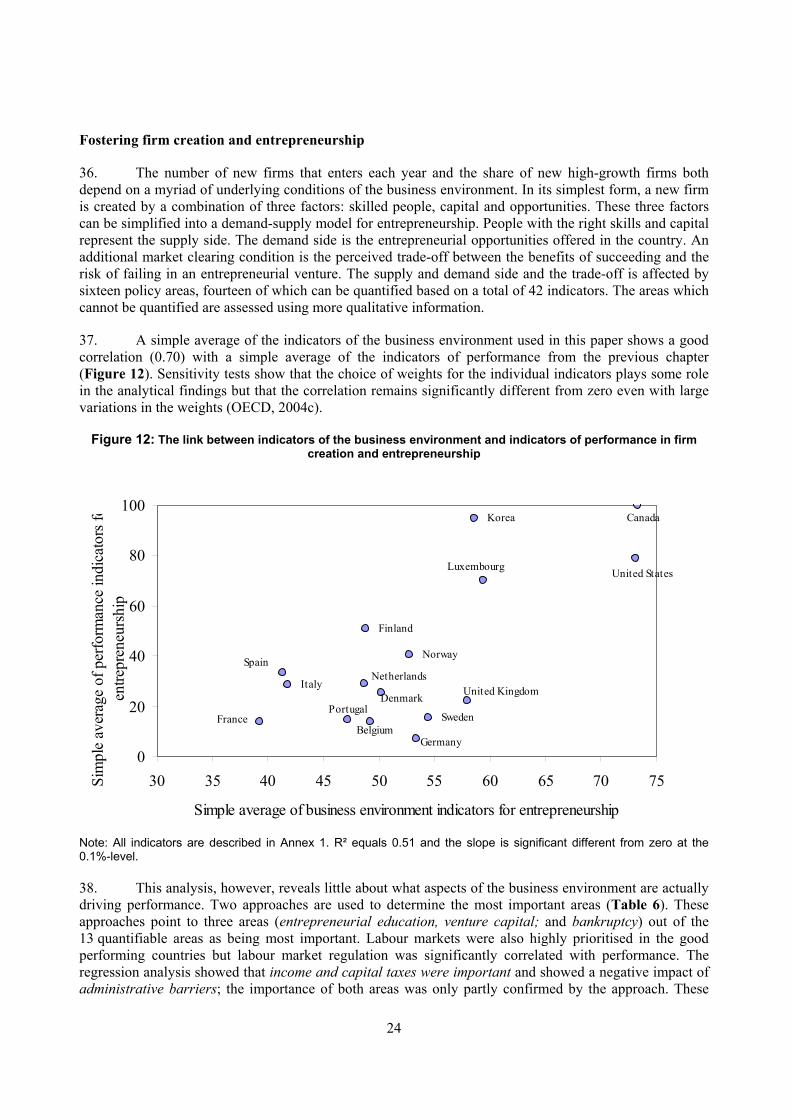
36. The number of new firms that enters each year and the share of new high-growth firms both depend on a myriad of underlying conditions of the business environment. In its simplest form, a new firm is created by a combination of three factors: skilled people, capital and opportunities. These three factors can be simplified into a demand-supply model for entrepreneurship. People with the right skills and capital represent the supply side. The demand side is the entrepreneurial opportunities offered in the country. An additional market clearing condition is the perceived trade-off between the benefits of succeeding and the risk of failing in an entrepreneurial venture. The supply and demand side and the trade-off is affected by sixteen policy areas, fourteen of which can be quantified based on a total of 42 indicators. The areas which cannot be quantified are assessed using more qualitative information.
37. A simple average of the indicators of the business environment used in this paper shows a good correlation (0.70) with a simple average of the indicators of performance from the previous chapter (Figure 12). Sensitivity tests show that the choice of weights for the individual indicators plays some role in the analytical findings but that the correlation remains significantly different from zero even with large variations in the weights (OECD, 2004c).
Figure 12: The link between indicators of the business environment and indicators of performance in firm creation and entrepreneurship
United States
United Kingdom
Sweden
Spain
Portugal
Norway
Netherlands
Luxembourg
Korea
Italy
Germany
France
Finland
Denmark
Canada
Belgium
0
20
40
60
80
100
30 35 40 45 50 55 60 65 70 75
Simple average of business environment indicators for entrepreneurship
Sim
ple
aver
age
of p
erfo
rman
ce in
dica
tors
foen
trepr
eneu
rshi
p
Note: All indicators are described in Annex 1. R² equals 0.51 and the slope is significant different from zero at the 0.1%-level.
38. This analysis, however, reveals little about what aspects of the business environment are actually driving performance. Two approaches are used to determine the most important areas (Table 6). These approaches point to three areas (entrepreneurial education, venture capital; and bankruptcy) out of the 13 quantifiable areas as being most important. Labour markets were also highly prioritised in the good performing countries but labour market regulation was significantly correlated with performance. The regression analysis showed that income and capital taxes were important and showed a negative impact of administrative barriers; the importance of both areas was only partly confirmed by the approach. These
24

four (loans and loan guarantees; income and capital taxes; administrative barriers and labour market regulation) are consequently considered somewhat less important than the three areas mentioned above. Finally, the qualitative analysis showed that private business services should be included, as an important area although the role for government is unclear.
Table 6. Identifying Critical Policy Areas for Entrepreneurship
Significant correlated with entrepreneurship performance
Insignificant correlated with entrepreneurship performance
Highly prioritised by good performing countries
• Entrepreneurial education • Access to venture capital • Bankruptcy regimes
• Labour market regulation
Not prioritised by good performing countries
• Legal framework start-ups • Income taxation • Business taxation • Wealth and bequest tax
• Deregulation of protected sectors
• Loans and loan guarantees • Stock markets • Incubators
Note: The good performing countries are Canada, Korea and the United States
Selecting critical policy areas for further analysis
Critical policy areas have been identified for each of the four micro-drivers. These policy areas should be seen as a first attempt to produce a prioritised list of policy areas to be included in a coherent growth strategy for the micro-level of the economy (Table 7). Countries should not ignore or neglect other policy areas but they should start their policy efforts by looking at their business environment in these critical areas. The policy insights will develop over time as the analysis and the underlying data improve. The following chapter will identify actual micro-policies relating to these critical areas by examining the policy mix in good performing countries.
Table 7. Good performing countries selected for further analysis
Ensuring productive use of the highly-
skilled
Seizing the benefits of ICT
Exploiting and diffusing science and
technology
Fostering firm creation and
entrepreneurship
Critical policy areas
• Educational attainment
• Lifelong learning • Preconditions for
organisational change
• Flexible work practices through flexible labour markets
• Competition in communication markets
• ICT in schools • IT workers • E-government • Private digital
content
• Quality of public research
• Promoting industry and science links
• Demand for new products, processes and services
• Entrepreneurial education
• Access to venture capital
• Bankruptcy regimes
• Taxes
25
IDENTIFYING EFFECTIVE MICRO-POLICIES
39. The critical micro-policy areas identified in the previous chapter are assumed to be general, whereas the underlying structures and micro-policies can vary among countries. Micro-policies implemented in one country may not necessarily be practical or effective approaches in other countries. A first-best micro-policy solution might consequently not exist. This chapter highlights what works in good performing countries. This analysis based on the findings and policy recommendations emanating from the ongoing country peer reviews and other work done within the project (OECD, 2005a). These solutions represent practical approaches to common policy problems country faced when deal with the critical policy areas. The intent is to identify effective micro-policies to provide inspiration to other OECD countries in their policy-making in these areas. The analysis first highlights the main challenges for each of the critical policy areas and then examines the policy approaches which are common to the good performing countries. In this examination, emphasis is put on national evaluations of policies and other quantitative and qualitative evidence of their effectiveness.
Micro-policies for enhancing human capital and realising its potential
40. Three policy areas emerge from the analysis as key for enhancing human capital and realising its potential: i) increasing the quality and relevance of educational attainment, ii) providing incentives to firms and individuals for continuous training and lifelong learning, and iii) fostering knowledge-based management and organisation in enterprises. The good performing countries – Finland, the Netherlands, Sweden and the United States – have implemented effective approaches in these areas.
41. First, tertiary educational attainment in the four countries is among the highest in the OECD: over 30% of the population aged 25-64 in the United States, Finland and Sweden have higher education and over 24% in the Netherlands. The United States, Sweden and the Netherlands have among the highest expenditures per student for higher education in the OECD. Public funding of higher education – through grants and loans to students and direct funding of educational institutions – is deemed necessary to realise social returns as well as to make access to tertiary education more equitable. This is especially important in countries where private returns to education are lowered by high marginal tax rates, as in Sweden.
42. Stimulating competition among educational institutions, either directly or through their financing and evaluations, is a primary means of reducing costs and increasing quality. It is a challenge to match the number and qualifications of graduates to the needs of the business community. The good performing countries have emphasised increasing the cost-effectiveness of their supports to higher education and ensuring the relevance of studies and graduates to labour market needs. Augmenting rates of return for individuals is a means for increasing university enrolments. Comparing the costs of tertiary education (e.g. tuition fees) to the gains thereafter (e.g. earnings) shows that rewards appear to be higher in the United States, the Netherlands and Sweden than in most other OECD countries. In the United States, rates of return to education exceeding 15% are largely due to competition among institutions and relatively short university studies. With this in mind, other countries such as Finland have undertaken reforms to increase the range of study choices, shorten the time required to complete a tertiary degree, and encourage students to gain employment at an earlier age.
26

43. Another means of enhancing educational quality is linking higher education to the conduct of government-financed research and development (R&D). The share of research performed by the academic sector can be an important determinant of innovation performance. Sweden, Finland, the Netherlands and the United States are among those countries which have the highest shares of R&D conducted by the higher education sector. The United States spends the most on tertiary-level institutions, largely for R&D projects. Swedish government research funds are allocated through both grants to universities, where most publicly-funded research is conducted, and research councils. Finland recently established a series of “graduate schools” covering the main areas of research and forming a nationwide network. Research performed by tertiary institutions is also substantial in the Netherlands, where many universities receive funds from the government-funded Netherlands Organisation for Scientific Research (WNO).
44. Second, firm-level or work-related training is an area where significant market failures exist. Because firms cannot internalise the benefits of training which may accrue to future employers, they tend to under-invest in upgrading of skills. Yet technological change requires continuous upgrading of labour force skills. Firms as well as governments have a stake in ensuring that workers, including the highly-skilled, receive training to increase their ability to adapt to new technologies and tasks. The good performing countries have among the highest rates of adult participation in continuous education and training in the OECD. They have used tripartite agreements with the social partners and levy-based schemes to raise the level of enterprise training above that set by the market.
45. In the Netherlands, Finland and Sweden, collective bargaining has resulted in provisions that generalise the right to training. The Netherlands has a system of training levies on firms at the sectoral level which are supplemented by government grants. There is a similar approach in Finland, where contributions by the government, enterprises and worker councils provide for the subsidisation of wages while on training leave. In addition, Finnish law requires that all companies with more than 30 workers submit annual training plans to joint enterprise committees and negotiate these with employee representatives.
46. In Sweden, around 40% of workers receive some sort of employer-sponsored training each year. Sectoral agreements between unions and employers establish company-level assessments of qualification needs and the design of training plans. In the United States, sectors with high union participation, including the aerospace, automotive and telecommunications industries, also raise training funds through levies on enterprises. In these four countries, cost-sharing arrangements and partnerships between firms, governments and other stakeholders have been successful in addressing the risks and costs of training for enterprises.
47. Individuals as well as enterprises need incentives to overcome barriers to investing in lifelong learning. The good performing countries have offset the costs and time constraints of life-long learning for workers through competence exams and/or “individual learning accounts” (ILAs). These are self-managed savings accounts earmarked for training, where the contributions from the account holder are supplemented by the employer and/or the government. The Netherlands has undertaken 8 ILA pilot projects aimed at different types of workplace-related skills and financed by the government, the workers themselves and employers or sectoral training funds.
48. Sweden has also initiated an ILA programme aimed at competence development for those over 25 years of age, where the government provides an initial contribution. In the United States, ILAs are common at state level, where they have proven effective in increasing individual motivations to invest in continuous training and in leveraging public and private sources of funds. Finland implemented a system of competence-based qualifications to promote lifelong learning via vocational exams which credit current skills. Such schemes to give incentives to individuals to invest in training have been shown to increase overall levels of continuous education and worker skills
27
49. The good performing countries have taken steps to increase the share of workers in small firms which receive training. Training by small firms is significantly less than in larger enterprises and varies widely across countries. Small firm employees in Finland, the Netherlands, Sweden and the United States are far more likely to be trained than in other OECD countries. These governments have adopted innovative schemes for helping small enterprises expand their capacity to develop skilled human resources. In the United States, the Small Business Administration (SBA) offers a series of training schemes for small and medium businesses with the intent of upgrading their managerial and worker skills. The US also encourages networking between large firms, smaller enterprises and worker representatives to disseminate training best practices.
50. NUTEK, the Swedish Business Development Agency, launched IT.SME in 2000 to enhance the ICT skills training of workers in smaller firms. It is financed by the Swedish government and run in collaboration with the Federation of Private Enterprises and other business organisations. The Finnish government has used European regional and structural funds to create the Adaptation of the Workforce to Structural Change (ADAPT) programme to develop professional skills as well as flexibility and mobility among small firm workers. The Netherlands government finances “employability advisors” to inform and convince small enterprises about the value of training and initiated a new scheme, Benefit from People and Knowledge to provide 16 000 small enterprises with advice on training and other personnel matters.
51. Third, realising the full potential of skilled human capital requires new approaches to enterprise management and organisation. These work practices place a premium on flexibility, adaptability, continuous learning and the ability to transfer experience and skills development between activities. However, the role for governments in fostering knowledge-based organisation and management in firms is not fully understood or agreed. The common approaches taken in the good performing countries include promoting flexible work approaches through labour market policies, providing an example to firms through adopting knowledge-based management approaches in the public sector, and implementing special schemes to upgrade managerial skills in small firms.
52. In order to foster flexible work practices in the private sector, governments must first ensure that labour market policies provide the appropriate framework. For example the good performing countries have taken steps to improve employment conditions for part-time workers. In the Netherlands, a series of “flexicurity” agreements greatly reduced the wage disparity between part-time and full-time workers and gave greater flexibility for full-time employment while increasing security for part-time workers. In Sweden, the principle of “non-discrimination” between full-time workers and part-time workers has been an important contributor to worker flexibility and high female labour-force participation rates. Similarly, in Finland, legislation on employment contracts, periods of notice, redundancy pay, etc. apply equally to full-time and part-time workers.
53. Reducing tax disincentives to more flexible working arrangements has also played a role. Over the past two decades, the relative tax rates of second earners declined in Finland, Sweden and the United States relative to other OECD countries. This increased the neutrality of taxation of individuals, thus allowing more family members to work in part-time employment. In Finland and Sweden, the tax assessment formulae ensure that the same tax rate applies irrespective of the marital situation and the employment status or income of any partner. In the United States, households may choose their tax status thus allowing for benefits in the event of a sole breadwinner and reducing the burden in accordance with marital status.
54. The good performing countries have also provided practical examples of flexible work approaches by rethinking hiring practices and work arrangements in the public sector. Research institutions, for example, are being reformed. In the Netherlands, decentralisation has meant that academics are no longer civil servants, and hiring decisions and human resource management are dealt with by
28
universities in conjunction with trade unions. Similarly, in Sweden, the government has devolved much of its power over human resource issues in universities to introduce more flexible work practices and contracts in light of increased linkages with industry. The National Technology Agency of Finland (TEKES) has promoted less contractual and workplace rigidity in universities and the research sector through funding for technology-based partnerships and cluster activities. In the United-States, the introduction of more flexible contracts is accompanied by flexible wage-setting mechanisms so that higher wages might offset less secure positions and maintain incentives to joint the public research sector.
55. Good management skills are important in smaller enterprises which must be quick to adapt to changing markets and circumstances. To aid small-firm survival rates and increase management capabilities in SMEs, the good performing countries have developed manager-training programmes specifically targeted to SMEs. In Finland, 15 regional Employment and Economic Development Centres provide courses to small firm managers to develop their ability to analyse, plan and develop business activities, adopt up-to-date management systems and methods, and develop effective leadership skills. Sweden implemented the Starting Line scheme (Startlinjen) to train managers in areas such as setting up a business and also the Växtkraft Mål 3 programme specifically designed to stimulate organisational change in small firms (below 50 employees). The programme supports an analysis of the current situation in the company and its future position, which is used to write an action plan for the company with respect to needed changes in organisation and structure and competence-building plans for all employees.
56. The Netherlands provides management training for small firms through the government-financed Institutes for Small and Medium-Sized Enterprises (IMKs) which offer courses on product innovation, team-working, quality control and external partnerships. The US Small Business Administration (SBA) supports several management training programmes, including Small Business Development Centers, the Service Corps of Retired Executives, Business Information Centers and the Women Business Centers. Evaluations have found that management training for both start-ups and established businesses contributed significantly to job creation and the leveraging of external finance from the private sector.
Micro-policies for seizing the benefits of ICT
57. Four policy areas are identified as most significant to the ability of countries to seize the benefits of information and communications technology (ICT): i) stimulating competition in communications markets, ii) developing ICT skills in the education sector (both basic skills for everyone and advanced skills for IT workers), iii) implementing e-government, and iv) stimulating development of digital content. Qualitative assessments have also indicated the importance of firm-level ICT-related managerial and organisational change, but this is difficult to quantify.
58. The timing of these policies is important. The first two policy areas (ICT skills and competitive communications markets) are part of a policy package for increased connectivity and ICT readiness, which is also the case for many e-government solutions. Polices aimed at developing private digital content and e-government solutions based on reorganisation of government services move beyond basic connectivity to facilitate more widespread uptake and use of complex ICT applications and e-business. Stimulating ICT-related managerial and organisational changes in enterprises is increasingly important as more OECD countries go beyond the stage of assuring ICT readiness.
59. First, the good performing countries are creating more competitive communications markets, which act to lower prices and increase ICT uptake, by stimulating competition both within platforms and across platforms. The first depends on measures such as accelerating the process of unbundling local loops or breaking up monopolies by allowing new entrants to lease lines from incumbents, giving subscribers lower prices and new services. According to available data on the degree of telephony liberalisation, the United States and Canada have the highest ratios of unbundled local loops, followed by Finland and
29
somewhat lower shares in Sweden and Australia. Australia is attempting to correct this through regulating the ability of incumbents to launch new services in the absence of competition and forcing incumbents to expand space allocation in existing networks.
60. Canada and the United States have also benefited from competition across platforms, e.g. between cable and telecommunications networks, both of which provide broadband connections to subscribers. Canada has the highest uptake of broadband through cable networks and ranks second, while the United States increasingly provides telephone services through cable providers and ranks around tenth in OECD broadband uptake, together with Finland. Sweden is spinning off the cable division of the incumbent telecommunications operator following a request by the European Commission. Other communications platforms include satellite, as in Australia which subsidises satellite-based Internet connections for people living in remote areas, and wireless applications, which are used in e.g. Canada to provide access in remote areas.
61. Second, the five good performing countries (Australia, Canada, Finland, Sweden and the United States) were early movers in integrating ICT training into their educational systems. They have developed and implemented national strategies for how information technology should be integrated in primary and secondary education. The strategic objective is to provide all students with basic ICT skills, particularly the ability to use a computer for basic tasks and as a tool for learning. Most OECD countries have given high priority to building basic ICT skills in schools and in developing more advanced skills through formal education or vocational training schemes (OECD, 2004b). Strategies in the selected group of countries have included subsidies to schools to help them buy computers and get on-line. The E-Rate Scheme in the United States, for example, provided almost USD 8 billion to facilitate access to the Internet for schools and libraries in underprivileged areas. Similarly, the National Action Programme for ICT in Schools in Sweden has invested USD 150 million in computer hardware and software and on-line access for schools.
62. Training teachers is also central to these national ICT strategies, which integrated information technology skills into initial and continuing teacher training. For example, the OPE.FI programme in Finland specifies ICT proficiency skills for teachers, who are selected by their school to participate in government-funded training, after which they train their colleagues using specially-designed teaching materials. In Sweden, all teachers who complete required ICT training receive a multi-media personal computer. The lack of educational software and online digital content is another challenge. The Canadian GrassRoots Project supports creation of Internet-based educational content by teachers and students, and this successful programme is now being imitated in other countries. Several countries – including Canada, Sweden and the United States -- also use School-Nets (closed secure educational networks) to disseminate online content such as dictionaries and encyclopaedias as well as Internet-based activities and projects for students.
63. Third, the good performing countries have all used e-government as a means of both delivering government services and stimulating individuals and businesses to get online. E-government can reduce administrative burdens as well as have a significant ‘demonstrator’ and ‘pull-through’ effect on ICT users. Strategies and targets were formulated for getting the most frequently-used public services online, for example, by 2005 in the United States.
64. The way e-government is constructed and mounted is also important. Canada is the most innovative in this regard through its single government portal which provides unified and standardised access to public services, with standardised web pages which reflect the needs of users. All Canadian government web pages follow Treasury Board Common Look and Feel (CLF) Standards, which enable Canadians to navigate from one federal site to another. Canada has also made these sites into real online interactive services, rather than just information sources. The United States set up a search engine to allow users to find government information and services and compensate for the lack of a common portal.
30
65. As public services are translated into an on-line format, assuring security and privacy for users is essential. Canada created the Secure Channel and Australia is developing Fedlink to allow all departments and agencies to securely receive, store and exchange electronic information and to identify clients electronically. Finland has established one-stop public service portals for private citizens and enterprises such as enterprisefinland.fi. Canada aims at ensuring the interoperability of all government systems so that firms only need to report the same information once.
66. Fourth, the development of digital content by the private sector can be encouraged by fostering an adequate technological infrastructure, by creating an environment that allows for changing business models and the entry of new market players, and by clarifying regulatory frameworks that apply to the creation and the distribution of digital content. On the technological side, policies should focus on widespread access to the broadband infrastructure (including mobile and wireless systems), fostering public and private R&D in relevant technologies (e.g. imaging technologies), and the creation of new interactive content forms, interoperable and/or open standards, virus-free services and secure payment systems.
67. On the market side, policies that secure competition, remove obstacles to changing business models, ensure low barriers to entry and facilitate co-ordination between the different players in the value chain are needed. Legal frameworks may have to be adapted for digital content, including intellectual property rights regimes. The exploitation of public sector information (e.g. geographical and meteorological data, archives, cultural and educational information) through access to public content resources is a means to increase digital content. This can involve rearranging the structure of public information, changing budgetary practices and establishing clear pricing rules for access. In this way, governments can have an impact on setting standards for, e.g. electronic signatures, payment.
68. The good performing countries have an environment beneficial to the development of private and public digital content. Canada, the United States, Finland and Sweden all have greater broadband penetration (subscribers per 100 inhabitants) than the OECD average. The United States competitive content and high-technology industries that are at the forefront of moving content online. The US also has a legal framework (Digital Millennium Copyright Act) that fosters the protection of copyrighted works in implementing the WIPO Internet Treaties. Australia introduced Digital Agenda amendments to the 1964 Copyright Act and published a Digital Rights Management Guide to help firms understand and follow the regulations. Since 2001, the Australian government has had a commitment to develop a comprehensive Digital Content Strategy with the objective of accelerating the production, distribution and marketing of digital content and applications domestically and internationally. Australia has also integrated the regulation of content on the Internet in its Broadcasting Services Act, and its Broadband Content Fund provides seed funding for Australian digital content producers to pursue new broadband applications.
69. Canada has specified that Internet transmitters must negotiate copyrights to obtain authorisation to broadcast certain content, and the Canadian Copyright Licensing Agency has created an extensive online database of Canadian works. Canada’s information and cultural services industries have been the lead users of ICT technologies and e-commerce (OECD, 2004b). Finland and Sweden are part of the E-Europe programmes (e-Content) that foster the creation and development of digital content. A European directive also targets the commercial exploitation of public sector information. Legislation was harmonised across EU member states, and financing is provided to digital content projects that are cross-sectoral and user-oriented. Similar initiatives for public content are ongoing in the other good performing countries.
70. Ensuring the supply of information technology workers is a major challenge as demand for advanced IT skills increases and spreads throughout all sectors of the economy. Effective policies used in the good performing countries to augment the supply of skilled ICT workers include surveying labour markets to assess future skill ICT needs and integrating the results in education planning; working with the
31
private sector to develop long-term strategies for developing the ICT workforce; and increasing transparency and enhancing wage signals in the market for ICT skills.
71. The good performing countries are also emphasising ICT-related managerial and organisational change in their ICT strategies, although this area presents a challenge to governments. ICT needs to support company strategy and enhance the competitive edge of its operations. It should be combined with complementary investments in work practices, human capital, and organisational restructuring if the full benefits are to be realised. The policies used in the good performing countries fall in three categories: i) providing hard evidence and good business cases on the benefits of implementing ICT in combination with managerial and organisational changes, ii) stimulating the availability of ICT-management advisory services and training through a flexible market based system, and iii) integrating management and organisational change in public technology programmes and advisory services. For example, programmes for implementing e-business should include advice on integrating the Internet with the full range of business services and reorganising managerial practices to best implement an overall ICT strategy.
Micro-policies for fostering exploitation and diffusion of science and technology
72. All types of analyses confirmed the high importance of three policy areas for fostering exploitation and diffusion of science and technology: i) enhancing the quality of public research, ii) promoting industry and science links, and iii) stimulating demand for new products, processes and services. The micro-policies discussed in the following section are taken largely from recent country notes on innovation performance and policies (OECD, 2005c).
73. First, for the four good performing countries (Finland, Japan, the Netherlands and the United States), enhancing the quality of public research is a prime goal achieved mainly through creating centres of excellence to prioritise public support and conduct world-class research. Centres of excellence are used as a means of creating critical mass in specific research areas, promoting interdisciplinary research and encouraging public-private collaboration. They also aim to improve the quality of scientific output and fill gaps in fundamental research capabilities. Two best practices seen in these countries relating to centres of excellence are involving the private sector in co-financing research and identifying topics for research through competitive mechanisms.
74. In Finland, centres of excellence are selected for a term of six years on a competitive basis based on evaluations provided by international experts. For 2000-2007, 26 centres have been selected for government with co-financing from industry. In Japan, the 21st Century COE Programme has established university-based research units with funding from industry. These are intended to not only enhance the quality of public research but also to address problems of low researcher mobility and a dearth of research spin-offs and licensing agreements). The Netherlands created the Innovation Oriented Research Programme to support research at universities that industry regards as new and important. The private sector partly finances the research and is involved in user groups and in administering possible patents from the projects. Some of these research areas have developed into more formal centres of excellence or Leading Technology Institutes. Industry is closely involved in defining the long-term strategies of these Institutes, which conduct strategic and fundamental research.
75. Second, in the good performing countries, policies for promoting industry-science links have revealed two best practices: the need to stimulate spin-offs and licensing agreements from public research with flexible infrastructure relating to intellectual property rights (IPR), and to promote public-private partnerships with well-defined objectives, roles and expectations of parties, and clear funding arrangements. The United States is the leader in terms of producing spin-off firms from public research, mostly from universities rather than from public laboratories. The United States is also the most advanced in generating income from licensing agreements related to public research. Other countries are catching up.
32
In the Netherlands, for example, about 30% of all life science based start-ups are spin-offs from public research.
76. Many have attributed the US success to the introduction of the Bayh-Dole Act that permits universities and small businesses to elect ownership of inventions made under federal funding and to become directly involved in the commercialisation process. The Bayh-Dole act requires that royalties from licensing are shared with the inventor and that remaining income is used to support university research. Japan has followed the US example by introducing the Japanese Bayh-Dole provisions whereby intellectual property rights emerging from government contracted research belong to the contractors. At Japanese universities, as in the Netherlands, the inventor retains IPR ownership unless the government deems the invention has general public importance. In general, assigning IPR ownership to the research institution creates an incentive to construct an efficient infrastructure for promoting research spin-offs and patent applications.
77. These countries have found that research partnerships are unique tools to fill gaps in innovation systems (e.g. a lack of interaction between industry and public research), increase the efficiency of government policy in addressing market failures that affect innovation processes (e.g. high cost and risk of science-based pre-competitive research), and address new societal needs, especially when multidisciplinary research is required. The most well-known public-private partnership in the United States is the Advanced Technology Program (ATP) which aims to accelerate the development of high-risk technologies that promise significant commercial payoffs and benefits for the economy. The Netherlands promotes research partnerships through the Leading Technology Institutes as well as special initiatives such as the Genomics Initiative which has established consortia to research bio/IT linkages and proteomics.
78. In Japan, the National Institute of Advance Industrial Science and Technology has several research co-operation projects with industry. In addition, the well-known Large Scale Projects created public/private research consortia such as the successful Very Large Scale Integrated Circuit (VLSI) project. Finland has focused on cluster programmes in forestry, transport, telecommunications and environment to promote co-operation among public research institutions and the private sector. A common feature of these partnerships has been their emphasis on establishing well-defined objectives from the start, clarifying the roles and expectation of both the public and private partners, and establishing clear co-financing arrangements.
79. Third, in addition to the supply side, stimulating demand for new products, processes and services is key to exploiting and diffusing science and technology. Surveys show that clients and costumers are important sources of information and stimulus for innovating firms (Eurostat, 2004). The good performing countries feed demand through public procurement of new products and services. The United-States has a long tradition of purchasing innovative products and services from private firms for space and military applications. In addition, the US Small Business Innovation Research (SBIR) requires that a certain portion of government purchases is from small firms, which promotes innovation in different sized firms.
80. In Japan, government procurement is mainly aimed at public construction, although an innovative “green procurement” programme was introduced to promote environmental developments such as fuel cell cars. These countries, and particularly the Netherlands, have also approached demand side stimulation from another angle, stressing science awareness and public acceptance of new technologies with an impact on society. For example, genomics applications were extensively debated prior to the introduction of legislation. In Finland, trade unions are active in introducing and applying new technologies in the workplace. This positive attitude towards new technologies creates demand for new products and processes by Finnish firms and promotes the development of competent users. Creating awareness and public acceptance of new technologies can increase general demand for new products, whereas fostering
33
acceptance among the social partners of the long-term benefits of new technologies eases the integration of new techniques in production processes.
Micro-policies for fostering firm creation and entrepreneurship
81. Attaining higher levels of firm creation and entrepreneurship seems to depend on three types of policies: i) increasing access to venture capital, ii) ensuring efficient bankruptcy regimes, and iii) providing entrepreneurial education. Analysis shows that two other areas may also be of (somewhat lesser) significance: the legal framework for start-up firms and levels of business and labour taxation.
82. First, venture capital or risk finance is essential to the creation and early phases of small technology-based enterprises, owing to the generally risk-averse lending practices of banks and other financial institutions. There are certain similarities in the venture capital policies of the good performing countries for this driver (Canada, Finland, Korea and the United States). Venture capital investment started as a publicly-financed activity, where government equity funds were used to pump-prime private capital and reduce imbalances in the allocation of funds across different financing stages, sectors and regions. Substantial amounts of risk capital were channelled to younger and smaller firms who had difficulties obtaining funds from other sources.
83. In addition, regulations were eased for institutional investors, such as pension funds and insurance companies, who were generally blocked from making risky equity investments in many OECD countries. In the United States, for example, legislative changes to the Employee Retirement Income Security Act (ERISA) set loose a wave of pension funds that invigorated the venture capital market. At the same time, steps should be taken to protect investors, e.g. strengthening accounting standards and improving the transparency of venture capital funds. Not just the quantity of funds but also the quality of venture investments is important. Given the need for competent investors and advisors, government schemes should help to train managers in venture investing and support the development of a private equity culture among institutions. These approaches have been confirmed through peer reviews of ten countries which resulted in a set of agreed policy recommendations (Box 4).
84. Second, ensuring efficient bankruptcy regimes to allow easy exit and second chances is as important to creating new firms. But as the practices in the good performing countries illustrate, this is about trade-offs. While creditor interests need to be protected, an entrepreneurs’ willingness to take chances and start-up a new business should not be unduly affected. Bankruptcy procedures tend to reflect a country's institutional structure and legal tradition, but there are two aspects of the procedures which should be more common across countries: i) the time creditors have claims on assets and ii) the restrictions on bankrupt persons. The period of creditor claims varies from one year in the United States to a lifetime in Finland. Korea, the United Kingdom and Finland have recently reduced or in the process of reducing the claims time.
34

Box 4. Venture capital policy recommendations based on peer reviews
Equity programmes
• Use public equity funds to leverage private financing • Target public schemes to financing gaps, e.g. start-up firms • Employ private managers for public and hybrid equity funds • Consolidate regional and local equity funds or use alternative support schemes • Focus venture funding on knowledge-based clusters of enterprises, universities, support services, etc. • Evaluate public equity funds and phase-out when private venture market matures Investment regulations:
• Ease quantitative restrictions on institutional investors to diversify sources of venture funds • Support the development of a private equity culture among institutional investment managers • Facilitate creation of alternative investment pooling vehicles, such as funds-of-funds • Improve accounting standards and performance benchmarks to reduce opacity of venture capital funds and
protect investors • Remove barriers to inflows of foreign venture capital finance Taxation
• Reduce complexity in tax treatment of capital from different sources and types of investments • Decrease high capital gains tax rates and wealth taxes which can deter venture capital investments and
entrepreneurs • Evaluate targeted tax incentives for venture capital investment and consider phasing out those failing to meet
a cost-benefit test Business angel networks
• Link local and regional business angel networks to each other and to national initiatives • Ensure linkages between business angel networks and technology incubators, public research spin-offs, etc. • Provide complementary support services to enhance investment-readiness of small firms and increase
demand Source: OECD (2004b).
85. The good performing countries are implementing tougher restrictions for bankrupt parties whose conduct has been irresponsible, reckless or otherwise culpable. While remaining entrepreneur-friendly, this approach could help reduce the relatively higher level of bankruptcies experienced in the US system. And countries would do well to follow the UK lead in abolishing the Crown’s preferential rights to recover unpaid taxes ahead of other creditors, which reduces the number of people that directly lose money in a bankruptcy as well as some of the restrictions and stigmas attached to bankrupt persons.
86. Third, although a more intangible factor, providing entrepreneurial education at different levels of schooling is key to increasing risk-taking and the number of entrepreneurs. Canada and the United States have maintained entrepreneurship training in primary and secondary schools since the late 1970s. They teach young people self-employment as an alternative career and about the positive effects of entrepreneurship. Finland has stressed the development of broader entrepreneurship attitudes involving flexibility, self-initiative, creativity and risk-taking. The new Entrepreneurship Project in Finland will provide a revised curriculum for entrepreneurship programmes in primary schools.
87. Entrepreneurship education at the university level is especially advanced in the United States and gradually becoming more an integral part of tertiary education in the other countries. US studies show that, compared to other business school alumni, graduates taught entrepreneurship are three times more likely to
35
start new businesses, have higher annual incomes and are more satisfied with their jobs (Charney and Libecap, 2000).
88. Education should have a broad focus. The pool of skills required to grow a firm often surpass that of the individual entrepreneur or entrepreneurial group. At some point during the early stages most entrepreneurs and start-ups will require advice from specialists and will benefit from engaging in a dialogue with a variety of advisors such as technical experts, lawyers, accountants, consultants and venture capitalists. Thus a well-developed supply of knowledge in the local environment is an important prerequisite for the success of entrepreneurial companies. These providers of advisor also need to have their skills developed. In the US several universities have special courses aimed at future advisors.
89. Simplifying administrative procedures for start-up firms is an effective tool for increasing firm creation and a no-regrets policy. However, there may be decreasing returns to further reforms in the good performing countries since barriers to easy start-up have a threshold effect. For example, reducing the time it takes to register a new company from 3 days to 1 day will likely have limited results in terms of new firm creation. Effective policies used in the good performing countries to simplify procedures for start-ups include: introducing incentives to improved services in government agencies dealing with small firms, merging application forms from different agencies and granting automatic approval after a given time period, encouraging transactions through interactive web pages organised around the needs of small firms.
90. Business and income tax policies can also have significant effects on start-ups and entrepreneurs especially on their willingness to grow their firm. The United States, Canada and Korea have all introduced large cuts in personal income taxes and capital taxation in recent years, while Finland is reforming its tax system for those selling or transferring the ownership of their businesses to families or employees. Improving the tax climate for entrepreneurs includes reducing progressiveness in personal income tax rate schedules, which penalises successful entrepreneurs and discourages risk-taking. They can lower taxes on income earned by entrepreneurs (capital gains, dividends) and remove the tax bias favouring longer-term assets, which can hinder the reallocation of capital towards start-ups. More liberal provisions for carrying-forward losses in corporate income tax would assist start-ups which take more time to become profitable. Simplifying the value-added tax system and reducing tax compliance and administrative costs would also reduce burdens on small firms (Chen et. al., 2002).
Summarising the findings
91. Countries can use the identified micro-policies as inspiration for their own policy reforms (Table 8). All policies have to be adapted to the specific national context. The policy insights will develop over time as the analysis and the underlying data improve.
36

Table 8. Overview of effective micro-policies implemented in good performing countries
Enhancing human capital and realising its potential Increasing the quality and relevance of educational attainment -- through i) providing cost-effective support to tertiary education, ii) stimulating competition among educational institutions, iii) linking higher education to the conduct of government-financed research and development, and iv) ensuring a link between the supply of graduates and the industrial structure of the economy. Providing incentives for continuous training/lifelong learning -- through i) negotiating tripartite agreements to share the costs and responsibility for enterprise training, ii) offsetting costs and time constraints of individual investments in training, and iii) developing schemes to assist small firms in providing more worker training.
Fostering knowledge-based management and organisation in enterprises – through i) promoting flexible work approaches through labour market policies, ii) adopting knowledge-based management approaches in the public sector, and iii) upgrading managerial skills in small firms.
Seizing the benefits of information and communications technology (ICT) Developing ICT skills -- through i) defining a national strategy for integrating ICT in schools, ii) helping schools buy computers and get online, iii) providing ICT training for teachers, iv) developing educational software and online content, and v) ensuring the supply of workers with advanced ICT skills. Stimulating competition in communication markets -- through i) accelerating the process of unbundling local loops, and ii) increasing competition across different communications platforms.
Implementing e-government – through i) increasing online government services, ii) creating common government portals and standardised web pages, iii) ensuring online security and privacy, iv) ensuring inter-operability of government systems; and possible v) documenting positive returns of e-government solutions..
Developing digital content – through i) fostering an adequate technological infrastructure, ii) creating an environment that allows for changing business models and entry of new market players, iii) securing "no less favourable treatment" of digital content as compared to other such as printed content, iv) clarifying regulatory frameworks, and v) facilitating the exploitation of public sector information.
Exploiting and diffusing science and technology Enhancing the quality of public research – through i) creating centres of excellence for research, ii) involving industry in the design and financing of the centres, and iii) developing competitive mechanisms to identify research areas. Promoting industry-science links – through i) fostering spin-offs and licensing agreements from public research with flexible IPR infrastructure, and ii) promoting public-private partnerships with well-defined objectives and clear funding arrangements.
Stimulating demand for new products, processes and services – through i) public procurement of new products and services, ii) creating awareness and public acceptance of new technologies, and iii) fostering acceptance among the social partners of the long-term benefits of new technologies.
Fostering firm creation and entrepreneurship Increasing access to venture capital -- through i) using public equity funds to leverage private financing and targeting financing gaps, ii) easing quantitative restrictions on institutional investors, and iii) developing competent venture investors and managers. Ensuring efficient bankruptcy regimes -- through i) reducing the time that creditors have claims on assets, ii) introducing tougher regimes for bankrupt parties whose conduct has been irresponsible, iii) removing the state’s right to recover unpaid taxes ahead of other creditors, and iv) reviewing and removing unnecessary restrictions on bankrupt persons
Providing entrepreneurial education – through i) teaching entrepreneurial skills and attitudes in early education, ii) integrating entrepreneurial education in university curriculum and iii) ensuring sufficient skills to support/develop entrepreneurs are being developed in the market for private business support.
37

REFERENCES
AUDRETSCH, D. and R. THURIK (2000), “Linking Entrepreneurship to Growth”, paper prepared for the OECD Directorate for Science, Technology and Industry.
BRANDT, N. (2004) “Business Dynamics, Regulation and Performance”, OECD Working Paper.
BRYNJOLFSSON, E. (2003) "The IT Productivity GAP", MIT Optimize, July, Issue 21.
BRYNJOLFSSON, E. and HITT, L. (2003) "Computing Productivity: Firm-level Evidence", Review of Economics and Statistics, Volume 85, Issue 4, MIT Press
CHEN D., LEE, F. and MINTZ J. (2002), “Taxation, SMEs and Entrepreneurship”, OECD STI Working Paper, DSTI/DOC(2002)9.
EUROSTAT (2004), “Innovation in Europe, Results for the EU, Iceland and Norway”, Panorama for the European Union, Luxembourg.
FREUDENBERG, M. (2003), “Composite Indicators of Country Performance: A Critical Assessment”, OECD STI Working Paper DSTI/DOC(2003)16.
MCKINSEY & CO (2002), “How Information Technology Enables Productivity Growth”.
OECD (2001a), The New Economy: Beyond the Hype - The OECD Growth Project.
OECD (2001b), Science, Technology and Industry Outlook - Drivers of Growth: Information Technology, Innovation and Entrepreneurship.
OECD (2003a), ICT and Economic Growth: Evidence from OECD Countries, Industries and Firms.
OECD (2003b), Seizing the Benefits of Information and Communications Technologies, OECD Ministerial Council Report.
OECD (2003c), The Policy Agenda for Growth, An Overview of the Sources of Economic Growth in OECD Countries, OECD, Paris
OECD (2004a), Synthesis Report: Venture Capital Trends and Policies.
OECD (2004b), Information Technology Outlook 2004, Paris.
OECD (2005a), Micro-Policies for Growth and Productivity Project Final Report, OECD, Paris
OECD (2005b), Synthesis and Benchmarks User Guide, OECD, Paris
OECD (2005c), Innovation Policy and Performance: A Cross-Country Comparison, OECD, Paris
38

OECD (2005d), Handbook on Constructing Composite Indicators: Methodology and User Guide, OECD Working Paper 2005/3, OECD, Paris
OECD (2006), ICT Diffusion to Business National Peer reviews, only available online at: http://www.oecd.org/document/6/0,2340,en_2649_33757_34227910_1_1_1_1,00.html
STEVENSON, L. and LUNDSTRÖM A. (2001), “Patterns and Trends in Entrepreneurship/SME Policy and Practice in Ten Economies”, Swedish Foundation for Small Business Research
39

ANNEX 1. DOCUMENTING THE PERFORMANCE INDICATORS
Performance indicators for enhancing human capital and realising its potential
Stock of knowledge workers Organisational and managerial practices Share of employees in high-skilled jobs OECD, (2002i, p. 19)
Willingness to delegate authority to subordinates WEF, (2003 indicator 10.13)
Private sector researchers per 10 000 labour force OECD, (2003k, p.57).
Share of employees managed by objectives EUROFOND, (2000, p. 26)
Per cent of population aged 16-65 at literacy level 4/5 Own calculation based on OECD, (2000c. p.37).
Adaptability to market changes IMD, (2002, indicator 3.4.01)
Quality of domestic managers IMD, (2002, indicator 3.2.19)
Performance indicators for ICT
ICT investments ICT use The contribution of investment in ICT capital to GDP growth Colecchia and Schreyer (2001) and Van Ark, et al. (2002a).
Business using the Internet OECD (2002a, p.51)
ICT investment as a percentage of fixed capital formation OECD (2004, p. 10)
Business ordering over the Internet OECD (2002a, p.50)
Number of PC per 100 white collar workers OECD, based on data from IDC, Eurostat, US Bureau of Labor Statistics, and ILO.
Number of workers using the computers for work per 100 workers Eurobarometer, November 2001
Pick-up in productivity growth in the ICT-using services Own calculation based on Pilat (2002)
Performance indicators for development and exploitation of S&T New products, processes, services and
systems Technology diffusion
Number of patents in "triadic" patent families per million population, 1998 OECD (2004d: p. 38)
Qualitative evaluation of firm-level technology absorption WEF (2002 variable 10.04)
Share of firms introducing new or technologically improved products or processes on the market, 1998-2001 OECD (2001d; p. 57), Eurostat (2004; part 2)
Qualitative evaluation of firm-level production process sophistication WEF (2002 variable 3.01)
Qualitative evaluation of capacity for obtaining new technology WEF (2002 variable 3.03)
Technology payments to foreign countries as % of trade OECD, (2003k; p.128)
Qualitative evaluation of revenue generation by firm-level innovation WEF (2002 variable 3.02)
Qualitative evaluation of non-technical introduction of new products and processes - Branding; WEF (2002 variable 10.03)
Qualitative evaluation of non-technical introduction of new products and processes - Design WEF (2002 variable 10.05)
40

Performance indicators for fostering firm creation and entrepreneurship Creative destruction New high-growth firms
Firm entry rates, average 1998-2000 Own calculations based on Euro Stat (2003), Baldwin et. al, 2002.
Change in employment from 1998 to 1999 in new firms Own calculations based on Euro Stat (2003)
Share of young firms with more than 60% growth rates in a two year period, 1999 - 2002 Own calculations based on Hoffmann and Junge (2006)
Box A1. Data source and Internet links for indicators Colecchia, A. and P. Schreyer (2001), “The Impact of Information Communications Technology on Output Growth”, STI Working Paper 2001/7, OECD, Paris.
EU STAT (2003), Business Demography in Europe, Results for 10 Member States and Norway, European Commission, Luxembourg
Eurobarometer, November 2001 at http://europa.eu.int/information_society/eeurope/2002/benchmarking/list/testmichel/ca/computer_training/index_en.htm
EUROFOND (2000) Third European survey on working conditions 2000, EUROPEAN FOUNDATION for the Improvement of Living and Working Conditions available http://www.eurofound.eu.int/publications/files/EF0121EN.pdf
Hoffmann, Anders and Martin Junge (2006), Calculating the share of high-growth firms in 17 OECD countries, EBST and FORA Working Paper available at www.foranet.dk
IMD (2002), World Competitiveness Yearbook 2002, Available at http://www01.imd.ch/wcy/
OECD (2000c), Literacy in the Information Age, OECD and Statistics Canada
OECD (2001d), Science, Technology and Industry Scoreboard 2001 - Towards a Knowledge-based Economy. OECD (2003k), Science, Technology and Industry Scoreboard of Indicators, Paris
OECD (2002a), Measuring the Information Economy,
OECD (2002i), MEASURES OF SKILL FROM LABOUR FORCE SURVEYS - AN ASSESSMENT, DSTI/EAS/IND/SWP(2002)13
OECD (2003i), Employment Outlook, Paris
OECD (2003k), Science, Technology and Industry Scoreboard of Indicators, Paris
OECD (2003k), Science, Technology and Industry Scoreboard of Indicators, Paris
OECD (2003n), Education at a Glance, Paris
OECD (2004), ICT AND ECONOMIC GROWTH - EVIDENCE FROM OECD COUNTRIES, INDUSTRIES AND FIRMS
OECD (2004d), Science and Technology Statistical Compendium, Meeting of the OECD Committee for Scientific and Technological Policy at Ministerial Level 29-30 January 2004, Paris
Pilat, D., F. Lee and B. Van Ark (2002), “Production and use of ICT: A sectoral perspective on productivity growth in the OECD area”, OECD Economic Studies, No. 35,
Van Ark, B., R. Inklaar and R.H. McGuckin (2002), “Changing Gear Productivity, ICT and Services: Europe and the United States”, Research Memorandum GD-60, Groningen Growth and Development Centre, Groningen, http://www.eco.rug.nl/ggdc/homeggdc.html.
WEF (2002) Global Competitiveness Report 2001-2002
World Economic Forum (2003), Global Competitiveness Report 2003Eurostat (2004), PANORAMA OF THE EUROPEANUNION, Innovation in Europe, Results for the EU, Iceland and Norway, Luxembourg
41