Embed Size (px)
Citation preview
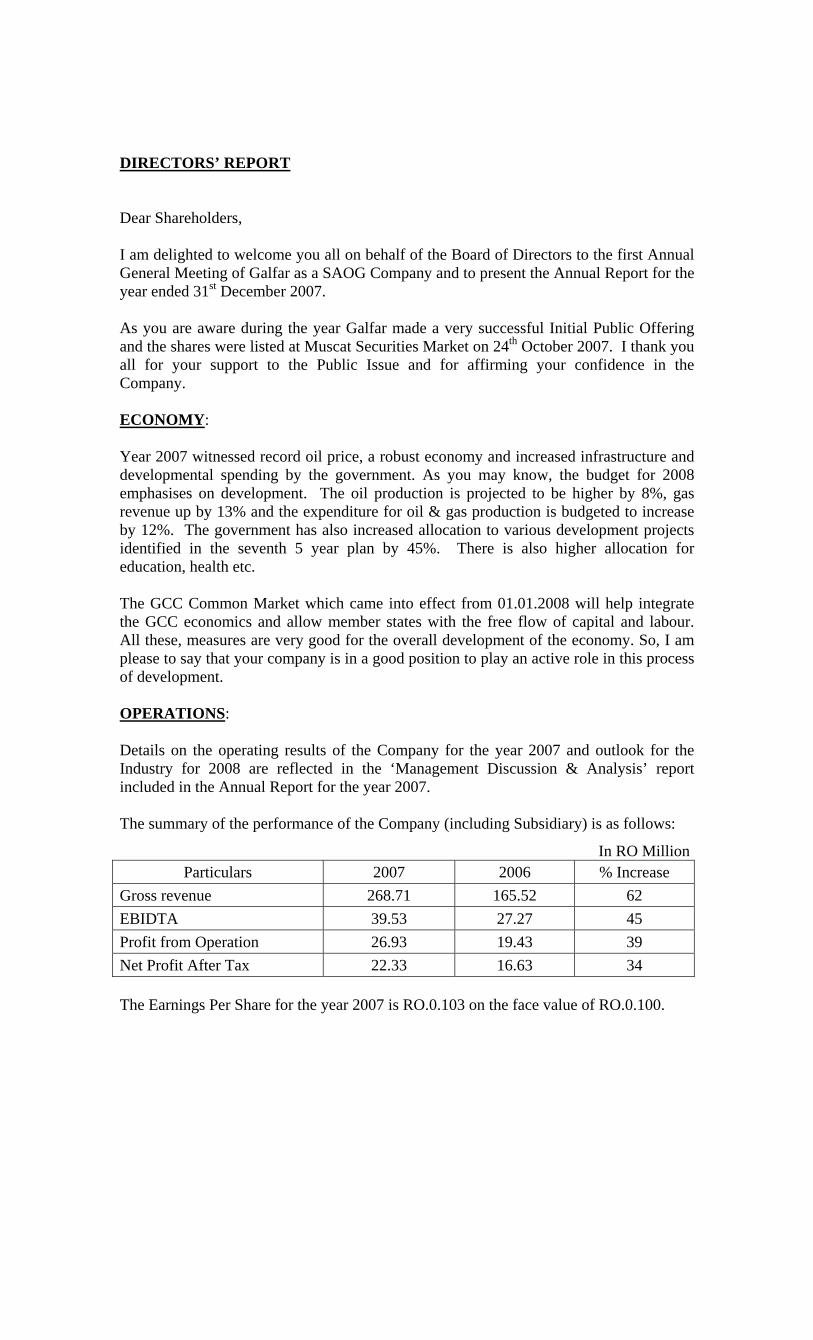
DIRECTORS’ REPORT Dear Shareholders, I am delighted to welcome you all on behalf of the Board of Directors to the first Annual General Meeting of Galfar as a SAOG Company and to present the Annual Report for the year ended 31st December 2007. As you are aware during the year Galfar made a very successful Initial Public Offering and the shares were listed at Muscat Securities Market on 24th October 2007. I thank you all for your support to the Public Issue and for affirming your confidence in the Company. ECONOMY: Year 2007 witnessed record oil price, a robust economy and increased infrastructure and developmental spending by the government. As you may know, the budget for 2008 emphasises on development. The oil production is projected to be higher by 8%, gas revenue up by 13% and the expenditure for oil & gas production is budgeted to increase by 12%. The government has also increased allocation to various development projects identified in the seventh 5 year plan by 45%. There is also higher allocation for education, health etc. The GCC Common Market which came into effect from 01.01.2008 will help integrate the GCC economics and allow member states with the free flow of capital and labour. All these, measures are very good for the overall development of the economy. So, I am please to say that your company is in a good position to play an active role in this process of development. OPERATIONS: Details on the operating results of the Company for the year 2007 and outlook for the Industry for 2008 are reflected in the ‘Management Discussion & Analysis’ report included in the Annual Report for the year 2007. The summary of the performance of the Company (including Subsidiary) is as follows:
In RO Million Particulars 2007 2006 % Increase
Gross revenue 268.71 165.52 62 EBIDTA 39.53 27.27 45 Profit from Operation 26.93 19.43 39 Net Profit After Tax 22.33 16.63 34 The Earnings Per Share for the year 2007 is RO.0.103 on the face value of RO.0.100.
: 2 : SUBSIDIARY: Messrs Al Khalij Heavy Equipment & Engineering LLC, a subsidiary of the Company, engaged in transportation and logistics business has achieved turnover of R.O.2.50 Mn. during the year 2007 as compared to R.O.1.82 Mn. in 2006 an increase of 37% over the previous year. More than half of this revenue is from services provided to customers other than Galfar. Profit for the period has registered a remarkable growth, from R.O.121,466/- in 2006 to R.O.366,309/- in 2007. Financials of this subsidiary are consolidated with Galfar. OMANISATION: Galfar employs 5400 Omani Nationals in various categories, which is about 22.5% of its work force. According to Ministry of Manpower this is the highest in the contracting sector. Galfar considers inducting, training and employing Omani’s as national priority and has two training centres, one in Muscat and the other in Sohar. Galfar also periodically send Omani’s to other countries to get them trained on various skills. CORPORATE GOVERNANCE: Your Company would like to achieve the highest standards of Corporate Governance. A detailed Corporate Governance Report is included in the Annual Report for the year ended 2007. HEALTH, SAFETY & ENVIRONMENT: The company has a very active programme for quality, health, safety, environmental and social responsibilities. Over the years Galfar has achieved several milestones in this regard. As you are aware, your Company is already certified for ISO 9001 : 2001 Standards of Quality Management System since 1995 and during the course of the year 2007 the Company has also been certified for ISO 14001 and OHSAS 18001 Standards which are landmark achievements in our pursuit to achieve a healthy and environment friendly work atmosphere. Health, Safety & Environment is a top priority for the management of Galfar and we have been very successfully working with Petroleum Development of Oman (PDO) and other petroleum concessionaries in the Sultanate of Oman for ensuring ‘zero’ accident levels as well as better quality of life. During the course of the year your Company have driven 97 million kms and have worked 77 million man-hours across all our Units. Our Lost Time Injury Frequency (LTIF) for the year is 0.56 against a set limit of 0.7, which is a significant achievement. Apart from the above programme Galfar also undertakes and contribute its resources in emergency and special situations like adverse weather condition in June.
: 3 : DIVIDEND POLICY: The Company proposes to follow a stable dividend policy based on Company’s need for retained earnings to support growth, dividend pay out and overall value creation to the shareholders. In the prospectus to the IPO dividend @ 35% for 2007 on the face value of the share was indicated. The Board has pleasure in recommending a dividend of 40 baisa for each 100 baisa share for the year ended 31.12.2007. OUTLOOK: As stated already, Galfar is very much part of Oman’s developmental plans and are extensively involved in construction of Infrastructure Projects. The Company’s Order Book ensures continued growth in revenue. However the prevailing higher oil prices are often accompanied with price increases in raw materials like Cement, Steel, Bitumen etc. The pressure on profit margin owing to this increase in raw material prices could be offset by increased contract income and economies of scale. ON RECORD: We are indeed grateful to His Majesty Sultan Qaboos Bin Said for providing an economic base and environment for sustainable long-term growth as well as opportunities for private and public sector in the development of the Omani economy. The Board records its sincere appreciation to Capital Market Authority, Muscat Securities Market, Muscat Depository & Security Registration Company, Issue Advisor and Managers, Collecting Banks and all others involved in the IPO for their guidance and support for the successful public listing of the company. Also, the Board would like to thank all Ministries and Government Agencies, Muscat Municipality, Royal Oman Police, Petroleum Development Oman and other Companies working in the Oil & Gas sector in Oman, Commercial Banks and Financial Institutions in Oman and abroad where we have relationship, Consultants, Sub-contractors, Dealers and all Clients of the Company, for their generous cooperation and continued support. We would also like to thank all the staff and management of the company for their outstanding performance and delivering what the company had promised. Salim Said Hamad Al Fannah Al Araimi Chairman

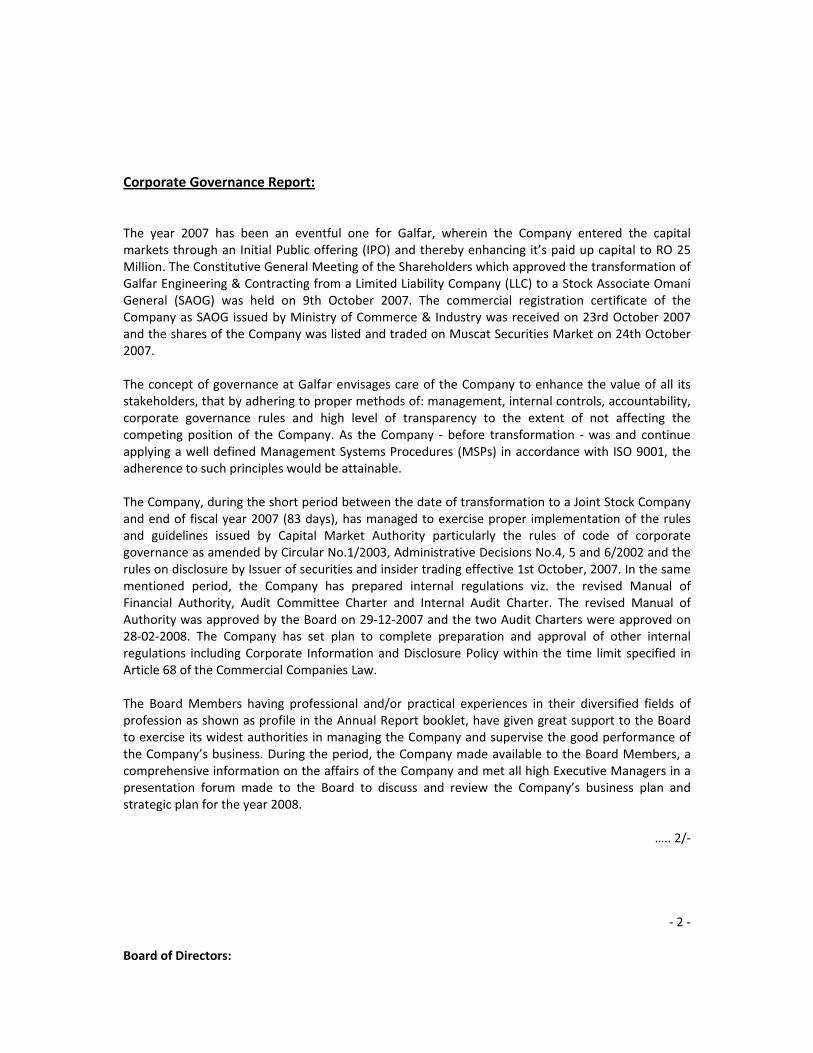
Corporate Governance Report: The year 2007 has been an eventful one for Galfar, wherein the Company entered the capital markets through an Initial Public offering (IPO) and thereby enhancing it’s paid up capital to RO 25 Million. The Constitutive General Meeting of the Shareholders which approved the transformation of Galfar Engineering & Contracting from a Limited Liability Company (LLC) to a Stock Associate Omani General (SAOG) was held on 9th October 2007. The commercial registration certificate of the Company as SAOG issued by Ministry of Commerce & Industry was received on 23rd October 2007 and the shares of the Company was listed and traded on Muscat Securities Market on 24th October 2007. The concept of governance at Galfar envisages care of the Company to enhance the value of all its stakeholders, that by adhering to proper methods of: management, internal controls, accountability, corporate governance rules and high level of transparency to the extent of not affecting the competing position of the Company. As the Company ‐ before transformation ‐ was and continue applying a well defined Management Systems Procedures (MSPs) in accordance with ISO 9001, the adherence to such principles would be attainable. The Company, during the short period between the date of transformation to a Joint Stock Company and end of fiscal year 2007 (83 days), has managed to exercise proper implementation of the rules and guidelines issued by Capital Market Authority particularly the rules of code of corporate governance as amended by Circular No.1/2003, Administrative Decisions No.4, 5 and 6/2002 and the rules on disclosure by Issuer of securities and insider trading effective 1st October, 2007. In the same mentioned period, the Company has prepared internal regulations viz. the revised Manual of Financial Authority, Audit Committee Charter and Internal Audit Charter. The revised Manual of Authority was approved by the Board on 29‐12‐2007 and the two Audit Charters were approved on 28‐02‐2008. The Company has set plan to complete preparation and approval of other internal regulations including Corporate Information and Disclosure Policy within the time limit specified in Article 68 of the Commercial Companies Law. The Board Members having professional and/or practical experiences in their diversified fields of profession as shown as profile in the Annual Report booklet, have given great support to the Board to exercise its widest authorities in managing the Company and supervise the good performance of the Company’s business. During the period, the Company made available to the Board Members, a comprehensive information on the affairs of the Company and met all high Executive Managers in a presentation forum made to the Board to discuss and review the Company’s business plan and strategic plan for the year 2008.
….. 2/‐
‐ 2 ‐ Board of Directors:
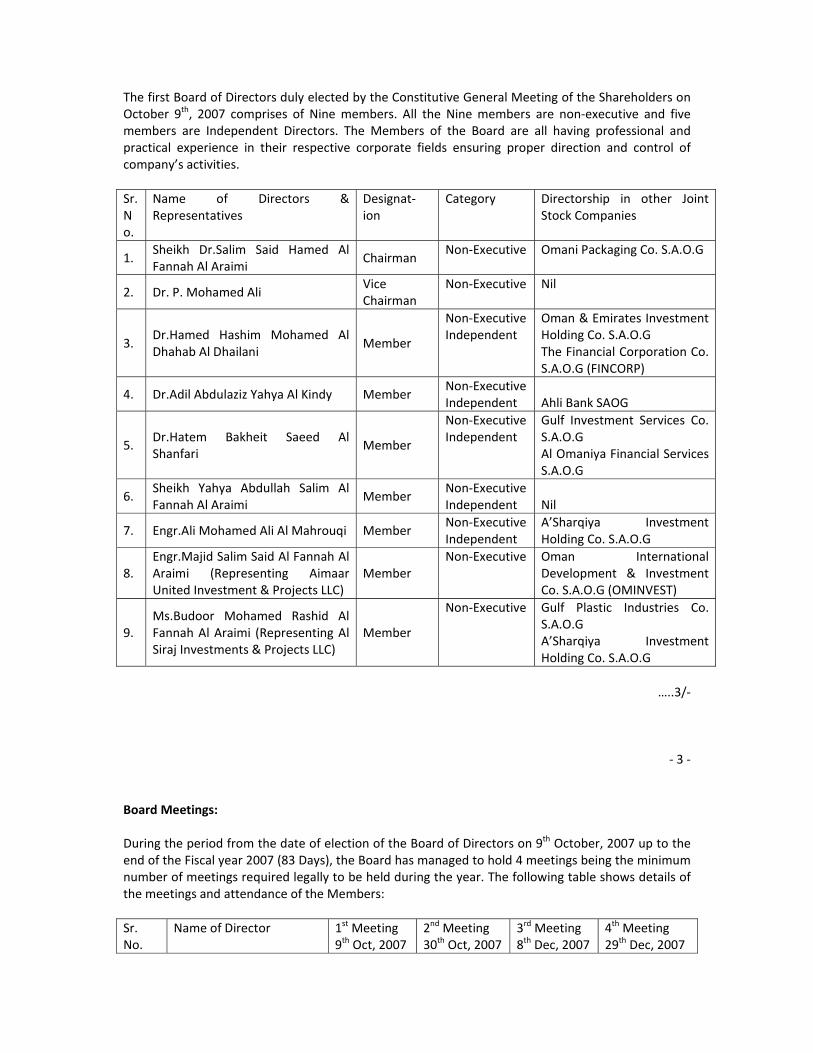
The first Board of Directors duly elected by the Constitutive General Meeting of the Shareholders on October 9th, 2007 comprises of Nine members. All the Nine members are non‐executive and five members are Independent Directors. The Members of the Board are all having professional and practical experience in their respective corporate fields ensuring proper direction and control of company’s activities. Sr. No.
Name of Directors & Representatives
Designat‐ion
Category Directorship in other Joint Stock Companies
1. Sheikh Dr.Salim Said Hamed Al Fannah Al Araimi
Chairman Non‐Executive Omani Packaging Co. S.A.O.G
2. Dr. P. Mohamed Ali Vice Chairman
Non‐Executive Nil
3. Dr.Hamed Hashim Mohamed Al Dhahab Al Dhailani
Member
Non‐ExecutiveIndependent
Oman & Emirates Investment Holding Co. S.A.O.G The Financial Corporation Co. S.A.O.G (FINCORP)
4. Dr.Adil Abdulaziz Yahya Al Kindy Member Non‐ExecutiveIndependent Ahli Bank SAOG
5. Dr.Hatem Bakheit Saeed Al Shanfari
Member
Non‐ExecutiveIndependent
Gulf Investment Services Co. S.A.O.G Al Omaniya Financial Services S.A.O.G
6. Sheikh Yahya Abdullah Salim Al Fannah Al Araimi
Member Non‐ExecutiveIndependent
Nil
7. Engr.Ali Mohamed Ali Al Mahrouqi Member Non‐ExecutiveIndependent
A’Sharqiya Investment Holding Co. S.A.O.G
8. Engr.Majid Salim Said Al Fannah Al Araimi (Representing Aimaar United Investment & Projects LLC)
Member Non‐Executive Oman International
Development & Investment Co. S.A.O.G (OMINVEST)
9. Ms.Budoor Mohamed Rashid Al Fannah Al Araimi (Representing Al Siraj Investments & Projects LLC)
Member
Non‐Executive Gulf Plastic Industries Co. S.A.O.G A’Sharqiya Investment Holding Co. S.A.O.G
…..3/‐
‐ 3 ‐ Board Meetings: During the period from the date of election of the Board of Directors on 9th October, 2007 up to the end of the Fiscal year 2007 (83 Days), the Board has managed to hold 4 meetings being the minimum number of meetings required legally to be held during the year. The following table shows details of the meetings and attendance of the Members: Sr. No.
Name of Director 1st Meeting 9th Oct, 2007
2nd Meeting 30th Oct, 2007
3rd Meeting 8th Dec, 2007
4th Meeting 29th Dec, 2007
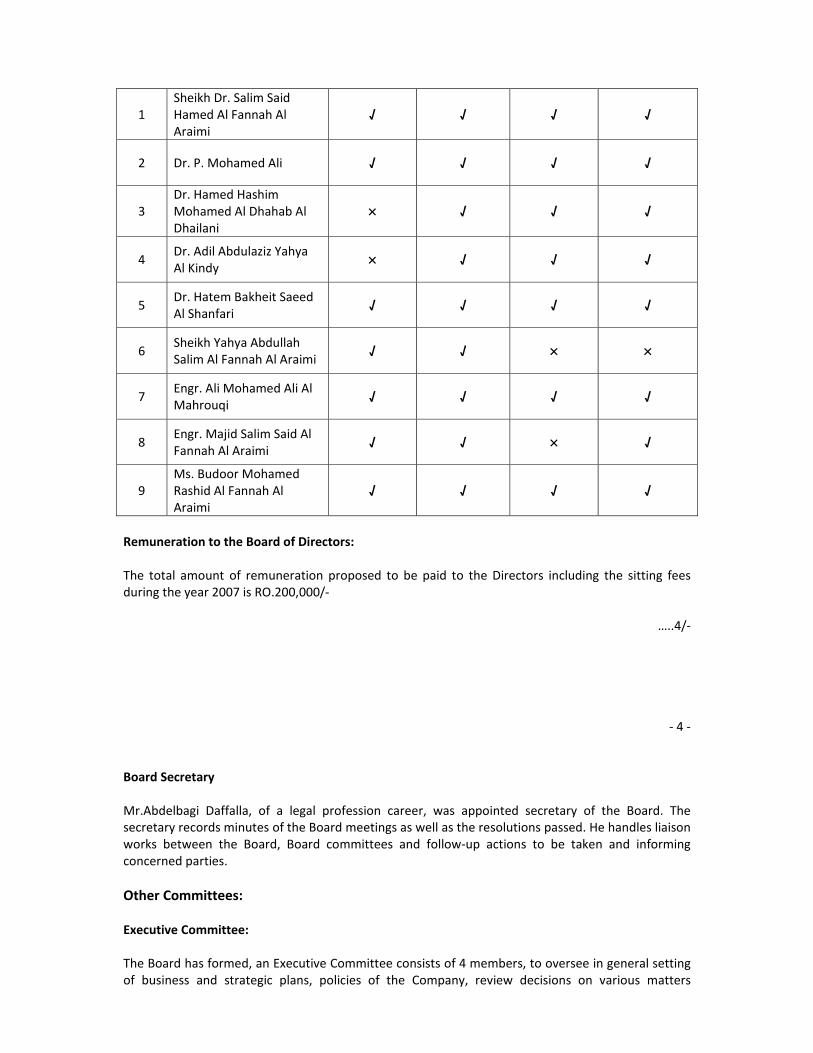
1 Sheikh Dr. Salim Said Hamed Al Fannah Al Araimi
√ √ √ √
2 Dr. P. Mohamed Ali √ √ √ √
3 Dr. Hamed Hashim Mohamed Al Dhahab Al Dhailani
× √ √ √
4 Dr. Adil Abdulaziz Yahya Al Kindy × √ √ √
5 Dr. Hatem Bakheit Saeed Al Shanfari √ √ √ √
6 Sheikh Yahya Abdullah Salim Al Fannah Al Araimi √ √ × ×
7 Engr. Ali Mohamed Ali Al Mahrouqi √ √ √ √
8 Engr. Majid Salim Said Al Fannah Al Araimi √ √ × √
9 Ms. Budoor Mohamed Rashid Al Fannah Al Araimi
√ √ √ √
Remuneration to the Board of Directors: The total amount of remuneration proposed to be paid to the Directors including the sitting fees during the year 2007 is RO.200,000/‐
…..4/‐
‐ 4 ‐ Board Secretary Mr.Abdelbagi Daffalla, of a legal profession career, was appointed secretary of the Board. The secretary records minutes of the Board meetings as well as the resolutions passed. He handles liaison works between the Board, Board committees and follow‐up actions to be taken and informing concerned parties. Other Committees: Executive Committee: The Board has formed, an Executive Committee consists of 4 members, to oversee in general setting of business and strategic plans, policies of the Company, review decisions on various matters
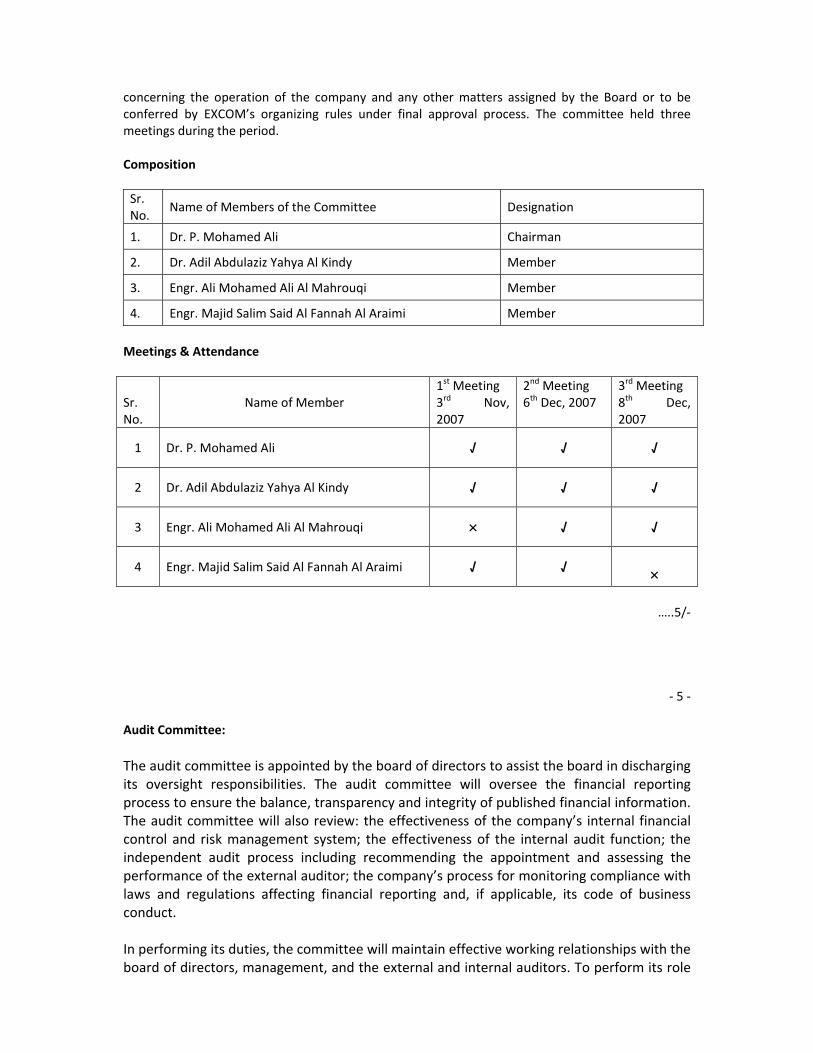
concerning the operation of the company and any other matters assigned by the Board or to be conferred by EXCOM’s organizing rules under final approval process. The committee held three meetings during the period. Composition Sr. No.
Name of Members of the Committee Designation
1. Dr. P. Mohamed Ali Chairman
2. Dr. Adil Abdulaziz Yahya Al Kindy Member
3. Engr. Ali Mohamed Ali Al Mahrouqi Member
4. Engr. Majid Salim Said Al Fannah Al Araimi Member
Meetings & Attendance Sr. No.
Name of Member
1st Meeting3rd Nov, 2007
2nd Meeting 6th Dec, 2007
3rd Meeting8th Dec, 2007
1 Dr. P. Mohamed Ali √ √ √
2 Dr. Adil Abdulaziz Yahya Al Kindy √ √ √
3 Engr. Ali Mohamed Ali Al Mahrouqi × √ √
4 Engr. Majid Salim Said Al Fannah Al Araimi √ √
×
…..5/‐
‐ 5 ‐ Audit Committee: The audit committee is appointed by the board of directors to assist the board in discharging its oversight responsibilities. The audit committee will oversee the financial reporting process to ensure the balance, transparency and integrity of published financial information. The audit committee will also review: the effectiveness of the company’s internal financial control and risk management system; the effectiveness of the internal audit function; the independent audit process including recommending the appointment and assessing the performance of the external auditor; the company’s process for monitoring compliance with laws and regulations affecting financial reporting and, if applicable, its code of business conduct. In performing its duties, the committee will maintain effective working relationships with the board of directors, management, and the external and internal auditors. To perform its role

effectively, each committee member will need to develop and maintain his skills and knowledge, including an understanding of the committee’s responsibilities and of the company’s business, operations and risks. Composition Sr. No.
Name of Members of the Committee Designation
1. Dr. Hamed Hashim Mohamed Al Dhahab Al Dhailani Chairman 2. Sheikh Yahya Abdullah Salim Al Fannah Al Araimi Member3. Dr. Hatem Bakheit Saeed Al Shanfari Member 4. Ms. Budoor Mohamed Rashid Al Fannah Al Araimi Member
Meetings & Attendance Sr. No.
Name of Member 1st Meeting 30th Oct, 2007
2nd Meeting 3rd Dec, 2007
3rd Meeting 15th Dec, 2007
1 Dr. Hamed Hashim Mohamed Al Dhahab Al Dhailani √ √ √
2 Sheikh Yahya Abdullah Salim Al Fannah Al Araimi √ × ×
3 Dr. Hatem Bakheit Saeed Al Shanfari √ √ √
4 Ms. Budoor Mohamed Rashid Al Fannah Al Araimi √ √ √
…..6/‐
‐ 6 ‐
Procedure for Standing as a Candidate for the Board: The right to stand as a candidate for membership of the Board of Directors of the Company is opened to shareholders and non shareholders. In case of a shareholder, whether in personal capacity or representing a juristic person, he must have a minimum equity of not less than 10000 shares. In the nomination procedures, Ten persons had submitted their nomination format within the time limit. Two of them are representing juristic persons. The Ten persons have satisfied the conditions and rules to stand candidates for the Board as provided for in the Commercial Companies Law 1974, the Articles of Association of the Company and Capital Market Authority Rules. On the date of election of the Nine members of the Board at the Constitutive General Meeting held on 9th October 2007, one of the candidate withdrawn his candidacy. As the seats assigned for the Board are Nine, which was in conformity with the remaining numbers of candidates, the CGM have decided to elect them by unanimity for a term of Three years Remuneration: Total remuneration during the Financial year 2007 to top Management (top 5) was RO 2.25 Million.
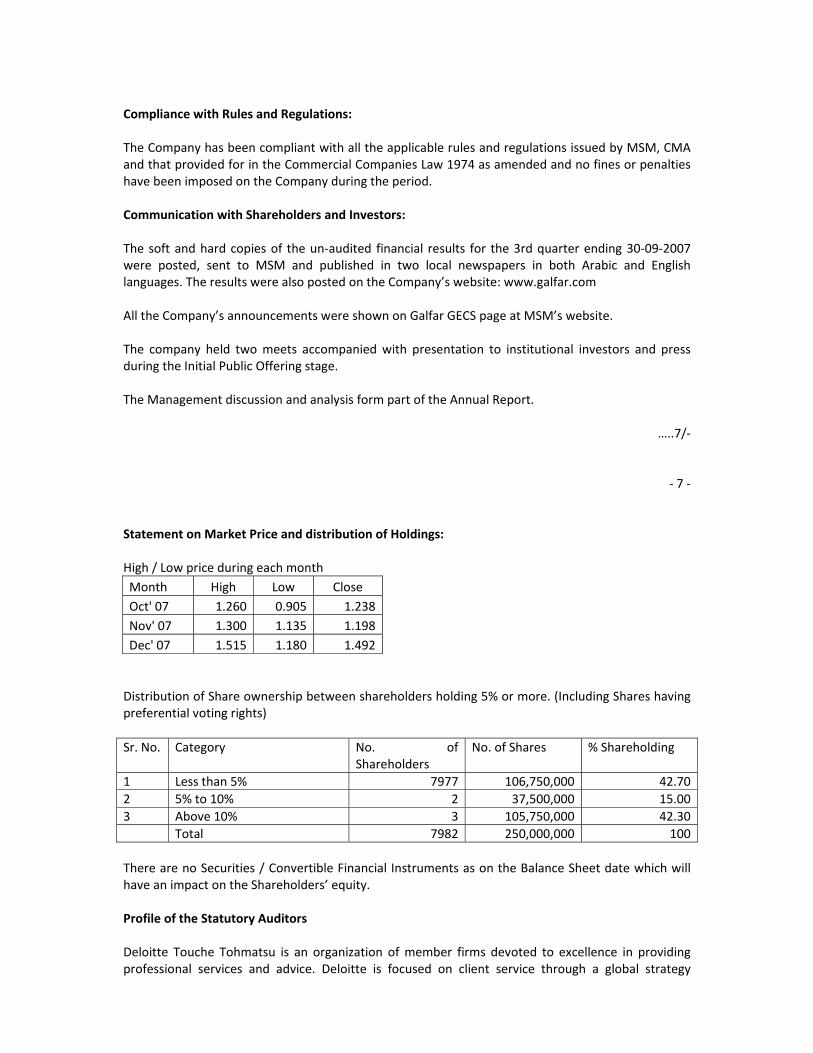
Compliance with Rules and Regulations: The Company has been compliant with all the applicable rules and regulations issued by MSM, CMA and that provided for in the Commercial Companies Law 1974 as amended and no fines or penalties have been imposed on the Company during the period. Communication with Shareholders and Investors: The soft and hard copies of the un‐audited financial results for the 3rd quarter ending 30‐09‐2007 were posted, sent to MSM and published in two local newspapers in both Arabic and English languages. The results were also posted on the Company’s website: www.galfar.com All the Company’s announcements were shown on Galfar GECS page at MSM’s website. The company held two meets accompanied with presentation to institutional investors and press during the Initial Public Offering stage. The Management discussion and analysis form part of the Annual Report.
…..7/‐
‐ 7 ‐ Statement on Market Price and distribution of Holdings: High / Low price during each month Month High Low Close Oct' 07 1.260 0.905 1.238Nov' 07 1.300 1.135 1.198Dec' 07 1.515 1.180 1.492 Distribution of Share ownership between shareholders holding 5% or more. (Including Shares having preferential voting rights) Sr. No. Category No. of
Shareholders No. of Shares % Shareholding
1 Less than 5% 7977 106,750,000 42.702 5% to 10% 2 37,500,000 15.003 Above 10% 3 105,750,000 42.30 Total 7982 250,000,000 100 There are no Securities / Convertible Financial Instruments as on the Balance Sheet date which will have an impact on the Shareholders’ equity. Profile of the Statutory Auditors Deloitte Touche Tohmatsu is an organization of member firms devoted to excellence in providing professional services and advice. Deloitte is focused on client service through a global strategy
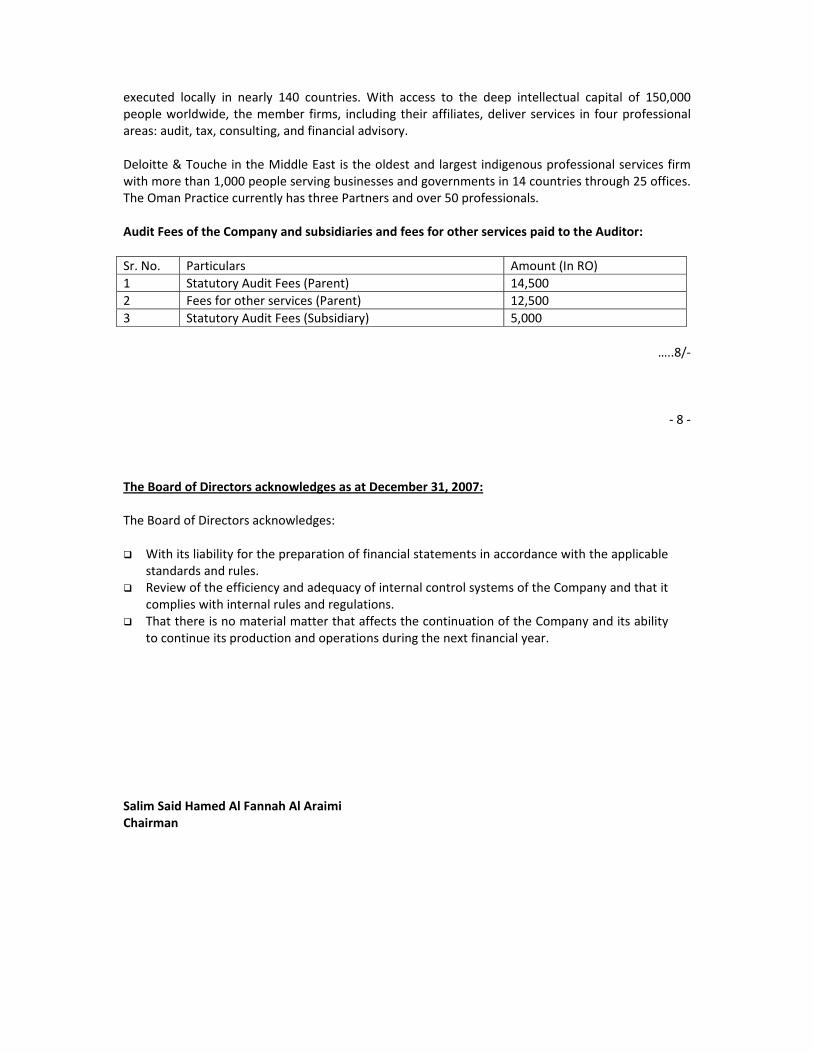
executed locally in nearly 140 countries. With access to the deep intellectual capital of 150,000 people worldwide, the member firms, including their affiliates, deliver services in four professional areas: audit, tax, consulting, and financial advisory. Deloitte & Touche in the Middle East is the oldest and largest indigenous professional services firm with more than 1,000 people serving businesses and governments in 14 countries through 25 offices. The Oman Practice currently has three Partners and over 50 professionals. Audit Fees of the Company and subsidiaries and fees for other services paid to the Auditor: Sr. No. Particulars Amount (In RO) 1 Statutory Audit Fees (Parent) 14,500 2 Fees for other services (Parent) 12,5003 Statutory Audit Fees (Subsidiary) 5,000
…..8/‐
‐ 8 ‐ The Board of Directors acknowledges as at December 31, 2007: The Board of Directors acknowledges:
With its liability for the preparation of financial statements in accordance with the applicable standards and rules.
Review of the efficiency and adequacy of internal control systems of the Company and that it complies with internal rules and regulations.
That there is no material matter that affects the continuation of the Company and its ability to continue its production and operations during the next financial year.
Salim Said Hamed Al Fannah Al Araimi Chairman
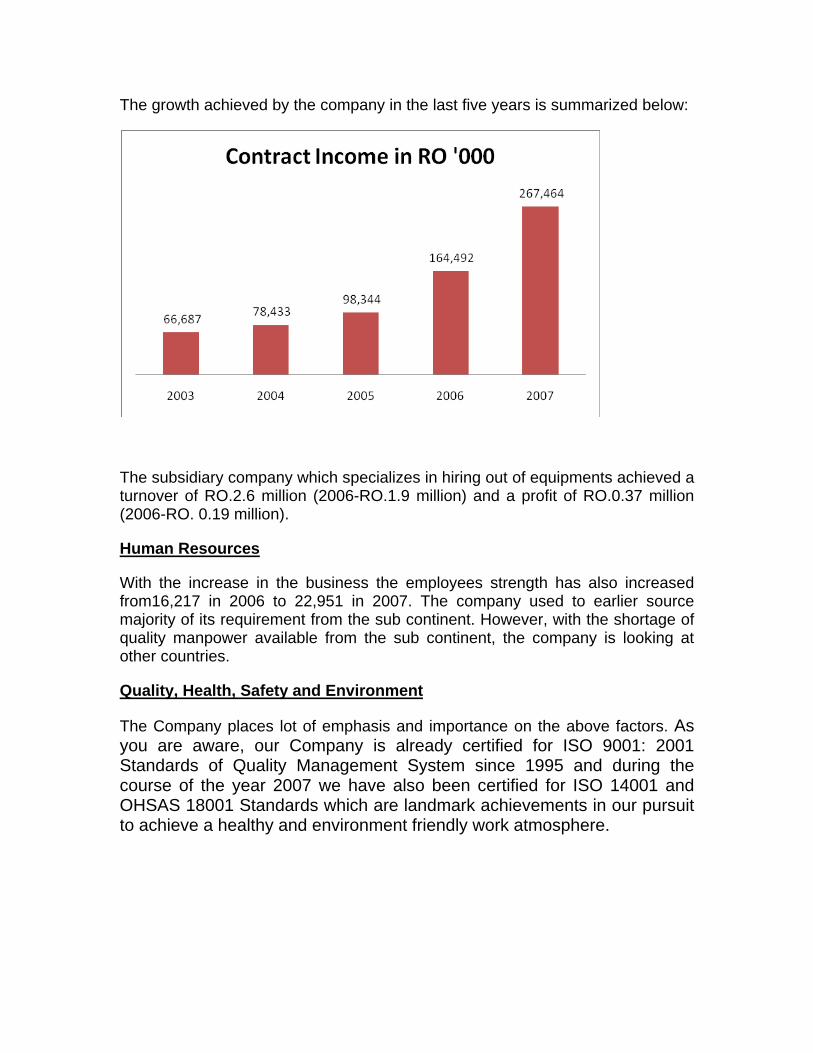
The growth achieved by the company in the last five years is summarized below:
The subsidiary company which specializes in hiring out of equipments achieved a turnover of RO.2.6 million (2006-RO.1.9 million) and a profit of RO.0.37 million (2006-RO. 0.19 million).
Human Resources
With the increase in the business the employees strength has also increased from16,217 in 2006 to 22,951 in 2007. The company used to earlier source majority of its requirement from the sub continent. However, with the shortage of quality manpower available from the sub continent, the company is looking at other countries.
Quality, Health, Safety and Environment
The Company places lot of emphasis and importance on the above factors. As you are aware, our Company is already certified for ISO 9001: 2001 Standards of Quality Management System since 1995 and during the course of the year 2007 we have also been certified for ISO 14001 and OHSAS 18001 Standards which are landmark achievements in our pursuit to achieve a healthy and environment friendly work atmosphere.
HSE has been a topmost concern for the management of Galfar and we have been very successfully working with PDO and other petroleum concessionaries in the Sultanate of Oman for ensuring ‘zero’ accident levels as well as better quality of life. During the course of the year we have driven 97 million kms. and have worked 77 million manhours across all our Units. Our Lost Time Injury Frequency (LTIF) for the year is 0.56 against a set limit of 0.7, which is a significant achievement. The ODC Contract in PDO achieved LTIF of 0.16 in 2007.
Risks
Risks do exist in all our business activities but they are foreseen and are not insurmountable.
The high volume of work available in the industry makes it attractive for new engineering and construction companies to enter the market. Severe competition is expected from larger international companies from India, Far East, Turkey and Egypt. Galfar being the largest local company is well equipped to meet this competition.
The very high level of activity in the engineering and construction market in the Middle East and India puts a strain on available quality resources. Galfar owns the majority of its construction equipment and makes significant investments in equipment to match the foreseeable requirements. Recruitment and training of new staff and labour, both from Oman and expatriates has become a major activity. New manpower markets have been entered and this process will continue. Costs of the above and of main construction commodities have been rising steeply in 2007 and there is no sign that this rise will halt in the near future.
Internal Controls Systems
The Board ensures that there is a detailed delegation of authority to the various levels of management and the need to have adequate corporate control of the organization.
The Management is also fully aware of its responsibility towards the various stakeholders. A key factor towards this responsibility is the strengthening of the associated internal control systems. The company addresses these issues by maintained clearly defined operating procedures which are updated as and when necessary.
Management discussion and analysis
Overview
The year 2007 has been a watershed year in the 35 year old history of the Company. The Company transformed into an SAOG Company from an LLC company during the year. The Public Issue was very successful.
The economic upswing that the Sultanate is going through benefitted the company and there has been a marked improvement in the revenues. The infrastructure development industry has been buoyant and it is expected to remain so.
Main objectives and Operational Results
Galfar is an engineering and construction company active in the following areas in the Sultanate of Oman:
1. Oil and Gas Sector
2. Structures & Buildings
3. Roads & Bridges
4. Sewage Treatment Plants and networks
5. Specialised Electromechanical works
6. Hiring of Equipments (Subsidiary company)
The company works as main contractor, in partnerships with other companies and as subcontractor. The company executes projects with its own workforce and equipment whilst subcontracting 19% of the work. Subcontracts are in specialized areas, including most of the engineering. The turnover of the company increased to RO.267 million from RO 164 million for the year 2006 and the Prospectus projection of RO.241 million. All segments of business increased their turnover with Oil & Gas and Road units in particular being the main contributors of the growth.
During the year cost pressures build up significantly due to major unprecedented increases in price of cement, bitumen, steel and copper,rise in recruitment and manpower costs and equipment hiring cost. Further, there was loss of productivity owing to climate changes experienced by the Sultanate during June ’07. These factors had an impact on the profitability. Actual profit achieved is RO21.965 million when compared to RO16.512 million for 2006 and RO.21.457 million projected in the Prospectus.
Outlook
The outlook of the company is quite good considering the fact there are plenty of projects available in the market and there is a dearth of quality companies. We are confident of growing and delivering consistent profit. Galfar’s order book stood at RO.536 million at the beginning of the year. During the first two months we have been awarded orders worth 166 million. There are pressures on the margins owing to some resource constraint. Overcoming the obstacles in the form of rising prices and non availability of some resources has the highest attention. Further in 2007 and coming years the company strives to increase the EPC content of its portfolio and its road and bridge building capabilities to compete with bigger international firms. The company is also looking at avenues to spread in other markets.
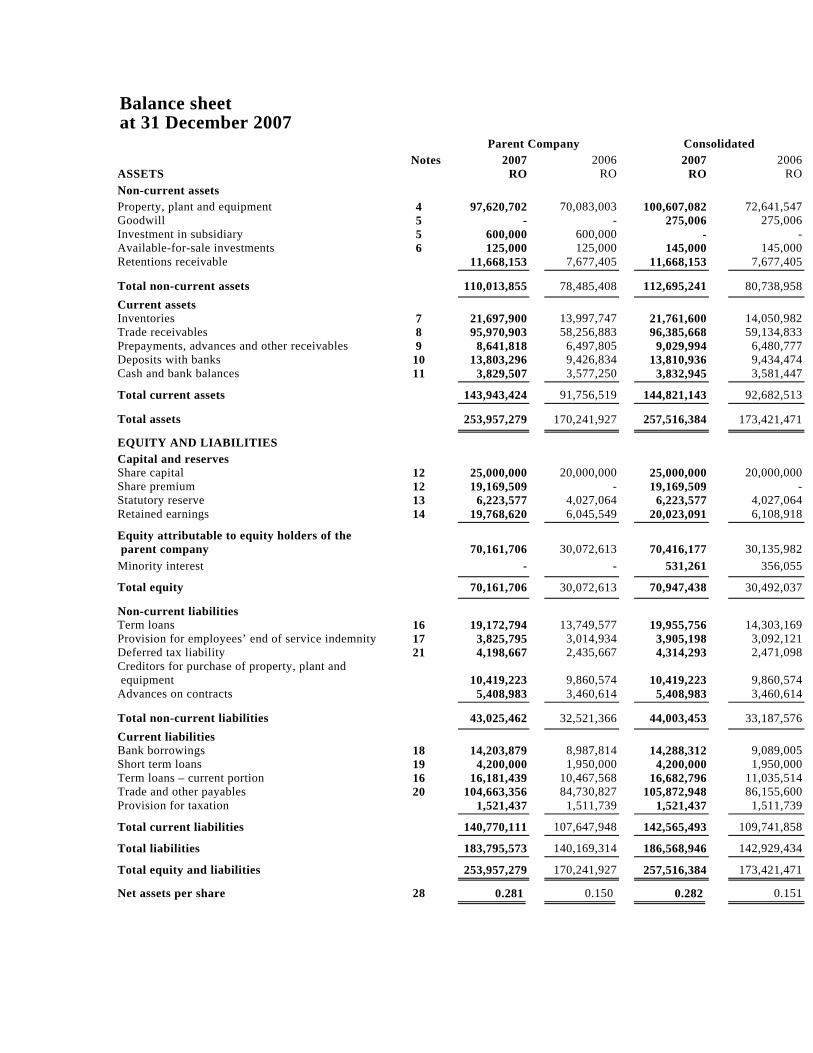
Balance sheet at 31 December 2007 Parent Company Consolidated Notes 2007 2006 2007 2006 ASSETS RO RO RO RO Non-current assets Property, plant and equipment 4 97,620,702 70,083,003 100,607,082 72,641,547 Goodwill 5 - - 275,006 275,006 Investment in subsidiary 5 600,000 600,000 - - Available-for-sale investments 6 125,000 125,000 145,000 145,000 Retentions receivable 11,668,153 7,677,405 11,668,153 7,677,405
Total non-current assets 110,013,855 78,485,408 112,695,241 80,738,958 Current assets Inventories 7 21,697,900 13,997,747 21,761,600 14,050,982 Trade receivables 8 95,970,903 58,256,883 96,385,668 59,134,833 Prepayments, advances and other receivables 9 8,641,818 6,497,805 9,029,994 6,480,777 Deposits with banks 10 13,803,296 9,426,834 13,810,936 9,434,474 Cash and bank balances 11 3,829,507 3,577,250 3,832,945 3,581,447
Total current assets 143,943,424 91,756,519 144,821,143 92,682,513
Total assets 253,957,279 170,241,927 257,516,384 173,421,471
EQUITY AND LIABILITIES Capital and reserves Share capital 12 25,000,000 20,000,000 25,000,000 20,000,000 Share premium 12 19,169,509 - 19,169,509 - Statutory reserve 13 6,223,577 4,027,064 6,223,577 4,027,064 Retained earnings 14 19,768,620 6,045,549 20,023,091 6,108,918
Equity attributable to equity holders of the parent company
70,161,706
30,072,613
70,416,177
30,135,982
Minority interest - - 531,261 356,055
Total equity 70,161,706 30,072,613 70,947,438 30,492,037
Non-current liabilities Term loans 16 19,172,794 13,749,577 19,955,756 14,303,169 Provision for employees’ end of service indemnity 17 3,825,795 3,014,934 3,905,198 3,092,121 Deferred tax liability 21 4,198,667 2,435,667 4,314,293 2,471,098 Creditors for purchase of property, plant and equipment
10,419,223
9,860,574
10,419,223
9,860,574
Advances on contracts 5,408,983 3,460,614 5,408,983 3,460,614
Total non-current liabilities 43,025,462 32,521,366 44,003,453 33,187,576 Current liabilities Bank borrowings 18 14,203,879 8,987,814 14,288,312 9,089,005 Short term loans 19 4,200,000 1,950,000 4,200,000 1,950,000 Term loans – current portion 16 16,181,439 10,467,568 16,682,796 11,035,514 Trade and other payables 20 104,663,356 84,730,827 105,872,948 86,155,600 Provision for taxation 1,521,437 1,511,739 1,521,437 1,511,739
Total current liabilities 140,770,111 107,647,948 142,565,493 109,741,858 Total liabilities 183,795,573 140,169,314 186,568,946 142,929,434
Total equity and liabilities 253,957,279 170,241,927 257,516,384 173,421,471 Net assets per share 28 0.281 0.150 0.282 0.151

____________________________ ______________________________________ Salim Said Al Fannah Al Araimi S. Muthukrishnan Chairman Corporate Manager – Finance & Treasury The accompanying notes form an integral part of these financial statements.
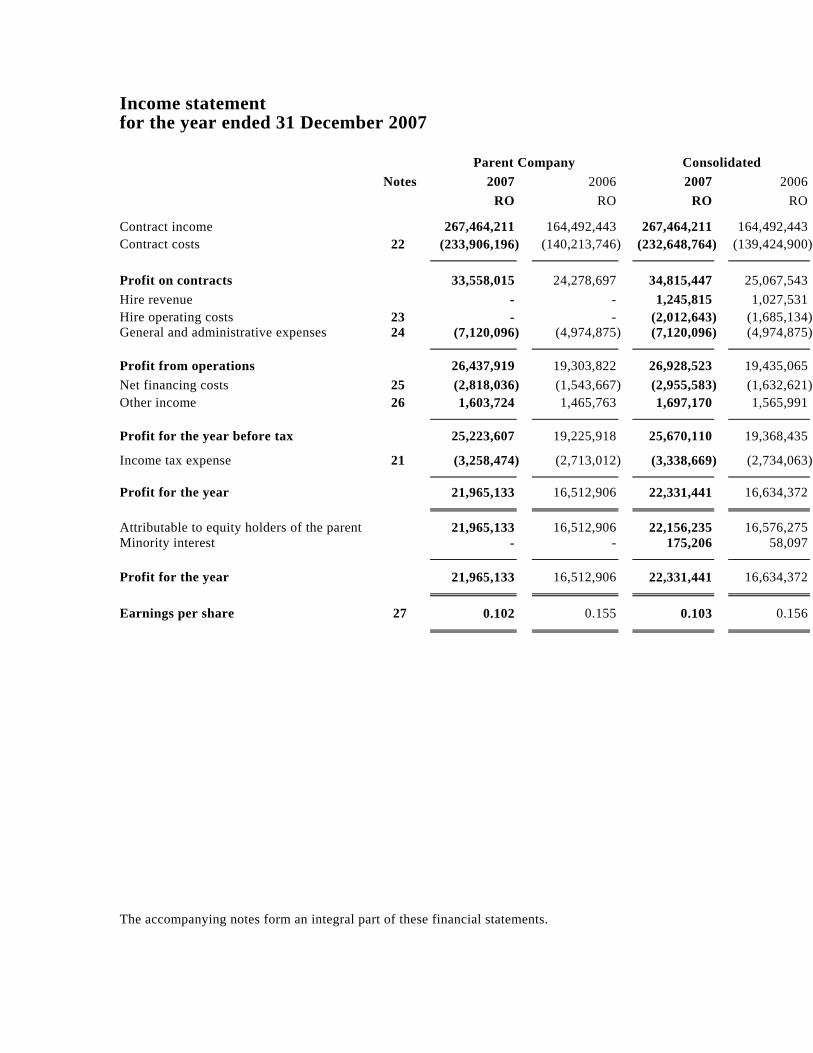
Income statement for the year ended 31 December 2007 Parent Company Consolidated Notes 2007 2006 2007 2006 RO RO RO RO
Contract income 267,464,211 164,492,443 267,464,211 164,492,443Contract costs 22 (233,906,196) (140,213,746) (232,648,764) (139,424,900)
Profit on contracts 33,558,015 24,278,697 34,815,447 25,067,543Hire revenue - - 1,245,815 1,027,531Hire operating costs 23 - - (2,012,643) (1,685,134)General and administrative expenses 24 (7,120,096) (4,974,875) (7,120,096) (4,974,875)
Profit from operations 26,437,919 19,303,822 26,928,523 19,435,065Net financing costs 25 (2,818,036) (1,543,667) (2,955,583) (1,632,621)Other income 26 1,603,724 1,465,763 1,697,170 1,565,991
Profit for the year before tax 25,223,607 19,225,918 25,670,110 19,368,435
Income tax expense 21 (3,258,474) (2,713,012) (3,338,669) (2,734,063)
Profit for the year 21,965,133 16,512,906 22,331,441 16,634,372 Attributable to equity holders of the parent 21,965,133 16,512,906 22,156,235 16,576,275Minority interest - - 175,206 58,097 Profit for the year 21,965,133 16,512,906 22,331,441 16,634,372 Earnings per share 27 0.102 0.155 0.103 0.156 The accompanying notes form an integral part of these financial statements.
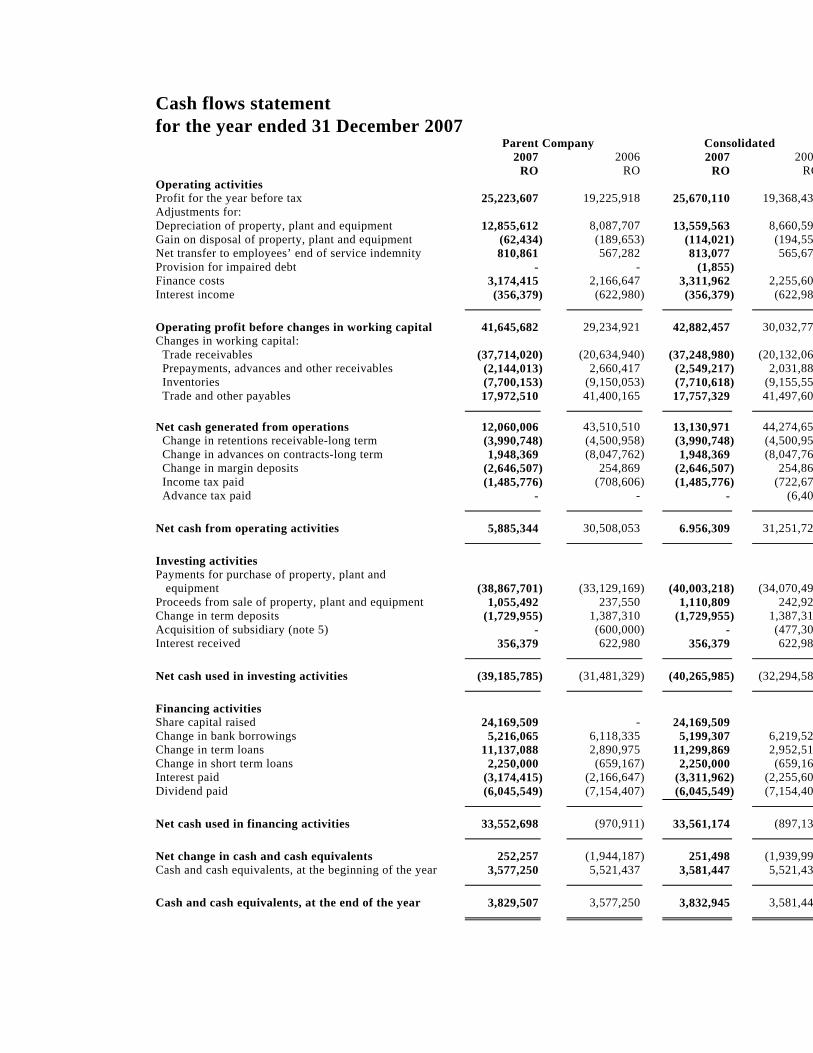
Cash flows statement for the year ended 31 December 2007
Parent Company Consolidated 2007 2006 2007 200 RO RO RO RO
Operating activities Profit for the year before tax 25,223,607 19,225,918 25,670,110 19,368,43Adjustments for: Depreciation of property, plant and equipment 12,855,612 8,087,707 13,559,563 8,660,59Gain on disposal of property, plant and equipment (62,434) (189,653) (114,021) (194,55Net transfer to employees’ end of service indemnity 810,861 567,282 813,077 565,67Provision for impaired debt - - (1,855) Finance costs 3,174,415 2,166,647 3,311,962 2,255,60Interest income (356,379) (622,980) (356,379) (622,98
Operating profit before changes in working capital 41,645,682 29,234,921 42,882,457 30,032,77Changes in working capital: Trade receivables (37,714,020) (20,634,940) (37,248,980) (20,132,06 Prepayments, advances and other receivables (2,144,013) 2,660,417 (2,549,217) 2,031,88 Inventories (7,700,153) (9,150,053) (7,710,618) (9,155,55 Trade and other payables 17,972,510 41,400,165 17,757,329 41,497,60 Net cash generated from operations 12,060,006 43,510,510 13,130,971 44,274,65 Change in retentions receivable-long term (3,990,748) (4,500,958) (3,990,748) (4,500,95 Change in advances on contracts-long term 1,948,369 (8,047,762) 1,948,369 (8,047,762 Change in margin deposits (2,646,507) 254,869 (2,646,507) 254,86 Income tax paid (1,485,776) (708,606) (1,485,776) (722,672 Advance tax paid - - - (6,40
Net cash from operating activities 5,885,344 30,508,053 6.956,309 31,251,72
Investing activities Payments for purchase of property, plant and equipment
(38,867,701)
(33,129,169)
(40,003,218) (34,070,494
Proceeds from sale of property, plant and equipment 1,055,492 237,550 1,110,809 242,92Change in term deposits (1,729,955) 1,387,310 (1,729,955) 1,387,31Acquisition of subsidiary (note 5) - (600,000) - (477,30Interest received 356,379 622,980 356,379 622,98
Net cash used in investing activities (39,185,785) (31,481,329) (40,265,985) (32,294,582
Financing activities Share capital raised 24,169,509 - 24,169,509 Change in bank borrowings 5,216,065 6,118,335 5,199,307 6,219,52Change in term loans 11,137,088 2,890,975 11,299,869 2,952,51Change in short term loans 2,250,000 (659,167) 2,250,000 (659,16Interest paid (3,174,415) (2,166,647) (3,311,962) (2,255,60Dividend paid (6,045,549) (7,154,407) (6,045,549) (7,154,40
Net cash used in financing activities 33,552,698 (970,911) 33,561,174 (897,13
Net change in cash and cash equivalents 252,257 (1,944,187) 251,498 (1,939,99Cash and cash equivalents, at the beginning of the year 3,577,250 5,521,437 3,581,447 5,521,43
Cash and cash equivalents, at the end of the year 3,829,507 3,577,250 3,832,945 3,581,44

The accompanying notes form an integral part of these financial statements.

Parent company statement of changes in equity for the year ended 31 December 2007
Notes Share capital
Share premium
Statutory reserve
Retained earnings Tota
RO RO RO RO RO Balance at 1 January 2006 7,500,000 - 2,375,773 6,538,341 16,414,114Increase in share capital 12 12,500,000 - - (8,200,000
)4,300,000
Profit for the year - - - 16,512,906 16,512,906Transfer to statutory reserve 13 - - 1,651,291 (1,651,291
)Dividend paid - - - (7,154,407
)
(7,154,407
Balance at 1 January 2007 20,000,000 - 4,027,064 6,045,549 30,072,613Increase in share capital 12 5,000,000 - - - 5,000,000Share premium from issue of capital
12
- 20,000,000 - 20,000,000
Share issue expenses - (830,491) - (830,49Profit for the year - - - 21,965,133 21,965,133Transfer to statutory reserve 13 - - 2,196,513 (2,196,513
)Dividend paid - - - (6,045,549
)
(6,045,549
Balance at 31 December 2007 25,000,000 19,169,509 6,223,577 19,768,620 70,161,706

The accompanying notes form an integral part of these financial statements. Parent company statement of changes in equity for the year ended 31 December 2007
Notes Share capital
Share premium
Statutory reserve
Retained earnings Tota
RO RO RO RO RO Balance at 1 January 2006 7,500,000 - 2,375,773 6,538,341 16,414,114Increase in share capital 12 12,500,000 - - (8,200,000
)4,300,000
Profit for the year - - - 16,512,906 16,512,906Transfer to statutory reserve 13 - - 1,651,291 (1,651,291
)Dividend paid - - - (7,154,407
)
(7,154,407
Balance at 1 January 2007 20,000,000 - 4,027,064 6,045,549 30,072,613Increase in share capital 12 5,000,000 - - - 5,000,000Share premium from issue of capital
12
- 20,000,000 - 20,000,000
Share issue expenses - (830,491) - (830,49Profit for the year - - - 21,965,133 21,965,133Transfer to statutory reserve 13 - - 2,196,513 (2,196,513
)Dividend paid - - - (6,045,549
)
(6,045,549
Balance at 31 December 2007 25,000,000 19,169,509 6,223,577 19,768,620 70,161,706
The accompanying notes form an integral part of these financial statements.
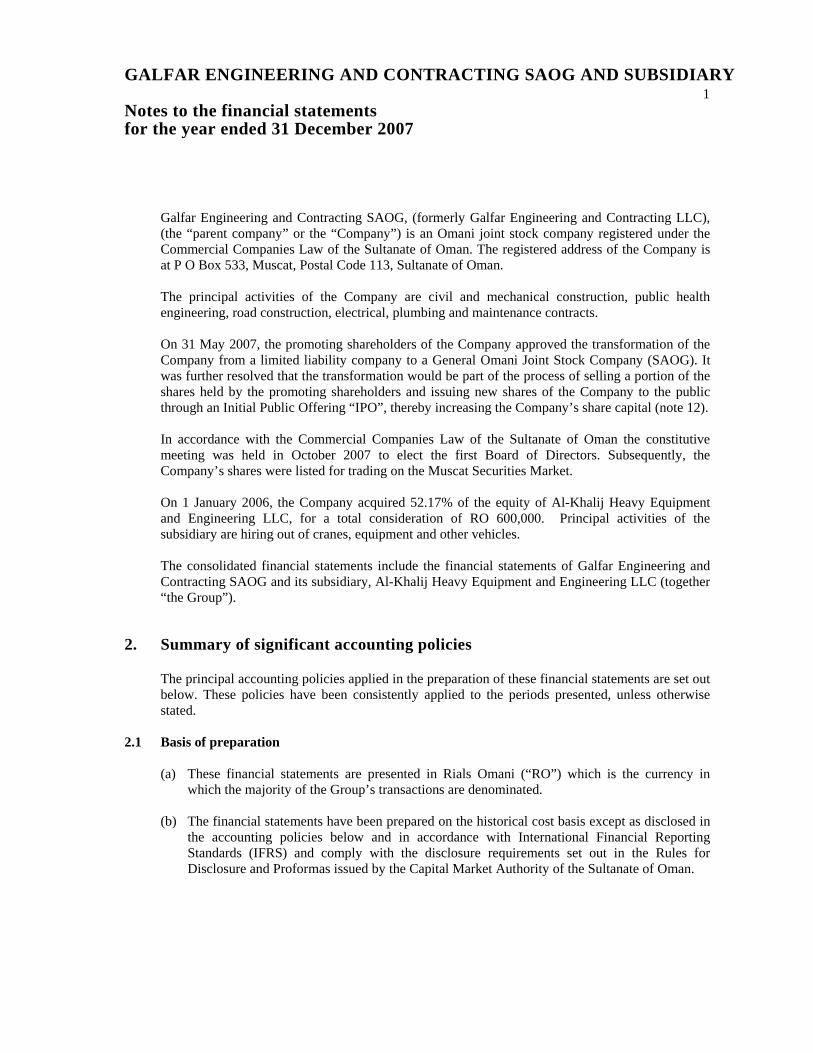
GALFAR ENGINEERING AND CONTRACTING SAOG AND SUBSIDIARY 1
Notes to the financial statements for the year ended 31 December 2007
Galfar Engineering and Contracting SAOG, (formerly Galfar Engineering and Contracting LLC), (the “parent company” or the “Company”) is an Omani joint stock company registered under the Commercial Companies Law of the Sultanate of Oman. The registered address of the Company is at P O Box 533, Muscat, Postal Code 113, Sultanate of Oman. The principal activities of the Company are civil and mechanical construction, public health engineering, road construction, electrical, plumbing and maintenance contracts. On 31 May 2007, the promoting shareholders of the Company approved the transformation of the Company from a limited liability company to a General Omani Joint Stock Company (SAOG). It was further resolved that the transformation would be part of the process of selling a portion of the shares held by the promoting shareholders and issuing new shares of the Company to the public through an Initial Public Offering “IPO”, thereby increasing the Company’s share capital (note 12). In accordance with the Commercial Companies Law of the Sultanate of Oman the constitutive meeting was held in October 2007 to elect the first Board of Directors. Subsequently, the Company’s shares were listed for trading on the Muscat Securities Market. On 1 January 2006, the Company acquired 52.17% of the equity of Al-Khalij Heavy Equipment and Engineering LLC, for a total consideration of RO 600,000. Principal activities of the subsidiary are hiring out of cranes, equipment and other vehicles. The consolidated financial statements include the financial statements of Galfar Engineering and Contracting SAOG and its subsidiary, Al-Khalij Heavy Equipment and Engineering LLC (together “the Group”).
2. Summary of significant accounting policies The principal accounting policies applied in the preparation of these financial statements are set out below. These policies have been consistently applied to the periods presented, unless otherwise stated.
2.1 Basis of preparation (a) These financial statements are presented in Rials Omani (“RO”) which is the currency in
which the majority of the Group’s transactions are denominated. (b) The financial statements have been prepared on the historical cost basis except as disclosed in
the accounting policies below and in accordance with International Financial Reporting Standards (IFRS) and comply with the disclosure requirements set out in the Rules for Disclosure and Proformas issued by the Capital Market Authority of the Sultanate of Oman.
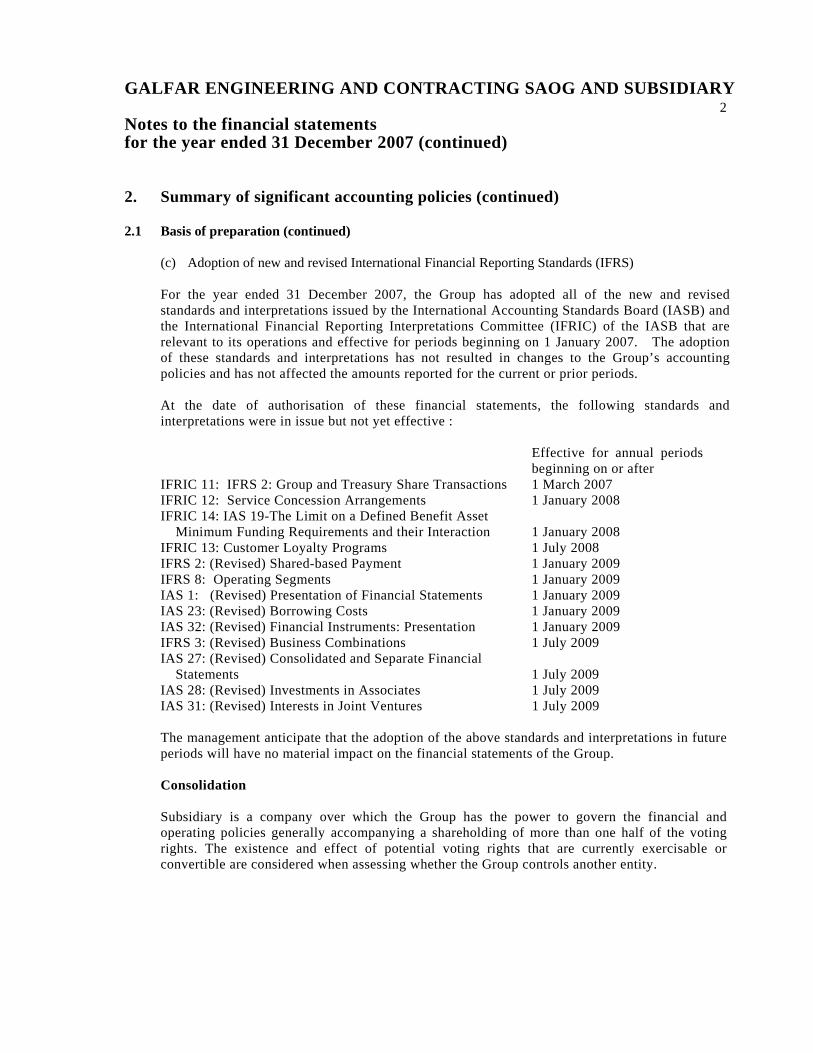
GALFAR ENGINEERING AND CONTRACTING SAOG AND SUBSIDIARY 2
Notes to the financial statements for the year ended 31 December 2007 (continued) 2. Summary of significant accounting policies (continued)
2.1 Basis of preparation (continued)
(c) Adoption of new and revised International Financial Reporting Standards (IFRS) For the year ended 31 December 2007, the Group has adopted all of the new and revised standards and interpretations issued by the International Accounting Standards Board (IASB) and the International Financial Reporting Interpretations Committee (IFRIC) of the IASB that are relevant to its operations and effective for periods beginning on 1 January 2007. The adoption of these standards and interpretations has not resulted in changes to the Group’s accounting policies and has not affected the amounts reported for the current or prior periods. At the date of authorisation of these financial statements, the following standards and interpretations were in issue but not yet effective : Effective for annual periods
beginning on or after IFRIC 11: IFRS 2: Group and Treasury Share Transactions 1 March 2007 IFRIC 12: Service Concession Arrangements 1 January 2008 IFRIC 14: IAS 19-The Limit on a Defined Benefit Asset Minimum Funding Requirements and their Interaction
1 January 2008
IFRIC 13: Customer Loyalty Programs 1 July 2008 IFRS 2: (Revised) Shared-based Payment 1 January 2009 IFRS 8: Operating Segments 1 January 2009 IAS 1: (Revised) Presentation of Financial Statements 1 January 2009 IAS 23: (Revised) Borrowing Costs 1 January 2009 IAS 32: (Revised) Financial Instruments: Presentation 1 January 2009 IFRS 3: (Revised) Business Combinations 1 July 2009 IAS 27: (Revised) Consolidated and Separate Financial Statements
1 July 2009
IAS 28: (Revised) Investments in Associates 1 July 2009 IAS 31: (Revised) Interests in Joint Ventures 1 July 2009 The management anticipate that the adoption of the above standards and interpretations in future periods will have no material impact on the financial statements of the Group. Consolidation Subsidiary is a company over which the Group has the power to govern the financial and operating policies generally accompanying a shareholding of more than one half of the voting rights. The existence and effect of potential voting rights that are currently exercisable or convertible are considered when assessing whether the Group controls another entity.
GALFAR ENGINEERING AND CONTRACTING SAOG AND SUBSIDIARY 3
Notes to the financial statements for the year ended 31 December 2007 (continued) 2. Summary of significant accounting policies (continued)
Consolidation (continued) Subsidiary is fully consolidated from the date on which control is transferred to the Group. They are de-consolidated from the date that control ceases. The purchase method of accounting is used to account for the acquisition of subsidiary by the Group. The cost of an acquisition is measured as the fair value of the assets given, equity instruments issued and liabilities incurred or assumed at the date of exchange, plus costs directly attributable to the acquisition. Identifiable assets acquired and liabilities and contingent liabilities assumed in a business combination are measured initially at their fair values at the acquisition date, irrespective of the extent of any minority interest. The excess of the cost of acquisition over the fair value of the group’s share of the identifiable net assets acquired is recorded as goodwill. If the cost of acquisition is less than the fair value of the net assets of the subsidiary acquired, the difference is recognised directly in the income statement. Inter-company transactions, balances and unrealised gains on transactions between Group companies are eliminated. Unrealised losses are also eliminated but considered an impairment indicator of the asset transferred. Accounting policies of subsidiary are changed, where necessary, to ensure consistency with the policies adopted by the group. In parent company’s financial statements, the investments in subsidiaries are stated at cost less impairment losses. The consolidated financial statements comprise those of the parent company and its subsidiary drawn up to 31 December each year. Minority interests Minority interest represents the interests in the subsidiary, not held by the parent company. The Group applies a policy of treating transactions with minority interests as transactions with parties external to the group. Disposals to minority interests result in gains and losses for the Group that are recorded in the income statement. Acquisitions result in goodwill, being the difference between any consideration paid and the relevant share acquired of the carrying value of net assets of the subsidiary.
GALFAR ENGINEERING AND CONTRACTING SAOG AND SUBSIDIARY 4
Notes to the financial statements for the year ended 31 December 2007 (continued) 2. Summary of significant accounting policies (continued)
Goodwill Goodwill arising on the acquisition of a subsidiary represents the excess of the cost of acquisition over the Group’s interest in the net fair value of the identifiable assets, liabilities and contingent liabilities of the subsidiary recognised at the date of acquisition. Goodwill is initially recognised as an asset at cost and is subsequently measured at cost less any accumulated impairment losses. For the purpose of impairment testing, goodwill is allocated to each of the Group’s cash-generating units expected to benefit from the synergies of the combination. Cash-generating units to which goodwill is allocated are tested for impairment annually, or more frequently when there is an indication that the unit may be impaired. If the recoverable amount of the cash-generating unit is less than the carrying amount of the unit, the impairment loss is allocated first to reduce the carrying amount of any goodwill allocated to the unit and then to the other assets of the unit pro-rata on the basis of the carrying amount of each asset in the unit. An impairment loss recognised for goodwill is not reversed in a subsequent period. The attributable amount of goodwill is included in the determination of the profit or loss on disposal of subsidiary. Property, plant and equipment All items of property, plant and equipment held for the use of Group’s activities are recorded at cost less accumulated depreciation and any identified impairment loss.
Depreciation is charged so as to write off the cost of property, plant and equipment over their estimated useful lives, using the straight line method, on the following bases: Years Site accommodation 4 Ghala camp 15 Plant and machinery 3 – 10 Lab equipment 5 Furniture and equipment 3 – 6 Software development 7 Motor vehicles and heavy equipments 3 - 10 Sundry assets costing less than RO 100 are written off in the year of purchase. The gain or loss on the disposal or retirement of an asset is determined as the difference between the sales proceeds and the carrying amount of the asset and is recognized in the income statement.
GALFAR ENGINEERING AND CONTRACTING SAOG AND SUBSIDIARY 5
Notes to the financial statements for the year ended 31 December 2007 (continued) 2. Summary of significant accounting policies (continued)
Capital work in progress Properties in the course of construction for production, rental or administrative purposes, or for purposes not yet determined, are carried at cost, less any recognised impairment loss. Depreciation of these assets, on the same basis as other property assets, commences when the assets are ready for their intended use. Impairment At each balance date, the Group reviews the carrying amounts of its assets to determine whether there is any indication that those assets have suffered an impairment loss. If any such indication exists, the recoverable amount of the asset is estimated in order to determine the extent of the impairment loss, if any. The loss arising on an impairment of an asset is determined as the difference between the recoverable amount and carrying amount of the asset and is recognised immediately in the income statement. Where an impairment loss subsequently reverses, the carrying amount of the asset is increased to the revised estimate of its recoverable amount and the increase is recognised as income immediately, provided that the increased carrying amount does not exceed the carrying amount that would have been determined had no impairment loss been recognised earlier. Available-for-sale investments Available-for-sale investments are initially recognised at cost, which includes transaction costs, and are, in general, subsequently carried at fair value. Available-for-sale equity investments that do not have a quoted market price in an active market, and for which other methods of reasonably estimating fair value are inappropriate, are measured at cost, as reduced by allowances for estimated impairment. Inventories Inventories are stated at the lower of cost and net realizable value. Cost comprises purchase price and all direct costs incurred in bringing the inventories to their present location and condition. Cost is calculated using the weighted average method. Net realizable value represents the estimated selling price less all estimated costs to be incurred in marketing, selling and distribution. Financial instruments Financial assets and financial liabilities are recognized on the Group’s balance sheet when the Group becomes a party to the contractual provisions of the instrument. The principal financial assets are cash and bank balances and trade and other receivables.

GALFAR ENGINEERING AND CONTRACTING SAOG AND SUBSIDIARY 6
Notes to the financial statements for the year ended 31 December 2007 (continued) 2. Summary of significant accounting policies (continued)
Financial instruments (continued) Trade and other receivables are stated at their nominal values as reduced by appropriate allowances for estimated impaired debts. The principal financial liabilities are trade payables, term loans and bank borrowings.
Trade and payables are stated at their nominal value. Interest-bearing loans and borrowings are recorded at the proceeds received, net of direct issue costs. After initial recognition, interest bearing loans and borrowings are subsequently measured at amortised cost using the effective interest method. Offsetting Financial assets and financial liabilities are offset and the net amount reported in the balance sheet only when there is a legally enforceable right to set off the recognised amounts and the Group intends to either settle on a net basis, or to realise the asset and settle the liability simultaneously. Provision for employees’ benefits Termination benefits for Omani employees are contributed in accordance with the terms of the Social Securities Law of 1991. Provision for non-Omani employees has been made for termination gratuities, leave pay and passage in accordance with the terms of the Labour Law of the Sultanate of Oman. Taxation Taxation is provided for in accordance with the fiscal regulations of the Sultanate of Oman. Deferred tax is accounted for using the balance sheet liability method in respect of temporary differences arising from differences between the carrying amount of assets and liabilities in the financial statements and the corresponding tax basis used in the computation of taxable profit. In principle, deferred tax liabilities are recognized for all taxable temporary differences and deferred tax assets are recognized to the extent that it is probable that taxable profit will be available against which deductible temporary differences can be utilized. Such assets and liabilities are not recognized if the temporary difference arises from the initial recognition of other assets and liabilities in a transaction which affects neither the tax profit nor the accounting profit. Deferred tax is calculated at the tax rates that are expected to apply to the period when the asset is realized or the liability is settled. Deferred tax is charged or credited in the income statement, except when it relates to items credited or charged directly to equity, in which case the deferred tax is also dealt with in equity.
GALFAR ENGINEERING AND CONTRACTING SAOG AND SUBSIDIARY 7
Notes to the financial statements for the year ended 31 December 2007 (continued) 2. Summary of significant accounting policies (continued)
Provisions Provisions are recognized when the Group has a present obligation as a result of a past event which it is probable will result in an outflow of economic benefits that can be reasonably estimated.
Foreign currencies Transactions denominated in foreign currencies are initially recorded at the rates of exchange prevailing on the dates of the transactions. Monetary assets and liabilities denominated in such currencies are translated at the rates prevailing on the balance sheet date. Gains and losses arising from foreign currency transactions are included in the profit or loss for the year. Revenue recognition Where the outcome of a construction contract can be estimated reliably, revenue and costs are recognized by reference to the stage of completion of the construction activity at the balance sheet date, as measured by surveys of work performed. Variation in contract work, claims and incentive payments are included to the extent that they have been agreed with the customer. Where the outcome of a construction contract cannot be estimated reliably, contract revenue is recognised to the extent of contract costs incurred that it is probable will be recoverable. Contract costs are recognised as expenses in the period in which they are incurred. When it is probable that total contract costs will exceed total contract revenue, the expected loss is recognized as an expense immediately. Net financing costs All interest costs incurred in connection with borrowings, net of interest received are recognised in the period in which they are incurred as net financing costs. Directors’ remuneration In accordance with the Capital Market Authority circular E/2/2007, directors’ remuneration is computed in accordance with the Article 101 of the Commercial Companies Law of 1974, as per the requirements of Capital Market Authority and is charged as an expense in the income statement. Cash and cash equivalents For the purpose of the cash flows statement, the Group considers cash on hand and bank balances with a maturity of less than three months from the date of placement as cash and cash equivalents.
GALFAR ENGINEERING AND CONTRACTING SAOG AND SUBSIDIARY 8
Notes to the financial statements for the year ended 31 December 2007 (continued) 2. Summary of significant accounting policies (continued)
Use of estimates The preparation of the financial statements requires management to make estimates and assumptions that affect the reported amount of financial assets and liabilities at the date of the financial statements and the resultant provisions and changes in fair value for the year. Such estimates are necessarily based on assumptions about several factors involving varying, and possibly significant, degrees of judgment and uncertainty and actual results may differ from management’s estimates resulting in future changes in estimated assets and liabilities.
3. Financial risk management Financial instruments carried on the balance sheet comprise cash and cash equivalents, trade and other receivables, trade and other payables and borrowings. Financial assets are assessed for indicators of impairment at each balance sheet date. Financial assets are impaired where there is objective evidence that as a result of one or more events that occurred after the initial recognition of the financial asset, the estimated future cash flows have been impacted. The classification of financial assets depends on the purpose for which the financial assets were acquired. Management determines the classification of its financial assets at initial recognition. Financial risk factors Overview The Group has exposure to the following risks from its use of financial instruments: • Credit risk • Liquidity risk • Market risk The Group’s activities expose it to a variety of financial risks: market risk, credit risk and liquidity risk. The Group’s overall risk management programme focuses on the unpredictability of financial markets and seeks to minimise potential adverse effects on the Group’s financial performance. Risk management is carried out under policies approved by the management which identify, evaluate and hedge financial risk. The management provides written principles for overall risk management covering specific areas, such as foreign exchange risk, interest rate risk, credit risk, and investment of excess liquidity.
GALFAR ENGINEERING AND CONTRACTING SAOG AND SUBSIDIARY 9
Notes to the financial statements for the year ended 31 December 2007 (continued) 3. Financial risk management (continued)
(i) Credit risk Credit risk is the risk of financial loss to the Group if a customer or counterparty to a financial instrument fails to meet its contractual obligations and arises principally from the Group’s receivables from customers. Trade and other receivables The Group’s exposure to credit risk is influenced mainly by the individual characteristics of each customer. All major customers are based in the Sultanate of Oman. The Group has established credit policies and procedures that are considered appropriate and commensurate with the nature and size of receivables. In monitoring customer credit risk, customers are segmented according to their credit characteristics in the following categories: • Private individual customers • Corporate customers • Government customers • Other customers The potential risk in respect of amounts receivable is limited to their carrying values as management regularly reviews these balances whose recoverability is in doubt. There is no credit risk in respect of receivable from Government customers. The Group establishes a provision for impairment that represents its estimate of potential losses in respect of trade and other receivables. The main components of this loss are a specific loss component that relates to individual exposures and a collective loss component established for similar assets in respect of any potential losses that may have been incurred but not yet identified. The collective loss provision is determined based on historical data of payment statistics for similar financial assets. Investments The Group limits its exposure to credit risk on its investments by only invest in liquid securities and only with counterparties which have a good credit rating. Given good credit ratings and liquidity, management does not expect any counterparty to fail to meet its obligations.
GALFAR ENGINEERING AND CONTRACTING SAOG AND SUBSIDIARY 10
Notes to the financial statements for the year ended 31 December 2007 (continued) 3. Financial risk management (continued)
(ii) Liquidity risk Liquidity risk is the risk that the Group will not be able to meet its financial obligations as they fall due. The Group’s approach to managing liquidity is to ensure, as far as possible, that it will have sufficient liquidity to meet its liabilities when due, under both normal and stressed conditions, without incurring unacceptable losses or risking damage to the Group’s reputation. Typically, the Group ensures that it has sufficient cash on demand to meet expected operational expenses including the servicing of financial obligations. This excludes the potential impact of extreme circumstances that cannot reasonably be predicted, such as natural disasters. In addition, the Group has access to credit facilities. (iii) Market risk Market risk is the risk that changes in market prices, such as foreign exchange rates and interest rates affect the Group’s income or the value of its holdings of financial instruments. The objective of market risk management is to manage and control market risk exposures within acceptable parameters, while optimising the return. Foreign currency risk The Group’s functional and presentation currency is Rial Omani and the Group’s performance is substantially independent of changes in foreign currency rates. There are no significant financial instruments denominated in foreign currency and consequently, foreign currency risk is not significant. Interest rate risk The Group has short term bank deposits and borrowings, which are interest bearing and exposed to changes in market interest rates. The Group adopts a policy of appropriate mix of fixed and floating rate instruments to minimize interest rate risk. Capital management The Group’s objective when managing capital is to safeguard its ability to continue as a going concern and benefit other stakeholders. The management’s policy is to maintain a strong capital base so as to maintain creditor and market confidence and to sustain future development of the business. Management is confident of maintaining the current level of profitability by enhancing top line growth and prudent cost management. The Group is not subject to externally imposed capital requirements.
GALFAR ENGINEERING AND CONTRACTING SAOG AND SUBSIDIARY 11
Notes to the financial statements for the year ended 31 December 2007 (continued) 4. Property, plant and equipment
Parent Company
Land
Site accommodatio
n
Ghala camp
Plant and machinery
Lab equipment
Furniture and
equipment
Software development
Motor
vehicles and heavy equipment
Capital work-in-progress
Total
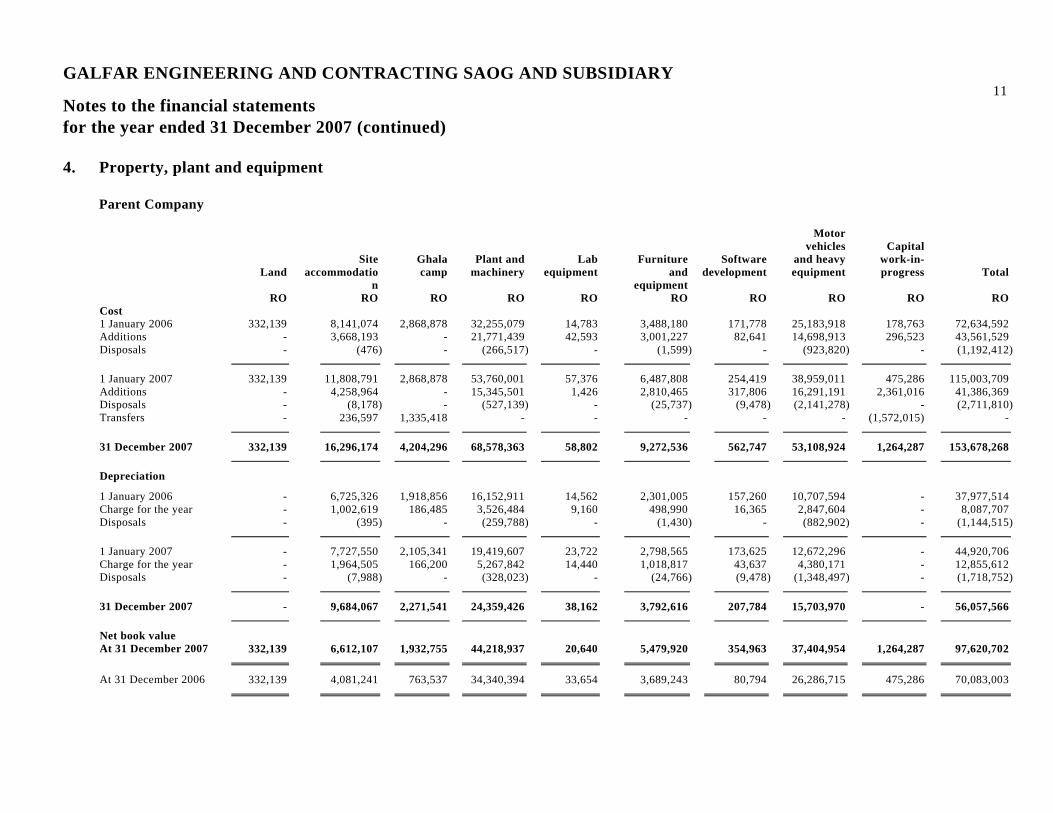
RO RO RO RO RO RO RO RO RO RO Cost 1 January 2006 332,139 8,141,074 2,868,878 32,255,079 14,783 3,488,180 171,778 25,183,918 178,763 72,634,592 Additions - 3,668,193 - 21,771,439 42,593 3,001,227 82,641 14,698,913 296,523 43,561,529 Disposals - (476) - (266,517) - (1,599) - (923,820) - (1,192,412) 1 January 2007 332,139 11,808,791 2,868,878 53,760,001 57,376 6,487,808 254,419 38,959,011 475,286 115,003,709 Additions - 4,258,964 - 15,345,501 1,426 2,810,465 317,806 16,291,191 2,361,016 41,386,369 Disposals - (8,178) - (527,139) - (25,737) (9,478) (2,141,278) - (2,711,810) Transfers - 236,597 1,335,418 - - - - - (1,572,015) - 31 December 2007 332,139 16,296,174 4,204,296 68,578,363 58,802 9,272,536 562,747 53,108,924 1,264,287 153,678,268 Depreciation 1 January 2006 - 6,725,326 1,918,856 16,152,911 14,562 2,301,005 157,260 10,707,594 - 37,977,514 Charge for the year - 1,002,619 186,485 3,526,484 9,160 498,990 16,365 2,847,604 - 8,087,707 Disposals - (395) - (259,788) - (1,430) - (882,902) - (1,144,515) 1 January 2007 - 7,727,550 2,105,341 19,419,607 23,722 2,798,565 173,625 12,672,296 - 44,920,706 Charge for the year - 1,964,505 166,200 5,267,842 14,440 1,018,817 43,637 4,380,171 - 12,855,612 Disposals - (7,988) - (328,023) - (24,766) (9,478) (1,348,497) - (1,718,752) 31 December 2007 - 9,684,067 2,271,541 24,359,426 38,162 3,792,616 207,784 15,703,970 - 56,057,566 Net book value At 31 December 2007 332,139 6,612,107 1,932,755 44,218,937 20,640 5,479,920 354,963 37,404,954 1,264,287 97,620,702 At 31 December 2006 332,139 4,081,241 763,537 34,340,394 33,654 3,689,243 80,794 26,286,715 475,286 70,083,003
GALFAR ENGINEERING AND CONTRACTING SAOG AND SUBSIDIARY 12
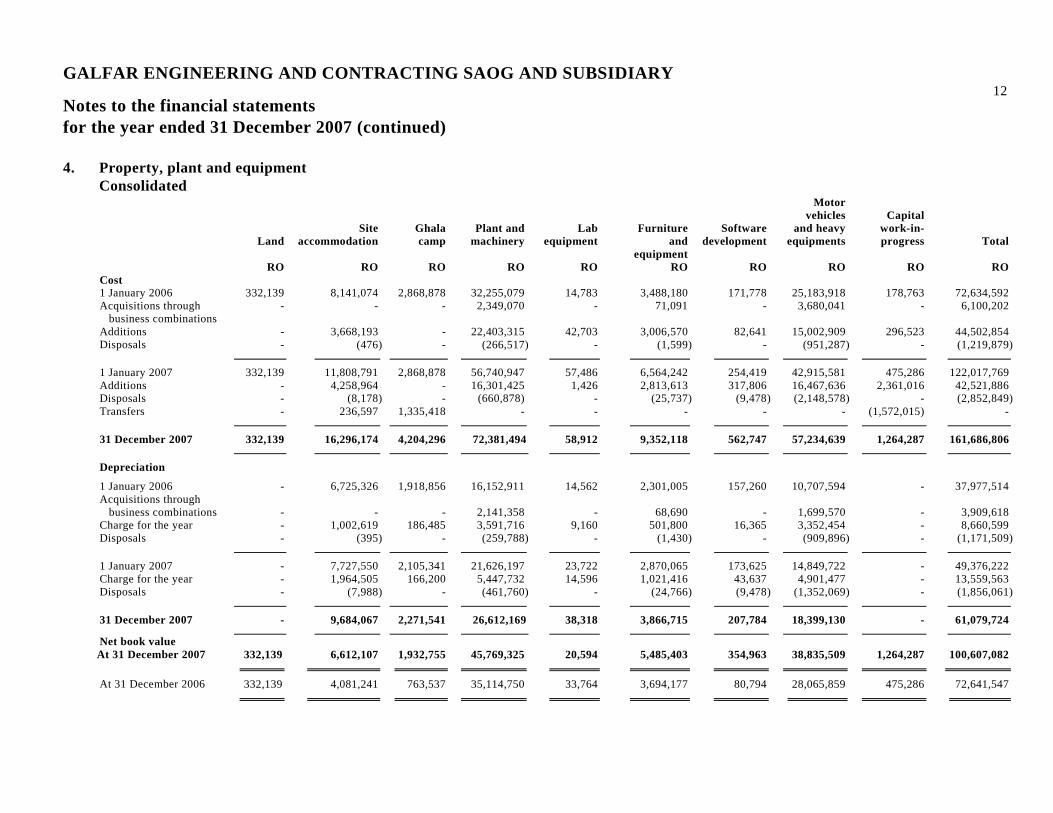
Notes to the financial statements for the year ended 31 December 2007 (continued) 4. Property, plant and equipment
Consolidated
Land
Site accommodation
Ghala camp
Plant and machinery
Lab equipment
Furniture and
equipment
Software development
Motor vehicles
and heavy equipments
Capital
work-in-progress
Total
RO RO RO RO RO RO RO RO RO RO Cost 1 January 2006 332,139 8,141,074 2,868,878 32,255,079 14,783 3,488,180 171,778 25,183,918 178,763 72,634,592 Acquisitions through business combinations
- - - 2,349,070 - 71,091 - 3,680,041 - 6,100,202
Additions - 3,668,193 - 22,403,315 42,703 3,006,570 82,641 15,002,909 296,523 44,502,854 Disposals - (476) - (266,517) - (1,599) - (951,287) - (1,219,879) 1 January 2007 332,139 11,808,791 2,868,878 56,740,947 57,486 6,564,242 254,419 42,915,581 475,286 122,017,769 Additions - 4,258,964 - 16,301,425 1,426 2,813,613 317,806 16,467,636 2,361,016 42,521,886 Disposals - (8,178) - (660,878) - (25,737) (9,478) (2,148,578) - (2,852,849) Transfers - 236,597 1,335,418 - - - - - (1,572,015) - 31 December 2007 332,139 16,296,174 4,204,296 72,381,494 58,912 9,352,118 562,747 57,234,639 1,264,287 161,686,806 Depreciation 1 January 2006 - 6,725,326 1,918,856 16,152,911 14,562 2,301,005 157,260 10,707,594 - 37,977,514 Acquisitions through business combinations
-
-
-
2,141,358
-
68,690
-
1,699,570
-
3,909,618
Charge for the year - 1,002,619 186,485 3,591,716 9,160 501,800 16,365 3,352,454 - 8,660,599 Disposals - (395) - (259,788) - (1,430) - (909,896) - (1,171,509) 1 January 2007 - 7,727,550 2,105,341 21,626,197 23,722 2,870,065 173,625 14,849,722 - 49,376,222 Charge for the year - 1,964,505 166,200 5,447,732 14,596 1,021,416 43,637 4,901,477 - 13,559,563 Disposals - (7,988) - (461,760) - (24,766) (9,478) (1,352,069) - (1,856,061) 31 December 2007 - 9,684,067 2,271,541 26,612,169 38,318 3,866,715 207,784 18,399,130 - 61,079,724
Net book value At 31 December 2007 332,139 6,612,107 1,932,755 45,769,325 20,594 5,485,403 354,963 38,835,509 1,264,287 100,607,082 At 31 December 2006 332,139 4,081,241 763,537 35,114,750 33,764 3,694,177 80,794 28,065,859 475,286 72,641,547
GALFAR ENGINEERING AND CONTRACTING SAOG AND SUBSIDIARY 13
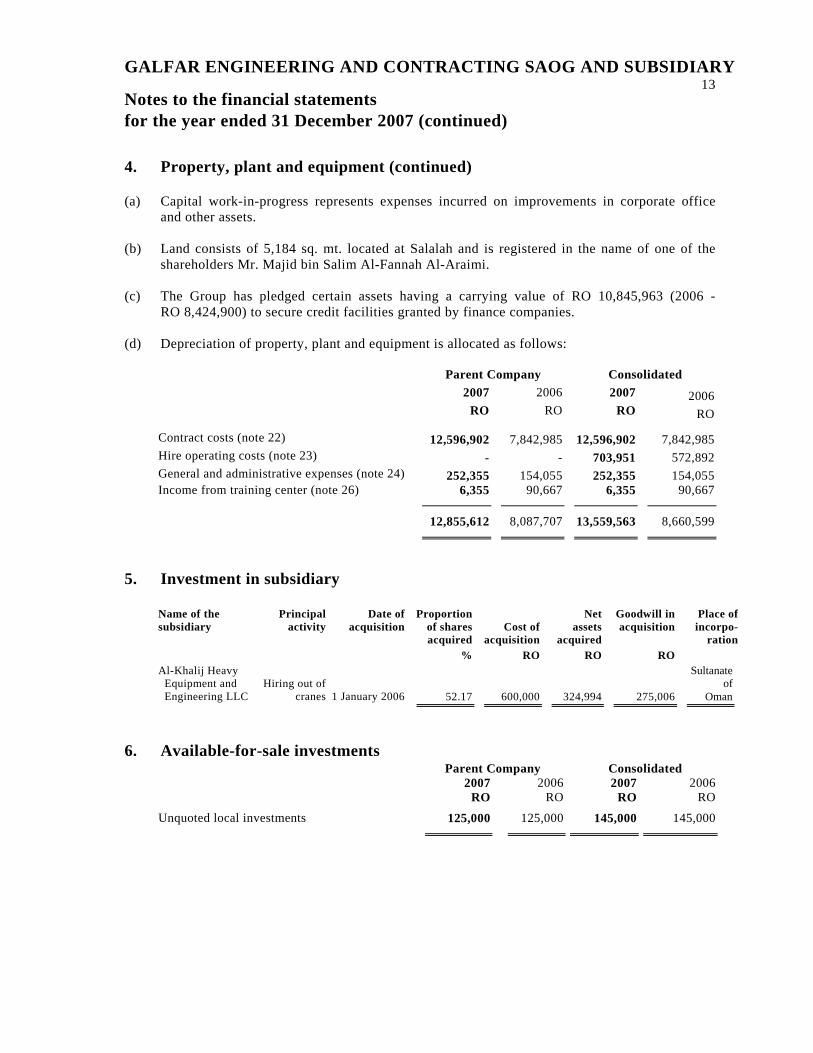
Notes to the financial statements for the year ended 31 December 2007 (continued) 4. Property, plant and equipment (continued) (a) Capital work-in-progress represents expenses incurred on improvements in corporate office
and other assets. (b) Land consists of 5,184 sq. mt. located at Salalah and is registered in the name of one of the
shareholders Mr. Majid bin Salim Al-Fannah Al-Araimi. (c) The Group has pledged certain assets having a carrying value of RO 10,845,963 (2006 -
RO 8,424,900) to secure credit facilities granted by finance companies. (d) Depreciation of property, plant and equipment is allocated as follows:
Parent Company Consolidated 2007 2006 2007 2006 RO RO RO RO Contract costs (note 22) 12,596,902 7,842,985 12,596,902 7,842,985 Hire operating costs (note 23) - - 703,951 572,892 General and administrative expenses (note 24) 252,355 154,055 252,355 154,055 Income from training center (note 26) 6,355 90,667 6,355 90,667 12,855,612 8,087,707 13,559,563 8,660,599
5. Investment in subsidiary
Name of the subsidiary
Principal activity
Date of acquisition
Proportion of shares acquired
Cost of
acquisition
Net assets
acquired
Goodwill in acquisition
Place of incorpo-
ration % RO RO RO Al-Khalij Heavy Equipment and Engineering LLC
Hiring out of
cranes
1 January 2006
52.17
600,000
324,994
275,006
Sultanate of
Oman
6. Available-for-sale investments Parent Company Consolidated 2007 2006 2007 2006 RO RO RO RO
Unquoted local investments 125,000 125,000 145,000 145,000
GALFAR ENGINEERING AND CONTRACTING SAOG AND SUBSIDIARY 14
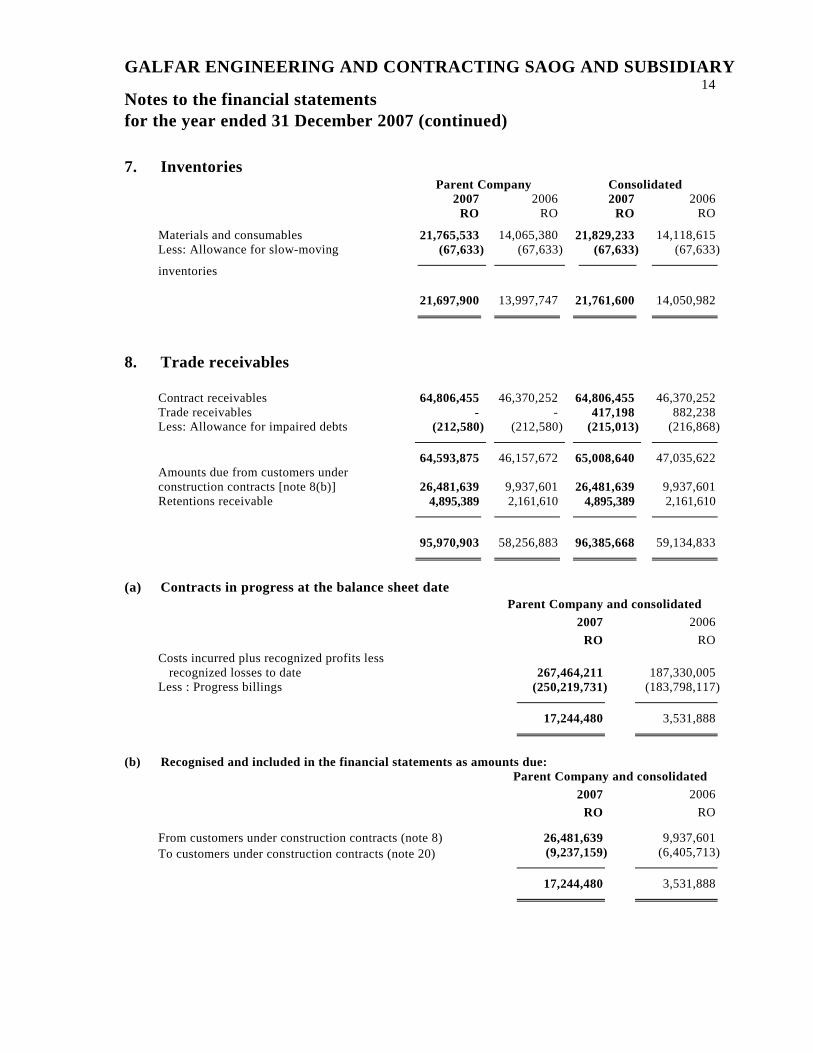
Notes to the financial statements for the year ended 31 December 2007 (continued) 7. Inventories
Parent Company Consolidated 2007 2006 2007 2006 RO RO RO RO Materials and consumables 21,765,533 14,065,380 21,829,233 14,118,615 Less: Allowance for slow-moving
inventories
(67,633) (67,633) (67,633) (67,633)
21,697,900 13,997,747 21,761,600 14,050,982
8. Trade receivables
Contract receivables 64,806,455 46,370,252 64,806,455 46,370,252 Trade receivables - - 417,198 882,238Less: Allowance for impaired debts (212,580) (212,580) (215,013) (216,868)
64,593,875 46,157,672 65,008,640 47,035,622 Amounts due from customers under construction contracts [note 8(b)]
26,481,639
9,937,601
26,481,639
9,937,601
Retentions receivable 4,895,389 2,161,610 4,895,389 2,161,610
95,970,903 58,256,883 96,385,668 59,134,833
(a) Contracts in progress at the balance sheet date
Parent Company and consolidated 2007 2006 RO RO Costs incurred plus recognized profits less recognized losses to date
267,464,211
187,330,005
Less : Progress billings (250,219,731) (183,798,117)
17,244,480 3,531,888
(b) Recognised and included in the financial statements as amounts due:
Parent Company and consolidated 2007 2006 RO RO
From customers under construction contracts (note 8) 26,481,639 9,937,601 To customers under construction contracts (note 20) (9,237,159) (6,405,713)
17,244,480 3,531,888
GALFAR ENGINEERING AND CONTRACTING SAOG AND SUBSIDIARY 15
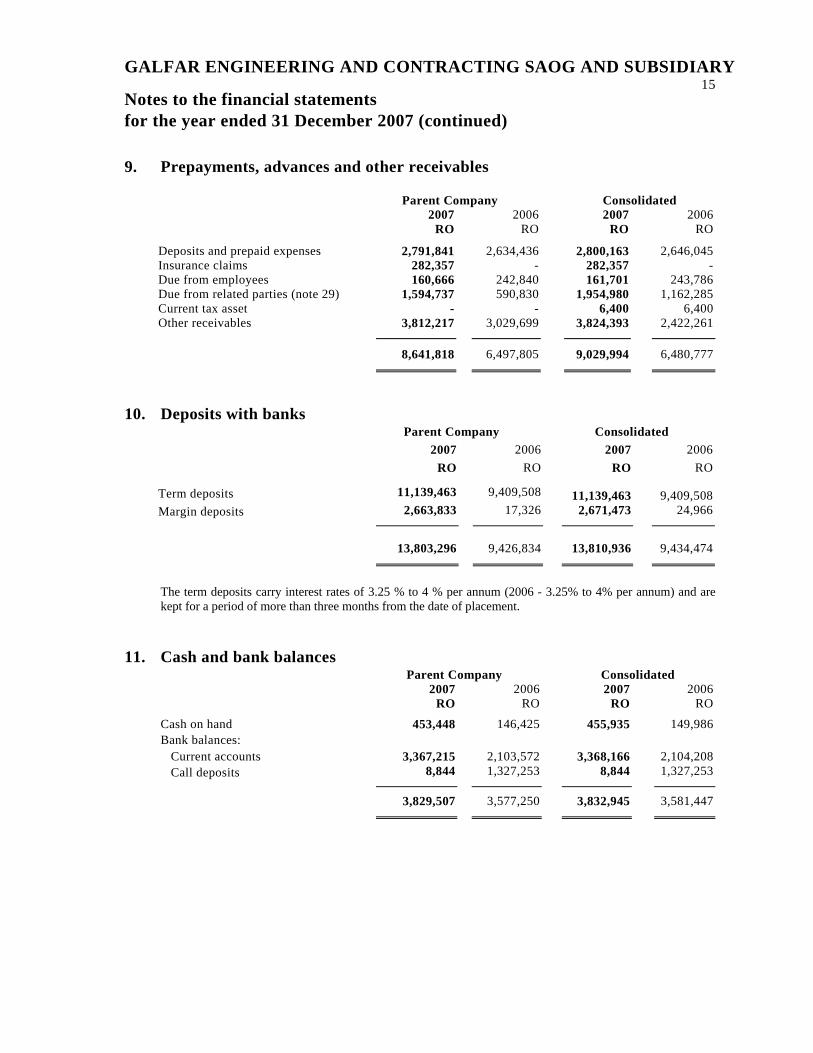
Notes to the financial statements for the year ended 31 December 2007 (continued) 9. Prepayments, advances and other receivables
Parent Company Consolidated 2007 2006 2007 2006 RO RO RO RO Deposits and prepaid expenses 2,791,841 2,634,436 2,800,163 2,646,045 Insurance claims 282,357 - 282,357 - Due from employees 160,666 242,840 161,701 243,786 Due from related parties (note 29) 1,594,737 590,830 1,954,980 1,162,285 Current tax asset - - 6,400 6,400 Other receivables 3,812,217 3,029,699 3,824,393 2,422,261
8,641,818 6,497,805 9,029,994 6,480,777
10. Deposits with banks Parent Company Consolidated 2007 2006 2007 2006 RO RO RO RO
Term deposits 11,139,463 9,409,508 11,139,463 9,409,508 Margin deposits 2,663,833 17,326 2,671,473 24,966
13,803,296 9,426,834 13,810,936 9,434,474
The term deposits carry interest rates of 3.25 % to 4 % per annum (2006 - 3.25% to 4% per annum) and are kept for a period of more than three months from the date of placement.
11. Cash and bank balances Parent Company Consolidated 2007 2006 2007 2006 RO RO RO RO Cash on hand 453,448 146,425 455,935 149,986 Bank balances: Current accounts 3,367,215 2,103,572 3,368,166 2,104,208 Call deposits 8,844 1,327,253 8,844 1,327,253
3,829,507 3,577,250 3,832,945 3,581,447

GALFAR ENGINEERING AND CONTRACTING SAOG AND SUBSIDIARY 16
Notes to the financial statements for the year ended 31 December 2007 (continued) 12. Share capital
Parent and consolidated
2007 2006 RO RO
Authorised: 500,000,000 (2006 – 20,000,000) ordinary shares of par value RO 0.100 (2006 – RO 1) each
500,000,000
20,000,000
Issued and fully paid: At 1 January 20,000,000 7,500,000 Loan from shareholders converted to share capital (note 15)
-
4,300,000
Transferred from retained earnings - 8,200,000 Cash brought in by promoting shareholders 1,000,000 - Proceeds from IPO 4,000,000 -
At 31 December 25,000,000 20,000,000
At the balance sheet date the issued and fully paid share capital comprises of 250,000,000 (2006 - 20,000,000) shares having a par value of RO 0.100 (2006 – RO 1) each. Pursuant to the terms of the IPO, as detailed below, the share capital of the Company is divided into two classes comprising of 175,000,000 ordinary shares and 75,000,000 preferential voting rights shares. The preferential voting rights shares will be held by the promoting shareholders and shall carry two votes at all general meetings while otherwise ranking pari-passu with ordinary shares in all rights including the dividend receipt. As explained in note 1, during the year in pursuant to the IPO, the promoting shareholders of the Company offered a portion of their shares to the public for subscription and proposed to increase the Company’s share capital through a fresh issue of share capital. Prior to the IPO, the parent company increased its share capital through an issue of additional shares of 1,000,000 of RO 1 each to the promoting shareholders. Further, as part of the IPO process, the par value of the shares was split from RO 1 per share to RO 0.100 per share thereby increasing the number of shares from the existing 21,000,000 to 210,000,000. Share premium Under the terms of the IPO, 100 million shares were offered for subscription to the general public @ RO 0.600 per share representing RO 0.100 nominal value and RO 0.500 share premium. This resulted in a cash inflow of RO 60 million. Of the amount collected, RO 36 million (comprising premium of RO 30 million and nominal value of RO 6 million for 60 million shares of RO 0.100 per share) was repaid to the promoting shareholders as consideration for their shares offered for sale, while the remaining RO 24,000,000 accrued to the Company resulting in a share premium of RO 20,000,000 and an increase in share capital of RO 4,000,000 for 40 million shares of RO 0.100 per share.
GALFAR ENGINEERING AND CONTRACTING SAOG AND SUBSIDIARY 17
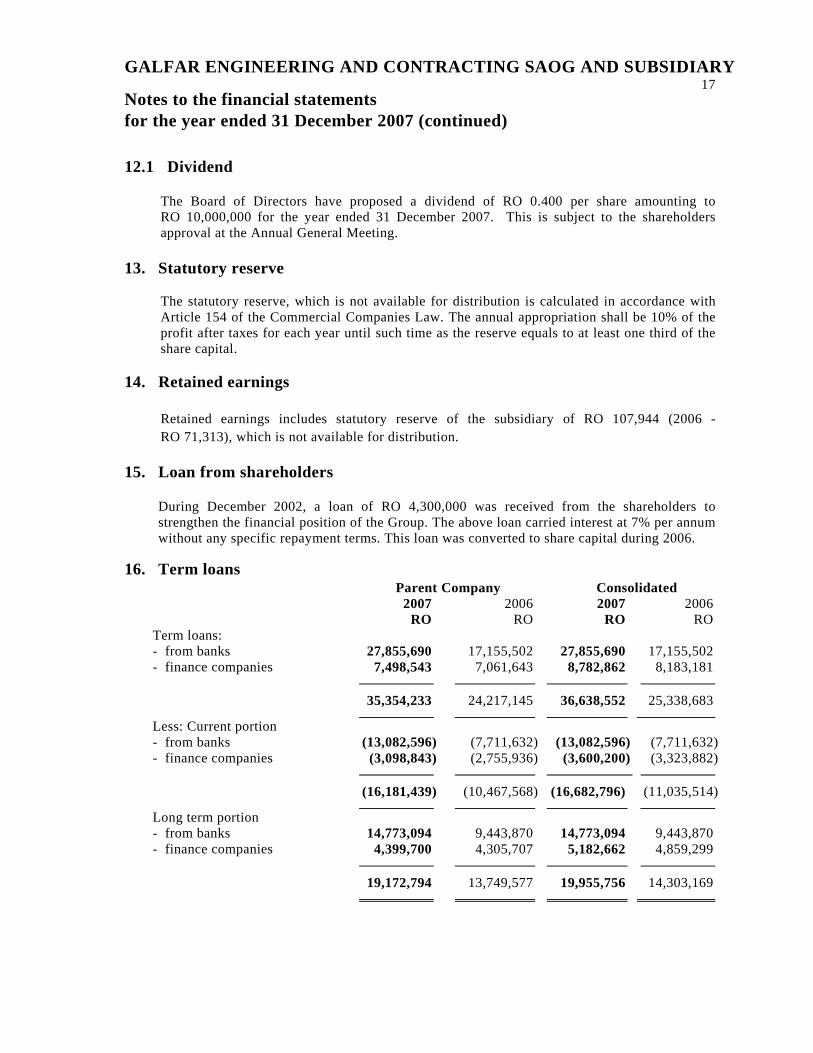
Notes to the financial statements for the year ended 31 December 2007 (continued) 12.1 Dividend
The Board of Directors have proposed a dividend of RO 0.400 per share amounting to RO 10,000,000 for the year ended 31 December 2007. This is subject to the shareholders approval at the Annual General Meeting.
13. Statutory reserve The statutory reserve, which is not available for distribution is calculated in accordance with Article 154 of the Commercial Companies Law. The annual appropriation shall be 10% of the profit after taxes for each year until such time as the reserve equals to at least one third of the share capital.
14. Retained earnings Retained earnings includes statutory reserve of the subsidiary of RO 107,944 (2006 - RO 71,313), which is not available for distribution.
15. Loan from shareholders During December 2002, a loan of RO 4,300,000 was received from the shareholders to
strengthen the financial position of the Group. The above loan carried interest at 7% per annum without any specific repayment terms. This loan was converted to share capital during 2006.
16. Term loans
Parent Company Consolidated 2007 2006 2007 2006 RO RO RO RO Term loans: - from banks 27,855,690 17,155,502 27,855,690 17,155,502 - finance companies 7,498,543 7,061,643 8,782,862 8,183,181 35,354,233 24,217,145 36,638,552 25,338,683
Less: Current portion - from banks (13,082,596) (7,711,632) (13,082,596) (7,711,632) - finance companies (3,098,843) (2,755,936) (3,600,200) (3,323,882) (16,181,439) (10,467,568) (16,682,796) (11,035,514)
Long term portion - from banks 14,773,094 9,443,870 14,773,094 9,443,870 - finance companies 4,399,700 4,305,707 5,182,662 4,859,299 19,172,794 13,749,577 19,955,756 14,303,169
GALFAR ENGINEERING AND CONTRACTING SAOG AND SUBSIDIARY 18
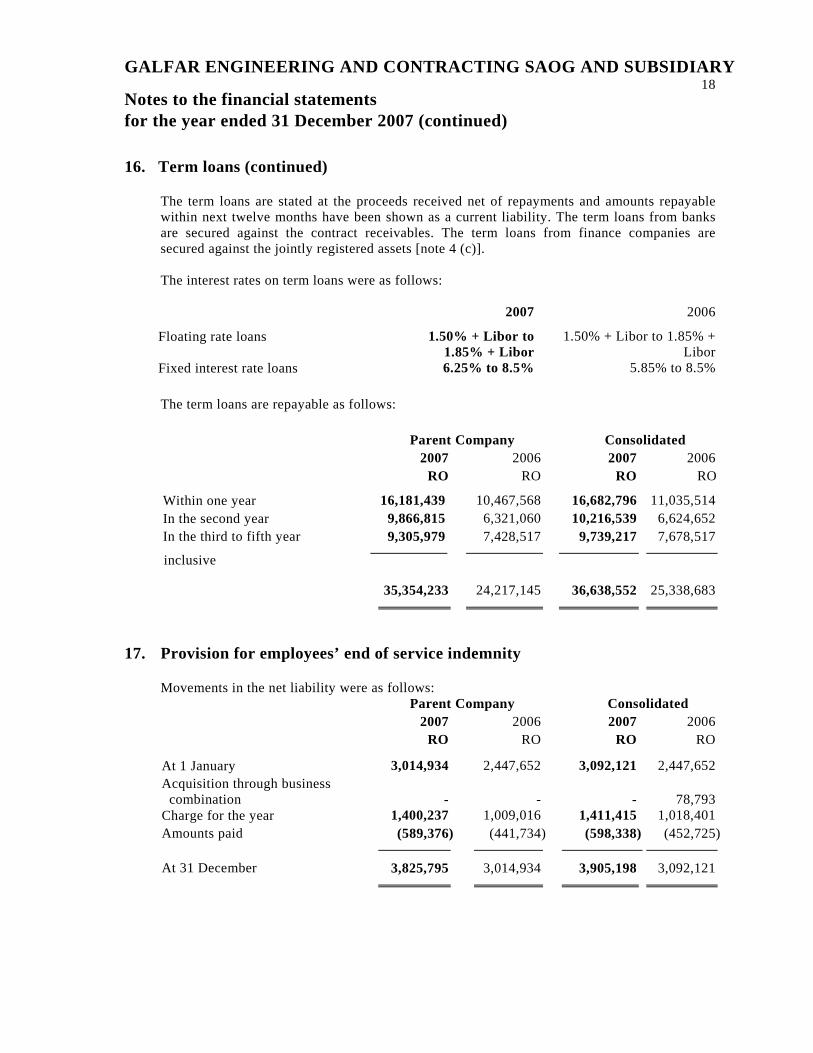
Notes to the financial statements for the year ended 31 December 2007 (continued) 16. Term loans (continued)
The term loans are stated at the proceeds received net of repayments and amounts repayable within next twelve months have been shown as a current liability. The term loans from banks are secured against the contract receivables. The term loans from finance companies are secured against the jointly registered assets [note 4 (c)]. The interest rates on term loans were as follows: 2007 2006 Floating rate loans 1.50% + Libor to
1.85% + Libor 1.50% + Libor to 1.85% +
Libor Fixed interest rate loans 6.25% to 8.5% 5.85% to 8.5% The term loans are repayable as follows: Parent Company Consolidated
2007 2006 2007 2006 RO RO RO RO
Within one year 16,181,439 10,467,568 16,682,796 11,035,514 In the second year 9,866,815 6,321,060 10,216,539 6,624,652 In the third to fifth year
inclusive
9,305,979 7,428,517 9,739,217 7,678,517
35,354,233 24,217,145 36,638,552 25,338,683
17. Provision for employees’ end of service indemnity Movements in the net liability were as follows: Parent Company Consolidated 2007 2006 2007 2006 RO RO RO RO At 1 January 3,014,934 2,447,652 3,092,121 2,447,652 Acquisition through business combination
-
-
-
78,793
Charge for the year 1,400,237 1,009,016 1,411,415 1,018,401 Amounts paid (589,376) (441,734) (598,338) (452,725)
At 31 December 3,825,795 3,014,934 3,905,198 3,092,121
GALFAR ENGINEERING AND CONTRACTING SAOG AND SUBSIDIARY 19
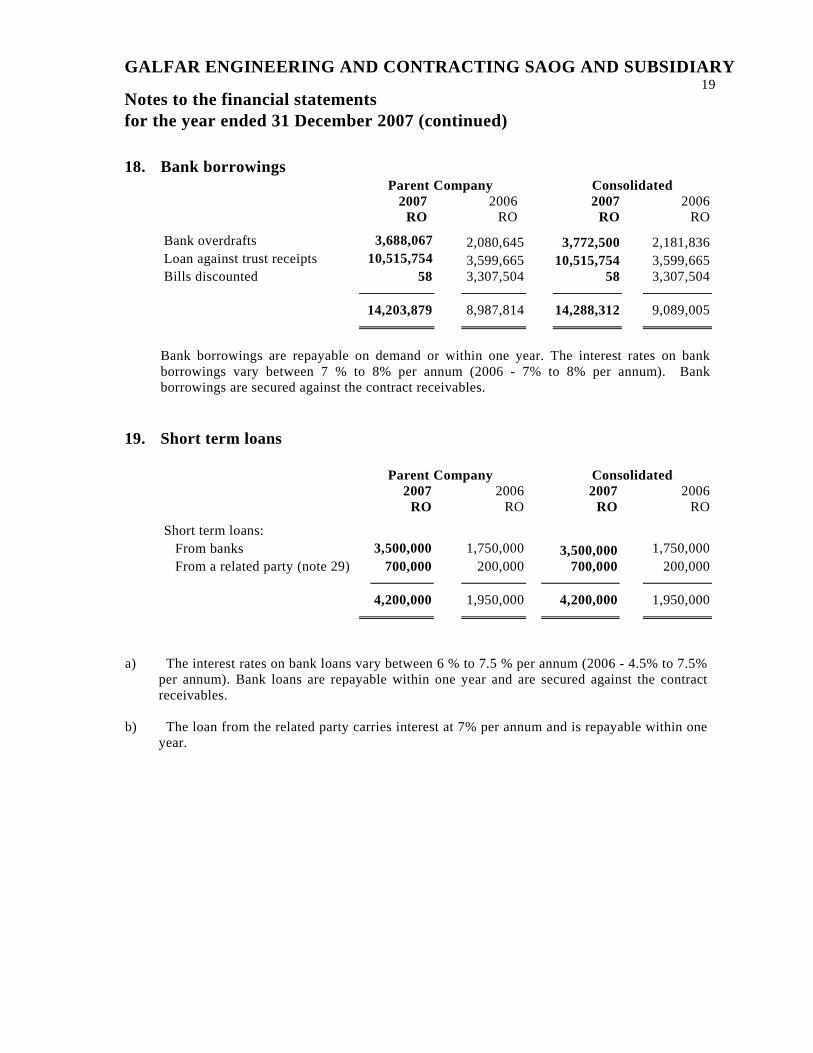
Notes to the financial statements for the year ended 31 December 2007 (continued) 18. Bank borrowings
Parent Company Consolidated 2007 2006 2007 2006 RO RO RO RO
Bank overdrafts 3,688,067 2,080,645 3,772,500 2,181,836 Loan against trust receipts 10,515,754 3,599,665 10,515,754 3,599,665 Bills discounted 58 3,307,504 58 3,307,504 14,203,879 8,987,814 14,288,312 9,089,005
Bank borrowings are repayable on demand or within one year. The interest rates on bank borrowings vary between 7 % to 8% per annum (2006 - 7% to 8% per annum). Bank borrowings are secured against the contract receivables.
19. Short term loans
Parent Company Consolidated 2007 2006 2007 2006 RO RO RO RO
Short term loans: From banks 3,500,000 1,750,000 3,500,000 1,750,000 From a related party (note 29) 700,000 200,000 700,000 200,000 4,200,000 1,950,000 4,200,000 1,950,000
a) The interest rates on bank loans vary between 6 % to 7.5 % per annum (2006 - 4.5% to 7.5% per annum). Bank loans are repayable within one year and are secured against the contract receivables.
b) The loan from the related party carries interest at 7% per annum and is repayable within one year.
GALFAR ENGINEERING AND CONTRACTING SAOG AND SUBSIDIARY 20
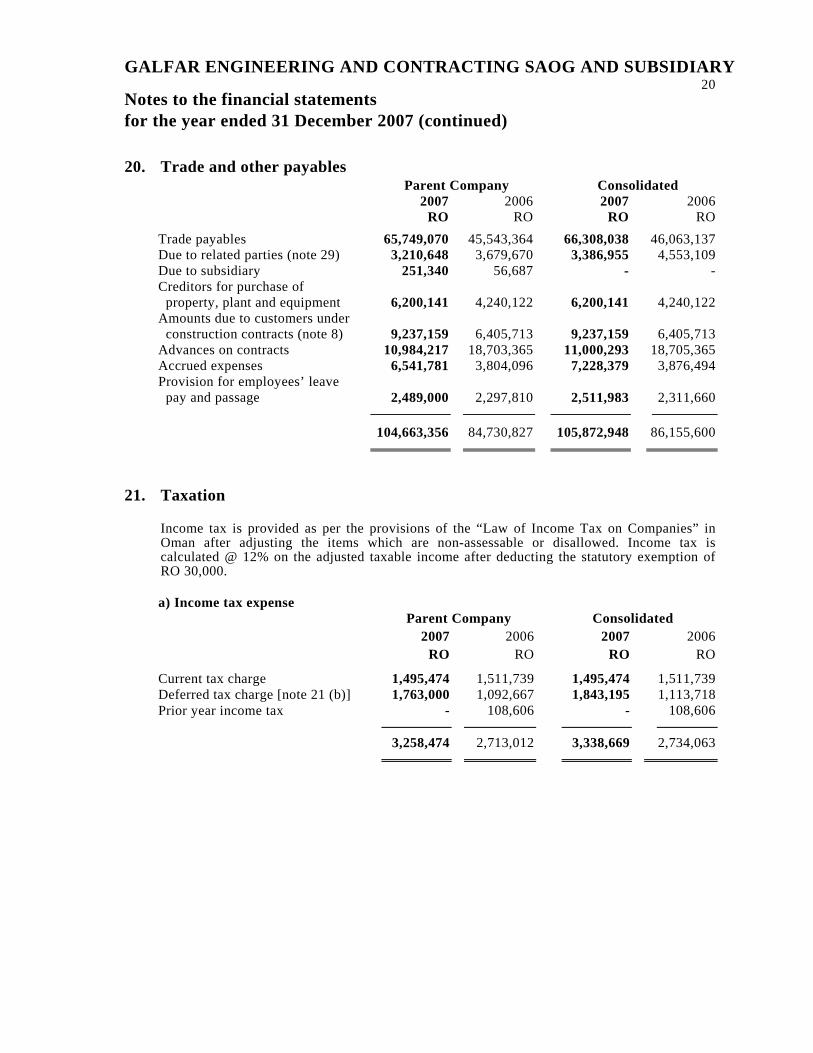
Notes to the financial statements for the year ended 31 December 2007 (continued) 20. Trade and other payables
Parent Company Consolidated 2007 2006 2007 2006 RO RO RO RO
Trade payables 65,749,070 45,543,364 66,308,038 46,063,137 Due to related parties (note 29) 3,210,648 3,679,670 3,386,955 4,553,109 Due to subsidiary 251,340 56,687 - - Creditors for purchase of property, plant and equipment
6,200,141
4,240,122
6,200,141
4,240,122
Amounts due to customers under construction contracts (note 8)
9,237,159
6,405,713
9,237,159
6,405,713
Advances on contracts 10,984,217 18,703,365 11,000,293 18,705,365 Accrued expenses 6,541,781 3,804,096 7,228,379 3,876,494 Provision for employees’ leave pay and passage
2,489,000
2,297,810
2,511,983
2,311,660
104,663,356 84,730,827 105,872,948 86,155,600
21. Taxation
Income tax is provided as per the provisions of the “Law of Income Tax on Companies” in Oman after adjusting the items which are non-assessable or disallowed. Income tax is calculated @ 12% on the adjusted taxable income after deducting the statutory exemption of RO 30,000.
a) Income tax expense Parent Company Consolidated
2007 2006 2007 2006 RO RO RO RO
Current tax charge 1,495,474 1,511,739 1,495,474 1,511,739 Deferred tax charge [note 21 (b)] 1,763,000 1,092,667 1,843,195 1,113,718 Prior year income tax - 108,606 - 108,606
3,258,474 2,713,012 3,338,669 2,734,063
GALFAR ENGINEERING AND CONTRACTING SAOG AND SUBSIDIARY 21
Notes to the financial statements for the year ended 31 December 2007 (continued) 21. Taxation (continued)
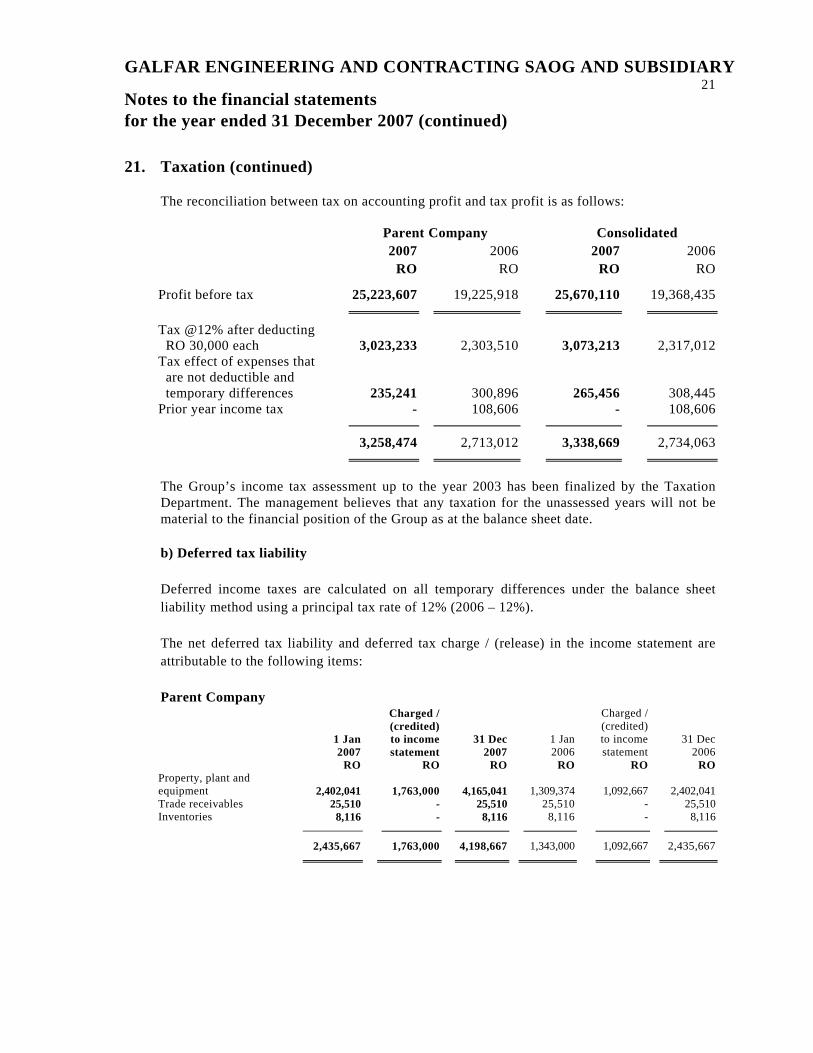
The reconciliation between tax on accounting profit and tax profit is as follows: Parent Company Consolidated 2007 2006 2007 2006 RO RO RO RO
Profit before tax 25,223,607 19,225,918 25,670,110 19,368,435 Tax @12% after deducting RO 30,000 each
3,023,233 2,303,510 3,073,213 2,317,012
Tax effect of expenses that are not deductible and temporary differences
235,241 300,896 265,456 308,445 Prior year income tax - 108,606 - 108,606
3,258,474 2,713,012 3,338,669 2,734,063
The Group’s income tax assessment up to the year 2003 has been finalized by the Taxation Department. The management believes that any taxation for the unassessed years will not be material to the financial position of the Group as at the balance sheet date. b) Deferred tax liability Deferred income taxes are calculated on all temporary differences under the balance sheet liability method using a principal tax rate of 12% (2006 – 12%). The net deferred tax liability and deferred tax charge / (release) in the income statement are attributable to the following items: Parent Company
1 Jan 2007
Charged / (credited) to income statement
31 Dec 2007
1 Jan 2006
Charged / (credited) to income statement
31 Dec 2006
RO RO RO RO RO ROProperty, plant and equipment
2,402,041 1,763,000 4,165,041
1,309,374
1,092,667
2,402,041
Trade receivables 25,510 - 25,510 25,510 - 25,510Inventories 8,116 - 8,116 8,116 - 8,116 2,435,667 1,763,000 4,198,667 1,343,000 1,092,667 2,435,667
GALFAR ENGINEERING AND CONTRACTING SAOG AND SUBSIDIARY 22
Notes to the financial statements for the year ended 31 December 2007 (continued) 21. Taxation (continued)
b) Deferred tax liability (continued)
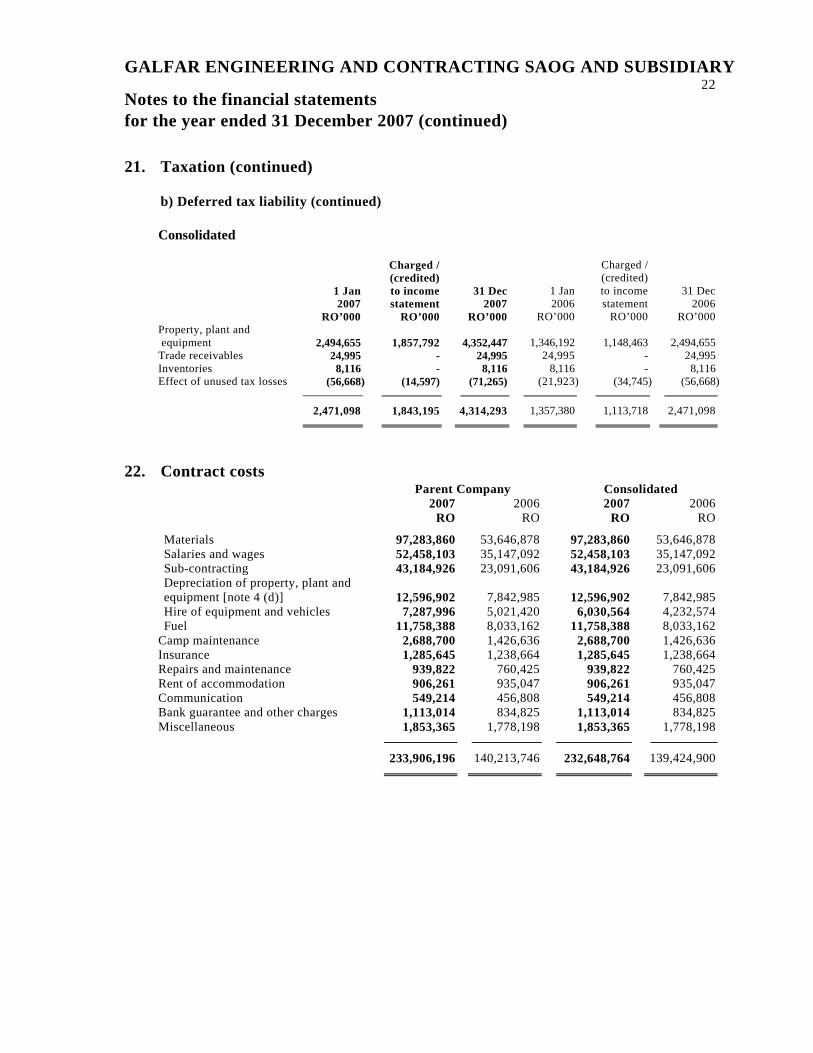
Consolidated
1 Jan 2007
Charged / (credited) to income statement
31 Dec 2007
1 Jan 2006
Charged / (credited) to income statement
31 Dec 2006
RO’000 RO’000 RO’000 RO’000 RO’000 RO’000 Property, plant and equipment
2,494,655 1,857,792 4,352,447
1,346,192
1,148,463
2,494,655
Trade receivables 24,995 - 24,995 24,995 - 24,995 Inventories 8,116 - 8,116 8,116 - 8,116Effect of unused tax losses (56,668) (14,597) (71,265) (21,923) (34,745) (56,668) 2,471,098 1,843,195 4,314,293 1,357,380 1,113,718 2,471,098
22. Contract costs
Parent Company Consolidated 2007 2006 2007 2006 RO RO RO RO
Materials 97,283,860 53,646,878 97,283,860 53,646,878 Salaries and wages 52,458,103 35,147,092 52,458,103 35,147,092 Sub-contracting 43,184,926 23,091,606 43,184,926 23,091,606 Depreciation of property, plant and equipment [note 4 (d)]
12,596,902 7,842,985
12,596,902 7,842,985
Hire of equipment and vehicles 7,287,996 5,021,420 6,030,564 4,232,574 Fuel 11,758,388 8,033,162 11,758,388 8,033,162
Camp maintenance 2,688,700 1,426,636 2,688,700 1,426,636 Insurance 1,285,645 1,238,664 1,285,645 1,238,664 Repairs and maintenance 939,822 760,425 939,822 760,425 Rent of accommodation 906,261 935,047 906,261 935,047 Communication 549,214 456,808 549,214 456,808 Bank guarantee and other charges 1,113,014 834,825 1,113,014 834,825 Miscellaneous 1,853,365 1,778,198 1,853,365 1,778,198
233,906,196 140,213,746 232,648,764 139,424,900
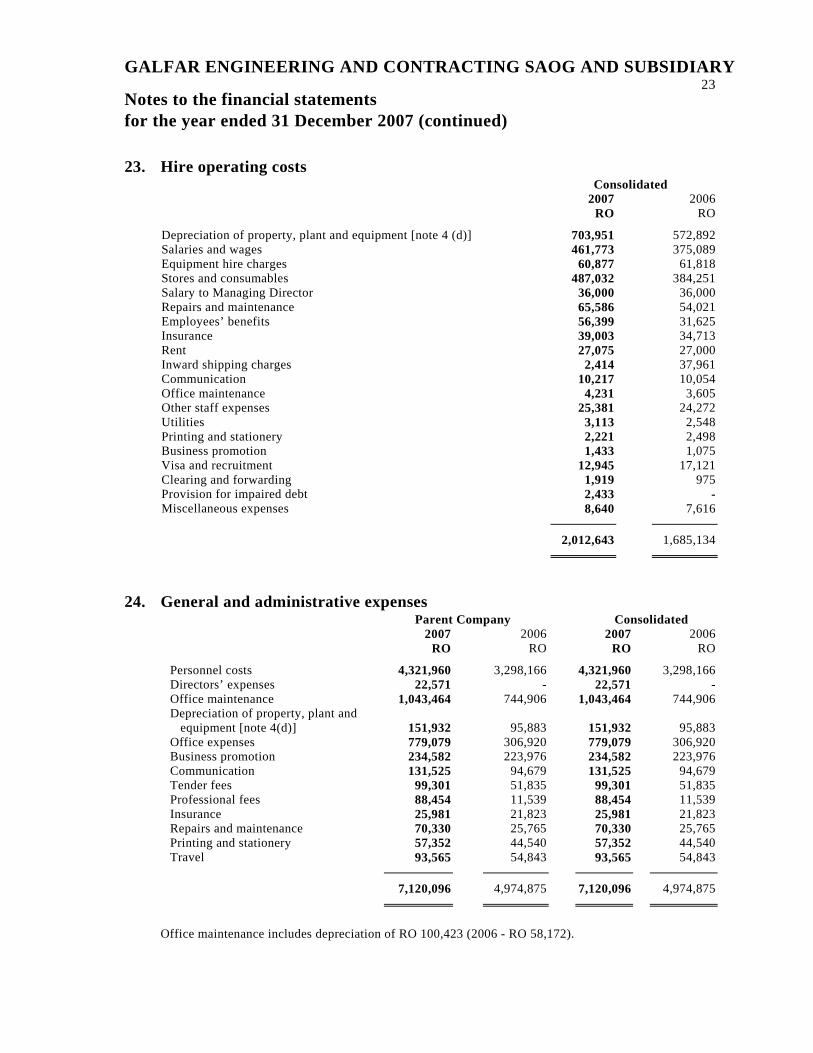
GALFAR ENGINEERING AND CONTRACTING SAOG AND SUBSIDIARY 23
Notes to the financial statements for the year ended 31 December 2007 (continued) 23. Hire operating costs
Consolidated 2007 2006 RO RO Depreciation of property, plant and equipment [note 4 (d)] 703,951 572,892 Salaries and wages 461,773 375,089 Equipment hire charges 60,877 61,818 Stores and consumables 487,032 384,251 Salary to Managing Director 36,000 36,000 Repairs and maintenance 65,586 54,021 Employees’ benefits 56,399 31,625 Insurance 39,003 34,713 Rent 27,075 27,000 Inward shipping charges 2,414 37,961 Communication 10,217 10,054 Office maintenance 4,231 3,605Other staff expenses 25,381 24,272 Utilities 3,113 2,548 Printing and stationery 2,221 2,498Business promotion 1,433 1,075 Visa and recruitment 12,945 17,121 Clearing and forwarding 1,919 975Provision for impaired debt 2,433 - Miscellaneous expenses 8,640 7,616
2,012,643 1,685,134
24. General and administrative expenses
Parent Company Consolidated 2007 2006 2007 2006 RO RO RO RO Personnel costs 4,321,960 3,298,166 4,321,960 3,298,166 Directors’ expenses 22,571 - 22,571 - Office maintenance 1,043,464 744,906 1,043,464 744,906 Depreciation of property, plant and equipment [note 4(d)]
151,932 95,883
151,932 95,883
Office expenses 779,079 306,920 779,079 306,920 Business promotion 234,582 223,976 234,582 223,976 Communication 131,525 94,679 131,525 94,679 Tender fees 99,301 51,835 99,301 51,835 Professional fees 88,454 11,539 88,454 11,539 Insurance 25,981 21,823 25,981 21,823 Repairs and maintenance 70,330 25,765 70,330 25,765 Printing and stationery 57,352 44,540 57,352 44,540 Travel 93,565 54,843 93,565 54,843
7,120,096 4,974,875 7,120,096 4,974,875
Office maintenance includes depreciation of RO 100,423 (2006 - RO 58,172).
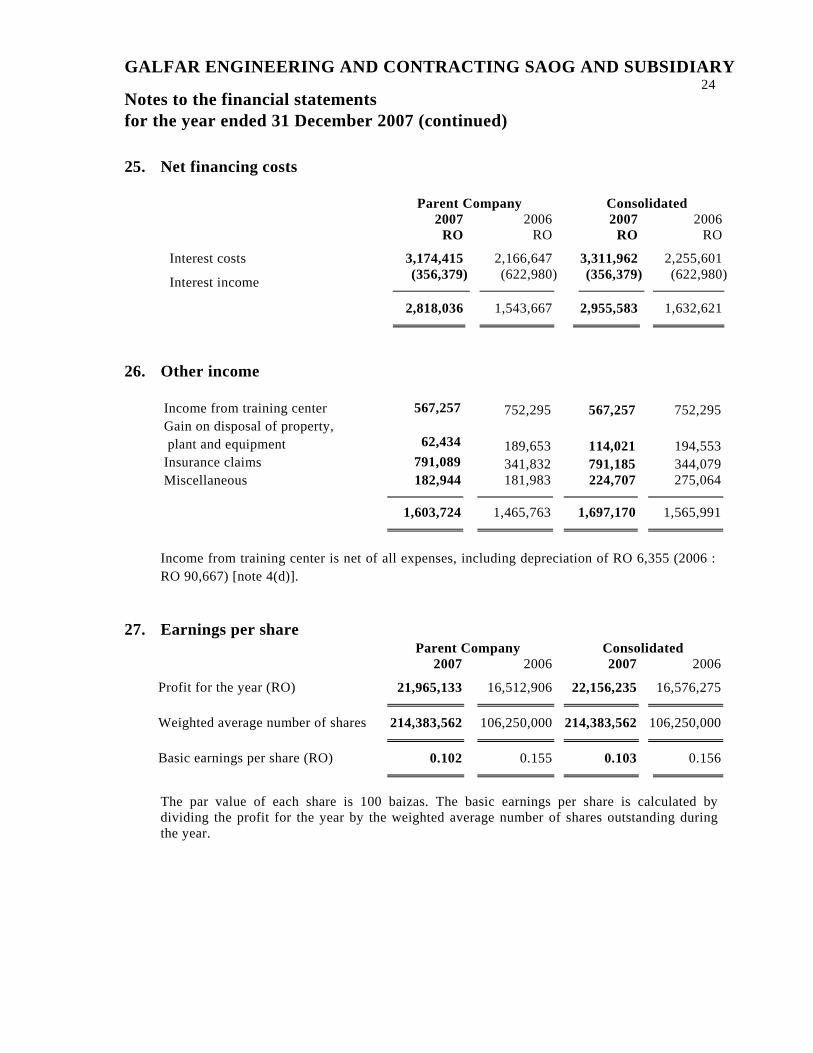
GALFAR ENGINEERING AND CONTRACTING SAOG AND SUBSIDIARY 24
Notes to the financial statements for the year ended 31 December 2007 (continued) 25. Net financing costs
Parent Company Consolidated 2007 2006 2007 2006 RO RO RO RO
Interest costs 3,174,415 2,166,647 3,311,962 2,255,601
Interest income (356,379) (622,980) (356,379) (622,980) 2,818,036 1,543,667 2,955,583 1,632,621
26. Other income
Income from training center 567,257 752,295 567,257 752,295 Gain on disposal of property, plant and equipment
62,434 189,653 114,021 194,553
Insurance claims 791,089 341,832 791,185 344,079 Miscellaneous 182,944 181,983 224,707 275,064
1,603,724 1,465,763 1,697,170 1,565,991
Income from training center is net of all expenses, including depreciation of RO 6,355 (2006 : RO 90,667) [note 4(d)].
27. Earnings per share
Parent Company Consolidated 2007 2006 2007 2006 Profit for the year (RO) 21,965,133 16,512,906 22,156,235 16,576,275 Weighted average number of shares 214,383,562 106,250,000 214,383,562 106,250,000 Basic earnings per share (RO) 0.102 0.155 0.103 0.156
The par value of each share is 100 baizas. The basic earnings per share is calculated by dividing the profit for the year by the weighted average number of shares outstanding during the year.
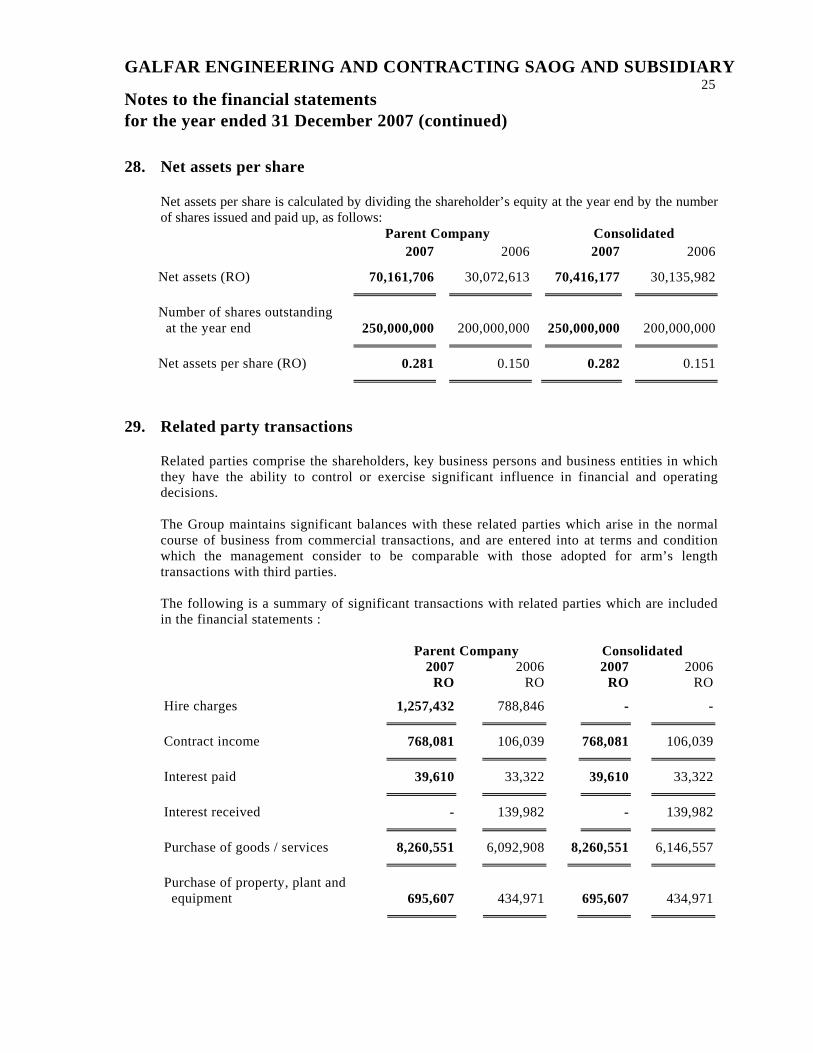
GALFAR ENGINEERING AND CONTRACTING SAOG AND SUBSIDIARY 25
Notes to the financial statements for the year ended 31 December 2007 (continued) 28. Net assets per share
Net assets per share is calculated by dividing the shareholder’s equity at the year end by the number of shares issued and paid up, as follows: Parent Company Consolidated 2007 2006 2007 2006 Net assets (RO) 70,161,706 30,072,613 70,416,177 30,135,982
Number of shares outstanding at the year end
250,000,000
200,000,000
250,000,000
200,000,000
Net assets per share (RO) 0.281 0.150 0.282 0.151
29. Related party transactions Related parties comprise the shareholders, key business persons and business entities in which they have the ability to control or exercise significant influence in financial and operating decisions. The Group maintains significant balances with these related parties which arise in the normal course of business from commercial transactions, and are entered into at terms and condition which the management consider to be comparable with those adopted for arm’s length transactions with third parties. The following is a summary of significant transactions with related parties which are included in the financial statements :
Parent Company Consolidated 2007 2006 2007 2006
RO RO RO RO Hire charges 1,257,432 788,846 - - Contract income 768,081 106,039 768,081 106,039
Interest paid 39,610 33,322 39,610 33,322
Interest received - 139,982 - 139,982
Purchase of goods / services 8,260,551 6,092,908 8,260,551 6,146,557
Purchase of property, plant and equipment
695,607
434,971
695,607
434,971
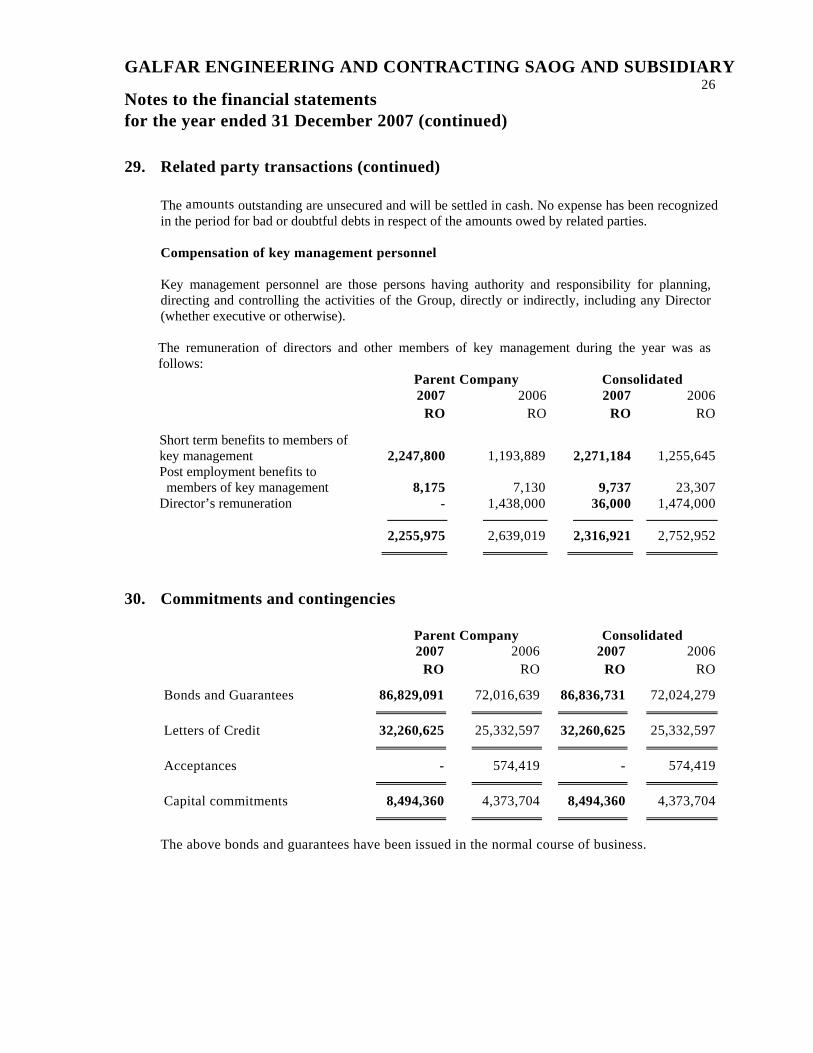
GALFAR ENGINEERING AND CONTRACTING SAOG AND SUBSIDIARY 26
Notes to the financial statements for the year ended 31 December 2007 (continued) 29. Related party transactions (continued)
The amounts outstanding are unsecured and will be settled in cash. No expense has been recognized in the period for bad or doubtful debts in respect of the amounts owed by related parties. Compensation of key management personnel Key management personnel are those persons having authority and responsibility for planning, directing and controlling the activities of the Group, directly or indirectly, including any Director (whether executive or otherwise). The remuneration of directors and other members of key management during the year was as follows:
Parent Company Consolidated 2007 2006 2007 2006 RO RO RO RO Short term benefits to members of key management 2,247,800
1,193,889
2,271,184
1,255,645
Post employment benefits to members of key management 8,175
7,130 9,737
23,307
Director’s remuneration - 1,438,000 36,000 1,474,000
2,255,975 2,639,019 2,316,921 2,752,952
30. Commitments and contingencies
Parent Company Consolidated 2007 2006 2007 2006
RO RO RO RO
Bonds and Guarantees 86,829,091 72,016,639 86,836,731 72,024,279
Letters of Credit 32,260,625 25,332,597 32,260,625 25,332,597
Acceptances - 574,419 - 574,419
Capital commitments 8,494,360 4,373,704 8,494,360 4,373,704
The above bonds and guarantees have been issued in the normal course of business.
GALFAR ENGINEERING AND CONTRACTING SAOG AND SUBSIDIARY 27
Notes to the financial statements for the year ended 31 December 2007 (continued) 31. Business and geographical segments
The Group operates only in one geographical segment in the Sultanate of Oman. Segmental information is presented in respect of the Group’s business segments. Business segment is based on the Group’s management and internal reporting structure. Segment results, assets and liabilities include items directly attributable to a segment as well as those that can be allocated on a reasonable basis. Business segment For management purposes, the Group is organized into two operating divisions. These Divisions are the basis on which the Group reports its segmental information. The principal activities of the Divisions are as follows: Construction The principal activities are civil and mechanical construction, public health engineering, road construction, electrical, plumbing and maintenance contracts. Hiring The main activities are hiring out of cranes, equipment and other vehicles.
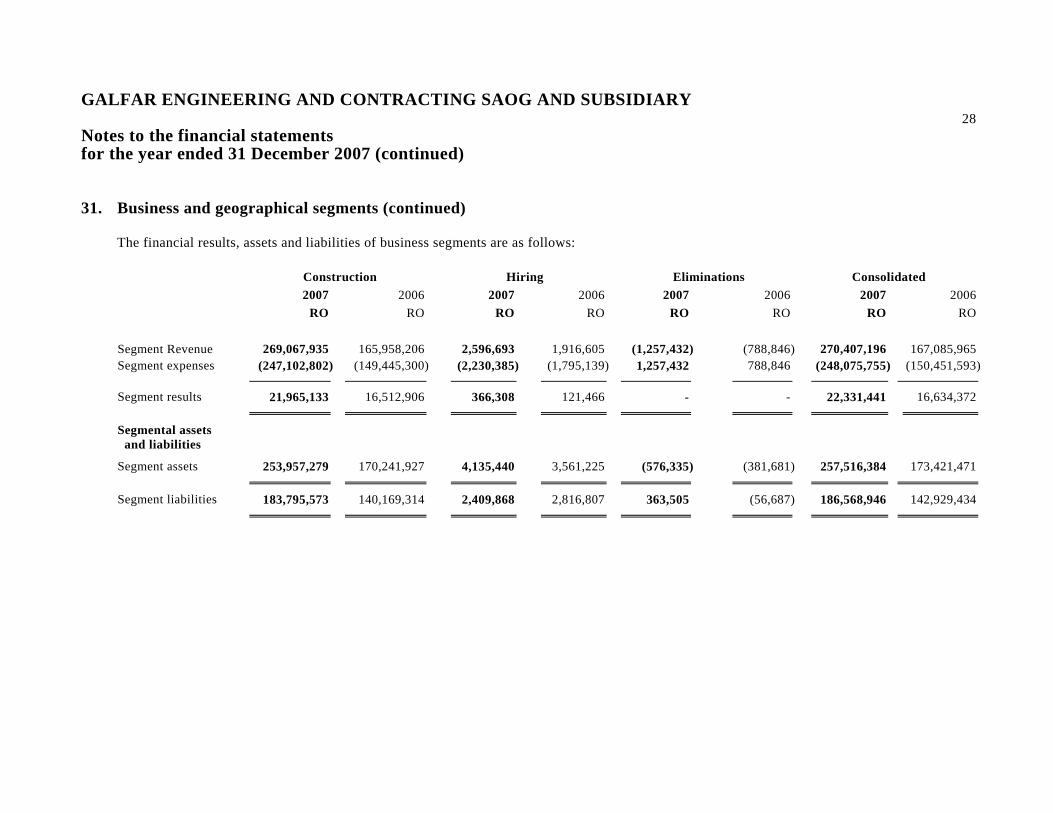
GALFAR ENGINEERING AND CONTRACTING SAOG AND SUBSIDIARY
28 Notes to the financial statements for the year ended 31 December 2007 (continued) 31. Business and geographical segments (continued)
The financial results, assets and liabilities of business segments are as follows: Construction Hiring Eliminations Consolidated 2007 2006 2007 2006 2007 2006 2007 2006 RO RO RO RO RO RO RO RO Segment Revenue 269,067,935 165,958,206 2,596,693 1,916,605 (1,257,432) (788,846) 270,407,196 167,085,965 Segment expenses (247,102,802) (149,445,300) (2,230,385) (1,795,139) 1,257,432 788,846 (248,075,755) (150,451,593) Segment results 21,965,133 16,512,906 366,308 121,466 - - 22,331,441 16,634,372 Segmental assets and liabilities Segment assets 253,957,279 170,241,927 4,135,440 3,561,225 (576,335) (381,681) 257,516,384 173,421,471 Segment liabilities 183,795,573 140,169,314 2,409,868 2,816,807 363,505 (56,687) 186,568,946 142,929,434
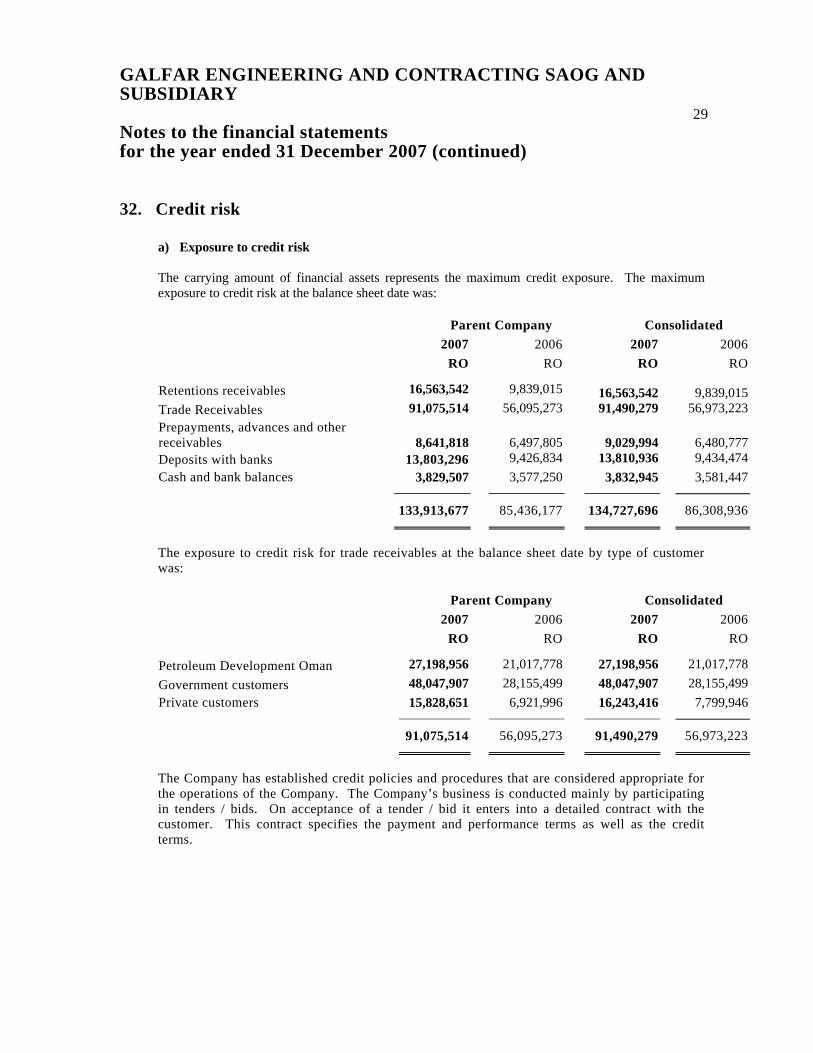
GALFAR ENGINEERING AND CONTRACTING SAOG AND SUBSIDIARY
29 Notes to the financial statements for the year ended 31 December 2007 (continued) 32. Credit risk
a) Exposure to credit risk The carrying amount of financial assets represents the maximum credit exposure. The maximum exposure to credit risk at the balance sheet date was: Parent Company Consolidated 2007 2006 2007 2006 RO RO RO RO Retentions receivables 16,563,542 9,839,015 16,563,542 9,839,015 Trade Receivables 91,075,514 56,095,273 91,490,279 56,973,223 Prepayments, advances and other receivables
8,641,818
6,497,805
9,029,994
6,480,777
Deposits with banks 13,803,296 9,426,834 13,810,936 9,434,474 Cash and bank balances 3,829,507 3,577,250 3,832,945 3,581,447 133,913,677 85,436,177 134,727,696 86,308,936
The exposure to credit risk for trade receivables at the balance sheet date by type of customer was: Parent Company Consolidated 2007 2006 2007 2006 RO RO RO RO Petroleum Development Oman 27,198,956 21,017,778 27,198,956 21,017,778 Government customers 48,047,907 28,155,499 48,047,907 28,155,499 Private customers 15,828,651 6,921,996 16,243,416 7,799,946 91,075,514 56,095,273 91,490,279 56,973,223
The Company has established credit policies and procedures that are considered appropriate for the operations of the Company. The Company’s business is conducted mainly by participating in tenders / bids. On acceptance of a tender / bid it enters into a detailed contract with the customer. This contract specifies the payment and performance terms as well as the credit terms.
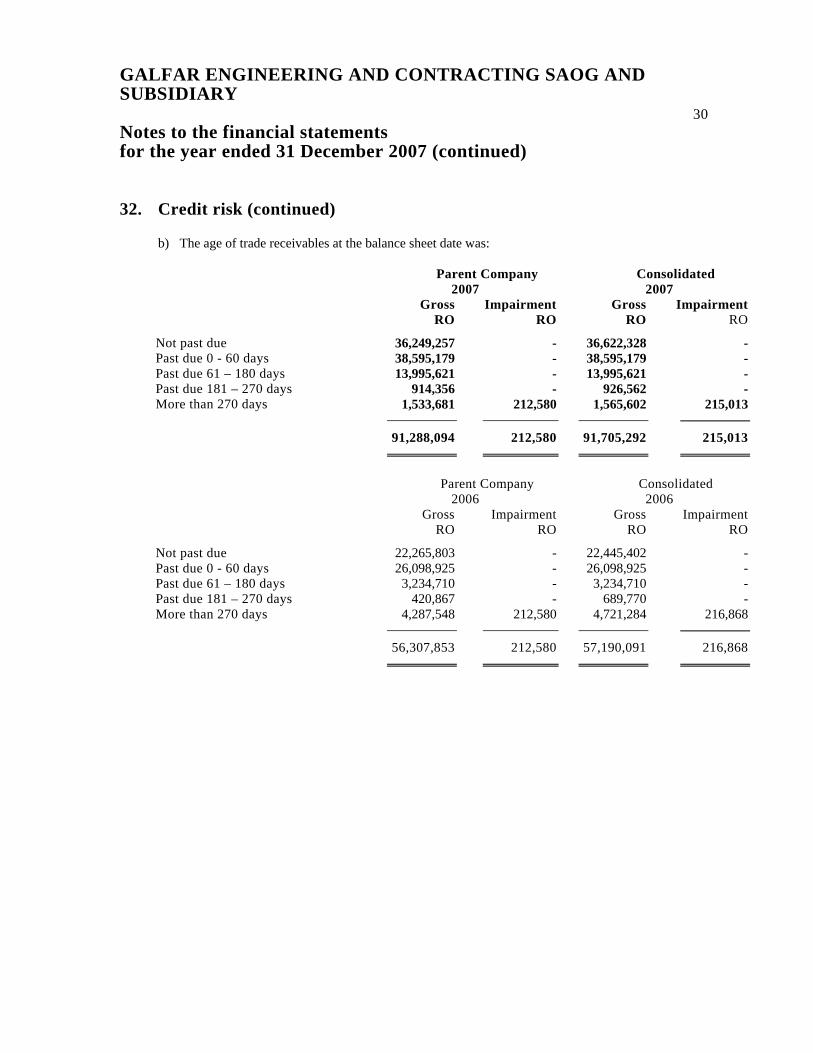
GALFAR ENGINEERING AND CONTRACTING SAOG AND SUBSIDIARY
30 Notes to the financial statements for the year ended 31 December 2007 (continued) 32. Credit risk (continued)
b) The age of trade receivables at the balance sheet date was:
Parent Company
2007 Consolidated
2007 Gross Impairment Gross Impairment RO RO RO RO Not past due 36,249,257 - 36,622,328 - Past due 0 - 60 days 38,595,179 - 38,595,179 - Past due 61 – 180 days 13,995,621 - 13,995,621 - Past due 181 – 270 days 914,356 - 926,562 - More than 270 days 1,533,681 212,580 1,565,602 215,013 91,288,094 212,580 91,705,292 215,013
Parent Company
2006 Consolidated
2006 Gross Impairment Gross Impairment RO RO RO RO Not past due 22,265,803 - 22,445,402 - Past due 0 - 60 days 26,098,925 - 26,098,925 - Past due 61 – 180 days 3,234,710 - 3,234,710 - Past due 181 – 270 days 420,867 - 689,770 - More than 270 days 4,287,548 212,580 4,721,284 216,868 56,307,853 212,580 57,190,091 216,868
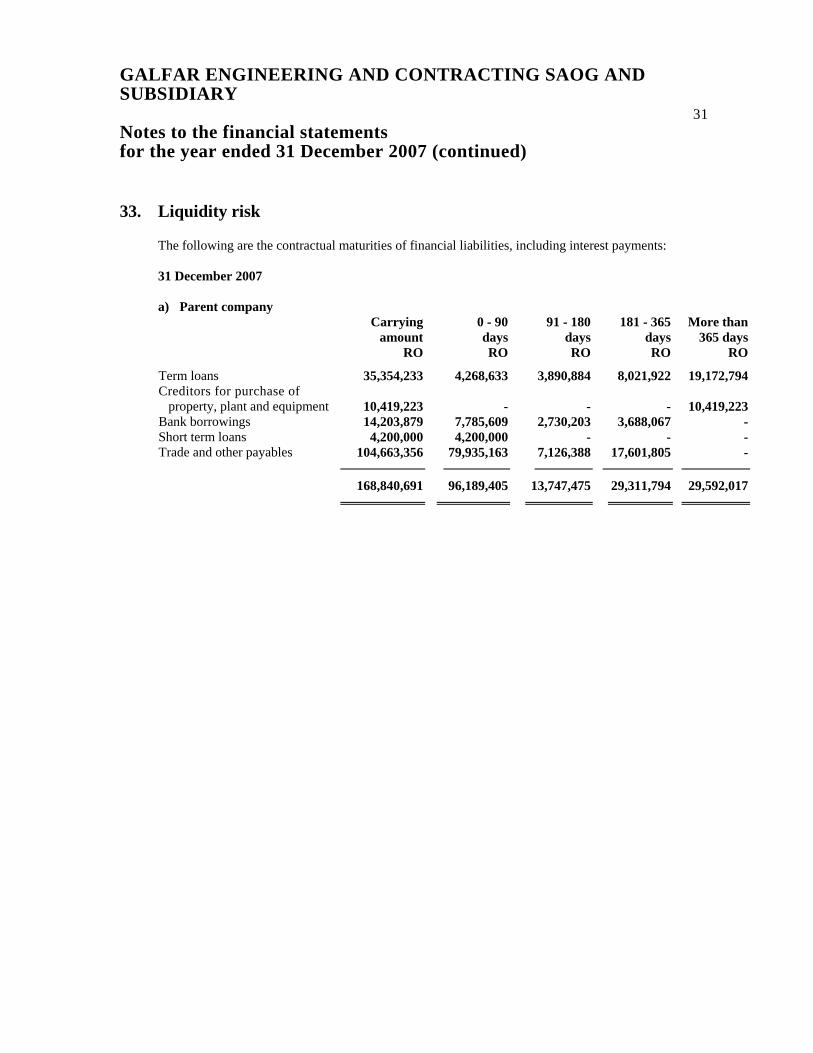
GALFAR ENGINEERING AND CONTRACTING SAOG AND SUBSIDIARY
31 Notes to the financial statements for the year ended 31 December 2007 (continued) 33. Liquidity risk
The following are the contractual maturities of financial liabilities, including interest payments: 31 December 2007 a) Parent company Carrying
amount 0 - 90 days
91 - 180 days
181 - 365 days
More than 365 days
RO RO RO RO RO Term loans 35,354,233 4,268,633 3,890,884 8,021,922 19,172,794 Creditors for purchase of property, plant and equipment 10,419,223
-
-
-
10,419,223
Bank borrowings 14,203,879 7,785,609 2,730,203 3,688,067 - Short term loans 4,200,000 4,200,000 - - - Trade and other payables 104,663,356 79,935,163 7,126,388 17,601,805 - 168,840,691 96,189,405 13,747,475 29,311,794 29,592,017
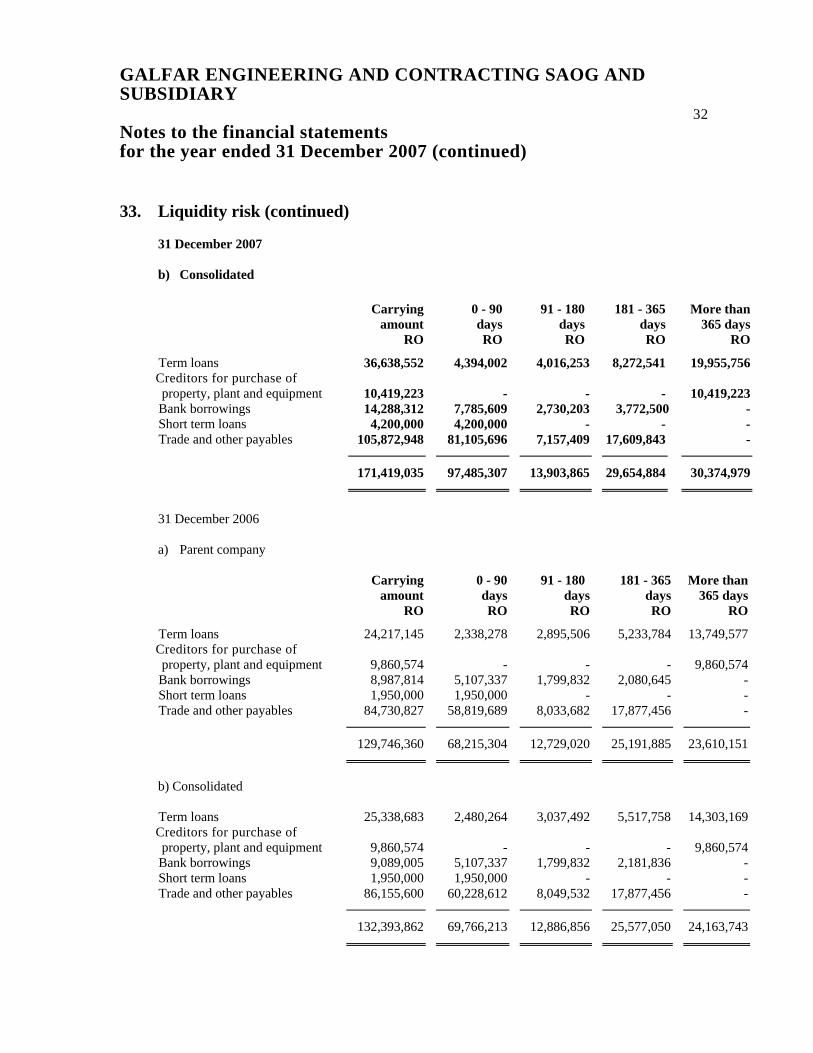
GALFAR ENGINEERING AND CONTRACTING SAOG AND SUBSIDIARY
32 Notes to the financial statements for the year ended 31 December 2007 (continued) 33. Liquidity risk (continued)
31 December 2007 b) Consolidated Carrying
amount 0 - 90 days
91 - 180 days
181 - 365 days
More than 365 days
RO RO RO RO RO Term loans 36,638,552 4,394,002 4,016,253 8,272,541 19,955,756 Creditors for purchase of property, plant and equipment 10,419,223 -
-
- 10,419,223
Bank borrowings 14,288,312 7,785,609 2,730,203 3,772,500 - Short term loans 4,200,000 4,200,000 - - - Trade and other payables 105,872,948 81,105,696 7,157,409 17,609,843 - 171,419,035 97,485,307 13,903,865 29,654,884 30,374,979
31 December 2006 a) Parent company Carrying
amount 0 - 90 days
91 - 180 days
181 - 365 days
More than 365 days
RO RO RO RO RO Term loans 24,217,145 2,338,278 2,895,506 5,233,784 13,749,577 Creditors for purchase of property, plant and equipment
9,860,574
-
-
-
9,860,574
Bank borrowings 8,987,814 5,107,337 1,799,832 2,080,645 - Short term loans 1,950,000 1,950,000 - - - Trade and other payables 84,730,827 58,819,689 8,033,682 17,877,456 - 129,746,360 68,215,304 12,729,020 25,191,885 23,610,151
b) Consolidated Term loans 25,338,683 2,480,264 3,037,492 5,517,758 14,303,169 Creditors for purchase of property, plant and equipment
9,860,574
-
-
-
9,860,574
Bank borrowings 9,089,005 5,107,337 1,799,832 2,181,836 - Short term loans 1,950,000 1,950,000 - - - Trade and other payables 86,155,600 60,228,612 8,049,532 17,877,456 - 132,393,862 69,766,213 12,886,856 25,577,050 24,163,743
GALFAR ENGINEERING AND CONTRACTING SAOG AND SUBSIDIARY
33 Notes to the financial statements for the year ended 31 December 2007 (continued) 34. Interest rate risk
The Group’s exposure to interest rate risk relates to its bank deposits, borrowings, and term loans. Term loans of RO 29,231,938 (2006 - RO 14,522,092) are recognized at fixed interest rates and expose the Group to the fair value interest rate risk. The remaining term loans of RO 6,122,295 (2006 - RO 9,695,053) are recognized at floating rates thus exposing the Group to cash flow interest rate risk.
35. Approval of financial statements These financial statements were approved by the Board of Directors and authorized for issue on 28 February 2008.
36. Comparative amounts
Certain amounts for the prior year were reclassified to conform to current year