Embed Size (px)
Citation preview

Daniel Mont
Leonard Cheshire Disabi l i ty and Inclusive Development Centre
UCL
January 17, 2013
DISABILITY AND POVERTY
IN DEVELOPING
COUNTRIES

WHAT ARE DISABILITY AND POVERTY?
DISABILITY
?
POVERTY
?

DISABILITY
POVERTY
The ability to be a full member of society

HOW DO WE MEASURE THESE?
DISABILITY
?
POVERTY
?

Country Census Rate of
Disability
United States 19.4
Canada 18.5
Brazil 14.5
Ethiopia 3.8
Chile 2.2
India 2.1
OFTEN DISABILITY MEASUREMENT IS POOR
AND/OR NOT STANDARDIZED
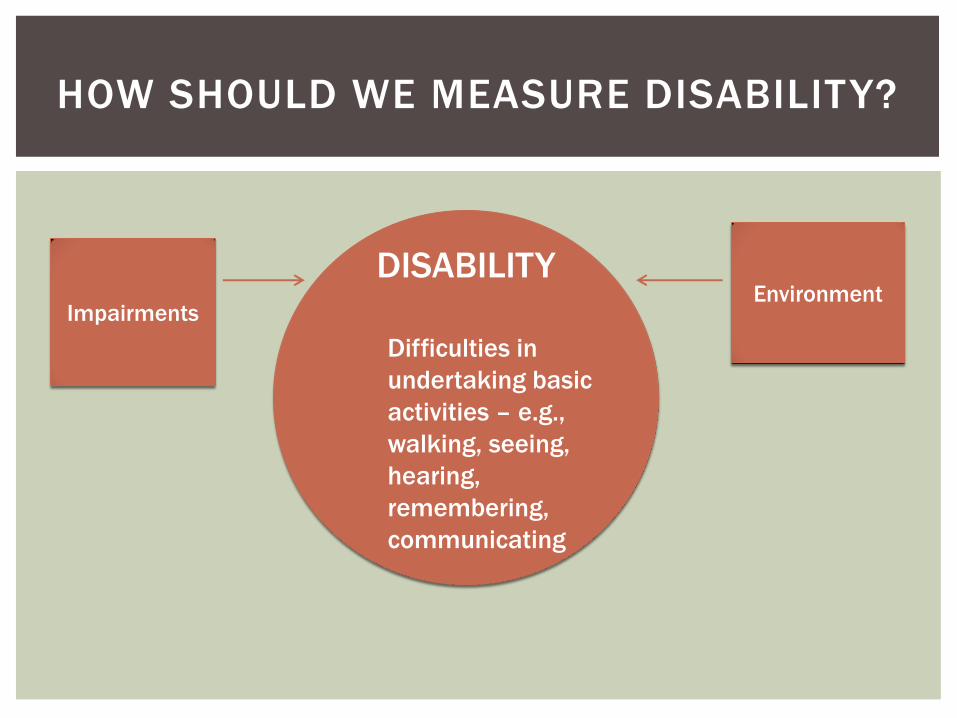
HOW SHOULD WE MEASURE DISABILITY?
DISABILITY
Difficulties in
undertaking basic
activities – e.g.,
walking, seeing,
hearing,
remembering,
communicating
Impairments Environment
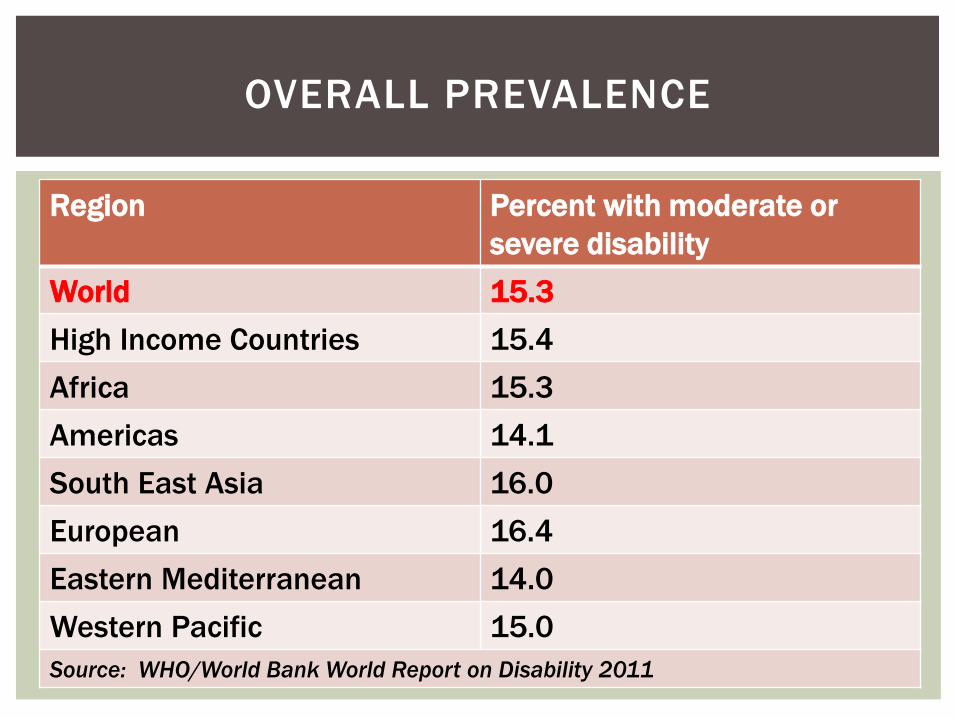
Region Percent with moderate or
severe disability
World 15.3
High Income Countries 15.4
Africa 15.3
Americas 14.1
South East Asia 16.0
European 16.4
Eastern Mediterranean 14.0
Western Pacific 15.0
Source: WHO/World Bank World Report on Disability 2011
OVERALL PREVALENCE
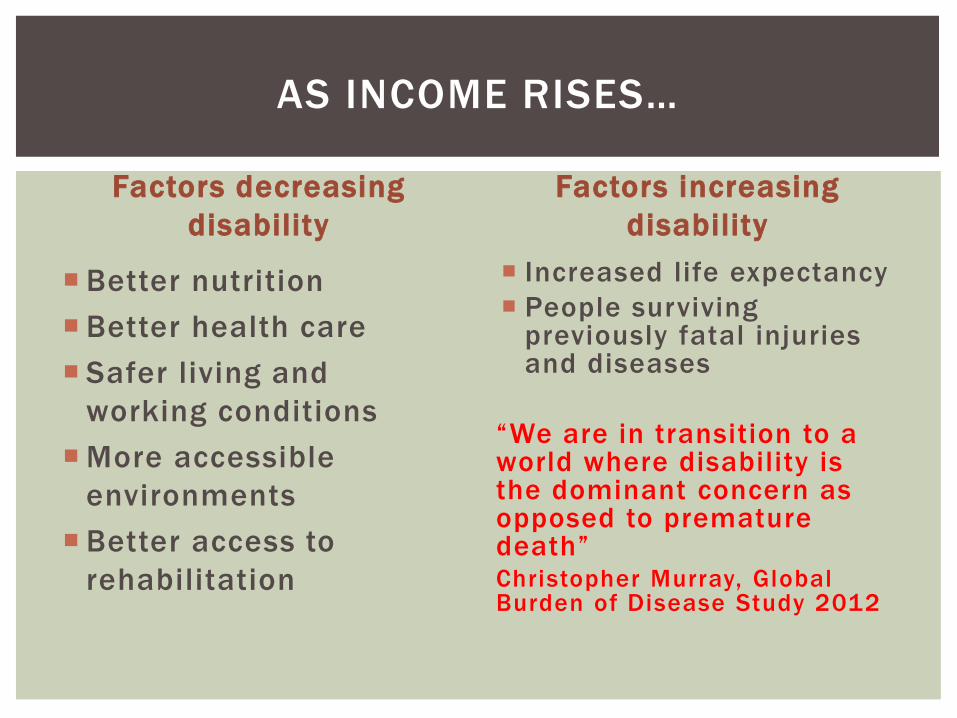
Factors decreasing
disability
Better nutrition
Better health care
Safer living and
working conditions
More accessible
environments
Better access to
rehabilitation
Factors increasing
disability
Increased life expectancy
People surviving previously fatal injuries and diseases
“We are in transition to a world where disability is the dominant concern as opposed to premature death” Christopher Murray, Global Burden of Disease Study 2012
AS INCOME RISES…

Consumption expenditures associated with minimum standard of living
Income a poor measure in developing countries because of home production, bartering, and lack of records
Asset indices
Easier to measure, harder to hide
Multidimensional measures
Degree of deprivation in key areas, such as education, health, living arrangements, sanitation, etc.
MEASURING POVERTY

Study of 15 developing countries using the
World Health Survey (Mitra, Posarac, and Vick 2011)
High quality data on disability based on functionality
Data on poverty indicators
Often sources do not have both types of data.
EMPIRICAL RELATION BETWEEN DISABILITY
AND POVERTY

Asset Indicators Disability higher in the bottom quintile in 11 countries
(statistical significance in 5)
Consumption (excluding health expenditures)
Poverty significantly higher among disabled people in 4 countries
Multi-Dimensional Indicators Average deprivations higher among disabled people in 11 of 14
countries
Number of deprivations – Employment, Education, Per Capita Expenditures, Health Ratio, Electricity, Water, Toilet, Floor, Cooking, Assets
DISABILITY AND POVERTY

Education Less likely to start or
complete education
Bigger correlation than socio-economic status or gender (Filmer 2008)
51 Country study – ratio of completed primary school is .83 for males, .79 for females. (WHO/World Bank 2011)
Employment Less likely to be
employed
More likely to be self-employed
Employment ratio in low income countries is .82 for males, .64 for females (WHO/World Bank 2011)
DISABILITY AND EXCLUSION

Extra costs of disability
Medical expenditures, transportation, housing, assistive devices,
rehabilitation services, etc.
Date of onset
Does disability occur in post-earning years, or at least late enough for
assets or skills to have been accumulated?
Family formation
Are disabled people more likely to be living with extended family?
Important because poverty is usually a household measure.
Link between income and self -reporting of
difficulties
Higher income more likely to report more mild functional difficulties
(Scott and Mete 2008)
PROBLEMS WITH SIMPLE CORRELATION OF
DISABILITY AND POVERTY MEASURES

2006 VHLSS has data on functional difficulties
Six domains: Vision, Hearing, Mobility, Cognition, Communication,
Self-Care
Scaled responses: No Difficulty, A Little Difficulty, A Lot of Difficulty,
Unable to Do
High quality data on consumption
Mont and Cuong, WBER 2011
VIETNAM CASE STUDY

15.7% had difficulty in at least one functional
domain
For technical reasons having to do with vision
questions, the definition of disability was changed to
exclude people with mild vision problems but no
other difficulties
Using low threshold – 7.6% prevalence
Using high threshold – 3.6% prevalence
PREVALENCE

Quintile Low Threshold High Threshold
Poorest 8.13 4.19
Near Poorest 7.87 3.75
Middle 7.53 3.71
Near Richest 7.01 3.10
Richest 7.28 3.30
DISABILITY PREVALENCE BY
EXPENDITURE QUINTILE

Zaidi/Burchardt Methodology (2005)
Create Asset Index
Regress asset index on income, disability, other explanatory
variables
Difference in assets because of dif ference in costs of
disability
ACCOUNTING FOR EXTRA COSTS OF
DISABILITY

Poverty line should be adjusted 11.5% higher
These are estimates of the actual extra expenditures.
Expenditures could rise as more services and devices become
available. Though presumably there will be extra benefits to
those expenditures.
EXTRA COSTS OF DISABILITY

Characteristic Non-Disabled
People
Disabled People Adjusted Poverty
Line - Disabled
People
All 15.09 17.16 22.31
Male 14.60 17.46 22.55
Female 15.57 16.94 22.13
Age 5-18 19.29 31.08 36.24
Age 19-40 15.14 24.72 31.42
Age 41-62 9.93 11.90 15.28
Older than 62 14.45 17.01 22.82
Urban 3.61 5.53 6.63
Rural 19.32 21.44 28.09
POVERTY RATES BY DISABILITY STATUS

Age of Onset
Low vs. High Threshold
Explanatory Variables – rural/urban, family structure, region of residence, household head’s age and education
District Level fixed effects
Controls for things like epidemics and natural disasters that can impact both poverty and disability
REGRESSION ANALYSIS

Coefficient
Low Threshold
Onset before age 18 -.13*
Onset after age 18 -.04*
High Threshold
Onset before age 18 -.13*
Onset after age 18 -.01 * 99% confidence level
COEFFICIENTS ON DISABILITY VARIABLE IN
CONSUMPTION EXPENDITURE REGRESSION

Disabled children 41% to 47% less likely to attend
school
Disabled people work less – especially if disabled
prior to age 18
Disabled adults in a household significantly reduce
non-disabled children’s school attendance (Cuong and
Mont, for thcoming)
EDUCATION AND EMPLOYMENT
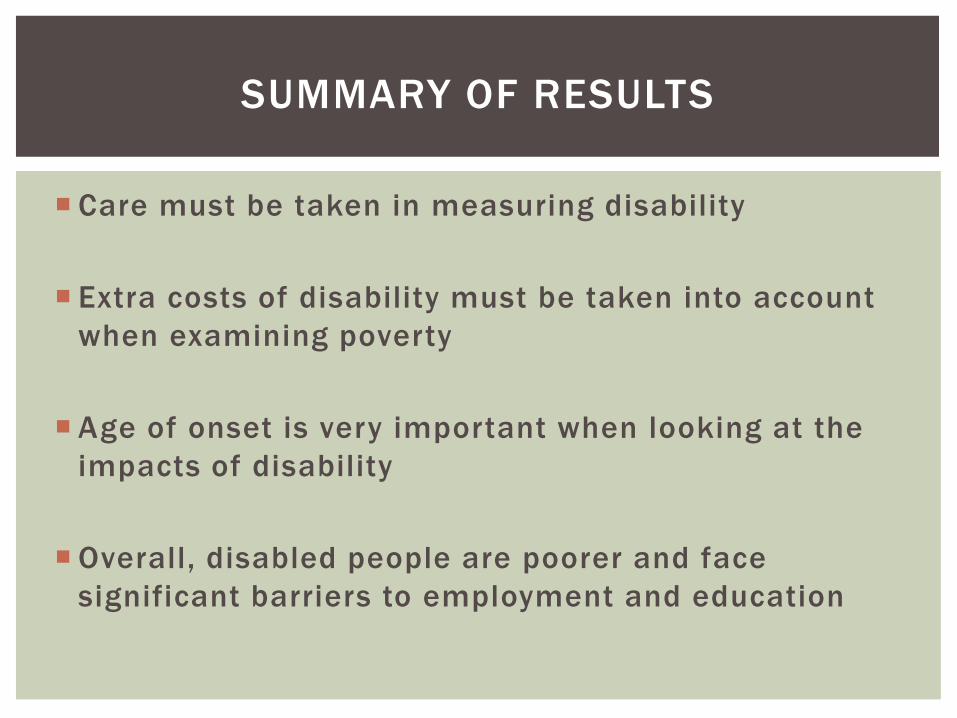
Care must be taken in measuring disability
Extra costs of disability must be taken into account
when examining poverty
Age of onset is very important when looking at the
impacts of disability
Overall, disabled people are poorer and face
significant barriers to employment and education
SUMMARY OF RESULTS


![Disability and Poverty[1]](https://img.pdfslide.net/doc/110x75/53fcc47fdab5ca94038b48fc/disability-and-poverty1.jpg)