Embed Size (px)
Citation preview
About this series
Abstract
This study aims to contribute to the empirical research on social and economic conditions of people with disabilities in developing countries. Using comparable data and methods across countries, this study presents a snapshot of economic and poverty situation of working-age persons with disabilities and their households in 15 developing countries. The study uses data from the World Health Survey conducted by the World Health Organization. The countries for this study are: Burkina Faso, Ghana, Kenya, Malawi, Mauritius, Zambia, and Zimbabwe in Africa; Bangladesh, Lao People’s Democratic Republic (Lao PDR), Pakistan, and the Philippines in Asia; and Brazil, Dominican Republic, Mexico, and Paraguay in Latin America and the Caribbean. The selection of the countries was driven by the data quality
HUMAN DEVELOPMENT NETWORK
About this series...
Social Protection Discussion Papers are published to communicate the results of The World Bank’s work to the development community with the least possible delay. The typescript manuscript of this paper therefore has not been prepared in accordance with the procedures appropriate to formally edited texts. The findings, interpretations, and conclusions expressed herein are those of the author(s), and do not necessarily reflect the views of the International Bank for Reconstruction and Development / The World Bank and its affiliated organizations, or those of the Executive Directors of The World Bank or the governments they represent. The World Bank does not guarantee the accuracy of the data included in this work. For free copies of this paper, please contact the Social Protection Advisory Service, The World Bank, 1818 H Street, N.W., Room G7-703, Washington, D.C. 20433 USA. Telephone: (202) 458-5267, Fax: (202) 614-0471, E-mail: [email protected] or visit the Social Protection website at www.worldbank.org/sp.
Disability and Poverty in Developing Countries: A Snapshot from the World Health Survey
Sophie Mitra, Aleksandra Posarac and Brandon Vick
S P D I S C U S S I O N P A P E R
April 2011
NO. 1109

DISABILITY AND POVERTY IN DEVELOPING COUNTRIES:
A SNAPSHOT FROM THE WORLD HEALTH SURVEY
SOPHIE MITRA, ALEKSANDRA POSARAC, AND BRANDON VICK
APRIL 2011
Key words: Disability, Poverty, World Health Survey, Economic Outcomes, Multidimensional Poverty Measure, Burkina Faso, Ghana, Kenya, Malawi, Mauritius, Zambia, Zimbabwe, Bangladesh, Lao People’s Democratic Republic, Pakistan, the Philippines, Brazil, Dominican Republic, Mexico, Paraguay
JEL classifications: I32, R20
This study is part of the effort of the World Bank Social Protection and Labor Unit, Human Development Network (HDNSP) to investigate socio-economic conditions and poverty among persons with disabilities in developing countries. The preparation of the study was supported by Finland and Norway through the World Bank Trust Fund for Socially and Environmentally Sustainable Development (TFESSD). The findings, interpretations and conclusions expressed in this paper are that of the authors and do not necessarily reflect the views of the Executive Directors of the World Bank or the governments they represent. The World Bank does not guarantee the accuracy of data included in this work.
ACKNOWLEDGEMENTS
The authors are particularly thankful for comments and advice received from the World Bank staff Michael Lokshin, Cem Mete, Rasmus Heltberg, Kinnon Scott, and Daniel Mont. Karen Peffley from the World Bank Disability & Development Team has prepared the Executive Summary, edited the text and checked references. Dung Thi Ngoc Tran has meticulously proofread and formatted the study. Sophie Mitra thanks Tyler Boston for excellent research assistance on literature reviews related to this paper.
ABBREVIATIONS AND ACRONYMS
CDF - Cumulative Distribution Function
DS - Descriptive Statistics
ICF - International Classification of Functioning, Disability and Health
GDP - Gross Domestic Product
Lao PDR - Lao People’s Democratic Republic
LSMS - Living Standard Measurement Survey
MDG - Millennium Development Goal
NA - Not Available
OECD - Organisation for Economic Co-operation and Development
PCE - Per Capita Consumption Expenditure
PPP - Purchasing Power Parity
RA - Regression Analysis
UNICEF - United Nations Children’s Fund
US - United States
WHO - World Health Organization
WHS - World Health Survey

TABLE OF CONTENTS
Executive Summary ......................................................................................................... i
1. Introduction .............................................................................................................. 1
2. Definitions and Background ................................................................................... 3
2.1. Definitions .......................................................................................................... 3 2.2. Health Conditions and Poverty .......................................................................... 5 2.3. Likely Pathways between Disability and Poverty.............................................. 6 2.4. Disability and Poverty: A Review of Recent Empirical Evidence .................. 12
3. Data and Measures ................................................................................................ 17
3.1. The World Health Survey ................................................................................. 17 3.2. Countries in the Survey .................................................................................... 18 3.3. Disability Measures Using the World Health Survey Data .............................. 19 3.4. Advantages and Caveats of Using the WHS Data to Measure Disability ........ 23 3.5. Economic Dimensions of Well-being at the Individual Level ......................... 25 3.6. Economic Dimensions of Well-being at the Household Level ........................ 26 3.7. Multidimensional Poverty Measures ................................................................ 28 3.8. Data Analysis ................................................................................................... 32
4. Results ..................................................................................................................... 33
4.1. Disability Prevalence ........................................................................................ 33 4.2. Individual-Level Economic Well-being ........................................................... 42 4.3. Household-Level Economic Well-being .......................................................... 44 4.4. Multidimensional Poverty Measure ................................................................. 53
5. Conclusions ............................................................................................................ 61
References ...................................................................................................................... 65
Appendix A: Disability Legislative and Policy Background in the Countries
under Study .......................................................................................... 72
Appendix B: Data Analysis Results .......................................................................... 74
Appendix B1: Disability Prevalence (Expanded Measure) among Working-Age Individuals in Developing Countries ..................................................... 75
Appendix B2a: Disability Prevalence (Base Measure) among Working-Age Individuals, by Asset Index Quintile ......................................................................... 76
Appendix B2b: Disability Prevalence (Base Measure) among Working-Age Individuals, by Non-medical PCE Quintile ............................................................... 77
Appendix B2c: Disability (Expanded Measure) Prevalence among Working-Age Individuals, by Quintile ......................................................................... 78
Appendix B3: Disability (Expanded Measure) Prevalence, by Poverty Status ............ 79

Appendix B4: Individual-Level Economic Well-being across Disability Status (Expanded Measure) among Working-Age Individuals ....................... 80
Appendix B5: Household-Level Economic Well-being Measures among Households with/without a Working-Age Person with Disability (Expanded Measure) ................................................................................................ 81
Appendix B6: Poverty Headcount, Gap, and Gap-Squared among Households with/without a Working-Age Person with Disability (Expanded Measure) Based on Non-medical PCE .................................................. 83
Appendix B7: Multidimensional Poverty Analysis with k/d=30% .............................. 85
Appendix B8: Multidimensional Poverty Analysis, with More Restrictive within Dimension Cutoffs................................................................................. 86
Appendix B9: Multidimensional Poverty Analysis (Bourguignon and Chakravarty Method k/d=25%).................................................................................. 87
Appendix C: Country Profiles .................................................................................. 88
Appendix C.1: Profiles for Countries in Africa ............................................................ 90
Appendix C.1.1 Disability Profile: Burkina Faso ........................................................... 90 Appendix C.1.2 Disability Profile: Ghana .................................................................... 100 Appendix C.1.3 Disability Profile: Kenya .................................................................... 110 Appendix C.1.4 Disability Profile: Malawi .................................................................. 120 Appendix C.1.5 Disability Profile: Mauritius ............................................................... 130 Appendix C.1.6 Disability Profile: Zambia .................................................................. 140 Appendix C.1.7 Disability Profile: Zimbabwe ............................................................. 150
Appendix C.2: Profiles for Countries in Asia ............................................................. 158
Appendix C.2.1 Disability Profile: Bangladesh ............................................................ 158 Appendix C.2.2 Disability Profile: Lao PDR ............................................................... 168 Appendix C.2.3 Disability Profile: Pakistan ................................................................. 178 Appendix C.2.4 Disability Profile: Philippines ............................................................ 188
Appendix C.3: Profiles for Countries in Latin America and the Caribbean ............... 198
Appendix C.3.1 Disability Profile: Brazil..................................................................... 198 Appendix C.3.2 Disability Profile: Dominican Republic ............................................. 208 Appendix C.3.3 Disability Profile: Mexico .................................................................. 218 Appendix C.3.4 Disability Profile: Paraguay ............................................................... 228
Appendix D: Summary Comparison of Economic Outcomes across Disability Status .................................................................................................. 238
Charts Chart 1 Likely Pathways from Disability to Poverty ........................................... 9
Chart 2 Likely Pathways from Poverty to Disability ......................................... 11

Figures Figure 4.1 Disability Prevalence (Base Measure) among Working-Age
Individuals, by Asset Index Quintiles .................................................. 36
Figure 4.2 Disability Prevalence (Base Measure) among Working-Age Individuals, by Non-health PCE Quintiles........................................... 37
Figure 4.3 Primary School Completion Rates, by Disability Status ..................... 42
Figure 4.4 Relative Employment Rates of Persons with Disabilities.................... 43
Figure 4.5 Ratios of Mean Asset Index Score: Households with Disabilities to Other Households................................................................................. 45
Figure 4.6 Percentage of Households in the Bottom Asset Index Quintile, by Disability Status ................................................................................... 45
Figure 4.7 Ratios of Mean Non-health PCE: Households with Disabilities to Households without Disabilities .......................................................... 46
Figure 4.8 Percentage of Households in the Bottom PCE Quintile, by Disability Status .................................................................................................... 47
Figure 4.9 Ratio of Health to Total Expenditures, by Household Disability Status (Base Measure) .................................................................................... 52
Figure 4.10 Multidimensional Poverty Headcount Ratio across Disability Status (Base Measure) .................................................................................... 53
Figure 4.11 Multidimensional Poverty Adjusted Headcount Ratio across Disability Status (Base Measure).......................................................................... 55
Tables Table 3.1 Countries under Study: Key Socioeconomic Indicators ....................... 19 Table 3.2 Washington Group’s Recommended Short List of Disability Questions
and Matching WHS Questions............................................................. 21
Table 3.3 Washington Group’s Recommended Long List of Disability Questions and Matching WHS Questions............................................................. 22
Table 3.4 Dimensions of Economic Well-being and Related Indicators ............. 25
Table 3.5 Dimensions and Weights in the Multidimensional Poverty Measure .. 30
Table 4.1 Disability Prevalence (Base Measure) among Working-Age Individuals in 15 Developing Countries ................................................................. 34
Table 4.2 Disability Prevalence (Base Measure) among Working-Age Individuals, by Asset Index and Non-health PCE Quintiles .................................... 38
Table 4.3 Disability Prevalence (Base Measure) among Working-Age Individuals, by Poverty Status ................................................................................. 40
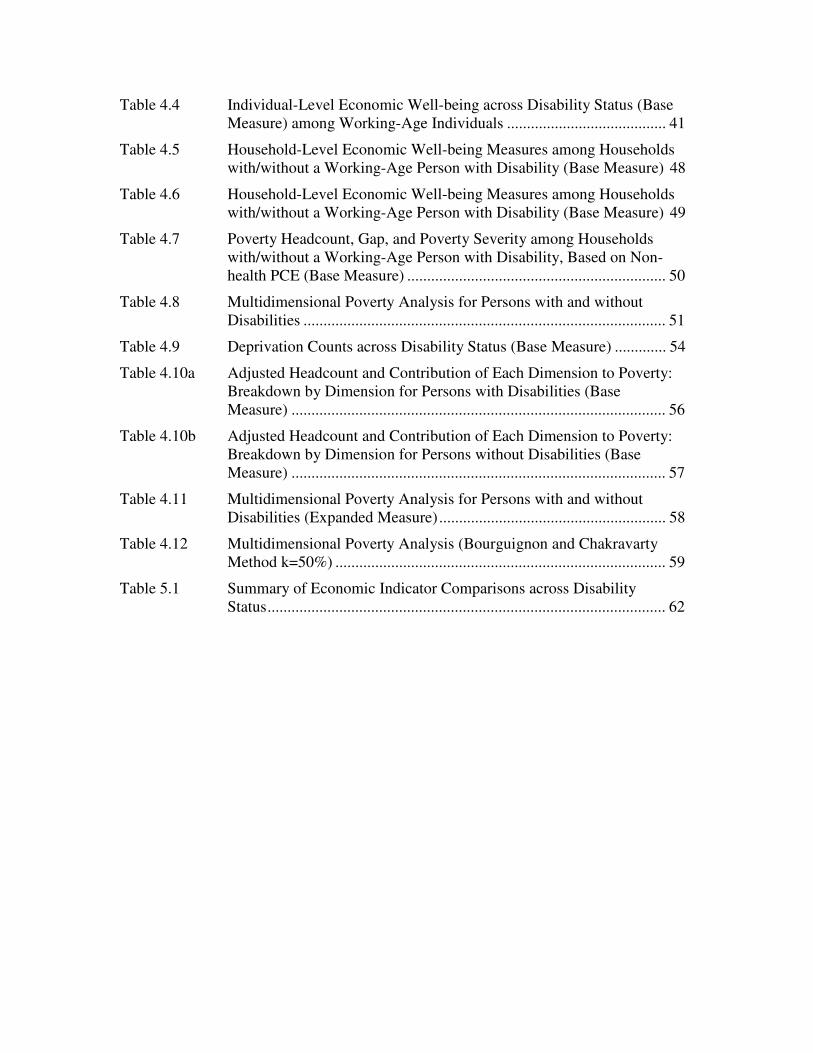
Table 4.4 Individual-Level Economic Well-being across Disability Status (Base Measure) among Working-Age Individuals ........................................ 41
Table 4.5 Household-Level Economic Well-being Measures among Households with/without a Working-Age Person with Disability (Base Measure) 48
Table 4.6 Household-Level Economic Well-being Measures among Households with/without a Working-Age Person with Disability (Base Measure) 49
Table 4.7 Poverty Headcount, Gap, and Poverty Severity among Households with/without a Working-Age Person with Disability, Based on Non-health PCE (Base Measure) ................................................................. 50
Table 4.8 Multidimensional Poverty Analysis for Persons with and without Disabilities ........................................................................................... 51
Table 4.9 Deprivation Counts across Disability Status (Base Measure) ............. 54
Table 4.10a Adjusted Headcount and Contribution of Each Dimension to Poverty: Breakdown by Dimension for Persons with Disabilities (Base Measure) .............................................................................................. 56
Table 4.10b Adjusted Headcount and Contribution of Each Dimension to Poverty: Breakdown by Dimension for Persons without Disabilities (Base Measure) .............................................................................................. 57
Table 4.11 Multidimensional Poverty Analysis for Persons with and without Disabilities (Expanded Measure) ......................................................... 58
Table 4.12 Multidimensional Poverty Analysis (Bourguignon and Chakravarty Method k=50%) ................................................................................... 59
Table 5.1 Summary of Economic Indicator Comparisons across Disability Status .................................................................................................... 62

i
EXECUTIVE SUMMARY
Disability and poverty are dynamic and intricately linked phenomena. In developed countries, a large body of empirical research shows that persons with disabilities experience inter alia comparatively lower educational attainment, lower employment and higher unemployment rates, worse living conditions, and higher poverty rates. In developing countries, the still limited body of empirical research points toward individuals with disability being often economically worse off in terms of employment and educational attainment, while at the household level, the evidence is mixed. Deriving any conclusions on the association between disability and poverty in developing countries from this literature is problematic, given the lack of comparability of the disability measures, economic indicators, and methods in these studies.
This study aims to contribute to the empirical research on social and economic conditions of people with disabilities in developing countries. Using comparable data and methods across countries, this study presents a snapshot of economic and poverty situation of working-age persons with disabilities and their households in 15 developing countries. The study uses data from the World Health Survey (WHS) conducted by the World Health Organization (WHO) in 2002-2004 in 30 developed and 40 developing countries across the world. The countries for this study are: Burkina Faso, Ghana, Kenya, Malawi, Mauritius, Zambia, and Zimbabwe in Africa; Bangladesh, Lao People’s Democratic Republic (Lao PDR), Pakistan, and the Philippines in Asia; and Brazil, Dominican Republic, Mexico, and Paraguay in Latin America and the Caribbean. The selection of the countries was driven by the data quality.
It is essential to note that the WHS is a cross-sectional survey and that hence this study can only describe the economic well-being of persons with disabilities. No conclusions about the causality between disability and poverty should be drawn based on the descriptive statistics this study presents. Furthermore, the results of the study cannot be generalized for developing countries as a whole, given that the 15 countries included in the study may not be representative of all developing countries.
This research is relevant for several reasons. First, it contributes to a currently small body of empirical evidence on the economic status of persons with disabilities in developing countries. Second, by providing a baseline data on the economic well-being and the poverty status of working-age persons with disabilities and their households in 2003 in the countries under study, it can inform national disability policies. Finally, this study can also inform future data and research efforts on disability in developing countries.
Definitions, data, and measures of well-being
Disability: Different models have been developed to define disability. In this study, disability is understood following the International Classification of Functioning, Disability and Health (ICF) developed by the WHO in 2001. The ICF model integrates the medical model (disability as a medical issue) and social model (disability as a social
ii
construct) of disability into a bio-psychosocial model of disability by recognizing that people are disabled both by the interaction between their health condition and the environment. “Disability is an umbrella term for impairments, activity limitations, and participation restrictions. It denotes the negative aspects of the interaction between an individual (with a health condition) and that individual’s contextual factors (environmental and personal factors)” (WHO 2001, p. 213). Environmental and personal factors may present barriers for persons with health conditions to function and participate in economic and social life. An implication of the ICF model of disability is that by removing barriers, persons with health conditions can be enabled to function and participate.
Poverty: Like disability, poverty is a complex phenomenon. This study follows a common approach and looks at both monetary (income/consumption expenditure) and non-monetary aspects of living standard and poverty (for example, education, health, living conditions), at the individual level (for example, educational attainment, employment), and at the household level (for example, expenditures, assets).
Pathways between disability and poverty: The onset of disability may lead to lower living standard and poverty through adverse impact on education, employment, earnings, and increased expenditures related to disability. Conversely, poverty may increase the risk of disability through several pathways, many of which are related to poor health and its determinants. Poverty, as a contextual factor, may also increase the likelihood that a health condition may result in disability. In addition, stigma associated with a health condition may lead to activity limitations and participation restrictions given a particular social and cultural context and it might be worsened by the stigma associated with poverty. Finally, environmental factors due to limited resources in the community, leading for instance to an inaccessible physical environment, make it difficult for an individual with a disability to have activities and participate in the community.
Disability measures using the WHS data: There is no agreed international standard to measure disability. Disability measures may vary depending on the definition of disability, information collected by a particular survey instrument, as well as research objectives. This study adopts the ICF definition of disability focusing on functioning and participation and uses self-reported data from the WHS on difficulties in functioning in everyday life to construct disability measures. For the purpose of this study, two measures of disability are used. The base measure of disability is defined as experiencing severe or extreme difficulty in at least one of the following: seeing/recognizing people across the road (while wearing glasses/lenses); moving around; concentrating or remembering things; and self care. The expanded measure includes the above four questions of the base measure and four additional ones as follows: difficulty in seeing/recognizing object at arm's length (while wearing glasses/lenses); difficulty with personal relationships/participation in the community; difficulty in learning a new task; and difficulty in dealing with conflicts/tension with others.
Economic dimensions of well-being: Several dimensions of well-being at both individual and household levels are analyzed to draw country level profiles of economic well-being and poverty across disability status. At the individual level, two dimensions are included:
iii
education and employment. The education dimension is measured by the years of completed schooling and whether a person has completed primary school. The employment dimension is measured through the employment status. At the household level, two welfare aggregates are analyzed: 1) asset ownership and living conditions; and 2) non-health per capita consumption expenditures (PCE). In addition to the individual- and household-level measures of economic status and poverty described above, several multidimensional poverty measures complement the use of the non-health PCE as welfare aggregate for poverty estimates.
Results
The main text presents the analysis using the base measure of disability and overall results. Information using the expanded measure of disability and individual country profiles is presented in the appendices.
Overall disability prevalence: Country specific estimates of disability prevalence vary tremendously: from a low of 3 percent in Lao PDR to a high of 16 percent in Bangladesh for the base disability measure. Disability prevalence is found to be higher among women than men in every country. The largest difference in disability prevalence is observed in Bangladesh, where the prevalence stands at 23 percent among women, compared to 10 percent among men. In 11 out of the 15 countries under study, disability prevalence is higher in rural than in urban areas using the base measure. Similar results were found when using the expanded disability measure for each of these prevalence figures.
Disability prevalence by economic status: Disability prevalence estimates by economic status vary by the measure used. For the asset index, prevalence in the bottom quintile ranges from a low of 5 percent in Mexico to a high of 21 percent in Bangladesh and is higher in the bottom quintile in 11 countries, but the difference is statistically significant in five countries. Results are overall similar when the expanded disability measure is used. When poverty status is measured using non-health PCE as welfare aggregate and the PPP US$1.25 a day international poverty line, disability prevalence is significantly higher among the poor than the non-poor in four countries. When poverty is measured through a multidimensional measure, disability prevalence among persons who experience multiple deprivations is significantly higher in 11 out of the 14 countries included in this analysis.
Individual-level economic well-being: In a majority of the countries under study, persons with disabilities, on average, as a group are found to have statistically significantly lower educational attainment and lower employment rates than persons without disabilities.
Education: Using a base disability measure, persons with disabilities are found to have a mean number of years of education that is statistically significantly fewer compared to persons without disabilities in 12 countries. Likewise, the percentage of individuals who have completed primary education is significantly lower among persons with disabilities in all but one country. Very similar results are found using the expanded disability measure.
iv
Employment: In a majority of the countries, the difference in employment rates is to the detriment of disabled people. Persons with disabilities have lower employment rates in 12 countries and this difference is statistically significant in nine countries. Very similar results are found using the expanded disability measure.
Household-level economic well-being: At the household level, the economic situation of households with disabilities varies by dimension. In a majority of countries (10 out of 15), households with disabilities have a significantly lower mean asset index. Also, a higher percentage of households with disabilities belong to the bottom asset quintile and this difference is statistically significant in six out of 15 countries. Households with disabilities, on average, also report spending a higher proportion of their expenditure on health care: the mean ratio of health to total household expenditures is significantly higher for households with disabilities in 10 out of 14 countries1 irrespective of whether the base or the expanded disability measure is used.
Disability is significantly associated with multidimensional poverty in 11 to 14 of the 14 developing countries under study. In other words, persons with disabilities are more likely to experience multiple deprivations than persons without disabilities in most countries. This result holds when different multidimensional poverty measures and poverty thresholds (within and across dimensions) are used.
Descriptive statistics do not suggest that households with disabilities are worse off as per mean non-health PCE: only five countries had a share of households in the bottom quintile of the non-health PCE significantly higher among households with disabilities. In terms of poverty measures based on the non-health PCE compared to international poverty lines, the difference in the poverty status between households with and without disabilities was statistically significant only in very few countries. This result should, however, be treated with caution given that it might be influenced by the limitations of the WHS with respect to its sampling design when it comes to identifying the disability status of a household and its small set of questions on expenditures.
Possible policy implications
Although this study does not discuss policies, the findings broadly point to three possible policy implications.
First, the results that in all the countries under study, persons with disabilities are significantly worse off in several dimensions of economic well-being, and in most countries experience multiple deprivations, call for further research and action on poverty among persons with disabilities.
Second, policies and programs to improve socioeconomic status of people with disabilities and their families need to be adapted to country specific contexts. This study does not find a single economic indicator for which persons with disabilities are systematically worse off in all countries, suggesting that the processes whereby disability and poverty are related are complex and vary from country to country. A more in-depth
1 One country, Zimbabwe, could not be included in the analysis of PCE and multidimensional poverty due to a lack of PCE data.
v
analysis would be needed at the country level to develop specific and contextualized policy recommendations.
Third, results from the analyses within dimensions of economic well-being suggest that policies that promote access to education, health care and employment may be particularly important for the well-being of persons and households with disabilities.
Further research and data collection
The results of this study tempt for more research on disability and social and economic outcomes in developing countries.
First, research is needed on the causal pathways between disability and poverty to understand how in a developing country context, disability may lead to poverty and vice versa. It is necessary to bring causal pathways into light in order to make specific policy recommendations, at the country level, on how to reduce poverty among persons with disabilities, and how to curb the incidence of disability among the poor.
Second, comprehensive poverty profiles of persons and households with disabilities are needed for disability policies to be efficient and effective.
Third, research is needed to evaluate interventions such as income support and programs to economically empower persons with disabilities in developing countries. Some interventions, such as community-based rehabilitation, have long been in the field, but little is known on what works.
All three areas of research suggested above need more and better data on disabled people and their households. Longitudinal data is necessary to assess the causal pathways between disability and poverty. In developing countries, the longitudinal household surveys are rare and those that include disability questions are all but lacking. Cross-sectional data need to improve on the disability questions and sample design that would also allow researchers to draw reliable estimates on persons and households with disabilities. Last but not least, better data collection is needed to investigate the access and affordability of health care for persons with disabilities in developing countries. This study found a higher medical to total household expenditure ratio for households with disabilities in most countries, but did not have data on access to health care services at the individual level.

1
1. INTRODUCTION
This study presents a snapshot of economic and poverty situation of working-age persons with disabilities and their households in 15 developing countries. These countries are Burkina Faso, Ghana, Kenya, Malawi, Mauritius, Zambia, and Zimbabwe in Africa; Bangladesh, Lao People’s Democratic Republic (Lao PDR), Pakistan, and the Philippines in Asia; and Brazil, Dominican Republic, Mexico, and Paraguay in Latin America and the Caribbean. The study also presents estimates of disability prevalence among working-age population in those countries.
Disability and poverty are complex, dynamic and intricately linked phenomena. The onset of disability may increase the risk of poverty and poverty may increase the risk of disability. While these relations are commonly assumed and have been noted in literature (Sen 2009), there has been little systematic empirical evidence on them. It is the two-way causation between disability and poverty, difficulties in defining and measuring disability and the lack of good statistical information that have conspired against the efforts to empirically disentangle the poverty disability nexus. Furthermore, the available empirical evidence differs greatly between developed and developing countries. In developed countries, multiple data sources are available and descriptive statistics on various aspects of social and economic well-being of persons with disabilities is commonly compiled and published. Some countries, notably the United States and members of the European Union, also have longitudinal panel surveys which are necessary for empirical analysis of the linkages between disability and poverty; for example, for answering the questions on how the onset of disability affects the socioeconomic situation of an individual and her/his family and how poverty affects the onset of disability. In contrast, in developing countries descriptive statistics are rare, fragmented and sporadic and longitudinal surveys are altogether lacking.
This study attempts to shed some light on the prevalence of disability and the socioeconomic status of working-age disabled people in 15 developing countries. The study uses data from the World Health Survey (WHS) conducted by the World Health Organization (WHO) in 2002-2004 in 70 developed and developing countries across the world. It is essential to note that, given that the WHS is a one off, cross sectional survey, this study can only provide a snapshot of socioeconomic indicators, in other words it can only describe the economic well-being of persons with disabilities along several dimensions. No conclusions about the causality between disability and poverty should be drawn based on the descriptive statistics this study presents.
This research is relevant for several reasons. First, it contributes to a - currently small - body of empirical evidence on the economic status of persons with disabilities in developing countries. Second, by providing a baseline data on the economic well-being and the poverty status of working-age persons with disabilities and their households in 2003 in the countries under study, it can inform national disability policies. Finally, this study can also inform future data and research efforts on disability in developing countries.

2
This study is structured as follows. Section 2 provides definitions and some background on disability and poverty. Section 3 describes the data and methods. Section 4 presents disability prevalence estimates in the 15 developing countries under study and results on the economic well-being of working-age population at the individual and household levels. Section 5 gives results of an analysis of multidimensional poverty across disability status. Section 6 concludes.
3
2. DEFINITIONS AND BACKGROUND
This section presents definitions and some background information on disability and poverty, describes some of the linkages between them and reviews recent literature on the socioeconomic status of persons with disability.
2.1 Definitions
Disability
Different models have been developed to define disability.2 In this study, disability is understood following the International Classification of Functioning, Disability and Health (ICF or International Classification hereafter) developed by WHO in 2001. According to the ICF, “disability is an umbrella term for impairments, activity limitations and participation restrictions. It denotes the negative aspects of the interaction between an individual (with a health condition) and that individual’s contextual factors (environmental and personal factors)” (WHO 2001, p. 213). Thus, this model starts with a health condition (for example, diseases, health disorders, injuries, and other health related conditions) which in interaction with contextual factors may result in impairments, activity limitations, and participation restrictions. The ICF defines that impairments are problems in body function or structure such as a significant deviation or loss; activity is the execution of a task or action by an individual; activity limitations are difficulties an individual may have in executing activities; participation is involvement in a life situation; participation restrictions are problems an individual may experience in involvement in life situations; environmental factors make up the physical, social and attitudinal environment in which people live and conduct their lives; and personal factors are the particular background of an individual’s life and living, including gender, race, and age (WHO 2001, p. 213).
Functioning and disability are two umbrella terms, one mirroring the other. Functioning covers body functions and structures, activities and participation, while disability includes impairments, activity limitations and participation restrictions. It is sometimes difficult to differentiate activities and participation. For example, self care can be considered as either (WHO 2001, p. 235). Hence, the ICF gives domains that can be used for both activities and participation. They include learning and applying knowledge, mobility, self care, education, remunerative employment, and economic self-sufficiency.
The ICF model represents an integration of the medical and social models into a “bio-psycho-social model” (WHO 2001, p. 20). In the medical model, disability is defined as caused by a disease, an injury or other health conditions and it is considered intrinsic to the individual. Under this model, addressing disability requires medical treatment and rehabilitation and an individual with any impairment is considered disabled, regardless of whether the person experiences limitations in his or her life activities due to the impairment. In the social model, disability is understood as a social construct; disability is not a characteristic of the individual, instead it is created by the social environment and
2 Detailed presentations of these models are available in Altman (2001) and Mitra (2006).

4
addressing it requires social change. The ICF model integrates the medical and social model by recognizing that people are disabled both by health conditions and by the environment.
In a cross-country study such as this one, it is important to bear in mind that environments could vary tremendously from one country to the next, and even within countries from one area to the next. Thus, two individuals with the same health condition in two different countries or in two different regions within the same country may have different disability status given differences in the environment. An individual in one country/region might have a severe problem “moving around” because the terrain is difficult and there are no ramps and curb cuts; the transportation system is inadequate and/or inaccessible, because (as a woman) she can’t travel unaccompanied or because assistive devices are not available. The other individual may not face any of these environmental barriers and thus may only experience a mild difficulty “moving around”.
Measuring disability
Because disability is not a readily identifiable attribute such as gender or age, but a complex, dynamic interaction between a person’s health condition and physical and social environment, it has proven very difficult to measure. Three disability measures have been commonly used in applied disability research: measures of impairment, functional limitation measures and activity limitation measures. Impairment measures of disability focus on the presence of impairment intrinsic to the individual. For example, individuals may be queried about impairments that might include blindness, deafness, mental retardation, stammering and stuttering, complete or partial paralysis. The measures that were focused only on impairment were commonly used in the past. The measures of functional limitations focus on limitations experienced with particular bodily functions such as seeing, walking, hearing, speaking, climbing stairs, lifting and carrying, irrespective of whether the individual has an impairment or not. Activity limitations measures focus on limitations in activities of daily living such as bathing or dressing. Activity limitations may also include participation limitation in major life activities such as going outside the home, work or housework for working-age persons, and school or play for children. The measures of impairments and functional limitations relate to disability as per the medical model. They also capture problems in body functions and structures under the ICF. The measures of activity limitations may be considered to capture disability as per the social model and the activity limitations and participation restrictions under the ICF.
The measures of disability have changed over time following changes in the conceptual approach to it. Over time, as a definition of disability has evolved from an exclusively medical phenomenon measured by impairments toward a concept that encompasses the interaction between an individual’s health condition and her/his environment, the efforts to develop measures of disability have accordingly focused on measures that capture activity limitations and participation restrictions. This study attempts to use disability measures, which, to the extent possible given the data at hand, follow the ICF definition of disability.

5
Poverty
Like disability, poverty is a dynamic phenomenon that is difficult to measure. A vast body of literature on poverty, including on its definition and measurement has been published over the last several decades (World Bank 1990 and 2001; Ravallion 1992; Lipton and Ravallion 1995; de Janvry and Kanbur 2006). This study follows a common approach and looks at both monetary (income/consumption expenditure)3 and non-monetary aspects of living standard and poverty (for example, education, living conditions), at the household level (for example, expenditures, assets), and at the individual level (for example, educational attainment, employment). It also attempts to look at poverty through a multidimensional lens following methods proposed by Bourguignon and Chakravarty (2003), and Alkire and Foster (2009).
2.2 Health Conditions and Poverty
In most definitions of disability, including the ICF, having a health condition is a prerequisite for having a disability. One can then assume that a significant part of the association between disability and poverty is mediated through health.
It is well established in the literature that poverty and ill health are interconnected. In a study of 56 developing countries, Gwatkin et al. (2007) find that “the health of the poor is notably worse than that of the better off” where health is measured by under-five mortality, malnutrition, and fertility (p. 7). This pattern of worse health is found in all countries for malnutrition and fertility and in all but two countries for the under-five mortality. The study also finds that “the poor use health services less and have less adequate health related behaviors” (p. 7). Poverty may lead to health conditions through various pathways and much evidence is available on this link in the literature on the social determinants of health (WHO 2009). Pathways include malnutrition (Susser et al. 2008), housing and environmental exposures (Rauh et al. 2008), and a lack of access to health services (Peters et al. 2008). Some diseases such as malaria, measles, lower respiratory infections, and diarrheal diseases are so strongly associated with poverty that they have been labeled “diseases of poverty” (Kaler 2008). Poverty and health conditions are also linked through the general level of awareness and education of the poor. Parental awareness, access to information, and maternal education have all been found to have a great preventive effect by promoting the ability to adopt health promoting behaviors (Cutler et al. 2006).
In reverse, health conditions may increase the risk of poverty through lost earnings and health expenditures. A comprehensive review of empirical literature found that evidence suggests that poor health reduces the capacity to work and has substantive effects on wages, labor force participation and job choice (Currie and Madrian 1999). In Indonesia, for instance, Gertler and Gruber (2002) show that a change in illness symptoms lead to reduced hours of work, reduced earnings, and increased health care spending. Increased out-of-pocket spending on health care may have an impoverishing impact (van Doorslaer et al. 2006).
3 Consumption expenditure as a welfare aggregate is considered to have several advantages over income (Deaton 1997); it fluctuates less and it is more accurately captured by household surveys compared to income data. It is also a better proxy of a household’s standard of living.

6
Finally, it should be noted that the links between poverty and health are difficult to study because poverty may affect health (and disability) self-reports. The poor may systematically under-report health problems due to a lack of awareness of what constitutes a true healthy state (Banerjee et al. (2004); Strauss and Thomas (2008)).
To conclude, if health conditions and poverty are associated, and having a health condition is a necessary (but non-sufficient) condition to have a disability, one might also expect that disability and poverty are associated.
2.3 Likely Pathways between Disability and Poverty
Likely pathways between disability and poverty have seldom been depicted in detail,4 let alone established empirically. Some of those pathways are described below and summarized in Charts 1 and 2.
From the onset of disability to adverse socioeconomic outcomes and poverty
The onset of disability may lead to lower living standard and poverty through adverse impact on education, employment, earnings, and increased expenditures related to disability.
Education. Disability may prevent school attendance of children and youth with disabilities and restrict human capital accumulation and may thus lead to limited employment opportunities and reduced productivity (earnings) in adulthood for persons with a disability onset at birth or during childhood (Filmer 2008). Standard labor economics theory predicts that investments in education will be more limited for children with disabilities due to lower expected returns from education in terms of employment outcomes. The relevance and intensity of this link will vary depending on many factors, including the socioeconomic status of a family before the onset of childhood disability, the timing of disability onset (for example, at birth, early childhood), the type and severity of disability, the interaction between individual’s disability and the school environment in the community, as well as the cultural and education policy background.
Employment. Disability may prevent work, or constrain the kind and amount of work a person can do (Evans 1989; Gertler and Gruber 2002; Contreras et al. 2006; Meyer and Mok 2008). In other words, to use Amartya Sen’s (1992; 2009) term earnings handicap, disability may restrict the ability to earn an income. In economic theory, the labor leisure choice model suggests that the employment rate is expected to be lower for persons with disabilities due to higher reservation wages (sometimes as a result of the availability of benefits) and lower market wages as a result of lower productivity and/or discrimination.5 In practice, the extent of this negative effect of disability on employment will vary depending on a variety of factors, starting with the individual’s type of disability, the timing of disability onset (at birth, during childhood or adulthood), its duration (temporary or permanent) and how it relates to his/her occupation. As noted in Baldwin and Johnson (1994), a blind person might find it difficult to operate a crane but might
4 Exceptions include Yeo and Moore (2003) and Yeo (2005). 5 An exposition of the labor leisure choice model in relation to the employment and wages of persons with disabilities is available in Bound and Burkhauser (1999) and Mitra and Sambamoorthi (2008).
7
face no productivity impediment as a phone operator. In an agrarian economy, as is often the case in developing countries, most jobs are in the primary sector (agriculture, forestry) and may involve heavy manual labor, which persons with walking or carrying limitations may not be able to do. The effect of disability on employment will also depend on the work place, its accessibility, available accommodations, and whether there is discrimination that might prevent access to employment and/or might lead to lower wages (Baldwin and Johnson 2006; Bound and Burkhauser 1999). Additionally, the relevance and intensity of this pathway depend on the cultural context in so far as negative attitudes toward the employment potential of persons with disabilities in society at large or within the household might limit access to work (Mitra and Sambamoorthi 2008). The policy context is also relevant; for instance, are vocational rehabilitation programs, disability insurance or social assistance programs available? Such programs, depending on how they are designed and put into practice, could facilitate, limit or not affect access to employment for persons with disabilities.
Employment of informal care givers. Disability may lead to limited employment and forgone earnings of other family members to care for a disabled family member. The relevance of this pathway is endogenous to intra-household decision making and such decision will depend on whether a disabled family member is a child or an adult, the availability and accessibility of care services outside the family, the opportunity cost of care, the existing labor market status of the family members, the household decision on how to share the care between family members and whether family members co-reside with the disabled person, and on customs and traditions. For instance, if a family member is not employed and assumes a care-provider role there will be no foregone earnings (Heitmueller 2005; Contreras et al. 2006).
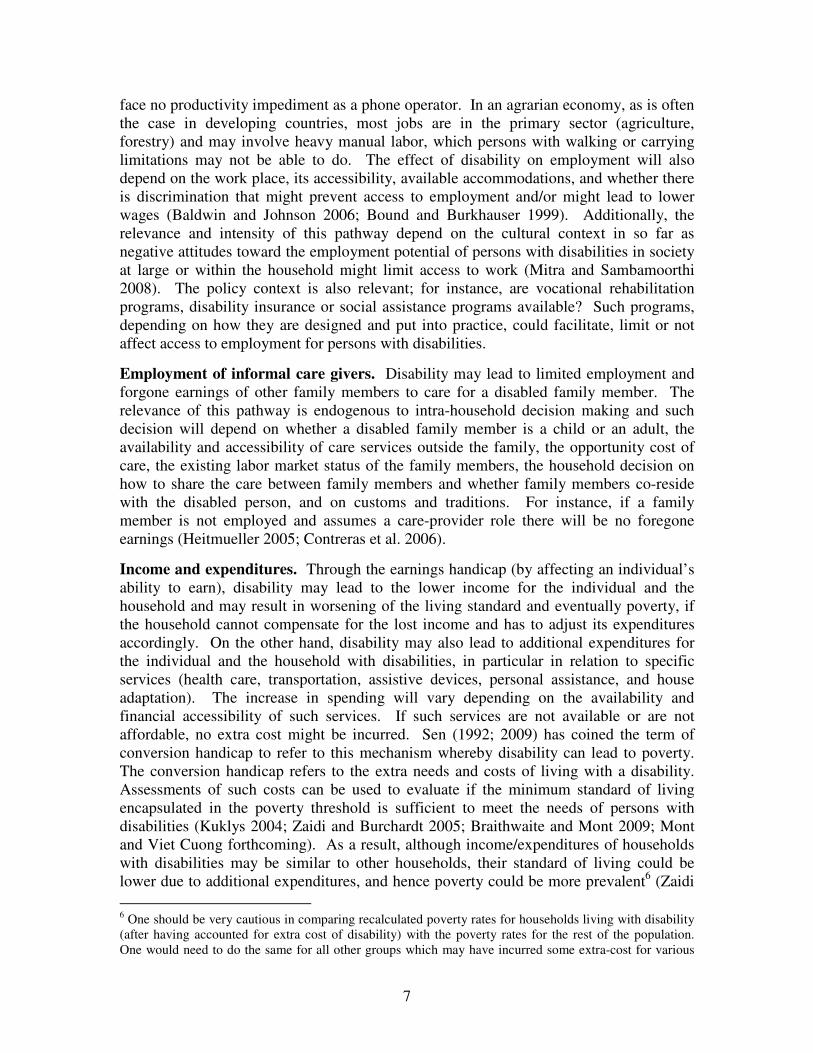
Income and expenditures. Through the earnings handicap (by affecting an individual’s ability to earn), disability may lead to the lower income for the individual and the household and may result in worsening of the living standard and eventually poverty, if the household cannot compensate for the lost income and has to adjust its expenditures accordingly. On the other hand, disability may also lead to additional expenditures for the individual and the household with disabilities, in particular in relation to specific services (health care, transportation, assistive devices, personal assistance, and house adaptation). The increase in spending will vary depending on the availability and financial accessibility of such services. If such services are not available or are not affordable, no extra cost might be incurred. Sen (1992; 2009) has coined the term of conversion handicap to refer to this mechanism whereby disability can lead to poverty. The conversion handicap refers to the extra needs and costs of living with a disability. Assessments of such costs can be used to evaluate if the minimum standard of living encapsulated in the poverty threshold is sufficient to meet the needs of persons with disabilities (Kuklys 2004; Zaidi and Burchardt 2005; Braithwaite and Mont 2009; Mont and Viet Cuong forthcoming). As a result, although income/expenditures of households with disabilities may be similar to other households, their standard of living could be lower due to additional expenditures, and hence poverty could be more prevalent6 (Zaidi
6 One should be very cautious in comparing recalculated poverty rates for households living with disability (after having accounted for extra cost of disability) with the poverty rates for the rest of the population. One would need to do the same for all other groups which may have incurred some extra-cost for various

8
and Burchardt 2005; Braithwaite and Mont 2009; Cullinan et al. 2010). Because disability can both limit and increase household expenditures, the net effect is not a priori
obvious. As a consequence of the earnings and the conversion handicaps, a disability may lead to a lower standard of living and poverty, if a household cannot compensate for the lost income and cover additional expenditures. In practice, the magnitude of these effects would depend on many factors, including the household’s socioeconomic status prior to the onset of disability (Jenkins and Rigg 2003), type, severity and duration of disability, whether a disabled person is a principal income earner, as well as a policy context. Are there private or public disability insurance programs? Are there social assistance programs for persons with disabilities? In fact, if there is a range of disability benefits, which would not only fully (or to a large extent) replace the earnings, but also provide for coverage of certain disability related expenditures, such as the cost of specific rehabilitation, free assistive devices, care and attendance allowance, etc., disability might not lead to significant reductions in living standard and poverty.
Intra-household distribution of resources. Welfare indicators such as income, expenditures, and assets are usually collected at the household level. It is possible that individuals with disabilities within the household may still suffer from poverty and deprivation, although their household may not classify as poor. This will depend on the distribution of resources within the household.
To conclude, the onset of disability may lead to a lower standard of living and eventually poverty though several interconnected pathways. Economic theory suggests that adults with childhood/youth disabilities could be expected to have lower educational attainment. It also suggests that disabled working-age population could be expected to experience lower employment rates. The earnings and the conversion handicaps suggest that persons with disabilities and their households could be expected to be worse off as compared to persons with no disabilities and their households. However, this may not necessarily be the case due to a number of factors including the socioeconomic status prior to disability, and the possibility for disability to be fully insured/compensated for through various insurance and public assistance interventions. Thus, the relevance and the intensity of the pathways from disability to poverty described above appear to be context specific. Depending on the individual, his household, community and country context, some or all of the above links may be taking place, but with different intensity and impact. Therefore, it is reasonable to expect that the dynamic links above will in practice vary from country to country.
reasons, for instance, because of sickness, or a new-born baby, etc., in order for those comparisons to be methodologically correct.
9
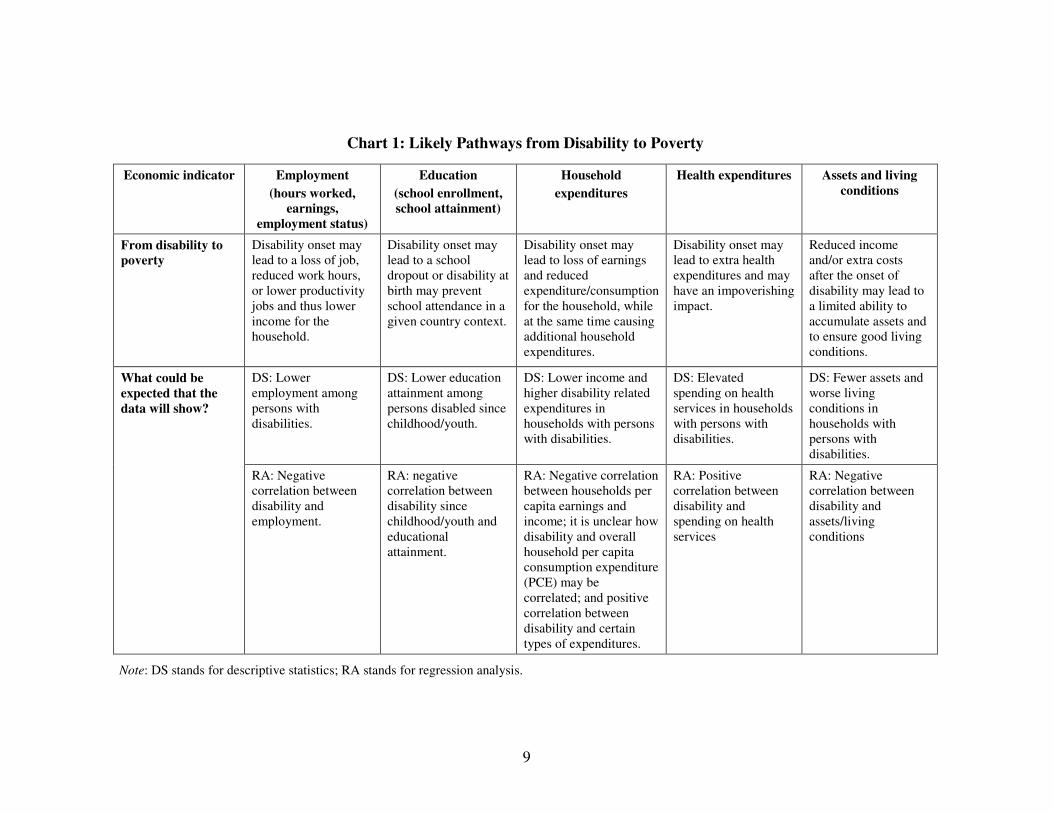
Chart 1: Likely Pathways from Disability to Poverty
Economic indicator Employment
(hours worked, earnings,
employment status)
Education
(school enrollment, school attainment)
Household
expenditures
Health expenditures Assets and living conditions
From disability to poverty
Disability onset may lead to a loss of job, reduced work hours, or lower productivity jobs and thus lower income for the household.
Disability onset may lead to a school dropout or disability at birth may prevent school attendance in a given country context.
Disability onset may lead to loss of earnings and reduced expenditure/consumption for the household, while at the same time causing additional household expenditures.
Disability onset may lead to extra health expenditures and may have an impoverishing impact.
Reduced income and/or extra costs after the onset of disability may lead to a limited ability to accumulate assets and to ensure good living conditions.
What could be expected that the data will show?
DS: Lower employment among persons with disabilities.
DS: Lower education attainment among persons disabled since childhood/youth.
DS: Lower income and higher disability related expenditures in households with persons with disabilities.
DS: Elevated spending on health services in households with persons with disabilities.
DS: Fewer assets and worse living conditions in households with persons with disabilities.
RA: Negative correlation between disability and employment.
RA: negative correlation between disability since childhood/youth and educational attainment.
RA: Negative correlation between households per capita earnings and income; it is unclear how disability and overall household per capita consumption expenditure (PCE) may be correlated; and positive correlation between disability and certain types of expenditures.
RA: Positive correlation between disability and spending on health services
RA: Negative correlation between disability and assets/living conditions
Note: DS stands for descriptive statistics; RA stands for regression analysis.
10
From poverty to disability
Poverty may increase the risk of disability through several pathways, many of which are related to poor health and its determinants.
Poverty may lead to the onset of a health condition which may result in disability including through malnutrition (Maulik et al. 2007; Lancet 2008), diseases whose incidence and prevalence are strongly associated with poverty, lack of inadequate public health interventions (for example, immunization), poor living conditions (for example, lack of safe water and sanitation), environmental exposures (for example, unsafe work environments), and injuries (intentional and unintentional; for instance, vulnerable buildings in the context of natural disasters). On the other hand, one should note that wealth may also lead to disability. For instance, Thomas (2005) refers to studies in Cambodia where the wealthy are more at risk of road traffic injuries due to higher motorbike ownership.
Poverty, as a contextual factor, may also increase the likelihood that a health condition may result in impairment, activity limitation, or participation restriction. This could be the case if there is a lack of health care and rehabilitation services or a lack of resources to access those that are available; acquire prosthetic, orthotic and mobility devices; get personal assistance at the community level, etc. In poor communities where such services are not provided or are of low quality, health conditions may be more likely to lead to disability. Even if such services are available, they may not be affordable (Horner et al. 2003). Affordability is influenced by the resources of the household (income, assets), the intra-household distribution of resources, by the economic environment (prices of services) and the health and disability policy context (health insurance, copayments). Poor households across the world are found to experience less access to health services (Gwatkin et al. 2007), unless specific policies and programs are in place to facilitate access. In addition, stigma associated with a health condition may lead to activity limitations and participation restrictions given a particular social and cultural context and it might be worsened by the stigma associated with poverty. Environmental factors due to limited resources in the community, leading for instance to an inaccessible physical environment, may also make it difficult for an individual with a health condition to have activities and participate in the community.

11
Chart 2: Likely Pathways from Poverty to Disability
Economic indicator Employment (hours worked, earnings,
employment status)
Education (school enrollment, school
attainment)
Household expenditures
Health expenditures Assets and living conditions
From poverty to disability
Lack of and low productivity jobs and the resulting lack of resources may lead to the lack of or limited access to health and rehabilitation leading to onset of disability.
Malnutrition leads to lower cognitive development and school attainment; poor households may under-invest in the education of disabled children; schools may be unavailable, inaccessible and/or unaffordable.
Low quality jobs may pose higher health hazard.
Inability to ensure adequate diet, secure good housing and better living conditions, and pay for health services and rehabilitation and other services may increase the likelihood of a health condition and a health condition resulting in onset of disability.
Lack of safe water and sanitation and unsafe work environment may lead to a disabling health condition.
What could be expected that the data will show?
DS: Higher disability prevalence among holders of low quality jobs.
DS: Higher disability prevalence among less educated adult population.
DS: Higher prevalence of disability among lower income/expenditure/ consumption groups.
DS: Not clear.
DS: Higher disability prevalence among households with fewer assets and poor living conditions.
RA: Positive correlation between low quality jobs and disability prevalence.
RA: Negative correlation between educational attainment in adults and disability.
RA: Positive correlation between household low per capita income/expenditure/ consumption and disability.
RA: Not clear. RA: correlation between low assets level and poor living conditions and disability.
Note: DS stands for descriptive statistics; RA stands for regression analysis.

12
2.4 Disability and Poverty: A Review of Recent Empirical Evidence
Globally, systematic evidence on socioeconomic status of persons with disabilities and the relation between disability and poverty in its various dimensions (income/expenditure and non-income) is limited, albeit the situation greatly differs between developed and developing countries. Typically, the empirical evidence on persons with disabilities is derived from population censuses, and population and household surveys. Administrative statistics is much less commonly available, even in developed countries. The majority of surveys are cross-sectional. In developing countries, surveys are often conducted as stand-alone researches. Longitudinal surveys which are required in order to observe changes in socioeconomic status prior to, immediately after, and for a longer time following the onset of disability are only available in a handful of developed countries. However, even in those countries, the data sources are argued to be in need of improvement (for the United States, see Houtenville et al. 2009).
When available, data has many limitations. Following Houtenville et al. (2009), those include: (i) operational definition of disability which may exclude some parts of the population with disabilities; (ii) changes in the definition of disability within the same survey which may hamper comparability over time; (iii) data collection methods may exclude people with disabilities (for instance, by definition, household surveys exclude institutionalized disabled people); (iv) sample sizes are often too small to capture persons with disabilities even at the national level, nor allow data to be disaggregated geographically, by administrative levels, or by types of disability; and (v) data on social, physical and information barriers is rarely collected. Another issue is the quality of the field work, because interviewers may not be adequately trained to survey persons with disabilities. As a result, it is often not possible to neither estimate disability prevalence nor get a robust description of social and economic status of people with disabilities, which is essential for design of the evidence-based disability policies and monitoring of their implementation.
Because of the linkages between poverty and disability described earlier, in a cross-sectional data, various indicators of socioeconomic status would be expected to point toward persons with disabilities and their households being worse off relative to persons without disabilities and their households. Some of these expected outcomes from descriptive statistics and regression analysis are presented above in charts 1 and 2. For instance, one would expect to observe a higher risk of income poverty among households with a disability than among households without disabilities, or to observe higher disability prevalence rates among the income poor than among the non-poor. The absolute and relative value of those indicators would be expected to vary across countries, given that disability experience is highly context specific, as explained earlier. In a regression analysis of longitudinal data one would expect to observe the onset of disability resulting in adverse socioeconomic outcomes. Looking at the other side of the causality, one would expect adverse socioeconomic circumstances, such as prolonged acute malnutrition during a famine, to lead later on to disability onset.
Empirical evidence from developed countries. Most of the available descriptive statistics on the social and economic status of persons with disabilities pertains to developed countries. The evidence suggests that persons with disabilities have lower

13
educational attainment and experience lower employment rates, have lower wages when employed, and are more likely to be poor than persons without disabilities. A 2009 study by the Organisation for Economic Co-operation and Development (OECD) covering 21 high income and upper middle income countries presents a snapshot of the labor market outcomes and poverty situation of working-age persons with disabilities. The study shows higher poverty rates (defined as percentages of people with disabilities in households with less than 60 percent of the median adjusted disposable income) among working-age disabled people than among working-age people with no disabilities in all but three countries (Sweden, Norway and Slovak Republic, where the reverse is the case). The relative poverty risk (poverty rate of working-age disabled relative to that of working-age non-disabled people), however, varies greatly. It is the highest – over two times higher – in the United States, Australia, Ireland, and Korea; and the lowest, for example, only slightly higher than in the case of non-disabled people in the Netherlands, Iceland, and Mexico. The study also showed that working-age people with disabilities are less likely to be employed; when employed, more likely to work part-time; twice as likely to be unemployed; and have relatively low income, unless highly educated and have a job.
The OECD (2009) study provides summary statistics, and thus does not provide evidence in relation to the causal pathways between disability and poverty. It does not tell whether disabled people were unemployed or poor before the onset of disability, or became unemployed or poor after the onset of disability. Jenkins and Rigg (2003) analyzed eight waves of the British Household Panel Survey (1991-1998) and found that working-age adults who became disabled were typically more disadvantaged prior to disability onset (for instance, not having any educational qualification or not being in paid work). They also found that employment rates fall with disability onset, and continue to fall the longer a disability spell lasts. As for average household income, it falls sharply with onset, but recovers subsequently although not to pre-disability levels.7 Research on the association between disability and lower economic status is also available for other developed countries, including Australia (Buddlemeyer and Verick 2008; Saunders 2007), Ireland (Gannon and Nolan 2004), Italy (Parodi and Sciulli 2008), and the United States (Meyer and Mok 2008; Mitra et al. 2009; She and Livermore 2007, 2009).
Developing countries. In developing countries,8 the quantitative literature, while still small, has recently grown. Similar to the findings for developed countries, this literature, as presented below, suggests lower social and economic status of persons with disabilities, but inconclusively. The topics covered in the studies reviewed for this paper include employment, education, educational attainment among adults, access to health care, household economic well-being, and living conditions.
Regarding employment, a large majority of studies show that persons with disabilities are less likely to be employed (Contreras et al. 2006 (Chile and Uruguay); Eide et al. 2003b (Namibia); Eide and Loeb 2006 (Zambia); Eide and Kamaleri 2009 (Mozambique);
7 For other UK related research, see for instance Kuklys 2004 and Zaidi and Burchardt 2005. 8 The literature under review covers developing countries, except for Mete (2008), which is focused on transition countries, and UNICEF (2009) and Gotlieb et al. (2009) which cover both developing and transition countries.
14
Hoogeven 2005 (Uganda); Mete 2008 (Eastern Europe); Mitra 2008 (South Africa); Mitra and Sambamoorthi 2008 (India); World Bank 2009 (India); Loeb and Eide (2004) (Malawi); Trani and Loeb 2010 (Afghanistan and Zambia); Zambrano 2006 (Peru)). However, in Zimbabwe, Eide et al. (2003a) find no statistically significant difference between the employment rates of persons with and without disabilities.
As for education, most of the evidence suggests that children with disabilities tend to have lower school attendance rates. An analysis of 14 household surveys in 13 developing countries in Africa, Latin America, and Southeast Asia (Filmer 2008) found that in all countries studied, children with disabilities 6-17 years of age were less likely to start school or to be enrolled at the time of the survey. Similar results were found in Loeb and Eide 2004 (Malawi), Loeb et al. 2008 (South Africa), Mete 2008 (Eastern Europe), Rischewski et al. 2008 (Rwanda), Trani and VanLeit 2010 (Afghanistan and Cambodia), Eide et al. 2003a (Zimbabwe), Eide et al. 2003b (Namibia), Eide and Loeb 2006 (Zambia), Eide and Kamaleri 2009 (Mozambique), and World Bank 2009 (India). UNICEF (2009) finds in a study of 20 developing and transition countries an “important correlation” between attending early learning activities and screening negative for increased risk of disability. Results are more mixed in Gotlieb et al. (2009) where, using the same data as in UNICEF (2009), screening negative for increased risk of disability and school attendance are significantly correlated in eight out of 18 developing countries. It should be noted that UNICEF (2009) and Gotlieb et al. (2009) investigate the association between school attendance and being at risk of disability, which is different from having a disability.
Looking at the educational attainment among adults, there is consistent evidence that adults with disabilities have lower educational attainment (Contreras et al. 2006 (Chile and Uruguay); Hoogeven 2005 (Uganda); Loeb and Eide 2004 (Malawi), Loeb et al. 2008 (South Africa); Mete 2008 (Eastern Europe); Rischewski et al. 2008 (Rwanda); Trani and Loeb 2010 (Afghanistan and Zambia); World Bank 2009 (India), Zambrano 2006 (Peru)). To the authors’ best knowledge, the only study where this was not found to be the case is Trani et al. (2010) for urban Sierra Leone.
Regarding access to health care, the literature on disparities across disability status in developing countries is very limited. World Bank (2009) and Trani et al. (2010) show that individuals with disabilities have a reduced access to health care in India and urban Sierra Leone respectively. Trani et al. (2010) also shows that on average, “persons with severe or very severe disabilities spent 1.3 times more on health care than non-disabled respondents” (p. 36).
Recent research has also explored disparities in household economic well-being across disability status. The main measures that have been assessed are asset ownership, household expenditures, income, and living conditions.9 For asset ownership, a lot of studies show that households with disabilities have fewer assets compared to other households (Loeb and Eide 2004 (Malawi); Eide et al. 2003b (Namibia); Eide and Loeb 9 Other indicators of household well-being have been used in various studies. For instance, World Bank (2009) shows that in India, households with disability were a lot worse off in terms of the ability to have three meals a day. In rural Ethiopia, Fafchamps and Kebede (2008) find that disability is associated with lower self-reported wealth and lower overall well-being.

15
2006 (Zambia); Eide and Kamaleri 2009 (Mozambique); Palmer et al. 2010 (Vietnam); World Bank 2009 (India)). Two studies find no significant difference (Eide et al. 2003a (Zimbabwe); Trani and Loeb 2010 (Afghanistan and Zambia)). Results are more mixed for income and household expenditures. Loeb and Eide 2004 (Malawi) and Eide et al. 2003b (Namibia) find that households with disabilities have lower incomes but three other studies (Eide et al. 2003a (Zimbabwe); Eide and Loeb 2006 (Zambia); and Trani et al. 2010 (Sierra Leone)) do not.10 In a study of two Latin American countries, results of poverty incidence based on per capita income are mixed. In both Chile and Uruguay, Contreras et al. 2006 find higher poverty rates among households with disabilities compared to households with no disabilities. The poverty rate of the subset of households with a head with a disability is similar to that of households with nondisabled heads in Chile and is lower in Uruguay.11 Furthermore, the regression analysis of the probability of being poor shows that in Uruguay, disability has no significant effect on the probability of being income poor except in households headed by severely disabled person. In the case of Chile, disability is found to have a statistically significant effect and that increases the probability of being income poor by 3-4 percent (Contreras et al. 2006). Regarding household expenditures, Loeb and Eide 2004 (Malawi), Eide and Loeb 2006 (Zambia), and Hoogeven 2005 (Uganda) find that households with disabilities have lower expenditures than households without, but Eide et al. 2003a (Zimbabwe) and Rischewski et al. 2008 (Rwanda) do not find any significant difference.
Finally, households with disabilities are found to have worse living conditions in Eide et al. 2003b (Namibia), Eide and Kamaleri 2009 (Mozambique), and Loeb and Eide 2004 (Malawi), but not in Eide et al. 2003a (Zimbabwe) nor Eide and Loeb 2006 (Zambia).
The studies on household-level economic well-being referenced above are all country level studies. A cross-country study of 13 developing countries (Filmer 2008) finds that in a majority of countries, disability in adulthood is associated with a higher probability of being in poverty,12 although this association disappears in a lot of countries when controls for schooling are included. This study, however, suffers from a limitation in that the household surveys it uses are based on different measures of disability, and are therefore not strictly comparable.
Overall, in developing countries, the evidence from quantitative studies thus far points toward individuals with disability being often economically worse off in terms of employment and educational attainment, while at the household level, the evidence is mixed. However, deriving any conclusions on the association between disability and poverty from this literature is problematic. First, studies use different methods: some studies only present means and frequency counts across disability status (for example, UNICEF 2009; Loeb and Eide 2004; Trani and VanLeit 2010), while other studies resort
10 In South Africa, Loeb et al. (2008) find that households with disabilities in the Eastern Cape Province have more possessions and a higher income than households without disabilities. 11 Contreras et al. (2006) note that: “The definition of the household head is endogenous to the household. Hence, the condition of disability of a member of the household may prevent him/her to be household head. Then, these results suggest that for a person with disability to be the household head, his/her disability is likely not to be an impediment to be the main contributor of resources to the household” (p. 58). 12 Filmer (2008) measures poverty by belonging to the lowest two quintiles in terms of household expenditures or asset ownership.

16
to multivariate analysis using a variety of empirical strategies which can be difficult to compare (for example, Filmer 2008; Mitra and Sambamoorthi 2008; Trani and Loeb 2010). Second, and more importantly, the household survey data used in these studies are not comparable across countries, often because of their different measures of disability.13 Some studies measure disability through functional limitations (for example, Trani et al. 2010), while others use broad activity limitations (for example, Mitra 2008) or work limitations (for example, Loeb et al. 2008). The association between disability and poverty is not independent of the disability measure under use and the disabled population included in analysis (overall population with disabilities, all adults, and working-age adults). For instance, when disability is measured through a work limitation question, one expects the earnings handicap to be more pronounced than when disability is measured through functional limitations. Employment or income/expenditures indicators are expected to be worse for persons with disabilities identified through work limitations than for persons with disabilities identified through functional limitations. Another example comes out of a study in India: the World Bank (2009) finds a strong association between household consumption poverty and disability when persons with disabilities are identified by the community, but only a weak correlation when disability is measured through activities of daily living.
As a result, despite a growing body of research in developing countries, there remains little certainty that persons with disabilities and their families are more likely to face adverse socioeconomic outcomes than those without disabilities. This paper attempts to shed a new light to this literature by documenting the socio-economic outcomes of persons with disabilities in 15 developing countries using comparable data and methods across countries. This study adds to the descriptive body of research. Given the cross-sectional nature of the data, it is important to keep in mind that this paper is no more than descriptive and cannot be used in any way to demonstrate any of the causal pathways that may link disability and poverty.
13 It should be noted that five of the studies above have been conducted by the same organization (SINTEF) and use the same disability measures in the five countries: Eide et al. 2003a (Zimbabwe) and 2003b (Namibia), Eide and Loeb (2006) (Zambia), Eide and Kamaleri 2009 (Mozambique), and Loeb and Eide 2004 (Malawi). The former two studies are, however, not strictly comparable to the latter three in terms of sample design. If one focuses on the former three studies, which are comparable, results vary; for instance, households with disabilities are found to have worse living conditions in Eide and Kamaleri 2009 (Mozambique) and Loeb and Eide 2004 (Malawi), but not in Eide and Loeb 2006 (Zambia).
17
3. DATA AND MEASURES
3.1 The World Health Survey
This study uses a unique data set, the WHS.14 To the best of the knowledge of the authors, the WHS is the first source of disability data that is comparable across a significant number of countries and that also includes several indicators of economic well-being. The WHS was implemented in 70 developed and developing countries in 2002-2004 and data became publicly available in 2007. The primary objective of the WHS was to collect comparable health data across countries (Üstün et al. 2003). It used a common survey instrument in nationally representative populations with different modules to assess the health of individuals in various domains, health system responsiveness, and household expenditures on health care and living conditions.
In all the countries included in this study, the WHS followed a stratified sample design with weights.15 For each household, one household informant responded to a household questionnaire including questions on household expenditures, living conditions, assets, and household demographics (size and number of children). In addition, within each household, an individual respondent of 18 years of age or older was selected randomly using Kish tables (Kish 1965). That person then responded to an individual-level questionnaire, including questions about his/her own demographic characteristics, disability and health, employment, and education. Because only one individual respondent was chosen per household, the individual sample size is the same as the household sample size.
There are several differences in the WHS survey questionnaires used in high income countries compared to those used in low and middle income countries. In particular, the individual-level questionnaire came in two versions: a long version for low and middle income countries, and a short version for high income countries. The long version has more health and disability related questions than the short version. In addition, some sections of the household-level questionnaires were adapted to the low, middle, and high income country context: of relevance to this study, some items in the list of permanent income indicators (assets and selected living conditions) are different for the two groups of countries. For example, having electricity and owning a clock are included in the questionnaire for low and middle income countries, but not in the questionnaire for high income countries. This study, although it is focused on low and middle income countries, is somewhat affected by these differences in questionnaires between high income countries and low and middle income countries. For instance, for three upper middle income countries covered in this study (Brazil, Mauritius, and Mexico) the household
14 Documentation on the WHS is available at: http://www.who.int/healthinfo/survey/en/index.html The WHS questionnaires are available at: http://www.who.int/healthinfo/survey/instruments/en/index.html 15 Out of the 70 countries where the WHS was fielded, 60 countries used a complex sample design and 10 countries used random sampling.

18
questionnaire of high income countries was used. This affects only one of the survey items studied below in the analysis of household economic wellbeing.16
This study focuses on working-age individual respondents aged 18 to 65.17 It covers 15 developing countries,18 including seven countries in Africa (Burkina Faso, Ghana, Kenya, Malawi, Mauritius, Zambia, and Zimbabwe), four countries in Asia (Bangladesh, Lao PDR, Pakistan, and the Philippines), and four countries in Latin America and the Caribbean (Brazil, Dominican Republic, Mexico, and Paraguay). It is essential to note that these developing countries may not be representative of all developing countries. They were chosen from the WHS sub-sample of 40 developing countries based on the following considerations. First, three countries - Comoros, Congo, and Cote d’Ivoire - were excluded due to civil unrest at the time of the survey and related authors’ concerns over the quality of the data. Second, in three countries - Turkey, Mali, and Morocco - key economic indicators were not collected and hence they could not be covered by the study. In six countries - China, Malaysia, Myanmar, United Arab Emirates, Uruguay, and Senegal - the sample of working-age persons with disabilities was small. Given the concern that the descriptive profile of persons with disabilities might suffer from limited statistical power, these countries were not included. For the rest of the countries, missing data was analyzed. Missing data rates varied across countries from 0 percent to 25 percent for selected disability and economic indicator questions. An analysis of missing data was conducted to assess to what extent data on economic indicators was missing randomly across disability status.19 As a result of this analysis, 13 more countries were excluded: Chad, Ecuador, Ethiopia, Guatemala, India, Mauritania, Namibia, Nepal, South Africa, Sri Lanka, Swaziland, Tunisia, and Vietnam.
3.2 Countries in the Study
The countries included in this study vary greatly in their level of development: eight of them are low income countries (Bangladesh, Burkina Faso, Ghana, Kenya, Lao PDR, Malawi, Zambia, and Zimbabwe); three are lower middle income countries (Pakistan, Paraguay, and the Philippines) and four are upper middle income countries (Brazil, the
16 For Brazil, Mauritius, and Mexico, to compute the asset index, information on having electricity was not available. Instead, owning a VCR/DVD was included. 17 Although data is available on the elderly, disability in old age is beyond the scope of this study given that some of the economic indicators are only relevant for the working-age population. Needless to say, the disability in old age may increase the risk of poverty possibly through extra costs, the increased need for a long-term care and foregone earnings for caretakers. It needs to be the subject of further research. 18 For all the countries included in this study, data was collected in 2003. 19 For each country, non-random bias in missing data was checked in two ways. First, logistic regressions were run of the probability of having missing data on an economic indicator. Three dependent variables were used in turn: having missing data on assets, household expenditures, and employment. For each of the three regressions, independent variables included a dummy variable for disability status, age, age squared, marital status, and education; and a dummy variable for rural residence. Second, a logistic regression of missing data on disability against economic well-being (expenditures or assets) and household-level controls (household size, dummies for rural residence, household head’s gender and marital status) was run. Two dependent variables were used in turn: having missing data on the base disability measure and the expanded disability measure (see section on disability measures using WHS data). Considering results for the coefficients of relevant variables in these regressions, as well as missing data rates on economic indicators and disability measures, it was assessed that non-random missing data was a concern for 13 countries that were, therefore, excluded from this study.
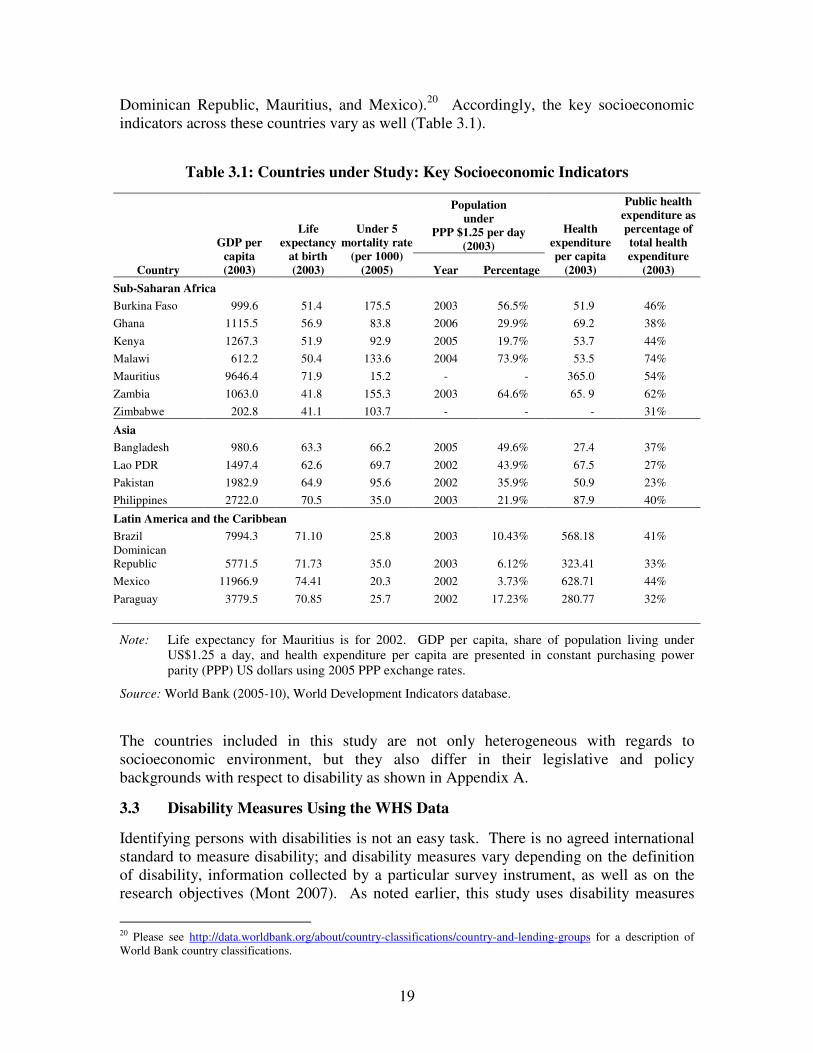
19
Dominican Republic, Mauritius, and Mexico).20 Accordingly, the key socioeconomic indicators across these countries vary as well (Table 3.1).
Table 3.1: Countries under Study: Key Socioeconomic Indicators
Country
GDP per capita (2003)
Life expectancy
at birth (2003)
Under 5 mortality rate
(per 1000) (2005)
Population under
PPP $1.25 per day (2003)
Health expenditure per capita
(2003)
Public health expenditure as percentage of total health expenditure
(2003) Year Percentage
Sub-Saharan Africa
Burkina Faso 999.6 51.4 175.5 2003 56.5% 51.9 46%
Ghana 1115.5 56.9 83.8 2006 29.9% 69.2 38%
Kenya 1267.3 51.9 92.9 2005 19.7% 53.7 44%
Malawi 612.2 50.4 133.6 2004 73.9% 53.5 74%
Mauritius 9646.4 71.9 15.2 - - 365.0 54%
Zambia 1063.0 41.8 155.3 2003 64.6% 65. 9 62%
Zimbabwe 202.8 41.1 103.7 - - - 31%
Asia
Bangladesh 980.6 63.3 66.2 2005 49.6% 27.4 37%
Lao PDR 1497.4 62.6 69.7 2002 43.9% 67.5 27%
Pakistan 1982.9 64.9 95.6 2002 35.9% 50.9 23%
Philippines 2722.0 70.5 35.0 2003 21.9% 87.9 40%
Latin America and the Caribbean
Brazil 7994.3 71.10 25.8 2003 10.43% 568.18 41% Dominican Republic 5771.5 71.73 35.0 2003 6.12% 323.41 33%
Mexico 11966.9 74.41 20.3 2002 3.73% 628.71 44%
Paraguay 3779.5 70.85 25.7 2002 17.23% 280.77 32%
Note: Life expectancy for Mauritius is for 2002. GDP per capita, share of population living under US$1.25 a day, and health expenditure per capita are presented in constant purchasing power parity (PPP) US dollars using 2005 PPP exchange rates.
Source: World Bank (2005-10), World Development Indicators database.
The countries included in this study are not only heterogeneous with regards to socioeconomic environment, but they also differ in their legislative and policy backgrounds with respect to disability as shown in Appendix A.
3.3 Disability Measures Using the WHS Data
Identifying persons with disabilities is not an easy task. There is no agreed international standard to measure disability; and disability measures vary depending on the definition of disability, information collected by a particular survey instrument, as well as on the research objectives (Mont 2007). As noted earlier, this study uses disability measures
20 Please see http://data.worldbank.org/about/country-classifications/country-and-lending-groups for a description of World Bank country classifications.

20
that reflect the ICF definition of disability. It uses the questions from the Health State Description module of the WHS. This module has a number of questions on functional and activity limitations and participation restrictions which are consistent with the ICF conception of disability and categorization of these components, as well as questions on overall health, difficulties related to pain and discomfort, and sleep and affect that can be used to measure disability. In constructing the measures, the study follows the recommendations of the United Nations Washington Group on Disability Statistics (the Washington Group hereafter).21 The Washington Group has developed, tested (Miller et al. 2010) and made recommendations for a short and a long list of questions on disability to be included in censuses and household surveys. This study uses two disability measures: a base measure and an extended measure of disability, based on two sets of questions from the WHS that match, as much as possible, the short and long lists of questions of the Washington Group as presented in Tables 3.2 and 3.3.
The base measure of disability used in the study is built by selecting WHS questions that best match the Washington Group’s short list of questions. It includes four questions related to: difficulty in seeing/recognizing people across the road (while wearing glasses/lenses); difficulty in moving around; difficulty in concentrating or remembering things; and difficulty with self care. In the WHS, for each difficulty, individuals could respond on a scale of 1 to 5 as follows: 1 - no difficulty, 2 - mild difficulty, 3 - moderate difficulty, 4 - severe difficulty, and 5 - extreme difficulty/unable to do. For the purpose of this study, if a person reports a severe or extreme/unable to do difficulty in any of the above four questions, he or she is identified as having a disability. Thus, the analysis focuses on economic status of person who in the WHS reported experiencing severe or extreme difficulties in certain domains of functioning, leaving aside mild or moderate difficulties.22 “Mild” and “Moderate” response categories have not fared well in cognitive testing (Miller 2003) and are therefore not used in this study. This base measure of disability represents a combined measure of impairments through functional limitations (seeing and concentrating) and of activity limitations/participation restriction (moving around,23 self care).
21 In June 2001, the United Nations International Seminar on the Measurement of Disability recommended that principles and standard forms for indicators of disability be developed (United Nations 2009). There was a broad consensus on the need for population-based measures of disability for country use and for international comparisons. The Washington Group on Disability Statistics was formed to address this need. The main purpose of the Washington Group is to promote and coordinate international cooperation in the area of disability measures. Specifically, the Washington Group aims to guide the development of a short set of disability questions for use in censuses and national surveys in order to inform policy on equalization of opportunities. A second priority is to recommend one or more extended sets of questions to measure disability to be used as part of population surveys or as supplements to special surveys. Information on the Washington Group is available at http://unstats.un.org/unsd/methods/citygroup/washington.htm. 22 Sample size for individuals with extreme/unable to do difficulty was too small to separate the analysis for those with severe difficulty, on the one hand, and those with extreme/unable to do difficulty, on the other. 23 It should be noted that the “moving around” question is problematic and may be understood differently across respondents. It does not specify whether it refers to upper or lower body mobility, or both. What if someone cannot walk at all but has plenty of mobility above the waist? How respondents answer this question would be very different depending on what they think "moving around" means.
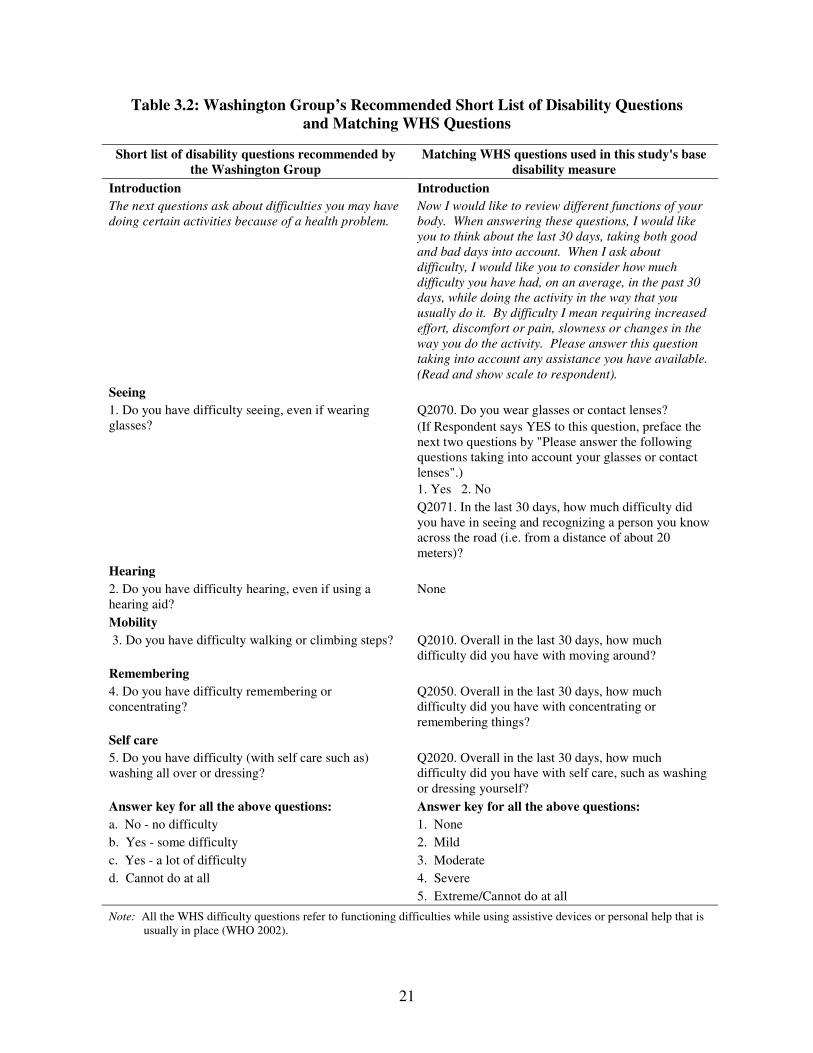
21
Table 3.2: Washington Group’s Recommended Short List of Disability Questions and Matching WHS Questions
Short list of disability questions recommended by the Washington Group
Matching WHS questions used in this study's base disability measure
Introduction Introduction
The next questions ask about difficulties you may have
doing certain activities because of a health problem.
Now I would like to review different functions of your
body. When answering these questions, I would like
you to think about the last 30 days, taking both good
and bad days into account. When I ask about
difficulty, I would like you to consider how much
difficulty you have had, on an average, in the past 30
days, while doing the activity in the way that you
usually do it. By difficulty I mean requiring increased
effort, discomfort or pain, slowness or changes in the
way you do the activity. Please answer this question
taking into account any assistance you have available.
(Read and show scale to respondent).
Seeing
1. Do you have difficulty seeing, even if wearing glasses?
Q2070. Do you wear glasses or contact lenses? (If Respondent says YES to this question, preface the next two questions by "Please answer the following questions taking into account your glasses or contact lenses".) 1. Yes 2. No
Q2071. In the last 30 days, how much difficulty did you have in seeing and recognizing a person you know across the road (i.e. from a distance of about 20 meters)?
Hearing
2. Do you have difficulty hearing, even if using a hearing aid?
None
Mobility
3. Do you have difficulty walking or climbing steps? Q2010. Overall in the last 30 days, how much difficulty did you have with moving around?
Remembering
4. Do you have difficulty remembering or concentrating?
Q2050. Overall in the last 30 days, how much difficulty did you have with concentrating or remembering things?
Self care
5. Do you have difficulty (with self care such as) washing all over or dressing?
Q2020. Overall in the last 30 days, how much difficulty did you have with self care, such as washing or dressing yourself?
Answer key for all the above questions: Answer key for all the above questions:
a. No - no difficulty 1. None
b. Yes - some difficulty 2. Mild
c. Yes - a lot of difficulty 3. Moderate
d. Cannot do at all 4. Severe
5. Extreme/Cannot do at all
Note: All the WHS difficulty questions refer to functioning difficulties while using assistive devices or personal help that is usually in place (WHO 2002).

22
Table 3.3: Washington Group’s Recommended Long List of Disability Questions and Matching WHS Questions
Long list of disability questions recommended by the Washington Group
Matching WHS questions used in this Study's expanded disability measure
Vision
1. Do you have difficulty seeing and recognizing a person you know from 7 meters (20 feet) away? 2. Do you have difficulty seeing and recognizing an object at arm’s length?
Q2070. Do you wear glasses or contact lenses? (If Respondent says YES to this question, preface the next two questions by "Please answer the following questions taking into account your glasses or contact lenses".) 1. Yes 2. No Q2071. In the last 30 days, how much difficulty did you have in seeing and recognizing a person you know across the road (i.e. from a distance of about 20 meters)? Q2072. In the last 30 days, how much difficulty did you have in seeing and recognizing an object at arm’s length or in reading?
Hearing
1. Do you have difficulty hearing someone talking on the other side of the room in a normal voice? 2. Do you have difficulty hearing what is said in a conversation with one other person in a quiet room?
None
Mobility
1. Do you have difficulty moving around inside your home? 2. Do you difficulty going outside of your home? 3. Do you have difficulty walking a long distance such as a kilometer (or equivalent)?
Q2010. Overall in the last 30 days, how much difficulty did you have with moving around?
Remembering
1. Do you have difficulty concentrating on doing something for 10 minutes? 2. Do you have difficulty remembering to do important things?
Q2050. Overall in the last 30 days, how much difficulty did you have with concentrating or remembering things?
Self care
1. Do you have difficulty washing your whole body? 2. Do you have difficulty getting dressed? 3. Do you have difficulty feeding yourself? 4. Do you have difficulty staying by yourself for a few days?
Q2020. Overall in the last 30 days, how much difficulty did you have with self care, such as washing or dressing yourself?
Communicating
1. Do you have difficulty generally understanding what people say? 2. Do you have difficulty starting and maintaining a conversation? 3. Do others generally have difficulty understanding you?
None
(Continued)
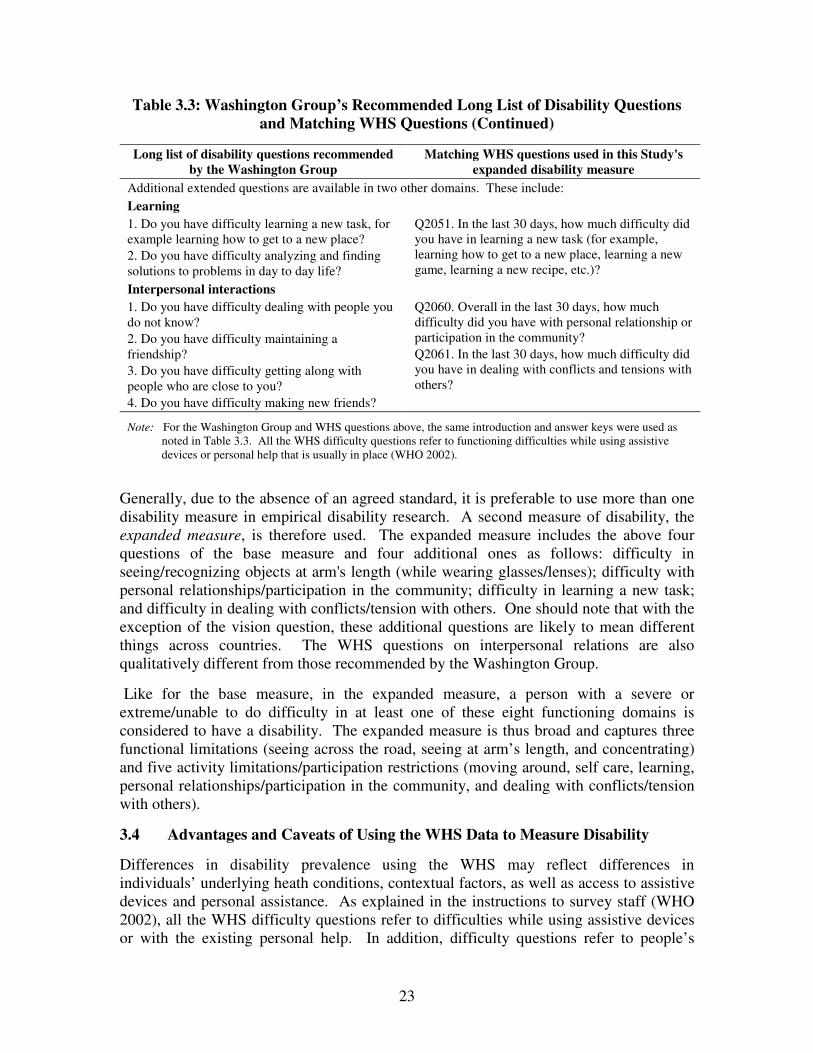
23
Table 3.3: Washington Group’s Recommended Long List of Disability Questions and Matching WHS Questions (Continued)
Long list of disability questions recommended by the Washington Group
Matching WHS questions used in this Study's expanded disability measure
Additional extended questions are available in two other domains. These include:
Learning
1. Do you have difficulty learning a new task, for example learning how to get to a new place? 2. Do you have difficulty analyzing and finding solutions to problems in day to day life?
Q2051. In the last 30 days, how much difficulty did you have in learning a new task (for example, learning how to get to a new place, learning a new game, learning a new recipe, etc.)?
Interpersonal interactions
1. Do you have difficulty dealing with people you do not know? 2. Do you have difficulty maintaining a friendship? 3. Do you have difficulty getting along with people who are close to you? 4. Do you have difficulty making new friends?
Q2060. Overall in the last 30 days, how much difficulty did you have with personal relationship or participation in the community? Q2061. In the last 30 days, how much difficulty did you have in dealing with conflicts and tensions with others?
Note: For the Washington Group and WHS questions above, the same introduction and answer keys were used as noted in Table 3.3. All the WHS difficulty questions refer to functioning difficulties while using assistive devices or personal help that is usually in place (WHO 2002).
Generally, due to the absence of an agreed standard, it is preferable to use more than one disability measure in empirical disability research. A second measure of disability, the expanded measure, is therefore used. The expanded measure includes the above four questions of the base measure and four additional ones as follows: difficulty in seeing/recognizing objects at arm's length (while wearing glasses/lenses); difficulty with personal relationships/participation in the community; difficulty in learning a new task; and difficulty in dealing with conflicts/tension with others. One should note that with the exception of the vision question, these additional questions are likely to mean different things across countries. The WHS questions on interpersonal relations are also qualitatively different from those recommended by the Washington Group.
Like for the base measure, in the expanded measure, a person with a severe or extreme/unable to do difficulty in at least one of these eight functioning domains is considered to have a disability. The expanded measure is thus broad and captures three functional limitations (seeing across the road, seeing at arm’s length, and concentrating) and five activity limitations/participation restrictions (moving around, self care, learning, personal relationships/participation in the community, and dealing with conflicts/tension with others).
3.4 Advantages and Caveats of Using the WHS Data to Measure Disability
Differences in disability prevalence using the WHS may reflect differences in individuals’ underlying heath conditions, contextual factors, as well as access to assistive devices and personal assistance. As explained in the instructions to survey staff (WHO 2002), all the WHS difficulty questions refer to difficulties while using assistive devices or with the existing personal help. In addition, difficulty questions refer to people’s

24
experience in the actual context in which they live, which will vary from one community to the next and of course from country to country.
Compared to earlier research on disability prevalence and economic status of disabled people in developing countries (Filmer 2008), the major advantage of the WHS is that disability related questions were identically formulated and sequenced across countries. It could, however, still be argued that the WHS collects self-reports to estimate disability, and that the comparison of self-reported questions may suffer from cultural biases across countries, especially for the broad questions used in the expanded disability measure that could be subject to different interpretations (personal relationships/participation in the community, or dealing with conflicts/tension with others). The WHS survey instrument was translated into several languages using cognitive interviews and cultural applicability tests and psychometric tests for reliability. In general, the use of self-reported measures for disability has been considered to be valuable in attempts to better understand experiences of morbidity in general, and disability in particular (Murray and Chen 1992). Moreover, only self-reported data is available; there is no disability data that would be based on an objective assessment. Finally, the use of self-reports to estimate disability prevalence and socioeconomic status of persons with disabilities has been criticized on the basis that self-reported measures could be biased and endogenous to some economic outcomes such as employment. However, there is evidence (Benitez-Silva et al. 2000) showing that disability self-reported indicators are reasonable predictors of a person’s objective health status, in particular if disability measures are not work limitations.
The WHS presents limitations when it comes to measuring disability prevalence. The WHS-based disability measures may underestimate disability prevalence, because it does not cover two limitations included in the Washington Group’s recommended lists of questions: limitation in hearing and limitation in communicating. If available, the former limitation would be included in the base and expanded disability measures, and the latter limitation would be included in the expanded disability measure so as to follow the Washington Group’s recommendations. Finally, it should be noted that, like many other surveys, WHS does not include the institutionalized population. The results of this study are underestimates or overestimates of the extent of poverty among persons with disabilities if persons with disabilities in institutions are disproportionately more/less deprived that those covered in this study. It should however be noted that in developing countries, rates of institutionalization tend to be low.
On the other hand, there are two reasons to expect that WHS-based disability measures may overestimate disability prevalence. The introduction to the section containing questions on difficulties in functioning does not explain that reported limitations or restrictions need to be related to a “health problem”, as the introduction to the questions of the Washington Group does. For instance, a person who experienced noise with construction and traffic in his/her neighborhood might report a difficulty concentrating while this is only due to an environmental problem, not a health condition/impairment problem. This might lead to an over-identification of persons with disabilities in the WHS. In addition, one has to bear in mind that respondents were asked to report difficulties during the last 30 days prior to the interview, which might give rise to an upward bias in estimating disability prevalence. Indeed, acute and short-term health conditions not resulting in impairment might have been reported. For instance, an

25
individual bedridden because of flu or someone who recently broke a leg, might have reported a severe difficulty in moving around, and would thus be counted as having a disability, while they are in fact experiencing a temporary functional limitation associated with a short-term health condition.
3.5 Economic Dimensions of Well-being at the Individual Level
This study investigates economic well-being among persons with disabilities and compares it with economic well-being of persons without disabilities. Measuring economic well-being and identifying the poor is no less difficult than identifying persons with disabilities and measuring disability prevalence. Several dimensions of well-being at both individual and household levels are analyzed to draw country level profiles of economic well-being and poverty across disability status. Table 3.4 presents a summary of different dimensions of economic well-being and related indicators used in the study.
Table 3.4: Dimensions of Economic Well-being and Related Indicators
Dimensions of economic well-being Indicators Individual economic well-being
- Education 1. Years of schooling 2. Completed primary education
- Employment (working for pay) Employed Household economic well-being
- Assets/Living conditions 1. Asset index 2. Belongs to the bottom quintile of the asset index distribution
- Household expenditures 1. Monthly non-health PCE 2. Belongs to the PCE bottom quintile 3. Daily PCE under US$1.25 a day 4. Daily PCE under US$2 a day
- Expenditures on health services Ratio of monthly health household expenditures to monthly total household expenditures
At the individual level, two dimensions of economic well-being are included: education and employment. While health is a dimension of well-being which has increasingly received attention (Banerjee, et al. 2004), it is not included in this study, because disabled people are assumed to experience worse health relative to the rest of the population. As noted earlier, according to the ICF, having a health condition is a necessary condition for disability (WHO 2001, p. 213). The objective of this study is then to determine if this group is worse off along other dimensions of well-being. The education dimension is measured by the years of completed schooling and whether a person has completed primary school. The employment is measured through the employment status, where employment means working for pay. Ideally, one would need to have more data at the individual level to study the economic well-being of persons with disabilities. However, no other dimension at the individual level can be measured using the WHS.24
24 Several variables of economic well-being such as sibling survivorship and safety in the community are available in the WHS, but data is largely missing for some of the countries included in this study.
26
3.6 Economic Dimensions of Well-being at the Household Level
Before describing the economic dimensions of well-being that can be measured at the household level, a cautionary note is needed. At the household level, because of the sample design, the WHS presents important limitations to measuring well-being of households with disabilities. Because not all household members were asked about their health and disability, there are some false negatives in the identification of the disability status of households. Some households with disabilities are not identified as such because the individuals with disabilities in these households were not the individual respondents. In addition, the WHS does not cover the health and disability of the children in the household. As a result, the comparison group, households without disabilities (referred to as “other households” thereafter) might in fact include adults or children with disabilities. If there are disparities in household economic well-being to the disadvantage of households with disabilities, results using the WHS may underestimate the true extent of disparities and the description of disparities may be biased downward.25 It is not possible to estimate the extent of this bias. In light of this limitation, results of this study on disparities between households with an adult with a disability and other households should be treated with caution.
In this study, several aspects of a household’s economic well-being are explored. The first one is the asset ownership and living conditions measured by an index calculated using a method developed by Filmer and Pritchett (2001). The asset variables include ownership of a bike, a car, a refrigerator, a fixed-line telephone, a cell phone, a television set, and a computer. Living condition variables include building quality (high-quality floor and wall materials), water source (from pipes, from protected wells, and from unprotected sources), type of toilet (flush, latrine, other/none), and use of a gas or electric cooking stove. Each variable is weighted using the corresponding eigenvector for the first principal component, found by a principal component analysis. The index scores are normalized to range from zero to 100 by subtracting the minimum score of the sample from the score of each observation, dividing by the range of scores for the sample, and multiplying by 100. It should be noted that one cannot make cross-country comparisons of the asset index, only comparison across disability status within countries. An
25 Let us assume we know actual disability prevalence for a country of 1,000 individuals. At the individual level, disability prevalence stands at 10 percent. At the household level, the 1000 individuals live in 300 households and 60 households have one or more individuals with disabilities, thus household level disability prevalence is 60/300 = 20%. A survey is conducted using a design similar to WHS. We assume that the survey was successfully implemented with Kish tables to select one individual out of every sampled household. Following from this assumption, at the individual level, the estimated prevalence is equal to the actual prevalence of 10 percent. At the household level, due to the survey design, we get the same prevalence as at the individual level because every household is represented by one individual that is labeled disabled or non-disabled. At the household level, we therefore also estimate 10-percent prevalence: we have 10 percent of households with disabilities, whom we compare to the remaining 90 percent. In fact, this 90 percent actually consists of some households that do not have a disability (80 percent) and some households that have disabilities but are excluded from the disabled group by error (remaining 10 percent to make the full 20 percent of households with disabilities). Our two constructed groups of households with/without disabilities are more similar to each other than the actual two groups of households with/without a disability. Estimated differences between the constructed groups of households will be biased toward zero. We will see this in our results, as the household-level indicators do tend to be more similar across disability status than the individual-level ones.
27
additional indicator is used to show whether the household belongs to the bottom quintile of the asset index distribution, as it has been done in previous studies (for example, Filmer 2008).
The second dimension of economic well-being at the household level is household expenditures. The main indicator to measure this dimension is non-health PCE. Recent evidence suggests that including expenditures on health in overall household expenditures leads to an underestimate of the extent of poverty in developing countries (van Doorslaer et al. 2006). Furthermore, given that additional health expenditures might be associated with disability status, it is all the more important to subtract health expenditures from reported total household expenditures before comparing household expenditure levels to poverty lines. The PCE indicator is further used in terms of a household belonging to the bottom PCE quintile. In addition, the PCE is used to calculate poverty rates at international poverty lines of PPP US$1.25 a day (extreme poverty) and PPP US$2 a day (poverty) at the latest (2005) purchasing PPP exchange rates. Here, three standard poverty indicators are estimated: poverty headcount (H), poverty gap (P1), and poverty severity (P2) (Foster, et al. 1984; Ravallion 1992).26 Thus, as shown in Table 3.4 above, four indicators based on PCE are used in this study to measure the household-level expenditure dimension of economic well-being: PCE, belonging to the bottom PCE quintile, daily PCE is below US$1.25, and daily PCE is below US$2.
Several issues should be noted with regards to using household (non-health) expenditures as a dimension of economic well-being in the context of this study. First, as pointed earlier, if poverty is measured through PCE against a poverty line, the comparison of households with a disability to other households may be biased due to the conversion handicap: households with disabilities may have additional (non-health)27 needs and hence expenditures (for example, transportation, personal assistance) due to the disability. Evidence on the additional costs of living with a disability is available only in very few developing countries (Braithwaite and Mont 2009 (Vietnam and Bosnia and Herzegovina)). To estimate the extra cost of disability, one would need more detailed data on household expenditures than is the case with the WHS. Second, there is a possibility that the intra-household distribution of expenditures is unequal across disability status. For these two reasons, PCE may not be an accurate indicator of economic disparities between persons with and without disabilities. In contrast, assets or living conditions, at least the ones included in this study as described earlier, can be, to a large extent, considered as household common goods, so the issue of intra-household distribution is less likely to arise. Third, the WHS might have underestimated household expenditure across the board by only collecting summary data on household
26 The poverty headcount (H), or poverty rate, is simply the number of families identified as poor divided by the total number in the population of interest. The poverty gap (P1) equals the summed amount that household income falls under the poverty line (as a proportion of the poverty line) divided by the total number in the population. In order to better analyze levels of inequality across poor households the poverty
severity (P2) is calculated. It equals the square of the amount that household income falls under the poverty line (as a proportion of the poverty line) divided by the total number in the population. 27 As explained earlier, health expenditures have been subtracted from total household expenditures to calculate PCE.
28
expenditures. Expenditures over the last month were collected as a total and also for six expenditure categories (food, housing, education, healthcare, insurance premiums, and other goods and services). This is a very succinct set of expenditure questions compared to those in household surveys such as the Living Standard Measurement Survey (LSMS) that aim at measuring living standard through household expenditures. For instance, the WHS did not include a diary of household expenditure/consumption or information on the consumption in kind, which in developing countries represents a significant fraction of consumption. For these reasons, results from the study of household expenditures across disability status using the WHS should be treated with a lot of caution.
Finally, the last dimension of economic well-being examined in this study concerns the expenditure of health services. Due to their underlying health condition, persons with disabilities and their households may consume more health services. This dimension is measured by one indicator: the ratio of monthly health expenditures to monthly total household expenditures. The WHS collected data on total household spending on health care and therefore this ratio suffers from several limitations as an indicator of health spending because of disability.
On the one hand, the spending on health care reported in WHS may be overstated, because the questions about difficulties did not differentiate between acute short-term health conditions and longer-lasting health conditions and health care needs related to disability. On the other hand, reported spending might be low not because the needs were low, but because of low capacity to pay for the care and/or lack of services – if there are no services, no spending would be incurred, irrespective of the need and/or capacity to pay. Also, to the extent that the WHS may underestimate true total household expenditure, as discussed above, this ratio may be overstated. Furthermore, this indicator does not tell anything about intra-household distribution of spending on health services, which may be to the detriment of a person with disability in the household. Therefore, one should keep in mind these limitations when interpreting the results.
3.7 Multidimensional Poverty Measures
In addition to the individual and household-level measures of economic status and poverty described above, this study also estimates multidimensional poverty measures, using the methods recently developed by Alkire and Foster (2009) and Bourguignon and Chakravarty (2003). The latter method is used as part of robustness checks.
The Alkire and Foster method is a dual cutoff method that is used to estimate a multidimensional poverty measure across d dimensions of economic well-being. Dimensions are weighted: wj is the weight of dimension j. Each individual i has a weighted count of dimensions where that person is deprived (ci) across all measured
dimensions: 0 ≤ ci ≤ d; where ∑=
=
d
j
ijji cwc1
with ijc a binary variable equal to one if
individual i is deprived in dimension j, and zero otherwise. Dimensions can rely on ordinal and/or cardinal data.
29
Let qi be a binary variable equal to one if the person is identified as poor, and to zero otherwise. A person is identified as poor if the person’s count of deprivations is greater than some specified cutoff (k):
if ci ≥ k, then qi = 1 if ci < k, then qi = 0
The headcount ratio for a given population is then the number of poor persons (q=Σqi) divided by the total population (n):
H = q/n
To capture the breadth of deprivation experienced by the poor, in other words, the experience of deprivation in several dimensions, the average number of deprivations that a poor person faces is computed. The total number of deprivations experienced by poor people c(k) is calculated as follows:
c(k)= Σ(qici) for i = 1…n.
The average deprivation share is the total number of deprivations of the poor (c(k)) divided by the maximum number of deprivations that the poor could face (qd):
A = c(k)/(qd)
Alkire and Foster’s (2009) multidimensional poverty measure M0, or adjusted headcount
ratio, combines information on the prevalence of poverty and the breadth of poverty, combining the headcount ratio and average deprivation share:
M0 = HA = c(k)/(nd)
The number of poor persons (q) falls out of the right side of the equation, leaving the ratio of total deprivations experienced by the poor to the total possible deprivations that the entire population could experience. M0 can equivalently be expressed as the weighted average of headcount ratios for dimensions j (Hj):
∑=
=
d
j
jj
d
HwM
10
It is important to note that this method has a number of limitations, including the following. First, the three measures above (H, A and M0) are a function of the weights wj allocated arbitrarily to dimensions. Thus, any poverty calculation using this framework is sensitive to the assumptions used in setting weights. Second, this method is also sensitive to the selection of dimensions and there is no guidance on how to select them. Furthermore, this method also requires that cutoffs are set. A cutoff needs to be set for each dimension. Deciding on a specific cutoff point is an arbitrary choice, albeit likely to be an informed one. Another challenge with this method is to identify the cutoff across dimensions k or k/d - the share of dimensions whereby one needs to experience deprivation. As noted in Alkire and Foster (2009), “setting k establishes the minimum eligibility criteria for poverty in terms of breadth of deprivation and reflects a judgment regarding the maximally acceptable multiplicity of deprivations” (p. 27). This judgment is based on expert opinion and seems particularly difficult to make in a cross-country study such as this one. This study uses k/d=40%, in other words, an individual needs to be deprived in 40 percent of the dimensions in order to be considered poor.

30
In this study, several multidimensional poverty measures are presented as a complement to the use of the PCE as welfare aggregate for poverty estimates, as well as to several indicators of economic well-being of persons and households with disabilities. For the purpose of this study, multidimensional poverty measures provide useful additional information on the economic well-being of persons with disabilities compared to those without disabilities. Since multidimensional poverty measures require assumptions for the selection of dimensions, weights and thresholds, it will be essential to assess the sensitivity of the results with respect to some of these choices.
Based on the information available in the WHS, 10 indicators were selected for the calculation of the multidimensional poverty measures: two indicators for individual economic well-being (education and employment), two for household expenditure (non-health PCE and ratio of health to total expenditures), and six indicators for assets and living condition (Alkire and Santos 2010). These six indicators include an indicator which covers the ownership of some consumer goods: car, television, telephone, refrigerator, bicycle, dishwasher, washing machine, and computer; three standard Millennium Development Goal (MDG) indicators (access to clean drinking water, sanitation, and the use of clean cooking fuel); and two non-MDG indicators: electricity and flooring material.
Each dimension’s indicators and weights are presented in Table 3.5. As explained earlier, the estimates of the household-level indicators should be treated with caution due to the WHS data issues explained earlier.
Table 3.5: Dimensions and Weights in the Multidimensional Poverty Measure
Dimensions of economic well-being Indicators and deprivation threshold (weights)
Individual economic well-being (1/3)
- Education Did not complete primary education (1/6)
- Employment Is not employed (1/6)
Household economic well-being
- Assets/living conditions (1/3)
Household does not have a car or any two of the other assets (TV, phone, refrigerator, bicycle, dish washer, washing machine, computer) (1/18)
Household does not have electricity (1/18)
Household's water source is not a protected pipe or well or is at least 30 minutes away (1/18)
Household does not have a covered latrine or flush toilet or the toilet facilities are shared (1/18)
Household's floor is dirt, sand, or dung (1/18)
Household's cooking fuel is wood, charcoal, or dung (1/18)
- Household expenditure (1/3)
Daily PCE under US$2 a day (1/6)
- Expenditure on health services Ratio of monthly health expenditure to monthly total expenditure is more than 10 percent (1/6)
31
The individual economic indicators are weighted at one third (education and employment at one sixth each). The household expenditure indicators are weighted at one third (PCE and the ratio of health to total expenditures at one sixth each). And, the assets and living conditions are weighted at one third, with each of the six items weighted at 1/18. The cutoffs for the dimensions are as follows: if a person (1) has less than primary education; (2) is not employed; (3) lives in a household where 10 percent or more of household expenditures are health expenditures;28 (4) PCE is below the international poverty line (PPP US$2 a day); (5) no one has a car/truck or any two of the other assets (TV, radio, phone, refrigerator, bicycle, dish washer, washing machine, and motorcycle); (6) there is no electricity; (7) water source is not a protected pipe or well or is at least 30 minutes away; (8) there is not a covered latrine or flush toilet or the toilet facilities are shared; (9) the floor is dirt, sand, or dung; and (10) cooking fuel is wood, charcoal, or dung.
A number of robustness checks were conducted, but only some of them are reported below. First, more restrictive thresholds were used for two of the dimensions: for PCE, the US$1.25 a day poverty line was used instead of US$2 a day. For the ratio of health to total expenditures, a person was considered to be deprived if the ratio was above 15 percent instead of 10 percent in the base case. Second, the values for the share of dimensions where an individual needs to be deprived to be considered poor (k/d) was changed to 30 percent. A third robustness check was performed by dropping the indicator for PCE from the calculations and redistributing weights equally across the remaining nine dimensions. It was decided to drop the PCE indicator due to WHS data limitations as explained earlier.
In a final robustness check, the method developed by Bourguignon and Chakravarty (2003) was used to calculate another set of multidimensional poverty measures. Similar to the previous method, this method uses a dual-cutoff, with the authors considering an individual poor, if she falls under the poverty line in any dimension. In order to present this measure in a context similar to the Alkire and Foster method described above, this study deviates from the original Bourguignon and Chakravarty implementation and uses a multidimensional poverty line of k/d=50% (that is, an individual is poor if he/she falls under two out of four dimensional poverty lines).29
The Bourguignon and Chakravarty method requires the use of continuous variables, which allows the computation of dimensional poverty gap and poverty severity. A multidimensional gap and poverty severity is computed by taking the weighted average of the respective dimensional gaps and poverty severity. Four economic indicators are used in this measure: years of schooling, PCE, health to total expenditure ratio, and the asset index. Dimensional poverty thresholds are as follows: (1) individual has less than five years of education; (2) PCE is below the international poverty line (PPP US$2 a
28 There is no consensus in the literature on the catastrophic threshold and cut-off for health expenditures. Values ranging from 5 percent to 20 percent of the total household income have been reported in the literature (Wyszewianski 1986; Berki 1986; Ranson 2002; Water et al. 2004). 29 Using k/d<40% leads to very high poverty headcounts for persons with and without disabilities, which dilutes the value of performing this analysis. However, calculations are made using k/d=25% are presented in the Appendix B9.

32
day); (3) 10 percent or more of household expenditures are health expenditures;30 and (4) the household asset index score is lower than 10 out of 100.
3.8 Data Analysis
Data analysis is limited to descriptive statistics. For each of the economic well-being indicators described above, this study presents estimates for persons and households reporting disabilities and for those without disabilities. The differences in indicators with and without disabilities are tested for statistical significance.
It should be noted that the authors decided not to conduct a multivariable regression analysis because of the endogeneity of disability and economic deprivation. As explained earlier, disability and economic deprivation are linked through a two-way causation. Analysis of longitudinal data is necessary to disentangle whether the onset of disability has led to deprivation or persons with disabilities were already deprived before becoming disabled. Otherwise, a potentially misleading picture of the dynamic relationship between disability and disadvantage might emerge. For instance, using this existing data set, if, in the regression of employment a coefficient of the disability variable is found to be statistically significant, one would not be able to conclude that persons with disabilities are less likely to find employment compared to persons without disabilities. It may be that persons with disabilities are less likely to be employed due to their disability, but it could also reflect the fact that persons who are not employed are more likely to report a disability. The picture is even more blurred in the case of education, because most of disabilities occur during adulthood, after the education has been completed.31 Therefore, in a study of working-age population, if in the regression of education a coefficient of the disability variable is found to be statistically significant, one would not be able to conclude that persons with disabilities are less likely to be educated. Further research using longitudinal data is necessary to address this endogeneity issue and identify the causal pathways that link disability and economic disadvantage and poverty. Given the data at hand, this is beyond the scope of this study.
30 Thresholds must be an upper bound, rather than a lower bound in this measure. This calculation is performed with a threshold of 1 (health-to-total expenditure ratio) falling below 90 percent. 31 As an illustration of this issue one may use Filmer’s analysis (2008). Based on 14 household surveys from 13 developing countries, he estimates disability prevalence at 1-2 percent of the population. The regression analysis suggests that adults with disabilities typically live in poorer than average households: disability is associated with about a 10 percentage point increase in the probability of falling in the two poorest quintiles. However, much of this association disappears when controls for education are introduced and Filmer concludes that “much of the association appears to reflect lower educational attainment among adults with disabilities” (p. 141). Therefore, one cannot be sure whether adults with disabilities are more likely to be in the bottom two quintiles because of disability or because of low educational attainment. Neither can one speculate that people with disabilities have lower educational attainment because of their disabilities, as most of disabilities occur during adulthood, once the education cycle has been completed (on disability dynamics, see Burchardt 2000).
33
4. RESULTS
This section presents the results of the data analysis. Results using the base disability measure are in the body of the study, while those using the expanded disability measure are in Appendix B. The overview tables are intended to facilitate cross-country comparisons for particular indicators. Results are also presented separately for each country in country profiles in Appendix C. Country profiles complement the overview tables with more information for each country. For instance, they present information on the demographic characteristics and types of employment for working persons with and without disabilities, and on the living conditions of households with disabilities compared to other households.
It is essential to note that the results presented in this study, whether in the overview tables or in the country profiles, only provide aggregate level estimates of selected indicators of socioeconomic status of persons with disabilities. This set of results in itself is insufficient to formulate hypotheses for further research or policies at the country level. The formulation of hypotheses will require additional country specific knowledge. The development of policies will require an in-depth understanding of the determinants of the specific indicators of economic well-being and poverty and evidence on programs and policies. For instance, in a country where persons with disabilities experience a lower employment rate compared to persons without disabilities, prior to developing a policy or program to increase employment among disabled people, one needs to find out why the employment rate is low. It could be because of many factors including: (i) the ways how the underlying health conditions reduce the productivity of disabled people for the types of jobs that are available in the labor market; (ii) the lack of access to assistive devices or personal assistance; (iii) contextual factors, for instance, a physically inaccessible work environment or negative attitudes with respect to the ability to work of persons with disabilities; and/or (iv) the rules related to disability benefits which may create incentives for disabled people to drop out of the labor market. Once the main causes for low employment rates for persons with disabilities in a particular country are better understood, it becomes possible to introduce adequate, and preferably evidence-based, programs and policies to promote employment among persons with disabilities.
4.1. Disability Prevalence
Overall disability prevalence
Using this study’s base measure of disability as explained above, the estimates of disability prevalence estimates among working age individuals are presented in Table 4.1. The estimates vary tremendously: from a low of 3 percent in Lao PDR to a high of 16 percent in Bangladesh.32 This figure refers to people who identify themselves as having a severe or extreme difficulty in functioning in at least one of the following: in seeing/recognizing people across the road (while wearing glasses/lenses); moving around; concentrating or remembering things; and with self care. There could be a variety of reasons why prevalence has such a wide range across countries. It could reflect
32 Disability prevalence estimates are not age standardized.

34
differences in the prevalence of underlying health conditions, as well as differences in contextual factors. It is also possible that cultural differences across countries might have led to different interpretations by survey staff or respondents of the WHS questions on functional and activity limitations.33 Finding the determinants of disability prevalence in the different countries and explaining cross-country differences is beyond the scope of this study.
Table 4.1: Disability Prevalence (Base Measure) among Working-Age Individuals in
15 Developing Countries
Country Disability prevalence All Males Females Rural Urban
Sub-Saharan Africa Burkina Faso 7.95 (0.009) 6.78 (0.009) 9.00 (0.013) 8.12 (0.011) 7.16 (0.010) Ghana 8.41 (0.006) 6.17 (0.008) 10.55 (0.010) 8.21 (0.007) 8.65 (0.010) Kenya 5.30 (0.006) 3.72 (0.008) 6.80 (0.009) 6.91 (0.007) 3.05 (0.011) Malawi 12.97 (0.011) 12.43 (0.012) 13.49 (0.013) 14.05 (0.013) 7.48 (0.018) Mauritius 11.43 (0.008) 9.05 (0.010) 13.85 (0.010) 12.31 (0.011) 10.16 (0.011) Zambia 5.78 (0.007) 3.98 (0.007) 7.49 (0.008) 6.58 (0.008) 4.30 (0.008) Zimbabwe 10.98 (0.007) 8.98 (0.009) 12.87 (0.009) 12.92 (0.010) 7.52 (0.010)
Asia Bangladesh 16.21 (0.007) 9.91 (0.008) 22.90 (0.012) 17.32 (0.009) 12.92 (0.010) Lao PDR 3.08 (0.003) 2.71 (0.004) 3.45 (0.005) 3.19 (0.004) 2.73 (0.005) Pakistan 5.99 (0.004) 3.02 (0.004) 9.10 (0.007) 4.53 (0.006) 9.02 (0.009) Philippines 8.49 (0.005) 7.69 (0.006) 9.29 (0.006) 9.76 (0.009) 7.70 (0.007) Latin America and the Caribbean Brazil 13.45 (0.008) 11.11 (0.010) 16.40 (0.011) 16.31 (0.020) 12.76 (0.008) Dominican Republic 8.72 (0.006) 6.34 (0.008) 11.21 (0.010) 7.82 (0.009) 9.32 (0.009) Mexico 5.30 (0.002) 4.01 (0.002) 6.50 (0.003) 5.07 (0.004) 5.37 (0.002) Paraguay 6.87 (0.004) 3.97 (0.005) 9.75 (0.007) 7.14 (0.006) 6.66 (0.006)
Note: All estimates are weighted. Standard errors are in parentheses and adjusted for survey clustering and stratification. Working-age individuals are aged 18 to 65. For explanations on the base disability measure, see text. A number of observations for each country are shown in Table 4.4 below.
Source: Author's analysis based on WHS data as described in the text.
In each of the 15 countries, disability prevalence is found to be higher among women than men. For most countries, the gender gap, i.e. the difference in disability prevalence between females and males is between three and five percentage points. The gender gap is the largest in Bangladesh: disability prevalence stands at 23 percent among women, compared to 10 percent among men, which gives a gender gap of 13 percentage points. This result of a higher prevalence for women than men was not found in earlier case studies in developing countries (for example, Eide and Kamaleri 2006; Loeb and Eide 2004). It is, however, consistent with findings in developed countries, although the gender gap there was found to be small (OECD 2003). To better understand this gender
33 While this could be the case, it should be noted that in each country the WHS survey staff had to take the same training and follow the same instructions while administering the survey, and the questionnaire was subject to cognitive testing in each country prior to implementation.

35
gap in disability prevalence in developing countries and its determinants, more research is needed.
In 11 out of the 15 countries under study, disability prevalence is higher in rural areas than in urban centers. A higher prevalence in rural areas has been found in earlier studies in developing countries (for example, World Bank 2009 for India), but further research is needed to understand if this is a systematic finding.
Appendix B1 shows disability prevalence estimates when the expanded disability measure is used. As explained earlier, the expanded measure includes severe or extreme difficulty in at least one of the following eight domains: seeing/recognizing people across the road (while wearing glasses/lenses); moving around; concentrating or remembering things; self care; seeing/recognizing object at arm's length (while wearing glasses/lenses); personal relationships/participation in the community; learning a new task; and dealing with conflicts/tension with others. Disability prevalence with the expanded measure ranges from a low of 7 percent in Mexico to a high of 21 percent in Brazil. Like with the base disability measure, disability prevalence is higher for women than men in each country, and among rural population compared to urban residents in most countries.
Disability prevalence by economic status
Disability prevalence is estimated by economic status first by comparing prevalence across asset index or non-health PCE quintiles. Using base measures, the disability prevalence for each quintile from the poorest (first) to the wealthiest (fifth) is presented in Figures 4.1 and 4.2, and in Appendices B2a and B2b. In general, Figures 4.1 and 4.2 suggest that disability prevalence tends to be higher in the poorest quintiles than in the wealthiest quintiles for both the asset index and non-health PCE.
Disability prevalence is then estimated in the lowest (or bottom) quintile and compared to the prevalence in the rest of the population in Table 4.2.34 For the asset index, prevalence in the bottom quintile ranges from a low of 5 percent in Mexico to a high of 21 percent in Bangladesh and is higher in the bottom quintile in all but four countries (Ghana, Zambia, Pakistan, and Mexico). The difference in prevalence between the bottom quintile and the rest of the population quintiles is statistically different from zero in five countries: Kenya, Mauritius, Bangladesh, the Philippines, and Brazil.35 In Kenya, disability prevalence is almost double in the bottom quintile compared to the other quintiles (9 percent versus 4 percent). For non-health PCE, disability prevalence in the bottom PCE quintile ranges from 5 percent in Lao PDR to 19 percent in Bangladesh and is higher in all countries except Burkina Faso and the Dominican Republic. However, the difference in prevalence between the bottom quintile and the rest of the population is small and not statistically significant in all countries except in Bangladesh, the Philippines, and Brazil. Results are overall similar when the expanded disability measure is used (Appendix B2c).
34 In Table 4.2 and Appendix B2, individuals are grouped by household-level characteristics such as assets and non-health PCE and then disability prevalence is calculated within each group. Calculations for prevalence in Tables 4.1 and 4.2 and Appendix B2 utilize WHS individual survey weights rather than household weights. 35 “Significantly” and “statistically significant” are used interchangeably in this study. In the text, statistical significance refers to significance at the one-percent and five-percent levels.
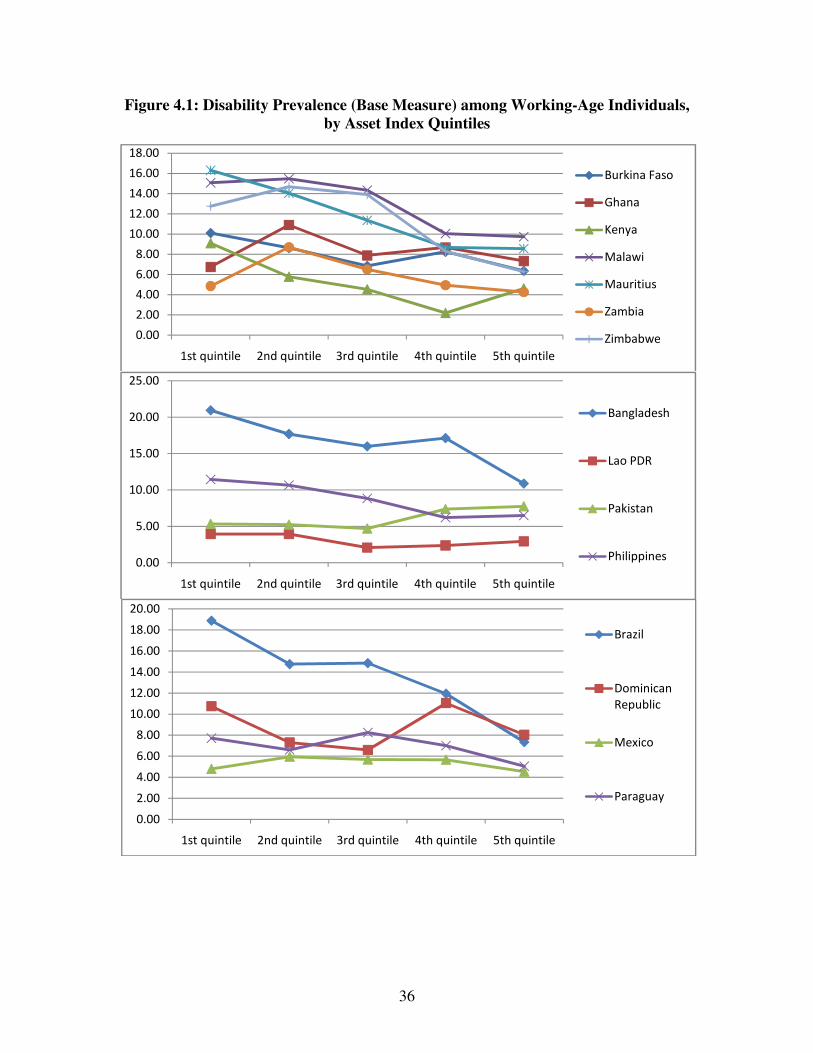
36
Figure 4.1: Disability Prevalence (Base Measure) among Working-Age Individuals, by Asset Index Quintiles
0.00
2.00
4.00
6.00
8.00
10.00
12.00
14.00
16.00
18.00
1st quintile 2nd quintile 3rd quintile 4th quintile 5th quintile
Burkina Faso
Ghana
Kenya
Malawi
Mauritius
Zambia
Zimbabwe
0.00
5.00
10.00
15.00
20.00
25.00
1st quintile 2nd quintile 3rd quintile 4th quintile 5th quintile
Bangladesh
Lao PDR
Pakistan
Philippines
0.00
2.00
4.00
6.00
8.00
10.00
12.00
14.00
16.00
18.00
20.00
1st quintile 2nd quintile 3rd quintile 4th quintile 5th quintile
Brazil
Dominican
Republic
Mexico
Paraguay

37
Figure 4.2: Disability Prevalence (Base Measure) among Working-Age Individuals, by Non-health PCE Quintiles
0.00
2.00
4.00
6.00
8.00
10.00
12.00
14.00
16.00
1st quintile 2nd quintile 3rd quintile 4th quintile 5th quintile
Burkina Faso
Ghana
Kenya
Malawi
Mauritius
Zambia
Zimbabwe
0.00
5.00
10.00
15.00
20.00
25.00
1st quintile 2nd quintile 3rd quintile 4th quintile 5th quintile
Bangladesh
Lao PDR
Pakistan
Philippines
0.00
2.00
4.00
6.00
8.00
10.00
12.00
14.00
16.00
18.00
20.00
1st quintile 2nd quintile 3rd quintile 4th quintile 5th quintile
Brazil
Dominican
Republic
Mexico
Paraguay
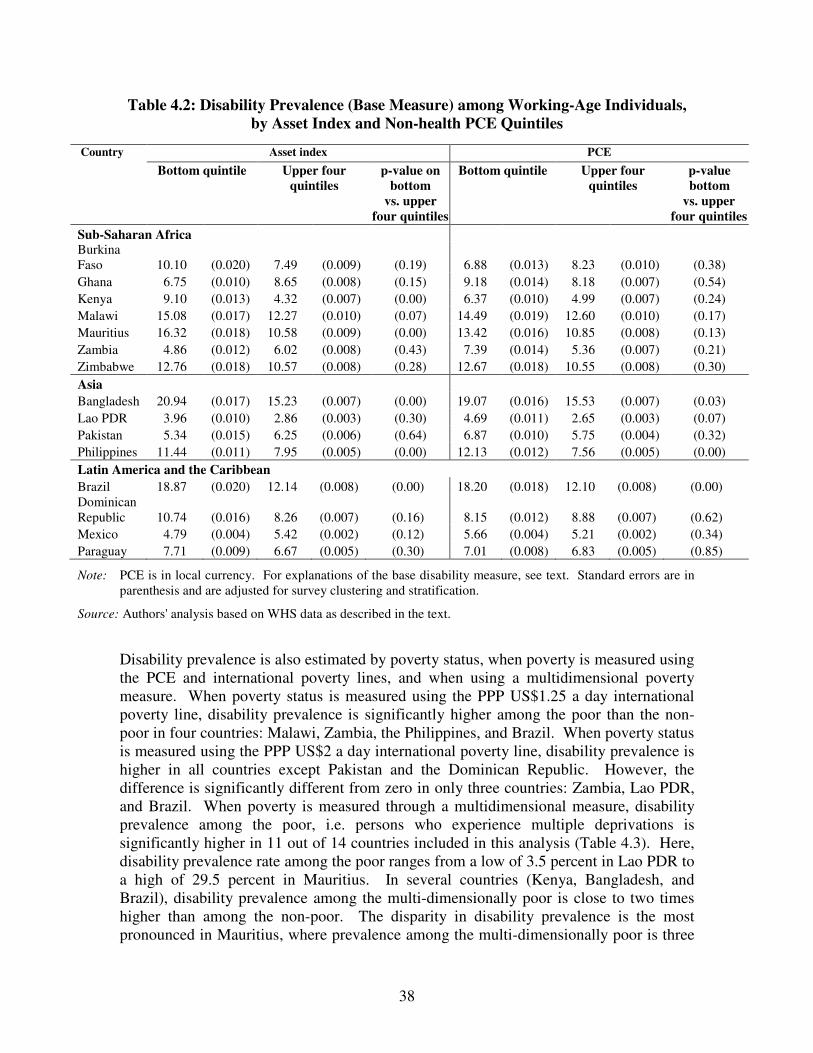
38
Table 4.2: Disability Prevalence (Base Measure) among Working-Age Individuals, by Asset Index and Non-health PCE Quintiles
Country
Asset index PCE
Bottom quintile
Upper four quintiles
p-value on bottom
vs. upper four quintiles
Bottom quintile Upper four quintiles
p-value bottom
vs. upper four quintiles
Sub-Saharan Africa Burkina Faso 10.10 (0.020) 7.49 (0.009) (0.19) 6.88 (0.013) 8.23 (0.010) (0.38) Ghana 6.75 (0.010) 8.65 (0.008) (0.15) 9.18 (0.014) 8.18 (0.007) (0.54) Kenya 9.10 (0.013) 4.32 (0.007) (0.00) 6.37 (0.010) 4.99 (0.007) (0.24) Malawi 15.08 (0.017) 12.27 (0.010) (0.07) 14.49 (0.019) 12.60 (0.010) (0.17) Mauritius 16.32 (0.018) 10.58 (0.009) (0.00) 13.42 (0.016) 10.85 (0.008) (0.13) Zambia 4.86 (0.012) 6.02 (0.008) (0.43) 7.39 (0.014) 5.36 (0.007) (0.21) Zimbabwe 12.76 (0.018) 10.57 (0.008) (0.28) 12.67 (0.018) 10.55 (0.008) (0.30)
Asia Bangladesh 20.94 (0.017) 15.23 (0.007) (0.00) 19.07 (0.016) 15.53 (0.007) (0.03) Lao PDR 3.96 (0.010) 2.86 (0.003) (0.30) 4.69 (0.011) 2.65 (0.003) (0.07) Pakistan 5.34 (0.015) 6.25 (0.006) (0.64) 6.87 (0.010) 5.75 (0.004) (0.32) Philippines 11.44 (0.011) 7.95 (0.005) (0.00) 12.13 (0.012) 7.56 (0.005) (0.00)
Latin America and the Caribbean Brazil 18.87 (0.020) 12.14 (0.008) (0.00) 18.20 (0.018) 12.10 (0.008) (0.00) Dominican Republic 10.74 (0.016) 8.26 (0.007) (0.16) 8.15 (0.012) 8.88 (0.007) (0.62) Mexico 4.79 (0.004) 5.42 (0.002) (0.12) 5.66 (0.004) 5.21 (0.002) (0.34) Paraguay 7.71 (0.009) 6.67 (0.005) (0.30) 7.01 (0.008) 6.83 (0.005) (0.85)
Note: PCE is in local currency. For explanations of the base disability measure, see text. Standard errors are in parenthesis and are adjusted for survey clustering and stratification.
Source: Authors' analysis based on WHS data as described in the text.
Disability prevalence is also estimated by poverty status, when poverty is measured using the PCE and international poverty lines, and when using a multidimensional poverty measure. When poverty status is measured using the PPP US$1.25 a day international poverty line, disability prevalence is significantly higher among the poor than the non-poor in four countries: Malawi, Zambia, the Philippines, and Brazil. When poverty status is measured using the PPP US$2 a day international poverty line, disability prevalence is higher in all countries except Pakistan and the Dominican Republic. However, the difference is significantly different from zero in only three countries: Zambia, Lao PDR, and Brazil. When poverty is measured through a multidimensional measure, disability prevalence among the poor, i.e. persons who experience multiple deprivations is significantly higher in 11 out of 14 countries included in this analysis (Table 4.3). Here, disability prevalence rate among the poor ranges from a low of 3.5 percent in Lao PDR to a high of 29.5 percent in Mauritius. In several countries (Kenya, Bangladesh, and Brazil), disability prevalence among the multi-dimensionally poor is close to two times higher than among the non-poor. The disparity in disability prevalence is the most pronounced in Mauritius, where prevalence among the multi-dimensionally poor is three
39
times higher than among the non-poor. Overall, it can be said that there are significant disparities in disability prevalence in most countries by poverty status, when poverty is measured multi-dimensionally.
Appendix B3 presents results of disability prevalence by poverty status using the expanded disability measure. Results are overall similar. One can also notice that, compared to the base disability measure, for each poverty measure under use, one additional country is found to have a significant difference in disability prevalence across poverty status.

40
Table 4.3: Disability Prevalence (Base Measure) among Working-Age Individuals, by Poverty Status
Poverty measure Under US$1.25 a day Under US$2 a day Multidimensional poverty
Among the poor
Among the non-poor
p-value on poor vs. non-
poor
Among the poor
Among the non-poor
p-value on poor vs. non-
poor
Among the poor
Among the non-poor
p-value on poor vs. non-
poor
Sub-Saharan Africa
Burkina Faso 8.10 (0.010) 7.46 (0.010) 0.57 8.11 (0.010) 6.57 (0.014) 0.34 8.20 (0.01) 4.50 (0.01) 0.01
Ghana 8.57 (0.008) 8.22 (0.008) 0.75 8.76 (0.007) 7.32 (0.008) 0.19 9.37 (0.01) 6.94 (0.01) 0.07 Kenya 6.20 (0.008) 4.62 (0.009) 0.20 5.53 (0.007) 4.98 (0.012) 0.69 6.71 (0.01) 3.71 (0.01) 0.02 Malawi 13.41 (0.012) 7.04 (0.015) 0.00 13.11 (0.012) 8.88 (0.026) 0.14 13.54 (0.01) 9.29 (0.02) 0.04 Mauritius 14.78 (0.052) 11.39 (0.008) 0.52 13.76 (0.024) 11.24 (0.008) 0.33 29.54 (0.03) 10.30 (0.01) 0.00 Zambia 6.07 (0.007) 3.97 (0.010) 0.04 5.97 (0.007) 2.89 (0.014) 0.03 6.39 (0.01) 4.10 (0.01) 0.03
Asia Bangladesh 16.44 (0.010) 15.90 (0.009) 0.64 16.63 (0.009) 14.39 (0.012) 0.13 18.49 (0.01) 8.47 (0.01) 0.00 Lao PDR 3.18 (0.004) 2.85 (0.005) 0.62 3.33 (0.004) 1.66 (0.005) 0.01 3.53 (0.00) 2.33 (0.00) 0.09 Pakistan 5.58 (0.006) 6.38 (0.007) 0.45 5.47 (0.004) 7.77 (0.011) 0.08 6.41 (0.00) 5.06 (0.01) 0.13 Philippines 9.64 (0.008) 7.57 (0.006) 0.02 8.84 (0.006) 7.64 (0.007) 0.15 11.67 (0.01) 6.99 (0.01) 0.00
Latin America and the Caribbean Brazil 18.53 (0.019) 12.21 (0.008) 0.00 17.95 (0.013) 10.70 (0.008) 0.00 23.75 (0.02) 11.20 (0.01) 0.00 Dominican Republic 8.15 (0.013) 8.87 (0.007) 0.64 7.91 (0.010) 9.24 (0.009) 0.38 11.87 (0.01) 7.49 (0.01) 0.00 Mexico 5.79 (0.004) 5.18 (0.002) 0.22 5.44 (0.003) 5.22 (0.002) 0.55 8.30 (0.01) 4.81 (0.00) 0.00 Paraguay 6.96 (0.009) 6.85 (0.005) 0.91 7.08 (0.007) 6.75 (0.006) 0.69 9.06 (0.01) 5.93 (0.01) 0.00
Note: Households poverty status with respect to the US$1.25 or US$2 a day poverty line is found using household PCE adjusting for 2005 PPP. All estimates are weighted. Poverty estimates for Zimbabwe are omitted due to a lack of PPP figures for the years of analysis. Standard errors are between parentheses and are adjusted for survey clustering and stratification. For explanations of the base disability measure, see text.
Source: Authors' analysis based on WHS data as described in the text.
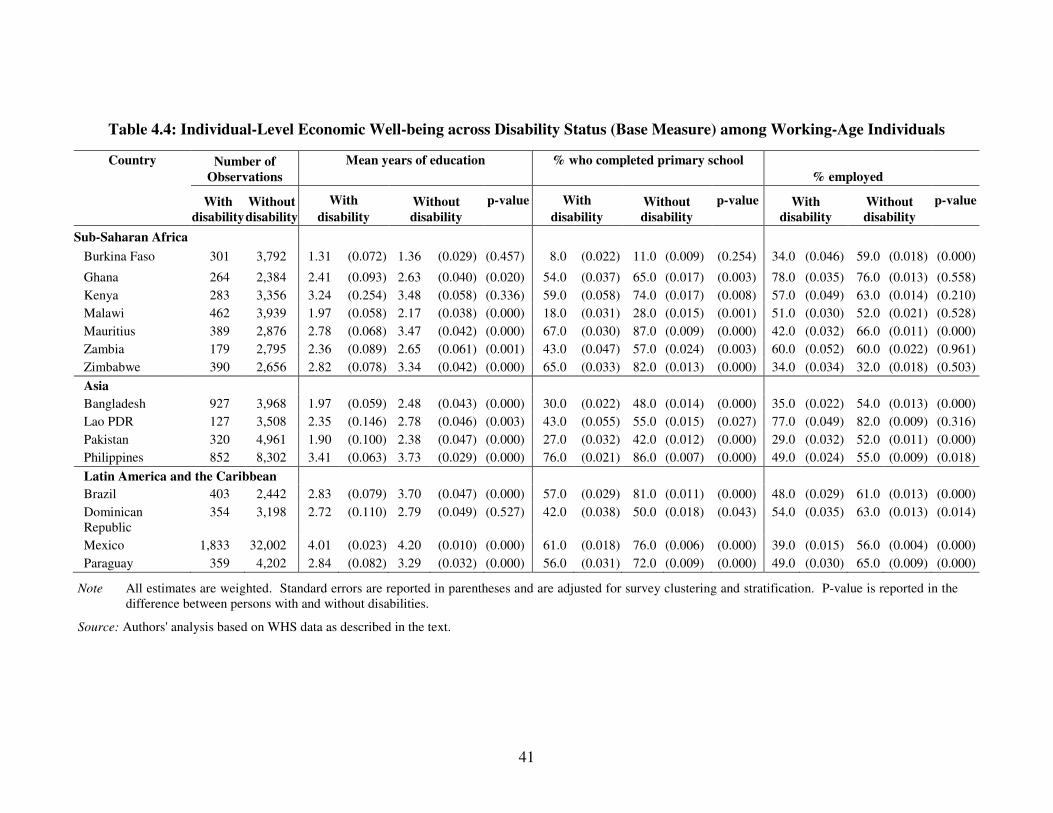
41
Table 4.4: Individual-Level Economic Well-being across Disability Status (Base Measure) among Working-Age Individuals
Country Number of Observations
Mean years of education
% who completed primary school
% employed
With disability
Without disability
With
disability Without disability
p-value
With
disability Without disability
p-value
With
disability Without disability
p-value
Sub-Saharan Africa
Burkina Faso 301 3,792 1.31 (0.072) 1.36 (0.029) (0.457) 8.0 (0.022) 11.0 (0.009) (0.254) 34.0 (0.046) 59.0 (0.018) (0.000)
Ghana 264 2,384 2.41 (0.093) 2.63 (0.040) (0.020) 54.0 (0.037) 65.0 (0.017) (0.003) 78.0 (0.035) 76.0 (0.013) (0.558)
Kenya 283 3,356 3.24 (0.254) 3.48 (0.058) (0.336) 59.0 (0.058) 74.0 (0.017) (0.008) 57.0 (0.049) 63.0 (0.014) (0.210)
Malawi 462 3,939 1.97 (0.058) 2.17 (0.038) (0.000) 18.0 (0.031) 28.0 (0.015) (0.001) 51.0 (0.030) 52.0 (0.021) (0.528)
Mauritius 389 2,876 2.78 (0.068) 3.47 (0.042) (0.000) 67.0 (0.030) 87.0 (0.009) (0.000) 42.0 (0.032) 66.0 (0.011) (0.000)
Zambia 179 2,795 2.36 (0.089) 2.65 (0.061) (0.001) 43.0 (0.047) 57.0 (0.024) (0.003) 60.0 (0.052) 60.0 (0.022) (0.961)
Zimbabwe 390 2,656 2.82 (0.078) 3.34 (0.042) (0.000) 65.0 (0.033) 82.0 (0.013) (0.000) 34.0 (0.034) 32.0 (0.018) (0.503)
Asia
Bangladesh 927 3,968 1.97 (0.059) 2.48 (0.043) (0.000) 30.0 (0.022) 48.0 (0.014) (0.000) 35.0 (0.022) 54.0 (0.013) (0.000)
Lao PDR 127 3,508 2.35 (0.146) 2.78 (0.046) (0.003) 43.0 (0.055) 55.0 (0.015) (0.027) 77.0 (0.049) 82.0 (0.009) (0.316)
Pakistan 320 4,961 1.90 (0.100) 2.38 (0.047) (0.000) 27.0 (0.032) 42.0 (0.012) (0.000) 29.0 (0.032) 52.0 (0.011) (0.000)
Philippines 852 8,302 3.41 (0.063) 3.73 (0.029) (0.000) 76.0 (0.021) 86.0 (0.007) (0.000) 49.0 (0.024) 55.0 (0.009) (0.018)
Latin America and the Caribbean
Brazil 403 2,442 2.83 (0.079) 3.70 (0.047) (0.000) 57.0 (0.029) 81.0 (0.011) (0.000) 48.0 (0.029) 61.0 (0.013) (0.000)
Dominican Republic
354 3,198 2.72 (0.110) 2.79 (0.049) (0.527) 42.0 (0.038) 50.0 (0.018) (0.043) 54.0 (0.035) 63.0 (0.013) (0.014)
Mexico 1,833 32,002 4.01 (0.023) 4.20 (0.010) (0.000) 61.0 (0.018) 76.0 (0.006) (0.000) 39.0 (0.015) 56.0 (0.004) (0.000)
Paraguay 359 4,202 2.84 (0.082) 3.29 (0.032) (0.000) 56.0 (0.031) 72.0 (0.009) (0.000) 49.0 (0.030) 65.0 (0.009) (0.000)
Note All estimates are weighted. Standard errors are reported in parentheses and are adjusted for survey clustering and stratification. P-value is reported in the difference between persons with and without disabilities.
Source: Authors' analysis based on WHS data as described in the text.
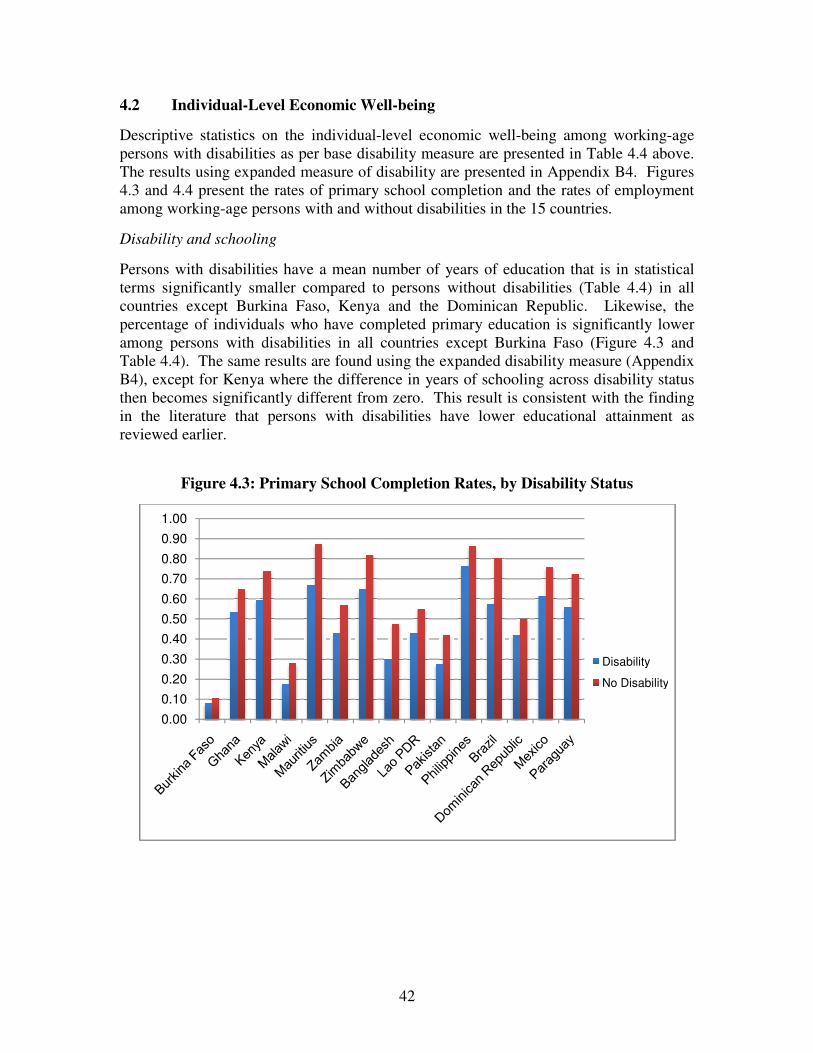
4.2 Individual-Level Economic
Descriptive statistics on the individualpersons with disabilities as per The results using expanded measure of disability 4.3 and 4.4 present the rates of primary school completion and the raamong working-age persons with and without disabilities in the 15 countries
Disability and schooling
Persons with disabilities have a mean number of years of education terms significantly smaller compared tocountries except Burkina Fasopercentage of individuals who have completed primary education is significantly lower among persons with disabilities in all countries except Table 4.4). The same results are found using the expanded disability measure B4), except for Kenya where the difference in years of schooling across disability status then becomes significantly different from zero. in the literature that persons with disabilities have lower educationreviewed earlier.
Figure 4.3: Primary School Completion Rates
0.00
0.10
0.20
0.30
0.40
0.50
0.60
0.70
0.80
0.90
1.00
42
Economic Well-being
the individual-level economic well-being among workingpersons with disabilities as per base disability measure are presented in Table 4.4
expanded measure of disability are presented in Appendix present the rates of primary school completion and the rates of employment
age persons with and without disabilities in the 15 countries.
Persons with disabilities have a mean number of years of education that is in statistical significantly smaller compared to persons without disabilities (Table 4.4) in all
Burkina Faso, Kenya and the Dominican Republic. Likewise, thpercentage of individuals who have completed primary education is significantly lower among persons with disabilities in all countries except Burkina Faso (Figure 4.
The same results are found using the expanded disability measure 4), except for Kenya where the difference in years of schooling across disability status
then becomes significantly different from zero. This result is consistent with the finding in the literature that persons with disabilities have lower educational attainment as
Figure 4.3: Primary School Completion Rates, by Disability Status
Disability
No Disability
being among working-age able 4.4 above. x B4. Figures
tes of employment .
that is in statistical able 4.4) in all
Likewise, the percentage of individuals who have completed primary education is significantly lower
igure 4.3 and The same results are found using the expanded disability measure (Appendix
4), except for Kenya where the difference in years of schooling across disability status This result is consistent with the finding
al attainment as
by Disability Status
Disability
No Disability

43
It is interesting to note that the disparities in educational attainment between persons with and without disabilities greatly vary across countries. The largest difference in primary school completion rates across disability status is found in Brazil (23 percentage points) followed by Mauritius (21 percentage points), while the smallest difference is found in Burkina Faso (three percentage points). When disparities in primary school completion are measured by the ratio of the completion rates of persons with and without disabilities, disparities are most pronounced in Malawi, Bangladesh, and Pakistan, where the primary school completion rates of persons with disabilities are 64 percent, 63 percent, and 65 percent of the primary school completion rates of persons without disabilities respectively. For other countries, this ratio is higher and ranges from 71 percent in Brazil to 88 percent in the Philippines. Disability and employment
Figure 4.4 presents the ratio between the employment rate of persons with disabilities and the employment rate of persons without disabilities. This ratio is commonly used in the disability and employment literature (for example, OECD 2003 and OECD 2009) to indicate the level of labor market integration of disabled people. A ratio at, above, or close to, one suggests that working-age persons with disabilities access employment to the same degree as persons without disabilities.
Figure 4.4: Relative Employment Rates of Persons with Disabilities
Note: The ratio is the employment rate of persons with disabilities divided by the employment rate of
persons without disabilities.
0.00
0.20
0.40
0.60
0.80
1.00
1.20
44
As shown in Table 4.4 and Figure 4.4 above, persons with disabilities have lower employment rates in all countries except in Ghana, Zambia, and Zimbabwe.36 The difference is statistically significant in nine out of 15 countries as follows: Burkina Faso, Mauritius, Bangladesh, Pakistan, the Philippines, Brazil, Dominican Republic, Mexico, and Paraguay.
Overall, the estimates suggest that in most of the countries included in the study, persons with disabilities as a group have significantly lower educational attainment than persons without disabilities. Comparatively, they have fewer years of education and lower primary school completion rates. Similarly, they have lower employment rates than persons without disabilities. In majority (60 percent) of the countries the difference in employment rates to the detriment of disabled people was statistically significant. 4.3. Household-Level Economic Well-being
Descriptive statistics on household-level economic indicators across disability status are presented for the base disability measure in Tables 4.5 and 4.6 below. The results using the expanded disability measure are in Appendices B5a and B5b.
Asset ownership and living conditions
As shown in Table 4.5, households with disabilities have a significantly lower mean asset index in 10 out of 15 countries. Figure 4.5 presents the asset index ratio; that is, the ratio between the mean asset index score of households with disabilities and the mean asset index of households without disabilities. A ratio at, above, or close to, one suggests that households with disabilities experience similar asset accumulation as households without disabilities. Out of 15 countries, the asset index ratio is below 0.80 in five countries (Burkina Faso, Kenya, Malawi, Zimbabwe, and Bangladesh). On the other hand, Pakistan shows higher levels of asset ownership for households with disabilities, while the Dominican Republic and Mexico show similar levels across household disability status. Households with disabilities are statistically significantly over-represented in the bottom quintile of asset index scores in 6 out of 15 countries. For instance, 36 percent of households with disabilities in Kenya and 28 percent in Brazil are in the bottom quintile of asset index scores. Figure 4.6 compares the percentage of households falling in the bottom asset index quintile across disability status.
36 The result for Zimbabwe is similar to that found in Eide et al. (2003a). In contrast, for Zambia, Eide and Loeb (2006) and Trani and Loeb (2010) found lower employment rates for persons with disabilities. To the authors’ knowledge, no additional evidence is available in Ghana.

45
Figure 4.5: Ratios of Mean Asset Index Score: Households with Disabilities to Other Households
Note: The ratio is the mean asset index score of persons with disabilities divided by the
mean asset index score of persons without disabilities.
Figure 4.6: Percentage of Households in the Bottom Asset Index Quintile, by Disability Status
0.00
0.20
0.40
0.60
0.80
1.00
1.20
0.00
0.05
0.10
0.15
0.20
0.25
0.30
0.35
0.40
Disability
No Disability

46
Per capita non-health expenditure
Mean non-health PCE. Three countries - Mauritius, Brazil, and Mexico - have a mean non-health PCE that is statistically lower in households with disabilities (Table 4.5). In five countries - Bangladesh, Lao PDR, the Philippines, Brazil, and Malawi - the share of households in the bottom PCE quintile is higher among households with disabilities (the mean PCE for all households at the 20th percentile is used as a cutoff point). Figure 4.7 presents the PCE ratio; that is, the ratio between the mean PCE of households with disabilities and the mean PCE of households without disabilities. Results vary widely across countries, with four of 15 countries showing ratios well above one, suggesting higher mean PCE for households with disabilities, and four countries at or below 0.8, suggesting lower mean PCE for households with disabilities.
Figure 4.7: Ratios of Mean Non-health PCE: Households with Disabilities
to Households without Disabilities
Note: The ratio is the mean non-health PCE of persons with disabilities divided by the mean
non-health PCE of persons without disabilities.
Figure 4.8 compares the percentage of households falling in the bottom PCE quintile across disability status. Households with disabilities are statistically significantly over-represented in the bottom quintile of PCE in five out of 15 countries (Malawi, Lao PDR, Bangladesh, the Philippines, and Brazil). For instance, 31 percent of households with disabilities in Lao PDR and 28 percent in Brazil are in the bottom quintile of PCE.
0.00
0.20
0.40
0.60
0.80
1.00
1.20
1.40
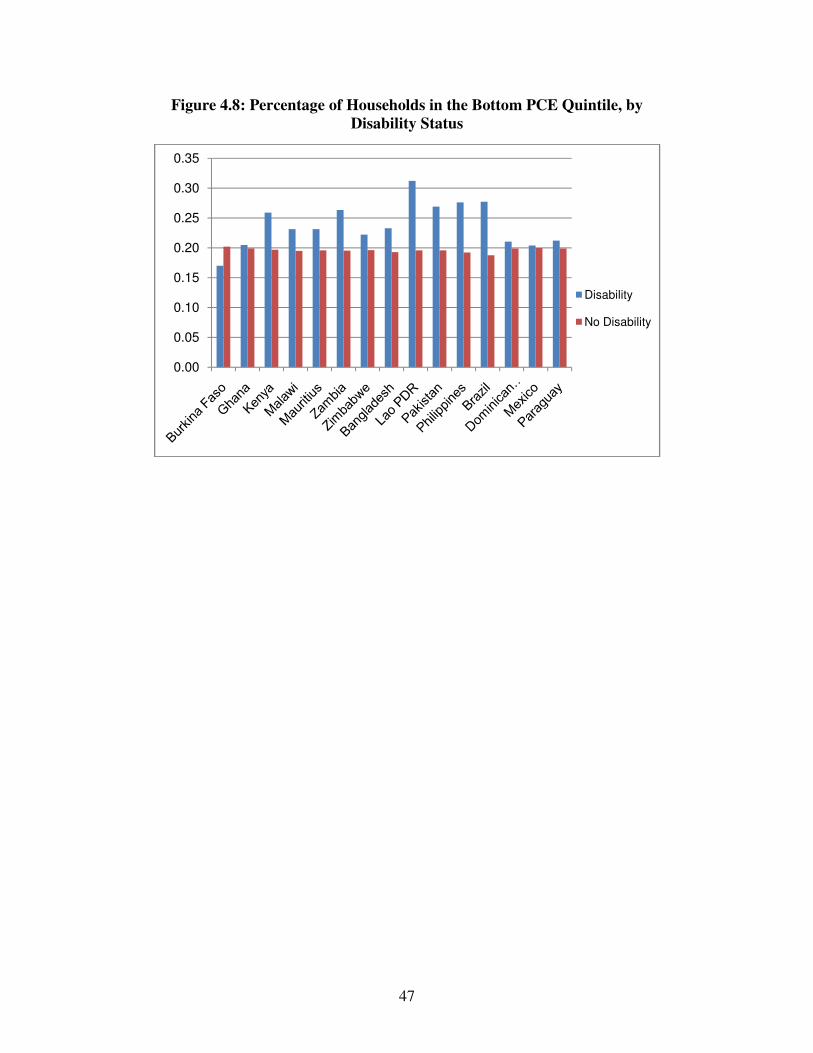
47
Figure 4.8: Percentage of Households in the Bottom PCE Quintile, by Disability Status
0.00
0.05
0.10
0.15
0.20
0.25
0.30
0.35
Disability
No Disability

48
Table 4.5: Household-Level Economic Well-being Measures among Households with/without a Working-Age Person with Disabilities (Base Measure)
Country Households with
disabilities
Other Households
Households with disabilities
Other households
p-value Households with disabilities
Other households
p-value
Number of observations
Mean asset index Mean non-health PCE
Sub-Saharan Africa Burkina Faso 301 3,792 8.02 (0.803) 10.42 (0.523) (0.002) 30.91 (2.633) 31.38 (1.305) (0.853) Ghana 264 2,384 23.55 (1.355) 25.49 (0.786) (0.141) 62.16 (7.850) 63.69 (6.472) (0.879) Kenya 283 3,356 17.27 (2.791) 23.64 (1.885) (0.039) 65.51 (9.189) 95.51 (18.528) (0.164) Malawi 462 3,939 5.16 (0.692) 7.27 (0.595) (0.000) 14.65 (3.631) 14.90 (0.994) (0.941) Mauritius 389 2,876 75.21 (0.971) 79.54 (0.652) (0.000) 127.65 (5.424) 145.80 (5.952) (0.006) Zambia 179 2,795 13.82 (2.259) 16.11 (2.311) (0.221) 18.81 (1.827) 23.26 (2.344) (0.096) Zimbabwe 390 2,658 22.51 (1.850) 30.18 (1.678) (0.000) n/a n/a n/a n/a n/a
Asia Bangladesh 927 3,968 11.75 (0.804) 15.54 (0.710) (0.000) 51.38 (4.717) 47.60 (1.809) (0.447) Lao PDR 127 3,508 21.73 (1.751) 26.26 (0.917) (0.011) 29.86 (4.178) 37.92 (1.980) (0.078) Pakistan 320 4,961 40.61 (2.487) 36.05 (1.338) (0.010) 53.25 (6.797) 45.80 (2.792) (0.303) Philippines 852 8,302 47.23 (1.147) 52.03 (0.670) (0.000) 49.89 (2.651) 53.37 (1.701) (0.219)
Latin America and the Caribbean
Brazil 403 2,442 80.64 (1.273) 85.33 (0.581) (0.000) 96.50 (6.405) 166.12 (13.651) (0.000) Dominican Republic 354 3,198 63.04 (1.961) 64.17 (1.086) (0.515) 127.38 (12.491) 118.10 (5.748) (0.456) Mexico 1,833 32,002 81.63 (0.605) 81.02 (0.482) (0.219) 247.55 (28.900) 190.16 (6.723) (0.047) Paraguay 359 4,202 48.23 (1.379) 51.73 (0.515) (0.010) 108.76 (7.716) 121.19 (3.697) (0.137)
Note: All estimates are weighted. Standard errors are reported in parentheses and are adjusted for survey clustering and stratification. P-value is reported in the difference between household with and without disabilities. Household poverty status with respect to the US$1.25 or US$2 a day poverty line is found using household non-health PCE adjusting for PPP for 2005. PCE estimates for Zimbabwe are omitted due to the lack of accurate PPP figures for the year of analysis.
Source: Authors' analysis based on WHS data as described in the text.

49
Table 4.6: Household-Level Economic Well-being Measures among Households with/without a Working-Age Person with Disability (Base Measure)
Country Households with disabilities
Other households
p-value Households with disabilities
Other households
p-value Households with disabilities
Other households
p-value
Ratio of health to total expenditures % in bottom quintile asset index % in bottom quintile PCE
Sub-Saharan Africa Burkina Faso 0.10 (0.011) 0.09 (0.005) (0.178) 0.28 (0.042) 0.19 (0.019) (0.045) 0.17 (0.030) 0.20 (0.016) (0.264) Ghana 0.11 (0.012) 0.08 (0.004) (0.036) 0.16 (0.023) 0.20 (0.015) (0.093) 0.20 (0.026) 0.20 (0.012) (0.842) Kenya 0.12 (0.019) 0.06 (0.006) (0.011) 0.36 (0.053) 0.19 (0.017) (0.001) 0.26 (0.039) 0.20 (0.014) (0.097) Malawi 0.05 (0.008) 0.04 (0.004) (0.148) 0.23 (0.022) 0.20 (0.013) (0.133) 0.23 (0.020) 0.20 (0.014) (0.047) Mauritius 0.10 (0.007) 0.07 (0.003) (0.000) 0.28 (0.029) 0.19 (0.013) (0.001) 0.23 (0.027) 0.20 (0.014) (0.157) Zambia 0.02 (0.005) 0.02 (0.002) (0.976) 0.18 (0.037) 0.20 (0.029) (0.586) 0.26 (0.049) 0.20 (0.027) (0.162) Zimbabwe 0.04 (0.009) 0.03 (0.004) (0.382) 0.21 (0.027) 0.20 (0.016) (0.644) 0.22 (0.031) 0.20 (0.011) (0.406) Asia Bangladesh 0.16 (0.006) 0.11 (0.003) (0.000) 0.25 (0.022) 0.19 (0.014) (0.001) 0.23 (0.018) 0.19 (0.011) (0.014) Lao PDR 0.15 (0.024) 0.11 (0.004) (0.097) 0.28 (0.052) 0.20 (0.017) (0.086) 0.31 (0.055) 0.20 (0.012) (0.032) Pakistan 0.15 (0.013) 0.12 (0.003) (0.031) 0.17 (0.062) 0.20 (0.035) (0.599) 0.27 (0.049) 0.20 (0.017) (0.114) Philippines 0.11 (0.008) 0.08 (0.003) (0.000) 0.25 (0.023) 0.19 (0.011) (0.005) 0.28 (0.022) 0.19 (0.009) (0.000) Latin America and the Caribbean
Brazil 0.16 (0.012) 0.12 (0.005) (0.005) 0.28 (0.029) 0.19 (0.015) (0.000) 0.28 (0.025) 0.19 (0.011) (0.000) Dominican Republic 0.17 (0.018) 0.10 (0.004) (0.000) 0.26 (0.040) 0.19 (0.018) (0.065) 0.21 (0.028) 0.20 (0.011) (0.682) Mexico 0.08 (0.007) 0.04 (0.001) (0.000) 0.18 (0.013) 0.20 (0.010) (0.042) 0.20 (0.014) 0.20 (0.007) (0.755) Paraguay 0.12 (0.010) 0.09 (0.003) (0.006) 0.23 (0.024) 0.20 (0.009) (0.188) 0.21 (0.023) 0.20 (0.007) (0.575)
Note: All estimates are weighted. Standard errors are reported in parentheses and are adjusted for survey clustering and stratification. P-value is reported in the difference between household with and without disabilities. Household poverty status with respect to the US$1.25 or US$2 a day poverty line is found using household non-health PCE adjusting for PPP for 2005. PCE estimates for Zimbabwe are omitted due to the lack of accurate PPP figures for the year of analysis.
Source: Authors' analysis based on WHS data as described in the text.

50
Table 4.7: Poverty Headcount, Gap, and Poverty Severity among Households with/without a Working-Age Person with Disability, Based on Non-health PCE (Base Measure)
Country Households with disabilities
Other households
p-value
Households with disabilities
Other households
p-value
Households with disabilities
Other households
p-value
Poverty headcount (US$1.25 a day) Poverty gap (US$1.25 a day) Poverty severity (US$1.25 a day)
Sub-Saharan Africa Burkina Faso 0.75 (0.026) 0.75 (0.016) (0.882) 0.37 (0.023) 0.39 (0.014) (0.501) 0.23 (0.021) 0.25 (0.012) (0.395)
Ghana 0.47 (0.031) 0.49 (0.014) (0.515) 0.21 (0.019) 0.21 (0.009) (0.837) 0.12 (0.014) 0.12 (0.006) (0.906)
Kenya 0.50 (0.065) 0.38 (0.020) (0.054) 0.23 (0.031) 0.18 (0.011) (0.084) 0.14 (0.022) 0.11 (0.008) (0.149)
Malawi 0.96 (0.011) 0.92 (0.009) (0.000) 0.70 (0.017) 0.68 (0.012) (0.061) 0.56 (0.018) 0.54 (0.012) (0.168)
Mauritius 0.02 (0.006) 0.01 (0.002) (0.235) 0.00 (0.002) 0.00 (0.001) (0.437) 0.00 (0.001) 0.00 (0.000) (0.771)
Zambia 0.86 (0.026) 0.84 (0.024) (0.394) 0.58 (0.033) 0.52 (0.033) (0.055) 0.44 (0.033) 0.37 (0.031) (0.051)
Asia
Bangladesh 0.57 (0.022) 0.58 (0.014) (0.711) 0.20 (0.010) 0.18 (0.007) (0.096) 0.09 (0.006) 0.08 (0.004) (0.039)
Lao PDR 0.71 (0.044) 0.69 (0.016) (0.647) 0.44 (0.043) 0.38 (0.013) (0.187) 0.34 (0.046) 0.27 (0.011) (0.106)
Pakistan 0.46 (0.064) 0.52 (0.035) (0.338) 0.18 (0.027) 0.17 (0.010) (0.719) 0.09 (0.015) 0.08 (0.004) (0.374)
Philippines 0.49 (0.025) 0.43 (0.011) (0.014) 0.22 (0.015) 0.17 (0.006) (0.000) 0.13 (0.011) 0.09 (0.004) (0.000)
Latin America and the Caribbean Brazil 0.24 (0.025) 0.16 (0.011) (0.001) 0.10 (0.013) 0.08 (0.006) (0.059) 0.06 (0.010) 0.05 (0.004) (0.281)
Dominican Republic 0.20 (0.027) 0.18 (0.009) (0.622) 0.12 (0.019) 0.08 (0.005) (0.059) 0.09 (0.017) 0.05 (0.004) (0.024)
Mexico 0.19 (0.014) 0.18 (0.007) (0.515) 0.09 (0.008) 0.08 (0.004) (0.237) 0.06 (0.007) 0.05 (0.003) (0.073)
Paraguay 0.18 (0.022) 0.17 (0.007) (0.520) 0.08 (0.013) 0.06 (0.004) (0.259) 0.05 (0.010) 0.04 (0.003) (0.185)
Note: Standard errors are reported in parentheses and are adjusted for survey clustering and stratification. Household poverty status with respect to the US$1.25 a day poverty line is found using household PCE adjusting for PPP for 2005. Poverty estimates for Zimbabwe are omitted due to the lack of accurate PPP figures for the years of analysis.
Source: Author's analysis based on WHS data as described in the text.
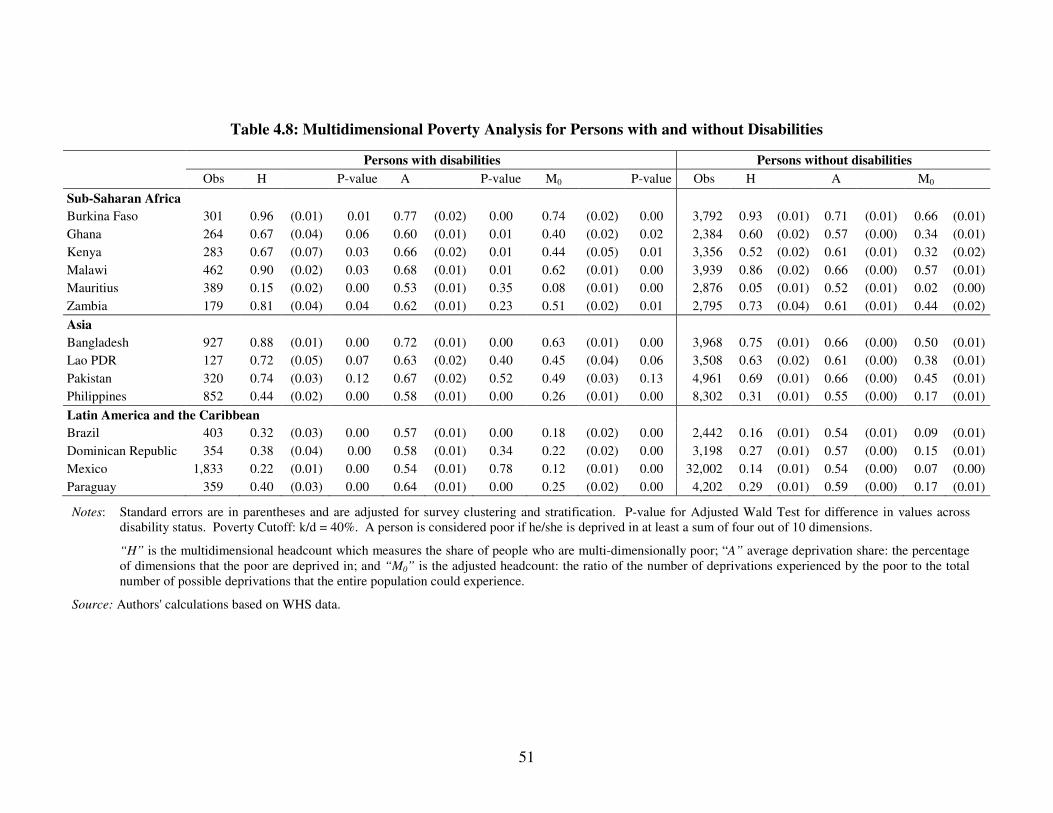
51
Table 4.8: Multidimensional Poverty Analysis for Persons with and without Disabilities
Persons with disabilities Persons without disabilities
Obs H P-value A P-value M0 P-value Obs H A M0
Sub-Saharan Africa
Burkina Faso 301 0.96 (0.01) 0.01 0.77 (0.02) 0.00 0.74 (0.02) 0.00 3,792 0.93 (0.01) 0.71 (0.01) 0.66 (0.01)
Ghana 264 0.67 (0.04) 0.06 0.60 (0.01) 0.01 0.40 (0.02) 0.02 2,384 0.60 (0.02) 0.57 (0.00) 0.34 (0.01)
Kenya 283 0.67 (0.07) 0.03 0.66 (0.02) 0.01 0.44 (0.05) 0.01 3,356 0.52 (0.02) 0.61 (0.01) 0.32 (0.02)
Malawi 462 0.90 (0.02) 0.03 0.68 (0.01) 0.01 0.62 (0.01) 0.00 3,939 0.86 (0.02) 0.66 (0.00) 0.57 (0.01)
Mauritius 389 0.15 (0.02) 0.00 0.53 (0.01) 0.35 0.08 (0.01) 0.00 2,876 0.05 (0.01) 0.52 (0.01) 0.02 (0.00)
Zambia 179 0.81 (0.04) 0.04 0.62 (0.01) 0.23 0.51 (0.02) 0.01 2,795 0.73 (0.04) 0.61 (0.01) 0.44 (0.02)
Asia
Bangladesh 927 0.88 (0.01) 0.00 0.72 (0.01) 0.00 0.63 (0.01) 0.00 3,968 0.75 (0.01) 0.66 (0.00) 0.50 (0.01)
Lao PDR 127 0.72 (0.05) 0.07 0.63 (0.02) 0.40 0.45 (0.04) 0.06 3,508 0.63 (0.02) 0.61 (0.00) 0.38 (0.01)
Pakistan 320 0.74 (0.03) 0.12 0.67 (0.02) 0.52 0.49 (0.03) 0.13 4,961 0.69 (0.01) 0.66 (0.00) 0.45 (0.01)
Philippines 852 0.44 (0.02) 0.00 0.58 (0.01) 0.00 0.26 (0.01) 0.00 8,302 0.31 (0.01) 0.55 (0.00) 0.17 (0.01)
Latin America and the Caribbean
Brazil 403 0.32 (0.03) 0.00 0.57 (0.01) 0.00 0.18 (0.02) 0.00 2,442 0.16 (0.01) 0.54 (0.01) 0.09 (0.01)
Dominican Republic 354 0.38 (0.04) 0.00 0.58 (0.01) 0.34 0.22 (0.02) 0.00 3,198 0.27 (0.01) 0.57 (0.00) 0.15 (0.01)
Mexico 1,833 0.22 (0.01) 0.00 0.54 (0.01) 0.78 0.12 (0.01) 0.00 32,002 0.14 (0.01) 0.54 (0.00) 0.07 (0.00)
Paraguay 359 0.40 (0.03) 0.00 0.64 (0.01) 0.00 0.25 (0.02) 0.00 4,202 0.29 (0.01) 0.59 (0.00) 0.17 (0.01)
Notes: Standard errors are in parentheses and are adjusted for survey clustering and stratification. P-value for Adjusted Wald Test for difference in values across disability status. Poverty Cutoff: k/d = 40%. A person is considered poor if he/she is deprived in at least a sum of four out of 10 dimensions.
“H” is the multidimensional headcount which measures the share of people who are multi-dimensionally poor; “A” average deprivation share: the percentage of dimensions that the poor are deprived in; and “M0” is the adjusted headcount: the ratio of the number of deprivations experienced by the poor to the total number of possible deprivations that the entire population could experience.
Source: Authors' calculations based on WHS data.
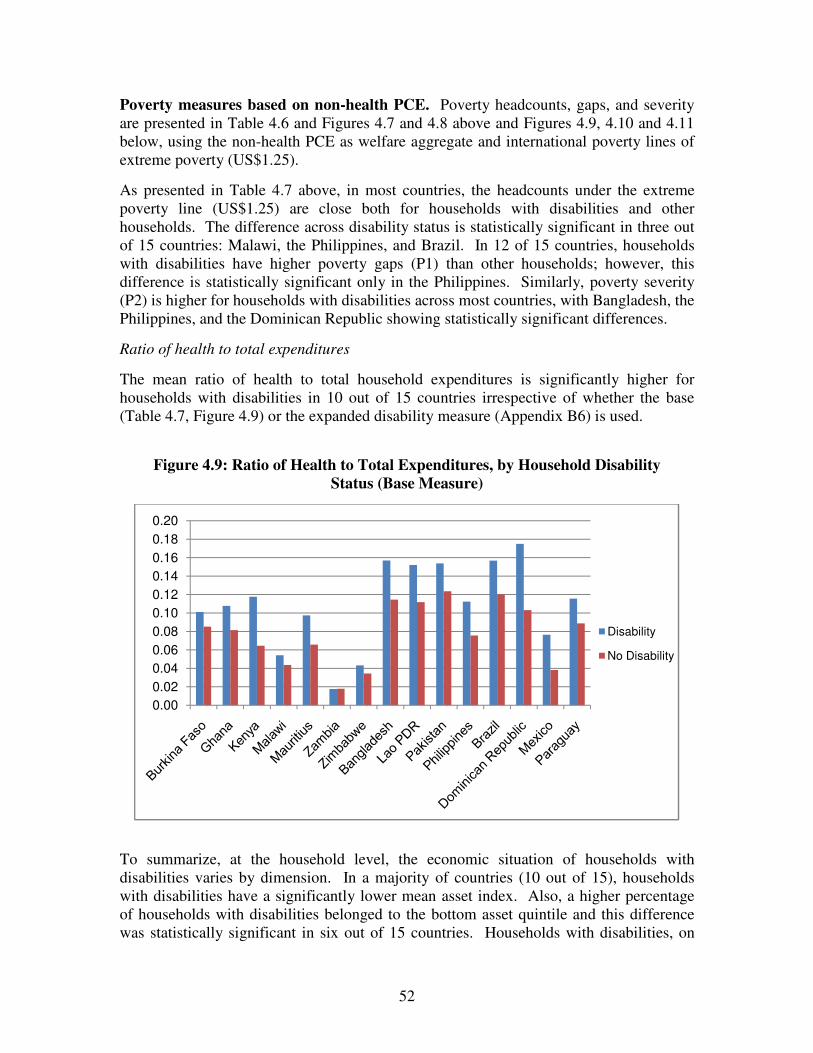
52
Poverty measures based on non-health PCE. Poverty headcounts, gaps, and severity are presented in Table 4.6 and Figures 4.7 and 4.8 above and Figures 4.9, 4.10 and 4.11 below, using the non-health PCE as welfare aggregate and international poverty lines of extreme poverty (US$1.25).
As presented in Table 4.7 above, in most countries, the headcounts under the extreme poverty line (US$1.25) are close both for households with disabilities and other households. The difference across disability status is statistically significant in three out of 15 countries: Malawi, the Philippines, and Brazil. In 12 of 15 countries, households with disabilities have higher poverty gaps (P1) than other households; however, this difference is statistically significant only in the Philippines. Similarly, poverty severity (P2) is higher for households with disabilities across most countries, with Bangladesh, the Philippines, and the Dominican Republic showing statistically significant differences.
Ratio of health to total expenditures
The mean ratio of health to total household expenditures is significantly higher for households with disabilities in 10 out of 15 countries irrespective of whether the base (Table 4.7, Figure 4.9) or the expanded disability measure (Appendix B6) is used.
Figure 4.9: Ratio of Health to Total Expenditures, by Household Disability
Status (Base Measure)
To summarize, at the household level, the economic situation of households with disabilities varies by dimension. In a majority of countries (10 out of 15), households with disabilities have a significantly lower mean asset index. Also, a higher percentage of households with disabilities belonged to the bottom asset quintile and this difference was statistically significant in six out of 15 countries. Households with disabilities, on
0.00
0.02
0.04
0.06
0.08
0.10
0.12
0.14
0.16
0.18
0.20
Disability
No Disability

53
average, also report spending a higher proportion of their expenditure on health care. The mean ratio of health to total household expenditures was significantly higher for households with disabilities in 10 out of 15 countries irrespective of whether the base or the expanded disability measure is used. In contrast, descriptive statistics do not suggest that households with disabilities were worse off as per mean non-health PCE. Only three countries had statistically significant lower mean non-health PCE and only five had the share of households in the bottom PCE quintile significantly higher among households with disabilities. In terms of poverty measures based on the PCE as a welfare aggregate, the difference in the poverty status between households with and without disabilities was statistically significant only in very few countries.
4.4. Multidimensional Poverty Measure
Results
In this section, we look at poverty through a multidimensional lens, using the dimensions that have been looked at so far one after the other: education, employment, assets/living conditions, household, and health services expenditures. All countries analyzed so far are included except Zimbabwe for which reliable PCE PPP data is not available. Results obtained using the method proposed by Alkire and Foster (2009) are presented in Table 4.8 above. A higher headcount is found among persons with disabilities for every country, as shown in Figure 4.10. The difference across disability status is found to be statistically significant in all countries except Ghana, Lao PDR, and Pakistan. The difference in the multidimensional headcount ratio across disability status is the largest in Kenya (15 percentage points) and the lowest in Burkina Faso (three percentage points).
Figure 4.10: Multidimensional Poverty Headcount Ratio across Disability
Status (Base Measure)
0
0.2
0.4
0.6
0.8
1
1.2
Disability
No Disability

54
The average deprivation share; that is, the total number of deprivations of the poor divided by the maximum number of deprivations that the poor could face, is significantly higher among persons with disabilities in nine out of 15 countries. In other words, in a majority of the countries under study, the poor with disabilities face more deprivations than the poor without disabilities. This is confirmed by the distribution of deprivation counts across disability status (Table 4.9).
Table 4.9: Deprivation Counts across Disability Status (Base Measure)
Number of deprivations
Persons without disabilities Percentage
Persons with disabilities Percentage
0 11,955 14% 502 7%
1 2,779 3% 151 2%
2 19,955 23% 1,243 17%
3 12,797 15% 1,157 15%
4 9,737 11% 832 11%
5 5,592 7% 619 8%
6 10,284 12% 1,111 15%
7 6,269 7% 886 12%
8 4,656 5% 696 9%
9 1,000 1% 269 4%
10 206 0% 56 1%
Total 85,230 100% 7,522 100%
Source: Authors' calculations based on WHS data.
Table 4.8 and Figure 4.11 present the adjusted headcount ratio M0, which is the ratio of total deprivations experienced by the poor to the total possible deprivations that the entire population could experience. The adjusted headcount ratio is found to be higher among persons with disabilities than persons without disabilities in all countries. The difference across disability status is statistically different from zero in all countries but Lao PDR and Pakistan. The difference in the adjusted headcount ratio across disability status is the largest in Mauritius: the adjusted headcount is four times higher among persons with disabilities compared to persons without disabilities.
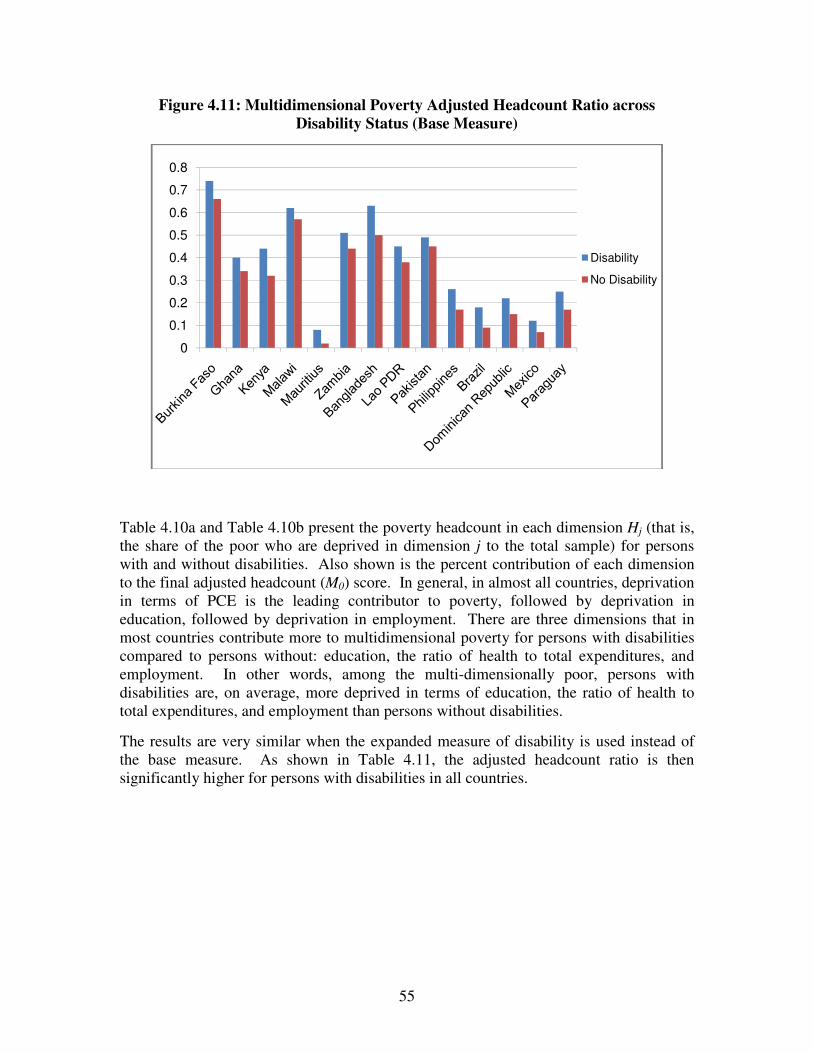
55
Figure 4.11: Multidimensional Poverty Adjusted Headcount Ratio across Disability Status (Base Measure)
Table 4.10a and Table 4.10b present the poverty headcount in each dimension Hj (that is, the share of the poor who are deprived in dimension j to the total sample) for persons with and without disabilities. Also shown is the percent contribution of each dimension to the final adjusted headcount (M0) score. In general, in almost all countries, deprivation in terms of PCE is the leading contributor to poverty, followed by deprivation in education, followed by deprivation in employment. There are three dimensions that in most countries contribute more to multidimensional poverty for persons with disabilities compared to persons without: education, the ratio of health to total expenditures, and employment. In other words, among the multi-dimensionally poor, persons with disabilities are, on average, more deprived in terms of education, the ratio of health to total expenditures, and employment than persons without disabilities.
The results are very similar when the expanded measure of disability is used instead of the base measure. As shown in Table 4.11, the adjusted headcount ratio is then significantly higher for persons with disabilities in all countries.
0
0.1
0.2
0.3
0.4
0.5
0.6
0.7
0.8
Disability
No Disability
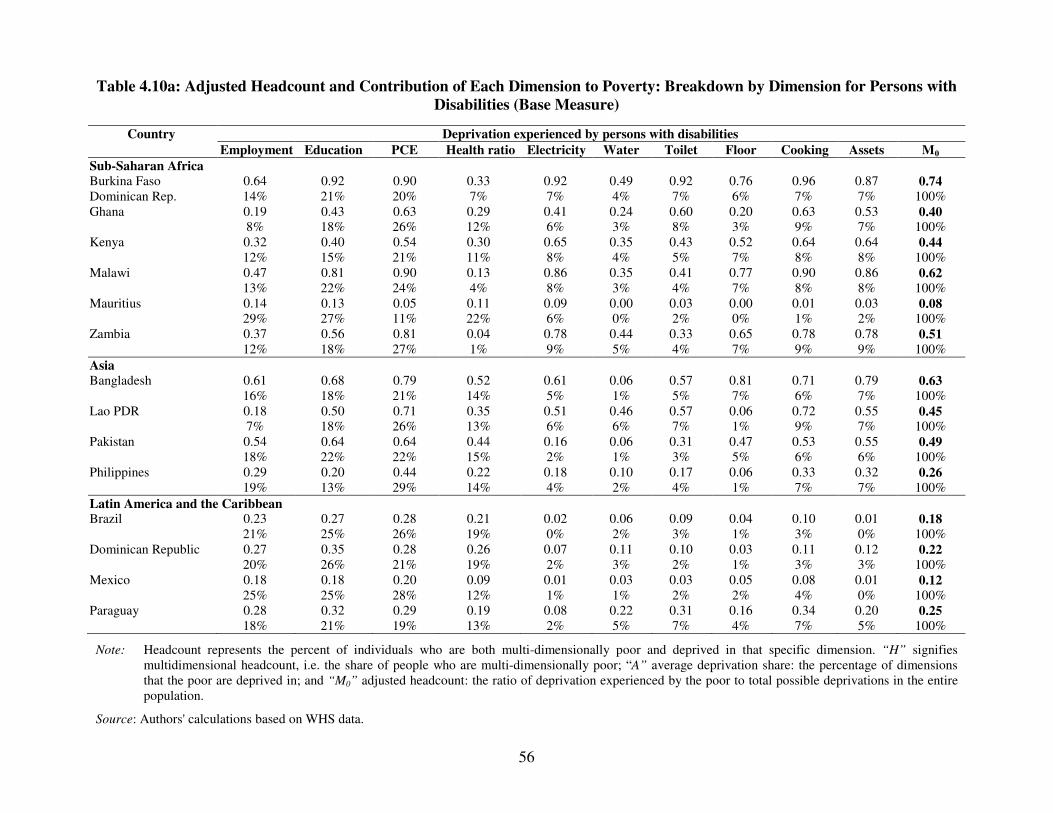
56
Table 4.10a: Adjusted Headcount and Contribution of Each Dimension to Poverty: Breakdown by Dimension for Persons with Disabilities (Base Measure)
Country Deprivation experienced by persons with disabilities
Employment Education PCE Health ratio Electricity Water Toilet Floor Cooking Assets M0
Sub-Saharan Africa Burkina Faso 0.64 0.92 0.90 0.33 0.92 0.49 0.92 0.76 0.96 0.87 0.74 Dominican Rep. 14% 21% 20% 7% 7% 4% 7% 6% 7% 7% 100% Ghana 0.19 0.43 0.63 0.29 0.41 0.24 0.60 0.20 0.63 0.53 0.40 8% 18% 26% 12% 6% 3% 8% 3% 9% 7% 100% Kenya 0.32 0.40 0.54 0.30 0.65 0.35 0.43 0.52 0.64 0.64 0.44 12% 15% 21% 11% 8% 4% 5% 7% 8% 8% 100% Malawi 0.47 0.81 0.90 0.13 0.86 0.35 0.41 0.77 0.90 0.86 0.62 13% 22% 24% 4% 8% 3% 4% 7% 8% 8% 100% Mauritius 0.14 0.13 0.05 0.11 0.09 0.00 0.03 0.00 0.01 0.03 0.08 29% 27% 11% 22% 6% 0% 2% 0% 1% 2% 100% Zambia 0.37 0.56 0.81 0.04 0.78 0.44 0.33 0.65 0.78 0.78 0.51 12% 18% 27% 1% 9% 5% 4% 7% 9% 9% 100% Asia Bangladesh 0.61 0.68 0.79 0.52 0.61 0.06 0.57 0.81 0.71 0.79 0.63 16% 18% 21% 14% 5% 1% 5% 7% 6% 7% 100% Lao PDR 0.18 0.50 0.71 0.35 0.51 0.46 0.57 0.06 0.72 0.55 0.45 7% 18% 26% 13% 6% 6% 7% 1% 9% 7% 100% Pakistan 0.54 0.64 0.64 0.44 0.16 0.06 0.31 0.47 0.53 0.55 0.49 18% 22% 22% 15% 2% 1% 3% 5% 6% 6% 100% Philippines 0.29 0.20 0.44 0.22 0.18 0.10 0.17 0.06 0.33 0.32 0.26
19% 13% 29% 14% 4% 2% 4% 1% 7% 7% 100% Latin America and the Caribbean Brazil 0.23 0.27 0.28 0.21 0.02 0.06 0.09 0.04 0.10 0.01 0.18 21% 25% 26% 19% 0% 2% 3% 1% 3% 0% 100% Dominican Republic 0.27 0.35 0.28 0.26 0.07 0.11 0.10 0.03 0.11 0.12 0.22 20% 26% 21% 19% 2% 3% 2% 1% 3% 3% 100% Mexico 0.18 0.18 0.20 0.09 0.01 0.03 0.03 0.05 0.08 0.01 0.12 25% 25% 28% 12% 1% 1% 2% 2% 4% 0% 100% Paraguay 0.28 0.32 0.29 0.19 0.08 0.22 0.31 0.16 0.34 0.20 0.25 18% 21% 19% 13% 2% 5% 7% 4% 7% 5% 100%
Note: Headcount represents the percent of individuals who are both multi-dimensionally poor and deprived in that specific dimension. “H” signifies multidimensional headcount, i.e. the share of people who are multi-dimensionally poor; “A” average deprivation share: the percentage of dimensions that the poor are deprived in; and “M0” adjusted headcount: the ratio of deprivation experienced by the poor to total possible deprivations in the entire population.
Source: Authors' calculations based on WHS data.

57
Table 4.10b: Adjusted Headcount and Contribution of Each Dimension to Poverty: Breakdown by Dimension for Persons without Disabilities (Base Measure)
Country Deprivation experienced by persons without disabilities
Employment Education PCE Health ratio Electricity Water Toilet Floor Cooking Assets M0
Sub-Saharan Africa Burkina Faso 0.39 0.87 0.87 0.27 0.87 0.46 0.84 0.73 0.92 0.85 0.66 Dominican Rep. 10% 22% 22% 7% 7% 4% 7% 6% 8% 7% 100% Ghana 0.18 0.30 0.56 0.21 0.38 0.23 0.56 0.18 0.57 0.49 0.34 9% 15% 27% 10% 6% 4% 9% 3% 9% 8% 100% Kenya 0.28 0.23 0.47 0.15 0.48 0.28 0.30 0.36 0.44 0.47 0.32 15% 12% 25% 8% 8% 5% 5% 6% 8% 8% 100% Malawi 0.46 0.72 0.86 0.12 0.82 0.24 0.34 0.70 0.85 0.84 0.57 13% 21% 25% 3% 8% 2% 3% 7% 8% 8% 100% Mauritius 0.04 0.03 0.02 0.04 0.03 0.00 0.01 0.00 0.00 0.01 0.02 28% 20% 17% 26% 6% 0% 1% 0% 1% 2% 100% Zambia 0.33 0.43 0.72 0.04 0.68 0.41 0.38 0.56 0.71 0.68 0.44 12% 16% 27% 1% 9% 5% 5% 7% 9% 8% 100% Asia Bangladesh 0.39 0.50 0.70 0.38 0.52 0.03 0.45 0.69 0.62 0.68 0.50 13% 17% 24% 13% 6% 0% 5% 8% 7% 8% 100% Lao PDR 0.13 0.42 0.61 0.31 0.45 0.37 0.49 0.05 0.62 0.49 0.38 6% 18% 27% 13% 7% 5% 7% 1% 9% 7% 100% Pakistan 0.38 0.54 0.63 0.38 0.18 0.11 0.39 0.51 0.61 0.52 0.45 14% 20% 23% 14% 2% 1% 5% 6% 8% 6% 100% Philippines 0.21 0.11 0.30 0.12 0.12 0.06 0.14 0.05 0.22 0.23 0.17
20% 11% 30% 12% 4% 2% 4% 2% 7% 7% 100% Latin America and the Caribbean Brazil 0.12 0.10 0.15 0.10 0.00 0.02 0.05 0.02 0.05 0.00 0.09 23% 19% 28% 20% 0% 2% 3% 1% 3% 0% 100% Dominican Republic 0.16 0.24 0.23 0.15 0.06 0.08 0.08 0.04 0.09 0.10 0.15 18% 26% 25% 16% 2% 3% 3% 1% 3% 4% 100% Mexico 0.10 0.10 0.13 0.04 0.01 0.02 0.03 0.05 0.07 0.00 0.07 24% 24% 29% 9% 1% 2% 2% 4% 5% 0% 100% Paraguay 0.15 0.19 0.24 0.13 0.06 0.17 0.23 0.13 0.26 0.15 0.17 14% 19% 23% 12% 2% 5% 7% 4% 8% 5% 100%
Note: Headcount represents the percent of individuals who are both multi-dimensionally poor and deprived in that specific dimension. “H” signifies multidimensional headcount, i.e. the share of people who are multi-dimensionally poor; “A” average deprivation share: the percentage of dimensions that the poor are deprived in; and “M0” adjusted headcount: the ratio of deprivation experienced by the poor to total possible deprivations in the entire population.
Source: Authors' calculations based on WHS data.
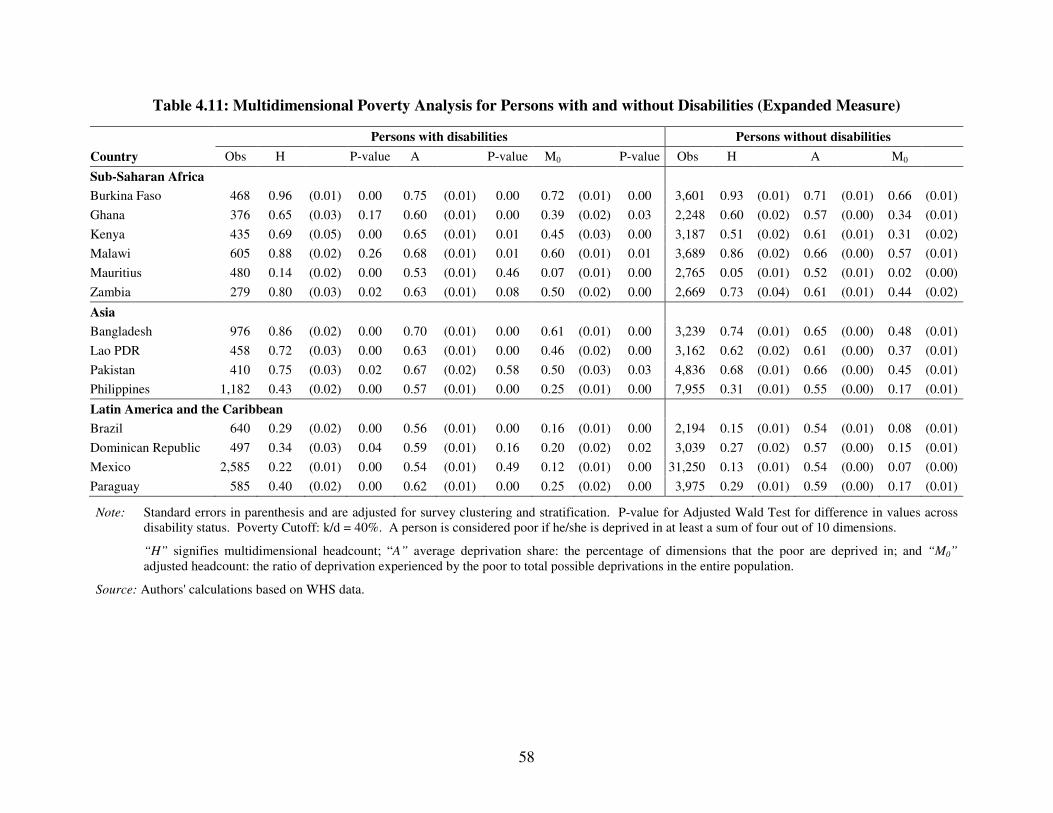
58
Table 4.11: Multidimensional Poverty Analysis for Persons with and without Disabilities (Expanded Measure)
Country
Persons with disabilities Persons without disabilities
Obs H P-value A P-value M0 P-value Obs H A M0
Sub-Saharan Africa
Burkina Faso 468 0.96 (0.01) 0.00 0.75 (0.01) 0.00 0.72 (0.01) 0.00 3,601 0.93 (0.01) 0.71 (0.01) 0.66 (0.01)
Ghana 376 0.65 (0.03) 0.17 0.60 (0.01) 0.00 0.39 (0.02) 0.03 2,248 0.60 (0.02) 0.57 (0.00) 0.34 (0.01)
Kenya 435 0.69 (0.05) 0.00 0.65 (0.01) 0.01 0.45 (0.03) 0.00 3,187 0.51 (0.02) 0.61 (0.01) 0.31 (0.02)
Malawi 605 0.88 (0.02) 0.26 0.68 (0.01) 0.01 0.60 (0.01) 0.01 3,689 0.86 (0.02) 0.66 (0.00) 0.57 (0.01)
Mauritius 480 0.14 (0.02) 0.00 0.53 (0.01) 0.46 0.07 (0.01) 0.00 2,765 0.05 (0.01) 0.52 (0.01) 0.02 (0.00)
Zambia 279 0.80 (0.03) 0.02 0.63 (0.01) 0.08 0.50 (0.02) 0.00 2,669 0.73 (0.04) 0.61 (0.01) 0.44 (0.02)
Asia
Bangladesh 976 0.86 (0.02) 0.00 0.70 (0.01) 0.00 0.61 (0.01) 0.00 3,239 0.74 (0.01) 0.65 (0.00) 0.48 (0.01)
Lao PDR 458 0.72 (0.03) 0.00 0.63 (0.01) 0.00 0.46 (0.02) 0.00 3,162 0.62 (0.02) 0.61 (0.00) 0.37 (0.01)
Pakistan 410 0.75 (0.03) 0.02 0.67 (0.02) 0.58 0.50 (0.03) 0.03 4,836 0.68 (0.01) 0.66 (0.00) 0.45 (0.01)
Philippines 1,182 0.43 (0.02) 0.00 0.57 (0.01) 0.00 0.25 (0.01) 0.00 7,955 0.31 (0.01) 0.55 (0.00) 0.17 (0.01)
Latin America and the Caribbean
Brazil 640 0.29 (0.02) 0.00 0.56 (0.01) 0.00 0.16 (0.01) 0.00 2,194 0.15 (0.01) 0.54 (0.01) 0.08 (0.01)
Dominican Republic 497 0.34 (0.03) 0.04 0.59 (0.01) 0.16 0.20 (0.02) 0.02 3,039 0.27 (0.02) 0.57 (0.00) 0.15 (0.01)
Mexico 2,585 0.22 (0.01) 0.00 0.54 (0.01) 0.49 0.12 (0.01) 0.00 31,250 0.13 (0.01) 0.54 (0.00) 0.07 (0.00)
Paraguay 585 0.40 (0.02) 0.00 0.62 (0.01) 0.00 0.25 (0.02) 0.00 3,975 0.29 (0.01) 0.59 (0.00) 0.17 (0.01)
Note: Standard errors in parenthesis and are adjusted for survey clustering and stratification. P-value for Adjusted Wald Test for difference in values across disability status. Poverty Cutoff: k/d = 40%. A person is considered poor if he/she is deprived in at least a sum of four out of 10 dimensions.
“H” signifies multidimensional headcount; “A” average deprivation share: the percentage of dimensions that the poor are deprived in; and “M0” adjusted headcount: the ratio of deprivation experienced by the poor to total possible deprivations in the entire population.
Source: Authors' calculations based on WHS data.
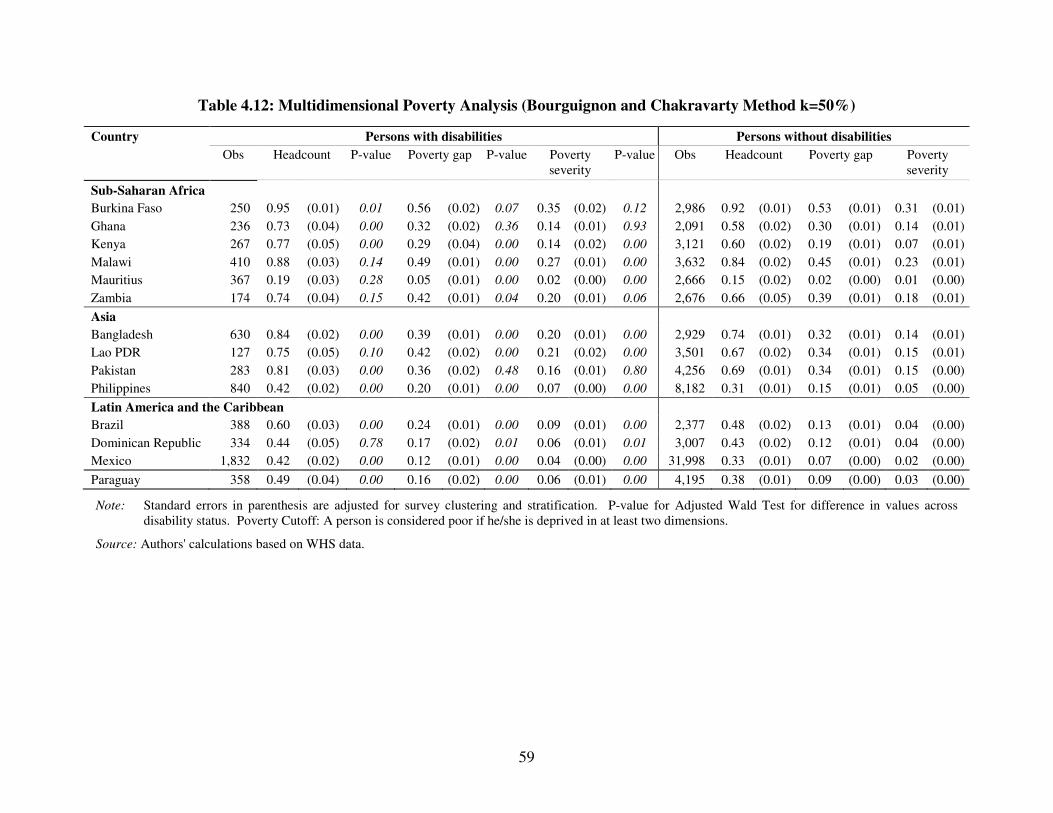
59
Table 4.12: Multidimensional Poverty Analysis (Bourguignon and Chakravarty Method k=50%)
Country Persons with disabilities Persons without disabilities
Obs Headcount
P-value Poverty gap P-value Poverty severity
P-value Obs Headcount
Poverty gap Poverty severity
Sub-Saharan Africa
Burkina Faso 250 0.95 (0.01) 0.01 0.56 (0.02) 0.07 0.35 (0.02) 0.12 2,986 0.92 (0.01) 0.53 (0.01) 0.31 (0.01)
Ghana 236 0.73 (0.04) 0.00 0.32 (0.02) 0.36 0.14 (0.01) 0.93 2,091 0.58 (0.02) 0.30 (0.01) 0.14 (0.01)
Kenya 267 0.77 (0.05) 0.00 0.29 (0.04) 0.00 0.14 (0.02) 0.00 3,121 0.60 (0.02) 0.19 (0.01) 0.07 (0.01)
Malawi 410 0.88 (0.03) 0.14 0.49 (0.01) 0.00 0.27 (0.01) 0.00 3,632 0.84 (0.02) 0.45 (0.01) 0.23 (0.01)
Mauritius 367 0.19 (0.03) 0.28 0.05 (0.01) 0.00 0.02 (0.00) 0.00 2,666 0.15 (0.02) 0.02 (0.00) 0.01 (0.00)
Zambia 174 0.74 (0.04) 0.15 0.42 (0.01) 0.04 0.20 (0.01) 0.06 2,676 0.66 (0.05) 0.39 (0.01) 0.18 (0.01)
Asia
Bangladesh 630 0.84 (0.02) 0.00 0.39 (0.01) 0.00 0.20 (0.01) 0.00 2,929 0.74 (0.01) 0.32 (0.01) 0.14 (0.01)
Lao PDR 127 0.75 (0.05) 0.10 0.42 (0.02) 0.00 0.21 (0.02) 0.00 3,501 0.67 (0.02) 0.34 (0.01) 0.15 (0.01)
Pakistan 283 0.81 (0.03) 0.00 0.36 (0.02) 0.48 0.16 (0.01) 0.80 4,256 0.69 (0.01) 0.34 (0.01) 0.15 (0.00)
Philippines 840 0.42 (0.02) 0.00 0.20 (0.01) 0.00 0.07 (0.00) 0.00 8,182 0.31 (0.01) 0.15 (0.01) 0.05 (0.00)
Latin America and the Caribbean
Brazil 388 0.60 (0.03) 0.00 0.24 (0.01) 0.00 0.09 (0.01) 0.00 2,377 0.48 (0.02) 0.13 (0.01) 0.04 (0.00)
Dominican Republic 334 0.44 (0.05) 0.78 0.17 (0.02) 0.01 0.06 (0.01) 0.01 3,007 0.43 (0.02) 0.12 (0.01) 0.04 (0.00)
Mexico 1,832 0.42 (0.02) 0.00 0.12 (0.01) 0.00 0.04 (0.00) 0.00 31,998 0.33 (0.01) 0.07 (0.00) 0.02 (0.00)
Paraguay 358 0.49 (0.04) 0.00 0.16 (0.02) 0.00 0.06 (0.01) 0.00 4,195 0.38 (0.01) 0.09 (0.00) 0.03 (0.00)
Note: Standard errors in parenthesis are adjusted for survey clustering and stratification. P-value for Adjusted Wald Test for difference in values across disability status. Poverty Cutoff: A person is considered poor if he/she is deprived in at least two dimensions.
Source: Authors' calculations based on WHS data.

60
Robustness checks
To check the robustness of the multidimensional poverty measure estimates, several checks were conducted. Results are identical when the cutoff across dimensions is set at 30 percent instead of 40 percent (Appendix B7). Next, more restrictive thresholds within dimensions are used.37 Again, similar results hold (Appendix B8). A third robustness check was performed by dropping the indicator for PCE from the calculations and redistributing weights equally across the remaining nine dimensions. Since this had little effect on the overall multidimensional scores, the results of this check are not presented.
In a final check to this analysis, Table 4.12 above shows the results of the Bourguignon and Chakravarty (2003) method applied to persons with and without disabilities. An individual is considered poor if he or she falls under two of four dimensional thresholds (k/d=50%). In nine out of 15 countries, persons with disabilities have a significantly higher multidimensional poverty headcount compared to persons without disabilities. The difference in poverty headcounts between persons with disabilities and persons without ranges from one percentage point in Burkina Faso to 20 percentage points in Brazil. Regarding the multidimensional gap, all countries show statistically significant and higher gaps for persons with disabilities. The multidimensional poverty severity is significantly higher in all countries but Ghana.
Like for Alkire and Foster, the Bourguignon and Chakravarty method’s results are sensitive to the share of dimensions for which one needs to experience deprivation to be identified as poor. Calculations for Appendix B9 use a less restrictive cutoff (k/d=25%). Even with this low threshold, the results hold: poverty headcounts are higher for persons with disabilities in nine out of 15 countries; the multidimensional poverty gap is higher in all countries, and the multidimensional poverty severity in 14 out of 15 countries.
To conclude, the results from the multidimensional poverty analysis presented above suggest that in a majority of the countries under study, persons with disabilities, on average, experience multiple deprivations at higher rates and in higher depth than persons without disabilities. The results for the multidimensional headcount using the Bourguignon and Chakravarty method focusing on continuous dimensions of poverty are somewhat more mixed than in the case of the Alkire and Foster method using both continuous and dichotomous dimensions of poverty. The multidimensional poverty headcount is significantly higher for persons with disabilities in nine out of 14 using Bourguignon and Chakravarty with k/d=25% or k/d=50%, and in 12 countries using the Alkire and Foster method (with k/d=30% or 40%). There is less variation in the results for the multidimensional poverty measures that adjust for the range and severity of deprivations such as Alkire and Foster’s adjusted headcount (M0) and Bourguignon and Chakravarty’s gap and poverty severity. Using these measures and depending on the cross-dimensional cutoff (k/d), persons with disabilities are significantly more prone to multidimensional poverty in 11 to 14 of the 14 countries under study.
37 For PCE, the US$1.25 a day poverty line is used instead of US$2 a day. For the ratio of health to total expenditures, a person is considered to be deprived if the ratio is above 15 percent instead of 10 percent in the base case.
61
5. CONCLUSIONS
Using WHS data, this study investigates the economic status of persons with disabilities in 15 developing countries, presenting a snapshot picture of several indicators of economic well-being at the individual and household levels.
This study has several limitations which reflect the limitations of the data set. First, results cannot be generalized for low and middle income countries as a whole, given that the 15 countries included in the study may not be representative of all developing countries. Second, it is not possible to exactly identify households with and without disabilities given the WHS sample design: not all household members responded to disability questions. Because of this WHS feature, disability prevalence at the household level may be underestimated and economic disparities across household disability status may not be accurately measured and may be biased toward zero. Third, the recall period (30 days) may lead to an overestimate of disability prevalence, as well as affect other indicators. For instance, it could have elevated the spending on health care, because of spending associated with the temporary health conditions. Fourth, using a relatively modest set of expenditure-related set of questions may lead to an overestimate of the household expenditure poverty across the board. Again, one cannot predict how this might affect the comparison between households with and without disabilities.
Furthermore, the authors of this study decided not to conduct a multivariable regression analysis, because of the endogeneity of disability and economic deprivation. As explained earlier, disability and economic deprivation are linked through a two-way causation. In snapshot data, one would not be able to disentangle whether the onset of disability has led to deprivation or persons with disabilities were already deprived before becoming disabled, thus potentially creating a misleading picture of the relationship between disability and disadvantage.
Keeping in mind data limitations, the following picture on the economic status of persons with disabilities and their households in 15 developing countries emerges.
First, looking across all five dimensions of economic well-being explored in this study (education, employment, assets/living conditions, household expenditures, and household expenditures on health care), one finds in all the countries that persons with disabilities as a group are significantly worse off in two or more dimensions in 14 out of 15 countries (Table 5.1).38
Second, disability is significantly associated with multidimensional poverty in 11 to 14 of the 14 developing countries under study.39 In other words, persons with disabilities are more likely to experience multiple deprivations than persons without disabilities. This
38 In one country (Zambia), persons with disabilities are worse off in only one dimension (education). 39 One of the 15 countries under study (Zimbabwe) was not included in the analysis using PPP PCE data, and in the multidimensional poverty analysis.

62
result holds when different multi-dimensional poverty measures and poverty thresholds (within and across dimensions) are used.
Table 5.1: Summary of Economic Indicator Comparisons across Disability Status
Country Individual education Individual employment
Assets/Living condition
Household expenditures
Healthcare expenditures
Lower mean
years of education
Lower primary school
completion
Lower employment
rate
Lower mean asset index
Higher percentage in bottom quintile
Lower mean non-health PCE
Higher percentage in bottom quintile
Higher ratio of health-to-
total expenditures
Sub-Saharan Africa Burkina Faso - - * * * - - - Ghana * * - - - - - * Kenya - * - * * - - * Malawi * * - * - - * - Mauritius * * * * * * - * Zambia * * - - - - - - Zimbabwe * * - * - NA NA NA Asia Bangladesh * * * * * - * * Lao PDR * * - * - - * - Pakistan * * * * - - - * Philippines * * * * * - * * Latin America and the Caribbean Brazil * * * * * * * * Dominican Republic - * * - - - - * Mexico * * * - - * - * Paraguay * * * * - - - *
Total 12 14 9 11 6 3 5 10
Note: * Indicates that persons/households with disabilities experience a statistically significant (at least at 5 percent) worse economic well-being outcome in the particular category. NA stands for not available.
Third, at the individual level, in most of the countries included in the study, persons with disabilities have lower educational attainment and experience lower employment rates than persons without disabilities. In education, they have fewer years of education and lower primary school completion rates. Similarly, they have lower employment rates than persons without disabilities. In a majority (60 percent) of the countries the difference in employment rates to the detriment of disabled people was statistically significant.
Fourth, at the household level, in most of the countries (11 out of 15), households with disabilities have a significantly lower mean asset index. Also, a higher percentage of households with disabilities belong to the bottom asset quintile; this difference was statistically significant in six out of 14 countries. Households with disabilities, on average, also report spending a higher proportion of their expenditure on health care: the mean ratio of health to total household expenditures was significantly higher for households with disabilities in two thirds of the countries.
63
Fifth, descriptive statistics suggest that in most countries households with disabilities are not worse off when their well-being is measured by mean non-health PCE. Similar results were obtained for the poverty headcount, gap, and severity based on the PCE as welfare aggregate. This result should be treated with caution given that it might be influenced by the limitations of the WHS sampling design when it comes to identify the disability status of a household and its small set of questions on expenditures.
Possible policy implications
Although this study does not discuss policies, the findings broadly point to three possible policy implications.
First, the results that in all the countries under study, persons with disabilities are significantly worse off in three to four dimensions of economic well-being, and in most countries experience multiple deprivations, is a call for further research and action on poverty among persons with disabilities.
Second, policies and programs to improve socioeconomic status of people with disabilities and their families need to be adapted to country specific contexts. This study does not find a single economic indicator for which persons with disabilities are systematically worse off in all countries, suggesting that the processes whereby disability and poverty are related are complex and vary from country to country. A more in-depth analysis would be needed at the country level to develop specific and contextualized policy recommendations.
Third, results from the analyses within dimensions of economic well-being suggest that policies that promote access to education, health care and employment may be particularly important for the well-being of persons and households with disabilities.
Further research and data collection
This study examines the economic status of persons with disabilities and their households in 15 developing countries using the 2002-2004 WHS data. The results tempt for more research on disability and social and economic outcomes in developing countries.
First and foremost, research is needed on the causal pathways between disability and poverty to understand how in a developing country context, disability may lead to poverty and vice versa. It is necessary to bring causal pathways into light in order to make specific policy recommendations, at the country level, on how to reduce poverty among persons with disabilities, and how to curb the incidence of disability among the poor. For instance, if unemployment is relatively high among persons with disabilities, what are the causes? It becomes necessary to investigate the causes of unemployment in each labor market. Possible causes are numerous. For example, on the demand side, it could be the result of prejudice or discrimination by the employer. On the supply side, it could come from low self-expectations that lead to a decision not to join the labor force or from low skills level that may decrease chances of getting a job.
Second, comprehensive poverty profiles of persons and households with disabilities are needed at the country level investigating in detail the extent and the causes of economic deprivation.

64
Last, research is needed to evaluate interventions such as income support and programs to economically empower persons with disabilities in developing countries. Some interventions, such as community-based rehabilitation, have long been in the field, but little is known on what works.
All three areas of research suggested above need more and better data on disabled people and their households. The disability data measurement field has made advances since the WHS was fielded in 2002-2004. The Washington Group has made recommendations on disability questions that a number of countries have adopted for their population census. The Washington Group has continued technical work on a number of household survey questions related to disability (Miller et al. 2010). Although the WHS provides unique data in the area of disability and economic well-being, we recommend that a modified version of the WHS be fielded that (i) builds upon technical advances made by the Washington Group in disability measurement; (ii) enables valid estimates of both individual and household level disability prevalence for an analysis of household level economic outcomes; (ii) has a longitudinal design so as to enable an analysis of the causal links between disability and economic well being.
Longitudinal data is necessary to assess the causal pathways between disability and poverty. In developing countries, the longitudinal household surveys are rare and those that include disability questions are all but lacking. Cross-sectional data need to improve on the disability questions and sample design that would also allow researchers to draw reliable estimates on persons and households with disability. Last, but not least, better data collection is needed to investigate the access and affordability of health care for persons with disabilities in developing countries. This study found a higher health to total household expenditure ratio for households with disabilities in most countries, but did not have data on access to health services at the individual level.40
40 The WHS includes a question on access to healthcare services at the individual level, but data was often missing in lots of the countries under study.
65
REFERENCES
Alkire, S. and J. E. Foster. 2009. “Counting and Multidimensional Poverty Measurement.” Working Paper 7. Oxford Poverty and Human Development Initiative. Forthcoming in Journal of Public Economics.
Alkire, S. and M. E. Santos. 2010. “Acute Multidimensional Poverty: A New Index for Developing Countries.” Working Paper 38. Oxford Poverty and Human Development Initiative.
Altman, B. 2001. “Disability Definitions, Models, Classification Schemes, and Applications”. In Handbook of Disability Studies, ed. G. Albrecht, K. Seelman, and M. Bury. Sage Publications.
Baldwin, M. L. and W. G. Johnson. 1994. “Labor Market Discrimination against Men with Disabilities. “Journal of Human Resources 29(1): 1 – 19.
______. 2006. “A Critical Review of Studies of Discrimination against Workers with Disabilities.” In Handbook on the Economics of Discrimination, ed. W. Rodgers. Edward Elgar Publishing.
Banerjee, A., A. Deaton, and E. Duflo. 2004. “Wealth, Health, and Health Services in Rural Rajasthan.” American Economic Review Papers and Proceedings 94(2): 326-330.
Benitez-Silva, H., M. Buchinsky, H.M. Chan, J. Rust, and S. Sheidvasser. 2004. “How Large is the Bias in Self-Reported Disability Status?” Journal of Applied Econometrics 19(6): 649-670.
Berki, S.E. 1986. “A Look at Catastrophic Medical Expenses and the Poor.” Health Affairs 5(4): 138-145.
Bound, J., and R. V. Burkhauser. 1999. “Economic Analysis of Transfer Programs Targeted on People with Disabilities.” In Handbook of Labor Economics, vol. 3C, 3417-3528. North Holland: Elsevier Science.
Bourguignon, F., and S. R. Chrakravarty. 2003. “The Measurement of Multidimensional Poverty.” Journal of Economic Inequality 1: 25-49.
Braithwaite, J., and Daniel Mont. 2009. “Disability and Poverty: A Survey of World Bank Poverty Assessments and Implications.” ALTER - European Journal of Disability
Research/Revue Européenne de Recherche sur le Handicap 3(3): 219-232.
Buddelmeyer, H., and S. Verick. 2008. “Understanding the Drivers of Poverty Dynamics in Australian Households.” The Economic Record 84(266): 310-321.
66
Burchardt, T. 2000. “The Dynamics of Being Disabled.” Working Paper 36. Center for the Analysis of Social Exclusion.
Contreras, D. G., J. V. Ruiz-Tagle, P. Garcez, and I. Azocar. 2006. Socio-Economic Impact of
Disability in Latin America: Chile and Uruguay. Chile: Universidad de Chile, Departemento de Economia.
Cullinan, J., B. Gannon, and S. Lyons. 2010. “Estimating the Extra Cost of Living for People with Disabilities.” Health Economics. http://www.interscience.wiley.com. DOI: 10.1002/hec.1619.
Currie, Janet, and B.C. Madrian (1999). “Health, Health Insurance and the Labor Market.” In O. Ashenfelter and D. Card (eds.), Handbook of Labor Economics, 3:3 (Elsevier), 3309-3416.
Cutler, D., A. Deaton, and A. Lleras-Muney. 2006. “The Determinants of Mortality.” Journal of
Economic Perspectives 20(3): 97-120.
Deaton, A. 1997. The Analysis of Household Surveys: A Microeconometric Approach to
Development Policy. Baltimore: Johns Hopkins University Press for the World Bank.
Eide, A., S. Nhiwathiwa, J. Muderedzi, and M. Loeb. 2003a. “Living Conditions among People with Activity Limitations in Zimbabwe.” A Regional Representative Survey, SINTEF Health Research, Oslo, Norway. http://www.safod.org/Images/LCZimbabwe.pdf.
Eide, A., G. van Rooy, and M. Loeb. 2003b. “Living Conditions among People with Activity Limitations in Namibia.” A National Representative Survey, SINTEF Health Research, Oslo, Norway. http://www.safod.org/Images/LCNamibia.pdf.
Eide, A., and M. Loeb. 2006. “Living Conditions among People with Activity Limitations in Zambia. A National Representative Study, SINTEF Health Research, Oslo, Norway. http://www.sintef.no/upload/Helse/Levek%C3%A5r%20og%20tjenester/ZambiaLCweb.pdf.
Eide, A., and Y. Kamaleri. 2009. “Living Conditions among People with Disabilities in Mozambique.” A National Representative Study, SINTEF Health Research, Oslo, Norway. http://www.sintef.no/upload/Helse/Levekår%20og%20tjenester/LC%20Report%20Mozambique%20-%202nd%20revision.pdf
Evans T. 1989. “The Impact of Permanent Disability on Rural Households: River Blindness in Guinea.” IDS Bulletin. Institute of Development Studies, Sussex, UK.
Fafchamps, M., and B. Kebede. 2008. “Subjective Well-being, Disability and Adaptation: A Case Study from Rural Ethiopia.” In Adaptation and Well-being, ed. David Clark. London: Cambridge University Press.
67
Filmer, D. 2008. “Disability, Poverty and Schooling in Developing Countries: Results from 14 Household Surveys.” The World Bank Economic Review 22(1): 141-163.
Filmer, D., and L. H. Pritchett. 2001. “Estimating Wealth Effects without Expenditure Data - or Tears: An Application to Educational Enrollments in States of India.” Demography 38(1): 115-132.
Foster, J., J. Greer, and E. Thorbecke. 1984. “Notes and Comments a Class of Decomposable Poverty Measures.” Econometrica 52:761-76.
Gannon, B., and B. Nolan. 2004. “Disability and Labor Market Participation in Ireland.” Economic and Social Review 35(2): 135-155.
Gertler, P., and J. Gruber. 2002. “Insuring Consumption against Illness.” American Economic
Review 92(1):51-70.
Gottlieb, C., M. Maenner, and M. Durkin. 2009. “Child Disability Screening, Nutrition, and Early Learning in 18 Countries with Low and Middle Incomes: Data from the Third Round of UNICEF’s Multiple Indicator Cluster Survey (2005–06).” Lancet 374: 1831–39.
Gwatkin, D. R., S. Rutstein, K. Johnson, E. Suliman, A. Wagstaff, and A. Amouzou. 2007. “Socioeconomic Differences in Health, Nutrition, and Population within Developing Countries.” Working Paper 30544, World Bank, Washington, DC.
Heitmueller, A. 2005. “The Chicken or the Egg? Endogeneity in Labor Market Participation of Informal Careers in England.” Department for Work and Pensions, London. Also in IZA Discussion Paper No. 1366, October 2004.
Hoogeveen, J. G. 2005. “Measuring Welfare for Small but Vulnerable Groups: Poverty and Disability in Uganda.” Journal of African Economies 14(4): 603-631.
Horner, R.D., J. W. Swanson, H. B. Bosworth, and D. B. Matchar. 2003. “VA Acute Stroke (VAST) Study Team. Effects of Race and Poverty on the Process and Outcome of Inpatient Rehabilitation Services among Stroke Patients.” Stroke 34(4):1027-31.
Houtenville, A. J., D. C. Stapleton, R. R. Weathers II, and R. V. Burkhauser, eds. 2009. Counting Working-Age People with Disabilities, What Current Data Tell Us and Options
for Improvement. Michigan: W.E. Upjohn Institute for Employment Research.
de Janvry, A. D., and R. Kanbur, eds. 2006. Poverty, Inequality and Development: Essays in
Honor of Erik Thorbecke, Vol. 1. Springer.
Jenkins, S. P., and J. A. Rigg. 2003. “Disability and Disadvantage: Selection, Onset and Duration Effects.” CASE Paper 74, Centre for Analysis of Social Exclusion, London School of Economics, November 2003.
68
Kaler, S.G. 2008. “Diseases of Poverty with High Mortality in Infants and Children: Malaria, Measles, Lower Respiratory Infections, and Diarrheal Illnesses.” Ann. N.Y. Acad. Sci. 1136: 28–31.
Kish, L. 1965. Survey Sampling. New York: John Wiley and Sons Inc.
Kuklys, W., and I. Robeyns. 2004. “Sen’s Capability Approach to Welfare Economics.” Cambridge Working Paper in Economics 0415, Cambridge University, Cambridge.
Lancet. 2008. “Maternal and Child Undernutrition”, Special Series, Lancet, January 2008.
Lipton, M., and M. Ravalion. 1995. “Poverty and Policy.” In Handbook of Development
Economics, ed. J. Behrman and T. N. Srinivasan, T. N., Vol. 3, 2551-2657. Amsterdam: Elsevier.
Loeb, M., and H. Eide. 2004. “Living Conditions among People with Activity Limitations in Malawi.” A National Representative Study, SINTEF Health Research, Oslo, Norway. http://www.safod.org/Images/LCMalawi.pdf.
Loeb, M., A. Eide, J. Jelsma, M. Toni, and S. Maart. 2008. “Poverty and Disability in Eastern and Western Cape Provinces, South Africa.” Disability and Society 23(4): 311-321.
Maulik, P.K., and G. L. Damstadt. 2007. “Childhood Disabilities in Low and Middle Income Countries: Overview of Screening, Prevention, Services, Legislation and Epidemiology.” Pediatrics 120(Supplement 1): S1-55.
Mete, C., ed. 2008. Economic Implications of Chronic Illness and Disability in Eastern Europe
and the Former Soviet Union. Washington, D.C.: World Bank.
Meyer, B.D., and W.K.C. Mok. 2008. “Disability, Earnings, Income and Consumption.” Working Paper No. 06.10, Harris School of Public Policy Studies, University of Chicago.
Miller, K. 2003. “Conducting Cognitive Interviews to Understand Question-Response Limitations.” American Journal of Health Behavior 27(3): S264-272.
Miller, K., D. Mont, A. Maitland, B. Altman, and J. Madans. 2010. “Results of a Cross-national Structured Cognitive Interviewing Protocol to Test Measures of Disability.” Quality and
Quantity 45(4): 801-815, DOI: 10.1007/s11135-010-9370-4.
Mitra, S. 2006. The Capability Approach and Disability, Journal of Disability Policy Studies
(Sage) 16(4): 236-247.
Mitra, S. 2008. “The Recent Decline in the Employment of Persons with Disabilities in South Africa, 1998-2006.” South African Journal of Economics 76(3): 480-492.
Mitra, S., and U. Sambamoorthi. 2008. “Disability and the Rural Labor Market in India: Evidence for Males in Tamil Nadu.” World Development 36(5):934-952.

69
Mitra, S., P. Findley, and U. Sambamoorthi. 2009. “Healthcare Expenditures of Living with a Disability: Total Expenditures, Out of Pocket Expenses and Burden, 1996-2004.” Archives of Physical Medicine and Rehabilitation 90:1532-1540.
Mont, D. 2007. “Measuring Disability Prevalence.” SP Discussion Paper No. 706, World Bank, Washington, D.C.
Mont., D and N. Viet Cuong forthcoming, Disability and Poverty in Vietnam, World Bank
Economic Review.
Murray, C. J.L., and L. C. Chen. 1992. “Understanding Morbidity Change.” Population and
Development Review 18(3): 481-503.
OECD (Organisation for Economic Co-operation and Development). 2003. Transforming
Disability into Ability: Policies to Promote Work and Income Security for Disabled
People. Paris: OECD.
______. 2009. Sickness, Disability and Work: Keeping on Track in the Economic Downturn. Paris: OECD.
Palmer, M., N. Thuy, Q. Quyen, D. Duy, H. Huynh, and H. Berry. 2010. “Disability Measures as an Indicator of Poverty: A Case Study from Viet Nam.” Journal of International
Development DOI: 10.1002/jid.1715.
Parodi, G., and D. Sciulli. 2008. “Disability in Italian Households: Income, Poverty and Labour Market Participation.” Applied Economics 40(20):2615-2630
Peters, A., A. Garg, G. Bloom, D. G. Walker, W. R. Brieger, and H. Rahman. 2008. “Poverty and Access to Health Care in Developing Countries.” Annals of New York Academy of
Sciences 1136: 161-171.
Ranson, M. K. 2002. “Reduction of Catastrophic Healthcare Expenditures by a Community-based Health Insurance Scheme in Gujarat, India: Current Experiences and Challenges.” Bull World Health Organ 80: 613-21.
Rauh, V. A., P. J. Landrigan, and L. Claudio. 2008. “Housing and Health Intersection of Poverty and Environmental Exposures.” Annals of New York Academy of Sciences 1136: 276-288.
Ravallion, M. 1992. “Poverty Comparisons: A Guide to Concepts and Methods.” Working Paper No. 88, Living Standards Measurement Study.
Rischewski, D., H. Kuper, O. Atijosan, V. Simms, M. Jofret-Bonet, A. Foster, and C. Lavy. 2008. “Poverty and Musculoskeletal Impairment in Rwanda.” Transactions of the Royal
Society of Tropical Medicine and Hygiene 102: 608-617.
Saunders, P. 2007. “The Costs of Disability and the Incidence of Poverty.” Australian Journal of
Social Issues 42(4): 461-480.
Sen, A.K. 1992. Inequality Reexamined. Cambridge: Harvard University Press.
70
______. 2009. The Idea of Justice. London: Allen Lane/Penguin Books; Cambridge: Belknap Press of Harvard University Press.
She, P., and G. A. Livermore. 2007. “Material Hardship, Poverty and Disability among Working-age Adults.” Social Science Quarterly 88(4): 970-981.
______. 2009. “Long-term Poverty and Disability among Working-age Adults.” Journal of
Disability Policy Studies 19(4):244-256.
Strauss, J. and D. Thomas. 2008. “Health over the Life Course.” In Handbook of Development
Economics, ed. T. Paul Schultz and John Strauss, Vol. 4.
Susser, E., D. St Clair, and L. He. 2008. “Latent Effects of Prenatal Malnutrition on Adult Health: The Example of Schizophrenia.” Annals of New York Academy of Sciences 1136: 185-192.
Thomas, P. 2005. “Poverty Reduction and Development in Cambodia: Enabling Disabled People to Play a Role.” Disability Knowledge and Research. http://www.disabilitykar.net/pdfs/cambodia.pdf
Trani, J., and M. Loeb. 2010. “Poverty and Disability: A Vicious Circle? Evidence from Afghanistan and Zambia.” Journal of International Development.
Trani, J., and B. VanLeit. 2010. Increasing Inclusion of Persons with Disabilities: Reflections
from Disability Research Using the ICF in Afghanistan and Cambodia. London: Leonard Cheshire International.
Trani, J., O. Bah, N. Bailey, J. Browne, N. Groce, and M. Kett. 2010. Disability in and around
Urban Areas of Sierra Leone. London: Leonard Cheshire International.
UNICEF (United Nations Children’s Fund). 2009. Monitoring Child Disability in Developing
Countries: Results from the Multiple Indicator Cluster Survey. New York: UNICEF.
United Nations. 2009. “Report of the Washington Group on Disability Statistics.” E/CN.3/2010/20, Economic and Social Council, United Nations, New York, December 8. http://unstats.un.org/unsd/statcom/doc10/2010-20-WashingtonGroup-E.pdf
Üstün, T.B., S. Chatterjee, A. Mechbal, and C. J. L. Murray. 2003. “Collaborating Groups WHS.” In Health Systems Performance Assessment: Debates, Methods and Empiricism, ed. C. J. L. Murray and D. B. Evans, 115-126. Geneva: World Health Organization.
van Doorslaer, E., O. O'Donnell, R. P. Rannan-Eliya, A. Somanathan, S. R. Adhikari, C. C. Garg, D. Harbianto, A. N. Herrin, M. N. Huq, S. Ibragimova, A. Karan, C. W. Ng, B. R. Pande, R. Racelis, S. Tao, K. Tin, K. Tisayaticom, L. Trisnantoro, C. Vasavid, and Y. Zhao. 2006. “Effect of Payments for Health Care on Poverty Estimates in 11 Countries in Asia: An Analysis of Household Survey Data, Lancet 368 (9544): 1357 – 1364.
71
Water, H.R., G. F. Anderson, and J. Mays. 2004. “Measuring Financial Protection in Health in the United States.” Health Policy 69: 339-49.
WHO (World Health Organization). 2001. International Classification of Functioning, Disability
and Health. Geneva: WHO.
______. 2002. World Health Survey 2002: Guide to Administration and Question by Question
Specifications. Geneva: WHO.
______. 2009. Report of the Commission on the Social Determinants of Health. Geneva: WHO.
World Bank. 1990. World Development Report 1990, Poverty. Washington, D.C.: World Bank.
______. 2001. World Development Report 2000/2001, Attacking Poverty. Washington, D.C.: World Bank.
______. 2005–10. World Development Indicators. Washington D.C.: World Bank. http://data.worldbank.org/data-catalog/world-development-indicators
______. 2009. People with Disabilities in India: From Commitments to Outcomes. Washington, D.C.: World Bank.
Wyszewianski, L. 1986. “Families with Catastrophic Health Care Expenditures.” Health Services
Research 21: 617-34.
Yeo, R. 2005. “Disability, Poverty and the New Development Agenda.” Disability Knowledge
and Research.
Yeo, R., and K. Moore. 2003. “Including Disabled People in Poverty Reduction Work: Nothing about Us, without Us.” World Development 31(3): 571–590.
Zaidi, A., and T. Burchardt. 2005. “Comparing Incomes When Needs Differ: Equivalization for the Extra Costs of Disability in the U.K.” Review of Income and Wealth 51: 89-114.
Zambrano, S. 2006. Trabajo y Discapacidad en el Perú: Mercado Laboral, Políticas Públicas e
Inclusión Social. Lima: Fondo Editorial del Congreso del Perú.
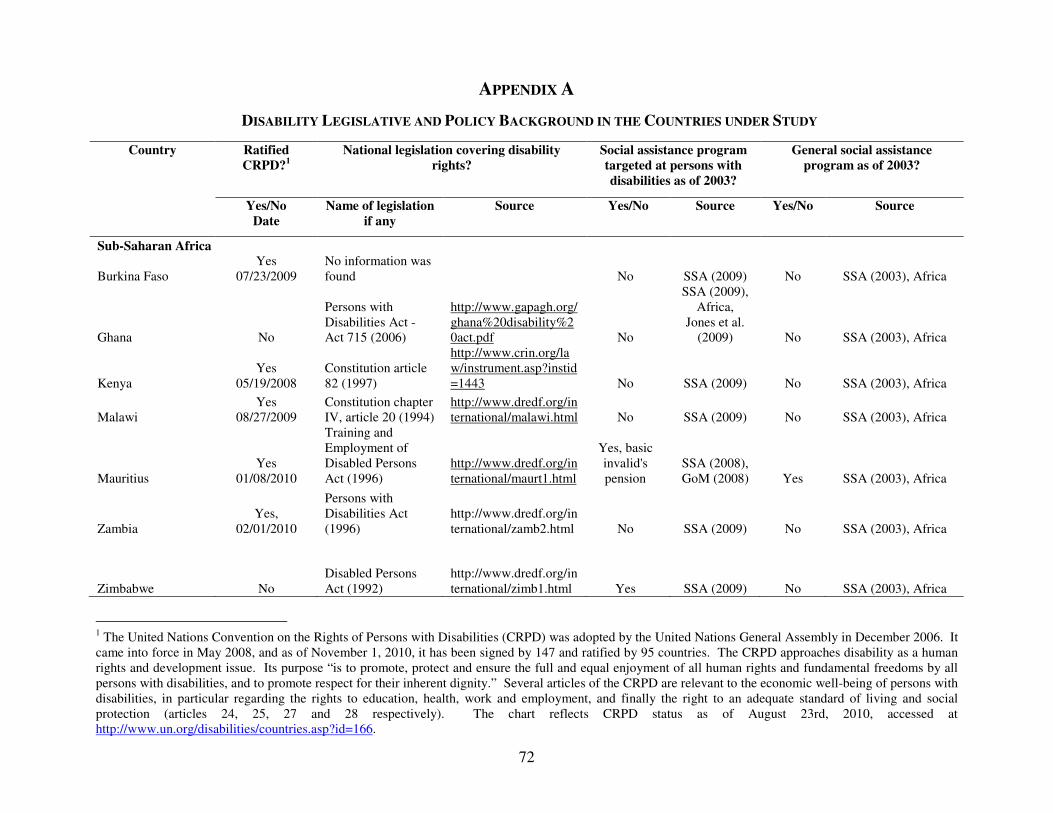
72
APPENDIX A
DISABILITY LEGISLATIVE AND POLICY BACKGROUND IN THE COUNTRIES UNDER STUDY
Country Ratified CRPD?1
National legislation covering disability rights?
Social assistance program targeted at persons with disabilities as of 2003?
General social assistance program as of 2003?
Yes/No Date
Name of legislation if any
Source Yes/No Source Yes/No Source
Sub-Saharan Africa
Burkina Faso Yes
07/23/2009 No information was found No SSA (2009) No SSA (2003), Africa
Ghana No
Persons with Disabilities Act - Act 715 (2006)
http://www.gapagh.org/ghana%20disability%20act.pdf No
SSA (2009), Africa,
Jones et al. (2009) No SSA (2003), Africa
Kenya Yes
05/19/2008 Constitution article 82 (1997)
http://www.crin.org/law/instrument.asp?instid=1443 No SSA (2009) No SSA (2003), Africa
Malawi Yes
08/27/2009 Constitution chapter IV, article 20 (1994)
http://www.dredf.org/international/malawi.html No SSA (2009) No SSA (2003), Africa
Mauritius Yes
01/08/2010
Training and Employment of Disabled Persons Act (1996)
http://www.dredf.org/international/maurt1.html
Yes, basic invalid's pension
SSA (2008), GoM (2008) Yes SSA (2003), Africa
Zambia Yes,
02/01/2010
Persons with Disabilities Act (1996)
http://www.dredf.org/international/zamb2.html No SSA (2009) No SSA (2003), Africa
Zimbabwe No Disabled Persons Act (1992)
http://www.dredf.org/international/zimb1.html Yes SSA (2009) No SSA (2003), Africa
1 The United Nations Convention on the Rights of Persons with Disabilities (CRPD) was adopted by the United Nations General Assembly in December 2006. It came into force in May 2008, and as of November 1, 2010, it has been signed by 147 and ratified by 95 countries. The CRPD approaches disability as a human rights and development issue. Its purpose “is to promote, protect and ensure the full and equal enjoyment of all human rights and fundamental freedoms by all persons with disabilities, and to promote respect for their inherent dignity.” Several articles of the CRPD are relevant to the economic well-being of persons with disabilities, in particular regarding the rights to education, health, work and employment, and finally the right to an adequate standard of living and social protection (articles 24, 25, 27 and 28 respectively). The chart reflects CRPD status as of August 23rd, 2010, accessed at http://www.un.org/disabilities/countries.asp?id=166.

73
Asia
Bangladesh Yes,
11/30/2007
Persons with Disability Welfare Act (2001) UNESCAP (2009)
Yes, Disability Allowance
and Integrated Poverty
Reduction Program
Gooding and Marriott (2009), Ahmed (2009) Yes SSA (2002), Asia
Lao PDR Yes,
09/25/2009 None as of 2006 UNESCAP (2009) No SSA (2008) No SSA (2002), Asia
Pakistan No None as of 2006 UNESCAP (2009) No SSA (2008) No SSA (2002), Asia
Philippines Yes,
04/15/2008 Republic Act no. 7277 (1991) UNESCAP (2009) No SSA (2008) No SSA (2003), Asia
Latin America and the Caribbean
Brazil Yes,
08/01/2008
Constitution chapter II, article 7 (1988) (against discrimination in hiring individuals with disabilities).
http://www.dredf.org/international/brazil.html
Yes, beneficio de prestaçao continuada
(bpc) disability
Veras Suares et al. (2006) Yes SSA (2003), Americas
Dominican republic Yes,
08/18/2009
Ley general sobre la discapacidad en república dominican republica (2000)
http://www.primeradama.gob.do/trans/normativas%20-%20derechos%20de%20los%20ciudadanos/ley_general_sobre_discapacidad.pdf
Yes, disability solidarity pension (pension
solidaria por discapacidad)
SSA (2009), Americas.
http://cnss.gob.do/linkclick.aspx?fileticket=idc9qv%2fuijw%3d&tabid=106&mi
d=562 Yes SSA (2003), Americas
Mexico Yes,
12/17/2007
Ley para personas con descapacidad del distrito federal (1995)
http://www.dredf.org/international/mexico.html No
SSA (2009), Americas No SSA (2003), Americas
Paraguay Yes,
09/03/2008 Political Constitution of 1992
http://www.dredf.org/international/parag1.html No SSA (2008) No SSA (2003), Americas
Note: Date of ratification is presented as day-month-year. For Lao PDR and Pakistan, no information on legislation was in place as of 2006, when the UNESCAP (2009) report was prepared.
Source: United Nations Enable – Rights and Dignity of Persons with Disabilities website, accessed on August 23rd, 2010, at http://www.un.org/disabilities/countries.asp?id=166.

74
APPENDIX B
Results using the base disability measure are primarily in the body of the study. Appendix B primarily presents the results using the expanded disability measure; individual and household level measures of economic status and poverty are presented in Tables B1 and B3 – B6.
Table B2 presents Disability Prevalence using the base measure by quintile for the asset index and non-medical PCE measures.
This study also estimates multidimensional poverty measures, using the methods recently developed by Alkire and Foster (2009) and Bourguignon and Chakravarty (2003).2 The latter method is used as part of robustness checks. These results are presented in Tables B7 - B9.
The overview Tables are intended to facilitate cross-country comparisons for particular indicators.
2 The idea behind multidimensional poverty measure is to capture the multidimensionality of poverty within a single indicator. Some of the technical limitations of the Alkire and Foster multidimensional poverty measure are noted in the main body of the study.

75
Appendix B1: Disability Prevalence (Expanded Measure) among Working-Age Individuals in Developing Countries
Country
Disability Prevalence
All Males Females Rural Urban
Sub-Saharan Africa
Burkina Faso 12.09 (0.011) 10.31 (0.011) 13.71 (0.015) 12.38 (0.013) 10.74 (0.014)
Ghana 12.54 (0.007) 10.46 (0.010) 14.56 (0.011) 12.17 (0.009) 13.00 (0.013)
Kenya 8.55 (0.007) 6.27 (0.009) 10.74 (0.010) 11.56 (0.009) 4.37 (0.011)
Malawi 16.84 (0.013) 16.71 (0.014) 16.97 (0.015) 18.17 (0.014) 10.00 (0.022)
Mauritius 14.31 (0.010) 11.43 (0.012) 17.24 (0.013) 15.34 (0.014) 12.83 (0.014)
Zambia 9.03 (0.008) 6.30 (0.010) 11.63 (0.010) 9.88 (0.010) 7.47 (0.012)
Zimbabwe 14.03 (0.008) 11.32 (0.011) 16.58 (0.010) 16.51 (0.011) 9.61 (0.012)
Asia
Bangladesh 19.56 (0.010) 13.37 (0.011) 27.20 (0.015) 20.99 (0.012) 15.31 (0.013)
Lao PDR 12.66 (0.007) 11.53 (0.009) 13.78 (0.010) 13.60 (0.009) 9.61 (0.012)
Pakistan 7.65 (0.005) 4.30 (0.005) 11.16 (0.008) 6.20 (0.008) 10.65 (0.009)
Philippines 12.09 (0.007) 10.88 (0.008) 13.31 (0.008) 14.02 (0.012) 10.88 (0.009)
Latin America
Brazil 21.48 (0.009) 16.96 (0.011) 27.18 (0.015) 24.18 (0.023) 20.83 (0.010)
Dominican Republic 13.33 (0.008) 9.50 (0.011) 17.31 (0.012) 12.95 (0.013) 13.58 (0.010)
Mexico 7.44 (0.002) 5.59 (0.003) 9.16 (0.003) 7.64 (0.005) 7.37 (0.003)
Paraguay 11.24 (0.005) 7.59 (0.006) 14.87 (0.008) 11.74 (0.008) 10.86 (0.007)
Note: All estimates are weighted. Standard errors are in parentheses and are adjusted for survey clustering and stratification. Working-age individuals are aged 18 to 65. For explanation of the expanded disability measure, see the main part of the study. Number of observations for each country is shown in appendix 3.
Source: Authors' analysis based on WHS data as described in the main part of the study.

76
Appendix B2a: Disability Prevalence (Base Measure) among Working-Age Individuals, by Asset Index Quintile
Country 1st quintile 2nd quintile 3rd quintile 4th quintile 5th quintile
Sub-Saharan Africa
Burkina Faso 10.10 8.63 6.86 8.25 6.36
Ghana 6.75 10.90 7.89 8.68 7.34
Kenya 9.10 5.79 4.54 2.20 4.62
Malawi 15.08 15.48 14.34 10.04 9.74
Mauritius 16.32 14.06 11.36 8.68 8.56
Zambia 4.86 8.71 6.50 4.95 4.27
Zimbabwe 12.76 14.68 13.91 8.30 6.29
Asia
Bangladesh 20.94 17.68 15.99 17.13 10.88
Lao PDR 3.96 3.96 2.10 2.39 2.95
Pakistan 5.34 5.24 4.69 7.38 7.75
Philippines 11.44 10.65 8.84 6.22 6.51
Latin America and the Caribbean
Brazil 18.87 14.75 14.84 11.94 7.34
Dominican 10.74 7.30 6.60 11.04 8.03
Mexico 4.79 5.95 5.68 5.66 4.53
Paraguay 7.71 6.60 8.25 7.01 5.05
Note: All estimates are weighted. For explanations of the base disability measure, see the main part of the study.
Source: Authors' analysis based on WHS data as described in the main part of the study.

77
Appendix B2b: Disability Prevalence (Base Measure) among Working-Age Individuals, by Non-medical PCE Quintile
Country 1st quintile 2nd quintile 3rd quintile 4th quintile 5th quintile
Sub-Saharan Africa
Burkina Faso 6.88 7.27 9.97 8.30 7.28
Ghana 9.18 7.08 8.38 9.16 8.24
Kenya 6.37 5.72 3.56 7.88 2.63
Malawi 14.49 10.58 13.69 12.98 13.13
Mauritius 13.42 9.78 12.94 12.53 8.04
Zambia 7.39 6.92 5.47 5.48 3.38
Zimbabwe 12.67 10.81 11.19 11.63 8.55
Asia
Bangladesh 19.07 16.15 13.93 17.30 14.86
Lao PDR 4.69 2.18 2.75 3.89 1.75
Pakistan 6.87 4.94 4.32 5.90 7.60
Philippines 12.13 7.88 6.71 6.85 8.89
Latin America and the Caribbean
Brazil 18.20 16.67 11.56 12.12 7.30
Dominican 8.15 7.61 8.76 7.28 12.31
Mexico 5.66 4.73 5.66 5.35 5.08
Paraguay 7.01 7.01 7.91 6.28 5.98
Note: All estimates are weighted. For explanations of the base disability measure, see the main part of the study.
Source: Authors' analysis based on WHS data as described in the main part of the study.

78
Appendix B2c: Disability (Expanded Measure) Prevalence among Working-Age Individuals, by Quintile
Country Asset index PCE
Bottom quintile Upper four
quintiles
p-value on bottom
vs. upper four
quintiles Bottom quintile Upper four
quintiles
p-value on bottom vs. upper
four quintiles
Sub-Saharan Africa
Burkina Faso 14.44 (0.021) 11.66 (0.011) (0.21) 11.49 (0.017) 12.25 (0.012) (0.70)
Ghana 9.93 (0.011) 12.90 (0.009) (0.04) 13.30 (0.017) 12.32 (0.009) (0.62)
Kenya 14.62 (0.015) 7.01 (0.008) (0.00) 11.48 (0.014) 7.72 (0.007) (0.01)
Malawi 20.45 (0.019) 15.81 (0.012) (0.01) 18.45 (0.017) 16.44 (0.013) (0.21)
Mauritius 19.64 (0.021) 13.42 (0.010) (0.00) 16.02 (0.019) 13.81 (0.011) (0.27)
Zambia 8.71 (0.016) 9.20 (0.009) (0.78) 10.90 (0.017) 8.55 (0.010) (0.30)
Zimbabwe 15.66 (0.020) 13.71 (0.010) (0.40) 16.27 (0.020) 13.46 (0.009) (0.22)
Asia
Bangladesh 22.86 (0.019) 18.91 (0.010) (0.05) 22.54 (0.020) 18.90 (0.010) (0.07)
Lao PDR 17.47 (0.021) 11.44 (0.007) (0.01) 16.41 (0.019) 11.65 (0.008) (0.02)
Pakistan 6.37 (0.015) 8.13 (0.008) (0.40) 8.58 (0.012) 7.39 (0.005) (0.36)
Philippines 16.01 (0.015) 11.38 (0.007) (0.00) 17.21 (0.015) 10.77 (0.007) (0.00)
Latin America and the Caribbean
Brazil 27.83 (0.024) 19.86 (0.010) (0.00) 26.24 (0.022) 20.13 (0.010) (0.01)
Dominican Republic 14.30 (0.016) 12.98 (0.009) (0.46) 12.68 (0.016) 13.51 (0.009) (0.66)
Mexico 7.41 (0.005) 7.45 (0.003) (0.95) 8.02 (0.005) 7.29 (0.003) (0.20)
Paraguay 12.59 (0.011) 10.94 (0.006) (0.17) 12.16 (0.011) 10.99 (0.006) (0.34)
Note: PCE is in local currency. For explanations of the expanded disability measure, see the main part of the study. Standard errors are reported in parentheses and are adjusted for the complex design of WHS.
Source: Authors' analysis based on WHS data as described in the main part of the study.

79
Appendix B3: Disability (Expanded Measure) Prevalence, by Poverty Status
Poverty measure Under $1.25 a day Under $2 a day Multidimensional poverty
Among the poor
Among the non-poor
p-value on poor
vs. non-poor
Among the poor
Among the non-poor
p-value on poor
vs. non-poor
Among the poor
Among the non-poor
p-value on poor
vs. non-poor
Sub-Saharan Africa
Burkina Faso 12.41 (0.012) 11.05 (0.013) 0.36 12.33 (0.011) 10.07 (0.016) 0.20 12.44 (0.01) 7.18 (0.01) 0.00
Ghana 12.06 (0.009) 13.11 (0.010) 0.42 12.42 (0.009) 12.93 (0.014) 0.75 13.42 (0.01) 11.20 (0.01) 0.17
Kenya 9.83 (0.011) 7.60 (0.009) 0.12 9.21 (0.009) 7.65 (0.012) 0.31 11.11 (0.01) 5.70 (0.01) 0.00
Malawi 17.10 (0.013) 13.32 (0.026) 0.20 16.88 (0.013) 15.61 (0.034) 0.73 17.20 (0.01) 14.56 (0.02) 0.27
Mauritius 18.03 (0.069) 14.27 (0.010) 0.59 17.39 (0.025) 14.07 (0.010) 0.21 33.90 (0.03) 13.08 (0.01) 0.00
Zambia 9.54 (0.008) 5.82 (0.009) 0.00 9.31 (0.008) 4.93 (0.018) 0.01 9.83 (0.01) 6.83 (0.01) 0.01
Zimbabwe - - - - - - - - - - - - - - -
Asia
Bangladesh 19.89 (0.013) 19.14 (0.011) 0.60 19.78 (0.011) 18.64 (0.018) 0.57 22.07 (0.01) 11.50 (0.01) 0.00
Lao PDR 13.72 (0.010) 10.16 (0.010) 0.02 13.49 (0.008) 7.95 (0.012) 0.00 14.50 (0.01) 9.54 (0.01) 0.00
Pakistan 7.40 (0.006) 7.88 (0.008) 0.63 7.33 (0.005) 8.72 (0.012) 0.27 8.36 (0.01) 6.06 (0.01) 0.02
Philippines 14.25 (0.011) 10.34 (0.007) 0.00 12.97 (0.008) 9.94 (0.008) 0.00 16.33 (0.01) 10.08 (0.01) 0.00
Latin America and the Caribbean
Brazil 27.46 (0.023) 20.02 (0.010) 0.00 26.92 (0.017) 18.16 (0.010) 0.00 34.87 (0.03) 18.57 (0.01) 0.00
Dominican Republic 12.21 (0.017) 13.62 (0.009) 0.47 12.15 (0.015) 14.08 (0.011) 0.37 16.26 (0.02) 12.19 (0.01) 0.04
Mexico 8.10 (0.005) 7.28 (0.003) 0.17 7.82 (0.004) 7.22 (0.003) 0.18 11.83 (0.01) 6.72 (0.00) 0.00
Paraguay 11.53 (0.012) 11.18 (0.006) 0.79 11.45 (0.008) 11.13 (0.007) 0.76 15.09 (0.01) 9.59 (0.01) 0.00
Note: Households poverty status with respect to the US$1.25 or US$2 a day poverty line is found using household non-medical PCE adjusted for 2005 PPP. All estimates are weighted. Poverty estimates for Zimbabwe are omitted due to a lack of accurate PPP Figures for the years of analysis. Standard errors are between parentheses and are adjusted for survey clustering and stratification.
For explanations of the disability measure, see the main part of the study.
Source: Authors’ analysis based on WHS data as described in the main part of the study.

80
Appendix B4: Individual Level Economic Well-being across Disability Status (Expanded Measure) among Working-Age Individuals
Country
Number of Observations
Mean years of education Percentage of who completed primary school
Percent employed
Individual with
disability
Individual without
disability
Individuals with disability
Individuals without
disability
p-value Individuals with disability
Individuals without
disability
p-value Individuals with
disability
Individuals without
disability
p-value
Sub-Saharan Africa
Burkina Faso 300 3,769 1.30 (0.055) 1.36 (0.030) (0.248) 0.08 (0.017) 0.11 (0.010) (0.140) 0.41 (0.043) 0.59 (0.018) (0.000)
Ghana 264 2,360 2.41 (0.076) 2.64 (0.041) (0.006) 0.54 (0.031) 0.65 (0.017) (0.001) 0.77 (0.029) 0.76 (0.013) (0.892)
Kenya 282 3,340 3.17 (0.176) 3.50 (0.056) (0.041) 0.57 (0.044) 0.75 (0.017) (0.000) 0.62 (0.040) 0.62 (0.014) (0.892)
Malawi 460 3,834 2.03 (0.054) 2.16 (0.038) (0.005) 0.21 (0.027) 0.28 (0.016) (0.007) 0.51 (0.031) 0.52 (0.021) (0.691)
Mauritius 388 2,857 2.83 (0.064) 3.49 (0.043) (0.000) 0.69 (0.028) 0.88 (0.009) (0.000) 0.44 (0.028) 0.66 (0.011) (0.000)
Zambia 178 2,770 2.43 (0.084) 2.65 (0.061) (0.004) 0.44 (0.036) 0.57 (0.024) (0.000) 0.61 (0.044) 0.60 (0.022) (0.790)
Zimbabwe 386 2,637 2.83 (0.072) 3.35 (0.043) (0.000) 0.66 (0.030) 0.82 (0.014) (0.000) 0.34 (0.032) 0.32 (0.018) (0.573)
Asia
Bangladesh 751 3,464 2.12 (0.071) 2.54 (0.047) (0.000) 0.35 (0.024) 0.50 (0.015) (0.000) 0.39 (0.022) 0.57 (0.014) (0.000)
Lao PDR 126 3,494 2.32 (0.079) 2.83 (0.047) (0.000) 0.40 (0.031) 0.57 (0.015) (0.000) 0.84 (0.021) 0.81 (0.009) (0.268)
Pakistan 317 4,929 1.90 (0.084) 2.40 (0.049) (0.000) 0.28 (0.027) 0.43 (0.013) (0.000) 0.30 (0.029) 0.53 (0.011) (0.000)
Philippines 850 8,287 3.41 (0.057) 3.74 (0.029) (0.000) 0.77 (0.017) 0.87 (0.007) (0.000) 0.50 (0.020) 0.55 (0.009) (0.012)
Latin America and the Caribbean
Brazil 399 2,435 2.91 (0.063) 3.77 (0.049) (0.000) 0.60 (0.022) 0.82 (0.012) (0.000) 0.49 (0.023) 0.62 (0.014) (0.000)
Dominican Republic
352 3,184 2.66 (0.084) 2.80 (0.050) (0.082) 0.39 (0.029) 0.51 (0.018) (0.000) 0.54 (0.029) 0.63 (0.014) (0.002)
Mexico 1,833 32,002 4.01 (0.020) 4.21 (0.010) (0.000) 0.60 (0.015) 0.76 (0.006) (0.000) 0.41 (0.014) 0.56 (0.004) (0.000)
Paraguay 359 4,201 2.91 (0.066) 3.30 (0.032) (0.000) 0.57 (0.024) 0.73 (0.009) (0.000) 0.49 (0.024) 0.66 (0.009) (0.000)
Note: All estimates are weighted. Standard errors are reported in parentheses and are adjusted for survey clustering and stratification. P-value is reported in the difference between persons with and without disability.
Source: Authors' analysis based on WHS data as described in the main part of the study.
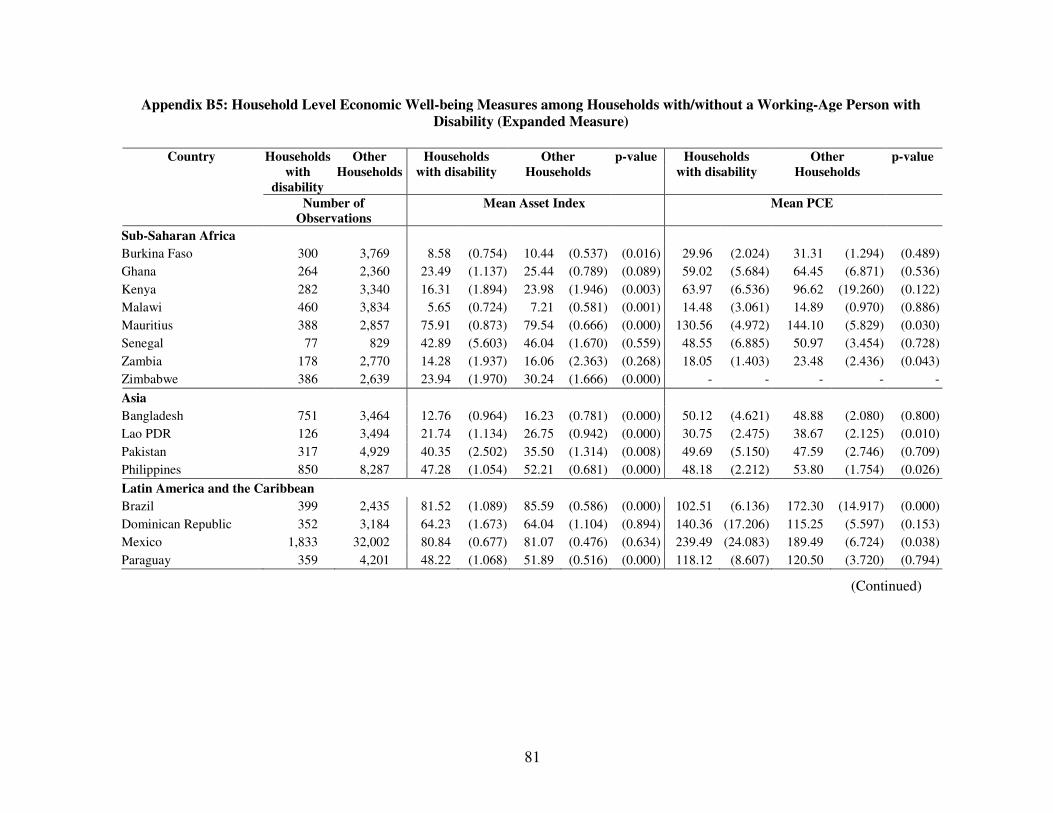
81
Appendix B5: Household Level Economic Well-being Measures among Households with/without a Working-Age Person with Disability (Expanded Measure)
Country Households
with disability
Other Households
Households with disability
Other Households
p-value Households with disability
Other Households
p-value
Number of Observations
Mean Asset Index Mean PCE
Sub-Saharan Africa
Burkina Faso 300 3,769 8.58 (0.754) 10.44 (0.537) (0.016) 29.96 (2.024) 31.31 (1.294) (0.489)
Ghana 264 2,360 23.49 (1.137) 25.44 (0.789) (0.089) 59.02 (5.684) 64.45 (6.871) (0.536)
Kenya 282 3,340 16.31 (1.894) 23.98 (1.946) (0.003) 63.97 (6.536) 96.62 (19.260) (0.122)
Malawi 460 3,834 5.65 (0.724) 7.21 (0.581) (0.001) 14.48 (3.061) 14.89 (0.970) (0.886)
Mauritius 388 2,857 75.91 (0.873) 79.54 (0.666) (0.000) 130.56 (4.972) 144.10 (5.829) (0.030)
Senegal 77 829 42.89 (5.603) 46.04 (1.670) (0.559) 48.55 (6.885) 50.97 (3.454) (0.728)
Zambia 178 2,770 14.28 (1.937) 16.06 (2.363) (0.268) 18.05 (1.403) 23.48 (2.436) (0.043)
Zimbabwe 386 2,639 23.94 (1.970) 30.24 (1.666) (0.000) - - - - -
Asia
Bangladesh 751 3,464 12.76 (0.964) 16.23 (0.781) (0.000) 50.12 (4.621) 48.88 (2.080) (0.800)
Lao PDR 126 3,494 21.74 (1.134) 26.75 (0.942) (0.000) 30.75 (2.475) 38.67 (2.125) (0.010)
Pakistan 317 4,929 40.35 (2.502) 35.50 (1.314) (0.008) 49.69 (5.150) 47.59 (2.746) (0.709)
Philippines 850 8,287 47.28 (1.054) 52.21 (0.681) (0.000) 48.18 (2.212) 53.80 (1.754) (0.026)
Latin America and the Caribbean
Brazil 399 2,435 81.52 (1.089) 85.59 (0.586) (0.000) 102.51 (6.136) 172.30 (14.917) (0.000)
Dominican Republic 352 3,184 64.23 (1.673) 64.04 (1.104) (0.894) 140.36 (17.206) 115.25 (5.597) (0.153)
Mexico 1,833 32,002 80.84 (0.677) 81.07 (0.476) (0.634) 239.49 (24.083) 189.49 (6.724) (0.038)
Paraguay 359 4,201 48.22 (1.068) 51.89 (0.516) (0.000) 118.12 (8.607) 120.50 (3.720) (0.794)
(Continued)
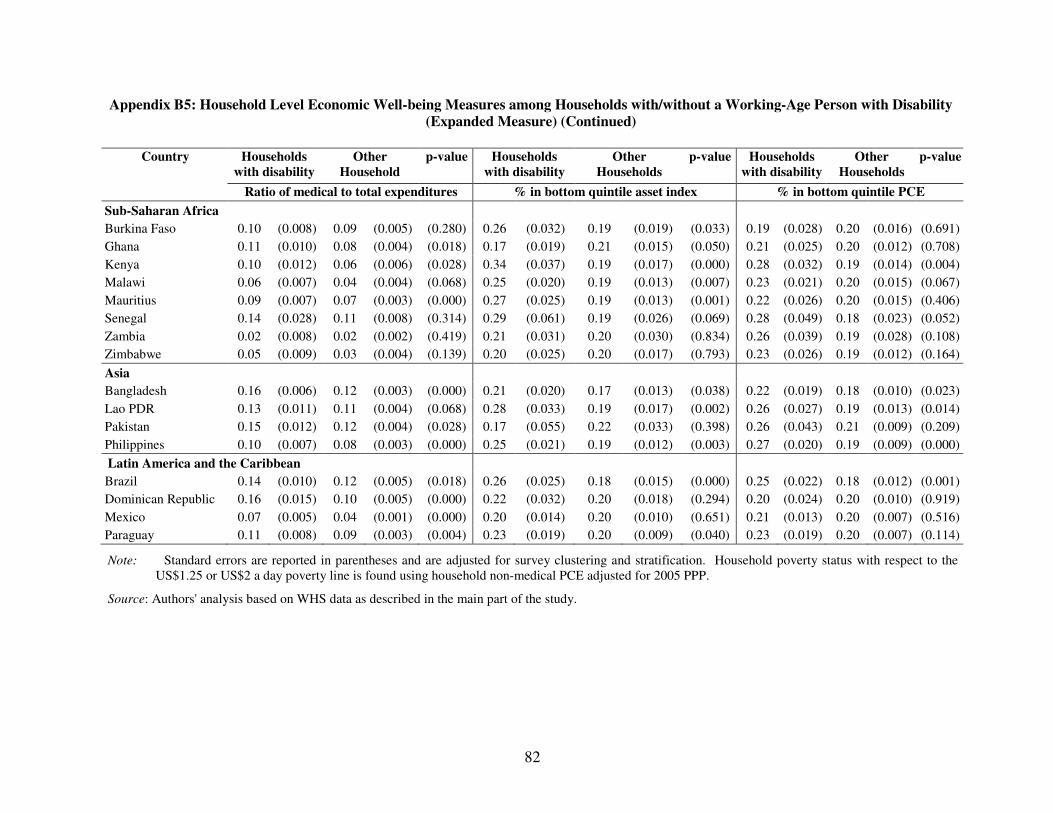
82
Appendix B5: Household Level Economic Well-being Measures among Households with/without a Working-Age Person with Disability (Expanded Measure) (Continued)
Country Households
with disability Other
Household p-value Households
with disability Other
Households p-value Households
with disability Other
Households p-value
Ratio of medical to total expenditures % in bottom quintile asset index % in bottom quintile PCE
Sub-Saharan Africa
Burkina Faso 0.10 (0.008) 0.09 (0.005) (0.280) 0.26 (0.032) 0.19 (0.019) (0.033) 0.19 (0.028) 0.20 (0.016) (0.691)
Ghana 0.11 (0.010) 0.08 (0.004) (0.018) 0.17 (0.019) 0.21 (0.015) (0.050) 0.21 (0.025) 0.20 (0.012) (0.708)
Kenya 0.10 (0.012) 0.06 (0.006) (0.028) 0.34 (0.037) 0.19 (0.017) (0.000) 0.28 (0.032) 0.19 (0.014) (0.004)
Malawi 0.06 (0.007) 0.04 (0.004) (0.068) 0.25 (0.020) 0.19 (0.013) (0.007) 0.23 (0.021) 0.20 (0.015) (0.067)
Mauritius 0.09 (0.007) 0.07 (0.003) (0.000) 0.27 (0.025) 0.19 (0.013) (0.001) 0.22 (0.026) 0.20 (0.015) (0.406)
Senegal 0.14 (0.028) 0.11 (0.008) (0.314) 0.29 (0.061) 0.19 (0.026) (0.069) 0.28 (0.049) 0.18 (0.023) (0.052)
Zambia 0.02 (0.008) 0.02 (0.002) (0.419) 0.21 (0.031) 0.20 (0.030) (0.834) 0.26 (0.039) 0.19 (0.028) (0.108)
Zimbabwe 0.05 (0.009) 0.03 (0.004) (0.139) 0.20 (0.025) 0.20 (0.017) (0.793) 0.23 (0.026) 0.19 (0.012) (0.164)
Asia
Bangladesh 0.16 (0.006) 0.12 (0.003) (0.000) 0.21 (0.020) 0.17 (0.013) (0.038) 0.22 (0.019) 0.18 (0.010) (0.023)
Lao PDR 0.13 (0.011) 0.11 (0.004) (0.068) 0.28 (0.033) 0.19 (0.017) (0.002) 0.26 (0.027) 0.19 (0.013) (0.014)
Pakistan 0.15 (0.012) 0.12 (0.004) (0.028) 0.17 (0.055) 0.22 (0.033) (0.398) 0.26 (0.043) 0.21 (0.009) (0.209)
Philippines 0.10 (0.007) 0.08 (0.003) (0.000) 0.25 (0.021) 0.19 (0.012) (0.003) 0.27 (0.020) 0.19 (0.009) (0.000)
Latin America and the Caribbean
Brazil 0.14 (0.010) 0.12 (0.005) (0.018) 0.26 (0.025) 0.18 (0.015) (0.000) 0.25 (0.022) 0.18 (0.012) (0.001)
Dominican Republic 0.16 (0.015) 0.10 (0.005) (0.000) 0.22 (0.032) 0.20 (0.018) (0.294) 0.20 (0.024) 0.20 (0.010) (0.919)
Mexico 0.07 (0.005) 0.04 (0.001) (0.000) 0.20 (0.014) 0.20 (0.010) (0.651) 0.21 (0.013) 0.20 (0.007) (0.516)
Paraguay 0.11 (0.008) 0.09 (0.003) (0.004) 0.23 (0.019) 0.20 (0.009) (0.040) 0.23 (0.019) 0.20 (0.007) (0.114)
Note: Standard errors are reported in parentheses and are adjusted for survey clustering and stratification. Household poverty status with respect to the US$1.25 or US$2 a day poverty line is found using household non-medical PCE adjusted for 2005 PPP.
Source: Authors' analysis based on WHS data as described in the main part of the study.

83
Appendix B6: Poverty Headcount, Gap, and Gap-Squared among Households with/without a Working-Age Person with Disability (Expanded Measure) based on Non-medical PCE
Country Households
with disability
Other
Households
p-value Households
with disability
Other
Households
p-value Households
with disability
Other
Households
p-value
Poverty headcount ($1.25 a day) Poverty gap ($1.25 a day) Poverty gap squared ($1.25 a day)
Sub-Saharan Africa
Burkina Faso 0.76 (0.024) 0.75 (0.016) (0.614) 0.38 (0.021) 0.39 (0.014) (0.822) 0.24 (0.018) 0.24 (0.012) (0.741)
Ghana 0.46 (0.026) 0.49 (0.015) (0.264) 0.20 (0.016) 0.21 (0.009) (0.533) 0.12 (0.012) 0.12 (0.006) (0.735)
Kenya 0.48 (0.046) 0.38 (0.021) (0.021) 0.24 (0.023) 0.18 (0.011) (0.009) 0.15 (0.016) 0.11 (0.008) (0.021)
Malawi 0.95 (0.013) 0.92 (0.009) (0.019) 0.70 (0.016) 0.68 (0.012) (0.094) 0.56 (0.017) 0.54 (0.013) (0.136)
Mauritius 0.02 (0.006) 0.01 (0.002) (0.330) 0.00 (0.002) 0.00 (0.001) (0.615) 0.00 (0.001) 0.00 (0.000) (0.961)
Senegal 0.57 (0.059) 0.54 (0.022) (0.525) 0.35 (0.039) 0.26 (0.016) (0.032) 0.25 (0.033) 0.17 (0.015) (0.022)
Zambia 0.88 (0.020) 0.84 (0.024) (0.042) 0.59 (0.027) 0.51 (0.034) (0.023) 0.44 (0.027) 0.37 (0.031) (0.028)
Zimbabwe - - - - - - - - - - - - - - -
Asia
Bangladesh 0.56 (0.023) 0.56 (0.016) (0.948) 0.19 (0.011) 0.17 (0.007) (0.059) 0.08 (0.007) 0.07 (0.003) (0.042)
Lao PDR 0.73 (0.026) 0.68 (0.017) (0.047) 0.44 (0.024) 0.38 (0.013) (0.015) 0.32 (0.023) 0.26 (0.011) (0.013)
Pakistan 0.48 (0.044) 0.48 (0.018) (0.887) 0.18 (0.023) 0.16 (0.006) (0.380) 0.09 (0.013) 0.08 (0.004) (0.477)
Philippines 0.50 (0.023) 0.42 (0.011) (0.001) 0.22 (0.013) 0.16 (0.006) (0.000) 0.13 (0.010) 0.09 (0.004) (0.000)
Latin America and the Caribbean
Brazil 0.23 (0.021) 0.16 (0.011) (0.000) 0.10 (0.011) 0.07 (0.006) (0.014) 0.06 (0.008) 0.05 (0.004) (0.135)
Dominican Republic 0.18 (0.022) 0.19 (0.010) (0.900) 0.10 (0.014) 0.08 (0.005) (0.165) 0.08 (0.013) 0.05 (0.004) (0.055)
Mexico 0.19 (0.013) 0.18 (0.007) (0.423) 0.09 (0.008) 0.08 (0.004) (0.099) 0.06 (0.007) 0.05 (0.003) (0.023)
Paraguay 0.19 (0.018) 0.16 (0.007) (0.243) 0.08 (0.010) 0.06 (0.004) (0.176) 0.05 (0.008) 0.04 (0.003) (0.139)
(Continued)
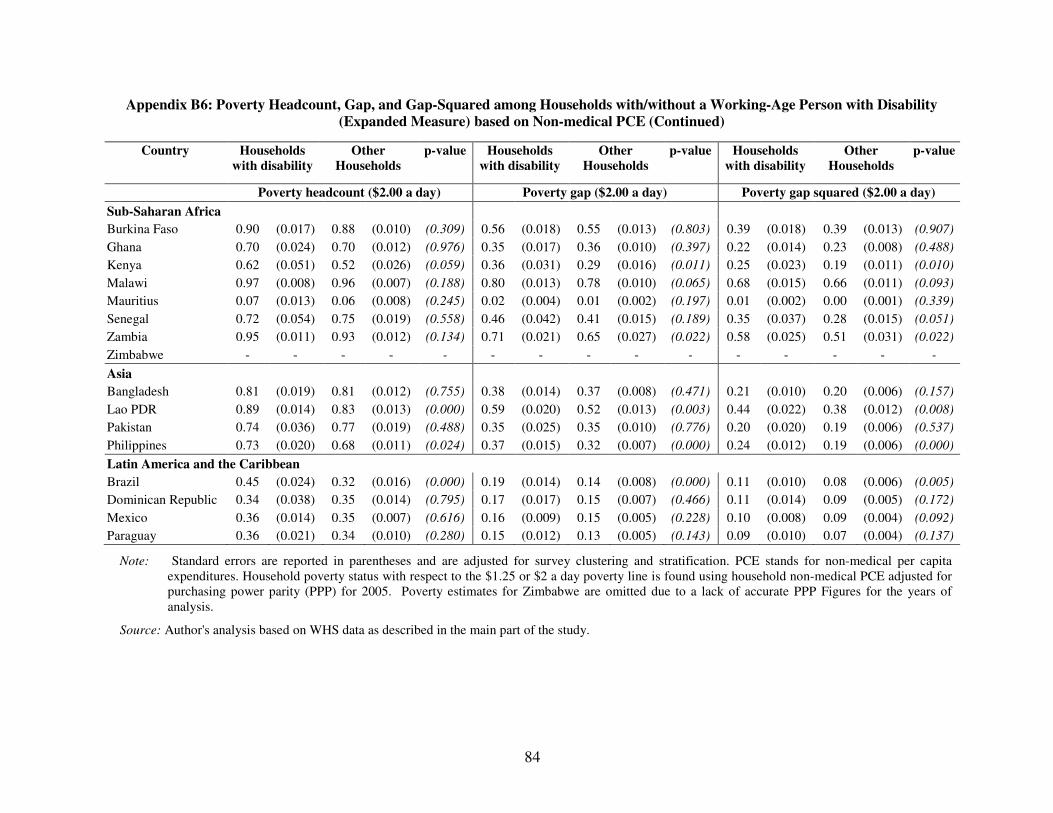
84
Appendix B6: Poverty Headcount, Gap, and Gap-Squared among Households with/without a Working-Age Person with Disability (Expanded Measure) based on Non-medical PCE (Continued)
Country Households with disability
Other Households
p-value Households with disability
Other Households
p-value Households with disability
Other Households
p-value
Poverty headcount ($2.00 a day) Poverty gap ($2.00 a day) Poverty gap squared ($2.00 a day)
Sub-Saharan Africa
Burkina Faso 0.90 (0.017) 0.88 (0.010) (0.309) 0.56 (0.018) 0.55 (0.013) (0.803) 0.39 (0.018) 0.39 (0.013) (0.907)
Ghana 0.70 (0.024) 0.70 (0.012) (0.976) 0.35 (0.017) 0.36 (0.010) (0.397) 0.22 (0.014) 0.23 (0.008) (0.488)
Kenya 0.62 (0.051) 0.52 (0.026) (0.059) 0.36 (0.031) 0.29 (0.016) (0.011) 0.25 (0.023) 0.19 (0.011) (0.010)
Malawi 0.97 (0.008) 0.96 (0.007) (0.188) 0.80 (0.013) 0.78 (0.010) (0.065) 0.68 (0.015) 0.66 (0.011) (0.093)
Mauritius 0.07 (0.013) 0.06 (0.008) (0.245) 0.02 (0.004) 0.01 (0.002) (0.197) 0.01 (0.002) 0.00 (0.001) (0.339)
Senegal 0.72 (0.054) 0.75 (0.019) (0.558) 0.46 (0.042) 0.41 (0.015) (0.189) 0.35 (0.037) 0.28 (0.015) (0.051)
Zambia 0.95 (0.011) 0.93 (0.012) (0.134) 0.71 (0.021) 0.65 (0.027) (0.022) 0.58 (0.025) 0.51 (0.031) (0.022)
Zimbabwe - - - - - - - - - - - - - - -
Asia
Bangladesh 0.81 (0.019) 0.81 (0.012) (0.755) 0.38 (0.014) 0.37 (0.008) (0.471) 0.21 (0.010) 0.20 (0.006) (0.157)
Lao PDR 0.89 (0.014) 0.83 (0.013) (0.000) 0.59 (0.020) 0.52 (0.013) (0.003) 0.44 (0.022) 0.38 (0.012) (0.008)
Pakistan 0.74 (0.036) 0.77 (0.019) (0.488) 0.35 (0.025) 0.35 (0.010) (0.776) 0.20 (0.020) 0.19 (0.006) (0.537)
Philippines 0.73 (0.020) 0.68 (0.011) (0.024) 0.37 (0.015) 0.32 (0.007) (0.000) 0.24 (0.012) 0.19 (0.006) (0.000)
Latin America and the Caribbean
Brazil 0.45 (0.024) 0.32 (0.016) (0.000) 0.19 (0.014) 0.14 (0.008) (0.000) 0.11 (0.010) 0.08 (0.006) (0.005)
Dominican Republic 0.34 (0.038) 0.35 (0.014) (0.795) 0.17 (0.017) 0.15 (0.007) (0.466) 0.11 (0.014) 0.09 (0.005) (0.172)
Mexico 0.36 (0.014) 0.35 (0.007) (0.616) 0.16 (0.009) 0.15 (0.005) (0.228) 0.10 (0.008) 0.09 (0.004) (0.092)
Paraguay 0.36 (0.021) 0.34 (0.010) (0.280) 0.15 (0.012) 0.13 (0.005) (0.143) 0.09 (0.010) 0.07 (0.004) (0.137)
Note: Standard errors are reported in parentheses and are adjusted for survey clustering and stratification. PCE stands for non-medical per capita expenditures. Household poverty status with respect to the $1.25 or $2 a day poverty line is found using household non-medical PCE adjusted for purchasing power parity (PPP) for 2005. Poverty estimates for Zimbabwe are omitted due to a lack of accurate PPP Figures for the years of analysis.
Source: Author's analysis based on WHS data as described in the main part of the study.

85
Appendix B7: Multidimensional Poverty Analysis with k/d=30%
Persons with disabilities Persons without disabilities
Observations H P-
value
A P-
value
M0 P-
value
Observations H A M0
Sub-Saharan Africa
Burkina Faso 301 0.98 (0.01) 0.06 0.76 (0.02) 0.00 0.74 (0.02) 0.00 3,792 0.96 (0.00) 0.70 (0.01) 0.67 (0.01)
Ghana 264 0.85 (0.02) 0.01 0.55 (0.01) 0.02 0.46 (0.02) 0.00 2,384 0.78 (0.01) 0.52 (0.00) 0.41 (0.01)
Kenya 283 0.80 (0.05) 0.00 0.61 (0.02) 0.04 0.49 (0.04) 0.00 3,356 0.64 (0.03) 0.56 (0.01) 0.36 (0.02)
Malawi 462 0.98 (0.01) 0.00 0.66 (0.01) 0.00 0.65 (0.01) 0.00 3,939 0.96 (0.01) 0.63 (0.01) 0.60 (0.01)
Mauritius 389 0.44 (0.03) 0.00 0.42 (0.01) 0.05 0.18 (0.01) 0.00 2,876 0.17 (0.01) 0.40 (0.00) 0.07 (0.00)
Zambia 179 0.92 (0.03) 0.43 0.59 (0.01) 0.02 0.55 (0.02) 0.04 2,795 0.90 (0.02) 0.56 (0.01) 0.51 (0.02)
Asia
Bangladesh 927 0.96 (0.01) 0.00 0.69 (0.01) 0.00 0.66 (0.01) 0.00 3,968 0.87 (0.01) 0.62 (0.00) 0.54 (0.01)
Lao PDR 127 0.90 (0.03) 0.00 0.57 (0.02) 0.50 0.52 (0.03) 0.00 3,508 0.79 (0.02) 0.56 (0.01) 0.44 (0.01)
Pakistan 320 0.86 (0.03) 0.22 0.62 (0.02) 0.34 0.54 (0.03) 0.18 4,961 0.83 (0.01) 0.61 (0.01) 0.50 (0.01)
Philippines 852 0.70 (0.02) 0.00 0.50 (0.01) 0.00 0.35 (0.01) 0.00 8,302 0.57 (0.01) 0.46 (0.00) 0.26 (0.01)
Latin America and the Caribbean
Brazil 403 0.62 (0.03) 0.00 0.46 (0.01) 0.00 0.29 (0.01) 0.00 2,442 0.40 (0.01) 0.42 (0.00) 0.17 (0.01)
Dominican Republic 354 0.61 (0.03) 0.00 0.50 (0.01) 0.07 0.30 (0.02) 0.00 3,198 0.50 (0.01) 0.47 (0.01) 0.24 (0.01)
Mexico 1,833 0.51 (0.02) 0.00 0.43 (0.01) 0.22 0.22 (0.01) 0.00 32,002 0.34 (0.01) 0.42 (0.00) 0.15 (0.00)
Paraguay 359 0.62 (0.03) 0.00 0.54 (0.01) 0.02 0.33 (0.02) 0.00 4,202 0.46 (0.01) 0.51 (0.00) 0.23 (0.01)
Note: Standard errors in parentheses and are adjusted for survey clustering and stratification. P-value for Adjusted Wald Test for difference in values across disability status.
Poverty Cutoff: k/d = 30%. A person is considered poor if he/she is deprived in at least a sum of 4 out of 10 dimensions.
Source: Authors' calculations based on WHS data.
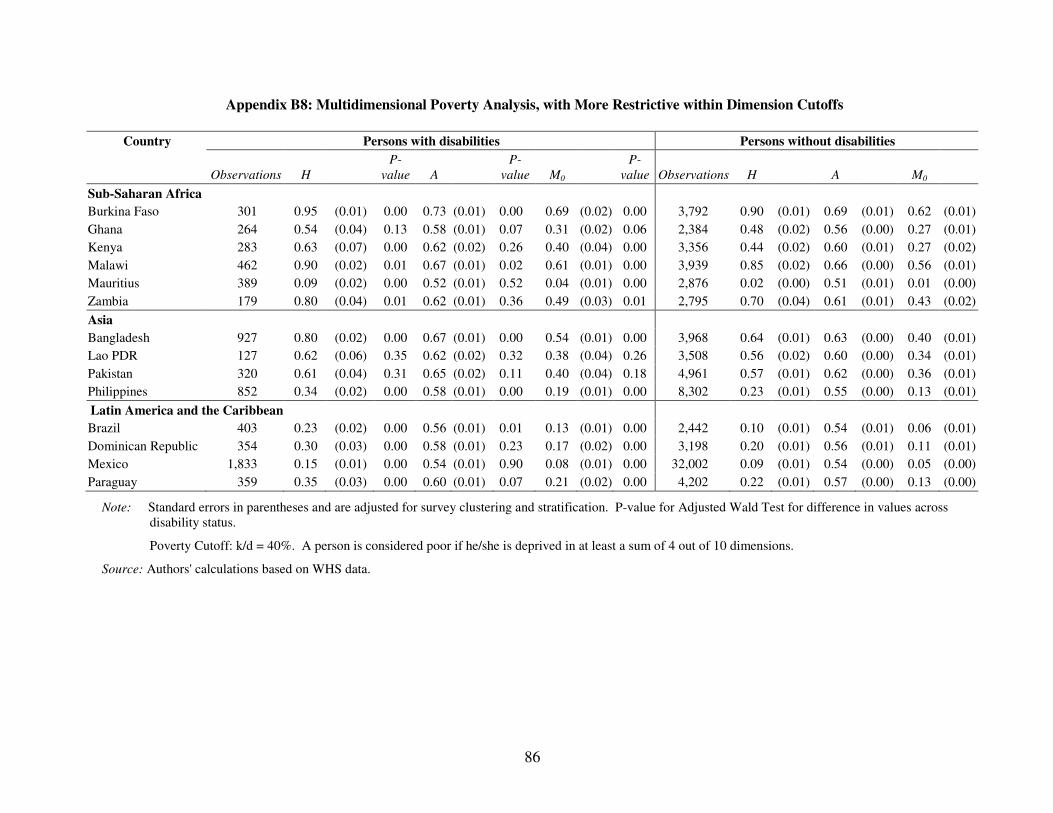
86
Appendix B8: Multidimensional Poverty Analysis, with More Restrictive within Dimension Cutoffs
Country Persons with disabilities Persons without disabilities
Observations H
P-
value A
P-
value M0 P-
value Observations H A M0
Sub-Saharan Africa
Burkina Faso 301 0.95 (0.01) 0.00 0.73 (0.01) 0.00 0.69 (0.02) 0.00 3,792 0.90 (0.01) 0.69 (0.01) 0.62 (0.01)
Ghana 264 0.54 (0.04) 0.13 0.58 (0.01) 0.07 0.31 (0.02) 0.06 2,384 0.48 (0.02) 0.56 (0.00) 0.27 (0.01)
Kenya 283 0.63 (0.07) 0.00 0.62 (0.02) 0.26 0.40 (0.04) 0.00 3,356 0.44 (0.02) 0.60 (0.01) 0.27 (0.02)
Malawi 462 0.90 (0.02) 0.01 0.67 (0.01) 0.02 0.61 (0.01) 0.00 3,939 0.85 (0.02) 0.66 (0.00) 0.56 (0.01)
Mauritius 389 0.09 (0.02) 0.00 0.52 (0.01) 0.52 0.04 (0.01) 0.00 2,876 0.02 (0.00) 0.51 (0.01) 0.01 (0.00)
Zambia 179 0.80 (0.04) 0.01 0.62 (0.01) 0.36 0.49 (0.03) 0.01 2,795 0.70 (0.04) 0.61 (0.01) 0.43 (0.02)
Asia
Bangladesh 927 0.80 (0.02) 0.00 0.67 (0.01) 0.00 0.54 (0.01) 0.00 3,968 0.64 (0.01) 0.63 (0.00) 0.40 (0.01)
Lao PDR 127 0.62 (0.06) 0.35 0.62 (0.02) 0.32 0.38 (0.04) 0.26 3,508 0.56 (0.02) 0.60 (0.00) 0.34 (0.01)
Pakistan 320 0.61 (0.04) 0.31 0.65 (0.02) 0.11 0.40 (0.04) 0.18 4,961 0.57 (0.01) 0.62 (0.00) 0.36 (0.01)
Philippines 852 0.34 (0.02) 0.00 0.58 (0.01) 0.00 0.19 (0.01) 0.00 8,302 0.23 (0.01) 0.55 (0.00) 0.13 (0.01)
Latin America and the Caribbean
Brazil 403 0.23 (0.02) 0.00 0.56 (0.01) 0.01 0.13 (0.01) 0.00 2,442 0.10 (0.01) 0.54 (0.01) 0.06 (0.01)
Dominican Republic 354 0.30 (0.03) 0.00 0.58 (0.01) 0.23 0.17 (0.02) 0.00 3,198 0.20 (0.01) 0.56 (0.01) 0.11 (0.01)
Mexico 1,833 0.15 (0.01) 0.00 0.54 (0.01) 0.90 0.08 (0.01) 0.00 32,002 0.09 (0.01) 0.54 (0.00) 0.05 (0.00)
Paraguay 359 0.35 (0.03) 0.00 0.60 (0.01) 0.07 0.21 (0.02) 0.00 4,202 0.22 (0.01) 0.57 (0.00) 0.13 (0.00)
Note: Standard errors in parentheses and are adjusted for survey clustering and stratification. P-value for Adjusted Wald Test for difference in values across disability status.
Poverty Cutoff: k/d = 40%. A person is considered poor if he/she is deprived in at least a sum of 4 out of 10 dimensions.
Source: Authors' calculations based on WHS data.
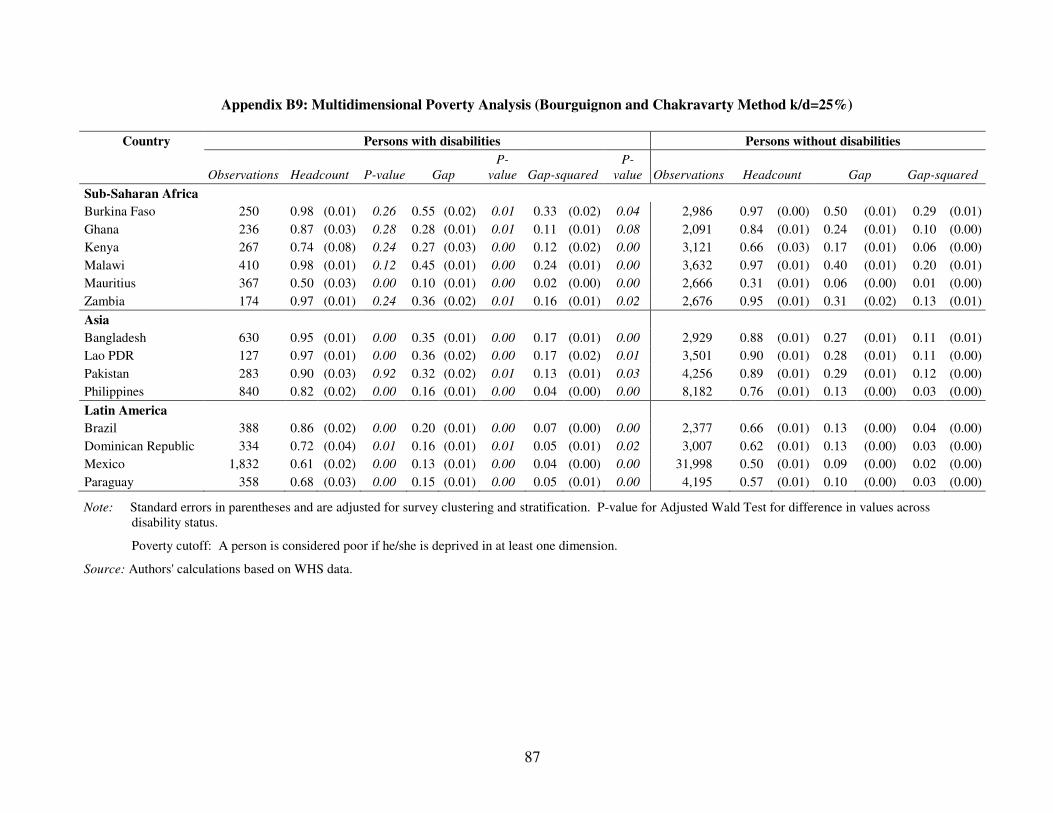
87
Appendix B9: Multidimensional Poverty Analysis (Bourguignon and Chakravarty Method k/d=25%)
Country Persons with disabilities Persons without disabilities
Observations Headcount P-value Gap
P-
value Gap-squared
P-
value Observations Headcount Gap Gap-squared
Sub-Saharan Africa
Burkina Faso 250 0.98 (0.01) 0.26 0.55 (0.02) 0.01 0.33 (0.02) 0.04 2,986 0.97 (0.00) 0.50 (0.01) 0.29 (0.01)
Ghana 236 0.87 (0.03) 0.28 0.28 (0.01) 0.01 0.11 (0.01) 0.08 2,091 0.84 (0.01) 0.24 (0.01) 0.10 (0.00)
Kenya 267 0.74 (0.08) 0.24 0.27 (0.03) 0.00 0.12 (0.02) 0.00 3,121 0.66 (0.03) 0.17 (0.01) 0.06 (0.00)
Malawi 410 0.98 (0.01) 0.12 0.45 (0.01) 0.00 0.24 (0.01) 0.00 3,632 0.97 (0.01) 0.40 (0.01) 0.20 (0.01)
Mauritius 367 0.50 (0.03) 0.00 0.10 (0.01) 0.00 0.02 (0.00) 0.00 2,666 0.31 (0.01) 0.06 (0.00) 0.01 (0.00)
Zambia 174 0.97 (0.01) 0.24 0.36 (0.02) 0.01 0.16 (0.01) 0.02 2,676 0.95 (0.01) 0.31 (0.02) 0.13 (0.01)
Asia
Bangladesh 630 0.95 (0.01) 0.00 0.35 (0.01) 0.00 0.17 (0.01) 0.00 2,929 0.88 (0.01) 0.27 (0.01) 0.11 (0.01)
Lao PDR 127 0.97 (0.01) 0.00 0.36 (0.02) 0.00 0.17 (0.02) 0.01 3,501 0.90 (0.01) 0.28 (0.01) 0.11 (0.00)
Pakistan 283 0.90 (0.03) 0.92 0.32 (0.02) 0.01 0.13 (0.01) 0.03 4,256 0.89 (0.01) 0.29 (0.01) 0.12 (0.00)
Philippines 840 0.82 (0.02) 0.00 0.16 (0.01) 0.00 0.04 (0.00) 0.00 8,182 0.76 (0.01) 0.13 (0.00) 0.03 (0.00)
Latin America
Brazil 388 0.86 (0.02) 0.00 0.20 (0.01) 0.00 0.07 (0.00) 0.00 2,377 0.66 (0.01) 0.13 (0.00) 0.04 (0.00)
Dominican Republic 334 0.72 (0.04) 0.01 0.16 (0.01) 0.01 0.05 (0.01) 0.02 3,007 0.62 (0.01) 0.13 (0.00) 0.03 (0.00)
Mexico 1,832 0.61 (0.02) 0.00 0.13 (0.01) 0.00 0.04 (0.00) 0.00 31,998 0.50 (0.01) 0.09 (0.00) 0.02 (0.00)
Paraguay 358 0.68 (0.03) 0.00 0.15 (0.01) 0.00 0.05 (0.01) 0.00 4,195 0.57 (0.01) 0.10 (0.00) 0.03 (0.00)
Note: Standard errors in parentheses and are adjusted for survey clustering and stratification. P-value for Adjusted Wald Test for difference in values across disability status.
Poverty cutoff: A person is considered poor if he/she is deprived in at least one dimension.
Source: Authors' calculations based on WHS data.
88
APPENDIX C: COUNTRY PROFILES
Appendix C presents country profiles of disability and poverty for each of the 15 developing countries included in the study. These profiles are prepared using the methods described in Section 3. The results presented in the profiles have the same data and measurement limitations, as explained in Section 3. It is advised that the reader first becomes familiar with the data and methods before reading the profiles.
The detailed data presented in the profiles are intended to serve as a source of basic information on the socioeconomic status of persons with disabilities in countries included in the study. By no means can the profiles be used to inform the design of country specific disability policies and programs, or draw conclusions about their performance. The design of disability policies and programs and the assessment of their performance require empirical evidence and its in-depth analyses. For example, in a country with a low employment rate for persons with disabilities compared to that for persons without disabilities, prior to developing a policy or program to enhance employment among persons with disabilities, one needs to find out why the employment rate is low. The possible causes for a low employment rate among persons with disabilities are numerous. It could be that some people with disabilities were already not working prior to becoming disabled. In some cases, the opportunity cost of working may be too high, which would be the case when disability benefits are higher than potential wage. This may not be as much the case in developing as it is in developed countries because disability benefits are not as prevalent, but middle and upper middle income developing countries have both contributory and non-contributory disability benefits in cash. It could also be due to how the underlying health conditions reduce the productivity of persons with disabilities for the types of jobs that are available in the labor market of the country under consideration. One would need to analyze a particular labor market conditions and assess how a particular functional or activity limitation (presented in the profile) may prevent labor force participation in a particular country under consideration. Further, a low employment rate could also be due to a lack of access to assistive devices or personal assistance. For each functional or activity limitation covered in this study, one could assess at the country level, to what extent relevant assistive devices are available and affordable (for example, availability of glasses for persons with seeing limitation). A low employment rate could also result from contextual factors, for instance, a physically inaccessible work environment or negative attitudes with respect to the ability to work of persons with disabilities. An analysis of the physical, social and cultural environment in the labor market would need to be conducted. Once the main causes for low employment rates for persons with disabilities in a particular country are better understood, it becomes feasible to develop evidence-based programs and policies to promote employment among persons with disabilities.
The country profiles include most of the results presented in the overview Tables from the main text. For Zimbabwe, however, PPP PCE data or poverty indicators based on PPP PCE are not presented due to the lack of reliable PPP exchange rates. In Zimbabwe’s profile, PCE data is presented in local currency. Country profiles also include additional information for each country. All individual and household level

89
indicators are presented separately for urban and rural areas. At the individual level, information on the demographic characteristics of persons with and without disabilities and on the types of employment for workers with and without disabilities is presented. At the household level, country profiles include data on the demographic characteristics, median non-medical PCE and living conditions of households with disabilities compared to other households. The profiles also contain the results of a measure of asset deprivation. The asset deprivation indicator considers small assets as TVs, radios, telephones (landline or mobile), refrigerators, washers, motorcycles, and big assets as cars or trucks. If the household has a car or any two of the other assets, it is considered non-deprived.
Profiles follow the same format for each country with data on prevalence, individual level and household level economic well-being indicators. Profiles are presented in turn for countries in Africa, Asia, and Latin America and the Caribbean.
90
C.1. PROFILES FOR COUNTRIES IN AFRICA
C.1.1 Disability Profile: Burkina Faso
Prevalence of disability among working-age population, 18-65 years (Table 1)
In Burkina Faso, disability prevalence among working-age individuals stands at 7.9 percent. With the expanded measure of disability, prevalence goes up to 12.1 percent.
Prevalence rates in rural and urban areas are close (8.1 percent versus 7.2 percent respectively). Disability prevalence is higher for women compared to men (9.0 percent versus 6.8 percent). Prevalence rates for males and females increase by three to four percentage points using the expanded measure of disability.
The most common difficulties reported are those in learning a new task and in concentrating/remembering things for all individuals, males, and females; and in both rural and urban areas.
Demographic characteristics (Table 2)
Overall, demographic characteristics except for age are similar across disability. The average individual with a disability is six years older than the average individual without a disability (mean age: 39 versus 32 years, p<0.05). The oldest age group (46-65 years) makes up 33 percent of working-age persons with disabilities, compared to only 15 percent for persons without disabilities (Chi-sq<0.05).
Education and labor market status (Table 2)
We find no significant difference in educational outcomes across disability status. Approximately 11 percent of persons with and without disabilities have completed primary school (4 percent in rural areas; 39 percent in urban areas). The average working-age person has completed just over one year of education in rural areas and two years of education in urban areas.
Individuals with disabilities are less likely to work than their non-disabled counterparts for the entire country, and within rural and urban areas. Indeed, persons with disabilities show higher rates of non-employment (66 percent versus 41 percent, Chi-sq<0.05). Despite this discrepancy in employment status, the breakdown by type of employment amongst the employed (government, non-government, self-employed, or employer) is similar across disability status.
Household characteristics, assets, living conditions, and expenditures (Table 3)
Comparing households with a working-age adult with a disability to other households, we find little difference in average household size or number of children. It is noteworthy though that the percentage of households headed by males is lower among households with a disability (85 percent versus 92 percent, Chi-sq<0.05).

91
Table 1: Burkina Faso: Prevalence of Disability among Working-Age (18-65) Population
All Rural Urban
All Seeing/recognizing across the road 2.4% 2.5% 1.6% Seeing/recognizing at arm's length 1.3% 1.4% 1.0% Moving around 2.8% 2.8% 2.9% Concentrating/remembering things 4.2% 4.4% 3.2% Self-care 0.9% 0.9% 0.8% Personal relationships 2.5% 2.7% 1.6% Learning a new task 5.0% 5.3% 3.6% Dealing with conflict 0.9% 0.8% 1.4% Disability prevalence (base)
a 7.9% 8.1% 7.2%
Disability prevalence (expanded)b 12.1% 12.4% 10.7%
Males Seeing/recognizing across the road 1.9% 2.1% 1.3% Seeing/recognizing at arm's length 1.2% 1.2% 1.2% Moving around 2.4% 2.4% 2.5% Concentrating/remembering things 3.8% 3.7% 4.1% Self-care 0.9% 0.9% 0.7% Personal relationships 2.6% 2.9% 1.6% Learning a new task 3.8% 3.8% 3.6% Dealing with conflict 0.8% 0.7% 1.1% Disability prevalence (base)
a 6.8% 6.6% 7.7%
Disability prevalence (expanded)b 10.3% 10.3% 10.4%
Females Seeing recognizing across the road 2.8% 2.9% 1.9% Seeing/recognizing at arm's length 1.4% 1.5% 0.8% Moving around 3.2% 3.2% 3.3% Concentrating/remembering things 4.6% 5.1% 2.2% Self-care 0.9% 0.9% 0.9% Personal relationships 2.5% 2.6% 1.7% Learning a new task 6.1% 6.6% 3.6% Dealing with conflict 1.0% 0.8% 1.6% Disability prevalence (base)
a 9.0% 9.5% 6.6%
Disability prevalence (expanded)b 13.7% 14.2% 11.1%
Number of observations (unweighted) 4,093 2,413 1,680 Number of observations (weighted) 16,781,727 13,779,604 3,002,123
Note: a. Base measure of disability prevalence: a person is considered to have a disability as per the base measure if he/she reports that he/she is unable to do or has severe or extreme difficulty for at least one of the following: seeing/ recognizing people across the road; moving around; concentrating or remembering things; self care.
b. Expanded measure of disability prevalence: a person has a disability as per the expanded measure if he/she reports that he/she is unable to do or has severe or extreme difficulty for at least one of the following: seeing/recognizing people across the road; moving around; concentrating or remembering things; self care; seeing/recognizing object at arm's length; personal relationships/ participation in the community; learning a new task; dealing with conflicts/ tension with others.
Source: Authors' calculations based on WHS. All estimates are weighted and adjusted for WHS complex design.

92
Table 2: Burkina Faso: Sample Means across Disability Status among Working-Age (18-65) Individuals a b
By Disability By Disability (Expanded)
All Rural Urban All Rural Urban Yes No Yes No Yes No Yes No Yes No Yes No
Demographics
Female 0.60 0.52 - 0.62 0.53 - 0.45 0.49 - 0.59 0.51 # 0.61 0.52 # 0.50 0.49 -
Male 0.40 0.48 - 0.38 0.47 - 0.55 0.51 - 0.41 0.49 # 0.39 0.48 # 0.50 0.51 -
Married 0.73 0.76 - 0.78 0.81 - 0.47 0.56 - 0.76 0.76 - 0.81 0.80 - 0.53 0.56 -
Age 38.73 31.97 39.01 32.17 37.25 31.09 37.16 31.85 37.33 32.05 36.25 30.97
(1.09) (0.31) * (1.26) (0.37) * (1.77) (0.40) * (0.97) (0.32) * (1.11) (0.38) * (1.62) (0.39) *
18-30 0.35 0.56 # 0.34 0.55 # 0.43 0.59 # 0.42 0.56 # 0.41 0.55 # 0.45 0.59 #
31-45 0.31 0.30 # 0.32 0.30 # 0.27 0.28 # 0.29 0.30 # 0.30 0.31 # 0.26 0.28 #
46-65 0.33 0.15 # 0.34 0.15 # 0.30 0.14 # 0.29 0.14 # 0.29 0.14 # 0.29 0.13 #
Urban 0.16 0.18 - - - 0.16 0.18 - - -
Rural 0.84 0.82 - - - 0.84 0.82 - - -
Education and labor market status
Years of education 1.31 1.36 1.12 1.15 2.26 2.30 1.30 1.36 1.14 1.15 2.14 2.32
(0.07) (0.03) - (0.05) (0.02) - (0.22) (0.09) - (0.06) (0.03) - (0.05) (0.02) - (0.17) (0.09) -
Less than primary school
0.92 0.89 - 0.98 0.96 - 0.62 0.61 - 0.92 0.89 - 0.96 0.96 - 0.68 0.60 -
Primary school completed
0.08 0.11 - 0.02 0.04 - 0.38 0.39 - 0.08 0.11 - 0.04 0.04 - 0.32 0.40 -
Not employed 0.66 0.41 # 0.68 0.41 # 0.58 0.42 # 0.59 0.41 # 0.59 0.40 # 0.56 0.42 #
Employed 0.34 0.59 # 0.32 0.59 # 0.42 0.58 # 0.41 0.59 # 0.41 0.60 # 0.44 0.58 #
Type of employment among the employed
. Government 0.02 0.02 - 0.02 0.01 - 0.04 0.09 - 0.02 0.03 - 0.01 0.01 - 0.06 0.09 -
. Non-government 0.04 0.05 - - 0.02 - 0.21 0.20 - 0.05 0.06 - - 0.03 - 0.27 0.19 -
. Self-employed 0.94 0.91 - 0.98 0.96 - 0.75 0.71 - 0.93 0.91 - 0.99 0.95 - 0.67 0.71 -
. Employer - 0.01 - - 0.01 - - 0.01 - 0.00 0.01 - 0.00 0.01 - - 0.01 -
Multidimensional Poverty Indicator
Multidimensionally Poor (AF method
k/d=40%)c
0.96 0.93 # 0.99 0.98 - 0.79 0.70 - 0.96 0.93 # 0.99 0.98 - 0.80 0.69 #
Number of observations
(unweighted)
301 3,792 200 2,213 101 1,579 468 3,601 314 2,085 154 1,516
Note: a For details on the disability measures, see notes to Table 1. b Standard deviations are in parentheses and are adjusted for survey clustering and stratification, estimates are weighted and adjusted for survey clustering and stratification. c Multidimensional measure developed by Alkire and Foster method k/d=40%, as described in text. * T-Test suggests Significant Difference from "No" at 5% # Pearson's Chi-Sq Test, p-value less than 5%
Source: Authors' calculations based on WHS. All estimates are weighted and adjusted for WHS complex design.

93
Table 3: Burkina Faso: Characteristics and Economic Well-being of Households across Disability Status a b
By Disability (Base) By Disability (Expanded)
All Urban Rural All Urban Rural HHs of
working-age
adults with
disability
Other HHs
HHs of working-
age adults with
disability
Other HHs
HHs of working-
age adults with
disability
Other HHs
HHs of working-
age adults with
disability
Other HHs
HHs of working-
age adults with
disability
Other HHs
HHs of working-
age adults with
disability
Other HHs
Demographics
Household size 6.14 5.88 6.16 5.92 6.04 5.71 5.86 5.91 5.86 5.94 5.80 5.72
(0.26) (0.09) - (0.29) (0.11) - (0.36) (0.12) - (0.22) (0.09) - (0.25) (0.11) - (0.30) (0.12) -
Number of children 0-17 3.36 3.21 3.46 3.29 2.69 2.75 3.17 3.22 3.26 3.31 2.57 2.76
(0.17) (0.07) - (0.19) (0.08) - (0.17) (0.09) - (0.15) (0.07) - (0.18) (0.08) - (0.15) (0.09) -
Male headed household 0.85 0.92 # 0.87 0.93 # 0.74 0.84 # 0.86 0.92 # 0.88 0.93 # 0.77 0.84 #
Assets
Asset indexc 8.02 10.42 4.42 5.83 31.58 35.15 8.58 10.44 4.82 5.84 33.06 35.04
(0.80) (0.52) * (0.50) (0.33) * (2.38) (1.62) - (0.75) (0.54) * (0.44) (0.34) * (2.70) (1.61) -
Asset deprivationd 0.91 0.90 - 0.95 0.96 - 0.66 0.57 # 0.90 0.90 - 0.94 0.96 - 0.63 0.57 -
Living conditionsd
Household lacks electricity 0.95 0.91 # 0.99 0.98 - 0.64 0.56 - 0.94 0.92 - 0.99 0.98 - 0.59 0.56 -
Household lacks clean water source
0.55 0.47 - 0.59 0.52 - 0.24 0.24 - 0.54 0.47 - 0.59 0.51 - 0.24 0.24 -
Household lacks adequate sanitation
0.94 0.89 # 0.98 0.95 # 0.64 0.59 - 0.93 0.89 # 0.97 0.94 # 0.62 0.59 -
Household lacks a hard floor 0.80 0.76 - 0.89 0.86 - 0.20 0.25 - 0.79 0.76 - 0.88 0.86 - 0.21 0.25 -
Household cooks on wood, charcoal, or dung
0.99 0.97 # 0.99 0.99 - 0.95 0.87 # 0.99 0.97 - 0.99 0.99 - 0.93 0.87 -
Non-medical household PCE (international $, PPP 2005)
Mean 30.91 31.38 26.44 26.88 60.45 55.27 29.96 31.31 25.73 26.73 57.72 55.45
(2.63) (1.30) - (1.65) (1.41) - (16.17) (3.19) - (2.02) (1.29) - (1.45) (1.42) - (11.22) (3.18) -
Median 20.11 19.57 19.43 17.49 30.50 34.05 20.08 19.68 19.38 17.49 29.73 34.39
Medical expenditures
Ratio of medical expenditures to total expenditures
0.10 0.09 0.10 0.08 0.14 0.11 0.10 0.09 0.09 0.08 0.14 0.11
(0.01) (0.00) - (0.01) (0.01) - (0.02) (0.01) - (0.01) (0.00) - (0.01) (0.01) - (0.02) (0.01) *
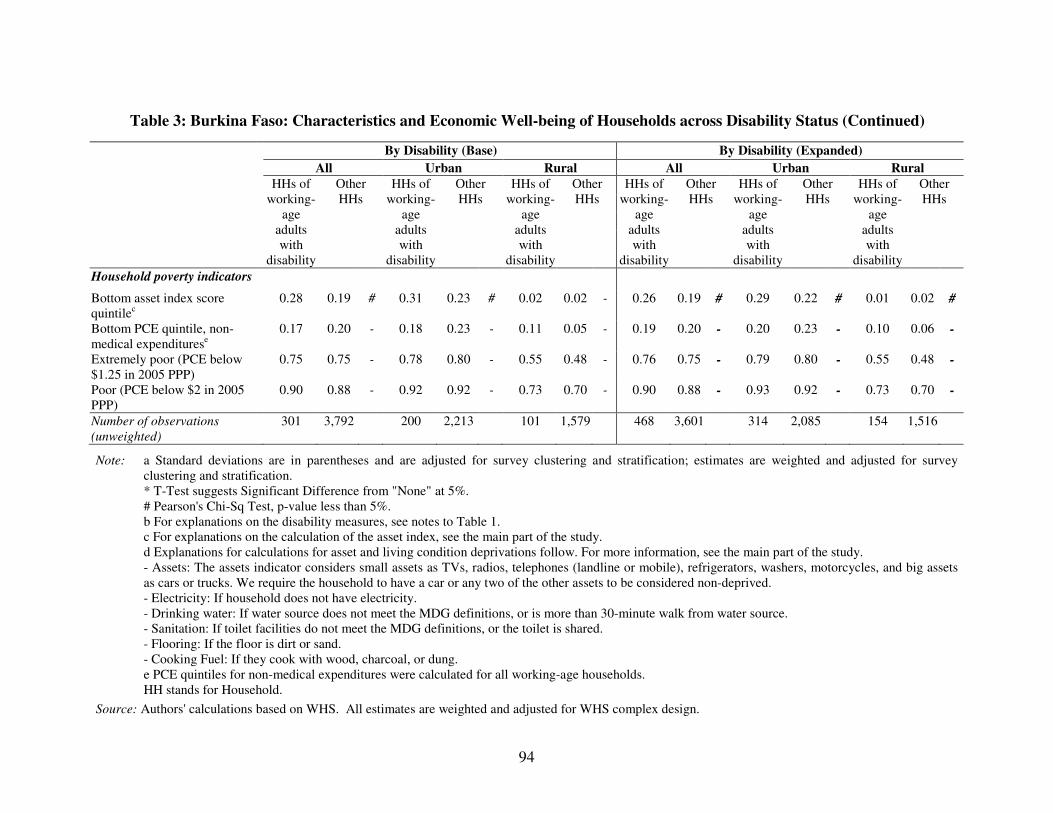
94
Table 3: Burkina Faso: Characteristics and Economic Well-being of Households across Disability Status (Continued)
By Disability (Base) By Disability (Expanded)
All Urban Rural All Urban Rural HHs of
working-age
adults with
disability
Other HHs
HHs of working-
age adults with
disability
Other HHs
HHs of working-
age adults with
disability
Other HHs
HHs of working-
age adults with
disability
Other HHs
HHs of working-
age adults with
disability
Other HHs
HHs of working-
age adults with
disability
Other HHs
Household poverty indicators
Bottom asset index score quintilec
0.28 0.19 # 0.31 0.23 # 0.02 0.02 - 0.26 0.19 # 0.29 0.22 # 0.01 0.02 #
Bottom PCE quintile, non-medical expenditurese
0.17 0.20 - 0.18 0.23 - 0.11 0.05 - 0.19 0.20 - 0.20 0.23 - 0.10 0.06 -
Extremely poor (PCE below $1.25 in 2005 PPP)
0.75 0.75 - 0.78 0.80 - 0.55 0.48 - 0.76 0.75 - 0.79 0.80 - 0.55 0.48 -
Poor (PCE below $2 in 2005 PPP)
0.90 0.88 - 0.92 0.92 - 0.73 0.70 - 0.90 0.88 - 0.93 0.92 - 0.73 0.70 -
Number of observations
(unweighted)
301 3,792 200 2,213 101 1,579 468 3,601 314 2,085 154 1,516
Note: a Standard deviations are in parentheses and are adjusted for survey clustering and stratification; estimates are weighted and adjusted for survey clustering and stratification.
* T-Test suggests Significant Difference from "None" at 5%. # Pearson's Chi-Sq Test, p-value less than 5%. b For explanations on the disability measures, see notes to Table 1. c For explanations on the calculation of the asset index, see the main part of the study. d Explanations for calculations for asset and living condition deprivations follow. For more information, see the main part of the study. - Assets: The assets indicator considers small assets as TVs, radios, telephones (landline or mobile), refrigerators, washers, motorcycles, and big assets as cars or trucks. We require the household to have a car or any two of the other assets to be considered non-deprived. - Electricity: If household does not have electricity. - Drinking water: If water source does not meet the MDG definitions, or is more than 30-minute walk from water source. - Sanitation: If toilet facilities do not meet the MDG definitions, or the toilet is shared. - Flooring: If the floor is dirt or sand. - Cooking Fuel: If they cook with wood, charcoal, or dung. e PCE quintiles for non-medical expenditures were calculated for all working-age households. HH stands for Household.
Source: Authors' calculations based on WHS. All estimates are weighted and adjusted for WHS complex design.

95
For the overall population, asset index scores are lower for households with a disability compared to other households. The asset index score for households with a disabled member is 8.02, while the score for other households is 10.42 (p<0.05). The left panel of Figure 1 shows the cumulative distribution function (CDF) of the asset index scores for both households with and without disability. The CDFs for the two groups are relatively close but the CDF for households with disabilities resides to the left and above the CDF for households without disability, suggesting lower asset ownership levels for households with disability.
Figure 1: Burkina Faso: Cumulative Distribution of Asset Index Score and Per Capita Household Expenditures
Note: HH stands for household.
A second indicator for asset ownership considers small assets including TVs, radios, telephones (landline or mobile), refrigerators, washing machines and dish washers, motorcycles, and big assets including cars or trucks. We require the household to have a car or any two of the other assets to be considered non-deprived. The percentage of households that are asset-deprived, by this measure, is similar for households across disability status, approximately 90 percent for each group. However, the share of households lacking electricity, adequate sanitation, and adequate cooking fuel sources is higher for households with disability (Chi-sq<0.05).
Mean and median non-medical monthly PCE are similar for households with disabilities compared to other households (median PCE: US$20.11 versus US$19.57; mean PCE: US$30.91 versus US$31.38).3 The right panel of Figure 1 above shows the cumulative distribution function of PCE for both households with and without disabilities. Differences in the ratio of medical to total monthly expenditures are not statistically different across disability status; they are near 10 percent for both groups.
3 Monthly PCE Figures are denoted in international $, 2005 PPP, adjusted for inflation.
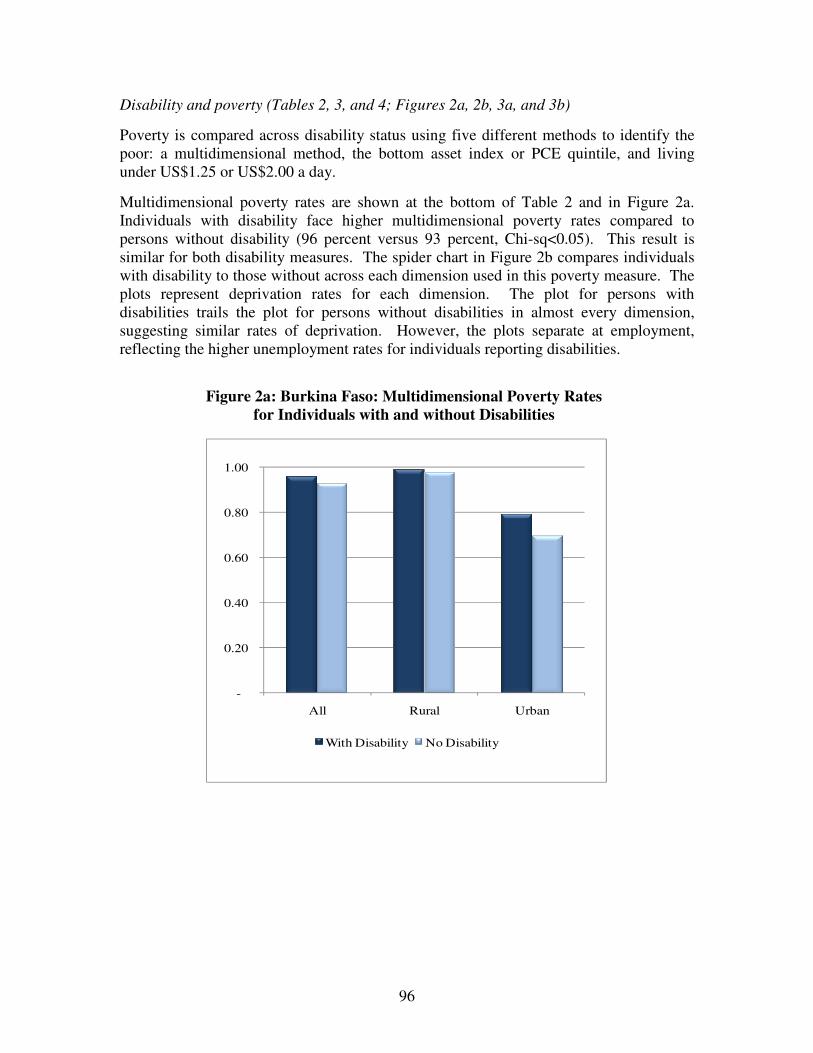
96
Disability and poverty (Tables 2, 3, and 4; Figures 2a, 2b, 3a, and 3b)
Poverty is compared across disability status using five different methods to identify the poor: a multidimensional method, the bottom asset index or PCE quintile, and living under US$1.25 or US$2.00 a day.
Multidimensional poverty rates are shown at the bottom of Table 2 and in Figure 2a. Individuals with disability face higher multidimensional poverty rates compared to persons without disability (96 percent versus 93 percent, Chi-sq<0.05). This result is similar for both disability measures. The spider chart in Figure 2b compares individuals with disability to those without across each dimension used in this poverty measure. The plots represent deprivation rates for each dimension. The plot for persons with disabilities trails the plot for persons without disabilities in almost every dimension, suggesting similar rates of deprivation. However, the plots separate at employment, reflecting the higher unemployment rates for individuals reporting disabilities.
Figure 2a: Burkina Faso: Multidimensional Poverty Rates
for Individuals with and without Disabilities
-
0.20
0.40
0.60
0.80
1.00
All Rural Urban
With Disability No Disability

97
Figure 2b: Burkina Faso: Deprivation Rates across Multiple Dimensions for Individuals with and without Disabilities
-
0.20
0.40
0.60
0.80
1.00
Individual Not Employed
Individual has less than Primary Education
PCE under $2/day
Medical Expense ratio > 10%
Household lacks electricity
Household lacks clean water source
Household lacks adequate sanitation
Household lacks a hard floor
Household cooks on wood,
charcoal, or dung
Household is Asset Deprived
(see text)
With Disability No Disability
All households are ranked by their asset index score from the lowest (bottom) to the highest asset index score, and categorized by quintile (with cutoffs at the 20th, 40th, 60th, and 80th percentiles for the five quintiles). Then, the percentage of households with disability that are in the bottom quintile is presented and compared to the percentage of other households in the bottom quintile. For instance, if more than 20 percent of households with disabilities are in the bottom quintile, households with disabilities are overrepresented in the bottom quintile. This procedure is repeated for non-medical PCE. As shown in Table 3, households with disabilities are overrepresented in the bottom asset index score quintile of all households, with 28 percent of households with disabilities forming part of this group, compared to 19 percent of households without disabilities (Chi-sq<0.05). However, differences in households falling in the bottom PCE quintile fail significance tests.
Overall, three quarters of all households in Burkina Faso fall below PPP US$1.25 per day, and 88 percent are below PPP US$2.00 per day. We find no statistically significant difference in poverty rates across disability status. Figures 3a and 3b show these comparisons.

98
Figure 3a: Burkina Faso: Poverty Rates (Percentage below PPP US$1.25 a day) for
Household with/without a Disabled Member
Figure 3b: Burkina Faso: Poverty Rates (Percentage below PPP US$2.00 a day) for
Household with/without a Disabled Member
0.00
0.20
0.40
0.60
0.80
1.00
All Rural Urban
With Disability No Disability
0.00
0.20
0.40
0.60
0.80
1.00
All Rural Urban
With Disability No Disability
Table 4 shows the disability prevalence for poor versus non-poor, using each of the five definitions of poverty studied above. Disability prevalence is four to five percentage points higher for the multidimensional poor, depending on the disability measures employed (p<0.05). Using the base disability measure for the entire country, 8.20 percent of multidimensionally poor persons report a disability, compared to 4.50 percent of non-poor persons (p<0.05).
Across the other four poverty measures used, differences in disability prevalence across poverty status are not statistically significant (whether measured as a comparison of the bottom versus upper quintiles for asset index and PCE, or measured as falling below or above a US$1.25 and US$2 a day poverty line).

99
Table 4: Burkina Faso: Prevalence of Disability among Working-Age (18-65) Population across Poverty Statusa
Poverty identification Individuals who
are multi-dimensionally
poorb
Individuals in HHs in bottom
asset index quintilec
Individuals in HHs in bottom PCE quintiled
Individuals in HHs with PCE below US$1.25
PPP 2005
Individuals in HHs with PCE below US$2.00
PPP 2005 Poverty status Poor Non-poor Poor Non-poor Poor Non-poor Poor Non-poor Poor Non-poor
All Disability prevalence
(base)
8.20 4.50 * 10.10 7.49 6.88 8.23 8.10 7.46 8.11 6.57
Disability prevalence
(expanded)
12.44 7.18 * 14.44 11.66 11.49 12.25 12.41 11.05 12.33 10.07
Rural
Disability prevalence
(base)
8.22 2.69 * 10.11 7.54 6.47 8.64 8.18 7.83 8.27 6.09
Disability prevalence
(expanded)
12.49 6.56 14.50 11.83 11.04 12.81 12.51 11.79 12.57 9.92
Urban Disability prevalence
(base)
8.08 5.01 9.22 7.32 13.94 6.70 7.48 6.83 7.19 7.11
Disability prevalence
(expanded)
12.16 7.36 * 9.22 11.05 19.20 10.17 11.63 9.79 10.94 10.25
Note: a For explanations on the disability measures, see notes to Table 1. b Multidimensional variable as developed by Alkire and Foster method k=40%, as described in text. For explanations on the calculation of the asset index, see text. d PCE refers to monthly, non-medical household per-capita expenditures. * T-Test suggests significant difference from "Non-poor" at 5%. HH stands for household.
Source: Authors' calculations based on WHS. All estimates are weighted and adjusted for WHS complex design.
Conclusion
In Burkina Faso, results from the analysis of WHS data suggest that disability is associated with lower levels of economic well-being for several household- and individual-level indicators. Households with disability have lower asset index scores and higher rates of households that lack electricity and adequate sanitation. Multidimensional poverty rates are higher for persons with disabilities. Working-age persons with disabilities have lower employment rates.
100
C.1.2 Disability Profile: Ghana
Prevalence of disability among working-age population, 18-65 years (Table 1)
In Ghana, disability prevalence among working-age individuals stands at 8.4 percent. With the expanded measure of disability, the prevalence stands at 12.5 percent.
Prevalence rates in rural and urban areas are close (8.2 percent versus 8.6 percent respectively). Disability prevalence is higher for women (10.6 percent) compared to men (6.2 percent). Prevalence rates for males and females increase by three to four percentage points using the expanded measure of disability. The most common difficulties are those in learning a new task and in concentrating/remembering things for all individuals, and for males and females separately.
Demographic characteristics (Table 2)
Age and gender profiles differ significantly across disability. Persons with disabilities are 64 percent female compared to 50 percent for persons without disabilities. The average individual with a disability is eight years older than the average individual without a disability (mean age: 41versus 33 years, p<0.05). The oldest age group (46-65 years) makes up 38 percent of working-age persons with disabilities, compared to only 17 percent for persons without disabilities (Chi-sq<0.05).
Education and labor market status (Table 2)
Individuals with disabilities have significantly lower educational attainment. Years of education completed are 2.41 for persons with disabilities, compared to 2.63 for persons without disabilities (p<0.05). In addition, only 54 percent of persons with disabilities have completed primary school compared to 65 percent of persons without disabilities (Chi-sq<0.05). It should be noted that in rural areas, differences in educational attainment across disability status are not statistically significant.
Analyzing employment outcomes across disability status, we find no significant difference for employment rates or types of employment.
Household characteristics, assets, living conditions, and expenditures (Table 3)
Comparing households with a working-age adult with a disability to other households, we find no significant difference in average household size or in the number of children. However, we find that the percentage of households headed by males is lower for households with a disabled member compared to other households (60 percent versus 74 percent, Chi-sq<0.05).

101
Table 1: Ghana: Prevalence of Disability among Working-Age (18-65) Population
All Rural Urban
All Seeing/recognizing across the road 3.0% 2.8% 3.3% Seeing/recognizing at arm's length 2.2% 2.5% 1.9% Moving around 2.1% 2.3% 1.9% Concentrating/remembering things 4.0% 4.3% 3.7% Self-care 0.9% 0.7% 1.2% Personal relationships 1.8% 2.0% 1.5% Learning a new task 3.4% 3.0% 3.8% Dealing with conflict 2.1% 2.1% 2.0% Disability prevalence (base)
a 8.4% 8.2% 8.6%
Disability prevalence (expanded)b 12.5% 12.2% 13.0%
Males Seeing/recognizing across the road 2.3% 2.3% 2.3% Seeing/recognizing at arm's length 2.2% 2.6% 1.8% Moving around 2.1% 2.2% 1.9% Concentrating/remembering things 2.5% 3.2% 1.7% Self-care 0.9% 0.7% 1.1% Personal relationships 1.6% 1.8% 1.4% Learning a new task 2.7% 2.2% 3.4% Dealing with conflict 1.6% 1.7% 1.4% Disability prevalence (base)
a 6.2% 6.4% 5.9%
Disability prevalence (expanded)b 10.5% 10.3% 10.7%
Females Seeing/recognizing across the road 3.7% 3.2% 4.2% Seeing/recognizing at arm's length 2.3% 2.4% 2.1% Moving around 2.1% 2.3% 1.9% Concentrating/remembering things 5.5% 5.4% 5.6% Self-care 0.9% 0.6% 1.2% Personal relationships 1.9% 2.1% 1.7% Learning a new task 4.0% 3.8% 4.2% Dealing with conflict 2.5% 2.4% 2.6% Disability prevalence (base)
a 10.6% 10.0% 11.2%
Disability prevalence (expanded)b 14.6% 14.1% 15.1%
Number of observations (unweighted) 2,648 1,633 1,015 Number of observations (weighted) 23,080,785 12,671,619 10,409,166
Note: a. Base measure of disability prevalence: a person is considered to have a disability as per the base measure if he/she reports that he/she is unable to do or has severe or extreme difficulty for at least one of the following: seeing/recognizing people across the road; moving around; concentrating or remembering things; self care.
b. Expanded measure of disability prevalence: a person has a disability as per the expanded measure if he/she reports that he/she is unable to do or has severe or extreme difficulty for at least one of the following: seeing/recognizing people across the road; moving around; concentrating or remembering things; self care; seeing/recognizing object at arm's length; personal relationships/ participation in the community; learning a new task; dealing with conflicts/tension with others.
Source: Authors' calculations based on WHS. All estimates are weighted and adjusted for WHS complex design.

102
Table 2: Ghana: Sample Means across Disability Status among Working-Age (18-65) Individuals a b
By Disability By Disability (Expanded) All Rural Urban All Rural Urban
Yes No Yes No Yes No Yes No Yes No Yes No Demographics
Female 0.64 0.50 # 0.62 0.49 # 0.67 0.50 # 0.59 0.50 # 0.58 0.49 # 0.60 0.50 -
Male 0.36 0.50 # 0.38 0.51 # 0.33 0.50 # 0.41 0.50 # 0.42 0.51 # 0.40 0.50 -
Married 0.58 0.56 - 0.62 0.62 - 0.53 0.49 - 0.58 0.56 - 0.63 0.62 - 0.52 0.49 -
Age 40.96 32.69 40.96 32.88 40.95 32.46 39.20 32.56 39.82 32.66 38.49 32.43
(0.97) (0.29) * (1.35) (0.39) * (1.41) (0.44) * (0.91) (0.30) * (1.20) (0.40) * (1.39) (0.44) *
18-30 0.27 0.53 # 0.25 0.53 # 0.28 0.53 # 0.33 0.53 # 0.29 0.53 # 0.36 0.53 #
31-45 0.35 0.31 # 0.38 0.30 # 0.32 0.32 # 0.34 0.31 # 0.35 0.30 # 0.32 0.31 #
46-65 0.38 0.17 # 0.37 0.17 # 0.40 0.16 # 0.34 0.16 # 0.35 0.17 # 0.32 0.16 #
Urban 0.46 0.45 - - - 0.47 0.45 - - -
Rural 0.54 0.55 - - - 0.53 0.55 - - -
Education and labor market status Years of education 2.41 2.63 2.28 2.41 2.56 2.89 2.41 2.64 2.23 2.42 2.62 2.90 (0.09) (0.04) * (0.10) (0.05) - (0.16) (0.07) * (0.08) (0.04) * (0.09) (0.05) * (0.12) (0.07) *
Less than primary school 0.46 0.35 # 0.49 0.41 - 0.43 0.28 # 0.46 0.35 # 0.52 0.40 # 0.38 0.28 -
Primary school completed 0.54 0.65 # 0.51 0.59 - 0.57 0.72 # 0.54 0.65 # 0.48 0.60 # 0.62 0.72 -
Not employed 0.22 0.24 - 0.18 0.18 - 0.27 0.31 - 0.23 0.24 - 0.19 0.18 - 0.28 0.31 -
Employed 0.78 0.76 - 0.82 0.82 - 0.73 0.69 - 0.77 0.76 - 0.81 0.82 - 0.72 0.69 -
Type of employment among the employed
. Government 0.10 0.08 - 0.04 0.04 - 0.17 0.13 - 0.08 0.08 - 0.05 0.04 - 0.13 0.13 -
. Non-government 0.06 0.07 - 0.04 0.03 - 0.08 0.14 - 0.07 0.07 - 0.03 0.03 - 0.12 0.14 -
. Self-employed 0.84 0.84 - 0.91 0.93 - 0.75 0.72 - 0.84 0.85 - 0.92 0.93 - 0.74 0.73 -
. Employer 0.00 0.00 - 0.01 0.00 - - 0.01 - 0.00 0.01 - 0.01 0.00 - - 0.01 -
Multidimensional poverty indicator
Multidimensionally poor (AF method k/d=40%)
c 0.67 0.60 - 0.79 0.73 - 0.53 0.43 - 0.65 0.60 - 0.80 0.73 - 0.47 0.43 -
Number of observations
(unweighted)
264 2,384 161 1,472 103 912 376 2,248 231 1,389 145 859
Note: a For details on the disability measures, see notes to Table 1. b Standard deviations are in parentheses and are adjusted for survey clustering and stratification and are adjusted for survey clustering and stratification, estimates are weighted. c Multidimensional measure developed by Alkire and Foster method k/d=40%, as described in the main part of the
study. * T-Test suggests significant difference from "No" at 5% # Pearson's Chi-Sq Test, p-value less than 5%
Source: Authors' calculations based on WHS. All estimates are weighted and adjusted for WHS complex design.
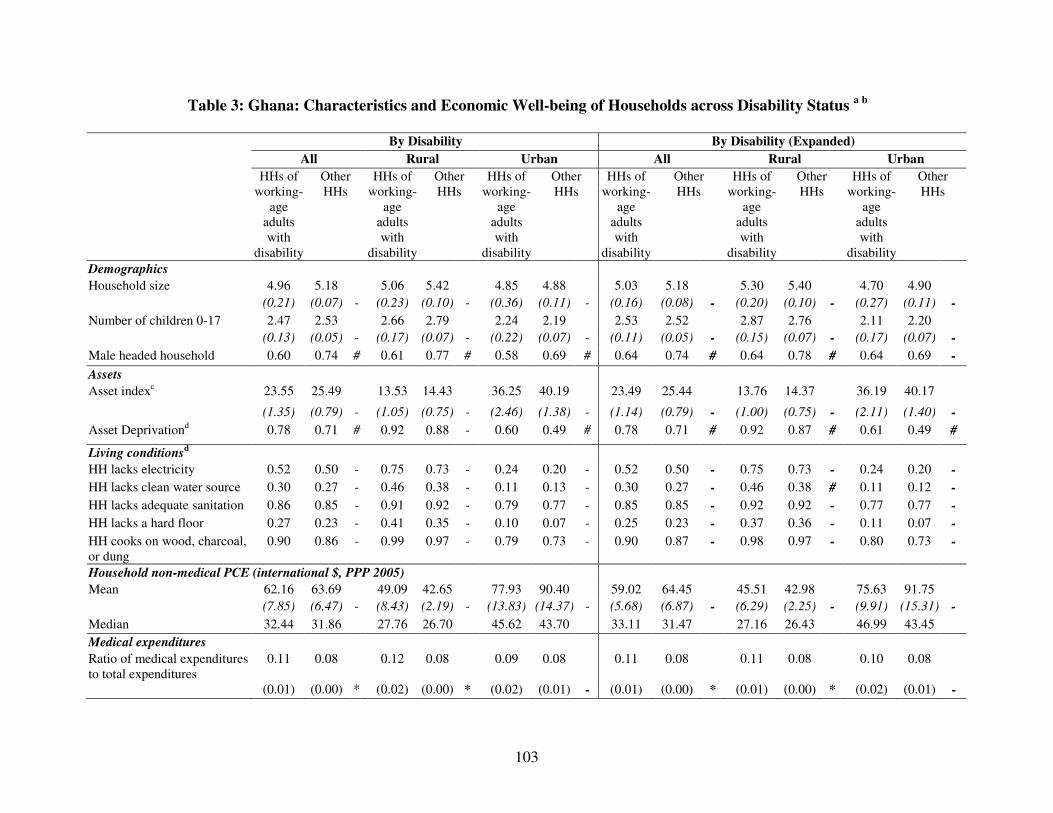
103
Table 3: Ghana: Characteristics and Economic Well-being of Households across Disability Status a b
By Disability By Disability (Expanded)
All Rural Urban All Rural Urban
HHs of working-
age adults with
disability
Other HHs
HHs of working-
age adults with
disability
Other HHs
HHs of working-
age adults with
disability
Other HHs
HHs of working-
age adults with
disability
Other HHs
HHs of working-
age adults with
disability
Other HHs
HHs of working-
age adults with
disability
Other HHs
Demographics
Household size 4.96 5.18 5.06 5.42 4.85 4.88 5.03 5.18 5.30 5.40 4.70 4.90
(0.21) (0.07) - (0.23) (0.10) - (0.36) (0.11) - (0.16) (0.08) - (0.20) (0.10) - (0.27) (0.11) -
Number of children 0-17 2.47 2.53 2.66 2.79 2.24 2.19 2.53 2.52 2.87 2.76 2.11 2.20
(0.13) (0.05) - (0.17) (0.07) - (0.22) (0.07) - (0.11) (0.05) - (0.15) (0.07) - (0.17) (0.07) -
Male headed household 0.60 0.74 # 0.61 0.77 # 0.58 0.69 # 0.64 0.74 # 0.64 0.78 # 0.64 0.69 -
Assets
Asset indexc 23.55 25.49 13.53 14.43 36.25 40.19 23.49 25.44 13.76 14.37 36.19 40.17
(1.35) (0.79) - (1.05) (0.75) - (2.46) (1.38) - (1.14) (0.79) - (1.00) (0.75) - (2.11) (1.40) -
Asset Deprivationd 0.78 0.71 # 0.92 0.88 - 0.60 0.49 # 0.78 0.71 # 0.92 0.87 # 0.61 0.49 #
Living conditionsd
HH lacks electricity 0.52 0.50 - 0.75 0.73 - 0.24 0.20 - 0.52 0.50 - 0.75 0.73 - 0.24 0.20 -
HH lacks clean water source 0.30 0.27 - 0.46 0.38 - 0.11 0.13 - 0.30 0.27 - 0.46 0.38 # 0.11 0.12 -
HH lacks adequate sanitation 0.86 0.85 - 0.91 0.92 - 0.79 0.77 - 0.85 0.85 - 0.92 0.92 - 0.77 0.77 -
HH lacks a hard floor 0.27 0.23 - 0.41 0.35 - 0.10 0.07 - 0.25 0.23 - 0.37 0.36 - 0.11 0.07 -
HH cooks on wood, charcoal, or dung
0.90 0.86 - 0.99 0.97 - 0.79 0.73 - 0.90 0.87 - 0.98 0.97 - 0.80 0.73 -
Household non-medical PCE (international $, PPP 2005)
Mean 62.16 63.69 49.09 42.65 77.93 90.40 59.02 64.45 45.51 42.98 75.63 91.75
(7.85) (6.47) - (8.43) (2.19) - (13.83) (14.37) - (5.68) (6.87) - (6.29) (2.25) - (9.91) (15.31) -
Median 32.44 31.86 27.76 26.70 45.62 43.70 33.11 31.47 27.16 26.43 46.99 43.45
Medical expenditures
Ratio of medical expenditures to total expenditures
0.11 0.08 0.12 0.08 0.09 0.08 0.11 0.08 0.11 0.08 0.10 0.08
(0.01) (0.00) * (0.02) (0.00) * (0.02) (0.01) - (0.01) (0.00) * (0.01) (0.00) * (0.02) (0.01) -

104
Table 3: Ghana: Characteristics and Economic Well-being of Households across Disability Status (Continued)
By Disability By Disability (Expanded)
All Rural Urban All Rural Urban
HHs of working-
age adults with
disability
Other HHs
HHs of working-
age adults with
disability
Other HHs
HHs of working-
age adults with
disability
Other HHs
HHs of working-
age adults with
disability
Other HHs
HHs of working-
age adults with
disability
Other HHs
HHs of working-
age adults with
disability
Other HHs
Household poverty indicators
Bottom asset index score quintilec
0.16 0.20 - 0.27 0.33 - 0.03 0.03 - 0.17 0.21 - 0.27 0.34 # 0.03 0.03 -
Bottom PCE quintile, non-medical expenditurese
0.20 0.20 - 0.26 0.27 - 0.14 0.10 - 0.21 0.20 - 0.28 0.27 - 0.11 0.11 -
Extremely poor (PCE below $1.25 in 2005 PPP)
0.47 0.49 - 0.59 0.62 - 0.33 0.33 - 0.46 0.49 - 0.60 0.62 - 0.29 0.33 -
Poor (PCE below $2 in 2005 PPP)
0.71 0.70 - 0.80 0.81 - 0.61 0.55 - 0.70 0.70 - 0.82 0.81 - 0.55 0.56 -
Number of observations
(unweighted)
264 2,384 161 1,472 103 912 376 2,248 231 1,389 145 859
Note: a Standard deviations are in parentheses and are adjusted for survey clustering and stratification, estimates are weighted. * T-Test suggests Significant Difference from "None" at 5%.
# Pearson's Chi-Sq Test, p-value less than 5%. b For explanations on the disability measures, see notes to Table 1. c For explanations on the calculation of the asset index, see the main part of the study. d Explanations for calculations for asset and living condition deprivations follow. For more information, see the main part of the study. - Assets: The assets indicator considers small assets as TVs, radios, telephones (landline or mobile), refrigerators, washers, motorcycles, and big assets as cars or trucks. We require the household to have a car or any two of the other assets to be considered non-deprived. - Electricity: If household does not have electricity. - Drinking water: If water source does not meet the MDG definitions, or is more than 30-minute walk from water source. - Sanitation: If toilet facilities do not meet the MDG definitions, or the toilet is shared. - Flooring: If the floor is dirt or sand. - Cooking Fuel: If they cook with wood, charcoal, or dung. e PCE quintiles for non-medical expenditures were calculated for all working-age households. HH stands for Household.
Source: Authors' calculations based on WHS. All estimates are weighted and adjusted for WHS complex design.
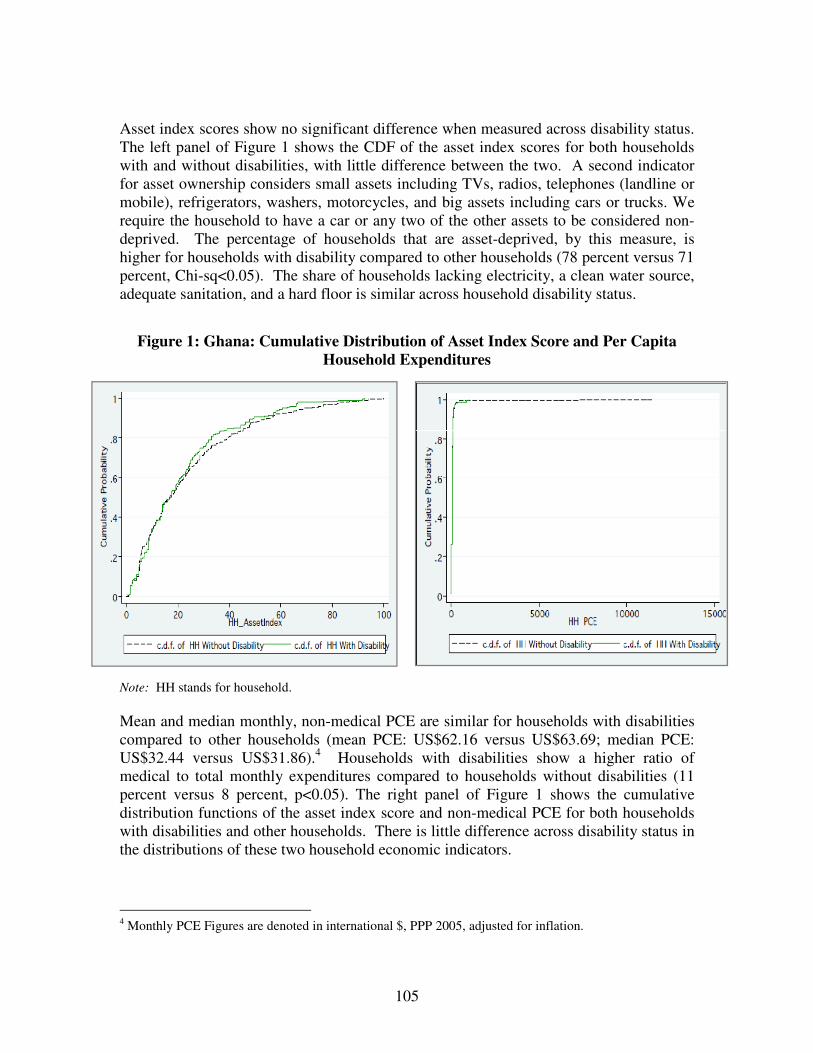
105
Asset index scores show no significant difference when measured across disability status. The left panel of Figure 1 shows the CDF of the asset index scores for both households with and without disabilities, with little difference between the two. A second indicator for asset ownership considers small assets including TVs, radios, telephones (landline or mobile), refrigerators, washers, motorcycles, and big assets including cars or trucks. We require the household to have a car or any two of the other assets to be considered non-deprived. The percentage of households that are asset-deprived, by this measure, is higher for households with disability compared to other households (78 percent versus 71 percent, Chi-sq<0.05). The share of households lacking electricity, a clean water source, adequate sanitation, and a hard floor is similar across household disability status.
Figure 1: Ghana: Cumulative Distribution of Asset Index Score and Per Capita Household Expenditures
Note: HH stands for household. Mean and median monthly, non-medical PCE are similar for households with disabilities compared to other households (mean PCE: US$62.16 versus US$63.69; median PCE: US$32.44 versus US$31.86).4 Households with disabilities show a higher ratio of medical to total monthly expenditures compared to households without disabilities (11 percent versus 8 percent, p<0.05). The right panel of Figure 1 shows the cumulative distribution functions of the asset index score and non-medical PCE for both households with disabilities and other households. There is little difference across disability status in the distributions of these two household economic indicators.
4 Monthly PCE Figures are denoted in international $, PPP 2005, adjusted for inflation.
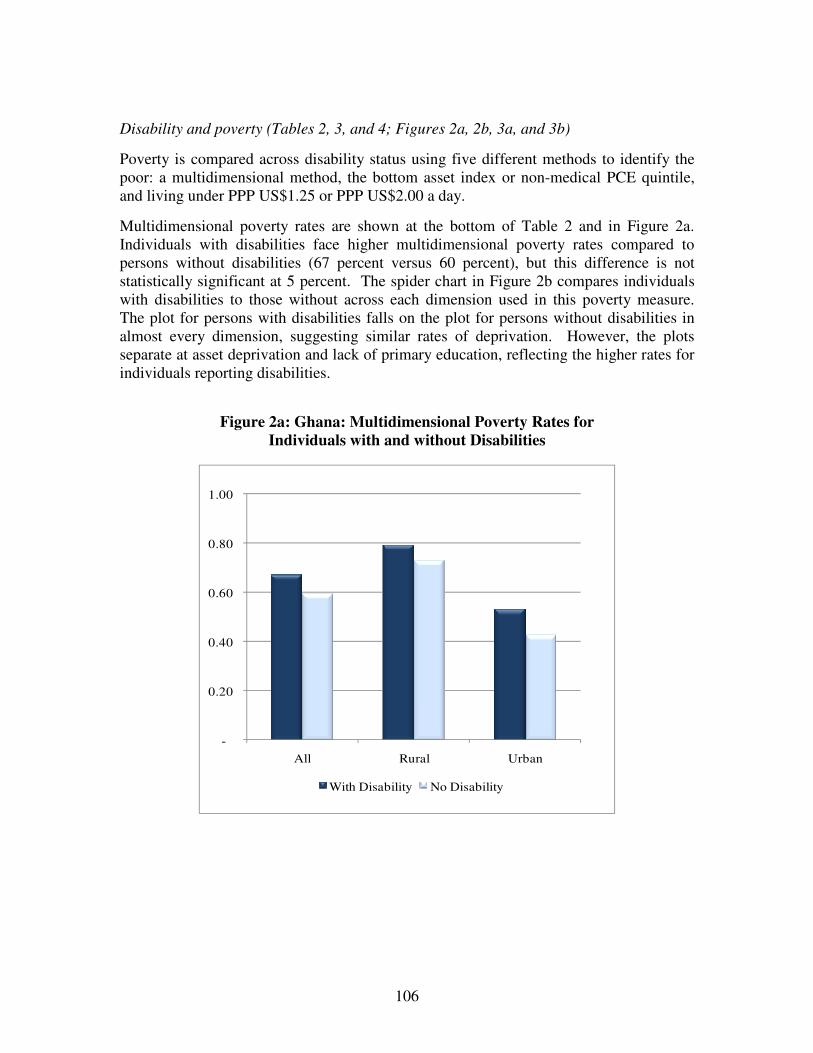
106
Disability and poverty (Tables 2, 3, and 4; Figures 2a, 2b, 3a, and 3b)
Poverty is compared across disability status using five different methods to identify the poor: a multidimensional method, the bottom asset index or non-medical PCE quintile, and living under PPP US$1.25 or PPP US$2.00 a day.
Multidimensional poverty rates are shown at the bottom of Table 2 and in Figure 2a. Individuals with disabilities face higher multidimensional poverty rates compared to persons without disabilities (67 percent versus 60 percent), but this difference is not statistically significant at 5 percent. The spider chart in Figure 2b compares individuals with disabilities to those without across each dimension used in this poverty measure. The plot for persons with disabilities falls on the plot for persons without disabilities in almost every dimension, suggesting similar rates of deprivation. However, the plots separate at asset deprivation and lack of primary education, reflecting the higher rates for individuals reporting disabilities.
Figure 2a: Ghana: Multidimensional Poverty Rates for
Individuals with and without Disabilities
-
0.20
0.40
0.60
0.80
1.00
All Rural Urban
With Disability No Disability

107
Figure 2b: Ghana: Deprivation Rates across Multiple Dimensions for Individuals with and without Disabilities
-
0.20
0.40
0.60
0.80
1.00
Individual Not Employed
Individual has less than Primary Education
PCE under $2/day
Medical Expense ratio > 10%
Household lacks electricity
Household lacks clean water source
Household lacks adequate sanitation
Household lacks a hard floor
Household cooks on wood, charcoal, or
dung
Household is Asset Deprived (see text)
With Disability No Disability
All households are ranked by their asset index score from the lowest (bottom) to the highest asset index score, and categorized by quintile (with cutoffs at the 20th, 40th, 60th, and 80th percentiles for the five quintiles). Then, the percentage of households with disabilities that are in the bottom quintile is presented and compared to the percentage of other households in the bottom quintile. For instance, if more than 20 percent of households with disabilities are in the bottom quintile, households with disabilities are overrepresented in the bottom quintile. This procedure is repeated for non-medical PCE. As shown in Table 3, households show no differences in either the bottom asset index score quintile or the bottom PCE quintile, with both groups close to the expected 20 percent.
Identifying poverty by comparing PCE to international poverty lines shows no statistically significant difference across household disability status. Approximately 49 percent of households in each group (with and without disabled members) fall below the extreme poverty threshold (US$1.25 per day) and 70 percent fall below the poverty threshold (US$2.00 per day). Figures 3a and 3b illustrate poverty comparisons across disability for the US$1.25 and US$2.00 a day poverty lines.

Figure 3a: Ghana: Poverty Rates (Percentage below PPP US$1.25 a
Household with/without a Disabled Member
Table 4 shows the disability prevalence for the poor versusthe five definitions of poverty studied above. percentage points higher for the multidimensional poor, but this difference is not statistically significant. Using the base disability measupercent of multidimensionally poor persons havenon-poor persons.
Across the other four poverty definitions used, differences in disabilitpoverty status are not statistically significant (whether measured bottom versus upper quintiles for asset index and nonfalling below or above a USusing the expanded measure of disability, we find that disability prevalence is lower for households in the bottom asset index quintile coversus 12.90 percent, p<0.05).
0.00
0.20
0.40
0.60
0.80
1.00
All Rural
With Disability No Disability
108
3a: Ghana: Poverty Rates US$1.25 a day) for
without a Disabled Member
Figure 3b: Ghana: Poverty Rates (Percentage below PPP US$2.00 a
Household with/without a Disabled Member
sability prevalence for the poor versus the non-poor, using each of the five definitions of poverty studied above. Disability prevalence is approximately two percentage points higher for the multidimensional poor, but this difference is not
significant. Using the base disability measure for the entire country, 9.37 dimensionally poor persons have a disability, compared to 6.94 percent
Across the other four poverty definitions used, differences in disability prevalence across poverty status are not statistically significant (whether measured as a comparison of the
upper quintiles for asset index and non-medical PCE, or measured as US$1.25 and US$2 a day poverty lines). Interestingly, when
using the expanded measure of disability, we find that disability prevalence is lower for households in the bottom asset index quintile compared to upper quintiles (9.03 percent
, p<0.05).
Urban
No Disability
0.00
0.20
0.40
0.60
0.80
1.00
All Rural
With Disability No Disability
3b: Ghana: Poverty Rates US$2.00 a day) for
without a Disabled Member
poor, using each of Disability prevalence is approximately two
percentage points higher for the multidimensional poor, but this difference is not re for the entire country, 9.37
a disability, compared to 6.94 percent of
y prevalence across as a comparison of the
medical PCE, or measured as Interestingly, when
using the expanded measure of disability, we find that disability prevalence is lower for mpared to upper quintiles (9.03 percent
Urban
No Disability

109
Table 4: Ghana: Prevalence of Disability among Working-Age (18-65) Population across Poverty Statusa
Poverty identification Individuals
who are multi-dimensionally
poorb
Individuals in HHs in bottom
asset index quintilec
Individuals in HHs in bottom PCE quintiled
Individuals in HHs with PCE
Below $1.25 PPP 2005
Individuals in HHs with PCE
below $2.00 PPP 2005
Poverty status Poor Non-poor Poor Non-poor Poor Non-poor Poor Non-poor Poor Non-poor
All Disability prevalence
(base)
9.37 6.94 6.75 8.65 9.18 8.18 8.57 8.22 8.76 7.32
Disability prevalence
(expanded)
13.42 11.20 9.93 12.90 * 13.30 12.32 12.06 13.11 12.42 12.93
Rural
Disability prevalence
(base)
8.81 6.49 6.66 8.95 9.30 7.74 8.43 7.76 8.22 8.10
Disability prevalence
(expanded)
13.14 9.40 9.96 13.21 13.43 11.64 12.10 12.32 12.12 12.48
Urban Disability prevalence
(base)
10.50 7.20 8.32 8.39 8.84 8.62 8.87 8.51 9.67 6.97
Disability prevalence
(expanded)
14.00 12.21 9.57 12.62 12.95 13.00 11.97 13.63 12.91 13.13
Note: a For explanations on the disability measures, see notes to Table 1. b Multidimensional variable as developed by Alkire and Foster method k=40%, as described in text. c For explanations on the calculation of the asset index, see main part of the study. d PCE refers to monthly, non-medical household per-capita expenditures. * T-Test suggests Significant Difference from "Non-poor" at 5%. HH stands for household.
Source: Authors' calculations based on WHS. All estimates are weighted and adjusted for WHS complex design.
Conclusion
In Ghana, an analysis of WHS data suggests that households with disabilities experience lower levels of economic well-being primarily through lower asset ownership and higher medical to total expenditure ratios. At the individual level, on average, persons with disabilities have fewer years of education and lower primary school completion rates, than persons without disabilities.
110
C.1.3 Disability Profile: Kenya Prevalence of disability among working-age population, 18-65 years (Table 1)
In Kenya, disability prevalence among working-age individuals stands at 5.3 percent. With the expanded measure of disability, prevalence goes up to 8.6 percent.
Prevalence rates are higher in rural than urban areas (6.9 percent versus 3.0 percent respectively). Disability prevalence for women is approximately double that of men (6.8 percent versus 3.7 percent respectively). Seeing/recognizing at arm’s length and moving around are the most commonly reported difficulties.
Demographic characteristics (Table 2)
Age, gender, and marital characteristics differ across disabilities. Persons with disabilities are 66 percent female compared to 50 percent for persons without disability (Chi-sq<0.05). The average individual with a disability is six years older than the average individual without a disability (mean age: 37 versus 31 years, p<0.05). The oldest age group (46-65 years) makes up 29 percent of working-age persons with disabilities, compared to only 13 percent for persons without disabilities (Chi-sq<0.05). Additionally, 76 percent of individuals with disabilities are married, compared to only 62 percent of others (Chi-sq<0.05). Seventy-six percent of individuals with disabilities live in rural areas compared to only 57 percent of others (Chi-sq<0.05).
Education and labor market status (Table 2)
Individuals with disabilities have lower educational attainment. While the years of education completed is just over three years for all persons, only 59 percent of persons with disabilities have completed primary school compared to 74 percent of persons without disabilities (Chi-sq<0.05).
We find a significant difference in employment outcomes based on disability status for individuals living in urban areas where 34 percent of persons with disabilities are employed compared to 66 percent of persons without (Chi-sq<0.05). Differences in employment rates are not statistically significant in rural areas. The breakdown by type of employment held amongst the employed differs across disability status. For the country as a whole, persons with disabilities rely more heavily on self-employment than individuals without disabilities (75 percent to 62 percent respectively, Chi-sq<0.05).
Household characteristics, assets, living conditions, and expenditures (Table 3)
Comparing households with a working-age adult with a disability to other households, households with disabilities are larger in size (mean size: 4.61 versus 4.03 persons respectively, p<0.05) and in the number of children (2.47 versus 1.94 children, p<0.05). The percentage of households headed by a male member is not statistically different across disability status, however.
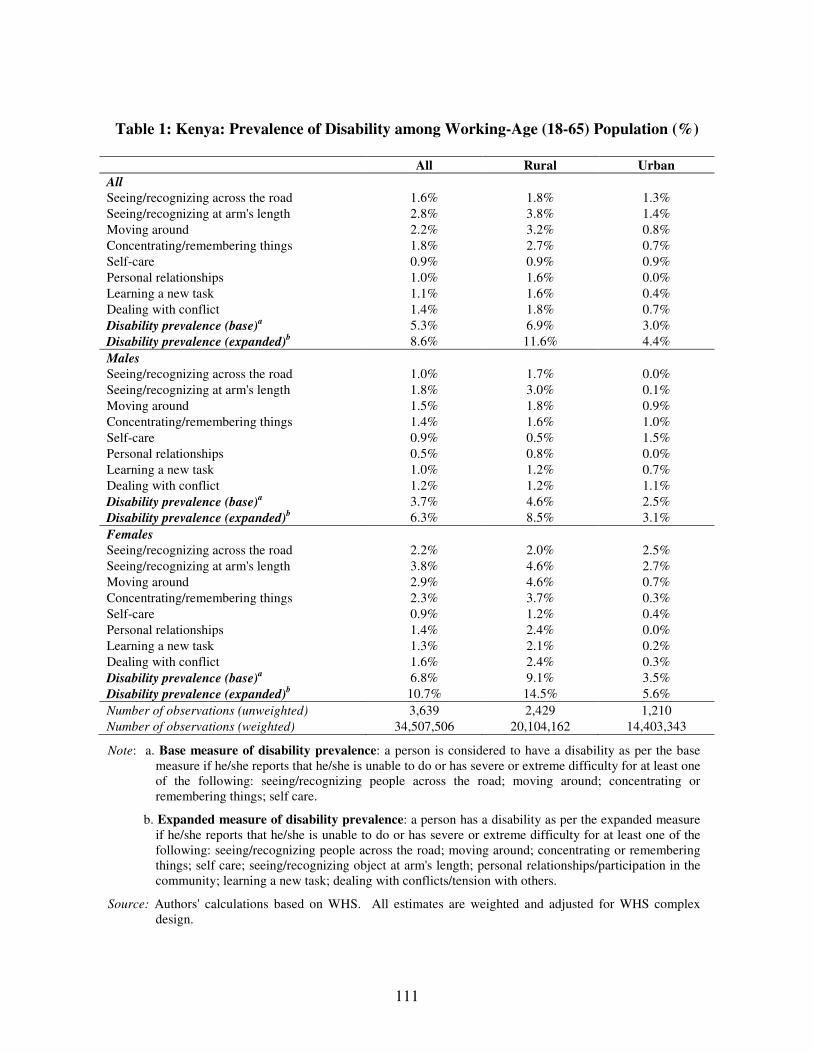
111
Table 1: Kenya: Prevalence of Disability among Working-Age (18-65) Population (%)
All Rural Urban
All Seeing/recognizing across the road 1.6% 1.8% 1.3% Seeing/recognizing at arm's length 2.8% 3.8% 1.4% Moving around 2.2% 3.2% 0.8% Concentrating/remembering things 1.8% 2.7% 0.7% Self-care 0.9% 0.9% 0.9% Personal relationships 1.0% 1.6% 0.0% Learning a new task 1.1% 1.6% 0.4% Dealing with conflict 1.4% 1.8% 0.7% Disability prevalence (base)
a 5.3% 6.9% 3.0%
Disability prevalence (expanded)b 8.6% 11.6% 4.4%
Males Seeing/recognizing across the road 1.0% 1.7% 0.0% Seeing/recognizing at arm's length 1.8% 3.0% 0.1% Moving around 1.5% 1.8% 0.9% Concentrating/remembering things 1.4% 1.6% 1.0% Self-care 0.9% 0.5% 1.5% Personal relationships 0.5% 0.8% 0.0% Learning a new task 1.0% 1.2% 0.7% Dealing with conflict 1.2% 1.2% 1.1% Disability prevalence (base)
a 3.7% 4.6% 2.5%
Disability prevalence (expanded)b 6.3% 8.5% 3.1%
Females Seeing/recognizing across the road 2.2% 2.0% 2.5% Seeing/recognizing at arm's length 3.8% 4.6% 2.7% Moving around 2.9% 4.6% 0.7% Concentrating/remembering things 2.3% 3.7% 0.3% Self-care 0.9% 1.2% 0.4% Personal relationships 1.4% 2.4% 0.0% Learning a new task 1.3% 2.1% 0.2% Dealing with conflict 1.6% 2.4% 0.3% Disability prevalence (base)
a 6.8% 9.1% 3.5%
Disability prevalence (expanded)b 10.7% 14.5% 5.6%
Number of observations (unweighted) 3,639 2,429 1,210 Number of observations (weighted) 34,507,506 20,104,162 14,403,343
Note: a. Base measure of disability prevalence: a person is considered to have a disability as per the base measure if he/she reports that he/she is unable to do or has severe or extreme difficulty for at least one of the following: seeing/recognizing people across the road; moving around; concentrating or remembering things; self care.
b. Expanded measure of disability prevalence: a person has a disability as per the expanded measure if he/she reports that he/she is unable to do or has severe or extreme difficulty for at least one of the following: seeing/recognizing people across the road; moving around; concentrating or remembering things; self care; seeing/recognizing object at arm's length; personal relationships/participation in the community; learning a new task; dealing with conflicts/tension with others.
Source: Authors' calculations based on WHS. All estimates are weighted and adjusted for WHS complex design.
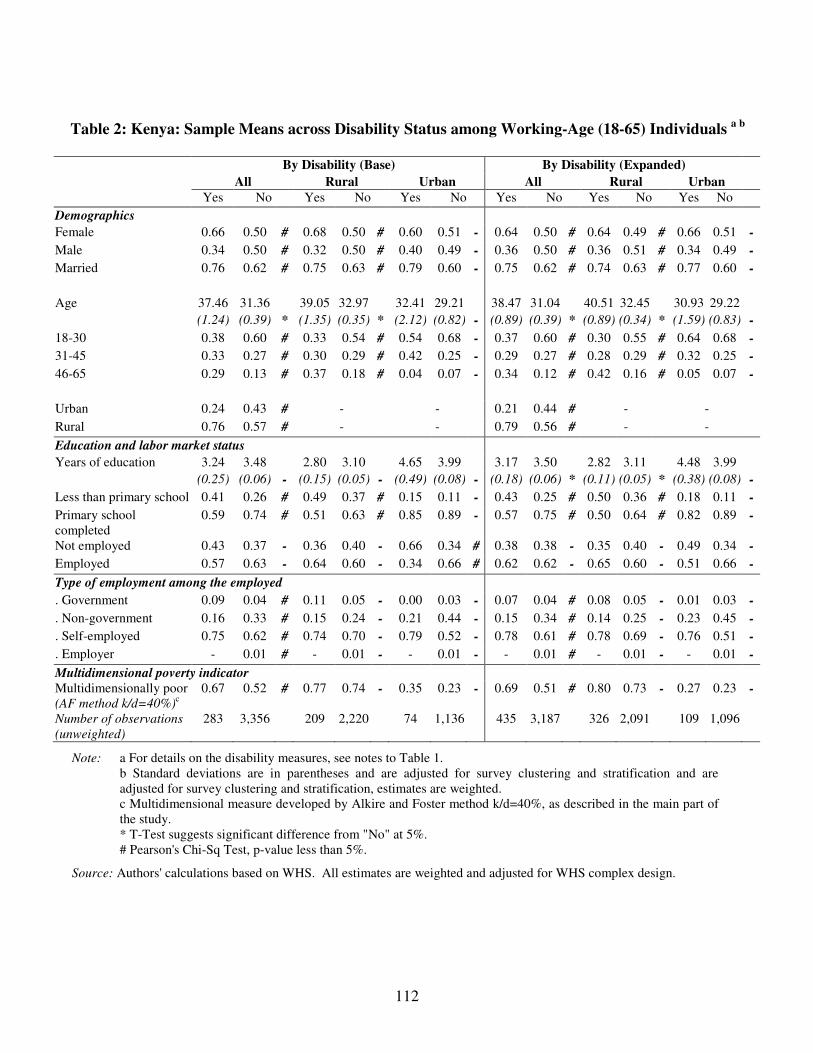
112
Table 2: Kenya: Sample Means across Disability Status among Working-Age (18-65) Individuals a b
By Disability (Base) By Disability (Expanded)
All Rural Urban All Rural Urban Yes No Yes No Yes No Yes No Yes No Yes No
Demographics
Female 0.66 0.50 # 0.68 0.50 # 0.60 0.51 - 0.64 0.50 # 0.64 0.49 # 0.66 0.51 -
Male 0.34 0.50 # 0.32 0.50 # 0.40 0.49 - 0.36 0.50 # 0.36 0.51 # 0.34 0.49 -
Married 0.76 0.62 # 0.75 0.63 # 0.79 0.60 - 0.75 0.62 # 0.74 0.63 # 0.77 0.60 -
Age 37.46 31.36 39.05 32.97 32.41 29.21 38.47 31.04 40.51 32.45 30.93 29.22
(1.24) (0.39) * (1.35) (0.35) * (2.12) (0.82) - (0.89) (0.39) * (0.89) (0.34) * (1.59) (0.83) -
18-30 0.38 0.60 # 0.33 0.54 # 0.54 0.68 - 0.37 0.60 # 0.30 0.55 # 0.64 0.68 -
31-45 0.33 0.27 # 0.30 0.29 # 0.42 0.25 - 0.29 0.27 # 0.28 0.29 # 0.32 0.25 -
46-65 0.29 0.13 # 0.37 0.18 # 0.04 0.07 - 0.34 0.12 # 0.42 0.16 # 0.05 0.07 -
Urban 0.24 0.43 # - - 0.21 0.44 # - -
Rural 0.76 0.57 # - - 0.79 0.56 # - -
Education and labor market status
Years of education 3.24 3.48 2.80 3.10 4.65 3.99 3.17 3.50 2.82 3.11 4.48 3.99
(0.25) (0.06) - (0.15) (0.05) - (0.49) (0.08) - (0.18) (0.06) * (0.11) (0.05) * (0.38) (0.08) -
Less than primary school 0.41 0.26 # 0.49 0.37 # 0.15 0.11 - 0.43 0.25 # 0.50 0.36 # 0.18 0.11 -
Primary school completed
0.59 0.74 # 0.51 0.63 # 0.85 0.89 - 0.57 0.75 # 0.50 0.64 # 0.82 0.89 -
Not employed 0.43 0.37 - 0.36 0.40 - 0.66 0.34 # 0.38 0.38 - 0.35 0.40 - 0.49 0.34 -
Employed 0.57 0.63 - 0.64 0.60 - 0.34 0.66 # 0.62 0.62 - 0.65 0.60 - 0.51 0.66 -
Type of employment among the employed
. Government 0.09 0.04 # 0.11 0.05 - 0.00 0.03 - 0.07 0.04 # 0.08 0.05 - 0.01 0.03 -
. Non-government 0.16 0.33 # 0.15 0.24 - 0.21 0.44 - 0.15 0.34 # 0.14 0.25 - 0.23 0.45 -
. Self-employed 0.75 0.62 # 0.74 0.70 - 0.79 0.52 - 0.78 0.61 # 0.78 0.69 - 0.76 0.51 -
. Employer - 0.01 # - 0.01 - - 0.01 - - 0.01 # - 0.01 - - 0.01 -
Multidimensional poverty indicator
Multidimensionally poor (AF method k/d=40%)
c 0.67 0.52 # 0.77 0.74 - 0.35 0.23 - 0.69 0.51 # 0.80 0.73 - 0.27 0.23 -
Number of observations
(unweighted)
283 3,356 209 2,220 74 1,136 435 3,187 326 2,091 109 1,096
Note: a For details on the disability measures, see notes to Table 1. b Standard deviations are in parentheses and are adjusted for survey clustering and stratification and are adjusted for survey clustering and stratification, estimates are weighted. c Multidimensional measure developed by Alkire and Foster method k/d=40%, as described in the main part of the study. * T-Test suggests significant difference from "No" at 5%. # Pearson's Chi-Sq Test, p-value less than 5%.
Source: Authors' calculations based on WHS. All estimates are weighted and adjusted for WHS complex design.
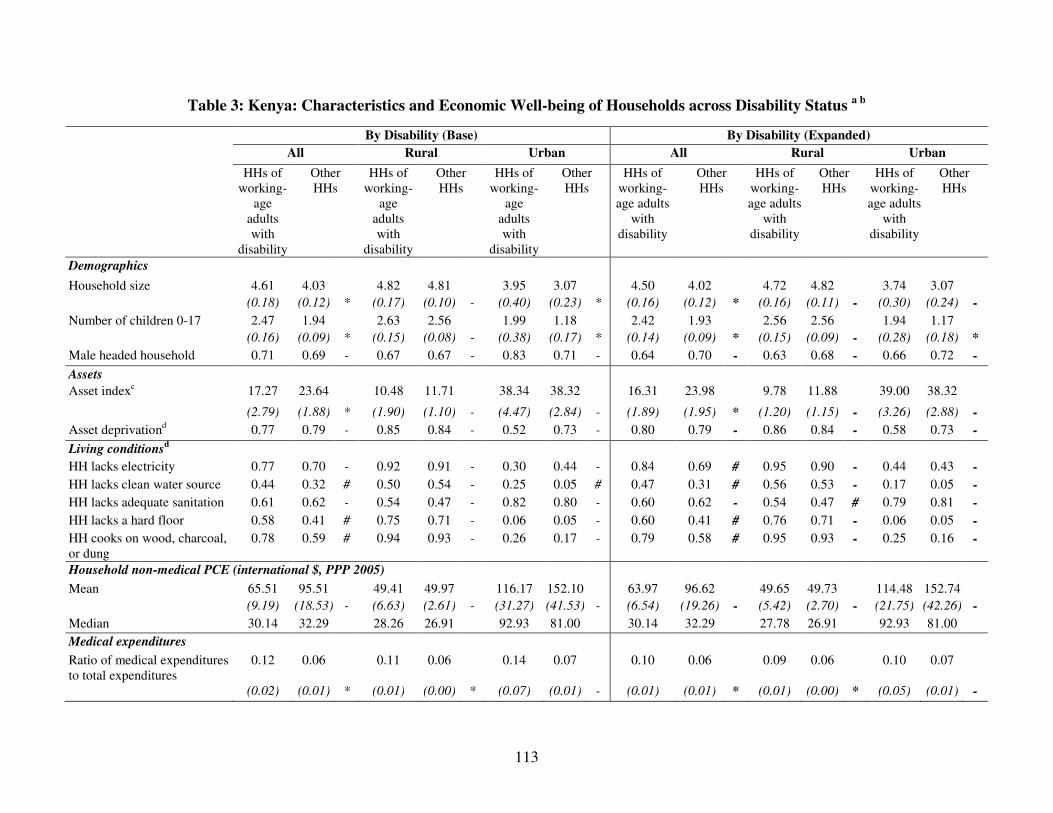
113
Table 3: Kenya: Characteristics and Economic Well-being of Households across Disability Status a b
By Disability (Base) By Disability (Expanded)
All Rural Urban All Rural Urban
HHs of working-
age adults with
disability
Other HHs
HHs of working-
age adults with
disability
Other HHs
HHs of working-
age adults with
disability
Other HHs
HHs of working-age adults
with disability
Other HHs
HHs of working-age adults
with disability
Other HHs
HHs of working-age adults
with disability
Other HHs
Demographics
Household size 4.61 4.03 4.82 4.81 3.95 3.07 4.50 4.02 4.72 4.82 3.74 3.07
(0.18) (0.12) * (0.17) (0.10) - (0.40) (0.23) * (0.16) (0.12) * (0.16) (0.11) - (0.30) (0.24) -
Number of children 0-17 2.47 1.94 2.63 2.56 1.99 1.18 2.42 1.93 2.56 2.56 1.94 1.17
(0.16) (0.09) * (0.15) (0.08) - (0.38) (0.17) * (0.14) (0.09) * (0.15) (0.09) - (0.28) (0.18) *
Male headed household 0.71 0.69 - 0.67 0.67 - 0.83 0.71 - 0.64 0.70 - 0.63 0.68 - 0.66 0.72 -
Assets
Asset indexc 17.27 23.64 10.48 11.71 38.34 38.32 16.31 23.98 9.78 11.88 39.00 38.32
(2.79) (1.88) * (1.90) (1.10) - (4.47) (2.84) - (1.89) (1.95) * (1.20) (1.15) - (3.26) (2.88) -
Asset deprivationd 0.77 0.79 - 0.85 0.84 - 0.52 0.73 - 0.80 0.79 - 0.86 0.84 - 0.58 0.73 -
Living conditionsd
HH lacks electricity 0.77 0.70 - 0.92 0.91 - 0.30 0.44 - 0.84 0.69 # 0.95 0.90 - 0.44 0.43 -
HH lacks clean water source 0.44 0.32 # 0.50 0.54 - 0.25 0.05 # 0.47 0.31 # 0.56 0.53 - 0.17 0.05 -
HH lacks adequate sanitation 0.61 0.62 - 0.54 0.47 - 0.82 0.80 - 0.60 0.62 - 0.54 0.47 # 0.79 0.81 -
HH lacks a hard floor 0.58 0.41 # 0.75 0.71 - 0.06 0.05 - 0.60 0.41 # 0.76 0.71 - 0.06 0.05 -
HH cooks on wood, charcoal, or dung
0.78 0.59 # 0.94 0.93 - 0.26 0.17 - 0.79 0.58 # 0.95 0.93 - 0.25 0.16 -
Household non-medical PCE (international $, PPP 2005)
Mean 65.51 95.51 49.41 49.97 116.17 152.10 63.97 96.62 49.65 49.73 114.48 152.74
(9.19) (18.53) - (6.63) (2.61) - (31.27) (41.53) - (6.54) (19.26) - (5.42) (2.70) - (21.75) (42.26) -
Median 30.14 32.29 28.26 26.91 92.93 81.00 30.14 32.29 27.78 26.91 92.93 81.00
Medical expenditures
Ratio of medical expenditures to total expenditures
0.12 0.06 0.11 0.06 0.14 0.07 0.10 0.06 0.09 0.06 0.10 0.07
(0.02) (0.01) * (0.01) (0.00) * (0.07) (0.01) - (0.01) (0.01) * (0.01) (0.00) * (0.05) (0.01) -

114
Table 3: Kenya: Characteristics and Economic Well-being of Households across Disability Status (Continued)
By Disability (Base) By Disability (Expanded)
All Rural Urban All Rural Urban
HHs of working-
age adults with
disability
Other HHs
HHs of working-
age adults with
disability
Other HHs
HHs of working-
age adults with
disability
Other HHs
HHs of working-age adults
with disability
Other HHs
HHs of working-age adults
with disability
Other HHs
HHs of working-age adults
with disability
Other HHs
Household poverty indicators
Bottom asset index score quintilec
0.36 0.19 # 0.47 0.35 # 0.02 0.00 # 0.34 0.19 # 0.43 0.34 # 0.01 0.00 #
Bottom PCE quintile, non-medical expenditurese
0.26 0.20 - 0.34 0.33 - 0.01 0.04 - 0.28 0.19 # 0.36 0.32 - 0.01 0.04 -
Extremely poor (PCE below $1.25 in 2005 PPP)
0.50 0.38 # 0.61 0.58 - 0.15 0.14 - 0.48 0.38 # 0.59 0.58 - 0.12 0.14 -
Poor (PCE below $2 in 2005 PPP)
0.62 0.53 - 0.74 0.74 - 0.21 0.26 - 0.62 0.52 - 0.74 0.74 - 0.18 0.26 -
Number of observations
(unweighted)
283 3,356 209 2,220 74 1,136 435 3,187 326 2,091 109 1,096
Note: a Standard deviations are in parentheses and are adjusted for survey clustering and stratification, estimates are weighted. * T-Test suggests significant difference from "None" at 5%.
# Pearson's Chi-Sq Test, p-value less than 5%. b For explanations on the disability measures, see notes to Table 1. c For explanations on the calculation of the asset index, see the main part of the study. d Explanations for calculations for asset and living condition deprivations follow. For more information, see the main part of the study. - Assets: The assets indicator considers small assets as TVs, radios, telephones (landline or mobile), refrigerators, washers, motorcycles, and big assets as cars or trucks. We require the household to have a car or any two of the other assets to be considered non-deprived. - Electricity: If household does not have electricity. - Drinking water: If water source does not meet the MDG definitions, or is more than 30-minute walk from water source. - Sanitation: If toilet facilities do not meet the MDG definitions, or the toilet is shared. - Flooring: If the floor is dirt or sand. - Cooking Fuel: If they cook with wood, charcoal, or dung. e PCE quintiles for non-medical expenditures were calculated for all working-age households. HH stands for Household.
Source: Authors' calculations based on WHS. All estimates are weighted and adjusted for WHS complex design.
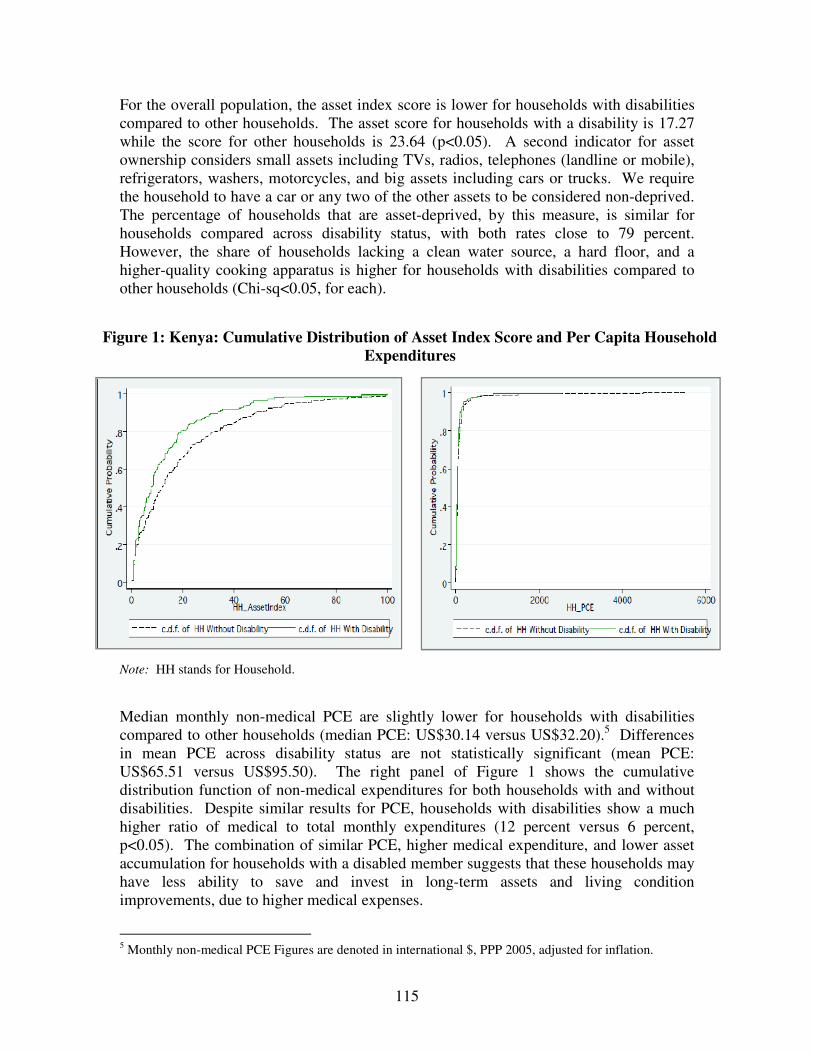
115
For the overall population, the asset index score is lower for households with disabilities compared to other households. The asset score for households with a disability is 17.27 while the score for other households is 23.64 (p<0.05). A second indicator for asset ownership considers small assets including TVs, radios, telephones (landline or mobile), refrigerators, washers, motorcycles, and big assets including cars or trucks. We require the household to have a car or any two of the other assets to be considered non-deprived. The percentage of households that are asset-deprived, by this measure, is similar for households compared across disability status, with both rates close to 79 percent. However, the share of households lacking a clean water source, a hard floor, and a higher-quality cooking apparatus is higher for households with disabilities compared to other households (Chi-sq<0.05, for each).
Figure 1: Kenya: Cumulative Distribution of Asset Index Score and Per Capita Household
Expenditures
Note: HH stands for Household.
Median monthly non-medical PCE are slightly lower for households with disabilities compared to other households (median PCE: US$30.14 versus US$32.20).5 Differences in mean PCE across disability status are not statistically significant (mean PCE: US$65.51 versus US$95.50). The right panel of Figure 1 shows the cumulative distribution function of non-medical expenditures for both households with and without disabilities. Despite similar results for PCE, households with disabilities show a much higher ratio of medical to total monthly expenditures (12 percent versus 6 percent, p<0.05). The combination of similar PCE, higher medical expenditure, and lower asset accumulation for households with a disabled member suggests that these households may have less ability to save and invest in long-term assets and living condition improvements, due to higher medical expenses.
5 Monthly non-medical PCE Figures are denoted in international $, PPP 2005, adjusted for inflation.

116
Disability and poverty (Tables 2, 3, and 4; Figures 2a, 2b, 3a, and 3b)
Poverty is compared across disability status using five different methods to identify the poor: a multidimensional method, the bottom asset index and non-medical PCE quintile, and living under US$1.25 or US$2.00 a day.
Multidimensional poverty rates are shown at the bottom of Table 2 and in Figure 2a. Individuals with disabilities face higher multidimensional poverty rates compared to persons without disabilities (67 percent versus 52 percent, Chi-sq<0.05). This result is similar across rural/urban regions and for both disability measures. The spider chart in Figure 2b compares individuals with disabilities to those without across each dimension used in this poverty measure. The plots represent deprivation rates for each dimension. The plot for persons with disabilities falls outside of the plot for persons without disabilities in almost every dimension, suggesting higher rates of deprivation.
Figure 2a: Kenya: Multidimensional Poverty Rates for Individuals with and without Disabilities
-
0.20
0.40
0.60
0.80
1.00
All Rural Urban
With Disability No Disability

117
Figure 2b: Kenya: Deprivation Rates across Multiple Dimensions for Individuals with and without Disabilities
-
0.20
0.40
0.60
0.80
1.00
Individual Not Employed
Individual has less than Primary
Education
PCE under $2/day
Medical Expense ratio > 10%
Household lacks electricity
Household lacks clean water source
Household lacks adequate sanitation
Household lacks a hard floor
Household cooks on wood,
charcoal, or dung
Household is Asset Deprived
(see text)
With Disability No Disability
All households are ranked by their asset index score from the lowest (bottom) to the highest asset index score, and categorized by quintile (with cutoffs at the 20th, 40th, 60th, and 80th percentiles for the five quintiles). Then, the percentage of households with disabilities that are in the bottom quintile is presented and compared to the percentage of other households in the bottom quintile. For instance, if more than 20 percent of households with disabilities are in the bottom quintile, households with disabilities are overrepresented in the bottom quintile. This procedure is repeated for PCE. As shown in Table 3, households with disabilities are significantly overrepresented in the bottom asset index score quintile of all households, with 36 percent of households with disabilities forming part of this group, compared to 19 percent of households without disabilities (Chi-sq<0.05). Using the expanded definition of disability, households with disabilities are also overrepresented in the bottom PCE quintile of all households, with 28 percent of households with disabilities forming part of this group, compared to 19 percent of households without disabilities (Chi-sq<0.05).
Identifying poverty by comparing non-medical PCE to international poverty lines also shows a statistically significant difference across household disability status. Approximately 50 percent of households with disabilities fall below the US$1.25 a day poverty line, compared to 38 percent of other households (Chi-sq<0.05). The difference across poverty status across disability status is not statistically significant at the US$2 a day poverty line (62 percent versus 53 percent). Figures 3a and 3b illustrate poverty comparisons across disability for the US$1.25 and US$2 a day poverty lines.
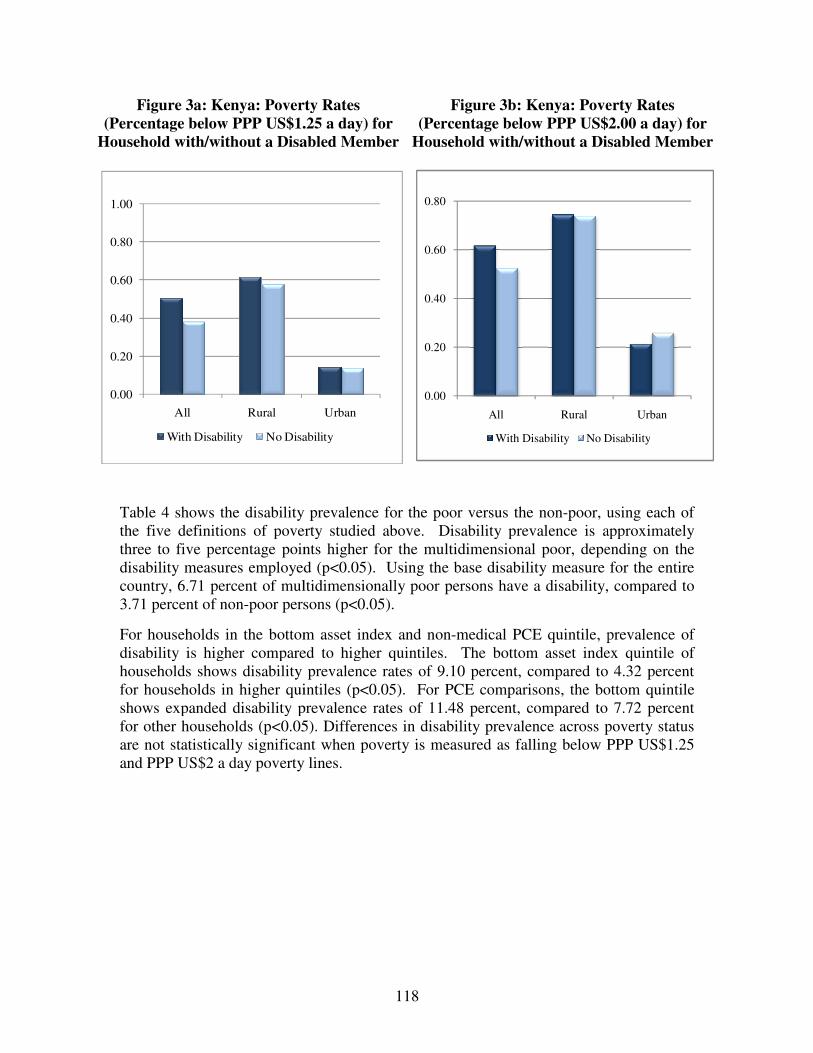
Figure 3a: Kenya: Poverty Rates (Percentage below PPP US$1.25 a
Household with/without a Disabled Member
Table 4 shows the disability prevalence for the five definitions of poverty studied above. three to five percentage points higher for the multidimensional poor, depending on thedisability measures employed (p<0.05). country, 6.71 percent of multi3.71 percent of non-poor persons (p<0.05).
For households in the bottom asset index and nondisability is higher compared to higher quintiles. households shows disability prevalence rates of 9.10 percent, compared to 4.32 percefor households in higher quintiles (p<0.05). shows expanded disability prevalence rates of 11.48for other households (p<0.05). Differences in disability prevalence across poverare not statistically significant when poverty is measured as falling below PPP and PPP US$2 a day poverty lines.
0.00
0.20
0.40
0.60
0.80
1.00
All Rural
With Disability No Disability
118
Poverty Rates US$1.25 a day) for
without a Disabled Member
Figure 3b: Kenya: Poverty Rates (Percentage below PPP US$2.00 a
Household with/without a Disabled Member
4 shows the disability prevalence for the poor versus the non-poor, using each of the five definitions of poverty studied above. Disability prevalence is approximately
percentage points higher for the multidimensional poor, depending on thedisability measures employed (p<0.05). Using the base disability measure for the entire
of multidimensionally poor persons have a disability, compared to poor persons (p<0.05).
For households in the bottom asset index and non-medical PCE quintile, prevalence of disability is higher compared to higher quintiles. The bottom asset index quintile of
bility prevalence rates of 9.10 percent, compared to 4.32 percefor households in higher quintiles (p<0.05). For PCE comparisons, the bottom quintile shows expanded disability prevalence rates of 11.48 percent, compared to 7.72for other households (p<0.05). Differences in disability prevalence across poverare not statistically significant when poverty is measured as falling below PPP
$2 a day poverty lines.
Urban
No Disability
0.00
0.20
0.40
0.60
0.80
All Rural
With Disability No Disability
3b: Kenya: Poverty Rates US$2.00 a day) for
without a Disabled Member
poor, using each of ty prevalence is approximately
percentage points higher for the multidimensional poor, depending on the Using the base disability measure for the entire
a disability, compared to
medical PCE quintile, prevalence of The bottom asset index quintile of
bility prevalence rates of 9.10 percent, compared to 4.32 percent For PCE comparisons, the bottom quintile
, compared to 7.72 percent for other households (p<0.05). Differences in disability prevalence across poverty status are not statistically significant when poverty is measured as falling below PPP US$1.25
Urban
No Disability
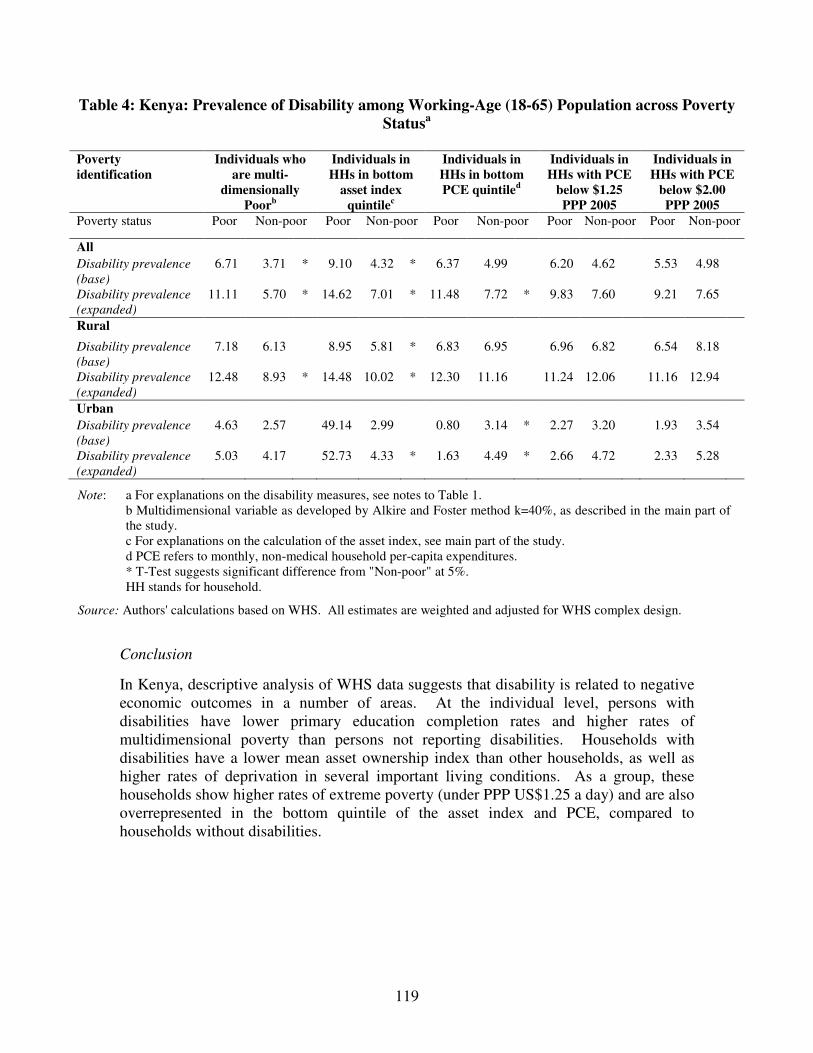
119
Table 4: Kenya: Prevalence of Disability among Working-Age (18-65) Population across Poverty Statusa
Poverty identification
Individuals who are multi-
dimensionally Poorb
Individuals in HHs in bottom
asset index quintilec
Individuals in HHs in bottom PCE quintiled
Individuals in HHs with PCE
below $1.25 PPP 2005
Individuals in HHs with PCE
below $2.00 PPP 2005
Poverty status Poor Non-poor Poor Non-poor Poor Non-poor Poor Non-poor Poor Non-poor
All Disability prevalence
(base)
6.71 3.71 * 9.10 4.32 * 6.37 4.99 6.20 4.62 5.53 4.98
Disability prevalence
(expanded)
11.11 5.70 * 14.62 7.01 * 11.48 7.72 * 9.83 7.60 9.21 7.65
Rural
Disability prevalence
(base)
7.18 6.13 8.95 5.81 * 6.83 6.95 6.96 6.82 6.54 8.18
Disability prevalence
(expanded)
12.48 8.93 * 14.48 10.02 * 12.30 11.16 11.24 12.06 11.16 12.94
Urban Disability prevalence
(base)
4.63 2.57 49.14 2.99 0.80 3.14 * 2.27 3.20 1.93 3.54
Disability prevalence
(expanded)
5.03 4.17 52.73 4.33 * 1.63 4.49 * 2.66 4.72 2.33 5.28
Note: a For explanations on the disability measures, see notes to Table 1. b Multidimensional variable as developed by Alkire and Foster method k=40%, as described in the main part of the study. c For explanations on the calculation of the asset index, see main part of the study. d PCE refers to monthly, non-medical household per-capita expenditures. * T-Test suggests significant difference from "Non-poor" at 5%. HH stands for household.
Source: Authors' calculations based on WHS. All estimates are weighted and adjusted for WHS complex design.
Conclusion
In Kenya, descriptive analysis of WHS data suggests that disability is related to negative economic outcomes in a number of areas. At the individual level, persons with disabilities have lower primary education completion rates and higher rates of multidimensional poverty than persons not reporting disabilities. Households with disabilities have a lower mean asset ownership index than other households, as well as higher rates of deprivation in several important living conditions. As a group, these households show higher rates of extreme poverty (under PPP US$1.25 a day) and are also overrepresented in the bottom quintile of the asset index and PCE, compared to households without disabilities.
120
C.1.4 Disability Profile: Malawi
Prevalence of disability among working-age population, 18-65 years (Table 1)
In Malawi, disability prevalence among working-age individuals stands at 13.0 percent. With the expanded measure of disability, the prevalence goes up to 16.8 percent.
Prevalence rates are higher in rural than urban areas (14.1 percent versus 7.5 percent respectively). Disability prevalence for women is higher than that of men (13.5 percent versus 12.4 percent respectively). When using the expanded measure of disability, prevalence rates increase by approximately four percentage points for both males and females. Difficulties in concentrating/remembering things and moving around are most commonly reported.
Demographic characteristics (Table 2)
Age characteristics differ across disability status. The average individual with a disability is four years older than the average individual without a disability (mean age: 37 versus 33 years, p<0.05). The oldest age group (46-65 years) makes up 29 percent of working-age persons with disabilities, compared to only 17 percent for persons without disabilities (Chi-sq<0.05). Differences in gender and marital status across disability are not statistically significant.
Education and labor market status (Table 2)
Individuals with disability have lower educational attainment. Persons with disabilities have 1.97 years of education on average, compared to 2.17 years for persons without disabilities (p<0.05) and lower completion rates of primary school compared to persons without disabilities (18 percent versus 28 percent, Chi-sq<0.05). It should be noted that differences in educational attainment are insignificant in urban areas, but this may be due to the relatively small sample size of persons with disabilities.
Employment rates are similar across disability status, with 51 percent of persons with disabilities employed compared to 52 percent of other persons. We do find a difference in the employment makeup of employed individuals, with a higher percentage of individuals with disabilities relying on self-employment compared to other individuals (84 percent versus 73 percent, Chi-sq<0.05).
Household characteristics, assets, living conditions, and expenditures (Table 3)
Comparing households with a working-age adult with a disability to other households, we find no significant difference in average household size, number of children, or percentage of households headed by a male member.

121
Table 1: Malawi: Prevalence of Disability among Working-Age (18-65) Population
All Rural Urban
All Seeing/recognizing across the road 3.6% 3.8% 2.5% Seeing/recognizing at arm's length 1.9% 2.0% 1.3% Moving around 5.9% 6.6% 2.4% Concentrating/remembering things 6.1% 6.6% 3.4% Self-care 2.3% 2.5% 1.6% Personal relationships 3.5% 4.1% 0.3% Learning a new task 3.4% 3.6% 2.5% Dealing with conflict 3.1% 3.2% 2.6% Disability prevalence (base)
a 13.0% 14.1% 7.5%
Disability prevalence (expanded)b 16.8% 18.2% 10.0%
Males Seeing/recognizing across the road 3.0% 3.3% 1.6% Seeing/recognizing at arm's length 1.2% 1.4% 0.5% Moving around 6.0% 6.8% 2.3% Concentrating/remembering things 5.4% 6.3% 1.3% Self-care 2.2% 2.7% 0.2% Personal relationships 3.6% 4.4% 0.2% Learning a new task 2.8% 3.2% 0.7% Dealing with conflict 2.9% 3.0% 2.3% Disability prevalence (base)
a 12.4% 14.0% 5.1%
Disability prevalence (expanded)b 16.7% 18.8% 7.3%
Females Seeing/recognizing across the road 4.2% 4.3% 3.6% Seeing/recognizing at arm's length 2.6% 2.7% 2.1% Moving around 5.7% 6.3% 2.6% Concentrating/remembering things 6.8% 6.9% 5.8% Self-care 2.5% 2.3% 3.3% Personal relationships 3.4% 3.9% 0.4% Learning a new task 4.0% 3.9% 4.8% Dealing with conflict 3.3% 3.4% 3.0% Disability prevalence (base)
a 13.5% 14.1% 10.2%
Disability prevalence (expanded)b 17.0% 17.6% 13.3%
Number of observations (unweighted) 4,401 3,683 718 Number of observations (weighted) 15,629,666 13,049,033 2,580,632
Note: a. Base measure of disability prevalence: a person is considered to have a disability as per the base measure if he/she reports that he/she is unable to do or has severe or extreme difficulty for at least one of the following: seeing/ recognizing people across the road; moving around; concentrating or remembering things; self care.
b. Expanded measure of disability prevalence: a person has a disability as per the expanded measure if he/she reports that he/she is unable to do or has severe or extreme difficulty for at least one of the following: seeing/recognizing people across the road; moving around; concentrating or remembering things; self care; seeing/recognizing object at arm's length; personal relationships/ participation in the community; learning a new task; dealing with conflicts/tension with others.
Source: Authors' calculations based on WHS. All estimates are weighted and adjusted for WHS complex design.
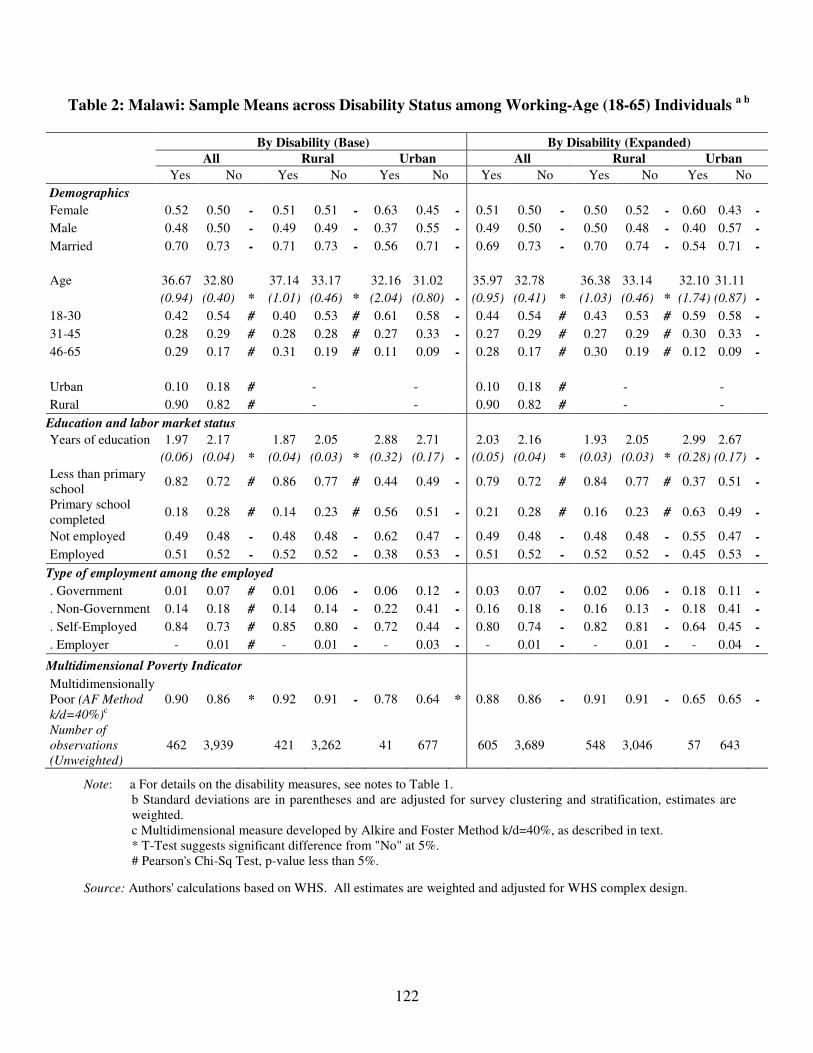
122
Table 2: Malawi: Sample Means across Disability Status among Working-Age (18-65) Individuals a b
By Disability (Base) By Disability (Expanded)
All Rural Urban All Rural Urban
Yes No Yes No Yes No Yes No Yes No Yes No
Demographics
Female 0.52 0.50 - 0.51 0.51 - 0.63 0.45 - 0.51 0.50 - 0.50 0.52 - 0.60 0.43 -
Male 0.48 0.50 - 0.49 0.49 - 0.37 0.55 - 0.49 0.50 - 0.50 0.48 - 0.40 0.57 -
Married 0.70 0.73 - 0.71 0.73 - 0.56 0.71 - 0.69 0.73 - 0.70 0.74 - 0.54 0.71 -
Age 36.67 32.80 37.14 33.17 32.16 31.02 35.97 32.78 36.38 33.14 32.10 31.11
(0.94) (0.40) * (1.01) (0.46) * (2.04) (0.80) - (0.95) (0.41) * (1.03) (0.46) * (1.74) (0.87) -
18-30 0.42 0.54 # 0.40 0.53 # 0.61 0.58 - 0.44 0.54 # 0.43 0.53 # 0.59 0.58 -
31-45 0.28 0.29 # 0.28 0.28 # 0.27 0.33 - 0.27 0.29 # 0.27 0.29 # 0.30 0.33 -
46-65 0.29 0.17 # 0.31 0.19 # 0.11 0.09 - 0.28 0.17 # 0.30 0.19 # 0.12 0.09 -
Urban 0.10 0.18 # - - 0.10 0.18 # - -
Rural 0.90 0.82 # - - 0.90 0.82 # - -
Education and labor market status
Years of education 1.97 2.17 1.87 2.05 2.88 2.71 2.03 2.16 1.93 2.05 2.99 2.67
(0.06) (0.04) * (0.04) (0.03) * (0.32) (0.17) - (0.05) (0.04) * (0.03) (0.03) * (0.28) (0.17) -
Less than primary school
0.82 0.72 # 0.86 0.77 # 0.44 0.49 - 0.79 0.72 # 0.84 0.77 # 0.37 0.51 -
Primary school completed
0.18 0.28 # 0.14 0.23 # 0.56 0.51 - 0.21 0.28 # 0.16 0.23 # 0.63 0.49 -
Not employed 0.49 0.48 - 0.48 0.48 - 0.62 0.47 - 0.49 0.48 - 0.48 0.48 - 0.55 0.47 -
Employed 0.51 0.52 - 0.52 0.52 - 0.38 0.53 - 0.51 0.52 - 0.52 0.52 - 0.45 0.53 -
Type of employment among the employed
. Government 0.01 0.07 # 0.01 0.06 - 0.06 0.12 - 0.03 0.07 - 0.02 0.06 - 0.18 0.11 -
. Non-Government 0.14 0.18 # 0.14 0.14 - 0.22 0.41 - 0.16 0.18 - 0.16 0.13 - 0.18 0.41 -
. Self-Employed 0.84 0.73 # 0.85 0.80 - 0.72 0.44 - 0.80 0.74 - 0.82 0.81 - 0.64 0.45 -
. Employer - 0.01 # - 0.01 - - 0.03 - - 0.01 - - 0.01 - - 0.04 -
Multidimensional Poverty Indicator
Multidimensionally Poor (AF Method
k/d=40%)c
0.90 0.86 * 0.92 0.91 - 0.78 0.64 * 0.88 0.86 - 0.91 0.91 - 0.65 0.65 -
Number of
observations
(Unweighted)
462 3,939 421 3,262 41 677 605 3,689 548 3,046 57 643
Note: a For details on the disability measures, see notes to Table 1. b Standard deviations are in parentheses and are adjusted for survey clustering and stratification, estimates are weighted. c Multidimensional measure developed by Alkire and Foster Method k/d=40%, as described in text. * T-Test suggests significant difference from "No" at 5%. # Pearson's Chi-Sq Test, p-value less than 5%.
Source: Authors' calculations based on WHS. All estimates are weighted and adjusted for WHS complex design.
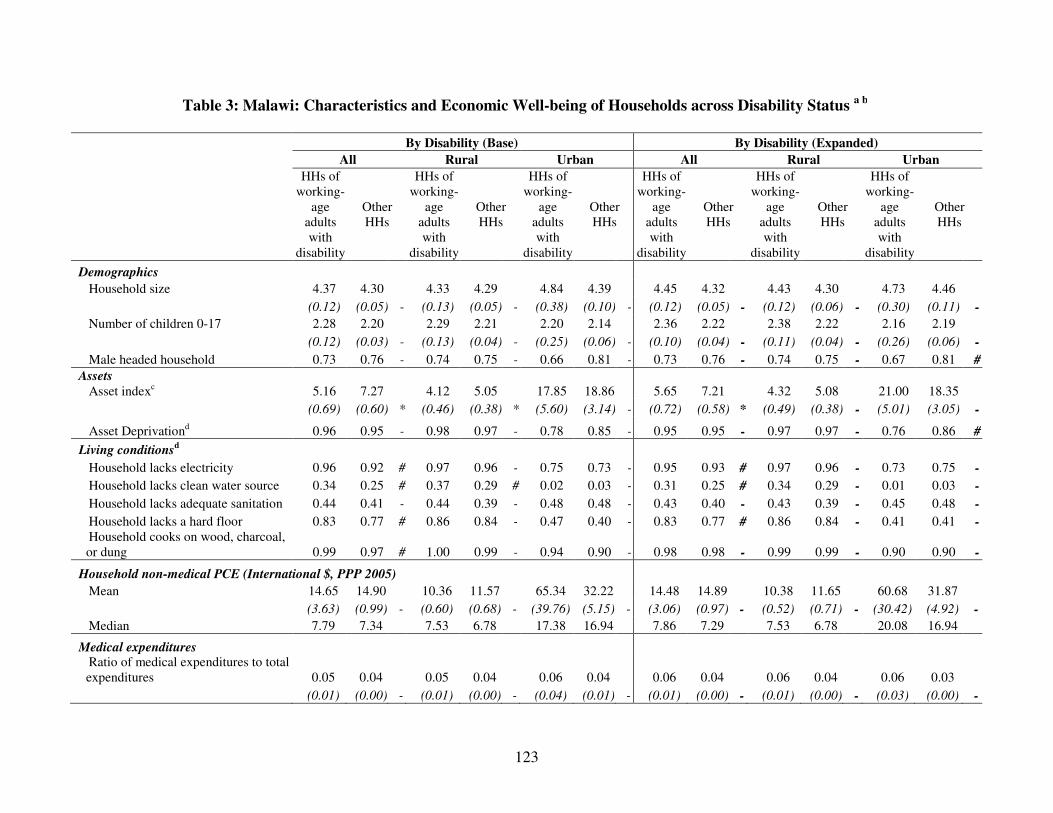
123
Table 3: Malawi: Characteristics and Economic Well-being of Households across Disability Status a b
By Disability (Base) By Disability (Expanded)
All Rural Urban All Rural Urban
HHs of working-
age adults with
disability
Other HHs
HHs of working-
age adults with
disability
Other HHs
HHs of working-
age adults with
disability
Other HHs
HHs of working-
age adults with
disability
Other HHs
HHs of working-
age adults with
disability
Other HHs
HHs of working-
age adults with
disability
Other HHs
Demographics
Household size 4.37 4.30 4.33 4.29 4.84 4.39 4.45 4.32 4.43 4.30 4.73 4.46
(0.12) (0.05) - (0.13) (0.05) - (0.38) (0.10) - (0.12) (0.05) - (0.12) (0.06) - (0.30) (0.11) -
Number of children 0-17 2.28 2.20 2.29 2.21 2.20 2.14 2.36 2.22 2.38 2.22 2.16 2.19
(0.12) (0.03) - (0.13) (0.04) - (0.25) (0.06) - (0.10) (0.04) - (0.11) (0.04) - (0.26) (0.06) -
Male headed household 0.73 0.76 - 0.74 0.75 - 0.66 0.81 - 0.73 0.76 - 0.74 0.75 - 0.67 0.81 #
Assets Asset indexc 5.16 7.27 4.12 5.05 17.85 18.86 5.65 7.21 4.32 5.08 21.00 18.35
(0.69) (0.60) * (0.46) (0.38) * (5.60) (3.14) - (0.72) (0.58) * (0.49) (0.38) - (5.01) (3.05) -
Asset Deprivationd 0.96 0.95 - 0.98 0.97 - 0.78 0.85 - 0.95 0.95 - 0.97 0.97 - 0.76 0.86 #
Living conditionsd
Household lacks electricity 0.96 0.92 # 0.97 0.96 - 0.75 0.73 - 0.95 0.93 # 0.97 0.96 - 0.73 0.75 -
Household lacks clean water source 0.34 0.25 # 0.37 0.29 # 0.02 0.03 - 0.31 0.25 # 0.34 0.29 - 0.01 0.03 -
Household lacks adequate sanitation 0.44 0.41 - 0.44 0.39 - 0.48 0.48 - 0.43 0.40 - 0.43 0.39 - 0.45 0.48 -
Household lacks a hard floor 0.83 0.77 # 0.86 0.84 - 0.47 0.40 - 0.83 0.77 # 0.86 0.84 - 0.41 0.41 -
Household cooks on wood, charcoal, or dung 0.99 0.97 # 1.00 0.99 - 0.94 0.90 - 0.98 0.98 - 0.99 0.99 - 0.90 0.90 -
Household non-medical PCE (International $, PPP 2005)
Mean 14.65 14.90 10.36 11.57 65.34 32.22 14.48 14.89 10.38 11.65 60.68 31.87
(3.63) (0.99) - (0.60) (0.68) - (39.76) (5.15) - (3.06) (0.97) - (0.52) (0.71) - (30.42) (4.92) -
Median 7.79 7.34 7.53 6.78 17.38 16.94 7.86 7.29 7.53 6.78 20.08 16.94
Medical expenditures Ratio of medical expenditures to total
expenditures 0.05 0.04 0.05 0.04 0.06 0.04 0.06 0.04 0.06 0.04 0.06 0.03
(0.01) (0.00) - (0.01) (0.00) - (0.04) (0.01) - (0.01) (0.00) - (0.01) (0.00) - (0.03) (0.00) -

124
Table 3: Malawi: Characteristics and Economic Well-being of Households across Disability Status (Continued)
By Disability (Base) By Disability (Expanded)
All Rural Urban All Rural Urban
HHs of working-
age adults with
disability
Other HHs
HHs of working-
age adults with
disability
Other HHs
HHs of working-
age adults with
disability
Other HHs
HHs of working-
age adults with
disability
Other HHs
HHs of working-
age adults with
disability
Other HHs
HHs of working-
age adults with
disability
Other HHs
Household poverty indicators
Bottom Asset Index Score quintilec 0.23 0.20 - 0.25 0.23 - 0.07 0.04 - 0.25 0.19 # 0.26 0.22 # 0.08 0.04 -
Bottom PCE quintile, non-medical expenditurese
0.23 0.20 # 0.23 0.22 - 0.22 0.07 # 0.23 0.20 - 0.24 0.22 - 0.18 0.06 #
Extremely poor (PCE below $1.25 in 2005 PPP)
0.96 0.92 # 0.97 0.96 - 0.80 0.75 - 0.95 0.92 - 0.97 0.96 - 0.69 0.76 -
Poor (PCE below $2 in 2005 PPP) 0.98 0.96 # 0.99 0.98 - 0.87 0.86 - 0.97 0.96 - 0.99 0.98 - 0.79 0.86 #
Number of observations (unweighted) 462 3,939 421 3,262 41 677 605 3,689 548 3,046 57 643
Note: a Standard deviations are in parentheses and are adjusted for survey clustering and stratification, estimates are weighted. * T-Test suggests Significant Difference from "None" at 5%
# Pearson's Chi-Sq Test, p-value less than 5% b For explanations on the disability measures, see notes to Table 1. c For explanations on the calculation of the asset index, see the main part of the study. d Explanations for calculations for asset and living condition deprivations follow. For more information, see the main part of the study. - Assets: The assets indicator considers small assets as TVs, radios, telephones (landline or mobile), refrigerators, washers, motorcycles, and big assets as cars or trucks. We require the household to have a car or any two of the other assets to be considered non-deprived. - Electricity: If household does not have electricity. - Drinking water: If water source does not meet the MDG definitions, or is more than 30 mins walk from water source. - Sanitation: If toilet facilities do not meet the MDG definitions, or the toilet is shared. - Flooring: If the floor is dirt or sand. - Cooking Fuel: If they cook with wood, charcoal, or dung. e PCE quintiles for non-medical expenditures were calculated for all working-age households. HH stands for Household.
Source: Authors' calculations based on WHS. All estimates are weighted and adjusted for WHS complex design.
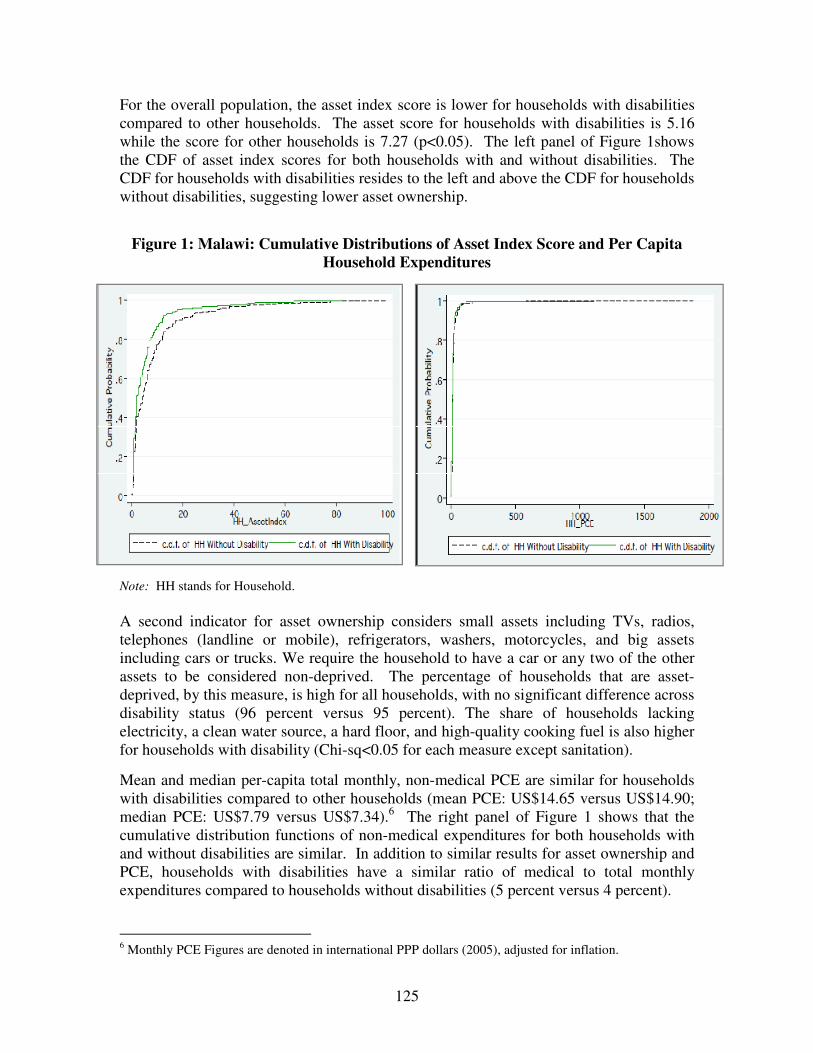
125
For the overall population, the asset index score is lower for households with disabilities compared to other households. The asset score for households with disabilities is 5.16 while the score for other households is 7.27 (p<0.05). The left panel of Figure 1shows the CDF of asset index scores for both households with and without disabilities. The CDF for households with disabilities resides to the left and above the CDF for households without disabilities, suggesting lower asset ownership.
Figure 1: Malawi: Cumulative Distributions of Asset Index Score and Per Capita
Household Expenditures
Note: HH stands for Household. A second indicator for asset ownership considers small assets including TVs, radios, telephones (landline or mobile), refrigerators, washers, motorcycles, and big assets including cars or trucks. We require the household to have a car or any two of the other assets to be considered non-deprived. The percentage of households that are asset-deprived, by this measure, is high for all households, with no significant difference across disability status (96 percent versus 95 percent). The share of households lacking electricity, a clean water source, a hard floor, and high-quality cooking fuel is also higher for households with disability (Chi-sq<0.05 for each measure except sanitation).
Mean and median per-capita total monthly, non-medical PCE are similar for households with disabilities compared to other households (mean PCE: US$14.65 versus US$14.90; median PCE: US$7.79 versus US$7.34).6 The right panel of Figure 1 shows that the cumulative distribution functions of non-medical expenditures for both households with and without disabilities are similar. In addition to similar results for asset ownership and PCE, households with disabilities have a similar ratio of medical to total monthly expenditures compared to households without disabilities (5 percent versus 4 percent).
6 Monthly PCE Figures are denoted in international PPP dollars (2005), adjusted for inflation.
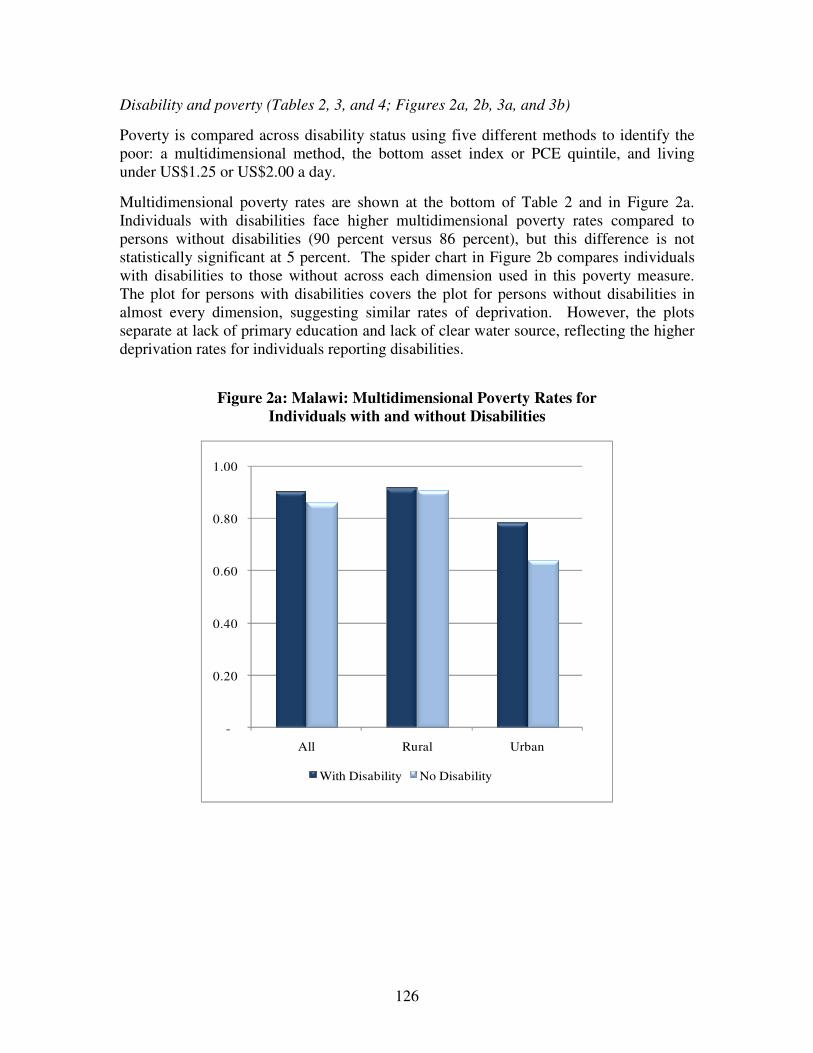
126
Disability and poverty (Tables 2, 3, and 4; Figures 2a, 2b, 3a, and 3b)
Poverty is compared across disability status using five different methods to identify the poor: a multidimensional method, the bottom asset index or PCE quintile, and living under US$1.25 or US$2.00 a day.
Multidimensional poverty rates are shown at the bottom of Table 2 and in Figure 2a. Individuals with disabilities face higher multidimensional poverty rates compared to persons without disabilities (90 percent versus 86 percent), but this difference is not statistically significant at 5 percent. The spider chart in Figure 2b compares individuals with disabilities to those without across each dimension used in this poverty measure. The plot for persons with disabilities covers the plot for persons without disabilities in almost every dimension, suggesting similar rates of deprivation. However, the plots separate at lack of primary education and lack of clear water source, reflecting the higher deprivation rates for individuals reporting disabilities.
Figure 2a: Malawi: Multidimensional Poverty Rates for
Individuals with and without Disabilities
-
0.20
0.40
0.60
0.80
1.00
All Rural Urban
With Disability No Disability
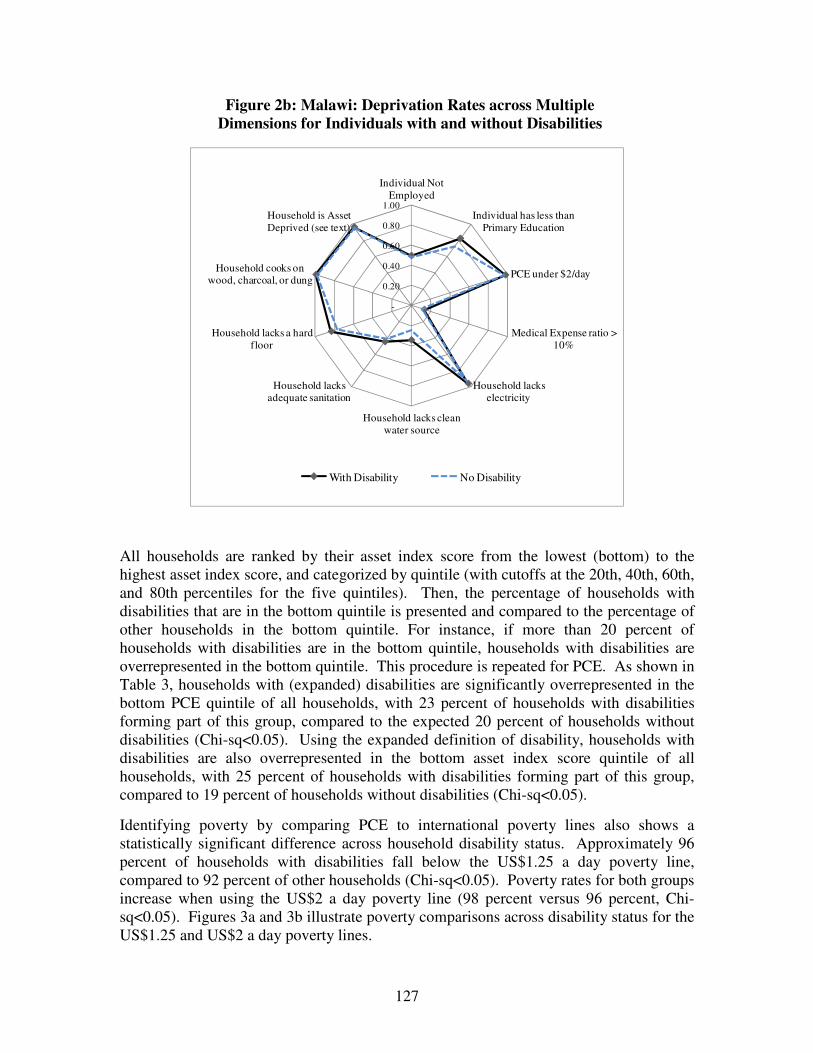
127
Figure 2b: Malawi: Deprivation Rates across Multiple Dimensions for Individuals with and without Disabilities
-
0.20
0.40
0.60
0.80
1.00
Individual Not Employed
Individual has less than Primary Education
PCE under $2/day
Medical Expense ratio > 10%
Household lacks electricity
Household lacks clean water source
Household lacks adequate sanitation
Household lacks a hard floor
Household cooks on wood, charcoal, or dung
Household is Asset Deprived (see text)
With Disability No Disability
All households are ranked by their asset index score from the lowest (bottom) to the highest asset index score, and categorized by quintile (with cutoffs at the 20th, 40th, 60th, and 80th percentiles for the five quintiles). Then, the percentage of households with disabilities that are in the bottom quintile is presented and compared to the percentage of other households in the bottom quintile. For instance, if more than 20 percent of households with disabilities are in the bottom quintile, households with disabilities are overrepresented in the bottom quintile. This procedure is repeated for PCE. As shown in Table 3, households with (expanded) disabilities are significantly overrepresented in the bottom PCE quintile of all households, with 23 percent of households with disabilities forming part of this group, compared to the expected 20 percent of households without disabilities (Chi-sq<0.05). Using the expanded definition of disability, households with disabilities are also overrepresented in the bottom asset index score quintile of all households, with 25 percent of households with disabilities forming part of this group, compared to 19 percent of households without disabilities (Chi-sq<0.05).
Identifying poverty by comparing PCE to international poverty lines also shows a statistically significant difference across household disability status. Approximately 96 percent of households with disabilities fall below the US$1.25 a day poverty line, compared to 92 percent of other households (Chi-sq<0.05). Poverty rates for both groups increase when using the US$2 a day poverty line (98 percent versus 96 percent, Chi-sq<0.05). Figures 3a and 3b illustrate poverty comparisons across disability status for the US$1.25 and US$2 a day poverty lines.

128
Figure 3a: Malawi: Poverty Rates (Percentage below PPP US$1.25 a day) for
Household with/without a Disabled Member
Figure 3b: Malawi: Poverty Rates (Percentage below PPP US$2.00 a day) for
Household with/without a Disabled Member
Table 4 shows the disability prevalence for the poor versus the non-poor, using each of the five definitions of poverty studied above. Disability prevalence is approximately four percentage points higher for the multidimensional poor than the non-poor (13.54 percent versus 9.29 percent, p<0.05).
For households in the bottom asset index quintile, prevalence of (expanded) disability is higher compared to households in the upper asset index quintiles (20.45 percent versus 15.81 percent, p<0.05). Additionally, households that fall below the US$1.25 a day poverty line show higher disability prevalence compared to households above the poverty line. For the country as a whole, 13.41 percent of households under the poverty line contain a working-age member with a disability, compared to 7.04 percent of households above the poverty line (p<0.05). Differences in disability prevalence across poverty status measured by the bottom PCE quintile and at the US$2 a day poverty line are not statistically significant.
0.00
0.20
0.40
0.60
0.80
1.00
All Rural Urban
With Disability No Disability
0.60
0.80
1.00
All Rural Urban
With Disability No Disability
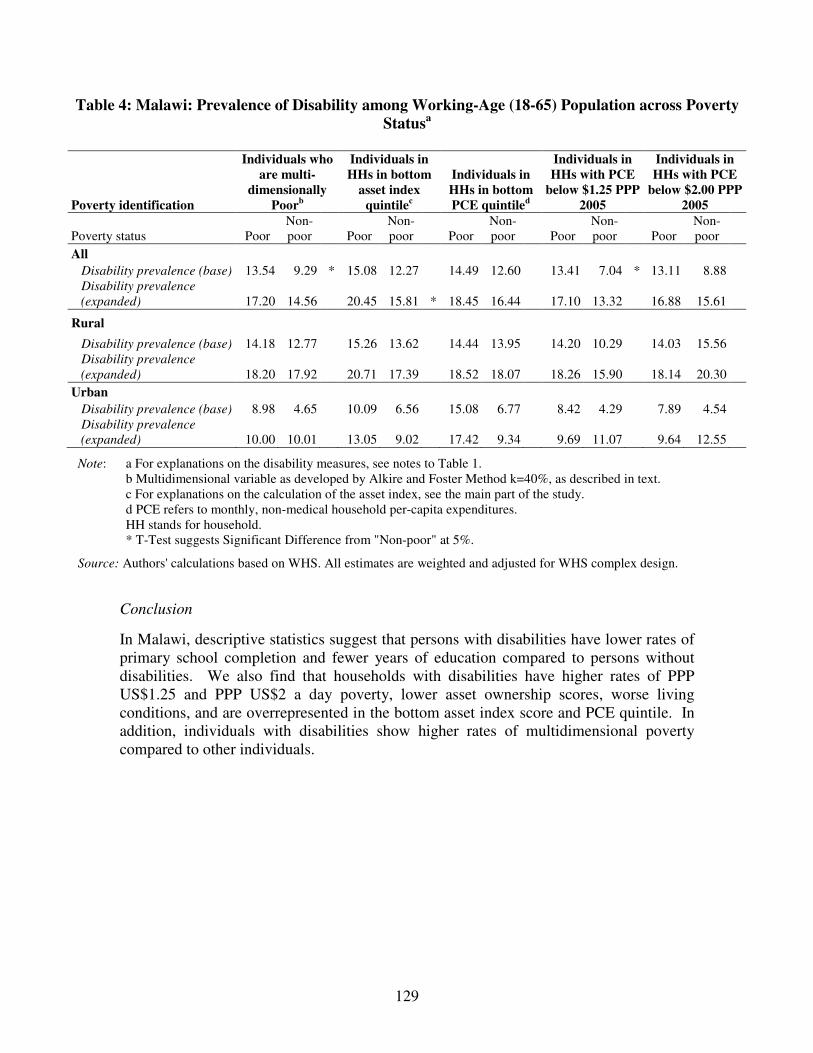
129
Table 4: Malawi: Prevalence of Disability among Working-Age (18-65) Population across Poverty Statusa
Poverty identification
Individuals who are multi-
dimensionally Poorb
Individuals in HHs in bottom
asset index quintilec
Individuals in HHs in bottom PCE quintiled
Individuals in HHs with PCE
below $1.25 PPP 2005
Individuals in HHs with PCE
below $2.00 PPP 2005
Poverty status Poor Non-poor Poor
Non-poor Poor
Non-poor Poor
Non-poor Poor
Non-poor
All Disability prevalence (base) 13.54 9.29 * 15.08 12.27 14.49 12.60 13.41 7.04 * 13.11 8.88 Disability prevalence
(expanded) 17.20 14.56 20.45 15.81 * 18.45 16.44 17.10 13.32 16.88 15.61
Rural
Disability prevalence (base) 14.18 12.77 15.26 13.62 14.44 13.95 14.20 10.29 14.03 15.56 Disability prevalence
(expanded) 18.20 17.92 20.71 17.39 18.52 18.07 18.26 15.90 18.14 20.30
Urban Disability prevalence (base) 8.98 4.65 10.09 6.56 15.08 6.77 8.42 4.29 7.89 4.54 Disability prevalence
(expanded) 10.00 10.01 13.05 9.02 17.42 9.34 9.69 11.07 9.64 12.55
Note: a For explanations on the disability measures, see notes to Table 1. b Multidimensional variable as developed by Alkire and Foster Method k=40%, as described in text. c For explanations on the calculation of the asset index, see the main part of the study. d PCE refers to monthly, non-medical household per-capita expenditures. HH stands for household. * T-Test suggests Significant Difference from "Non-poor" at 5%.
Source: Authors' calculations based on WHS. All estimates are weighted and adjusted for WHS complex design.
Conclusion
In Malawi, descriptive statistics suggest that persons with disabilities have lower rates of primary school completion and fewer years of education compared to persons without disabilities. We also find that households with disabilities have higher rates of PPP US$1.25 and PPP US$2 a day poverty, lower asset ownership scores, worse living conditions, and are overrepresented in the bottom asset index score and PCE quintile. In addition, individuals with disabilities show higher rates of multidimensional poverty compared to other individuals.
130
C.1.5 Disability Profile: Mauritius Prevalence of disability among working-age population, 18-65 years (Table 1)
In Mauritius, disability prevalence among working-age individuals stands at 11.4 percent. With the expanded measure of disability, prevalence goes up to 14.3 percent.
Prevalence rates are higher in rural than in urban areas (12.3 percent versus 10.1 percent respectively), as are rates for women compared to men (13.9 percent versus 9.0 percent respectively). When using the expanded measure of disability, prevalence rates increase by two to three percentage points for both males and females. This jump in rates is due to the relatively high rates of reported difficulty in learning a new task, which is a component of the expanded definition of disability. Only difficulties in concentrating/remembering things are reported at higher rates than learning a new task.
Demographic characteristics (Table 2)
Age and gender characteristics differ across disability status. Persons with disabilities are 60 percent female, while persons without disabilities are only 48 percent female. The average individual with a disability is seven years older than the average individual without a disability (mean age: 44 versus 37 years, p<0.05). The oldest age group (46-65 years) makes up 48 percent of working-age persons with disabilities, compared to only 25 percent for persons without disabilities.
Education and labor market status (Table 2)
Individuals with disabilities have statistically significant lower educational attainment and employment. Persons with disabilities have approximately 0.69 less years of education (2.78 versus 3.47 years, p<0.05) and lower completion rates of primary school compared to persons without disabilities (67 percent versus 87 percent, Chi-sq<0.05).
Forty-two percent of persons with disabilities are employed, compared to 66 percent of persons without disabilities (Chi-sq<0.05). Differences in the type of work that employed individuals do are not statistically significant across disability status.
Household characteristics, assets, living conditions, and expenditures (Table 3)
Comparing households with a working-age adult with a disability to other households, we find no significant difference in average household size or number of children. However, a lower percentage of households with disabilities are headed by a male member (79 percent versus 88 percent for other households, Chi-sq<0.05).
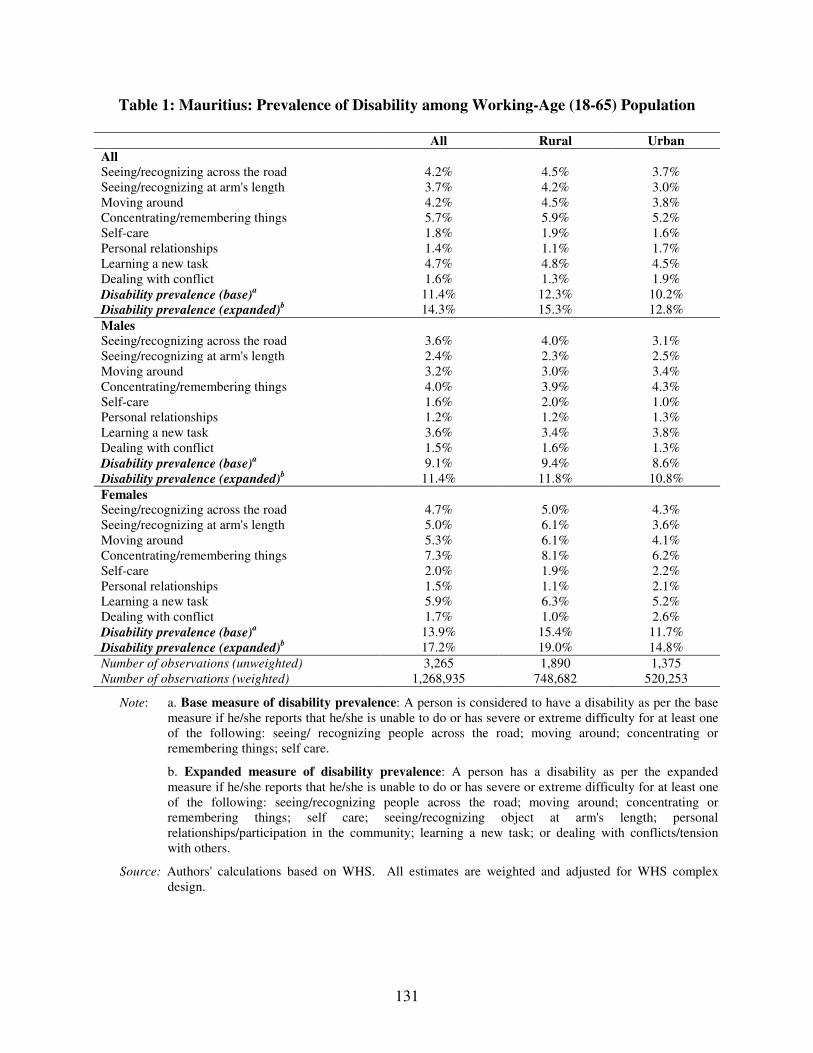
131
Table 1: Mauritius: Prevalence of Disability among Working-Age (18-65) Population
All Rural Urban
All Seeing/recognizing across the road 4.2% 4.5% 3.7% Seeing/recognizing at arm's length 3.7% 4.2% 3.0% Moving around 4.2% 4.5% 3.8% Concentrating/remembering things 5.7% 5.9% 5.2% Self-care 1.8% 1.9% 1.6% Personal relationships 1.4% 1.1% 1.7% Learning a new task 4.7% 4.8% 4.5% Dealing with conflict 1.6% 1.3% 1.9% Disability prevalence (base)
a 11.4% 12.3% 10.2%
Disability prevalence (expanded)b 14.3% 15.3% 12.8%
Males Seeing/recognizing across the road 3.6% 4.0% 3.1% Seeing/recognizing at arm's length 2.4% 2.3% 2.5% Moving around 3.2% 3.0% 3.4% Concentrating/remembering things 4.0% 3.9% 4.3% Self-care 1.6% 2.0% 1.0% Personal relationships 1.2% 1.2% 1.3% Learning a new task 3.6% 3.4% 3.8% Dealing with conflict 1.5% 1.6% 1.3% Disability prevalence (base)
a 9.1% 9.4% 8.6%
Disability prevalence (expanded)b 11.4% 11.8% 10.8%
Females Seeing/recognizing across the road 4.7% 5.0% 4.3% Seeing/recognizing at arm's length 5.0% 6.1% 3.6% Moving around 5.3% 6.1% 4.1% Concentrating/remembering things 7.3% 8.1% 6.2% Self-care 2.0% 1.9% 2.2% Personal relationships 1.5% 1.1% 2.1% Learning a new task 5.9% 6.3% 5.2% Dealing with conflict 1.7% 1.0% 2.6% Disability prevalence (base)
a 13.9% 15.4% 11.7%
Disability prevalence (expanded)b 17.2% 19.0% 14.8%
Number of observations (unweighted) 3,265 1,890 1,375 Number of observations (weighted) 1,268,935 748,682 520,253
Note: a. Base measure of disability prevalence: A person is considered to have a disability as per the base measure if he/she reports that he/she is unable to do or has severe or extreme difficulty for at least one of the following: seeing/ recognizing people across the road; moving around; concentrating or remembering things; self care.
b. Expanded measure of disability prevalence: A person has a disability as per the expanded measure if he/she reports that he/she is unable to do or has severe or extreme difficulty for at least one of the following: seeing/recognizing people across the road; moving around; concentrating or remembering things; self care; seeing/recognizing object at arm's length; personal relationships/participation in the community; learning a new task; or dealing with conflicts/tension with others.
Source: Authors' calculations based on WHS. All estimates are weighted and adjusted for WHS complex design.
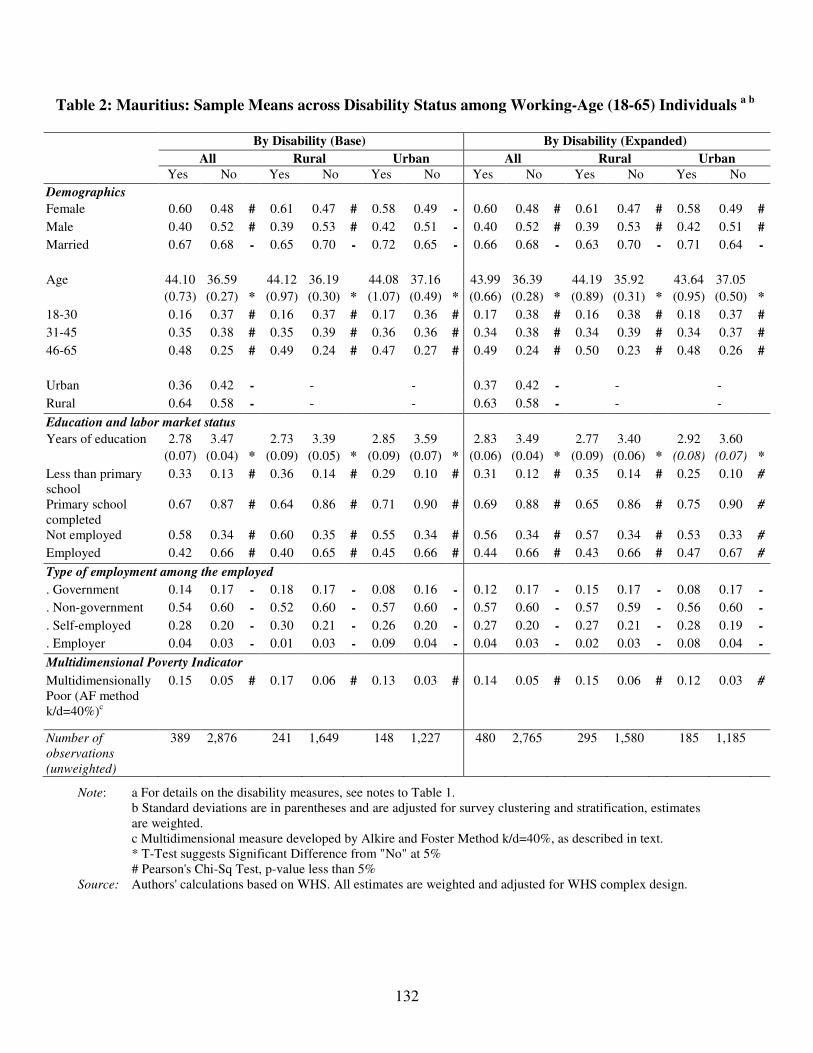
132
Table 2: Mauritius: Sample Means across Disability Status among Working-Age (18-65) Individuals a b
By Disability (Base) By Disability (Expanded)
All Rural Urban All Rural Urban Yes No Yes No Yes No Yes No Yes No Yes No
Demographics
Female 0.60 0.48 # 0.61 0.47 # 0.58 0.49 - 0.60 0.48 # 0.61 0.47 # 0.58 0.49 #
Male 0.40 0.52 # 0.39 0.53 # 0.42 0.51 - 0.40 0.52 # 0.39 0.53 # 0.42 0.51 #
Married 0.67 0.68 - 0.65 0.70 - 0.72 0.65 - 0.66 0.68 - 0.63 0.70 - 0.71 0.64 -
Age 44.10 36.59 44.12 36.19 44.08 37.16 43.99 36.39 44.19 35.92 43.64 37.05
(0.73) (0.27) * (0.97) (0.30) * (1.07) (0.49) * (0.66) (0.28) * (0.89) (0.31) * (0.95) (0.50) *
18-30 0.16 0.37 # 0.16 0.37 # 0.17 0.36 # 0.17 0.38 # 0.16 0.38 # 0.18 0.37 #
31-45 0.35 0.38 # 0.35 0.39 # 0.36 0.36 # 0.34 0.38 # 0.34 0.39 # 0.34 0.37 #
46-65 0.48 0.25 # 0.49 0.24 # 0.47 0.27 # 0.49 0.24 # 0.50 0.23 # 0.48 0.26 #
Urban 0.36 0.42 - - - 0.37 0.42 - - -
Rural 0.64 0.58 - - - 0.63 0.58 - - -
Education and labor market status
Years of education 2.78 3.47 2.73 3.39 2.85 3.59 2.83 3.49 2.77 3.40 2.92 3.60
(0.07) (0.04) * (0.09) (0.05) * (0.09) (0.07) * (0.06) (0.04) * (0.09) (0.06) * (0.08) (0.07) *
Less than primary school
0.33 0.13 # 0.36 0.14 # 0.29 0.10 # 0.31 0.12 # 0.35 0.14 # 0.25 0.10 #
Primary school completed
0.67 0.87 # 0.64 0.86 # 0.71 0.90 # 0.69 0.88 # 0.65 0.86 # 0.75 0.90 #
Not employed 0.58 0.34 # 0.60 0.35 # 0.55 0.34 # 0.56 0.34 # 0.57 0.34 # 0.53 0.33 #
Employed 0.42 0.66 # 0.40 0.65 # 0.45 0.66 # 0.44 0.66 # 0.43 0.66 # 0.47 0.67 #
Type of employment among the employed
. Government 0.14 0.17 - 0.18 0.17 - 0.08 0.16 - 0.12 0.17 - 0.15 0.17 - 0.08 0.17 -
. Non-government 0.54 0.60 - 0.52 0.60 - 0.57 0.60 - 0.57 0.60 - 0.57 0.59 - 0.56 0.60 -
. Self-employed 0.28 0.20 - 0.30 0.21 - 0.26 0.20 - 0.27 0.20 - 0.27 0.21 - 0.28 0.19 -
. Employer 0.04 0.03 - 0.01 0.03 - 0.09 0.04 - 0.04 0.03 - 0.02 0.03 - 0.08 0.04 -
Multidimensional Poverty Indicator
Multidimensionally Poor (AF method k/d=40%)c
0.15 0.05 # 0.17 0.06 # 0.13 0.03 # 0.14 0.05 # 0.15 0.06 # 0.12 0.03 #
Number of
observations
(unweighted)
389 2,876 241 1,649 148 1,227 480 2,765 295 1,580 185 1,185
Note: a For details on the disability measures, see notes to Table 1. b Standard deviations are in parentheses and are adjusted for survey clustering and stratification, estimates are weighted. c Multidimensional measure developed by Alkire and Foster Method k/d=40%, as described in text.
* T-Test suggests Significant Difference from "No" at 5% # Pearson's Chi-Sq Test, p-value less than 5% Source: Authors' calculations based on WHS. All estimates are weighted and adjusted for WHS complex design.

133
Table 3: Mauritius: Characteristics and Economic Well-being of Households across Disability Status a b
By Disability (base) By Disability (Expanded)
All Rural Urban All Rural Urban
HHs of working-
age adults with
disability
Other HHs
HHs of working-
age adults with
disability
Other HHs
HHs of working-
age adults with
disability
Other HHs
HHs of working-
age adults with
disability
Other HHs
HHs of working-
age adults with
disability
Other HHs
HHs of working-
age adults with
disability
Other HHs
Demographics
Household size 3.71 3.86 3.71 3.94 3.70 3.76 3.70 3.88 3.73 3.95 3.65 3.77
(0.09) (0.04) - (0.12) (0.05) * (0.14) (0.05) - (0.08) (0.04) * (0.11) (0.05) - (0.12) (0.05) -
Number of children 0-17 1.09 1.20 1.04 1.26 1.17 1.11 1.06 1.21 1.02 1.27 1.11 1.12
(0.06) (0.02) - (0.07) (0.03) * (0.11) (0.04) - (0.05) (0.03) * (0.07) (0.03) * (0.08) (0.04) -
Male headed household 0.79 0.88 # 0.77 0.90 # 0.82 0.86 - 0.81 0.88 # 0.79 0.90 # 0.83 0.86 -
Assets
Asset index c 75.21 79.54 74.62 77.87 76.25 81.89 75.91 79.54 75.48 77.77 76.65 82.01
(0.97) (0.65) * (1.24) (0.87) * (1.49) (0.92) * (0.87) (0.67) * (1.13) (0.89) - (1.34) (0.91) *
Asset Deprivation d 0.07 0.03 # 0.07 0.04 # 0.05 0.02 # 0.06 0.04 # 0.06 0.04 - 0.05 0.02 #
Living conditions d
Household lacks DVD/VCR 0.41 0.33 # 0.43 0.35 # 0.39 0.31 - 0.39 0.33 # 0.40 0.35 - 0.37 0.31 -
Household lacks clean water source 0.00 0.00 - 0.00 0.00 - 0.00 0.00 - 0.00 0.00 - 0.00 0.00 - 0.00 0.00 - Household lacks adequate
sanitation 0.08 0.05 # 0.07 0.06 - 0.11 0.04 # 0.09 0.05 # 0.08 0.06 - 0.10 0.04 #
Household lacks a hard floor 0.00 0.00 # 0.00 0.00 # 0.00 0.00 - 0.00 0.00 # 0.00 0.00 # 0.00 0.00 - Household cooks on wood,
charcoal, or dung 0.02 0.01 - 0.03 0.02 - 0.01 0.00 # 0.02 0.01 - 0.03 0.02 - 0.01 0.00 #
Household non-medical PCE (International $, PPP 2005)
Mean 127.65 145.80 121.59 132.49 137.78 164.33 130.56 144.10 123.60 129.20 141.87 164.71
(5.42) (5.95) * (7.25) (8.18) - (7.60) (8.11) * (4.97) (5.83) * (6.70) (7.79) - (6.83) (8.22) *
Median 109.62 110.32 102.70 103.30 119.82 123.95 113.11 108.46 103.81 103.30 121.48 123.95
Medical Expenditures Ratio of medical expenditures to
total expenditures 0.10 0.07 0.09 0.06 0.11 0.07 0.09 0.07 0.09 0.06 0.10 0.07
(0.01) (0.00) * (0.01) (0.00) * (0.01) (0.00) * (0.01) (0.00) * (0.01) (0.00) * (0.01) (0.01) *

134
Table 3: Mauritius: Characteristics and Economic Well-being of Households across Disability Status (Continued)
By Disability (base) By Disability (Expanded)
All Rural Urban All Rural Urban
HHs of working-
age adults with
disability
Other HHs
HHs of working-
age adults with
disability
Other HHs
HHs of working-
age adults with
disability
Other HHs
HHs of working-
age adults with
disability
Other HHs
HHs of working-
age adults with
disability
Other HHs
HHs of working-
age adults with
disability
Other HHs
Household Poverty Indicators
Bottom asset index score quintile c 0.28 0.19 # 0.31 0.22 # 0.23 0.14 # 0.27 0.19 # 0.29 0.22 # 0.24 0.14 #
Bottom PCE quintile, non-medical expenditures e 0.23 0.20 - 0.27 0.23 - 0.16 0.14 - 0.22 0.20 - 0.26 0.24 - 0.16 0.14 -
Extremely poor (PCE below $1.25 in 2005 PPP) 0.02 0.01 - 0.02 0.01 - 0.01 0.01 - 0.02 0.01 - 0.02 0.01 - 0.01 0.01 -
Poor (PCE below $2 in 2005 PPP) 0.08 0.06 - 0.10 0.08 - 0.03 0.03 - 0.07 0.06 - 0.10 0.08 - 0.03 0.03 -
Number of observations (unweighted) 389 2,876 241 1,649 148 1,227 480 2,765 295 1,580 185 1,185
Note: a Standard deviations are in parentheses and are adjusted for survey clustering and stratification, estimates are weighted. * T-Test suggests significant difference from "None" at 5%.
# Pearson's Chi-Sq Test, p-value less than 5%. b For explanations on the disability measures, see notes to Table 1. c For explanations on the calculation of the asset index, see the main part of the study. d Explanations for calculations for asset and living condition deprivations follow. For more information, see the main part of the study. - Assets: The assets indicator considers small assets as TVs, radios, telephones (landline or mobile), refrigerators, washers, motorcycles, and
big assets as cars or trucks. We require the household to have a car or any two of the other assets to be considered non-deprived. - Electricity: If household does not have electricity. - Drinking water: If water source does not meet the MDG definitions, or is more than 30-minute walk from water source. - Sanitation: If toilet facilities do not meet the MDG definitions, or the toilet is shared. - Flooring: If the floor is dirt or sand. - Cooking Fuel: If they cook with wood, charcoal, or dung. e PCE quintiles for non-medical expenditures were calculated for all working-age households. HH stands for Household.
Source: Authors' calculations based on WHS. All estimates are weighted and adjusted for WHS complex design.

135
For the overall population, as well as in rural and urban areas separately, asset index scores are lower for households with a disabled member compared to other households. The overall asset score for households with a disabled member is 75.21, while the score for other households is 79.54 (p<0.05). The left panel of Figure 1shows the CDF of asset index scores for both households with and without disabilities. The CDFs for the two groups are relatively close but the CDF for households with disabilities resides to the left and above the CDF for households without disabilities, suggesting lower asset ownership levels for households with disabilities.
A second indicator for asset ownership considers small assets including TVs, radios, telephones (landline or mobile), refrigerators, washers, motorcycles, and big assets including cars or trucks. We require the household to have a car or any two of the other assets to be considered non-deprived. The percentage of households that are asset-deprived, by this measure, is higher for households with disability compared to other households (7 percent versus 3 percent, Chi-sq<0.05). The share of households lacking DVD/VCR,7 a clean water source, and adequate sanitation is also higher for households with disabilities (Chi-sq<0.05).
Figure 1: Mauritius: Cumulative Distribution of Asset Index Score and Per Capita
Household Expenditures
Note: HH stands for household.
Median total monthly, non-medical PCE are similar across households (median PCE: US$109.62 versus US$110.32).8 However, mean PCE is lower for households with disabilities compared to other households (mean PCE: US$127.65 versus US$145.80,
7 Unlike most countries under study, Mauritius WHS data does not have data on electricity in the household. Instead, we assess whether the household has a DVD/VCR. 8 Monthly PCE Figures are denoted in international $, PPP 2005, adjusted for inflation.

136
p<0.05). We find a higher ratio of medical to total expenditures across disability status (10 percent versus 7 percent, p<0.05). The right panel of Figure 1shows the CDF of PCE for both households with and without disabilities. The combination of lower PCE, higher medical expenditure, and lower asset accumulation for households with a disabled member suggests that these households may have less ability to save and invest in long-term assets and living condition improvements, partially due to higher medical expenses.
Disability and poverty (Tables 2, 3, and 4; Figures 2a, 2b, 3a, and 3b)
Poverty is compared across disability status using five different methods to identify the poor: a multidimensional method, the bottom asset index or PCE quintile, and living under US$1.25 or US$2.00 a day.
Multidimensional poverty rates are shown at the bottom of Table 2 and in Figure 2a. Individuals with disabilities face higher multidimensional poverty rates compared to persons without disabilities (15 percent versus 5 percent, Chi-sq<0.05). This result holds across rural/urban regions and for both disability measures. The spider chart in Figure 2b compares individuals with disability to those without for each dimension used in this poverty measure. The plots represent deprivation rates for each dimension. The plot for persons with disability falls outside of the plot for persons without disability in about half of the measured dimensions, suggesting higher rates of deprivation in these areas.
Figure 2a: Mauritius: Multidimensional Poverty Rates
for Individuals with and without Disabilities
-
0.20
0.40
0.60
0.80
1.00
All Rural Urban
With Disability No Disability
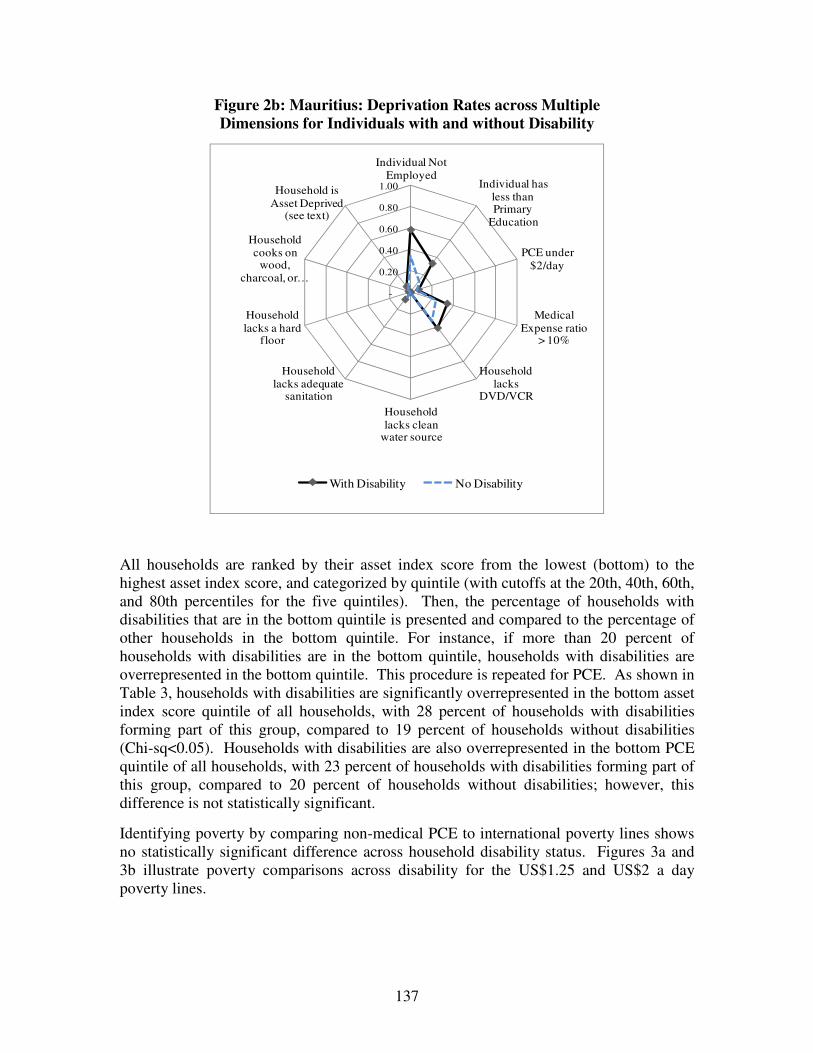
137
Figure 2b: Mauritius: Deprivation Rates across Multiple Dimensions for Individuals with and without Disability
-
0.20
0.40
0.60
0.80
1.00
Individual Not Employed
Individual has less than Primary
Education
PCE under $2/day
Medical Expense ratio
> 10%
Household lacks
DVD/VCR
Household lacks clean
water source
Household lacks adequate
sanitation
Household lacks a hard
floor
Household cooks on
wood, charcoal, or …
Household is Asset Deprived
(see text)
With Disability No Disability
All households are ranked by their asset index score from the lowest (bottom) to the highest asset index score, and categorized by quintile (with cutoffs at the 20th, 40th, 60th, and 80th percentiles for the five quintiles). Then, the percentage of households with disabilities that are in the bottom quintile is presented and compared to the percentage of other households in the bottom quintile. For instance, if more than 20 percent of households with disabilities are in the bottom quintile, households with disabilities are overrepresented in the bottom quintile. This procedure is repeated for PCE. As shown in Table 3, households with disabilities are significantly overrepresented in the bottom asset index score quintile of all households, with 28 percent of households with disabilities forming part of this group, compared to 19 percent of households without disabilities (Chi-sq<0.05). Households with disabilities are also overrepresented in the bottom PCE quintile of all households, with 23 percent of households with disabilities forming part of this group, compared to 20 percent of households without disabilities; however, this difference is not statistically significant.
Identifying poverty by comparing non-medical PCE to international poverty lines shows no statistically significant difference across household disability status. Figures 3a and 3b illustrate poverty comparisons across disability for the US$1.25 and US$2 a day poverty lines.

138
Figure 3a: Mauritius: Poverty Rates (Percentage below PPP US$1.25 a day) for
Household with/without a Disabled Member
Figure 3b: Mauritius: Poverty Rates (Percentage below PPP US$2.00 a day) for
Household with/without a Disabled Member
0.00
0.20
All Rural Urban
With Disability No Disability
0.00
0.20
All Rural Urban
With Disability No Disability
Table 4 shows the disability prevalence for poor vs. non-poor, using each of the five definitions of poverty studied above. Disability prevalence is about 20 percentage points higher for the multidimensional poor, compared to the non-poor (p<0.05). Using the base disability measure for the entire country, 29.54 percent of multidimensionally poor persons have a disability, compared to 10.30 percent of non-poor persons (p<0.05).
For households in the bottom asset index quintile, prevalence of disability is higher compared to higher quintiles. The bottom asset index quintile of households shows disability prevalence rates of 16.32 percent, compared to 10.58 percent for households in higher quintiles (p<0.05).
Across the other three poverty definitions used, differences in disability prevalence across poverty status are not statistically significant (whether measured as a comparison of the bottom versus upper quintiles for non-medical PCE, or measured as falling below or above a US$1.25 and US$2 a day poverty line).

139
Table 4: Mauritius: Prevalence of Disability among Working-Age (18-65) Population across Poverty Statusa
Poverty identification Individuals who
are multidimensionally
Poorb
Individuals in HHs in bottom
asset index quintilec
Individuals in HHs in bottom PCE quintiled
Individuals in HHs with PCE below US$1.25
PPP 2005
Individuals in HHs with PCE below US$2.00
PPP 2005
Poverty status Poor Non-poor
Poor Non-poor
Poor Non-poor
Poor Non-poor
Poor Non-poor
All Disability prevalence (base) 29.54 10.30 * 16.32 10.58 * 13.42 10.85 14.78 11.39 13.76 11.24 Disability prevalence
(expanded)
33.90 13.08 * 19.64 13.42 * 16.02 13.81 18.03 14.27 17.39 14.07
Rural
Disability prevalence (base) 28.27 11.06 * 16.44 11.67 * 14.87 11.39 16.78 12.25 16.17 11.91
Disability prevalence
(expanded)
32.57 13.99 * 19.19 14.79 17.58 14.53 20.86 15.26 19.77 14.88
Urban Disability prevalence (base) 32.89 9.23 * 16.02 9.12 * 10.10 10.17 6.84 10.17 5.64 10.35 Disability prevalence
(expanded)
37.44 11.82 * 20.67 11.59 * 12.44 12.90 6.84 12.86 9.35 12.97
Note: a For explanations on the disability measures, see notes to Table 1. b Multidimensional variable as developed by Alkire and Foster method k=40%, as described in text. c For explanations on the calculation of the asset index, see the main part of the study. d PCE refers to monthly, non-medical household PCE. * T-Test suggests significant difference from "non-poor" at 5%. HH stands for household.
Source: Authors' calculations based on WHS. All estimates are weighted and adjust for WHS complex design.
Conclusion
In Mauritius, results from the descriptive analysis of WHS data suggest that disability is associated with lower levels of economic well being for most household- and individual-level indicators used in this study. At the individual level, this is shown by lower average schooling outcomes, lower rates of employment among working-age persons with disabilities, and higher rates of multidimensional poverty. Households with disabilities also have, on average, worse living conditions, fewer assets, and are more likely to be in the bottom quintile of asset index score. Additionally, households with disabilities have lower mean PCE and higher ratio of medical to non-medical expenditures than other households.

140
C.1.6 Disability Profile: Zambia Prevalence of disability among working-age population, 18-65 years (Table 1)
In Zambia, disability prevalence among working-age individuals stands at 5.8 percent. With the expanded measure of disability, prevalence goes up to 9.0 percent.
Disability prevalence is higher in rural than urban areas (6.6 percent versus 4.3 percent respectively) and the rate for women is double that of men (7.5 percent versus 4.0 percent respectively). When using the expanded measure of disability, prevalence rates increase by two to four percentage points for both males and females. This jump in rates is due to the relatively higher rates of reported difficulty in dealing with conflict, which is a component of the expanded definition of disability.
Demographic characteristics (Table 2)
Age and gender differ significantly across disability. Persons with disabilities are 66 percent female compared to 50 percent for persons without disabilities. The average individual with a disability is six years older than the average individual without a disability (39 versus 33 years, p<0.05). The oldest age group (46-65 years) makes up 41 percent of working-age persons with disabilities, compared to only 18 percent for persons without disabilities (Chi-sq<0.05).
Education and labor market status (Table 2)
Individuals with disabilities have lower educational attainment. Years of education completed are 2.36 for persons with disabilities, compared to 2.66 for persons without disabilities (p<0.05). In addition, only 43 percent of persons with disabilities have completed primary school compared to 57 percent of persons without disabilities (Chi-sq<0.05). It should be noted though that, in urban areas, educational attainment is similar across disability status.
Analyzing employment outcomes across disability status, we find no significant difference for employment rates. The breakdown by type of employment held amongst the employed differs across disability status. For the country as a whole, persons with disabilities rely more heavily on self-employment than individuals with no disabilities (90 percent to 82 percent respectively, Chi-sq<0.05).
Household characteristics, assets, living conditions, and expenditures (Table 3)
Comparing households with a working-age adult with a disability to other households, we find a significant difference in average household size (4.94 versus 5.48 respectively, p<0.05) but not in the number of children. A lower percentage of households with disabilities are headed by a male member (69 percent versus 79 percent, Chi-sq<0.05).

141
Table 1: Zambia: Prevalence of Disability among Working-Age (18-65) Population
All Rural Urban
All Seeing/recognizing across the road 2.2% 2.5% 1.5% Seeing/recognizing at arm's length 1.8% 1.9% 1.4% Moving around 2.7% 3.2% 1.9% Concentrating/remembering things 2.4% 2.9% 1.5% Self-care 0.9% 1.1% 0.4% Personal relationships 1.8% 1.9% 1.5% Learning a new task 1.3% 1.7% 0.5% Dealing with conflict 2.8% 2.8% 2.6% Disability prevalence (base)
a 5.8% 6.6% 4.3%
Disability prevalence (expanded)b 9.0% 9.9% 7.5%
Males Seeing/recognizing across the road 1.5% 1.7% 1.1% Seeing/recognizing at arm's length 1.4% 1.4% 1.3% Moving around 1.9% 2.3% 1.1% Concentrating/remembering things 1.8% 1.9% 1.5% Self-care 0.8% 1.1% 0.2% Personal relationships 1.1% 1.5% 0.5% Learning a new task 0.8% 1.0% 0.5% Dealing with conflict 1.7% 2.1% 1.0% Disability prevalence (base)
a 4.0% 4.6% 2.8%
Disability prevalence (expanded)b 6.3% 7.6% 4.0%
Females Seeing/recognizing across the road 2.8% 3.2% 2.0% Seeing/recognizing at arm's length 2.1% 2.4% 1.6% Moving around 3.6% 4.0% 2.8% Concentrating/remembering things 3.0% 3.9% 1.5% Self-care 0.9% 1.1% 0.7% Personal relationships 2.4% 2.3% 2.5% Learning a new task 1.7% 2.4% 0.6% Dealing with conflict 3.8% 3.5% 4.2% Disability prevalence (base)
a 7.5% 8.4% 5.8%
Disability prevalence (expanded)b 11.6% 12.0% 10.9%
Number of observations (unweighted) 2,974 1,821 1,153 Number of observations (weighted) 9,598,719 6,225,274 3,373,445
Note: a. Base measure of disability prevalence: a person is considered to have a disability as per the base measure if he/she reports that he/she is unable to do or has severe or extreme difficulty for at least one of the following: seeing/recognizing people across the road; moving around; concentrating or remembering things; self care.
b. Expanded measure of disability prevalence: a person has a disability as per the expanded measure if he/she reports that he/she is unable to do or has severe or extreme difficulty for at least one of the following: seeing/recognizing people across the road; moving around; concentrating or remembering things; self care; seeing/recognizing object at arm's length; personal relationships/participation in the community; learning a new task; dealing with conflicts/tension with others.
Source: Authors' calculations based on WHS. All estimates are weighted and adjusted for WHS complex design.

142
Table 2: Zambia: Sample Means across Disability Status among Working-Age (18-65) Individuals a b
By disability (base) By disability (expanded)
All Rural Urban All Rural Urban
Yes No Yes No Yes No Yes No Yes No Yes No
Demographics
Female 0.66 0.50 # 0.66 0.50 # 0.68 0.50 # 0.66 0.50 # 0.63 0.50 # 0.74 0.49 #
Male 0.34 0.50 # 0.34 0.50 # 0.32 0.50 # 0.34 0.50 # 0.37 0.50 # 0.26 0.51 #
Married 0.66 0.59 - 0.65 0.62 - 0.68 0.55 - 0.62 0.60 - 0.63 0.62 - 0.60 0.55 -
Age 39.06 32.66 40.60 33.44 34.71 31.26 37.80 32.60 38.80 33.42 35.33 31.11
(1.55) (0.32) * (1.99) (0.42) * (1.40) (0.56) * (1.19) (0.32) * (1.53) (0.39) * (1.30) (0.66) *
18-30 0.37 0.55 # 0.34 0.53 # 0.47 0.58 # 0.43 0.54 # 0.42 0.52 # 0.46 0.58 #
31-45 0.22 0.27 # 0.20 0.27 # 0.27 0.28 # 0.20 0.28 # 0.18 0.27 # 0.27 0.29 #
46-65 0.41 0.18 # 0.46 0.20 # 0.26 0.14 # 0.36 0.18 # 0.40 0.20 # 0.27 0.13 #
Urban 0.26 0.36 - - - 0.29 0.36 - - -
Rural 0.74 0.64 - - - 0.71 0.64 - - -
Education and labor market status
Years of education 2.36 2.65 2.15 2.39 2.96 3.11 2.43 2.65 2.23 2.39 2.92 3.12
(0.09) (0.06) * (0.10) (0.05) * (0.13) (0.06) - (0.08) (0.06) * (0.09) (0.05) - (0.10) (0.06) -
Less than primary school 0.57 0.43 # 0.68 0.54 # 0.26 0.25 - 0.56 0.43 # 0.65 0.54 # 0.32 0.24 -
Primary school completed 0.43 0.57 # 0.32 0.46 # 0.74 0.75 - 0.44 0.57 # 0.35 0.46 # 0.68 0.76 -
Not employed 0.40 0.40 - 0.34 0.34 - 0.56 0.52 - 0.39 0.40 - 0.34 0.34 - 0.51 0.52 -
Employed 0.60 0.60 - 0.66 0.66 - 0.44 0.48 - 0.61 0.60 - 0.66 0.66 - 0.49 0.48 -
Type of employment among the employed
Government 0.03 0.04 # 0.02 0.03 - 0.08 0.07 - 0.04 0.04 - 0.03 0.03 - 0.08 0.07 -
Non-government 0.06 0.12 # 0.01 0.05 - 0.30 0.29 - 0.08 0.13 - 0.04 0.05 - 0.21 0.30 -
Self-employed 0.90 0.82 # 0.97 0.91 - 0.60 0.60 - 0.88 0.82 - 0.93 0.91 - 0.69 0.59 -
Employer 0.00 0.01 # - 0.01 - 0.02 0.03 - 0.00 0.02 - - 0.01 - 0.01 0.03 -
Multidimensional Poverty Indicator
Multidimensionally poor (AF method
k/d=40%)c 0.81 0.73 # 0.91 0.87 - 0.52 0.47 - 0.80 0.73 # 0.91 0.87 - 0.53 0.47 -
Number of
observations
(unweighted) 179 2,795 122 1,699 57 1,096 279 2,669 186 1,623 93 1,046
Note: a For details on the disability measures, see notes to Table 1. b Standard deviations are in parentheses and are adjusted for survey clustering and stratification, estimates are weighted. c Multidimensional measure developed by Alkire and Foster Method k/d=40%, as described in text.
* T-Test suggests Significant Difference from "No" at 5%. # Pearson's Chi-Sq Test, p-value less than 5%.
Source: Authors' calculations based on WHS. All estimates are weighted and adjusted for WHS complex design.
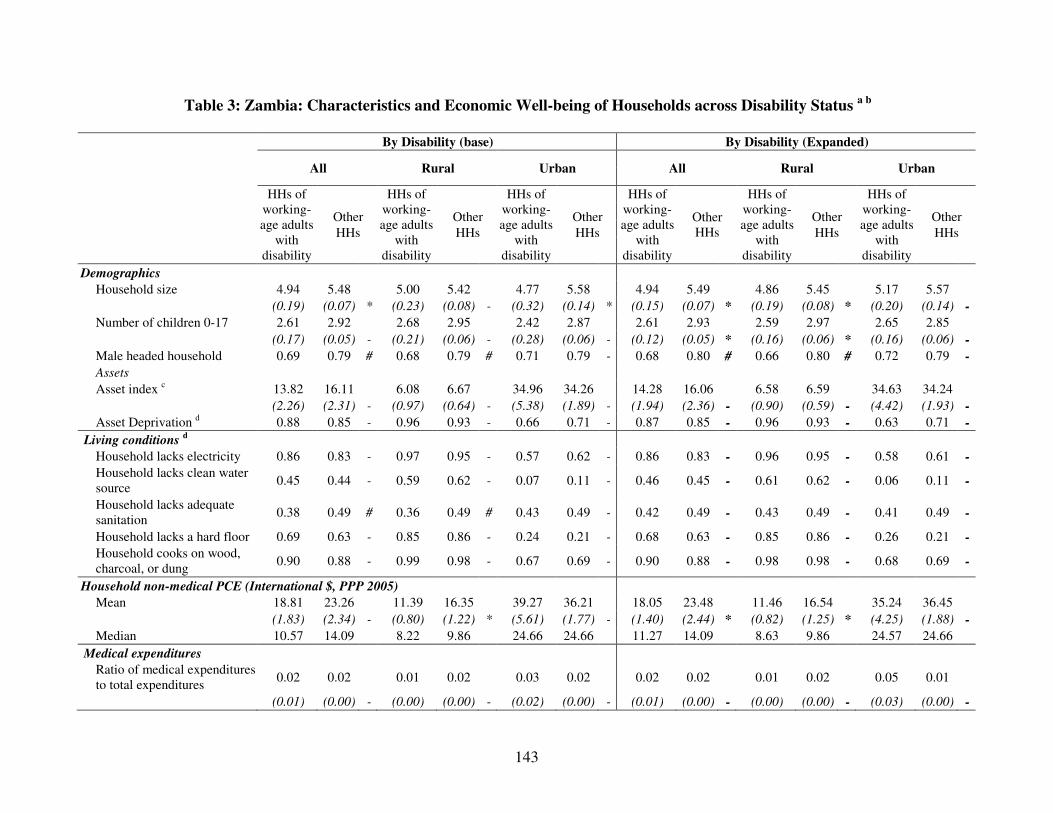
143
Table 3: Zambia: Characteristics and Economic Well-being of Households across Disability Status a b
By Disability (base) By Disability (Expanded)
All Rural Urban All Rural Urban
HHs of working-age adults
with disability
Other HHs
HHs of working-age adults
with disability
Other HHs
HHs of working-age adults
with disability
Other HHs
HHs of working-age adults
with disability
Other HHs
HHs of working-age adults
with disability
Other HHs
HHs of working-age adults
with disability
Other HHs
Demographics
Household size 4.94 5.48 5.00 5.42 4.77 5.58 4.94 5.49 4.86 5.45 5.17 5.57
(0.19) (0.07) * (0.23) (0.08) - (0.32) (0.14) * (0.15) (0.07) * (0.19) (0.08) * (0.20) (0.14) -
Number of children 0-17 2.61 2.92 2.68 2.95 2.42 2.87 2.61 2.93 2.59 2.97 2.65 2.85
(0.17) (0.05) - (0.21) (0.06) - (0.28) (0.06) - (0.12) (0.05) * (0.16) (0.06) * (0.16) (0.06) -
Male headed household 0.69 0.79 # 0.68 0.79 # 0.71 0.79 - 0.68 0.80 # 0.66 0.80 # 0.72 0.79 -
Assets
Asset index c 13.82 16.11 6.08 6.67 34.96 34.26 14.28 16.06 6.58 6.59 34.63 34.24
(2.26) (2.31) - (0.97) (0.64) - (5.38) (1.89) - (1.94) (2.36) - (0.90) (0.59) - (4.42) (1.93) -
Asset Deprivation d 0.88 0.85 - 0.96 0.93 - 0.66 0.71 - 0.87 0.85 - 0.96 0.93 - 0.63 0.71 -
Living conditions d
Household lacks electricity 0.86 0.83 - 0.97 0.95 - 0.57 0.62 - 0.86 0.83 - 0.96 0.95 - 0.58 0.61 -
Household lacks clean water source
0.45 0.44 - 0.59 0.62 - 0.07 0.11 - 0.46 0.45 - 0.61 0.62 - 0.06 0.11 -
Household lacks adequate sanitation
0.38 0.49 # 0.36 0.49 # 0.43 0.49 - 0.42 0.49 - 0.43 0.49 - 0.41 0.49 -
Household lacks a hard floor 0.69 0.63 - 0.85 0.86 - 0.24 0.21 - 0.68 0.63 - 0.85 0.86 - 0.26 0.21 -
Household cooks on wood, charcoal, or dung
0.90 0.88 - 0.99 0.98 - 0.67 0.69 - 0.90 0.88 - 0.98 0.98 - 0.68 0.69 -
Household non-medical PCE (International $, PPP 2005)
Mean 18.81 23.26 11.39 16.35 39.27 36.21 18.05 23.48 11.46 16.54 35.24 36.45
(1.83) (2.34) - (0.80) (1.22) * (5.61) (1.77) - (1.40) (2.44) * (0.82) (1.25) * (4.25) (1.88) -
Median 10.57 14.09 8.22 9.86 24.66 24.66 11.27 14.09 8.63 9.86 24.57 24.66
Medical expenditures
Ratio of medical expenditures to total expenditures
0.02 0.02 0.01 0.02 0.03 0.02 0.02 0.02 0.01 0.02 0.05 0.01
(0.01) (0.00) - (0.00) (0.00) - (0.02) (0.00) - (0.01) (0.00) - (0.00) (0.00) - (0.03) (0.00) -

144
Table 3: Zambia: Characteristics and Economic Well-being of Households across Disability Status (Continued)
By Disability (base) By Disability (Expanded)
All Rural Urban All Rural Urban
HHs of working-age adults
with disability
Other HHs
HHs of working-age adults
with disability
Other HHs
HHs of working-age adults
with disability
Other HHs
HHs of working-age adults
with disability
Other HHs
HHs of working-age adults
with disability
Other HHs
HHs of working-age adults
with disability
Other HHs
Household poverty indicators
Bottom asset index score quintile c
0.18 0.20 - 0.24 0.30 - 0.01 0.02 - 0.21 0.20 - 0.28 0.30 - 0.01 0.02 -
Bottom PCE quintile, non-medical expenditures e
0.26 0.20 - 0.34 0.27 - 0.05 0.06 - 0.26 0.19 - 0.33 0.27 - 0.09 0.05 -
Extremely poor (PCE below $1.25 in 2005 PPP)
0.86 0.84 - 0.95 0.92 - 0.62 0.69 - 0.88 0.84 # 0.96 0.92 - 0.68 0.69 -
Poor (PCE below $2 in 2005 PPP)
0.95 0.93 - 1.00 0.97 - 0.81 0.86 - 0.95 0.93 - 1.00 0.97 - 0.83 0.86 -
Number of observations
(unweighted) 179 2,795 122 1,699 57 1,096 279 2,669 186 1,623 93 1,046
Note: a Standard deviations are in parentheses and are adjusted for survey clustering and stratification, estimates are weighted. * T-Test suggests significant difference from "None" at 5%.
# Pearson's Chi-Sq Test, p-value less than 5%. b For explanations on the disability measures, see notes to Table 1. c For explanations on the calculation of the asset index, see the main part of the study. d Explanations for calculations for asset and living condition deprivations follow. For more information, see the main part of the study. - Assets: The assets indicator considers small assets as TVs, radios, telephones (landline or mobile), refrigerators, washers, motorcycles, and big assets as cars or trucks. We require the household to have a car or any two of the other assets to be considered non-deprived. - Electricity: If household does not have electricity. - Drinking water: If water source does not meet the MDG definitions, or is more than 30-minute walk from water source. - Sanitation: If toilet facilities do not meet the MDG definitions, or the toilet is shared. - Flooring: If the floor is dirt or sand. - Cooking Fuel: If they cook with wood, charcoal, or dung. e PCE quintiles for non-medical expenditures were calculated for all working-age households. HH stands for Household.
Source: Authors' calculations based on WHS. All estimates are weighted and adjusted for WHS complex design.

145
For the overall population, as well as for rural and urban subpopulations, the asset index score is similar for households with disabilities compared to other households. The left panel of Figure 1shows the CDF of the asset index scores for both households with and without disabilities. The CDFs for the two groups are relatively close, but the CDF for households with disabilities resides to the left and above the CDF for households without disabilities, suggesting lower asset ownership levels for households with disabilities.
Figure 1: Zambia: Cumulative Distribution of Asset Index Score and Per Capita Household Expenditures
A second indicator for asset ownership considers small assets including TVs, radios, telephones (landline or mobile), refrigerators, washers, motorcycles, and big assets including cars or trucks. We require the household to have a car or any two of the other assets to be considered non-deprived. The percentage of households that are asset-deprived, by this measure, is also similar for households compared across disability status, with both rates close to 85 percent. The share of households lacking adequate sanitation is lower for households with disability compared to other households (38 percent versus 49 percent, Chi-sq<0.05).
Median per-capita total monthly, non-medical PCE are lower for households with disabilities compared to other households (median PCE: US$10.57 versus US$14.09).9 Using the expanded definition of disability, mean PCE is also lower for households with disabilities compared to other households (mean PCE: US$18.05 versus US$23.48, p<0.05). The right panel of Figure 1 shows the CDF of non-medical household expenditures for both households with and without disabilities. Households with disabilities show a similar ratio of medical to total monthly expenditures (2 percent for each group).
9 Monthly PCE Figures are denoted in international $, PPP 2005, adjusted for inflation.

146
Disability and poverty (Tables 2, 3, and 4; Figures 2a, 2b, 3a, and 3b)
Poverty is compared across disability status using five different methods to identify the poor: a multidimensional method, the bottom asset index or non-medical PCE quintile, and living under US$1.25 or US$2.00 a day.
Multidimensional poverty rates are shown at the bottom of Table 2 and in Figure 2a. Individuals with disabilities face higher multidimensional poverty rates compared to persons without disabilities (81 percent versus 73 percent, Chi-sq<0.05). This finding is robust across the definition of disability used, but not robust across urban/ rural sub-populations, likely due to the lower number of observations in rural and urban areas separately. The spider chart in Figure 2b compares individuals with disabilities to those without across each dimension used in this poverty measure. The plots represent deprivation rates for each dimension. The plot for persons with disabilities is similar to the plot for persons without disabilities in most dimensions, suggesting similar deprivation rates across disability status in these areas.
Figure 2a: Zambia: Multidimensional Poverty Rates
for Individuals with and without Disabilities
-
0.20
0.40
0.60
0.80
1.00
All Rural Urban
With Disability No Disability

147
Figure 2b: Zambia: Deprivation Rates across Multiple Dimensions for Individuals with and without Disabilities
-
0.20
0.40
0.60
0.80
1.00
Individual Not Employed
Individual has less than Primary
Education
PCE under $2/day
Medica l Expense ratio >
10%
Household lacks electricity
Household lacks clean
water source
Household lacks adequate
sanitation
Household lacks a hard
floor
Household cooks on wood,
charcoal, or dung
Household is Asset Deprived
(see text)
With Disability No Disability
All households are ranked by their asset index score from the lowest (bottom) to the highest asset index score, and categorized by quintile (with cutoffs at the 20th, 40th, 60th, and 80th percentiles for the five quintiles). Then, the percentage of households with disabilities that are in the bottom quintile is presented and compared to the percentage of other households in the bottom quintile. For instance, if more than 20 percent of households with disabilities are in the bottom quintile, households with disabilities are overrepresented in the bottom quintile. This procedure is repeated for PCE. As shown in Table 3, households show no statistically significant difference in neither representation of the bottom asset index quintile nor the bottom PCE quintile, with both groups close to the expected 20 percent.
Identifying poverty by comparing non-medical PCE to international poverty lines shows no statistically significant difference across household disability status. Figures 3a and 3b illustrate poverty comparisons across disability for the PPP US$1.25 and PPP US$2 a day poverty lines.
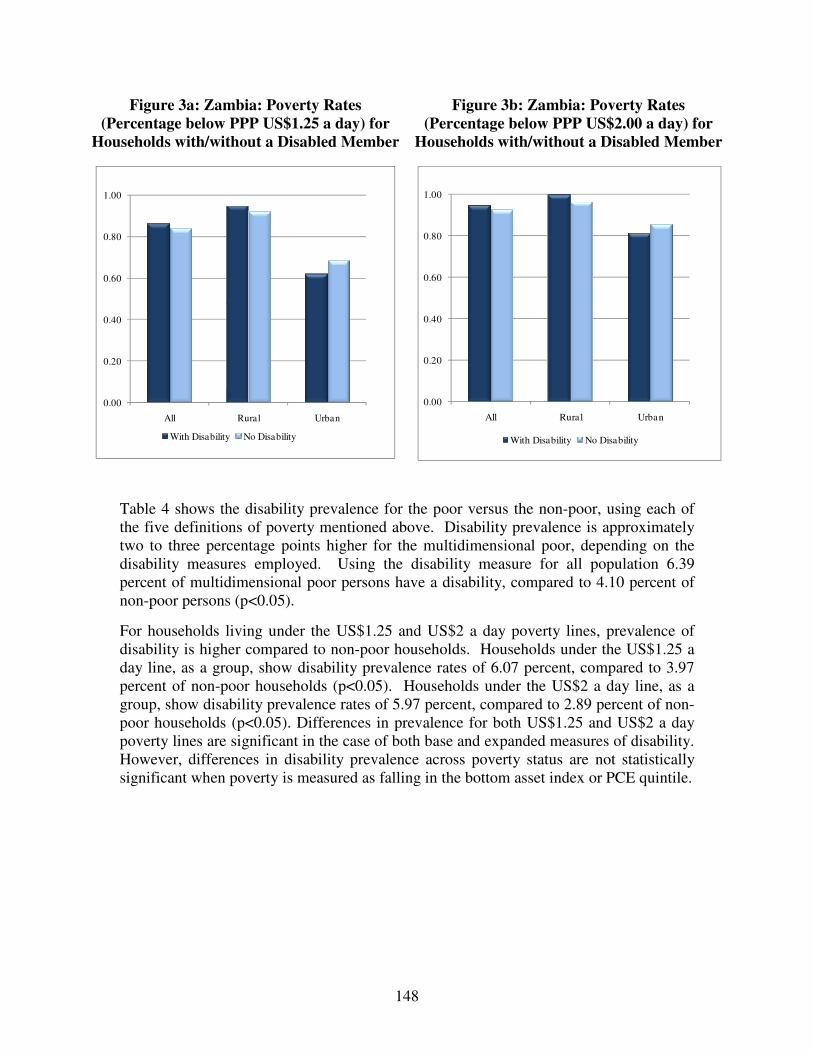
148
Figure 3a: Zambia: Poverty Rates (Percentage below PPP US$1.25 a day) for
Households with/without a Disabled Member
Figure 3b: Zambia: Poverty Rates (Percentage below PPP US$2.00 a day) for
Households with/without a Disabled Member
0.00
0.20
0.40
0.60
0.80
1.00
All Rural Urban
With Disability No Disability
0.00
0.20
0.40
0.60
0.80
1.00
All Rural Urban
With Disability No Disability
Table 4 shows the disability prevalence for the poor versus the non-poor, using each of the five definitions of poverty mentioned above. Disability prevalence is approximately two to three percentage points higher for the multidimensional poor, depending on the disability measures employed. Using the disability measure for all population 6.39 percent of multidimensional poor persons have a disability, compared to 4.10 percent of non-poor persons (p<0.05).
For households living under the US$1.25 and US$2 a day poverty lines, prevalence of disability is higher compared to non-poor households. Households under the US$1.25 a day line, as a group, show disability prevalence rates of 6.07 percent, compared to 3.97 percent of non-poor households (p<0.05). Households under the US$2 a day line, as a group, show disability prevalence rates of 5.97 percent, compared to 2.89 percent of non-poor households (p<0.05). Differences in prevalence for both US$1.25 and US$2 a day poverty lines are significant in the case of both base and expanded measures of disability. However, differences in disability prevalence across poverty status are not statistically significant when poverty is measured as falling in the bottom asset index or PCE quintile.
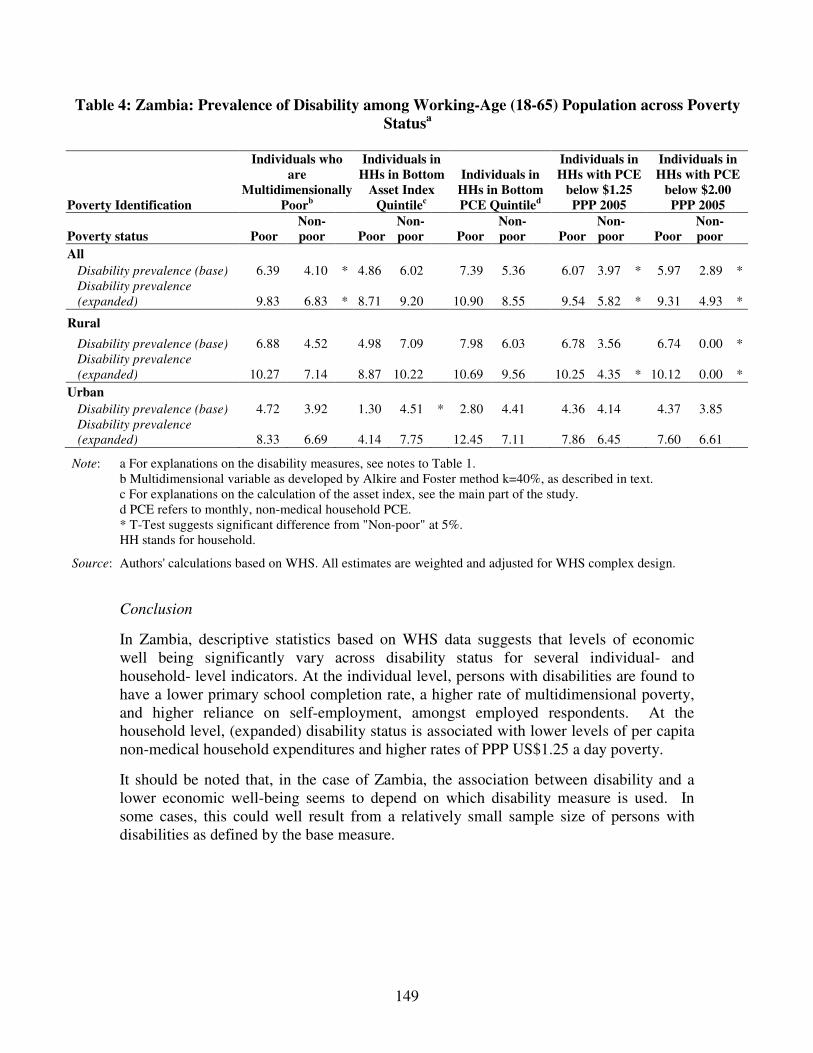
149
Table 4: Zambia: Prevalence of Disability among Working-Age (18-65) Population across Poverty Statusa
Poverty Identification
Individuals who are
Multidimensionally Poorb
Individuals in HHs in Bottom
Asset Index Quintilec
Individuals in HHs in Bottom PCE Quintiled
Individuals in HHs with PCE
below $1.25 PPP 2005
Individuals in HHs with PCE
below $2.00 PPP 2005
Poverty status Poor Non-poor Poor
Non-poor Poor
Non-poor Poor
Non-poor Poor
Non-poor
All Disability prevalence (base) 6.39 4.10 * 4.86 6.02 7.39 5.36 6.07 3.97 * 5.97 2.89 * Disability prevalence
(expanded) 9.83 6.83 * 8.71 9.20 10.90 8.55 9.54 5.82 * 9.31 4.93 *
Rural
Disability prevalence (base) 6.88 4.52 4.98 7.09 7.98 6.03 6.78 3.56 6.74 0.00 * Disability prevalence
(expanded) 10.27 7.14 8.87 10.22 10.69 9.56 10.25 4.35 * 10.12 0.00 *
Urban Disability prevalence (base) 4.72 3.92 1.30 4.51 * 2.80 4.41 4.36 4.14 4.37 3.85 Disability prevalence
(expanded) 8.33 6.69 4.14 7.75 12.45 7.11 7.86 6.45 7.60 6.61
Note: a For explanations on the disability measures, see notes to Table 1. b Multidimensional variable as developed by Alkire and Foster method k=40%, as described in text. c For explanations on the calculation of the asset index, see the main part of the study. d PCE refers to monthly, non-medical household PCE. * T-Test suggests significant difference from "Non-poor" at 5%. HH stands for household.
Source: Authors' calculations based on WHS. All estimates are weighted and adjusted for WHS complex design.
Conclusion
In Zambia, descriptive statistics based on WHS data suggests that levels of economic well being significantly vary across disability status for several individual- and household- level indicators. At the individual level, persons with disabilities are found to have a lower primary school completion rate, a higher rate of multidimensional poverty, and higher reliance on self-employment, amongst employed respondents. At the household level, (expanded) disability status is associated with lower levels of per capita non-medical household expenditures and higher rates of PPP US$1.25 a day poverty.
It should be noted that, in the case of Zambia, the association between disability and a lower economic well-being seems to depend on which disability measure is used. In some cases, this could well result from a relatively small sample size of persons with disabilities as defined by the base measure.

150
C.1.7 Disability Profile: Zimbabwe Prevalence of disability among working-age population, 18-65 years (Table 1)
In Zimbabwe, disability prevalence among working-age individuals stands at 11.0 percent. With the expanded measure of disability, prevalence goes up to 14.0 percent.
Prevalence rates are higher in rural than urban areas (12.9 percent versus 7.5 percent respectively). Disability prevalence for women is higher than that of men (12.9 percent versus 9.0 percent respectively). When using the expanded measure of disability, prevalence rates increase by 2.4 percentage points for both males and 3.5 percentage points for females. Concentrating/remembering things and moving around are the most commonly reported difficulties.
Demographic characteristics (Table 2)
Age, gender, and marital characteristics differ across disability status. The average individual with a disability is seven years older than the average individual without a disability (mean age: 41 versus 31 years, p<0.05). The oldest age group (46-65 years) makes up 43 percent of working-age persons with disabilities, compared to only 16 percent for persons without disabilities (Chi-sq<0.05). Sixty percent of persons with disabilities are female, compared to 50 percent of other individuals (Chi-sq<0.05). Additionally, persons with (expanded) disabilities are married at higher rates than persons without disabilities (65 percent versus 58 percent, Chi-sq<0.05).
Education and labor market status (Table 2)
Individuals with disabilities have lower educational attainment and greater reliance on self-employment. Persons with disabilities have 2.82 years of education, compared to 3.34 years for persons without disabilities (p<0.05). Individuals with disabilities also have lower completion rates of primary school (65 percent versus 82 percent for persons without disabilities, Chi-sq<0.05). Such lower educational attainment outcomes for persons with disabilities occur in both rural and urban areas.
Employment rates are similar across disability status, as 34 percent of persons with disabilities are employed compared to 32 percent of other persons. We do find a difference in the employment makeup of employed individuals, with a higher percentage of individuals with disability relying on self-employment compared to other individuals (67 percent versus 45 percent, Chi-sq<0.05).
Household characteristics, assets, living conditions, and expenditures (Table 3)
Comparing households with a working-age adult with a disability to other households, we find no significant difference in average household size or number of children. Households with disabilities do have a lower percentage of households headed by a male member (58 percent versus 67 percent for other households, Chi-sq<0.05).
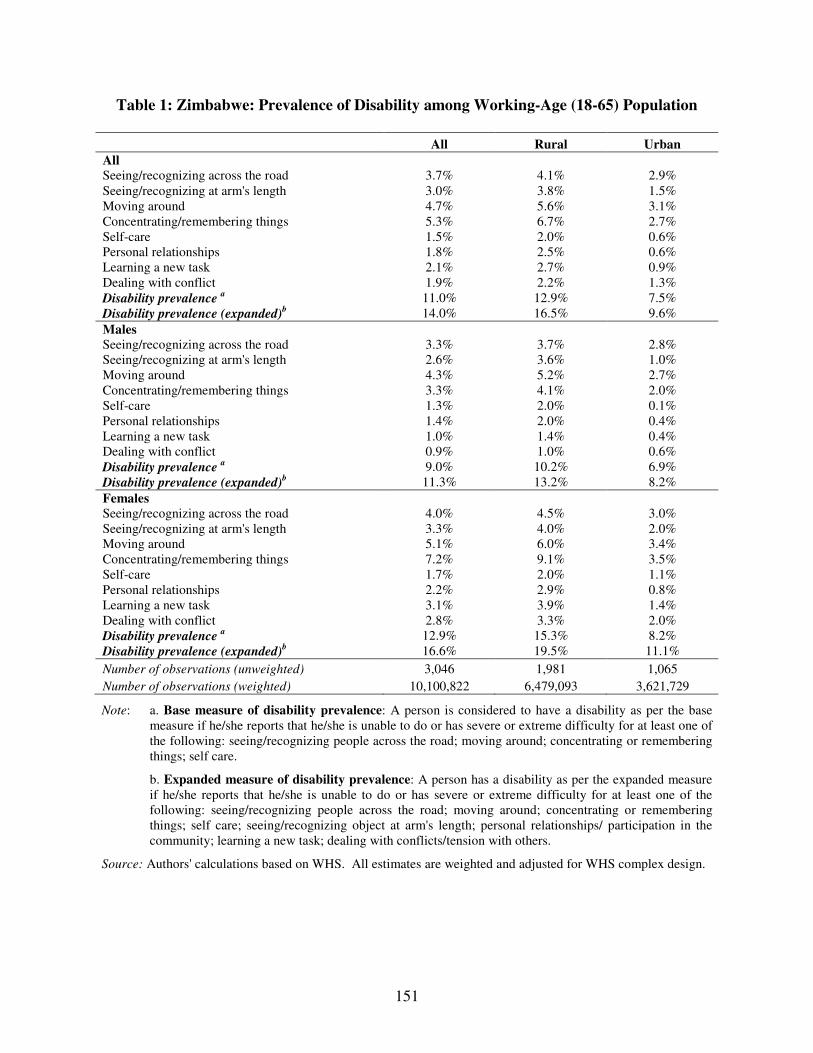
151
Table 1: Zimbabwe: Prevalence of Disability among Working-Age (18-65) Population
All Rural Urban
All Seeing/recognizing across the road 3.7% 4.1% 2.9% Seeing/recognizing at arm's length 3.0% 3.8% 1.5% Moving around 4.7% 5.6% 3.1% Concentrating/remembering things 5.3% 6.7% 2.7% Self-care 1.5% 2.0% 0.6% Personal relationships 1.8% 2.5% 0.6% Learning a new task 2.1% 2.7% 0.9% Dealing with conflict 1.9% 2.2% 1.3% Disability prevalence
a 11.0% 12.9% 7.5%
Disability prevalence (expanded)b 14.0% 16.5% 9.6%
Males Seeing/recognizing across the road 3.3% 3.7% 2.8% Seeing/recognizing at arm's length 2.6% 3.6% 1.0% Moving around 4.3% 5.2% 2.7% Concentrating/remembering things 3.3% 4.1% 2.0% Self-care 1.3% 2.0% 0.1% Personal relationships 1.4% 2.0% 0.4% Learning a new task 1.0% 1.4% 0.4% Dealing with conflict 0.9% 1.0% 0.6% Disability prevalence
a 9.0% 10.2% 6.9%
Disability prevalence (expanded)b 11.3% 13.2% 8.2%
Females Seeing/recognizing across the road 4.0% 4.5% 3.0% Seeing/recognizing at arm's length 3.3% 4.0% 2.0% Moving around 5.1% 6.0% 3.4% Concentrating/remembering things 7.2% 9.1% 3.5% Self-care 1.7% 2.0% 1.1% Personal relationships 2.2% 2.9% 0.8% Learning a new task 3.1% 3.9% 1.4% Dealing with conflict 2.8% 3.3% 2.0% Disability prevalence
a 12.9% 15.3% 8.2%
Disability prevalence (expanded)b 16.6% 19.5% 11.1%
Number of observations (unweighted) 3,046 1,981 1,065 Number of observations (weighted) 10,100,822 6,479,093 3,621,729
Note: a. Base measure of disability prevalence: A person is considered to have a disability as per the base measure if he/she reports that he/she is unable to do or has severe or extreme difficulty for at least one of the following: seeing/recognizing people across the road; moving around; concentrating or remembering things; self care.
b. Expanded measure of disability prevalence: A person has a disability as per the expanded measure if he/she reports that he/she is unable to do or has severe or extreme difficulty for at least one of the following: seeing/recognizing people across the road; moving around; concentrating or remembering things; self care; seeing/recognizing object at arm's length; personal relationships/ participation in the community; learning a new task; dealing with conflicts/tension with others.
Source: Authors' calculations based on WHS. All estimates are weighted and adjusted for WHS complex design.
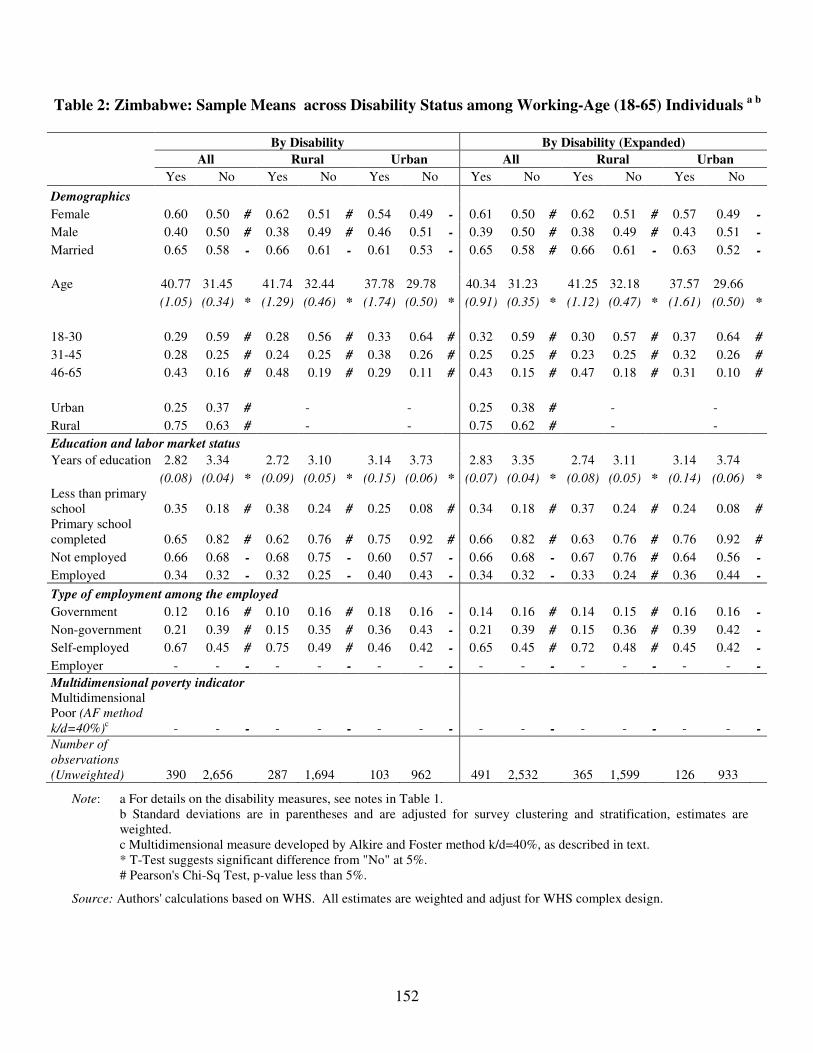
152
Table 2: Zimbabwe: Sample Means across Disability Status among Working-Age (18-65) Individuals a b
By Disability By Disability (Expanded)
All Rural Urban All Rural Urban
Yes No Yes No Yes No Yes No Yes No Yes No
Demographics
Female 0.60 0.50 # 0.62 0.51 # 0.54 0.49 - 0.61 0.50 # 0.62 0.51 # 0.57 0.49 -
Male 0.40 0.50 # 0.38 0.49 # 0.46 0.51 - 0.39 0.50 # 0.38 0.49 # 0.43 0.51 -
Married 0.65 0.58 - 0.66 0.61 - 0.61 0.53 - 0.65 0.58 # 0.66 0.61 - 0.63 0.52 -
Age 40.77 31.45 41.74 32.44 37.78 29.78 40.34 31.23 41.25 32.18 37.57 29.66
(1.05) (0.34) * (1.29) (0.46) * (1.74) (0.50) * (0.91) (0.35) * (1.12) (0.47) * (1.61) (0.50) *
18-30 0.29 0.59 # 0.28 0.56 # 0.33 0.64 # 0.32 0.59 # 0.30 0.57 # 0.37 0.64 #
31-45 0.28 0.25 # 0.24 0.25 # 0.38 0.26 # 0.25 0.25 # 0.23 0.25 # 0.32 0.26 #
46-65 0.43 0.16 # 0.48 0.19 # 0.29 0.11 # 0.43 0.15 # 0.47 0.18 # 0.31 0.10 #
Urban 0.25 0.37 # - - 0.25 0.38 # - -
Rural 0.75 0.63 # - - 0.75 0.62 # - -
Education and labor market status
Years of education 2.82 3.34 2.72 3.10 3.14 3.73 2.83 3.35 2.74 3.11 3.14 3.74
(0.08) (0.04) * (0.09) (0.05) * (0.15) (0.06) * (0.07) (0.04) * (0.08) (0.05) * (0.14) (0.06) *
Less than primary school 0.35 0.18 # 0.38 0.24 # 0.25 0.08 # 0.34 0.18 # 0.37 0.24 # 0.24 0.08 #
Primary school completed 0.65 0.82 # 0.62 0.76 # 0.75 0.92 # 0.66 0.82 # 0.63 0.76 # 0.76 0.92 #
Not employed 0.66 0.68 - 0.68 0.75 - 0.60 0.57 - 0.66 0.68 - 0.67 0.76 # 0.64 0.56 -
Employed 0.34 0.32 - 0.32 0.25 - 0.40 0.43 - 0.34 0.32 - 0.33 0.24 # 0.36 0.44 -
Type of employment among the employed
Government 0.12 0.16 # 0.10 0.16 # 0.18 0.16 - 0.14 0.16 # 0.14 0.15 # 0.16 0.16 -
Non-government 0.21 0.39 # 0.15 0.35 # 0.36 0.43 - 0.21 0.39 # 0.15 0.36 # 0.39 0.42 -
Self-employed 0.67 0.45 # 0.75 0.49 # 0.46 0.42 - 0.65 0.45 # 0.72 0.48 # 0.45 0.42 -
Employer - - - - - - - - - - - - - - - - - -
Multidimensional poverty indicator
Multidimensional Poor (AF method
k/d=40%)c - - - - - - - - - - - - - - - - - -
Number of
observations
(Unweighted) 390 2,656 287 1,694 103 962 491 2,532 365 1,599 126 933
Note: a For details on the disability measures, see notes in Table 1. b Standard deviations are in parentheses and are adjusted for survey clustering and stratification, estimates are weighted. c Multidimensional measure developed by Alkire and Foster method k/d=40%, as described in text. * T-Test suggests significant difference from "No" at 5%. # Pearson's Chi-Sq Test, p-value less than 5%.
Source: Authors' calculations based on WHS. All estimates are weighted and adjust for WHS complex design.
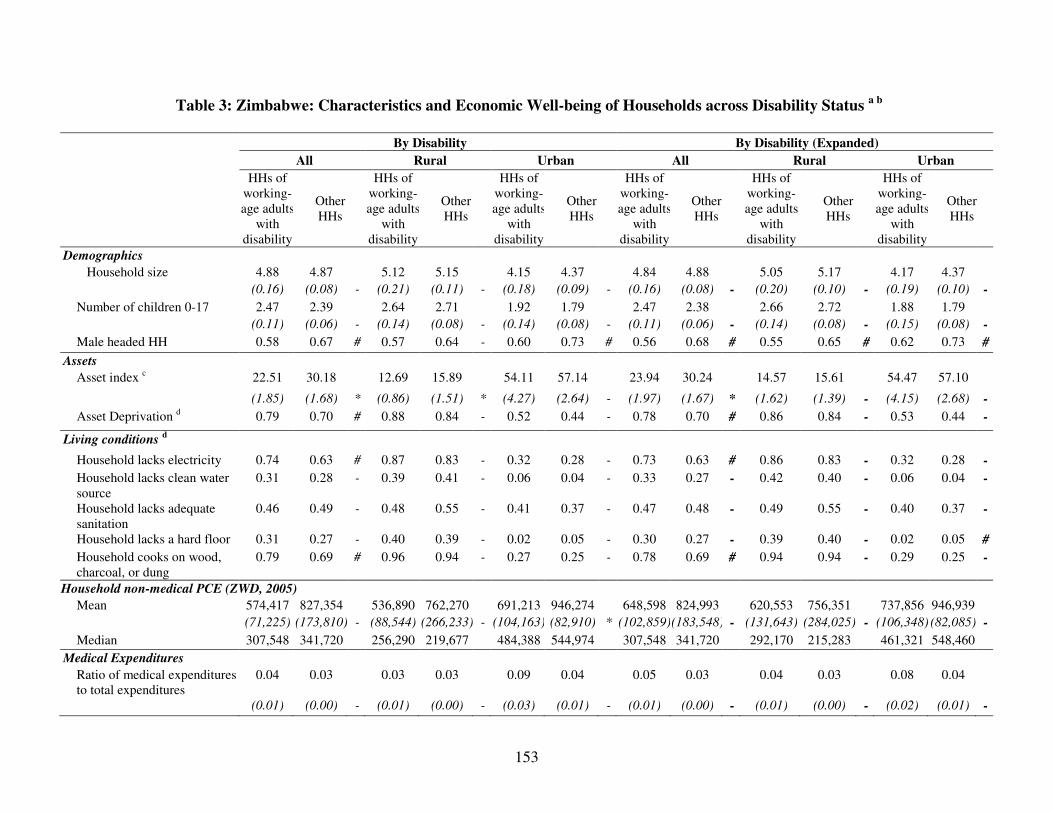
153
Table 3: Zimbabwe: Characteristics and Economic Well-being of Households across Disability Status a b
By Disability By Disability (Expanded)
All Rural Urban All Rural Urban
HHs of working-age adults
with disability
Other HHs
HHs of working-age adults
with disability
Other HHs
HHs of working-age adults
with disability
Other HHs
HHs of working-age adults
with disability
Other HHs
HHs of working-age adults
with disability
Other HHs
HHs of working-age adults
with disability
Other HHs
Demographics
Household size 4.88 4.87 5.12 5.15 4.15 4.37 4.84 4.88 5.05 5.17 4.17 4.37
(0.16) (0.08) - (0.21) (0.11) - (0.18) (0.09) - (0.16) (0.08) - (0.20) (0.10) - (0.19) (0.10) -
Number of children 0-17 2.47 2.39 2.64 2.71 1.92 1.79 2.47 2.38 2.66 2.72 1.88 1.79
(0.11) (0.06) - (0.14) (0.08) - (0.14) (0.08) - (0.11) (0.06) - (0.14) (0.08) - (0.15) (0.08) -
Male headed HH 0.58 0.67 # 0.57 0.64 - 0.60 0.73 # 0.56 0.68 # 0.55 0.65 # 0.62 0.73 #
Assets
Asset index c 22.51 30.18 12.69 15.89 54.11 57.14 23.94 30.24 14.57 15.61 54.47 57.10
(1.85) (1.68) * (0.86) (1.51) * (4.27) (2.64) - (1.97) (1.67) * (1.62) (1.39) - (4.15) (2.68) -
Asset Deprivation d 0.79 0.70 # 0.88 0.84 - 0.52 0.44 - 0.78 0.70 # 0.86 0.84 - 0.53 0.44 -
Living conditions d
Household lacks electricity 0.74 0.63 # 0.87 0.83 - 0.32 0.28 - 0.73 0.63 # 0.86 0.83 - 0.32 0.28 -
Household lacks clean water source
0.31 0.28 - 0.39 0.41 - 0.06 0.04 - 0.33 0.27 - 0.42 0.40 - 0.06 0.04 -
Household lacks adequate sanitation
0.46 0.49 - 0.48 0.55 - 0.41 0.37 - 0.47 0.48 - 0.49 0.55 - 0.40 0.37 -
Household lacks a hard floor 0.31 0.27 - 0.40 0.39 - 0.02 0.05 - 0.30 0.27 - 0.39 0.40 - 0.02 0.05 #
Household cooks on wood, charcoal, or dung
0.79 0.69 # 0.96 0.94 - 0.27 0.25 - 0.78 0.69 # 0.94 0.94 - 0.29 0.25 -
Household non-medical PCE (ZWD, 2005)
Mean 574,417 827,354 536,890 762,270 691,213 946,274 648,598 824,993 620,553 756,351 737,856 946,939
(71,225) (173,810) - (88,544) (266,233) - (104,163) (82,910) * (102,859)(183,548) - (131,643) (284,025) - (106,348) (82,085) -
Median 307,548 341,720 256,290 219,677 484,388 544,974 307,548 341,720 292,170 215,283 461,321 548,460
Medical Expenditures
Ratio of medical expenditures to total expenditures
0.04 0.03 0.03 0.03 0.09 0.04 0.05 0.03 0.04 0.03 0.08 0.04
(0.01) (0.00) - (0.01) (0.00) - (0.03) (0.01) - (0.01) (0.00) - (0.01) (0.00) - (0.02) (0.01) -
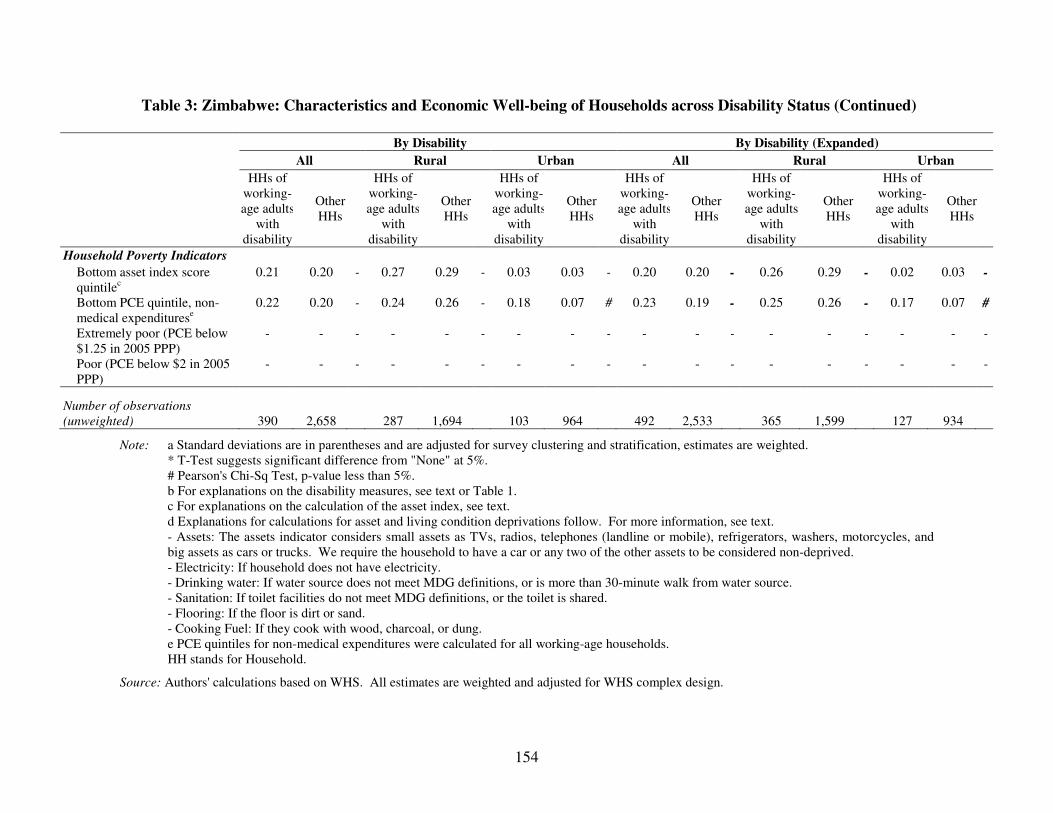
154
Table 3: Zimbabwe: Characteristics and Economic Well-being of Households across Disability Status (Continued)
By Disability By Disability (Expanded)
All Rural Urban All Rural Urban
HHs of working-age adults
with disability
Other HHs
HHs of working-age adults
with disability
Other HHs
HHs of working-age adults
with disability
Other HHs
HHs of working-age adults
with disability
Other HHs
HHs of working-age adults
with disability
Other HHs
HHs of working-age adults
with disability
Other HHs
Household Poverty Indicators
Bottom asset index score quintilec
0.21 0.20 - 0.27 0.29 - 0.03 0.03 - 0.20 0.20 - 0.26 0.29 - 0.02 0.03 -
Bottom PCE quintile, non-medical expenditurese
0.22 0.20 - 0.24 0.26 - 0.18 0.07 # 0.23 0.19 - 0.25 0.26 - 0.17 0.07 #
Extremely poor (PCE below $1.25 in 2005 PPP)
- - - - - - - - - - - - - - - - - -
Poor (PCE below $2 in 2005 PPP)
- - - - - - - - - - - - - - - - - -
Number of observations
(unweighted) 390 2,658 287 1,694 103 964 492 2,533 365 1,599 127 934
Note: a Standard deviations are in parentheses and are adjusted for survey clustering and stratification, estimates are weighted. * T-Test suggests significant difference from "None" at 5%. # Pearson's Chi-Sq Test, p-value less than 5%. b For explanations on the disability measures, see text or Table 1. c For explanations on the calculation of the asset index, see text. d Explanations for calculations for asset and living condition deprivations follow. For more information, see text. - Assets: The assets indicator considers small assets as TVs, radios, telephones (landline or mobile), refrigerators, washers, motorcycles, and big assets as cars or trucks. We require the household to have a car or any two of the other assets to be considered non-deprived. - Electricity: If household does not have electricity. - Drinking water: If water source does not meet MDG definitions, or is more than 30-minute walk from water source. - Sanitation: If toilet facilities do not meet MDG definitions, or the toilet is shared. - Flooring: If the floor is dirt or sand. - Cooking Fuel: If they cook with wood, charcoal, or dung. e PCE quintiles for non-medical expenditures were calculated for all working-age households. HH stands for Household.
Source: Authors' calculations based on WHS. All estimates are weighted and adjusted for WHS complex design.
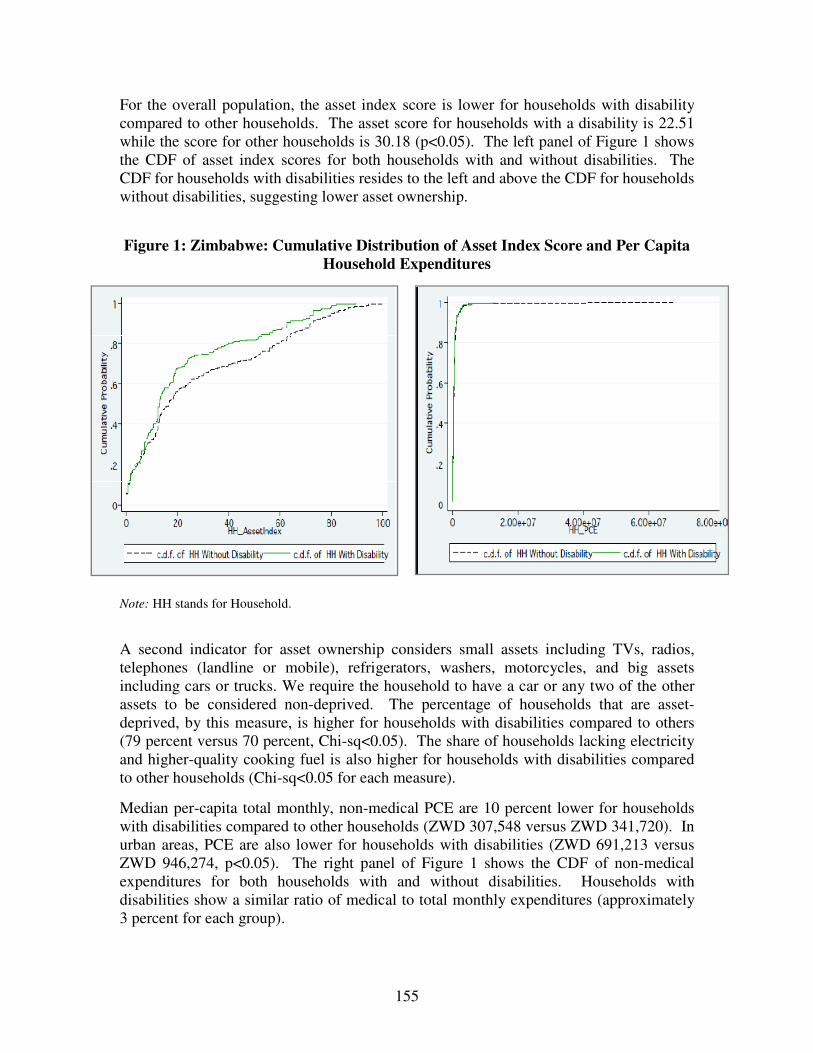
155
For the overall population, the asset index score is lower for households with disability compared to other households. The asset score for households with a disability is 22.51 while the score for other households is 30.18 (p<0.05). The left panel of Figure 1 shows the CDF of asset index scores for both households with and without disabilities. The CDF for households with disabilities resides to the left and above the CDF for households without disabilities, suggesting lower asset ownership.
Figure 1: Zimbabwe: Cumulative Distribution of Asset Index Score and Per Capita
Household Expenditures
Note: HH stands for Household.
A second indicator for asset ownership considers small assets including TVs, radios, telephones (landline or mobile), refrigerators, washers, motorcycles, and big assets including cars or trucks. We require the household to have a car or any two of the other assets to be considered non-deprived. The percentage of households that are asset-deprived, by this measure, is higher for households with disabilities compared to others (79 percent versus 70 percent, Chi-sq<0.05). The share of households lacking electricity and higher-quality cooking fuel is also higher for households with disabilities compared to other households (Chi-sq<0.05 for each measure).
Median per-capita total monthly, non-medical PCE are 10 percent lower for households with disabilities compared to other households (ZWD 307,548 versus ZWD 341,720). In urban areas, PCE are also lower for households with disabilities (ZWD 691,213 versus ZWD 946,274, p<0.05). The right panel of Figure 1 shows the CDF of non-medical expenditures for both households with and without disabilities. Households with disabilities show a similar ratio of medical to total monthly expenditures (approximately 3 percent for each group).

156
Disability and poverty (Tables 3 and 4)10
Poverty is compared across disability status using two different methods to identify the poor: the bottom asset index or PCE quintile. All households are ranked by their asset index score from the lowest (bottom) to the highest asset index score, and categorized by quintile (with cutoffs at the 20th, 40th, 60th, and 80th percentiles for the five quintiles). Then, the percentage of households with disabilities that are in the bottom quintile is presented and compared to the percentage of other households in the bottom quintile. For instance, if more than 20 percent of households with disabilities are in the bottom quintile, households with disabilities are overrepresented in the bottom quintile. This procedure is repeated for PCE. As shown in Table 3, households show no statistically significant difference in representation of the bottom asset index quintile, with both groups close to the expected 20 percent. In urban areas, however, we find that households with disabilities have higher representation in the bottom PCE quintile (of the entire country) than other households (18 percent versus 7 percent, p<0.05).
Table 4 shows the disability prevalence for the poor versus the non-poor, using both definitions of poverty mentioned above. However, differences in disability prevalence across poverty status are not statistically significant when poverty is measured as falling in the bottom asset index or PCE quintile.
Table 4: Zimbabwe: Prevalence of Disability among Working-Age (18-65) Population across
Poverty Statusa
Poverty Identification Individuals who are multi-
dimensionally Poorb
Individuals in HHs in bottom
asset index quintilece
Individuals in HHs in bottom PCE quintiled
Individuals in HHs with PCE
below $1.25 PPP 2005
Individuals in HHs with PCE
below $2.00 PPP 2005
Poverty status Poor Non-poor
Poor Non-poor
Poor Non-poor
Poor Non-poor
Poor Non-poor
All Disability prevalence (base) - - 12.76 10.57 12.67 10.55 - - - - Disability prevalence (expanded) - - 15.66 13.71 16.27 13.46 - - - - Rural Disability prevalence (base) - - 12.69 13.02 12.64 13.02 - - - - Disability prevalence (expanded) - - 15.74 16.80 16.04 16.68 - - - - Urban Disability prevalence (base) - - 14.07 7.20 12.85 6.95 - - - - Disability prevalence (expanded) - - 14.07 9.46 17.35 8.77 - - - -
Note: a For explanations on the disability measures, see notes in text or Table 1. b Multidimensional variable as developed by Alkire and Foster Method k=40%, as described in text. c For explanations on the calculation of the asset index, see text. d PCE refers to monthly, non-medical household per-capita expenditures. * T-Test suggests Significant Difference from "Non-poor" at 5%. HH stands for household.
Source: Authors' calculations based on WHS. All estimates are weighted and adjust for WHS complex design.
10 Due to a lack of 2003 and 2005 PPP estimates for Zimbabwe, we are unable to compare household PCE
to US$1.25 and US$2 a day international poverty lines, as we do for the other countries in the larger analysis. Multidimensional rates are also not calculated due to this restriction.

157
Conclusion
In Zimbabwe, the descriptive analysis of WHS data suggests that households and individuals with disabilities have lower levels of economic wellbeing for a number of indicators. Individuals with disabilities have lower rates of primary school completion and fewer mean years of education completed. Households with disabilities have lower asset ownership scores and less access to high quality living conditions. Households with disabilities in urban areas face lower mean PCE and a higher representation in the bottom PCE quintile.
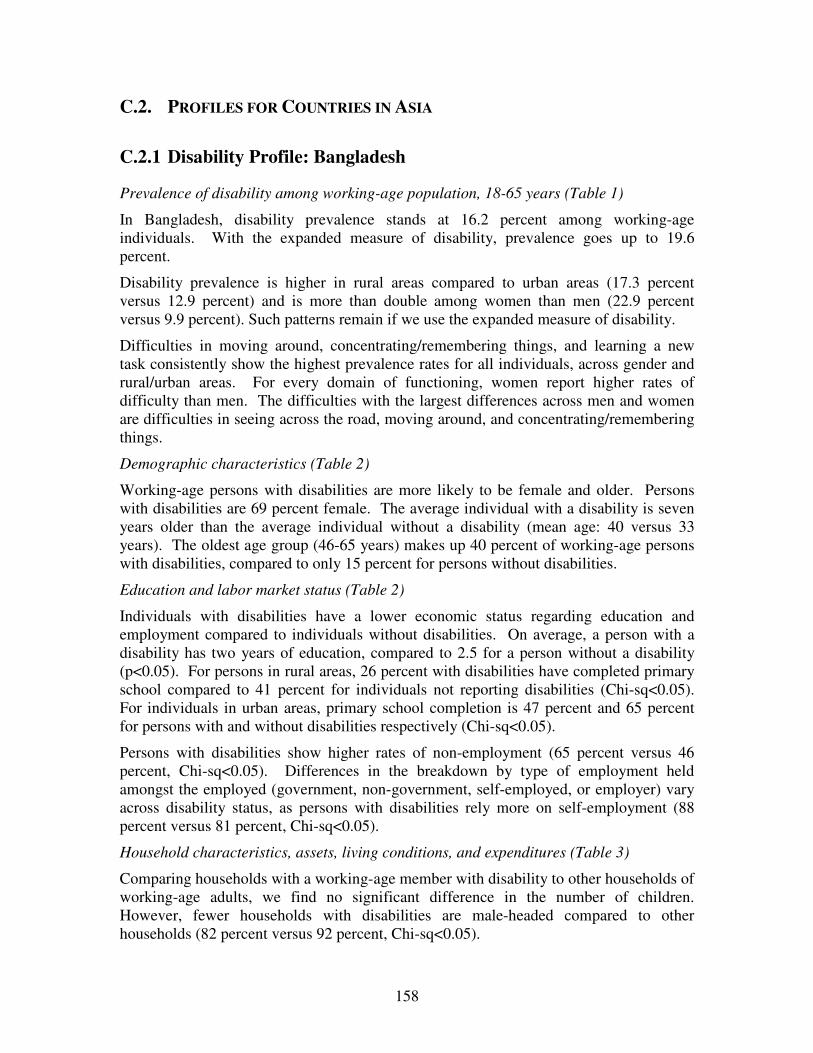
158
C.2. PROFILES FOR COUNTRIES IN ASIA
C.2.1 Disability Profile: Bangladesh Prevalence of disability among working-age population, 18-65 years (Table 1)
In Bangladesh, disability prevalence stands at 16.2 percent among working-age individuals. With the expanded measure of disability, prevalence goes up to 19.6 percent.
Disability prevalence is higher in rural areas compared to urban areas (17.3 percent versus 12.9 percent) and is more than double among women than men (22.9 percent versus 9.9 percent). Such patterns remain if we use the expanded measure of disability.
Difficulties in moving around, concentrating/remembering things, and learning a new task consistently show the highest prevalence rates for all individuals, across gender and rural/urban areas. For every domain of functioning, women report higher rates of difficulty than men. The difficulties with the largest differences across men and women are difficulties in seeing across the road, moving around, and concentrating/remembering things.
Demographic characteristics (Table 2)
Working-age persons with disabilities are more likely to be female and older. Persons with disabilities are 69 percent female. The average individual with a disability is seven years older than the average individual without a disability (mean age: 40 versus 33 years). The oldest age group (46-65 years) makes up 40 percent of working-age persons with disabilities, compared to only 15 percent for persons without disabilities.
Education and labor market status (Table 2)
Individuals with disabilities have a lower economic status regarding education and employment compared to individuals without disabilities. On average, a person with a disability has two years of education, compared to 2.5 for a person without a disability (p<0.05). For persons in rural areas, 26 percent with disabilities have completed primary school compared to 41 percent for individuals not reporting disabilities (Chi-sq<0.05). For individuals in urban areas, primary school completion is 47 percent and 65 percent for persons with and without disabilities respectively (Chi-sq<0.05).
Persons with disabilities show higher rates of non-employment (65 percent versus 46 percent, Chi-sq<0.05). Differences in the breakdown by type of employment held amongst the employed (government, non-government, self-employed, or employer) vary across disability status, as persons with disabilities rely more on self-employment (88 percent versus 81 percent, Chi-sq<0.05).
Household characteristics, assets, living conditions, and expenditures (Table 3)
Comparing households with a working-age member with disability to other households of working-age adults, we find no significant difference in the number of children. However, fewer households with disabilities are male-headed compared to other households (82 percent versus 92 percent, Chi-sq<0.05).

159
Table 1: Bangladesh: Prevalence of Disability among Working-Age (18-65) Population
All Rural Urban
All Seeing/recognizing across the road 4.9% 5.5% 3.2% Seeing/recognizing at arm's length 2.2% 2.5% 1.2% Moving around 8.2% 8.8% 6.3% Concentrating/remembering things 8.3% 8.8% 6.5% Self-care 4.1% 4.4% 3.3% Personal relationships 4.1% 4.4% 3.4% Learning a new task 6.3% 6.9% 4.5% Dealing with conflict 3.8% 4.2% 2.5% Disability prevalence
a 16.2% 17.3% 12.9%
Disability prevalence (expanded)b 19.6% 21.0% 15.3%
Males Seeing/recognizing across the road 1.8% 2.3% 0.6% Seeing/recognizing at arm's length 1.2% 1.4% 0.6% Moving around 4.9% 6.0% 1.9% Concentrating/remembering things 4.9% 5.1% 4.5% Self-care 1.9% 2.1% 1.2% Personal relationships 2.8% 2.8% 2.8% Learning a new task 4.3% 4.6% 3.6% Dealing with conflict 2.5% 2.7% 2.0% Disability prevalence
a 9.9% 11.3% 6.2%
Disability prevalence (expanded)b 13.4% 14.5% 10.3%
Females Seeing/recognizing across the road 8.1% 8.7% 6.4% Seeing/recognizing at arm's length 3.2% 3.6% 1.9% Moving around 11.7% 11.7% 11.7% Concentrating/remembering things 11.8% 12.6% 8.9% Self-care 6.5% 6.7% 5.8% Personal relationships 5.5% 5.9% 4.2% Learning a new task 8.7% 9.6% 5.9% Dealing with conflict 5.1% 5.7% 3.1% Disability prevalence
a 22.9% 23.4% 21.1%
Disability prevalence (expanded)b 27.2% 28.5% 22.7%
Number of observations (unweighted) 4,895 3,186 1,709 Number of observations (weighted) 166,000,000 124,300,000 41,676,366
Note: a. Base measure of disability prevalence: A person is considered to have a disability as per the base measure if he/she reports that he/she is unable to do or has severe or extreme difficulty for at least one of the following: seeing/recognizing people across the road; moving around; concentrating or remembering things; self care.
b. Expanded measure of disability prevalence: A person has a disability as per the expanded measure if he/she reports that he/she is unable to do or has severe or extreme difficulty for at least one of the following: seeing/recognizing people across the road; moving around; concentrating or remembering things; self care; seeing/recognizing object at arm's length; personal relationships/participation in the community; learning a new task; dealing with conflicts/tension with others.
Source: Authors' calculations based on WHS. All estimates are weighted and adjusted for WHS complex design.
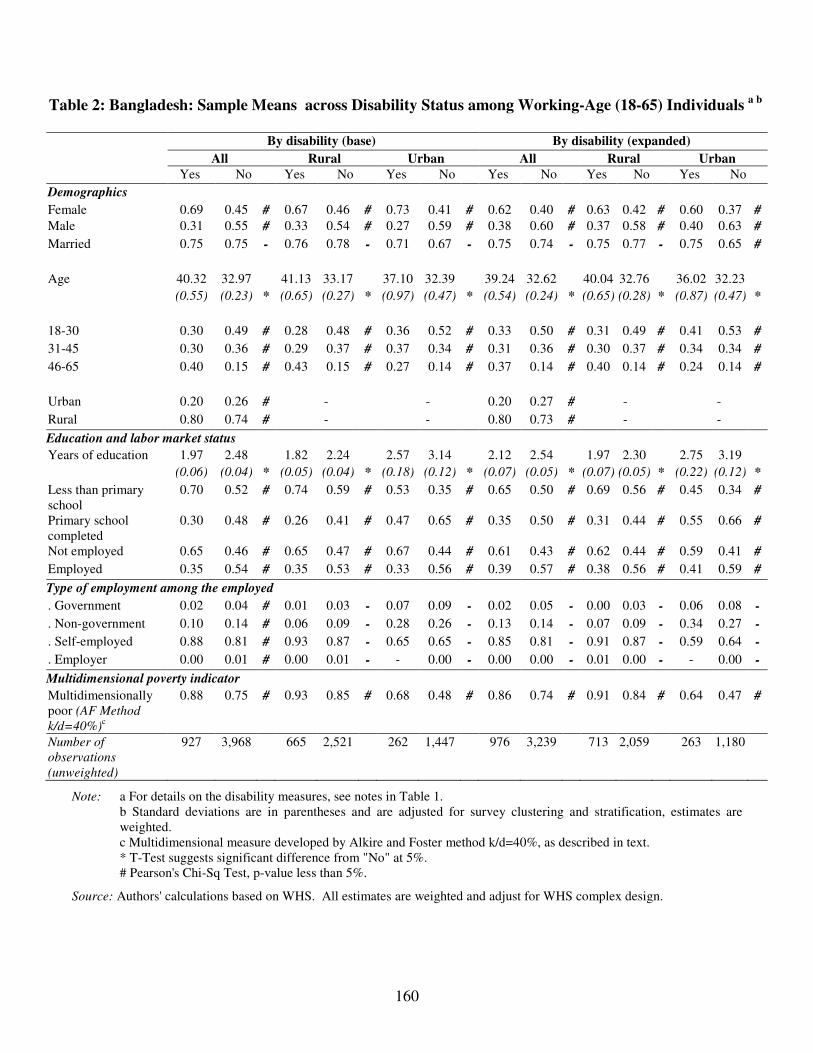
160
Table 2: Bangladesh: Sample Means across Disability Status among Working-Age (18-65) Individuals a b
By disability (base) By disability (expanded)
All Rural Urban All Rural Urban Yes No Yes No Yes No Yes No Yes No Yes No
Demographics
Female 0.69 0.45 # 0.67 0.46 # 0.73 0.41 # 0.62 0.40 # 0.63 0.42 # 0.60 0.37 #
Male 0.31 0.55 # 0.33 0.54 # 0.27 0.59 # 0.38 0.60 # 0.37 0.58 # 0.40 0.63 #
Married 0.75 0.75 - 0.76 0.78 - 0.71 0.67 - 0.75 0.74 - 0.75 0.77 - 0.75 0.65 #
Age 40.32 32.97 41.13 33.17 37.10 32.39 39.24 32.62 40.04 32.76 36.02 32.23
(0.55) (0.23) * (0.65) (0.27) * (0.97) (0.47) * (0.54) (0.24) * (0.65) (0.28) * (0.87) (0.47) *
18-30 0.30 0.49 # 0.28 0.48 # 0.36 0.52 # 0.33 0.50 # 0.31 0.49 # 0.41 0.53 #
31-45 0.30 0.36 # 0.29 0.37 # 0.37 0.34 # 0.31 0.36 # 0.30 0.37 # 0.34 0.34 #
46-65 0.40 0.15 # 0.43 0.15 # 0.27 0.14 # 0.37 0.14 # 0.40 0.14 # 0.24 0.14 #
Urban 0.20 0.26 # - - 0.20 0.27 # - -
Rural 0.80 0.74 # - - 0.80 0.73 # - -
Education and labor market status
Years of education 1.97 2.48 1.82 2.24 2.57 3.14 2.12 2.54 1.97 2.30 2.75 3.19
(0.06) (0.04) * (0.05) (0.04) * (0.18) (0.12) * (0.07) (0.05) * (0.07) (0.05) * (0.22) (0.12) *
Less than primary school
0.70 0.52 # 0.74 0.59 # 0.53 0.35 # 0.65 0.50 # 0.69 0.56 # 0.45 0.34 #
Primary school completed
0.30 0.48 # 0.26 0.41 # 0.47 0.65 # 0.35 0.50 # 0.31 0.44 # 0.55 0.66 #
Not employed 0.65 0.46 # 0.65 0.47 # 0.67 0.44 # 0.61 0.43 # 0.62 0.44 # 0.59 0.41 #
Employed 0.35 0.54 # 0.35 0.53 # 0.33 0.56 # 0.39 0.57 # 0.38 0.56 # 0.41 0.59 #
Type of employment among the employed
. Government 0.02 0.04 # 0.01 0.03 - 0.07 0.09 - 0.02 0.05 - 0.00 0.03 - 0.06 0.08 -
. Non-government 0.10 0.14 # 0.06 0.09 - 0.28 0.26 - 0.13 0.14 - 0.07 0.09 - 0.34 0.27 -
. Self-employed 0.88 0.81 # 0.93 0.87 - 0.65 0.65 - 0.85 0.81 - 0.91 0.87 - 0.59 0.64 -
. Employer 0.00 0.01 # 0.00 0.01 - - 0.00 - 0.00 0.00 - 0.01 0.00 - - 0.00 -
Multidimensional poverty indicator
Multidimensionally poor (AF Method
k/d=40%)c
0.88 0.75 # 0.93 0.85 # 0.68 0.48 # 0.86 0.74 # 0.91 0.84 # 0.64 0.47 #
Number of
observations
(unweighted)
927 3,968 665 2,521 262 1,447 976 3,239 713 2,059 263 1,180
Note: a For details on the disability measures, see notes in Table 1. b Standard deviations are in parentheses and are adjusted for survey clustering and stratification, estimates are weighted. c Multidimensional measure developed by Alkire and Foster method k/d=40%, as described in text. * T-Test suggests significant difference from "No" at 5%. # Pearson's Chi-Sq Test, p-value less than 5%.
Source: Authors' calculations based on WHS. All estimates are weighted and adjust for WHS complex design.

161
Table 3: Bangladesh: Characteristics and Economic Well-being of Households across Disability Status a b
By disability (base) By disability (expanded)
All Rural Urban All Rural Urban HHs of
working-age
adults with
disability
Other HHs
HHs of working-
age adults with
disability
Other HHs
HHs of working-
age adults with
disability
Other HHs
HHs of working-
age adults with
disability
Other HHs
HHs of working-
age adults with
disability
Other HHs
HHs of working-
age adults with
disability
Other HHs
Demographics Household size 4.95 5.17 4.96 5.20 4.91 5.10 5.05 5.22 5.09 5.25 4.86 5.12 (0.09) (0.05) * (0.11) (0.06) * (0.18) (0.08) - (0.09) (0.05) - (0.10) (0.06) - (0.19) (0.08) -
Number of children 0-17 2.22 2.33 2.27 2.42 2.01 2.04 2.27 2.34 2.33 2.45 1.97 2.02 (0.07) (0.04) - (0.08) (0.05) - (0.12) (0.06) - (0.06) (0.04) - (0.07) (0.05) - (0.13) (0.06) - Male headed household 0.82 0.92 # 0.82 0.92 # 0.84 0.91 # 0.83 0.92 # 0.83 0.92 # 0.85 0.91 #
Assets Asset index c 11.75 15.54 7.29 9.04 31.53 36.60 12.76 16.23 8.07 9.46 33.34 37.65 (0.80) (0.71) * (0.39) (0.49) * (3.30) (2.43) * (0.96) (0.78) * (0.48) (0.56) * (3.80) (2.44) -
Asset deprivation d 0.88 0.83 # 0.94 0.90 # 0.65 0.60 - 0.88 0.82 # 0.93 0.89 # 0.64 0.60 -
Living conditions d
Household lacks electricity 0.69 0.61 # 0.79 0.75 - 0.23 0.17 # 0.66 0.59 # 0.77 0.74 - 0.20 0.15 - Household lacks clean water source
0.06 0.04 # 0.08 0.05 # 0.01 0.00 # 0.07 0.04 # 0.08 0.05 # 0.01 0.00 -
Household lacks adequate sanitation
0.65 0.56 # 0.67 0.61 # 0.54 0.40 # 0.60 0.55 # 0.62 0.60 - 0.53 0.38 #
Household lacks a hard floor 0.88 0.81 # 0.96 0.93 # 0.53 0.44 # 0.88 0.80 # 0.95 0.92 # 0.53 0.42 #
Household cooks on wood, charcoal, or dung
0.79 0.75 - 0.83 0.82 - 0.58 0.52 - 0.83 0.76 # 0.89 0.84 # 0.57 0.50 -
Household non-medical PCE (International $, PPP 2005) Mean 51.38 47.60 47.74 40.61 67.56 70.01 50.12 48.88 46.62 41.34 65.65 72.50 (4.72) (1.81) - (5.53) (1.52) - (7.24) (5.55) - (4.62) (2.08) - (5.33) (1.83) - (8.28) (5.99) -
Median 30.56 31.51 29.03 29.79 43.55 44.81 31.17 32.09 29.47 30.56 45.18 45.84
Medical expenditures
Ratio of Medical Expenditures to Total Expenditures
0.16 0.11 0.16 0.12 0.15 0.11 0.16 0.12 0.16 0.12 0.15 0.11
(0.01) (0.00) * (0.01) (0.00) * (0.01) (0.00) * (0.01) (0.00) * (0.01) (0.00) * (0.01) (0.01) *
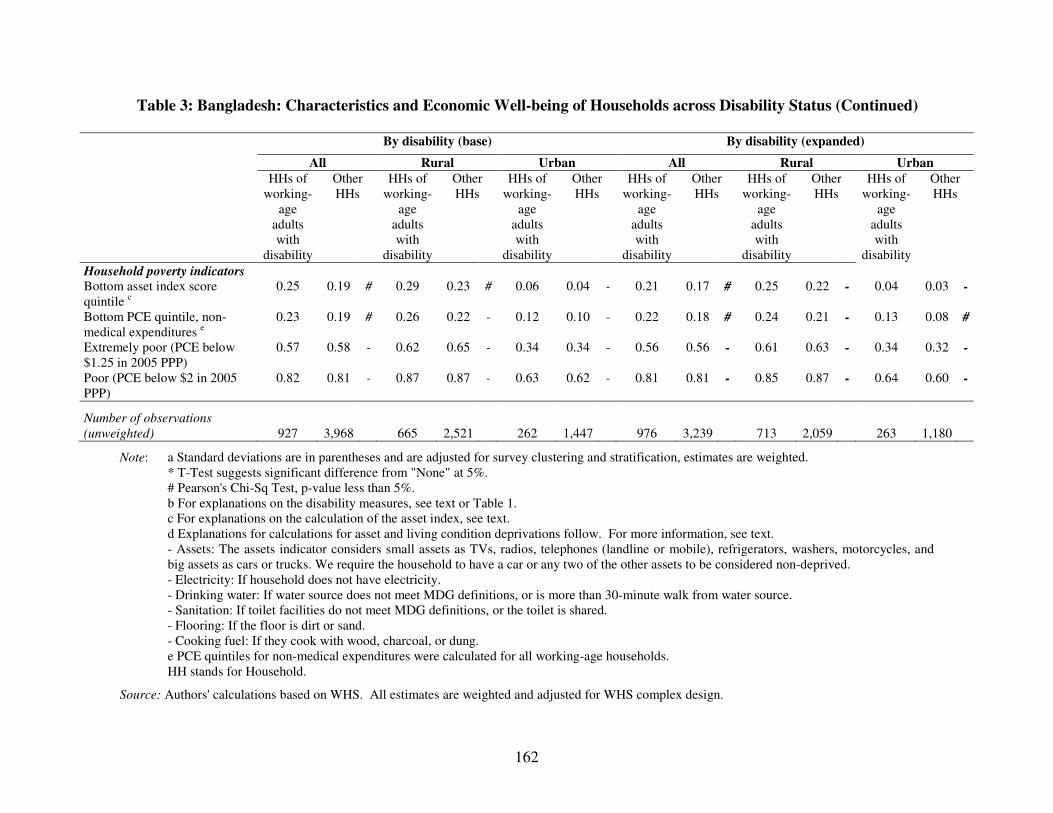
162
Table 3: Bangladesh: Characteristics and Economic Well-being of Households across Disability Status (Continued)
By disability (base) By disability (expanded)
All Rural Urban All Rural Urban HHs of
working-age
adults with
disability
Other HHs
HHs of working-
age adults with
disability
Other HHs
HHs of working-
age adults with
disability
Other HHs
HHs of working-
age adults with
disability
Other HHs
HHs of working-
age adults with
disability
Other HHs
HHs of working-
age adults with
disability
Other HHs
Household poverty indicators
Bottom asset index score quintile c
0.25 0.19 # 0.29 0.23 # 0.06 0.04 - 0.21 0.17 # 0.25 0.22 - 0.04 0.03 -
Bottom PCE quintile, non-medical expenditures e
0.23 0.19 # 0.26 0.22 - 0.12 0.10 - 0.22 0.18 # 0.24 0.21 - 0.13 0.08 #
Extremely poor (PCE below $1.25 in 2005 PPP)
0.57 0.58 - 0.62 0.65 - 0.34 0.34 - 0.56 0.56 - 0.61 0.63 - 0.34 0.32 -
Poor (PCE below $2 in 2005 PPP)
0.82 0.81 - 0.87 0.87 - 0.63 0.62 - 0.81 0.81 - 0.85 0.87 - 0.64 0.60 -
Number of observations
(unweighted) 927 3,968 665 2,521 262 1,447 976 3,239 713 2,059 263 1,180
Note: a Standard deviations are in parentheses and are adjusted for survey clustering and stratification, estimates are weighted. * T-Test suggests significant difference from "None" at 5%. # Pearson's Chi-Sq Test, p-value less than 5%. b For explanations on the disability measures, see text or Table 1. c For explanations on the calculation of the asset index, see text. d Explanations for calculations for asset and living condition deprivations follow. For more information, see text. - Assets: The assets indicator considers small assets as TVs, radios, telephones (landline or mobile), refrigerators, washers, motorcycles, and big assets as cars or trucks. We require the household to have a car or any two of the other assets to be considered non-deprived. - Electricity: If household does not have electricity. - Drinking water: If water source does not meet MDG definitions, or is more than 30-minute walk from water source. - Sanitation: If toilet facilities do not meet MDG definitions, or the toilet is shared. - Flooring: If the floor is dirt or sand. - Cooking fuel: If they cook with wood, charcoal, or dung. e PCE quintiles for non-medical expenditures were calculated for all working-age households. HH stands for Household.
Source: Authors' calculations based on WHS. All estimates are weighted and adjusted for WHS complex design.
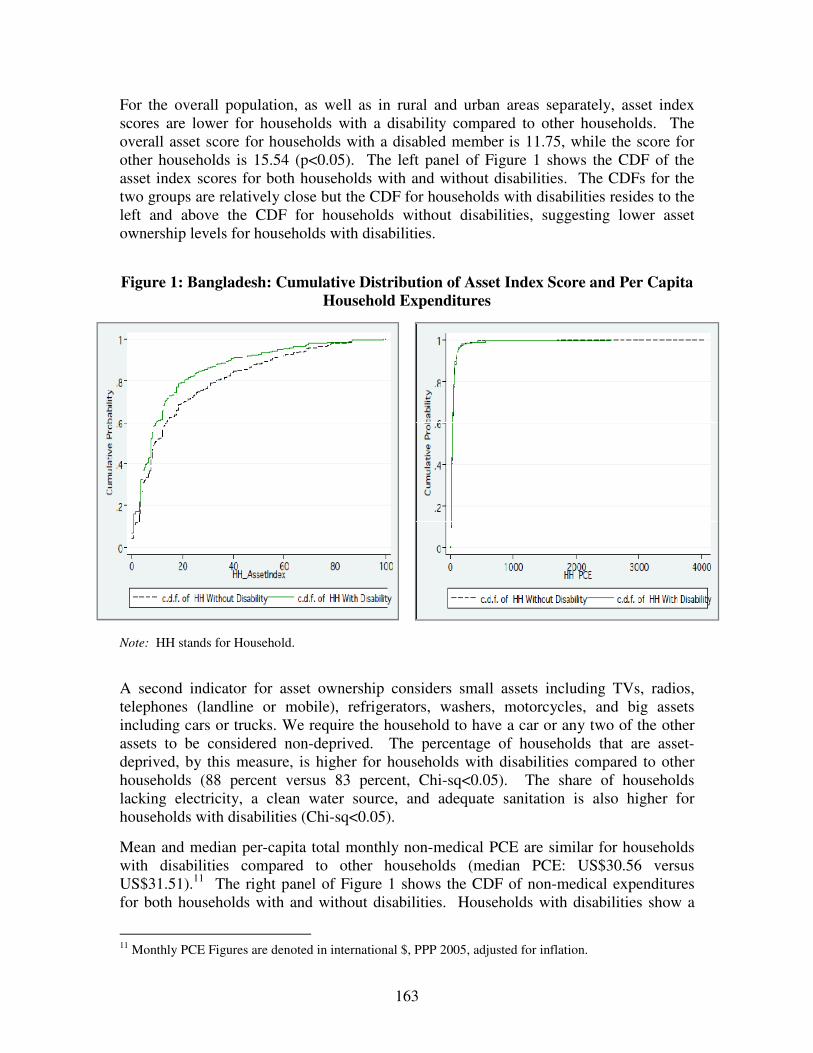
163
For the overall population, as well as in rural and urban areas separately, asset index scores are lower for households with a disability compared to other households. The overall asset score for households with a disabled member is 11.75, while the score for other households is 15.54 (p<0.05). The left panel of Figure 1 shows the CDF of the asset index scores for both households with and without disabilities. The CDFs for the two groups are relatively close but the CDF for households with disabilities resides to the left and above the CDF for households without disabilities, suggesting lower asset ownership levels for households with disabilities.
Figure 1: Bangladesh: Cumulative Distribution of Asset Index Score and Per Capita
Household Expenditures
Note: HH stands for Household.
A second indicator for asset ownership considers small assets including TVs, radios, telephones (landline or mobile), refrigerators, washers, motorcycles, and big assets including cars or trucks. We require the household to have a car or any two of the other assets to be considered non-deprived. The percentage of households that are asset-deprived, by this measure, is higher for households with disabilities compared to other households (88 percent versus 83 percent, Chi-sq<0.05). The share of households lacking electricity, a clean water source, and adequate sanitation is also higher for households with disabilities (Chi-sq<0.05).
Mean and median per-capita total monthly non-medical PCE are similar for households with disabilities compared to other households (median PCE: US$30.56 versus US$31.51).11 The right panel of Figure 1 shows the CDF of non-medical expenditures for both households with and without disabilities. Households with disabilities show a
11 Monthly PCE Figures are denoted in international $, PPP 2005, adjusted for inflation.
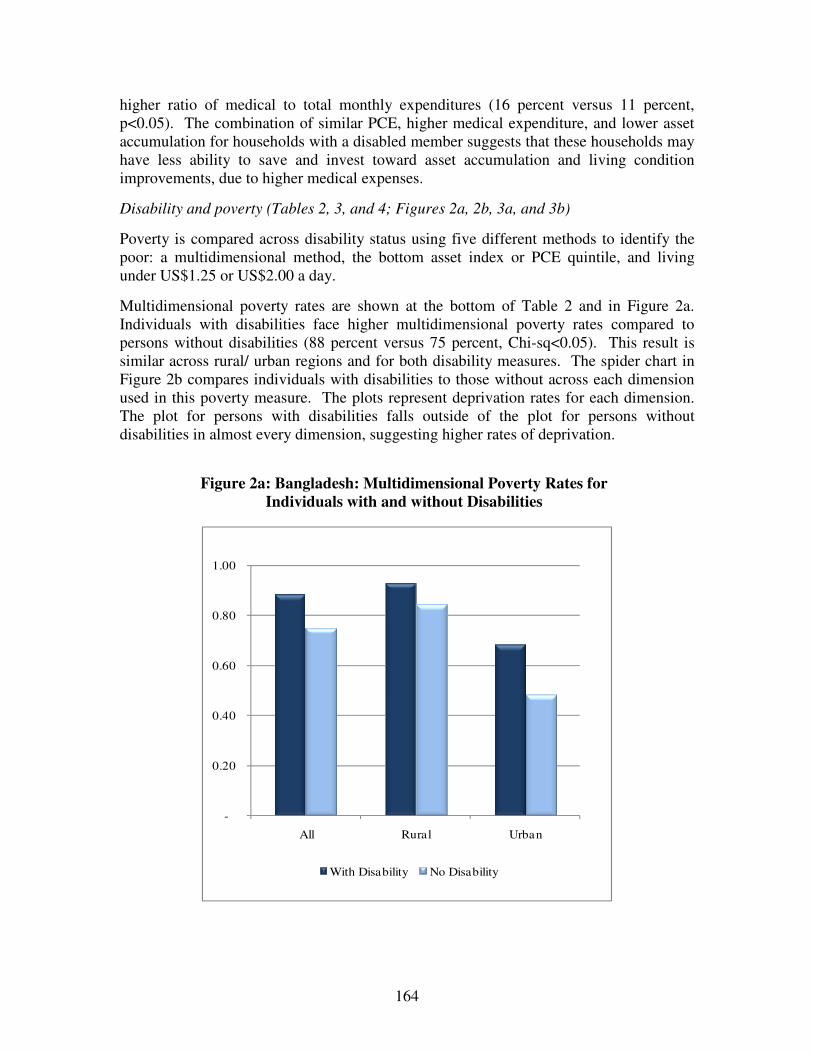
164
higher ratio of medical to total monthly expenditures (16 percent versus 11 percent, p<0.05). The combination of similar PCE, higher medical expenditure, and lower asset accumulation for households with a disabled member suggests that these households may have less ability to save and invest toward asset accumulation and living condition improvements, due to higher medical expenses.
Disability and poverty (Tables 2, 3, and 4; Figures 2a, 2b, 3a, and 3b)
Poverty is compared across disability status using five different methods to identify the poor: a multidimensional method, the bottom asset index or PCE quintile, and living under US$1.25 or US$2.00 a day.
Multidimensional poverty rates are shown at the bottom of Table 2 and in Figure 2a. Individuals with disabilities face higher multidimensional poverty rates compared to persons without disabilities (88 percent versus 75 percent, Chi-sq<0.05). This result is similar across rural/ urban regions and for both disability measures. The spider chart in Figure 2b compares individuals with disabilities to those without across each dimension used in this poverty measure. The plots represent deprivation rates for each dimension. The plot for persons with disabilities falls outside of the plot for persons without disabilities in almost every dimension, suggesting higher rates of deprivation.
Figure 2a: Bangladesh: Multidimensional Poverty Rates for
Individuals with and without Disabilities
-
0.20
0.40
0.60
0.80
1.00
All Rural Urban
With Disability No Disability
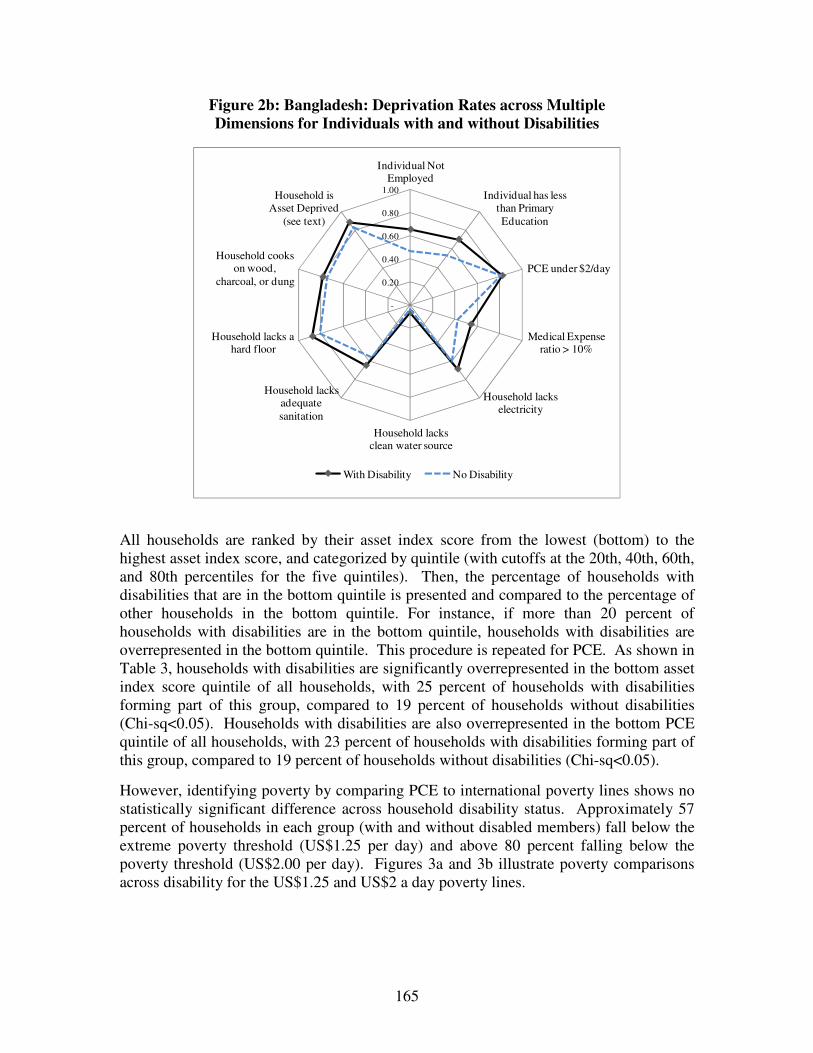
165
Figure 2b: Bangladesh: Deprivation Rates across Multiple Dimensions for Individuals with and without Disabilities
-
0.20
0.40
0.60
0.80
1.00
Individual Not Employed
Individual has less than Primary Education
PCE under $2/day
Medical Expense ratio > 10%
Household lacks electricity
Household lacks clean water source
Household lacks adequate sanitation
Household lacks a hard floor
Household cooks on wood,
charcoal, or dung
Household is Asset Deprived
(see text)
With Disability No Disability
All households are ranked by their asset index score from the lowest (bottom) to the highest asset index score, and categorized by quintile (with cutoffs at the 20th, 40th, 60th, and 80th percentiles for the five quintiles). Then, the percentage of households with disabilities that are in the bottom quintile is presented and compared to the percentage of other households in the bottom quintile. For instance, if more than 20 percent of households with disabilities are in the bottom quintile, households with disabilities are overrepresented in the bottom quintile. This procedure is repeated for PCE. As shown in Table 3, households with disabilities are significantly overrepresented in the bottom asset index score quintile of all households, with 25 percent of households with disabilities forming part of this group, compared to 19 percent of households without disabilities (Chi-sq<0.05). Households with disabilities are also overrepresented in the bottom PCE quintile of all households, with 23 percent of households with disabilities forming part of this group, compared to 19 percent of households without disabilities (Chi-sq<0.05).
However, identifying poverty by comparing PCE to international poverty lines shows no statistically significant difference across household disability status. Approximately 57 percent of households in each group (with and without disabled members) fall below the extreme poverty threshold (US$1.25 per day) and above 80 percent falling below the poverty threshold (US$2.00 per day). Figures 3a and 3b illustrate poverty comparisons across disability for the US$1.25 and US$2 a day poverty lines.

166
Figure 3a: Bangladesh: Poverty Rates (Percentage below US$1.25 a day) for
Household with/without a Disabled Member
Figure 3b: Bangladesh: Poverty Rates (Percentage below US$2.00 a day) for
Household with/without a Disabled Member
0.00
0.20
0.40
0.60
0.80
1.00
All Rural Urban
With Disability No Disability
0.00
0.20
0.40
0.60
0.80
1.00
All Rural Urban
With Disability No Disability
Table 4 shows the disability prevalence for the poor versus the non-poor, using each of the five definitions of poverty studied above. Disability prevalence is some 10 percentage points higher for the multidimensional poor, compared to the non-poor, across all areas and both disability measures (p<0.05). Using the base disability measure for the entire country, 18.49 percent of multidimensionally poor persons have a disability, compared to 8.47 percent of non-poor persons (p<0.05).
For households in the bottom asset index and PCE quintile, prevalence of disability is higher compared to higher quintiles. The bottom asset index quintile of households shows disability prevalence rates of 20.94 percent, compared to 15.23 percent for households in higher quintiles; however, this difference is not statistically significant. For PCE comparisons, the bottom quintile also shows higher disability prevalence (19.07 percent versus 15.53 percent, p<0.05).
Comparing households that fall above or below US$1.25 and US$2 a day poverty lines, approximately 16 percent of households in each group contain a working-age member with a disability, with no significant difference across poverty status. Using the expanded definition of disability, there also is no significant difference in disability prevalence across poverty status using the US$1.25 and US$2 a day measures: approximately 19 percent of individuals, in poor or non-poor households, have a disability.

167
Table 4: Bangladesh: Prevalence of Disability among Working-Age (18-65) Population across Poverty Status a
Poverty Identification Individuals who are
Multidimensionally Poorb
Individuals in HHs in Bottom
Asset Index Quintilec
Individuals in HHs in Bottom PCE Quintiled
Individuals in HHs with PCE
Below $1.25 PPP 2005
Individuals in HHs with PCE
Below $2.00 PPP 2005
Poverty status Poor Non-poor
Poor Non-poor
Poor Non-poor
Poor Non-poor
Poor Non-poor
All Disability prevalence (base) 18.49 8.47 * 20.94 15.23 * 19.07 15.53 * 16.44 15.90 16.63 14.39 Disability prevalence
(expanded)
22.07 11.50 * 22.86 18.91 * 22.54 18.90 19.89 19.14 19.78 18.64
Rural
Disability prevalence (base) 18.73 8.59 * 21.10 16.23 * 19.74 16.61 17.16 17.61 17.44 16.46
Disability prevalence
(expanded)
22.48 12.29 * 23.13 20.35 22.93 20.47 20.76 21.40 20.68 23.08
Urban Disability prevalence (base) 17.31 8.36 * 17.65 12.78 14.29 12.78 12.42 13.18 13.33 12.20 Disability prevalence
(expanded)
19.93 10.83 * 16.57 15.38 19.76 14.88 14.93 15.51 16.10 13.98
Note: a For explanations on the disability measures, see notes in text or Table 1. b Multidimensional variable as developed by Alkire and Foster method k=40%, as described in text. c For explanations on the calculation of the asset index, see text. d PCE refers to monthly, non-medical household PCE. * T-Test suggests significant difference from "non-poor" at 5%. HH stands for household.
Source: Authors' calculations based on WHS. All estimates are weighted and adjust for WHS complex design.
Conclusion
In conclusion, in Bangladesh, descriptive analysis of WHS data suggests that disability is associated with a lower economic well-being for several individual- and household-level indicators. At the individual level, working-age persons with disabilities have lower rates of employment and primary education completion. Persons with disabilities are also found to have higher rates of multidimensional poverty. At the household-level, households with disabilities have lower mean asset index scores, less access to adequate living conditions, and higher medical to non-medical expenditure ratios compared to other households. Additionally, households with disabilities, as a group, are overrepresented in the bottom asset index score and PCE quintiles of all households.
168
C.2.2 Disability Profile: Lao PDR Prevalence of disability among working-age population, 18-65 years (Table 1)
In Laos, disability prevalence among working-age individuals stands at 3.1 percent. With the expanded measure of disability, prevalence goes up to 12.7 percent.
Prevalence rates in rural and urban areas are close (3.2 percent versus 2.7 percent respectively), as are rates for females and males (3.5 percent versus 2.7 percent respectively). When using the expanded measure of disability, prevalence rates are as high as 13.8 percent and 11.5 percent for females and males. This jump is due to the relatively higher rates of difficulty in learning a new task, which is a component of the expanded definition of disability.
Demographic characteristics (Table 2)
Demographic characteristics around gender and marital status do not differ across disability. However, the average individual with a disability is 10 years older than the average individual without a disability (mean age: 44 versus 34 years, p<0.05). The oldest age group (46-65 years) makes up 50 percent of working-age persons with disabilities, compared to only 18 percent for persons without disabilities (Chi-sq<0.05).
Education and labor market status (Table 2)
Individuals with disability have a statistically significant lower mean educational attainment. The average person with disability has 2.35 years of education, compared to 2.78 for the average person without a disability (p<0.05). Additionally, individuals with disabilities experience lower completion rates of primary school compared to persons without disabilities (43 percent versus 55 percent, Chi-sq<0.05). Differences in rates of employment are not statistically significant across disability status. However, using the expanded definition of disability, employed persons with disabilities show higher rates of self-employment than others (87 percent versus 81 percent, Chi-sq<0.05).
Household characteristics, assets, living conditions, and expenditures (Table 3)
Comparing households with a working-age adult with a disability to other households, we find no significant difference in average household size, number of children, or percentage of households headed by a male member.

169
Table 1: Lao PDR: Prevalence of Disability among Working-Age (18-65) Population
All Rural Urban
All Seeing/Recognizing across the road 0.9% 1.0% 0.6% Seeing/Recognizing at arm's length 1.4% 1.5% 1.1% Moving around 1.4% 1.3% 1.5% Concentrating/remembering things 1.3% 1.4% 0.8% Self-care 0.2% 0.3% 0.1% Personal relationships 3.5% 3.7% 2.9% Learning a new task 7.9% 8.9% 4.7% Dealing with conflict 0.9% 1.0% 0.3% Disability prevalence
a 3.1% 3.2% 2.7%
Disability prevalence (expanded)b 12.7% 13.6% 9.6%
Males Seeing/Recognizing across the road 1.0% 1.0% 1.0% Seeing/Recognizing at arm's length 1.6% 1.6% 1.4% Moving around 1.0% 0.9% 1.2% Concentrating/remembering things 0.7% 0.9% 0.1% Self-care 0.4% 0.5% 0.1% Personal relationships 4.0% 4.4% 2.7% Learning a new task 6.6% 7.6% 3.1% Dealing with conflict 1.0% 1.2% 0.2% Disability prevalence
a 2.7% 2.9% 2.2%
Disability prevalence (expanded)b 11.5% 12.6% 7.8%
Females Seeing/Recognizing across the road 0.9% 1.0% 0.3% Seeing/Recognizing at arm's length 1.2% 1.4% 0.8% Moving around 1.8% 1.7% 1.8% Concentrating/remembering things 1.8% 1.9% 1.5% Self-care 0.0% 0.0% 0.0% Personal relationships 3.0% 3.0% 3.2% Learning a new task 9.2% 10.2% 6.1% Dealing with conflict 0.8% 0.9% 0.4% Disability prevalence
a 3.5% 3.5% 3.2%
Disability prevalence (expanded)b 13.8% 14.6% 11.3%
Number of observations (Unweighted) 3,635 2,588 1,047 Number of observations (Weighted) 4,912,890 3,763,169 1,149,722
Note: a. Base measure of disability prevalence: A person is considered to have a disability as per the base measure if he/she reports that he/she is unable to do or has severe or extreme difficulty for at least one of the following: seeing/recognizing people across the road, moving around, concentrating or remembering things, self care.
b. Expanded measure of disability prevalence: A person has a disability as per the expanded measure if he/she reports that he/she is unable to do or has severe or extreme difficulty for at least one of the following: seeing/recognizing people across the road, moving around, concentrating or remembering things, self care, seeing/recognizing object at arm's length, personal relationships/participation in the community, learning a new task, or dealing with conflicts/tension with others.
Source: Authors' calculations based on WHS. All estimates are weighted and adjusted for WHS complex design.
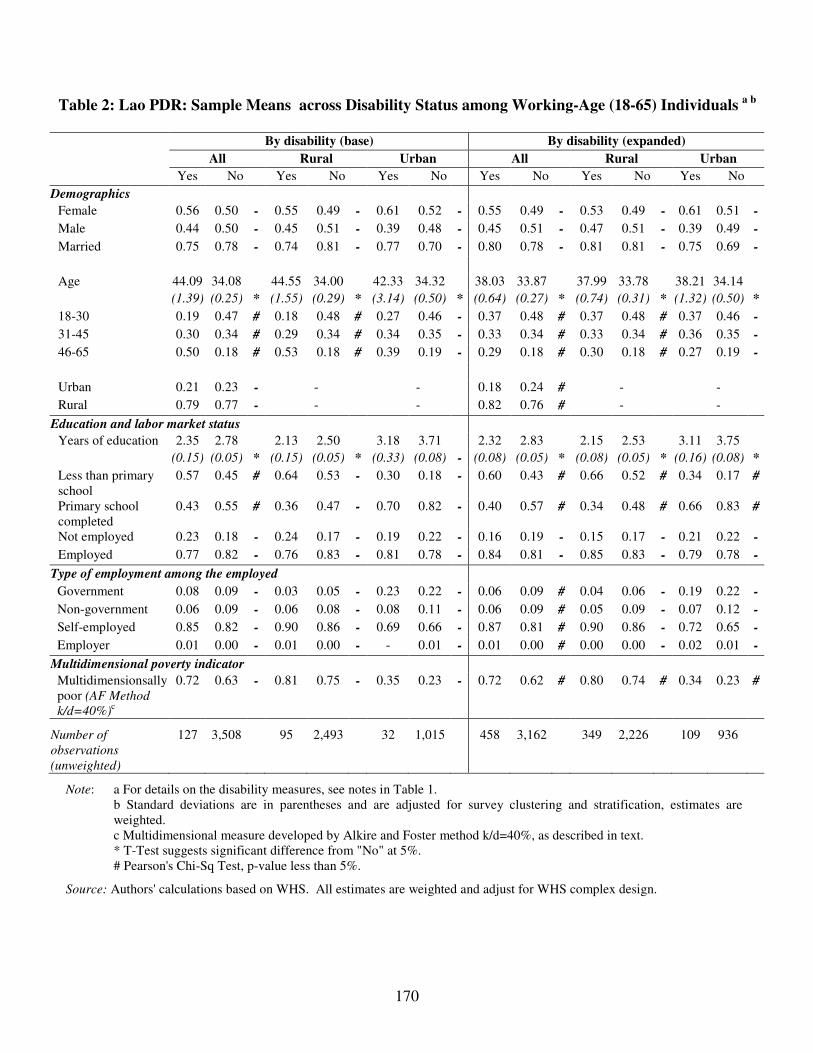
170
Table 2: Lao PDR: Sample Means across Disability Status among Working-Age (18-65) Individuals a b
By disability (base) By disability (expanded)
All Rural Urban All Rural Urban
Yes No Yes No Yes No Yes No Yes No Yes No
Demographics
Female 0.56 0.50 - 0.55 0.49 - 0.61 0.52 - 0.55 0.49 - 0.53 0.49 - 0.61 0.51 -
Male 0.44 0.50 - 0.45 0.51 - 0.39 0.48 - 0.45 0.51 - 0.47 0.51 - 0.39 0.49 -
Married 0.75 0.78 - 0.74 0.81 - 0.77 0.70 - 0.80 0.78 - 0.81 0.81 - 0.75 0.69 -
Age 44.09 34.08 44.55 34.00 42.33 34.32 38.03 33.87 37.99 33.78 38.21 34.14
(1.39) (0.25) * (1.55) (0.29) * (3.14) (0.50) * (0.64) (0.27) * (0.74) (0.31) * (1.32) (0.50) *
18-30 0.19 0.47 # 0.18 0.48 # 0.27 0.46 - 0.37 0.48 # 0.37 0.48 # 0.37 0.46 -
31-45 0.30 0.34 # 0.29 0.34 # 0.34 0.35 - 0.33 0.34 # 0.33 0.34 # 0.36 0.35 -
46-65 0.50 0.18 # 0.53 0.18 # 0.39 0.19 - 0.29 0.18 # 0.30 0.18 # 0.27 0.19 -
Urban 0.21 0.23 - - - 0.18 0.24 # - -
Rural 0.79 0.77 - - - 0.82 0.76 # - -
Education and labor market status
Years of education 2.35 2.78 2.13 2.50 3.18 3.71 2.32 2.83 2.15 2.53 3.11 3.75
(0.15) (0.05) * (0.15) (0.05) * (0.33) (0.08) - (0.08) (0.05) * (0.08) (0.05) * (0.16) (0.08) *
Less than primary school
0.57 0.45 # 0.64 0.53 - 0.30 0.18 - 0.60 0.43 # 0.66 0.52 # 0.34 0.17 #
Primary school completed
0.43 0.55 # 0.36 0.47 - 0.70 0.82 - 0.40 0.57 # 0.34 0.48 # 0.66 0.83 #
Not employed 0.23 0.18 - 0.24 0.17 - 0.19 0.22 - 0.16 0.19 - 0.15 0.17 - 0.21 0.22 -
Employed 0.77 0.82 - 0.76 0.83 - 0.81 0.78 - 0.84 0.81 - 0.85 0.83 - 0.79 0.78 -
Type of employment among the employed
Government 0.08 0.09 - 0.03 0.05 - 0.23 0.22 - 0.06 0.09 # 0.04 0.06 - 0.19 0.22 -
Non-government 0.06 0.09 - 0.06 0.08 - 0.08 0.11 - 0.06 0.09 # 0.05 0.09 - 0.07 0.12 -
Self-employed 0.85 0.82 - 0.90 0.86 - 0.69 0.66 - 0.87 0.81 # 0.90 0.86 - 0.72 0.65 -
Employer 0.01 0.00 - 0.01 0.00 - - 0.01 - 0.01 0.00 # 0.00 0.00 - 0.02 0.01 -
Multidimensional poverty indicator
Multidimensionsally poor (AF Method
k/d=40%)c
0.72 0.63 - 0.81 0.75 - 0.35 0.23 - 0.72 0.62 # 0.80 0.74 # 0.34 0.23 #
Number of
observations
(unweighted)
127 3,508 95 2,493 32 1,015 458 3,162 349 2,226 109 936
Note: a For details on the disability measures, see notes in Table 1. b Standard deviations are in parentheses and are adjusted for survey clustering and stratification, estimates are weighted. c Multidimensional measure developed by Alkire and Foster method k/d=40%, as described in text. * T-Test suggests significant difference from "No" at 5%. # Pearson's Chi-Sq Test, p-value less than 5%.
Source: Authors' calculations based on WHS. All estimates are weighted and adjust for WHS complex design.

171
Table 3: Lao PDR: Characteristics and Economic Well-being of Households across Disability Status a b
By disability (base) By disability (expanded)
All Rural Urban All Rural Urban
HHs of working-age adults
with disability
Other HHs
HHs of working-age adults
with disability
Other HHs
HHs of working-age adults
with disability
Other HHs
HHs of working-age adults
with disability
Other HHs
HHs of working-age adults
with disability
Other HHs
HHs of working-age adults
with disability
Other HHs
Demographics
Household size 5.39 5.55 5.42 5.65 5.31 5.29 5.72 5.52 5.85 5.61 5.24 5.29
(0.20) (0.05) - (0.21) (0.06) - (0.47) (0.08) - (0.12) (0.05) - (0.14) (0.06) - (0.21) (0.09) -
Number of children 0-17 2.74 2.72 2.80 2.87 2.55 2.31 2.88 2.70 3.01 2.85 2.45 2.30
(0.17) (0.05) - (0.18) (0.06) - (0.39) (0.08) - (0.10) (0.04) - (0.12) (0.06) - (0.18) (0.09) -
Male headed household 0.91 0.92 - 0.93 0.94 - 0.84 0.87 - 0.93 0.92 - 0.94 0.94 - 0.88 0.87 -
Assets
Asset index c 21.73 26.26 16.17 19.17 39.21 44.86 21.74 26.75 16.46 19.45 39.62 45.28
(1.75) (0.92) * (1.62) (0.78) - (3.46) (1.92) - (1.13) (0.94) * (0.95) (0.80) * (2.56) (1.91) *
Asset Deprivation d 0.66 0.60 - 0.76 0.73 - 0.34 0.26 - 0.71 0.59 # 0.80 0.73 # 0.37 0.25 #
Living conditions d
Household lacks electricity 0.58 0.53 - 0.69 0.68 - 0.22 0.15 - 0.65 0.52 # 0.78 0.67 # 0.22 0.15 -
Household lacks clean water source 0.53 0.43 - 0.62 0.53 - 0.24 0.18 - 0.46 0.43 - 0.53 0.53 - 0.22 0.17 -
Household lacks adequate sanitation
0.65 0.59 - 0.78 0.72 - 0.25 0.25 - 0.65 0.58 # 0.77 0.71 # 0.26 0.24 -
Household lacks a hard floor 0.07 0.06 - 0.06 0.06 - 0.10 0.05 - 0.08 0.06 - 0.08 0.06 - 0.06 0.05 -
Household cooks on wood, charcoal, or dung
0.99 0.96 - 1.00 0.99 - 0.94 0.88 - 0.98 0.96 # 1.00 0.99 - 0.93 0.87 -
Household non-medical PCE (International $, PPP 2005)
Mean 29.86 37.92 24.38 27.08 47.08 66.23 30.75 38.67 24.50 27.37 51.94 67.27
(4.18) (1.98) - (4.70) (1.20) - (8.24) (5.56) - (2.48) (2.12) * (2.59) (1.27) - (5.88) (5.80) *
Median 20.45 22.21 14.24 17.01 38.14 44.06 18.46 22.67 14.24 17.40 38.76 44.29
Medical expenditures
Ratio of medical expenditures to total expenditures
0.15 0.11 0.17 0.13 0.08 0.07 0.13 0.11 0.15 0.13 0.06 0.07
(0.02) (0.00) - (0.03) (0.01) - (0.02) (0.01) - (0.01) (0.00) - (0.01) (0.01) - (0.01) (0.01) -
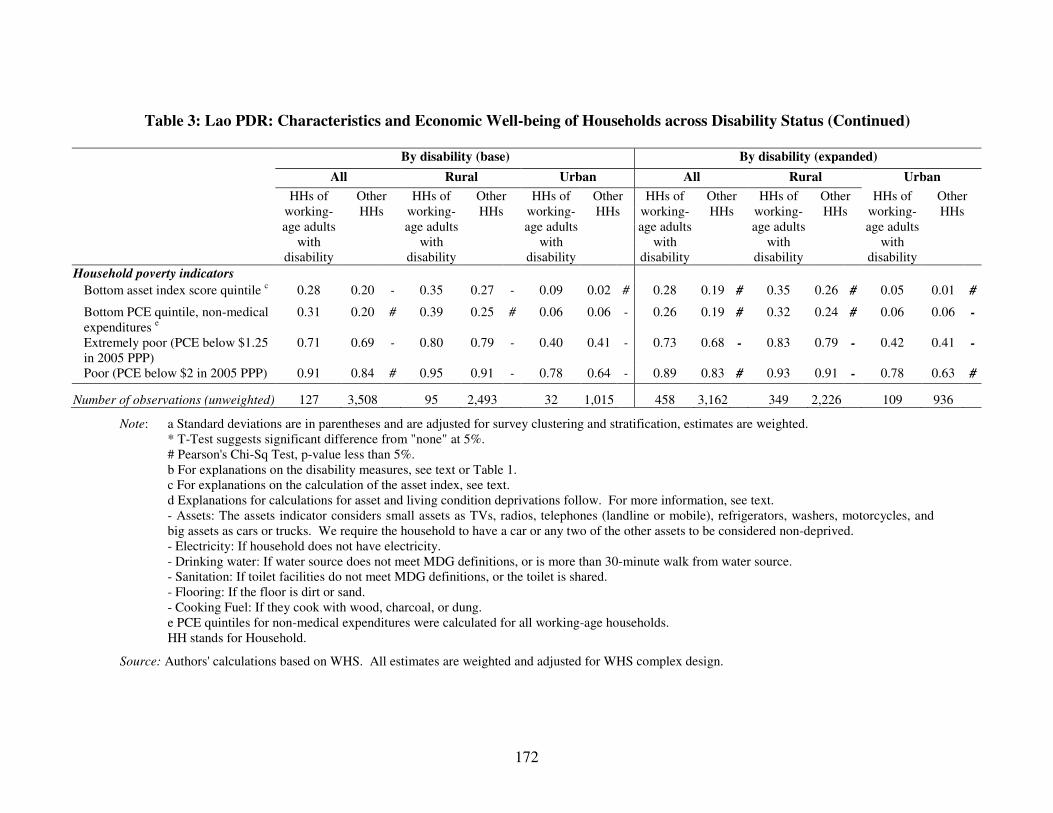
172
Table 3: Lao PDR: Characteristics and Economic Well-being of Households across Disability Status (Continued)
By disability (base) By disability (expanded)
All Rural Urban All Rural Urban
HHs of working-age adults
with disability
Other HHs
HHs of working-age adults
with disability
Other HHs
HHs of working-age adults
with disability
Other HHs
HHs of working-age adults
with disability
Other HHs
HHs of working-age adults
with disability
Other HHs
HHs of working-age adults
with disability
Other HHs
Household poverty indicators
Bottom asset index score quintile c 0.28 0.20 - 0.35 0.27 - 0.09 0.02 # 0.28 0.19 # 0.35 0.26 # 0.05 0.01 #
Bottom PCE quintile, non-medical expenditures e
0.31 0.20 # 0.39 0.25 # 0.06 0.06 - 0.26 0.19 # 0.32 0.24 # 0.06 0.06 -
Extremely poor (PCE below $1.25 in 2005 PPP)
0.71 0.69 - 0.80 0.79 - 0.40 0.41 - 0.73 0.68 - 0.83 0.79 - 0.42 0.41 -
Poor (PCE below $2 in 2005 PPP) 0.91 0.84 # 0.95 0.91 - 0.78 0.64 - 0.89 0.83 # 0.93 0.91 - 0.78 0.63 #
Number of observations (unweighted) 127 3,508 95 2,493 32 1,015 458 3,162 349 2,226 109 936
Note: a Standard deviations are in parentheses and are adjusted for survey clustering and stratification, estimates are weighted. * T-Test suggests significant difference from "none" at 5%. # Pearson's Chi-Sq Test, p-value less than 5%. b For explanations on the disability measures, see text or Table 1. c For explanations on the calculation of the asset index, see text. d Explanations for calculations for asset and living condition deprivations follow. For more information, see text. - Assets: The assets indicator considers small assets as TVs, radios, telephones (landline or mobile), refrigerators, washers, motorcycles, and big assets as cars or trucks. We require the household to have a car or any two of the other assets to be considered non-deprived. - Electricity: If household does not have electricity. - Drinking water: If water source does not meet MDG definitions, or is more than 30-minute walk from water source. - Sanitation: If toilet facilities do not meet MDG definitions, or the toilet is shared. - Flooring: If the floor is dirt or sand. - Cooking Fuel: If they cook with wood, charcoal, or dung. e PCE quintiles for non-medical expenditures were calculated for all working-age households. HH stands for Household.
Source: Authors' calculations based on WHS. All estimates are weighted and adjusted for WHS complex design.
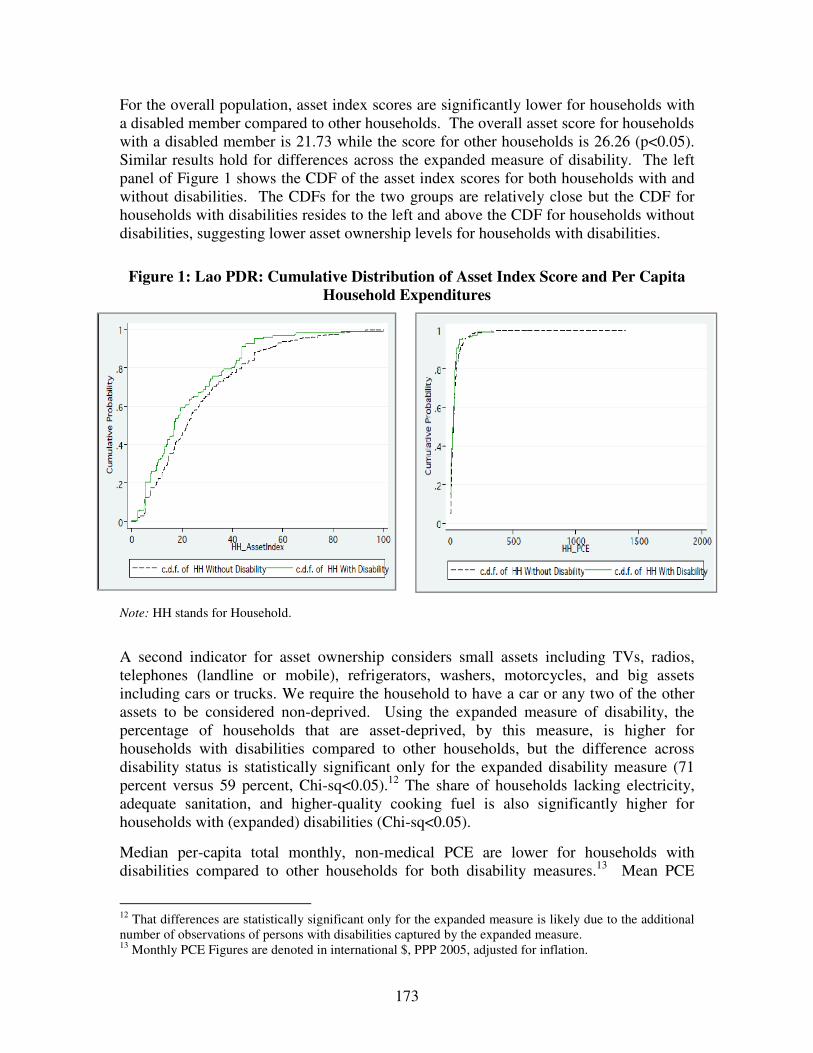
173
For the overall population, asset index scores are significantly lower for households with a disabled member compared to other households. The overall asset score for households with a disabled member is 21.73 while the score for other households is 26.26 (p<0.05). Similar results hold for differences across the expanded measure of disability. The left panel of Figure 1 shows the CDF of the asset index scores for both households with and without disabilities. The CDFs for the two groups are relatively close but the CDF for households with disabilities resides to the left and above the CDF for households without disabilities, suggesting lower asset ownership levels for households with disabilities.
Figure 1: Lao PDR: Cumulative Distribution of Asset Index Score and Per Capita Household Expenditures
Note: HH stands for Household.
A second indicator for asset ownership considers small assets including TVs, radios, telephones (landline or mobile), refrigerators, washers, motorcycles, and big assets including cars or trucks. We require the household to have a car or any two of the other assets to be considered non-deprived. Using the expanded measure of disability, the percentage of households that are asset-deprived, by this measure, is higher for households with disabilities compared to other households, but the difference across disability status is statistically significant only for the expanded disability measure (71 percent versus 59 percent, Chi-sq<0.05).12 The share of households lacking electricity, adequate sanitation, and higher-quality cooking fuel is also significantly higher for households with (expanded) disabilities (Chi-sq<0.05).
Median per-capita total monthly, non-medical PCE are lower for households with disabilities compared to other households for both disability measures.13 Mean PCE
12 That differences are statistically significant only for the expanded measure is likely due to the additional number of observations of persons with disabilities captured by the expanded measure. 13 Monthly PCE Figures are denoted in international $, PPP 2005, adjusted for inflation.

174
across disability status are also lower for households with disabilities and the difference is statistically significant only when the expanded disability measure is used (mean PCE: US$30.75 versus US$38.67). The right panel of Figure 1 shows the cumulative distribution function of non-medical expenditures for both households with and without disabilities. Households with disabilities show a higher ratio of medical to total monthly expenditures (13 percent versus 11 percent), but this result is not statistically significant.
Disability and poverty (Tables 2, 3, and 4; Figures 2a, 2b, 3a, and 3b)
Poverty is compared across disability status using five different methods to identify the poor: a multidimensional method, the bottom asset index or PCE quintile, and living under US$1.25 or US$2.00 a day.
Multidimensional poverty rates are shown at the bottom of Table 2 and in Figure 2a. Individuals with disabilities face higher multidimensional poverty rates compared to persons without disabilities (72 percent versus 63 percent). Using the expanded definition of disability, this result holds and is statistically significant across rural/urban regions. The spider chart in Figure 2b compares individuals with disabilities to those without across each dimension used in this poverty measure. The plots represent deprivation rates for each dimension. The plot for persons with disabilities falls well outside of the plot for persons without disabilities in about half of the dimensions, suggesting higher rates of deprivation.
Figure 2a: Lao PDR: Multidimensional Poverty Rates for
Individuals with and without Disabilities
-
0.20
0.40
0.60
0.80
1.00
All Rural Urban
With Disability No Disability

175
Figure 2b: Lao PDR: Deprivation Rates across Multiple Dimensions for Individuals with and without Disabilities
-
0.20
0.40
0.60
0.80
1.00
Individual Not Employed
Individual has less than Primary
Education
PCE under $2/day
Medical Expense ratio > 10%
Household lacks electricity
Household lacks clean water
source
Household lacks adequate sanitation
Household lacks a hard floor
Household cooks on wood,
charcoal, or dung
Household is Asset Deprived
(see text)
With Disability No Disability
All households are ranked by their asset index score from the lowest (bottom) to the highest asset index score, and categorized by quintile (with cutoffs at the 20th, 40th, 60th, and 80th percentiles for the five quintiles). Then, the percentage of households with disabilities that are in the bottom quintile is presented and compared to the percentage of other households in the bottom quintile. For instance, if more than 20 percent of the households with disabilities are in the bottom quintile, households with disabilities are overrepresented in the bottom quintile. This procedure is repeated for PCE. As shown in Table 3, households with (expanded) disabilities are significantly overrepresented in the bottom asset index score quintile of all households, with 28 percent of households with disabilities forming part of this group, compared to 19 percent of households without disabilities (Chi-sq<0.05). Households with (expanded) disabilities are also overrepresented in the bottom PCE quintile of all households, with 26 percent of households with disabilities forming part of this group, compared to 19 percent of households without disabilities (Chi-sq<0.05).
Identifying poverty by comparing PCE to international poverty lines also shows a statistically significant difference across household disability status. Approximately 89 percent of households with (expanded) disabilities fall below the US$2 a day poverty line, compared to 83 percent of other households (Chi-sq<0.05). This difference across poverty status is not statistically significant when using the US$1.25 a day poverty line (73 percent versus 68 percent). Figures 3a and 3b illustrate poverty comparisons across disability for the US$1.25 and US$2 a day poverty lines.
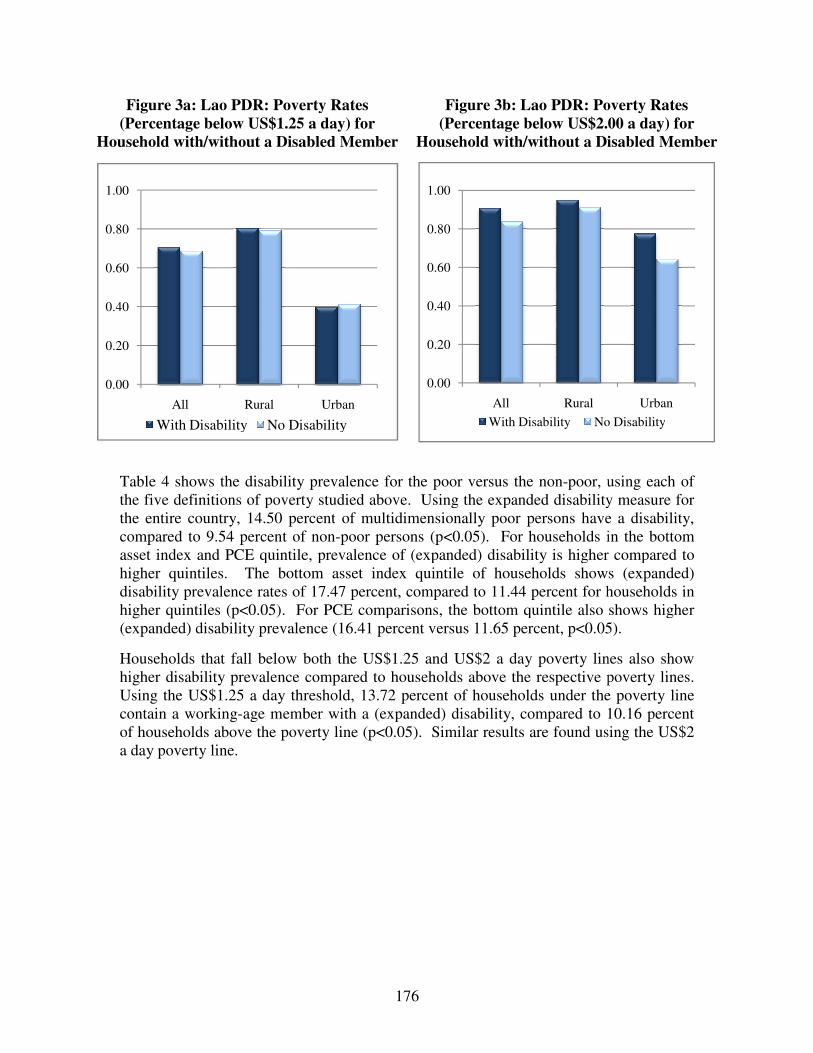
Figure 3a: Lao PDR: Poverty Rates (Percentage below US$1.25 a
Household with/without a Disabled Member
Table 4 shows the disability prevalence for the five definitions of poverty studied above. the entire country, 14.50 percentcompared to 9.54 percent of nonasset index and PCE quintile, prevalence of (expanded) disability is higher compared to higher quintiles. The bottom asset index quintile of households shows (expanded) disability prevalence rates of 17.47higher quintiles (p<0.05). For PCE comparisons, the bottom quintile also shows higher (expanded) disability prevalence (16.41 percent versus
Households that fall below both the higher disability prevalence compared to households above the respective poverty lines. Using the US$1.25 a day threshold, 13.72 percentcontain a working-age member with a (expanded) disabof households above the poverty line (p<0.05). a day poverty line.
0.00
0.20
0.40
0.60
0.80
1.00
All Rural
With Disability No Disability
176
Lao PDR: Poverty Rates US$1.25 a day) for
without a Disabled Member
Figure 3b: Lao PDR: Poverty Rates (Percentage below US$2.00 a day) for
Household with/without a Disabled Member
4 shows the disability prevalence for the poor versus the non-poor, using each of
the five definitions of poverty studied above. Using the expanded disability measure for percent of multidimensionally poor persons haveof non-poor persons (p<0.05). For households in the bottom
asset index and PCE quintile, prevalence of (expanded) disability is higher compared to The bottom asset index quintile of households shows (expanded)
disability prevalence rates of 17.47 percent, compared to 11.44 percent for households in For PCE comparisons, the bottom quintile also shows higher
d) disability prevalence (16.41 percent versus 11.65 percent, p<0.05).
Households that fall below both the US$1.25 and US$2 a day poverty lines also show higher disability prevalence compared to households above the respective poverty lines.
he US$1.25 a day threshold, 13.72 percent of households under the poverty line age member with a (expanded) disability, compared to 10.16 percent
of households above the poverty line (p<0.05). Similar results are found using the
Urban
No Disability
0.00
0.20
0.40
0.60
0.80
1.00
All Rural
With Disability No Disability
Lao PDR: Poverty Rates US$2.00 a day) for
without a Disabled Member
poor, using each of Using the expanded disability measure for
of multidimensionally poor persons have a disability, For households in the bottom
asset index and PCE quintile, prevalence of (expanded) disability is higher compared to The bottom asset index quintile of households shows (expanded)
for households in For PCE comparisons, the bottom quintile also shows higher
, p<0.05).
day poverty lines also show higher disability prevalence compared to households above the respective poverty lines.
of households under the poverty line , compared to 10.16 percent
Similar results are found using the US$2
Urban
No Disability
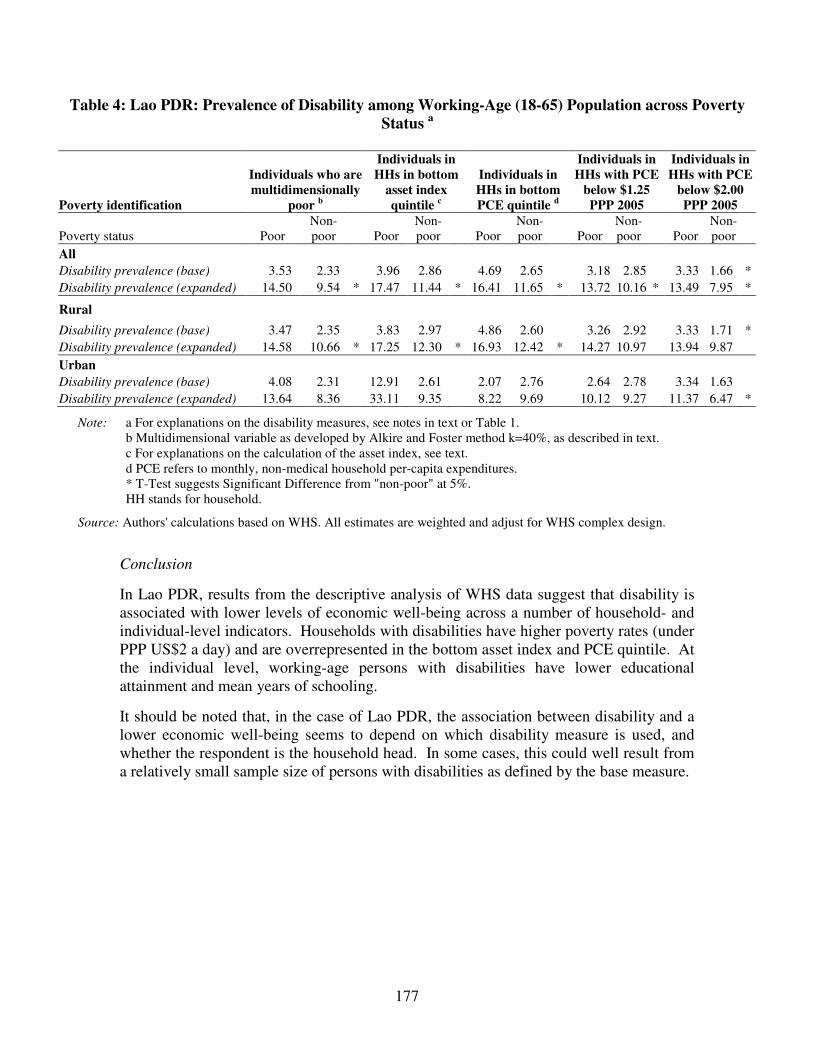
177
Table 4: Lao PDR: Prevalence of Disability among Working-Age (18-65) Population across Poverty Status a
Poverty identification
Individuals who are multidimensionally
poor b
Individuals in HHs in bottom
asset index quintile c
Individuals in HHs in bottom PCE quintile d
Individuals in HHs with PCE
below $1.25 PPP 2005
Individuals in HHs with PCE
below $2.00 PPP 2005
Poverty status Poor Non-poor Poor
Non-poor Poor
Non-poor Poor
Non-poor Poor
Non-poor
All Disability prevalence (base) 3.53 2.33 3.96 2.86 4.69 2.65 3.18 2.85 3.33 1.66 * Disability prevalence (expanded) 14.50 9.54 * 17.47 11.44 * 16.41 11.65 * 13.72 10.16 * 13.49 7.95 *
Rural
Disability prevalence (base) 3.47 2.35 3.83 2.97 4.86 2.60 3.26 2.92 3.33 1.71 * Disability prevalence (expanded) 14.58 10.66 * 17.25 12.30 * 16.93 12.42 * 14.27 10.97 13.94 9.87
Urban Disability prevalence (base) 4.08 2.31 12.91 2.61 2.07 2.76 2.64 2.78 3.34 1.63 Disability prevalence (expanded) 13.64 8.36 33.11 9.35 8.22 9.69 10.12 9.27 11.37 6.47 *
Note: a For explanations on the disability measures, see notes in text or Table 1. b Multidimensional variable as developed by Alkire and Foster method k=40%, as described in text. c For explanations on the calculation of the asset index, see text. d PCE refers to monthly, non-medical household per-capita expenditures. * T-Test suggests Significant Difference from "non-poor" at 5%. HH stands for household.
Source: Authors' calculations based on WHS. All estimates are weighted and adjust for WHS complex design.
Conclusion
In Lao PDR, results from the descriptive analysis of WHS data suggest that disability is associated with lower levels of economic well-being across a number of household- and individual-level indicators. Households with disabilities have higher poverty rates (under PPP US$2 a day) and are overrepresented in the bottom asset index and PCE quintile. At the individual level, working-age persons with disabilities have lower educational attainment and mean years of schooling.
It should be noted that, in the case of Lao PDR, the association between disability and a lower economic well-being seems to depend on which disability measure is used, and whether the respondent is the household head. In some cases, this could well result from a relatively small sample size of persons with disabilities as defined by the base measure.
178
C.2.3 Disability Profile: Pakistan Prevalence of disability among working-age population, 18-65 years (Table 1)
In Pakistan, disability prevalence among working-age individuals stands at 6.0 percent. With the expanded measure of disability, prevalence goes up to 7.6 percent.
Prevalence rates in rural areas are half those in urban areas (4.5 percent versus 9.0 percent respectively). Individuals in urban areas report higher rates of difficulty across every task compared to individuals in rural areas. Prevalence rates for women are triple those of men (9.1 percent versus 3.0 percent respectively for the standard disability measure). The discrepancy in gender is driven by the higher rates of difficulty for females for every task. Difficulties in moving around and concentrating/remembering things are the most common difficulties for men and women in rural and urban areas.
Demographic characteristics (Table 2)
In Pakistan, the disability status of an individual is related to the age and gender of the individual. Persons with disabilities are 74 percent female compared to 47 percent for persons without disabilities. The average individual with a disability is six years older than the average individual without a disability (mean age: 40 versus 34 years, p<0.05). The oldest age group (46-65 years) makes up 35 percent of working-age persons with disabilities, compared to only 20 percent for persons without disabilities (Chi-sq<0.05). There is no significant difference in marital status between persons with and without a disability.
Education and labor market status (Table 2)
Individuals with disabilities have lower educational attainment and employment rates. Persons with disabilities have 0.48 less years of education (mean years of education: 2.38 – 1.90 years, p<0.05) and lower completion rates of primary school compared to persons without disabilities (27 percent versus 42 percent for persons without disabilities, Chi-sq<0.05). This education gap is especially high in urban areas (35 percent versus 53 percent completion for non-disabled, Chi-sq<0.05).
Twenty-nine percent of persons with disabilities are employed, compared to 52 percent of persons without disabilities (Chi-sq<0.05). Again, the gap is greater in urban areas (23 percent versus 50 percent non-disabled employed, Chi-sq<0.05). Differences in the type of work that employed individuals do are not statistically significant across disability status.
Household characteristics, assets, living conditions, and expenditures (Table 3)
Comparing households with a working-age adult with a disability to other households, we find no significant difference in average household size, number of children, or percentage headed by a male member.

179
Table 1: Pakistan: Prevalence of Disability among Working-Age (18-65) Population
All Rural Urban
All Seeing/recognizing across the road 1.3% 1.0% 2.1% Seeing/recognizing at arm's length 1.4% 1.1% 1.9% Moving around 2.8% 1.9% 4.7% Concentrating/remembering things 2.6% 2.0% 3.9% Self-care 1.0% 0.9% 1.3% Personal relationships 1.2% 1.1% 1.3% Learning a new task 1.9% 1.6% 2.6% Dealing with conflict 1.6% 1.6% 1.6% Disability prevalence
a 6.0% 4.5% 9.0%
Disability prevalence (expanded) b 7.6% 6.2% 10.6%
Males Seeing/recognizing across the road 0.6% 0.4% 1.1% Seeing/recognizing at arm's length 0.4% 0.3% 0.7% Moving around 1.5% 1.4% 1.6% Concentrating/remembering things 1.3% 0.9% 2.1% Self-care 0.6% 0.7% 0.4% Personal relationships 0.5% 0.5% 0.6% Learning a new task 0.6% 0.4% 0.9% Dealing with conflict 1.1% 1.2% 1.0% Disability prevalence
a 3.0% 2.8% 3.6%
Disability prevalence (expanded) b 4.3% 4.1% 4.9%
Females Seeing/recognizing across the road 2.1% 1.6% 3.0% Seeing/recognizing at arm's length 2.4% 2.0% 3.0% Moving around 4.2% 2.5% 7.4% Concentrating/remembering things 4.0% 3.2% 5.5% Self-care 1.4% 1.0% 2.1% Personal relationships 1.9% 1.8% 2.0% Learning a new task 3.4% 2.9% 4.2% Dealing with conflict 2.1% 2.1% 2.1% Disability prevalence
a 9.1% 6.5% 13.9%
Disability prevalence (expanded) b 11.2% 8.6% 15.8%
Number of observations (unweighted) 5,281 3,147 2,134 Number of observations (weighted) 191,400,000 129,000,000 62,371,232
Note: a. Base measure of disability prevalence: A person is considered to have a disability as per the base measure if he/she reports that he/she is unable to do or has severe or extreme difficulty for at least one of the following: seeing/recognizing people across the road; moving around; concentrating or remembering things; or self care.
b. Expanded measure of disability prevalence: A person has a disability as per the expanded measure if he/she reports that he/she is unable to do or has severe or extreme difficulty for at least one of the following: seeing/recognizing people across the road; moving around; concentrating or remembering things; self care; seeing/recognizing object at arm's length; personal relationships/participation in the community; learning a new task; dealing with conflicts/tension with others.
Source: Authors' calculations based on WHS. All estimates are weighted and adjusted for WHS complex design.

180
Table 2: Pakistan: Sample Means across Disability Status among Working-Age (18-65) Individuals a b
By disability (base) By disability (expanded)
All Rural Urban All Rural Urban Yes No Yes No Yes No Yes No Yes No Yes No
Demographics Female 0.74 0.47 # 0.68 0.46 # 0.81 0.50 # 0.71 0.47 # 0.65 0.46 # 0.78 0.50 #
Male 0.26 0.53 # 0.32 0.54 # 0.19 0.50 # 0.29 0.53 # 0.35 0.54 # 0.22 0.50 #
Married 0.78 0.71 # 0.76 0.73 - 0.81 0.66 # 0.76 0.71 - 0.74 0.74 - 0.79 0.66 # Age 39.55 33.89 39.54 33.83 39.55 34.02 40.39 33.70 40.36 33.65 40.42 33.79 (1.14) (0.25) * (1.89) (0.26) * (1.20) (0.55) * (0.92) (0.25) * (1.44) (0.27) * (1.03) (0.57) *
18-30 0.31 0.51 # 0.35 0.51 # 0.28 0.50 # 0.29 0.52 # 0.32 0.52 # 0.26 0.51 #
31-45 0.34 0.29 # 0.27 0.29 # 0.41 0.29 # 0.33 0.29 # 0.27 0.30 # 0.41 0.29 #
46-65 0.35 0.20 # 0.38 0.19 # 0.31 0.21 # 0.38 0.19 # 0.42 0.18 # 0.33 0.20 # Urban 0.49 0.32 # - - 0.45 0.32 # - - Rural 0.51 0.68 # - - 0.55 0.68 # - - Education and labor market status Years of education 1.90 2.38 1.56 2.13 2.24 2.92 1.90 2.40 1.65 2.14 2.21 2.95 (0.10) (0.05) * (0.14) (0.04) * (0.17) (0.15) * (0.08) (0.05) * (0.10) (0.04) * (0.15) (0.15) * Less than primary school 0.73 0.58 # 0.80 0.63 # 0.65 0.47 # 0.72 0.57 # 0.78 0.63 # 0.66 0.46 #
Primary school completed 0.27 0.42 # 0.20 0.37 # 0.35 0.53 # 0.28 0.43 # 0.22 0.37 # 0.34 0.54 #
Not employed 0.71 0.48 # 0.64 0.47 # 0.77 0.50 # 0.70 0.47 # 0.65 0.46 # 0.76 0.49 #
Employed 0.29 0.52 # 0.36 0.53 # 0.23 0.50 # 0.30 0.53 # 0.35 0.54 # 0.24 0.51 #
Type of employment among the employed
Government 0.03 0.11 - 0.02 0.10 - 0.06 0.12 - 0.05 0.11 - 0.03 0.10 - 0.08 0.12 -
Non-government 0.23 0.19 - 0.20 0.14 - 0.30 0.31 - 0.24 0.19 - 0.20 0.14 - 0.31 0.31 - Self-employed 0.71 0.69 - 0.76 0.75 - 0.64 0.56 - 0.69 0.69 - 0.74 0.75 - 0.61 0.55 -
Employer 0.02 0.01 - 0.03 0.01 - - 0.01 - 0.01 0.01 - 0.02 0.01 - 0.00 0.01 -
Multidimensional Poverty Indicator
Multidimensionally poor (AF Method k/d=40%)
c 0.74 0.69 - 0.87 0.78 - 0.61 0.48 # 0.75 0.68 # 0.88 0.78 # 0.61 0.47 #
Number of observations
(unweighted) 320 4,961 147 3,000 173 1,961 410 4,836 196 2,929 214 1,907
Note: a For details on the disability measures, see notes in Table 1. b Standard deviations are in parentheses and are adjusted for survey clustering and stratification, estimates are weighted. c Multidimensional measure developed by Alkire and Foster method k/d=40%, as described in text. * T-Test suggests significant difference from "No" at 5%.
# Pearson's Chi-Sq Test, p-value less than 5%.
Source: Authors' calculations based on WHS. All estimates are weighted and adjust for WHS complex design.

181
Table 3: Pakistan: Characteristics and Economic Well-being of Households across Disability Status a b
By Disability By Disability (Expanded)
All Rural Urban All Rural Urban
HHs of working-
age adults with
disability
Other HHs
HHs of working-
age adults with
disability
Other HHs
HHs of working-
age adults with
disability
Other HHs
HHs of working-
age adults with
disability
Other HHs
HHs of working-
age adults with
disability
Other HHs
HHs of working-
age adults with
disability
Other HHs
Demographics
Household size 7.16 7.13 7.10 7.51 7.22 6.56 7.34 7.05 7.40 7.51 7.25 6.25
(0.23) (0.18) - (0.27) (0.06) - (0.40) (0.41) - (0.19) (0.17) - (0.20) (0.06) - (0.36) (0.33) -
Number of children 0-17 3.53 3.37 3.37 3.61 3.71 3.02 3.58 3.31 3.52 3.60 3.67 2.81
(0.27) (0.11) - (0.32) (0.05) - (0.47) (0.24) - (0.21) (0.10) - (0.22) (0.05) - (0.42) (0.18) -
Male headed household 0.97 0.98 - 0.95 0.98 - 0.98 0.98 - 0.97 0.98 - 0.96 0.98 - 0.98 0.98 -
Assets
Asset index c 40.61 36.05 32.92 29.94 49.20 45.14 40.35 35.50 33.35 29.80 49.50 45.70
(2.49) (1.34) * (3.32) (1.08) - (5.28) (3.89) - (2.50) (1.31) * (3.77) (1.02) - (4.67) (4.96) -
Asset Deprivation d 0.60 0.67 - 0.70 0.73 - 0.48 0.60 - 0.58 0.65 - 0.68 0.73 - 0.46 0.51 -
Living conditions d
Household lacks electricity 0.15 0.19 - 0.19 0.26 - 0.11 0.09 - 0.15 0.21 - 0.19 0.26 - 0.10 0.11 -
Household lacks clean water source 0.08 0.11 - 0.09 0.15 - 0.06 0.05 - 0.09 0.12 - 0.12 0.15 - 0.05 0.06 -
Household lacks adequate sanitation 0.33 0.52 # 0.37 0.56 # 0.30 0.45 - 0.33 0.48 # 0.37 0.56 # 0.27 0.34 -
Household lacks a hard floor 0.50 0.56 - 0.65 0.71 - 0.35 0.33 - 0.50 0.60 # 0.63 0.72 - 0.34 0.40 -
Household cooks on wood, charcoal, or dung
0.60 0.79 # 0.82 0.89 # 0.37 0.64 # 0.61 0.78 # 0.80 0.89 # 0.37 0.57 #
Household non-medical PCE (International $, PPP 2005)
Mean 53.25 45.80 54.88 39.35 51.43 55.29 49.69 47.59 48.52 39.50 51.22 61.78
(6.80) (2.79) - (9.21) (0.81) - (6.05) (7.98) - (5.15) (2.75) - (7.15) (0.82) - (5.30) (8.65) -
Median 37.72 33.01 37.72 32.82 40.74 33.95 36.31 34.76 33.95 33.01 42.12 42.44
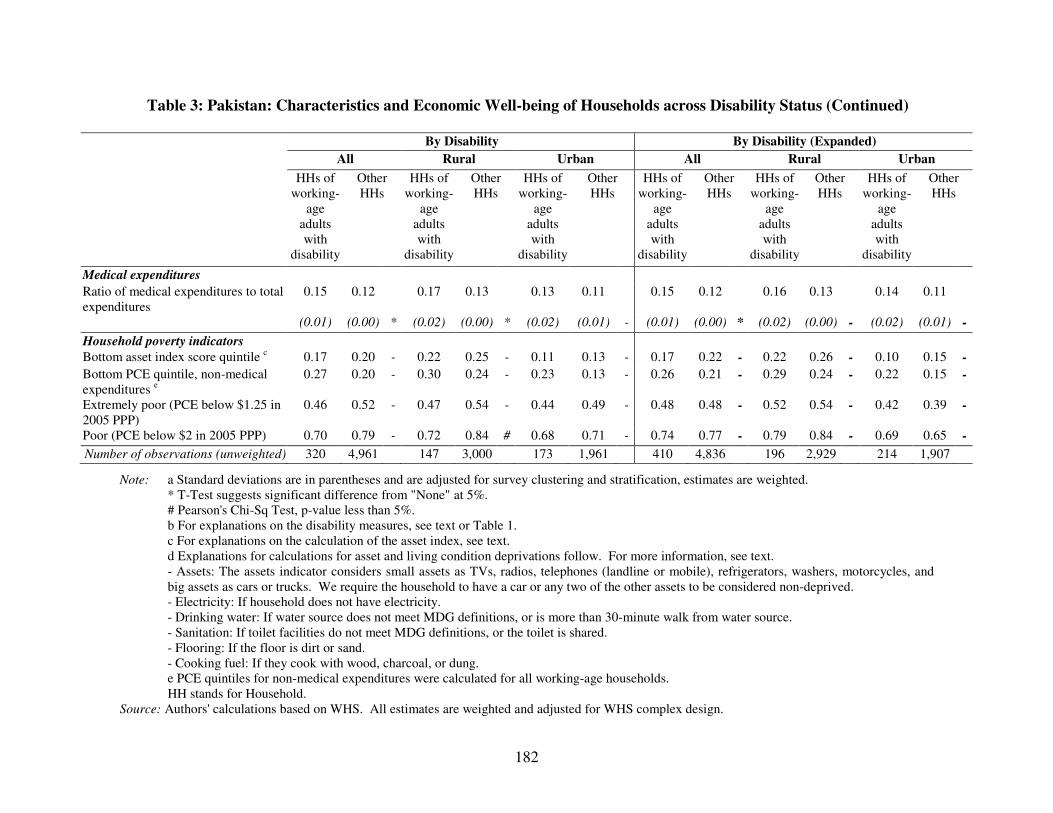
182
Table 3: Pakistan: Characteristics and Economic Well-being of Households across Disability Status (Continued)
By Disability By Disability (Expanded)
All Rural Urban All Rural Urban
HHs of working-
age adults with
disability
Other HHs
HHs of working-
age adults with
disability
Other HHs
HHs of working-
age adults with
disability
Other HHs
HHs of working-
age adults with
disability
Other HHs
HHs of working-
age adults with
disability
Other HHs
HHs of working-
age adults with
disability
Other HHs
Medical expenditures
Ratio of medical expenditures to total expenditures
0.15 0.12 0.17 0.13 0.13 0.11 0.15 0.12 0.16 0.13 0.14 0.11
(0.01) (0.00) * (0.02) (0.00) * (0.02) (0.01) - (0.01) (0.00) * (0.02) (0.00) - (0.02) (0.01) -
Household poverty indicators
Bottom asset index score quintile c 0.17 0.20 - 0.22 0.25 - 0.11 0.13 - 0.17 0.22 - 0.22 0.26 - 0.10 0.15 -
Bottom PCE quintile, non-medical expenditures e
0.27 0.20 - 0.30 0.24 - 0.23 0.13 - 0.26 0.21 - 0.29 0.24 - 0.22 0.15 -
Extremely poor (PCE below $1.25 in 2005 PPP)
0.46 0.52 - 0.47 0.54 - 0.44 0.49 - 0.48 0.48 - 0.52 0.54 - 0.42 0.39 -
Poor (PCE below $2 in 2005 PPP) 0.70 0.79 - 0.72 0.84 # 0.68 0.71 - 0.74 0.77 - 0.79 0.84 - 0.69 0.65 -
Number of observations (unweighted) 320 4,961 147 3,000 173 1,961 410 4,836 196 2,929 214 1,907
Note: a Standard deviations are in parentheses and are adjusted for survey clustering and stratification, estimates are weighted. * T-Test suggests significant difference from "None" at 5%.
# Pearson's Chi-Sq Test, p-value less than 5%. b For explanations on the disability measures, see text or Table 1. c For explanations on the calculation of the asset index, see text. d Explanations for calculations for asset and living condition deprivations follow. For more information, see text. - Assets: The assets indicator considers small assets as TVs, radios, telephones (landline or mobile), refrigerators, washers, motorcycles, and big assets as cars or trucks. We require the household to have a car or any two of the other assets to be considered non-deprived. - Electricity: If household does not have electricity. - Drinking water: If water source does not meet MDG definitions, or is more than 30-minute walk from water source. - Sanitation: If toilet facilities do not meet MDG definitions, or the toilet is shared. - Flooring: If the floor is dirt or sand. - Cooking fuel: If they cook with wood, charcoal, or dung. e PCE quintiles for non-medical expenditures were calculated for all working-age households. HH stands for Household.
Source: Authors' calculations based on WHS. All estimates are weighted and adjusted for WHS complex design.
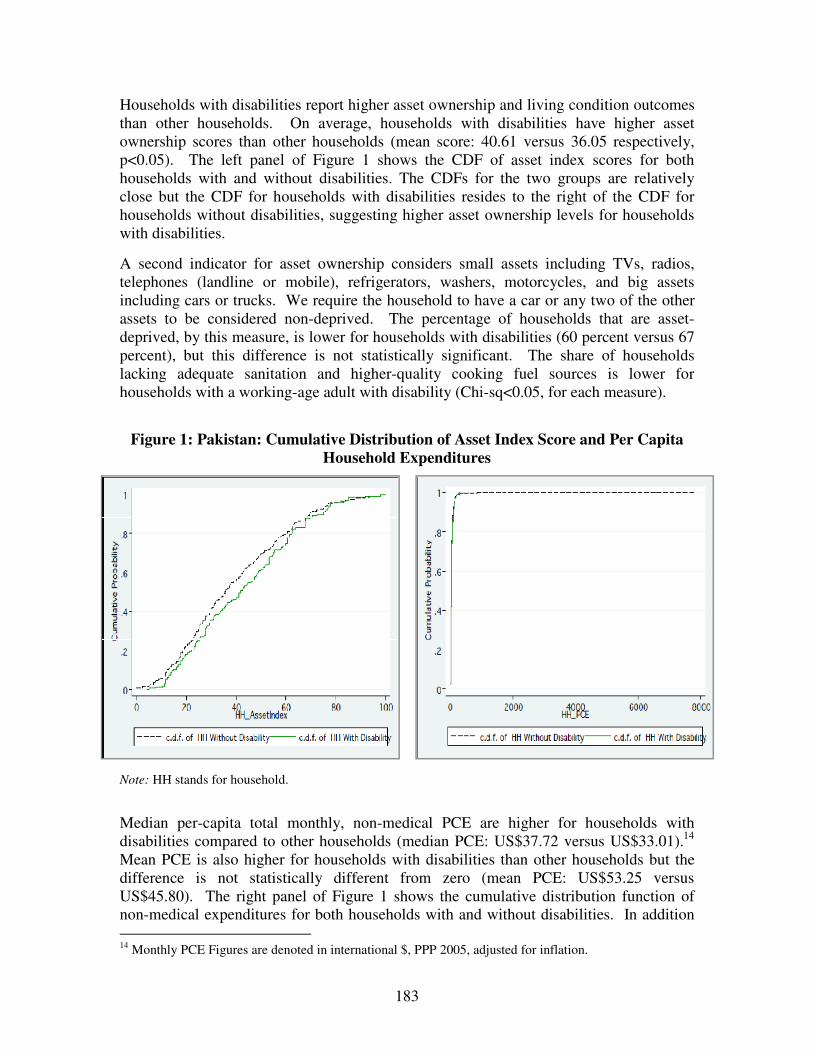
183
Households with disabilities report higher asset ownership and living condition outcomes than other households. On average, households with disabilities have higher asset ownership scores than other households (mean score: 40.61 versus 36.05 respectively, p<0.05). The left panel of Figure 1 shows the CDF of asset index scores for both households with and without disabilities. The CDFs for the two groups are relatively close but the CDF for households with disabilities resides to the right of the CDF for households without disabilities, suggesting higher asset ownership levels for households with disabilities.
A second indicator for asset ownership considers small assets including TVs, radios, telephones (landline or mobile), refrigerators, washers, motorcycles, and big assets including cars or trucks. We require the household to have a car or any two of the other assets to be considered non-deprived. The percentage of households that are asset-deprived, by this measure, is lower for households with disabilities (60 percent versus 67 percent), but this difference is not statistically significant. The share of households lacking adequate sanitation and higher-quality cooking fuel sources is lower for households with a working-age adult with disability (Chi-sq<0.05, for each measure).
Figure 1: Pakistan: Cumulative Distribution of Asset Index Score and Per Capita
Household Expenditures
Note: HH stands for household.
Median per-capita total monthly, non-medical PCE are higher for households with disabilities compared to other households (median PCE: US$37.72 versus US$33.01).14 Mean PCE is also higher for households with disabilities than other households but the difference is not statistically different from zero (mean PCE: US$53.25 versus US$45.80). The right panel of Figure 1 shows the cumulative distribution function of non-medical expenditures for both households with and without disabilities. In addition 14 Monthly PCE Figures are denoted in international $, PPP 2005, adjusted for inflation.
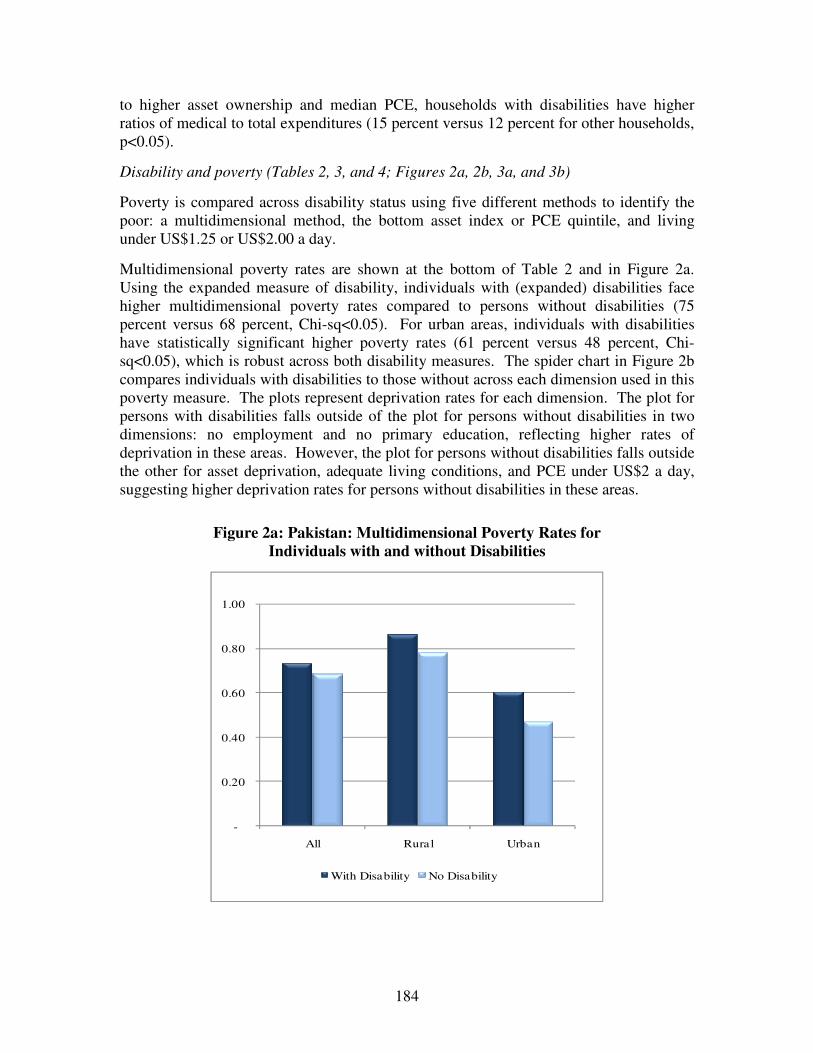
184
to higher asset ownership and median PCE, households with disabilities have higher ratios of medical to total expenditures (15 percent versus 12 percent for other households, p<0.05).
Disability and poverty (Tables 2, 3, and 4; Figures 2a, 2b, 3a, and 3b)
Poverty is compared across disability status using five different methods to identify the poor: a multidimensional method, the bottom asset index or PCE quintile, and living under US$1.25 or US$2.00 a day.
Multidimensional poverty rates are shown at the bottom of Table 2 and in Figure 2a. Using the expanded measure of disability, individuals with (expanded) disabilities face higher multidimensional poverty rates compared to persons without disabilities (75 percent versus 68 percent, Chi-sq<0.05). For urban areas, individuals with disabilities have statistically significant higher poverty rates (61 percent versus 48 percent, Chi-sq<0.05), which is robust across both disability measures. The spider chart in Figure 2b compares individuals with disabilities to those without across each dimension used in this poverty measure. The plots represent deprivation rates for each dimension. The plot for persons with disabilities falls outside of the plot for persons without disabilities in two dimensions: no employment and no primary education, reflecting higher rates of deprivation in these areas. However, the plot for persons without disabilities falls outside the other for asset deprivation, adequate living conditions, and PCE under US$2 a day, suggesting higher deprivation rates for persons without disabilities in these areas.
Figure 2a: Pakistan: Multidimensional Poverty Rates for
Individuals with and without Disabilities
-
0.20
0.40
0.60
0.80
1.00
All Rural Urban
With Disability No Disability

185
Figure 2b: Pakistan: Deprivation Rates across Multiple Dimensions for Individuals with and without Disabilities
-
0.20
0.40
0.60
0.80
1.00
Individual Not Employed
Individual has less than Primary
Education
PCE under $2/day
Medical Expense ratio > 10%
Household lacks electricity
Household lacks clean water
source
Household lacks adequate sanitation
Household lacks a hard floor
Household cooks on wood,
charcoal, or …
Household is Asset Deprived
(see text)
With Disability No Disability
All households are ranked by their asset index score from the lowest (bottom) to the highest asset index score, and categorized by quintile (with cutoffs at the 20th, 40th, 60th, and 80th percentiles for the five quintiles). Then, the percentage of households with disabilities that are in the bottom quintile is presented and compared to the percentage of other households in the bottom quintile. For instance, if more than 20 percent of the households with disabilities are in the bottom quintile, households with disabilities are overrepresented in the bottom quintile. This procedure is repeated for PCE. As shown in Table 3, households show no statistically significant difference in neither representation of the bottom asset index quintile nor the bottom PCE quintile, with both groups close to the expected 20 percent.
Identifying poverty by comparing PCE to international poverty lines shows no statistically significant difference across household disability status. Figures 3a and 3b illustrate poverty comparisons across disability for the US$1.25 and US$2 a day poverty lines.
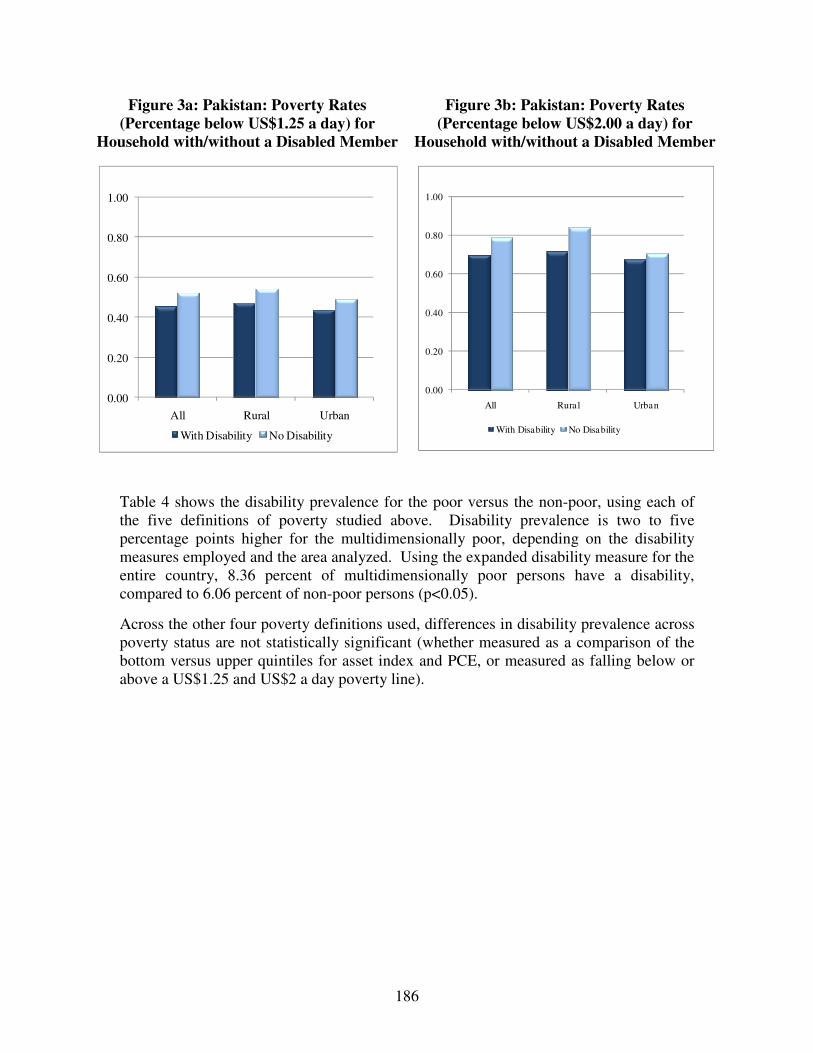
186
Figure 3a: Pakistan: Poverty Rates (Percentage below US$1.25 a day) for
Household with/without a Disabled Member
Figure 3b: Pakistan: Poverty Rates (Percentage below US$2.00 a day) for
Household with/without a Disabled Member
0.00
0.20
0.40
0.60
0.80
1.00
All Rural Urban
With Disability No Disability
0.00
0.20
0.40
0.60
0.80
1.00
All Rural Urban
With Disability No Disability
Table 4 shows the disability prevalence for the poor versus the non-poor, using each of the five definitions of poverty studied above. Disability prevalence is two to five percentage points higher for the multidimensionally poor, depending on the disability measures employed and the area analyzed. Using the expanded disability measure for the entire country, 8.36 percent of multidimensionally poor persons have a disability, compared to 6.06 percent of non-poor persons (p<0.05).
Across the other four poverty definitions used, differences in disability prevalence across poverty status are not statistically significant (whether measured as a comparison of the bottom versus upper quintiles for asset index and PCE, or measured as falling below or above a US$1.25 and US$2 a day poverty line).
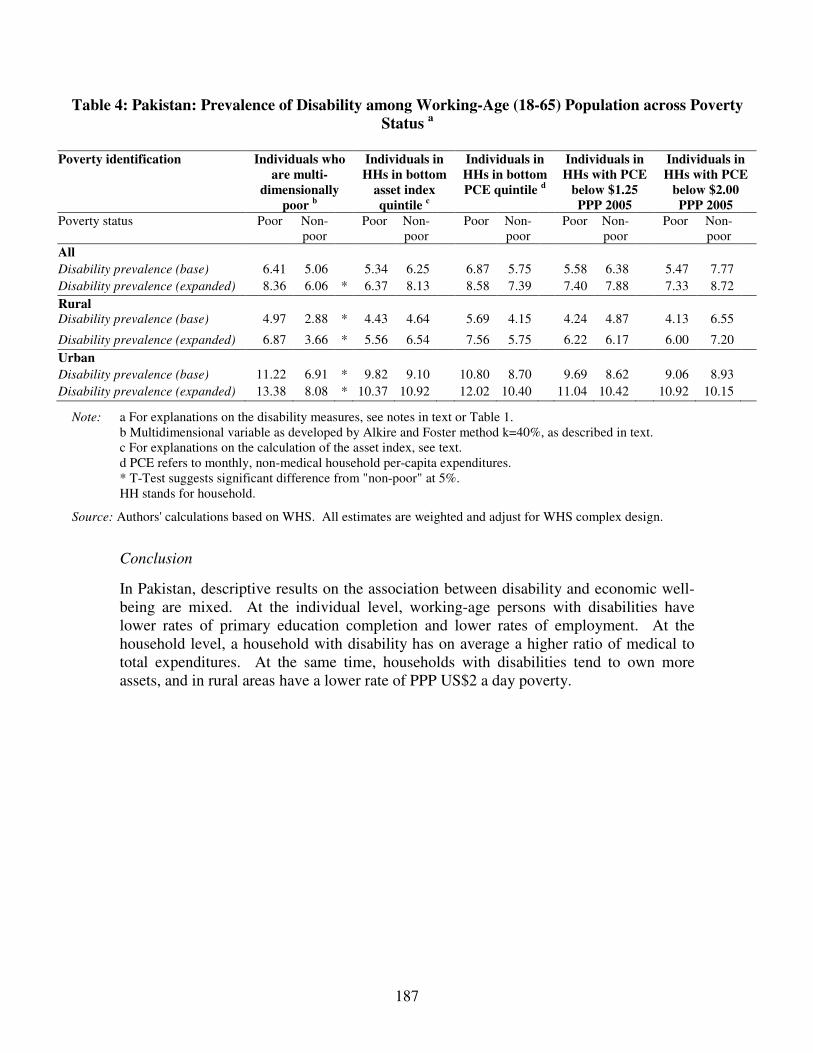
187
Table 4: Pakistan: Prevalence of Disability among Working-Age (18-65) Population across Poverty Status a
Poverty identification Individuals who
are multi-dimensionally
poor b
Individuals in HHs in bottom
asset index quintile c
Individuals in HHs in bottom PCE quintile d
Individuals in HHs with PCE
below $1.25 PPP 2005
Individuals in HHs with PCE
below $2.00 PPP 2005
Poverty status Poor Non-poor
Poor Non-poor
Poor Non-poor
Poor Non-poor
Poor Non-poor
All Disability prevalence (base) 6.41 5.06 5.34 6.25 6.87 5.75 5.58 6.38 5.47 7.77 Disability prevalence (expanded) 8.36 6.06 * 6.37 8.13 8.58 7.39 7.40 7.88 7.33 8.72
Rural Disability prevalence (base) 4.97 2.88 * 4.43 4.64 5.69 4.15 4.24 4.87 4.13 6.55
Disability prevalence (expanded) 6.87 3.66 * 5.56 6.54 7.56 5.75 6.22 6.17 6.00 7.20
Urban Disability prevalence (base) 11.22 6.91 * 9.82 9.10 10.80 8.70 9.69 8.62 9.06 8.93 Disability prevalence (expanded) 13.38 8.08 * 10.37 10.92 12.02 10.40 11.04 10.42 10.92 10.15
Note: a For explanations on the disability measures, see notes in text or Table 1. b Multidimensional variable as developed by Alkire and Foster method k=40%, as described in text. c For explanations on the calculation of the asset index, see text. d PCE refers to monthly, non-medical household per-capita expenditures. * T-Test suggests significant difference from "non-poor" at 5%. HH stands for household.
Source: Authors' calculations based on WHS. All estimates are weighted and adjust for WHS complex design.
Conclusion
In Pakistan, descriptive results on the association between disability and economic well-being are mixed. At the individual level, working-age persons with disabilities have lower rates of primary education completion and lower rates of employment. At the household level, a household with disability has on average a higher ratio of medical to total expenditures. At the same time, households with disabilities tend to own more assets, and in rural areas have a lower rate of PPP US$2 a day poverty.

188
C.2.4 Disability Profile: Philippines Prevalence of disability among working-age population, 18-65 years (Table 1)
In the Philippines, disability prevalence among working-age individuals stands at 8.5 percent. With the expanded measure of disability, prevalence goes up to 12.1 percent.
Prevalence rates are higher in rural than in urban areas (9.8 percent versus 7.7 percent respectively), as are rates for women compared to men (9.3 percent versus 7.7 percent respectively). When using the expanded measure of disability, prevalence rates increase by three to four percentage points for both males and females. This jump in rates is due to the relatively higher rates of reported difficulty in learning a new task and seeing/recognizing at arm’s length, which are components of the expanded definition of disability. Difficulties in concentrating/remembering things are reported at higher rates than all other tasks.
Demographic characteristics (Table 2)
Age and gender characteristics differ significantly across disability. Persons with disabilities are 55 percent female compared to 49 percent for persons without disabilities (Chi-sq<0.05). The average individual with a disability is seven years older than the average individual without a disability (mean age: 41 versus 34 years, p<0.05). The oldest age group (46-65 years) makes up 39 percent of working-age persons with disabilities, compared to only 20 percent for persons without disabilities (Chi-sq<0.05). In both groups, more than 60 percent of individuals are married.
Education and labor market status (Table 2)
Individuals with disabilities have lower educational attainment and employment compared to other individuals. Persons with disabilities have 3.41 years of education, compared to 3.73 years for persons without disabilities (p<0.05). As a group, individuals with disabilities have lower primary school completion rates compared to persons without disabilities (76 percent versus 86 percent, Chi-sq<0.05).
Forty-nine percent of persons with disabilities are employed, compared to 55 percent of persons without disabilities (Chi-sq<0.05). Differences in the type of work that employed individuals do are also statistically significant across disability status, as persons with disabilities rely more on self-employment compared to persons without (62 percent versus 50 percent, Chi-sq<0.05).
Household characteristics, assets, living conditions, and expenditures (Table 3)
Comparing households with a working-age adult with a disability to other households, we find no significant difference in average household size or number of children. However, a lower percentage of households with disabilities are headed by a male member (83 percent versus 86 percent for other households, Chi-sq<0.05).

189
Table 1: Philippines: Prevalence of Disability among Working-Age (18-65) Population
All Rural Urban
All Seeing/recognizing across the road 3.6% 4.0% 3.3% Seeing/recognizing at arm's length 3.6% 4.5% 3.1% Moving around 2.1% 2.9% 1.6% Concentrating/remembering things 3.9% 4.6% 3.5% Self-care 0.8% 1.0% 0.7% Personal relationships 1.6% 1.9% 1.3% Learning a new task 2.9% 4.2% 2.1% Dealing with conflict 1.7% 2.1% 1.5% Disability prevalence
a 8.5% 9.8% 7.7%
Disability prevalence (expanded)b 12.1% 14.0% 10.9%
Males Seeing/recognizing across the road 3.2% 3.3% 3.1% Seeing/recognizing at arm's length 3.2% 3.7% 2.8% Moving around 1.9% 2.4% 1.5% Concentrating/remembering things 3.5% 4.4% 2.8% Self-care 0.7% 1.0% 0.5% Personal relationships 1.5% 2.0% 1.2% Learning a new task 2.7% 3.7% 2.1% Dealing with conflict 1.7% 2.3% 1.4% Disability prevalence
a 7.7% 9.0% 6.9%
Disability prevalence (expanded)b 10.9% 12.9% 9.6%
Females Seeing/recognizing across the road 4.0% 4.7% 3.6% Seeing/recognizing at arm's length 4.1% 5.3% 3.4% Moving around 2.3% 3.3% 1.6% Concentrating/remembering things 4.4% 4.8% 4.1% Self-care 1.0% 1.1% 0.9% Personal relationships 1.6% 1.8% 1.5% Learning a new task 3.0% 4.6% 2.1% Dealing with conflict 1.6% 1.8% 1.5% Disability prevalence
a 9.3% 10.6% 8.5%
Disability prevalence (expanded)b 13.3% 15.2% 12.2%
Number of observations (unweighted) 9,154 3,728 5,426 Number of observations (weighted) 76,880,688 29,516,106 47,364,582
Note: a. Base measure of disability prevalence: A person is considered to have a disability as per the base measure if he/she reports that he/she is unable to do or has severe or extreme difficulty for at least one of the following: seeing/recognizing people across the road; moving around; concentrating or remembering things; or self care.
b. Expanded measure of disability prevalence: A person has a disability as per the expanded measure if he/she reports that he/she is unable to do or has severe or extreme difficulty for at least one of the following: seeing/recognizing people across the road; moving around; concentrating or remembering things; self care; seeing/recognizing object at arm's length; personal relationships/participation in the community; learning a new task; or dealing with conflicts/tension with others.
Source: Authors' calculations based on WHS. All estimates are weighted and adjusted for WHS complex design.

190
Table 2: Philippines: Sample Means across Disability Status among Working-Age (18-65) Individuals a b
By disability (base) By disability (expanded)
All Rural Urban All Rural Urban
Yes No Yes No Yes No Yes No Yes No Yes No
Demographics Female 0.55 0.49 # 0.53 0.49 - 0.56 0.50 - 0.55 0.49 # 0.53 0.48 - 0.56 0.50 #
Male 0.45 0.51 # 0.47 0.51 - 0.44 0.50 - 0.45 0.51 # 0.47 0.52 - 0.44 0.50 #
Married 0.65 0.61 - 0.68 0.66 - 0.62 0.58 - 0.65 0.61 # 0.70 0.65 - 0.62 0.58 -
Age 40.59 34.34 42.34 34.97 39.21 33.96 40.09 34.16 41.96 34.67 38.58 33.85
(0.67) (0.19) * (0.94) (0.33) * (0.91) (0.23) * (0.60) (0.19) * (0.79) (0.34) * (0.83) (0.23) *
18-30 0.31 0.46 # 0.25 0.43 # 0.35 0.48 # 0.32 0.46 # 0.25 0.43 # 0.37 0.48 #
31-45 0.30 0.34 # 0.30 0.36 # 0.30 0.33 # 0.30 0.34 # 0.32 0.36 # 0.28 0.33 #
46-65 0.39 0.20 # 0.45 0.21 # 0.35 0.19 # 0.38 0.19 # 0.43 0.20 # 0.35 0.19 #
Urban 0.56 0.62 - - - 0.55 0.62 # - -
Rural 0.44 0.38 - - - 0.45 0.38 # - -
Education and labor market status
Years of education 3.41 3.73 3.03 3.41 3.71 3.92 3.41 3.74 3.03 3.43 3.72 3.93
(0.06) (0.03) * (0.07) (0.05) * (0.08) (0.03) * (0.06) (0.03) * (0.07) (0.05) * (0.08) (0.03) *
Less than primary school
0.24 0.14 # 0.34 0.22 # 0.16 0.09 # 0.23 0.13 # 0.33 0.22 # 0.14 0.09 #
Primary school completed
0.76 0.86 # 0.66 0.78 # 0.84 0.91 # 0.77 0.87 # 0.67 0.78 # 0.86 0.91 #
Not employed 0.51 0.45 # 0.46 0.42 - 0.55 0.47 # 0.50 0.45 # 0.46 0.42 - 0.54 0.47 #
Employed 0.49 0.55 # 0.54 0.58 - 0.45 0.53 # 0.50 0.55 # 0.54 0.58 - 0.46 0.53 #
Type of employment among the employed
. Government 0.10 0.11 # 0.11 0.10 - 0.09 0.11 # 0.11 0.10 # 0.12 0.10 - 0.10 0.11 #
. Non-government 0.19 0.31 # 0.13 0.19 - 0.24 0.40 # 0.21 0.32 # 0.13 0.19 - 0.28 0.40 #
. Self-employed 0.62 0.50 # 0.67 0.63 - 0.57 0.42 # 0.60 0.50 # 0.66 0.62 - 0.54 0.42 #
. Employer 0.09 0.08 # 0.08 0.08 - 0.10 0.07 # 0.09 0.08 # 0.09 0.08 - 0.08 0.07 #
Multidimensional Poverty Indicator
Multidimensionally poor (AF Method
k/d=40%)c
0.44 0.31 # 0.58 0.45 # 0.33 0.23 # 0.43 0.31 # 0.58 0.44 # 0.31 0.22 #
Number of
observations
(unweighted)
852 8,302 399 3,329 453 4,973 1,182 7,955 556 3,166 626 4,789
Note: a For details on the disability measures, see notes in Table 1. b Standard deviations are in parentheses and are adjusted for survey clustering and stratification, estimates are weighted. c Multidimensional measure developed by Alkire and Foster method k/d=40%, as described in text. * T-Test suggests significant difference from "No" at 5%. # Pearson's Chi-Sq Test, p-value less than 5%.
Source: Authors' calculations based on WHS. All estimates are weighted and adjust for WHS complex design.

191
Table 3: Philippines: Characteristics and Economic Well-being of Households across Disability Status a b
By disability (base) By disability (expanded)
All Rural Urban All Rural Urban HHs of
working-age
adults with
disability
Other HHs
HHs of working-
age adults with
disability
Other HHs
HHs of working-
age adults with
disability
Other HHs
HHs of working-
age adults with
disability
Other HHs
HHs of working-
age adults with
disability
Other HHs
HHs of working-
age adults with
disability
Other HHs
Demographics Household size 5.25 5.34 5.31 5.33 5.19 5.34 5.29 5.33 5.32 5.33 5.27 5.34 (0.12) (0.04) - (0.17) (0.06) - (0.16) (0.06) - (0.10) (0.04) - (0.14) (0.06) - (0.14) (0.05) -
Number of children 0-17 2.30 2.35 2.43 2.47 2.19 2.27 2.32 2.35 2.40 2.47 2.25 2.26 (0.09) (0.03) - (0.14) (0.05) - (0.11) (0.04) - (0.08) (0.03) - (0.12) (0.05) - (0.10) (0.04) - Male headed household 0.83 0.86 # 0.88 0.90 - 0.79 0.84 # 0.83 0.86 # 0.88 0.90 - 0.79 0.84 #
Assets Asset index c 47.23 52.03 38.56 41.35 54.77 59.22 47.28 52.21 38.36 41.48 55.23 59.33 (1.15) (0.67) * (1.26) (1.17) * (1.45) (0.79) * (1.05) (0.68) * (1.25) (1.20) * (1.29) (0.80) *
Asset deprivation d 0.53 0.42 # 0.68 0.60 # 0.39 0.30 # 0.53 0.41 # 0.70 0.59 # 0.38 0.30 #
Living conditions d
Household lacks electricity 0.25 0.20 # 0.37 0.36 - 0.15 0.09 # 0.26 0.20 # 0.40 0.35 - 0.13 0.09 # Household lacks clean water
source 0.16 0.14 - 0.16 0.14 - 0.16 0.13 - 0.16 0.14 - 0.16 0.14 - 0.15 0.13 -
Household lacks adequate sanitation 0.27 0.25 - 0.27 0.29 - 0.27 0.22 - 0.27 0.25 - 0.28 0.29 - 0.26 0.22 #
Household lacks a hard floor 0.10 0.07 - 0.13 0.12 - 0.06 0.04 - 0.09 0.07 - 0.13 0.12 - 0.05 0.04 -
Household cooks on wood, charcoal, or dung 0.53 0.41 # 0.77 0.67 # 0.33 0.23 # 0.52 0.41 # 0.75 0.67 # 0.32 0.23 #
Household non-medical PCE (International $, PPP 2005) Mean 49.89 53.37 38.21 40.51 60.11 61.93 48.18 53.80 37.41 40.78 57.81 62.34 (2.65) (1.70) - (4.19) (1.86) - (2.99) (2.55) - (2.21) (1.75) * (3.28) (1.93) - (2.75) (2.61) -
Median 31.45 37.57 23.59 30.32 46.50 46.94 31.45 37.74 24.76 30.40 42.45 47.17
Medical expenditures Ratio of medical expenditures to
total expenditures 0.11 0.08 0.12 0.07 0.11 0.08 0.10 0.08 0.11 0.07 0.10 0.08 (0.01) (0.00) * (0.01) (0.00) * (0.01) (0.00) * (0.01) (0.00) * (0.01) (0.00) * (0.01) (0.00) *

192
Table 3: Philippines: Characteristics and Economic Well-being of Households across Disability Status (Continued)
By disability (base) By disability (expanded)
All Rural Urban All Rural Urban
HHs of working-
age adults with
disability
Other HHs
HHs of working-
age adults with
disability
Other HHs
HHs of working-
age adults with
disability
Other HHs
HHs of working-age adults
with disability
Other HHs
HHs of working-
age adults with
disability
Other HHs
HHs of working-
age adults with
disability
Other HHs
Household Poverty Indicators
Bottom Asset Index Score Quintilec
0.39 0.37 - 0.13 0.08 #
Bottom PCE Quintile, non-medical expenditurese
0.38 0.28 # 0.18 0.13 #
Extremely poor (PCE below $1.25 in 2005 PPP) 0.49 0.43 # 0.65 0.58 # 0.34 0.32 - 0.50 0.42 # 0.64 0.58 - 0.37 0.32 -
Poor (PCE below $2 in 2005 PPP) 0.71 0.69 - 0.85 0.82 - 0.59 0.60 - 0.73 0.68 # 0.85 0.82 - 0.63 0.60 -
Number of observations
(unweighted) 852 8,302 399 3,329 453 4,973 1,182 7,955 556 3,166 626 4,789
Note: a Standard deviations are in parentheses and are adjusted for survey clustering and stratification, estimates are weighted. * T-Test suggests Significant Difference from "None" at 5%. # Pearson's Chi-Sq Test, p-value less than 5%. b For explanations on the disability measures, see text or Table 1. c For explanations on the calculation of the asset index, see text. d Explanations for calculations for asset and living condition deprivations follow. For more information, see text. - Assets: The assets indicator considers small assets as TVs, radios, telephones (landline or mobile), refrigerators, washers, motorcycles, and big assets as cars or trucks. We require the household to have a car or any two of the other assets to be considered non-deprived. - Electricity: If household does not have electricity. - Drinking water: If water source does not meet MDG definitions, or is more than 30-minute walk from water source. - Sanitation: If toilet facilities do not meet MDG definitions, or the toilet is shared. - Flooring: If the floor is dirt or sand. - Cooking fuel: If they cook with wood, charcoal, or dung. e PCE quintiles for non-medical expenditures were calculated for all working-age households. HH stands for Household.
Source: Authors' calculations based on WHS. All estimates are weighted and adjusted for WHS complex design.
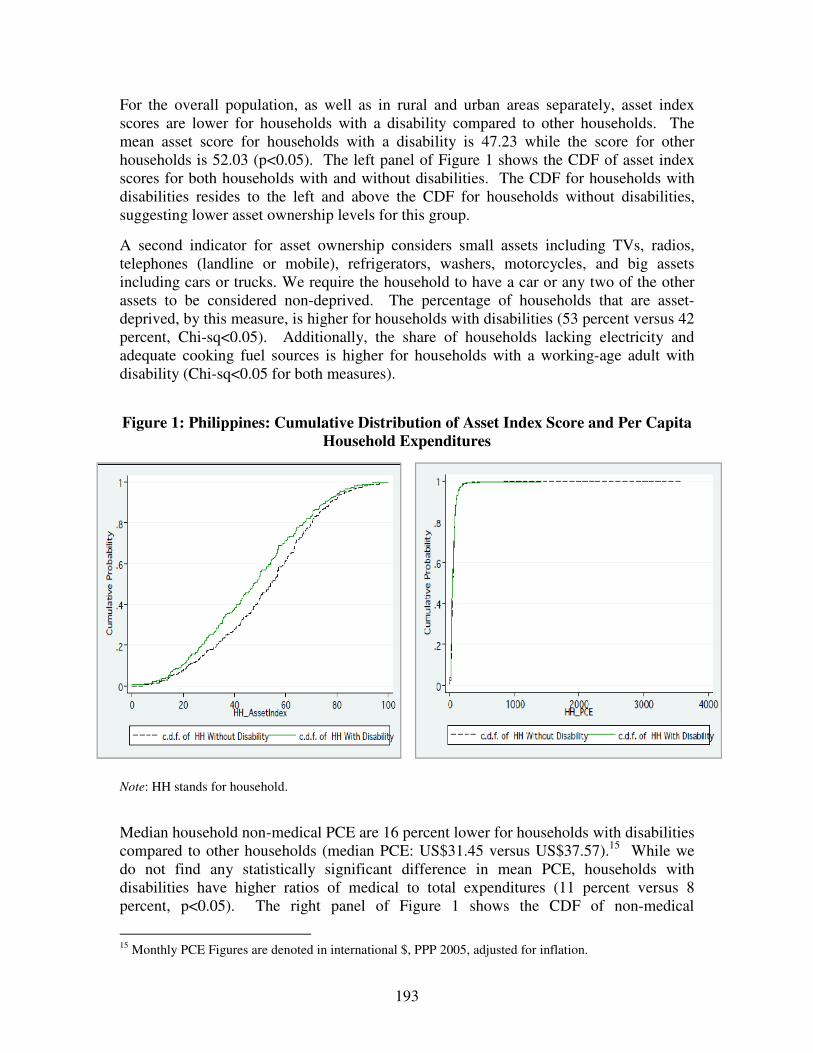
193
For the overall population, as well as in rural and urban areas separately, asset index scores are lower for households with a disability compared to other households. The mean asset score for households with a disability is 47.23 while the score for other households is 52.03 (p<0.05). The left panel of Figure 1 shows the CDF of asset index scores for both households with and without disabilities. The CDF for households with disabilities resides to the left and above the CDF for households without disabilities, suggesting lower asset ownership levels for this group.
A second indicator for asset ownership considers small assets including TVs, radios, telephones (landline or mobile), refrigerators, washers, motorcycles, and big assets including cars or trucks. We require the household to have a car or any two of the other assets to be considered non-deprived. The percentage of households that are asset-deprived, by this measure, is higher for households with disabilities (53 percent versus 42 percent, Chi-sq<0.05). Additionally, the share of households lacking electricity and adequate cooking fuel sources is higher for households with a working-age adult with disability (Chi-sq<0.05 for both measures).
Figure 1: Philippines: Cumulative Distribution of Asset Index Score and Per Capita
Household Expenditures
Note: HH stands for household.
Median household non-medical PCE are 16 percent lower for households with disabilities compared to other households (median PCE: US$31.45 versus US$37.57).15 While we do not find any statistically significant difference in mean PCE, households with disabilities have higher ratios of medical to total expenditures (11 percent versus 8 percent, p<0.05). The right panel of Figure 1 shows the CDF of non-medical
15 Monthly PCE Figures are denoted in international $, PPP 2005, adjusted for inflation.

194
expenditures for both households with and without disabilities. The combination of similar PCE, higher medical expenditure, and lower asset accumulation for households with a disabled member suggests that these households may have less ability to save and invest in long-term assets, partially due to higher medical expenses.
Disability and poverty (Tables 2, 3, and 4; Figures 2a, 2b, 3a, and 3b)
Poverty is compared across disability status using five different methods to identify the poor: a multidimensional method, the bottom asset index or PCE quintile, and living under US$1.25 or US$2.00 a day.
Multidimensional poverty rates are shown at the bottom of Table 2 and in Figure 2a. Individuals with disabilities face higher multidimensional poverty rates compared to persons without disabilities (44 percent versus 31 percent, p<0.05). This result is found across both rural and urban areas and across both measures of disability. The spider chart in Figure 2b compares individuals with disabilities to those without across each dimension used in this poverty measure. The plot for persons with disabilities falls well outside of the plot for persons without disabilities in about half of the reported dimensions, reflecting higher rates of deprivation in these areas.
Figure 2a: Philippines: Multidimensional Poverty Rates for Individuals with and without Disabilities
-
0.20
0.40
0.60
0.80
1.00
All Rural Urban
With Disability No Disability
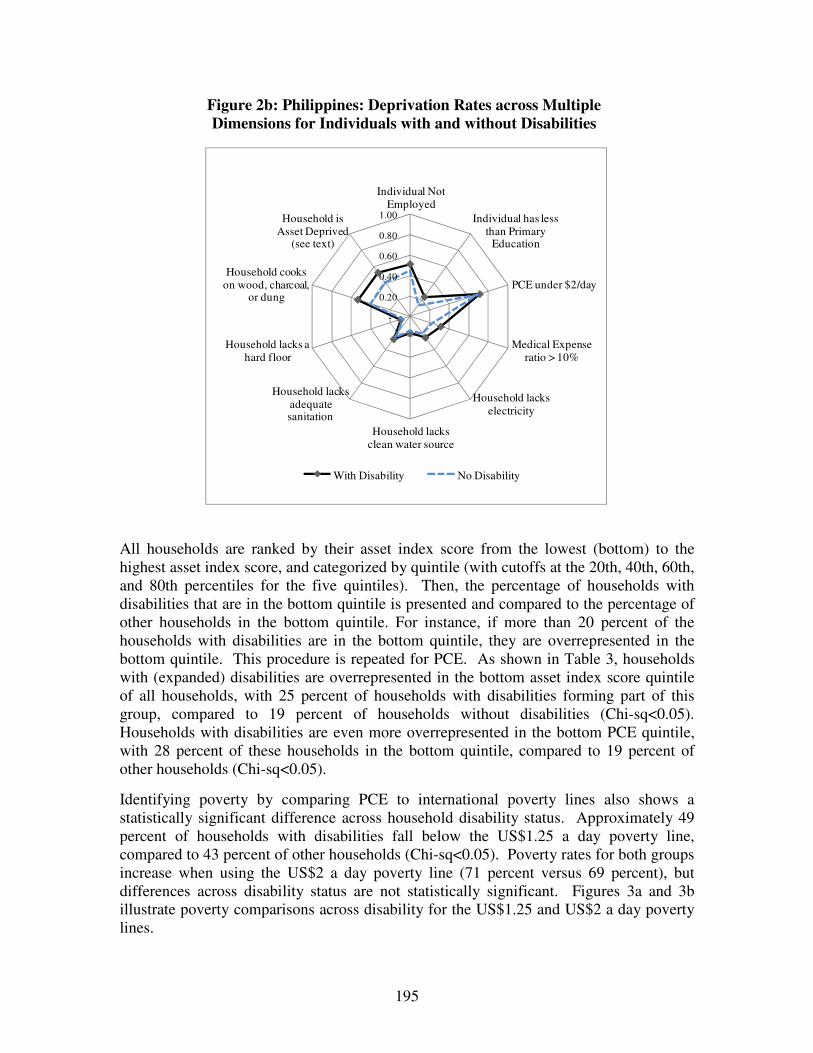
195
Figure 2b: Philippines: Deprivation Rates across Multiple Dimensions for Individuals with and without Disabilities
-
0.20
0.40
0.60
0.80
1.00
Individual Not Employed
Individual has less than Primary
Education
PCE under $2/day
Medical Expense ratio > 10%
Household lacks electricity
Household lacks clean water source
Household lacks adequate sanitation
Household lacks a hard floor
Household cooks on wood, charcoal,
or dung
Household is Asset Deprived
(see text)
With Disability No Disability
All households are ranked by their asset index score from the lowest (bottom) to the highest asset index score, and categorized by quintile (with cutoffs at the 20th, 40th, 60th, and 80th percentiles for the five quintiles). Then, the percentage of households with disabilities that are in the bottom quintile is presented and compared to the percentage of other households in the bottom quintile. For instance, if more than 20 percent of the households with disabilities are in the bottom quintile, they are overrepresented in the bottom quintile. This procedure is repeated for PCE. As shown in Table 3, households with (expanded) disabilities are overrepresented in the bottom asset index score quintile of all households, with 25 percent of households with disabilities forming part of this group, compared to 19 percent of households without disabilities (Chi-sq<0.05). Households with disabilities are even more overrepresented in the bottom PCE quintile, with 28 percent of these households in the bottom quintile, compared to 19 percent of other households (Chi-sq<0.05).
Identifying poverty by comparing PCE to international poverty lines also shows a statistically significant difference across household disability status. Approximately 49 percent of households with disabilities fall below the US$1.25 a day poverty line, compared to 43 percent of other households (Chi-sq<0.05). Poverty rates for both groups increase when using the US$2 a day poverty line (71 percent versus 69 percent), but differences across disability status are not statistically significant. Figures 3a and 3b illustrate poverty comparisons across disability for the US$1.25 and US$2 a day poverty lines.
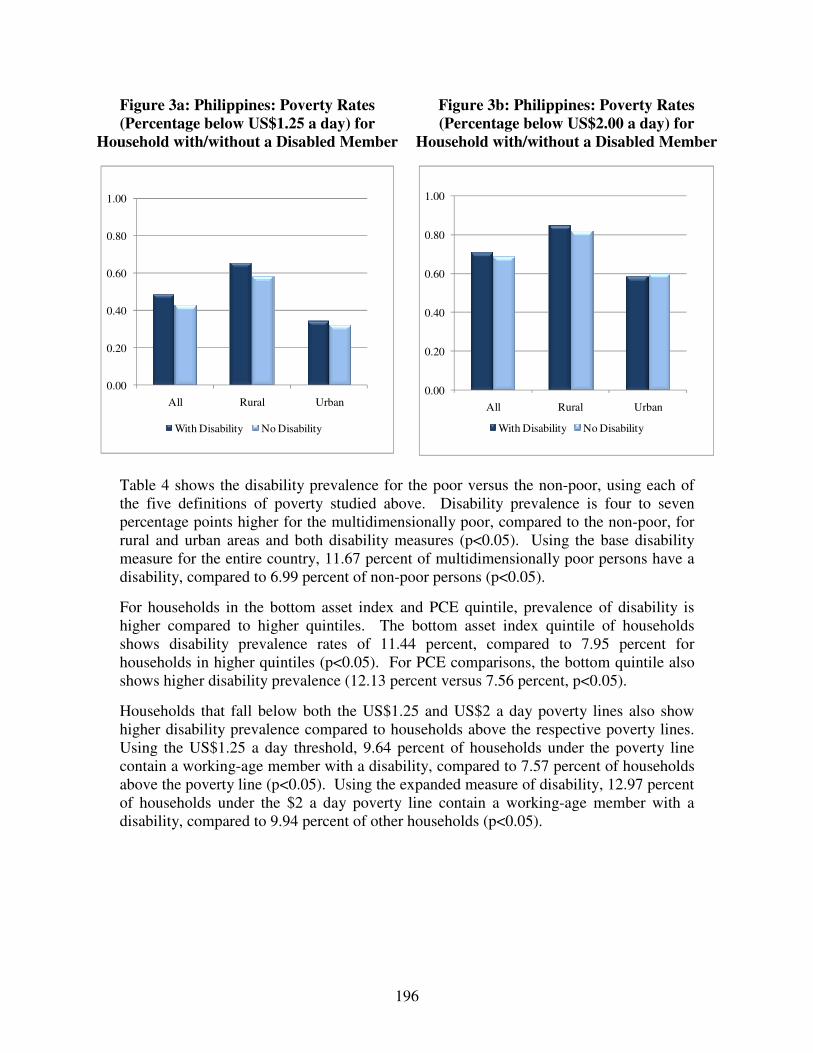
196
Figure 3a: Philippines: Poverty Rates (Percentage below US$1.25 a day) for
Household with/without a Disabled Member
Figure 3b: Philippines: Poverty Rates (Percentage below US$2.00 a day) for
Household with/without a Disabled Member
0.00
0.20
0.40
0.60
0.80
1.00
All Rural Urban
With Disability No Disability
0.00
0.20
0.40
0.60
0.80
1.00
All Rural Urban
With Disability No Disability
Table 4 shows the disability prevalence for the poor versus the non-poor, using each of the five definitions of poverty studied above. Disability prevalence is four to seven percentage points higher for the multidimensionally poor, compared to the non-poor, for rural and urban areas and both disability measures (p<0.05). Using the base disability measure for the entire country, 11.67 percent of multidimensionally poor persons have a disability, compared to 6.99 percent of non-poor persons (p<0.05).
For households in the bottom asset index and PCE quintile, prevalence of disability is higher compared to higher quintiles. The bottom asset index quintile of households shows disability prevalence rates of 11.44 percent, compared to 7.95 percent for households in higher quintiles (p<0.05). For PCE comparisons, the bottom quintile also shows higher disability prevalence (12.13 percent versus 7.56 percent, p<0.05).
Households that fall below both the US$1.25 and US$2 a day poverty lines also show higher disability prevalence compared to households above the respective poverty lines. Using the US$1.25 a day threshold, 9.64 percent of households under the poverty line contain a working-age member with a disability, compared to 7.57 percent of households above the poverty line (p<0.05). Using the expanded measure of disability, 12.97 percent of households under the $2 a day poverty line contain a working-age member with a disability, compared to 9.94 percent of other households (p<0.05).
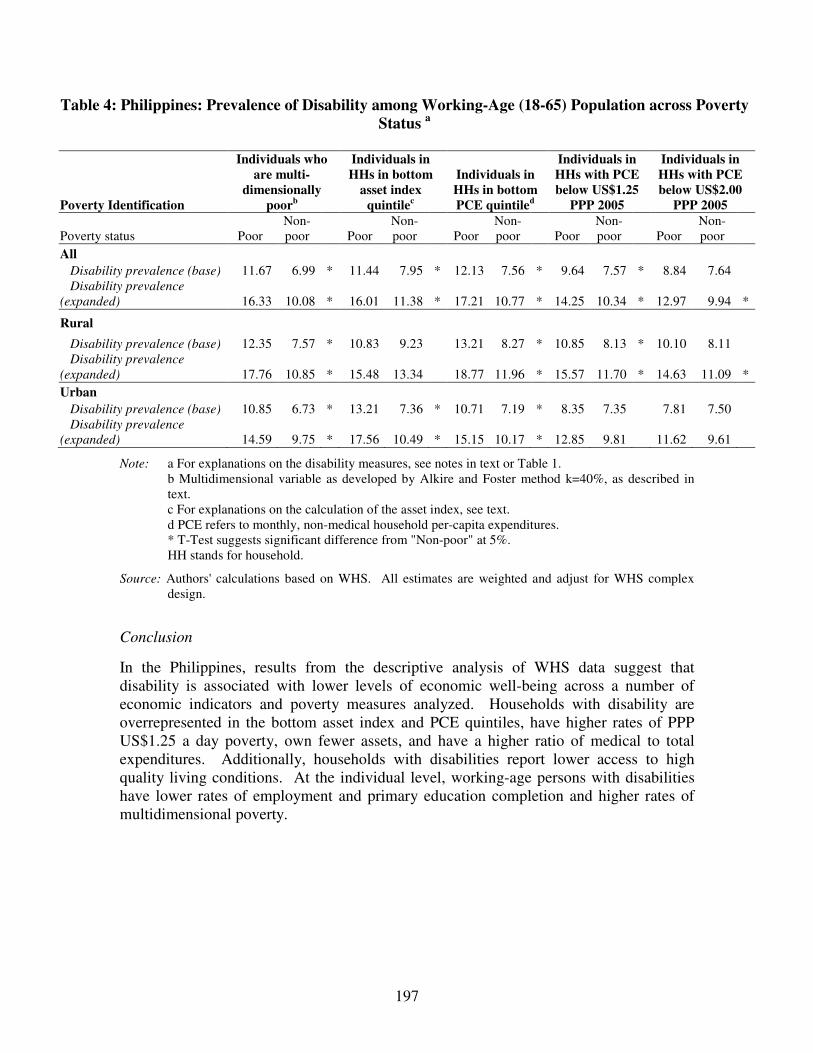
197
Table 4: Philippines: Prevalence of Disability among Working-Age (18-65) Population across Poverty Status a
Poverty Identification
Individuals who are multi-
dimensionally poorb
Individuals in HHs in bottom
asset index quintilec
Individuals in HHs in bottom PCE quintiled
Individuals in HHs with PCE below US$1.25
PPP 2005
Individuals in HHs with PCE below US$2.00
PPP 2005
Poverty status Poor Non-poor Poor
Non-poor Poor
Non-poor Poor
Non-poor Poor
Non-poor
All Disability prevalence (base) 11.67 6.99 * 11.44 7.95 * 12.13 7.56 * 9.64 7.57 * 8.84 7.64 Disability prevalence
(expanded) 16.33 10.08 * 16.01 11.38 * 17.21 10.77 * 14.25 10.34 * 12.97 9.94 *
Rural
Disability prevalence (base) 12.35 7.57 * 10.83 9.23 13.21 8.27 * 10.85 8.13 * 10.10 8.11 Disability prevalence
(expanded) 17.76 10.85 * 15.48 13.34 18.77 11.96 * 15.57 11.70 * 14.63 11.09 *
Urban Disability prevalence (base) 10.85 6.73 * 13.21 7.36 * 10.71 7.19 * 8.35 7.35 7.81 7.50 Disability prevalence
(expanded) 14.59 9.75 * 17.56 10.49 * 15.15 10.17 * 12.85 9.81 11.62 9.61
Note: a For explanations on the disability measures, see notes in text or Table 1. b Multidimensional variable as developed by Alkire and Foster method k=40%, as described in text. c For explanations on the calculation of the asset index, see text. d PCE refers to monthly, non-medical household per-capita expenditures. * T-Test suggests significant difference from "Non-poor" at 5%. HH stands for household.
Source: Authors' calculations based on WHS. All estimates are weighted and adjust for WHS complex design.
Conclusion
In the Philippines, results from the descriptive analysis of WHS data suggest that disability is associated with lower levels of economic well-being across a number of economic indicators and poverty measures analyzed. Households with disability are overrepresented in the bottom asset index and PCE quintiles, have higher rates of PPP US$1.25 a day poverty, own fewer assets, and have a higher ratio of medical to total expenditures. Additionally, households with disabilities report lower access to high quality living conditions. At the individual level, working-age persons with disabilities have lower rates of employment and primary education completion and higher rates of multidimensional poverty.
198
C.3. PROFILES FOR COUNTRIES IN LATIN AMERICA AND THE CARIBBEAN
C.3.1 Disability Profile: Brazil
Prevalence of disability among working-age population, 18-65 years (Table 1)
In Brazil, disability prevalence stands at 13.5 percent among the working-age population. With the expanded measure of disability, prevalence goes up to 21.5 percent. Prevalence is higher in rural areas (16.3 percent) compared to urban areas (12.8 percent). Disability prevalence is also higher among women (16.4 percent) than men (11.1 percent). Such patterns remain if we use the expanded measure of disability. Regarding disability types, difficulties in concentrating/ remembering things and dealing with conflict consistently rank as the most common difficulties for all individuals, across gender and rural/urban areas. Women report severe or extreme difficulty at higher rates than men in every category, with the largest differences in dealing with conflict, concentrating/remembering things, and moving around.
Demographic characteristics (Table 2)
Age, gender, and marital characteristics differ across disability status. Persons with disabilities are 54 percent female, while only 43 percent of persons without disabilities are female. The average individual with a disability is six years older than the average individual without a disability (mean age: 41 versus 35 years, p<0.05). The oldest age group (46-65 years) makes up 42 percent of working-age persons with disabilities, compared to only 22 percent for persons without disabilities. Fifty eight percent of persons with disabilities are married compared to 51 percent of those without disabilities (Chi-sq<0.05).
Education and labor market status (Table 2)
Individuals with disabilities are less educated and have lower employments rates than their nondisabled counterparts for the entire country, and within rural and urban areas. Results are similar using the expanded definition of disability.
The average person with disability has 2.8 years of education, compared to 3.7 for the average person without a disability (p<0.05). In rural areas, 42 percent of persons reporting disabilities have completed primary school compared to 64 percent of those not reporting disabilities (Chi-sq<0.05). For urban individuals, primary school completion is 62 percent and 84 percent for persons with and without disabilities respectively (Chi-sq<0.05).
Persons with disabilities show higher rates of unemployment (52 percent versus 39 percent, Chi-sq<0.05). In urban areas, the breakdown of the type of employment held amongst the employed (government, non-government, self-employed, or employer) differs significantly across disability status, with a higher percentage of persons with disabilities relying on self-employment (49 percent versus 36 percent for persons without disabilities, Chi-sq<0.05). A similar trend is shown in rural areas, although this difference across disability status is not significant.
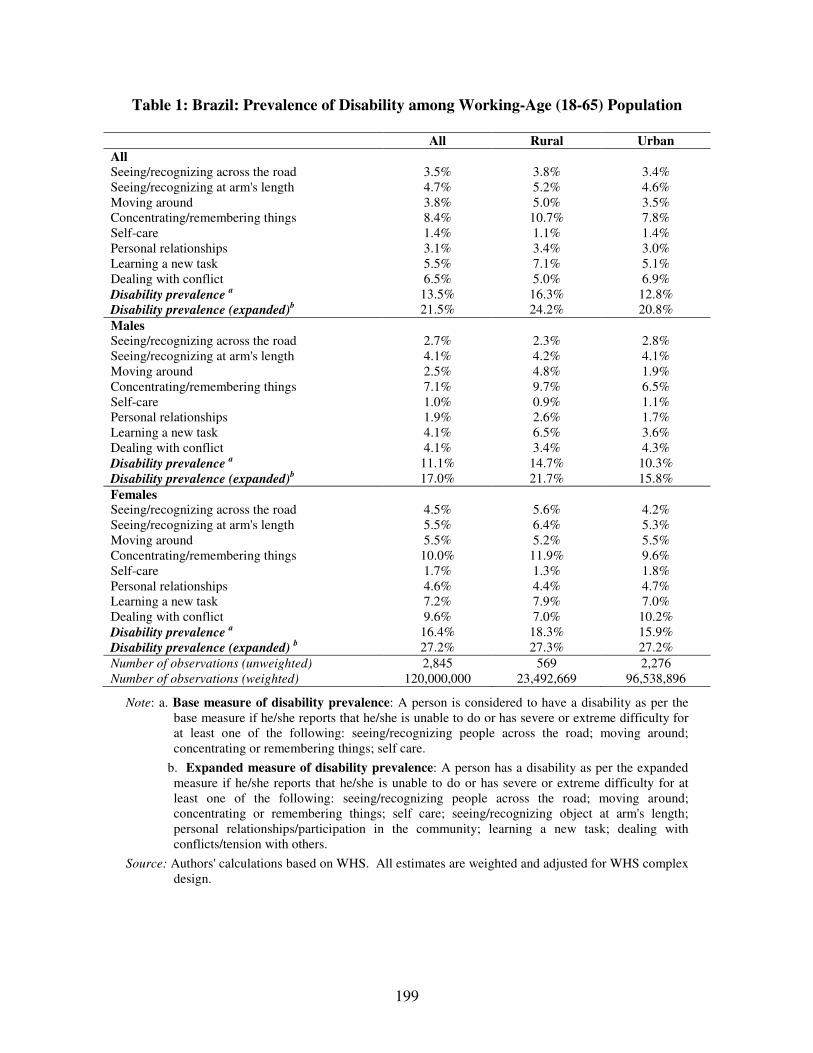
199
Table 1: Brazil: Prevalence of Disability among Working-Age (18-65) Population
All Rural Urban
All Seeing/recognizing across the road 3.5% 3.8% 3.4% Seeing/recognizing at arm's length 4.7% 5.2% 4.6% Moving around 3.8% 5.0% 3.5% Concentrating/remembering things 8.4% 10.7% 7.8% Self-care 1.4% 1.1% 1.4% Personal relationships 3.1% 3.4% 3.0% Learning a new task 5.5% 7.1% 5.1% Dealing with conflict 6.5% 5.0% 6.9% Disability prevalence
a 13.5% 16.3% 12.8%
Disability prevalence (expanded)b 21.5% 24.2% 20.8%
Males Seeing/recognizing across the road 2.7% 2.3% 2.8% Seeing/recognizing at arm's length 4.1% 4.2% 4.1% Moving around 2.5% 4.8% 1.9% Concentrating/remembering things 7.1% 9.7% 6.5% Self-care 1.0% 0.9% 1.1% Personal relationships 1.9% 2.6% 1.7% Learning a new task 4.1% 6.5% 3.6% Dealing with conflict 4.1% 3.4% 4.3% Disability prevalence
a 11.1% 14.7% 10.3%
Disability prevalence (expanded)b 17.0% 21.7% 15.8%
Females Seeing/recognizing across the road 4.5% 5.6% 4.2% Seeing/recognizing at arm's length 5.5% 6.4% 5.3% Moving around 5.5% 5.2% 5.5% Concentrating/remembering things 10.0% 11.9% 9.6% Self-care 1.7% 1.3% 1.8% Personal relationships 4.6% 4.4% 4.7% Learning a new task 7.2% 7.9% 7.0% Dealing with conflict 9.6% 7.0% 10.2% Disability prevalence
a 16.4% 18.3% 15.9%
Disability prevalence (expanded) b 27.2% 27.3% 27.2%
Number of observations (unweighted) 2,845 569 2,276 Number of observations (weighted) 120,000,000 23,492,669 96,538,896
Note: a. Base measure of disability prevalence: A person is considered to have a disability as per the base measure if he/she reports that he/she is unable to do or has severe or extreme difficulty for at least one of the following: seeing/recognizing people across the road; moving around; concentrating or remembering things; self care.
b. Expanded measure of disability prevalence: A person has a disability as per the expanded measure if he/she reports that he/she is unable to do or has severe or extreme difficulty for at least one of the following: seeing/recognizing people across the road; moving around; concentrating or remembering things; self care; seeing/recognizing object at arm's length; personal relationships/participation in the community; learning a new task; dealing with conflicts/tension with others.
Source: Authors' calculations based on WHS. All estimates are weighted and adjusted for WHS complex design.

200
Table 2: Brazil: Sample Means across Disability Status among Working-Age (18-65) Individuals a b
By disability (base) By disability (expanded) All Rural Urban All Rural Urban
Yes No Yes No Yes No Yes No Yes No Yes No Demographics
Female 0.54 0.43 # 0.50 0.44 - 0.55 0.43 # 0.56 0.41 # 0.50 0.43 - 0.58 0.41 #
Male 0.46 0.57 # 0.50 0.56 - 0.45 0.57 # 0.44 0.59 # 0.50 0.57 - 0.42 0.59 #
Married 0.58 0.51 # 0.62 0.55 - 0.57 0.50 # 0.57 0.50 # 0.63 0.55 - 0.55 0.49 #
Age 40.85 35.33 41.01 34.70 40.80 35.47 40.08 34.98 40.86 34.12 39.86 35.18
(0.75) (0.34) * (1.55) (0.89) * (0.85) (0.37) * (0.59) (0.36) * (1.18) (0.90) * (0.68) (0.40) *
18-30 0.26 0.42 # 0.30 0.44 # 0.25 0.42 # 0.30 0.43 # 0.28 0.46 # 0.30 0.42 #
31-45 0.32 0.36 # 0.27 0.36 # 0.33 0.36 # 0.32 0.36 # 0.32 0.36 # 0.32 0.36 #
46-65 0.42 0.22 # 0.43 0.20 # 0.42 0.23 # 0.38 0.21 # 0.40 0.19 # 0.38 0.22 #
Urban 0.76 0.81 - - - 0.78 0.81 - - -
Rural 0.24 0.19 - - - 0.22 0.19 - - -
Education and labor market status Years of education 2.83 3.70 2.24 2.87 3.01 3.90 2.91 3.77 2.23 2.95 3.11 3.96
(0.08) (0.05) * (0.12) (0.10) * (0.09) (0.05) * (0.06) (0.05) * (0.10) (0.09) * (0.07) (0.06) *
Less than primary school
0.43 0.19 # 0.58 0.36 # 0.38 0.16 # 0.40 0.18 # 0.59 0.33 # 0.34 0.14 #
Primary school completed
0.57 0.81 # 0.42 0.64 # 0.62 0.84 # 0.60 0.82 # 0.41 0.67 # 0.66 0.86 #
Not employed 0.52 0.39 # 0.52 0.38 # 0.52 0.40 # 0.51 0.38 # 0.51 0.36 # 0.51 0.39 #
Employed 0.48 0.61 # 0.48 0.62 # 0.48 0.60 # 0.49 0.62 # 0.49 0.64 # 0.49 0.61 #
Type of employment among the employed
. Government 0.05 0.12 # 0.02 0.08 - 0.05 0.13 # 0.07 0.12 # 0.03 0.09 - 0.08 0.13 #
. Non-government 0.39 0.44 # 0.25 0.28 - 0.43 0.48 # 0.37 0.45 # 0.23 0.29 - 0.41 0.49 #
. Self-Employed 0.54 0.41 # 0.73 0.63 - 0.49 0.36 # 0.55 0.40 # 0.74 0.61 - 0.50 0.35 #
. Employer 0.02 0.03 # - 0.01 - 0.03 0.03 # 0.01 0.03 # - 0.01 - 0.02 0.03 #
Multidimensional poverty indicator
Multidimensionally poor (AF method
k/d=40%)c
0.32 0.16 # 0.54 0.34 # 0.25 0.12 # 0.29 0.15 # 0.54 0.32 # 0.22 0.11 #
Number of observations
(unweighted)
403 2,442 99 470 304 1,972 640 2,194 147 420 493 1,774
Note: a For details on the disability measures, see notes in Table 1. b Standard deviations are in parentheses and are adjusted for survey clustering and stratification, estimates are weighted. c Multidimensional measure developed by Alkire and Foster method k/d=40%, as described in text. * T-Test suggests significant difference from "No" at 5%. # Pearson's Chi-Sq Test, p-value less than 5%.
Source: Authors' calculations based on WHS. All estimates are weighted and adjust for WHS complex design.

201
Table 3: Brazil: Characteristics and Economic Well-being of Households across Disability Status a b
By Disability By Disability (Expanded)
All Rural Urban All Rural Urban
HHs of working-age adults
with disability
Other HHs
HHs of working-age adults
with disability
Other HHs
HHs of working-age adults
with disability
Other HHs
HHs of working-age adults
with disability
Other HHs
HHs of working-age adults
with disability
Other HHs
HHs of working-age adults
with disability
Other HHs
Demographics
Household size 4.08 3.89 4.02 4.25 4.10 3.81 4.11 3.87 4.18 4.22 4.09 3.79 (0.10) (0.05) - (0.24) (0.12) - (0.10) (0.05) * (0.08) (0.05) * (0.22) (0.13) - (0.09) (0.06) *
Number of children 0-17 1.39 1.30 1.46 1.64 1.37 1.22 1.44 1.28 1.63 1.60 1.38 1.20 (0.07) (0.04) - (0.17) (0.10) - (0.08) (0.04) - (0.06) (0.04) * (0.16) (0.11) - (0.07) (0.04) * Male headed household 0.96 0.97 - 0.97 0.99 # 0.96 0.96 - 0.97 0.96 - 0.98 0.99 - 0.96 0.96 -
Assets Asset index c 80.64 85.33 62.55 67.30 86.80 89.54 81.52 85.59 63.28 67.56 87.14 89.77 (1.27) (0.58) * (3.40) (2.36) - (0.86) (0.50) * (1.09) (0.59) * (3.14) (2.33) - (0.71) (0.51) *
Asset Deprivation d 0.01 0.00 # 0.01 0.00 # 0.01 0.00 - 0.01 0.00 # 0.01 0.00 # 0.01 0.00 #
Living conditions d
Household lacks DVD/VCR
0.01 0.01 # 0.04 0.03 - 0.01 0.00 # 0.01 0.01 # 0.04 0.02 - 0.00 0.00 -
Household lacks clean water source
0.07 0.04 # 0.25 0.18 - 0.02 0.01 - 0.06 0.04 - 0.21 0.18 - 0.01 0.01 -
Household lacks adequate sanitation
0.13 0.09 # 0.33 0.29 - 0.06 0.05 - 0.12 0.09 # 0.33 0.28 - 0.06 0.05 -
Household lacks a hard floor
0.06 0.03 # 0.13 0.08 - 0.03 0.02 - 0.05 0.03 # 0.11 0.08 - 0.02 0.02 -
Household cooks on wood, charcoal, or dung
0.17 0.12 # 0.51 0.51 - 0.06 0.03 # 0.17 0.11 # 0.56 0.49 - 0.05 0.03 #
Household non-medical PCE (International $, PPP 2005) Mean 96.50 166.12 55.27 64.84 110.16 189.41 102.51 172.30 53.91 66.53 117.17 196.40 (6.41) (13.65) * (7.38) (5.65) - (8.09) (16.58) * (6.14) (14.92) * (6.01) (5.96) - (7.70) (18.05) * Median 58.05 79.45 36.28 41.46 65.30 90.70 60.47 81.63 36.28 41.79 69.48 92.51
Medical expenditures Ratio of medical expenditures to total expenditures
0.16 0.12 0.15 0.12 0.16 0.12 0.14 0.12 0.14 0.12 0.14 0.12
(0.01) (0.00) * (0.02) (0.01) - (0.01) (0.00) * (0.01) (0.00) * (0.02) (0.01) - (0.01) (0.01) *
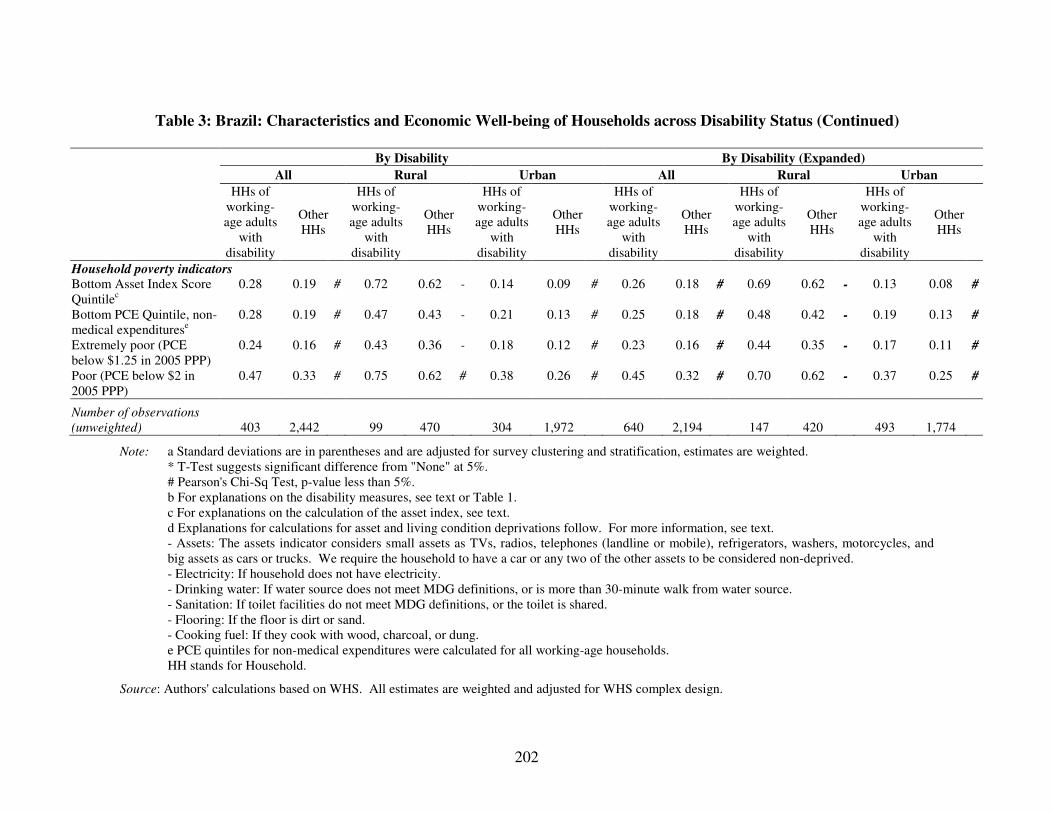
202
Table 3: Brazil: Characteristics and Economic Well-being of Households across Disability Status (Continued)
By Disability By Disability (Expanded)
All Rural Urban All Rural Urban
HHs of working-age adults
with disability
Other HHs
HHs of working-age adults
with disability
Other HHs
HHs of working-age adults
with disability
Other HHs
HHs of working-age adults
with disability
Other HHs
HHs of working-age adults
with disability
Other HHs
HHs of working-age adults
with disability
Other HHs
Household poverty indicators
Bottom Asset Index Score Quintilec
0.28 0.19 # 0.72 0.62 - 0.14 0.09 # 0.26 0.18 # 0.69 0.62 - 0.13 0.08 #
Bottom PCE Quintile, non-medical expenditurese
0.28 0.19 # 0.47 0.43 - 0.21 0.13 # 0.25 0.18 # 0.48 0.42 - 0.19 0.13 #
Extremely poor (PCE below $1.25 in 2005 PPP)
0.24 0.16 # 0.43 0.36 - 0.18 0.12 # 0.23 0.16 # 0.44 0.35 - 0.17 0.11 #
Poor (PCE below $2 in 2005 PPP)
0.47 0.33 # 0.75 0.62 # 0.38 0.26 # 0.45 0.32 # 0.70 0.62 - 0.37 0.25 #
Number of observations
(unweighted) 403 2,442 99 470 304 1,972 640 2,194 147 420 493 1,774
Note: a Standard deviations are in parentheses and are adjusted for survey clustering and stratification, estimates are weighted. * T-Test suggests significant difference from "None" at 5%. # Pearson's Chi-Sq Test, p-value less than 5%. b For explanations on the disability measures, see text or Table 1. c For explanations on the calculation of the asset index, see text. d Explanations for calculations for asset and living condition deprivations follow. For more information, see text. - Assets: The assets indicator considers small assets as TVs, radios, telephones (landline or mobile), refrigerators, washers, motorcycles, and big assets as cars or trucks. We require the household to have a car or any two of the other assets to be considered non-deprived. - Electricity: If household does not have electricity. - Drinking water: If water source does not meet MDG definitions, or is more than 30-minute walk from water source. - Sanitation: If toilet facilities do not meet MDG definitions, or the toilet is shared. - Flooring: If the floor is dirt or sand. - Cooking fuel: If they cook with wood, charcoal, or dung. e PCE quintiles for non-medical expenditures were calculated for all working-age households. HH stands for Household.
Source: Authors' calculations based on WHS. All estimates are weighted and adjusted for WHS complex design.
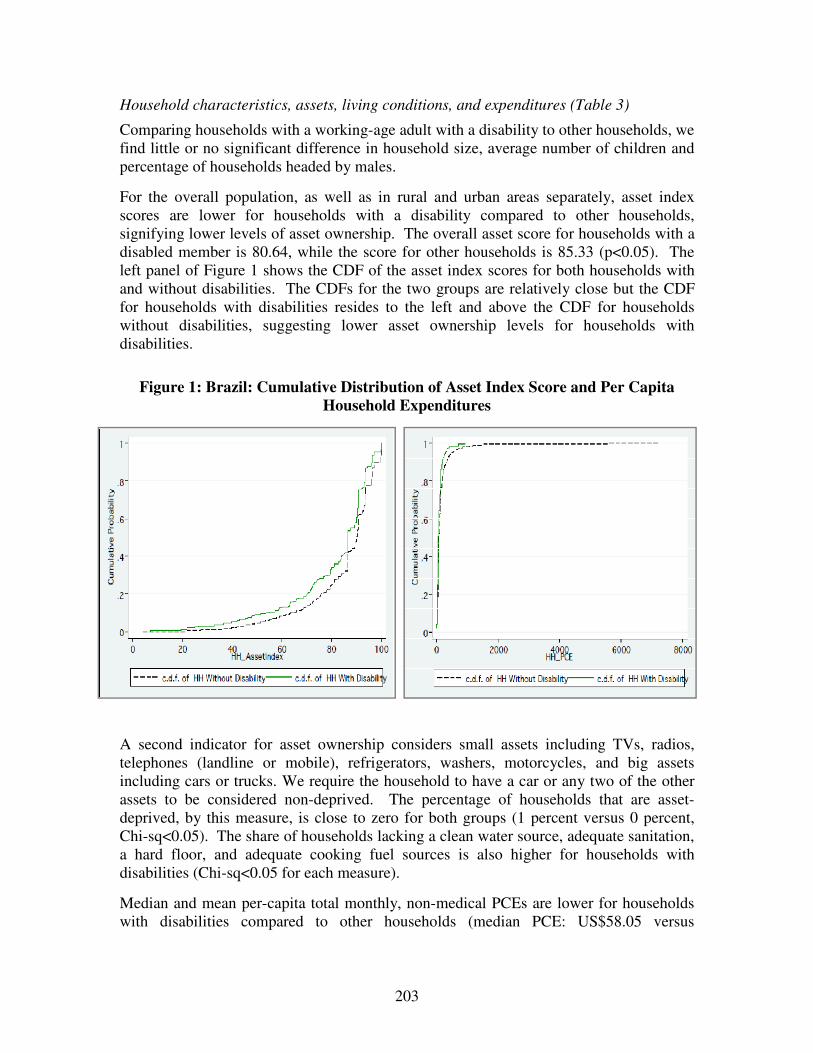
203
Household characteristics, assets, living conditions, and expenditures (Table 3)
Comparing households with a working-age adult with a disability to other households, we find little or no significant difference in household size, average number of children and percentage of households headed by males.
For the overall population, as well as in rural and urban areas separately, asset index scores are lower for households with a disability compared to other households, signifying lower levels of asset ownership. The overall asset score for households with a disabled member is 80.64, while the score for other households is 85.33 (p<0.05). The left panel of Figure 1 shows the CDF of the asset index scores for both households with and without disabilities. The CDFs for the two groups are relatively close but the CDF for households with disabilities resides to the left and above the CDF for households without disabilities, suggesting lower asset ownership levels for households with disabilities.
Figure 1: Brazil: Cumulative Distribution of Asset Index Score and Per Capita
Household Expenditures
A second indicator for asset ownership considers small assets including TVs, radios, telephones (landline or mobile), refrigerators, washers, motorcycles, and big assets including cars or trucks. We require the household to have a car or any two of the other assets to be considered non-deprived. The percentage of households that are asset-deprived, by this measure, is close to zero for both groups (1 percent versus 0 percent, Chi-sq<0.05). The share of households lacking a clean water source, adequate sanitation, a hard floor, and adequate cooking fuel sources is also higher for households with disabilities (Chi-sq<0.05 for each measure).
Median and mean per-capita total monthly, non-medical PCEs are lower for households with disabilities compared to other households (median PCE: US$58.05 versus

204
US$79.45; mean PCE: US$96.50 versus US$166.12, p<0.05).16 The right panel of Figure 1 shows the cumulative CDF of non-medical expenditures for both households with and without disabilities. In addition to lower PCE, households with disabilities show higher medical to total expenditure ratios (16 percent versus 12 percent, p<0.05). The combination of lower PCE, higher medical expenditure, and lower asset accumulation for households with a disabled member suggests that these households may have less ability to save and invest in long-term assets and living condition improvements, partially due to higher medical expenses.
Disability and poverty (Tables 2, 3, and 4; Figures 2a, 2b, 3a, and 3b)
Poverty is compared across disability status using five different methods to identify the poor: a multidimensional method, the bottom asset index or PCE quintile, and living under US$1.25 or US$2.00 a day.
Multidimensional poverty rates are shown at the bottom of Table 2 and in Figure 2a. Individuals with disabilities face higher multidimensional poverty rates compared to persons without disabilities (32 percent versus 16 percent, Chi-sq<0.05). This result holds across rural/ urban regions and for both disability measures. The spider chart in Figure 2b compares individuals with disability to those without across each dimension used in this poverty measure. The plots represent deprivation rates for each dimension. The plot for persons with disabilities falls outside of the plot for persons without disabilities in almost every dimension, suggesting higher rates of deprivation.
Figure 2a: Brazil: Multidimensional Poverty Rates for
Individuals with and without Disabilities
-
0.20
0.40
0.60
0.80
1.00
All Rural Urban
With Disability No Disability
16 Monthly PCE Figures are denoted in international $, PPP 2005, adjusted for inflation.

205
Figure 2b: Brazil: Deprivation Rates across Multiple Dimensions for Individuals with and without Disabilities
-
0.20
0.40
0.60
0.80
1.00
Individual Not Employed
Individual has less than Primary
Education
PCE under $2/day
Medical Expense ratio > 10%
Household lacks DVD/VCR
Household lacks clean water source
Household lacks adequate sanitation
Household lacks a hard floor
Household cooks on wood, charcoal,
or dung
Household is Asset Deprived (see text)
With Disability No Disability
All households are ranked by their asset index score from the lowest (bottom) to the highest asset index score, and categorized by quintile (with cutoffs at the 20th, 40th, 60th, and 80th percentiles for the five quintiles). Then, the percentage of households with disabilities that are in the bottom quintile is presented and compared to the percentage of other households in the bottom quintile. For instance, if more than 20 percent of the households with disabilities are in the bottom quintile, they are overrepresented in the bottom quintile. This procedure is repeated for PCE. As shown in Table 3, households with disabilities are significantly overrepresented in the bottom asset index score quintile of all households, with 28 percent of households with disabilities forming part of this group, compared to 19 percent of households without disabilities (Chi-sq<0.05). Households with disabilities are also overrepresented in the bottom PCE quintile of all households, with 28 percent of households with disabilities forming part of this group, compared to 19 percent of households without disabilities (Chi-sq<0.05).
Identifying poverty by comparing PCE to international poverty lines also shows a statistically significant difference across household disability status. Approximately 24 percent of households with disabilities fall below the US$1.25 a day poverty line, compared to 16 percent of other households (Chi-sq<0.05). This difference across poverty status increases when using the US$2 a day poverty line (47 percent versus 33 percent, Chi-sq<0.05). Figures 3a and 3b illustrate poverty comparisons across disability for the US$1.25 and US$2 a day poverty lines.

206
Figure 3a: Brazil: Poverty Rates (Percentage below US$1.25 a day) for Household
with/without a Disabled Member
Figure 3b: Brazil: Poverty Rates (Percentage below US$2.00 a day) for Household
with/without a Disabled Member
0.00
0.20
0.40
0.60
0.80
All Rural Urban
With Disability No Disability
0.00
0.20
0.40
0.60
0.80
All Rural Urban
With Disability No Disability
Table 4 shows the disability prevalence for the poor versus the non-poor, using each of the five definitions of poverty studied above. Disability prevalence ranges from 10- to 17- percentage points higher for the multidimensional poor, compared to the non-poor, ranging across rural and urban area and for both disability measures (p<0.05). Using the base disability measure for the entire country, 23.75 percent of multidimensionally poor persons have a disability, compared to 11.20 percent of non-poor persons (p<0.05).
For households in the bottom asset index and PCE quintile, prevalence of disability is higher compared to higher quintiles. The bottom asset index quintile of households shows disability prevalence rates of 18.87 percent, compared to 12.14 percent for households in higher quintiles (p<0.05). For PCE comparisons, the bottom quintile also shows higher disability prevalence (18.20 percent versus 12.10 percent, p<0.05).
Households that fall below both the US$1.25 and US$2 a day poverty lines also show higher disability prevalence compared to households above the respective poverty lines. Using the US$1.25 a day threshold, 18.53 percent of households under the poverty line contain a working-age member with a disability, compared to 12.21 percent of households above the poverty line (p<0.05). Using the expanded measure of disability, 27.46 percent of households under the US$1.25 a day poverty line contain a working-age member with a disability, compared to 20.02 percent of other households (p<0.05). Similar results are found using the US$2 a day poverty line.
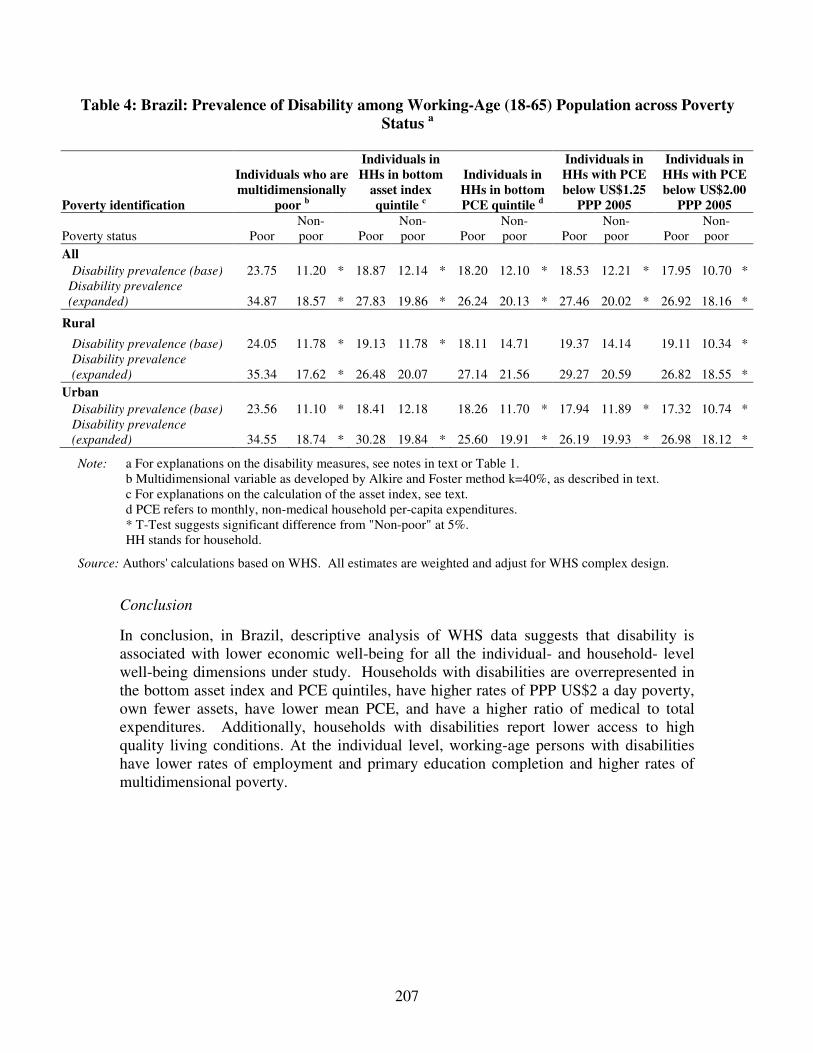
207
Table 4: Brazil: Prevalence of Disability among Working-Age (18-65) Population across Poverty Status a
Poverty identification
Individuals who are multidimensionally
poor b
Individuals in HHs in bottom
asset index quintile c
Individuals in HHs in bottom PCE quintile d
Individuals in HHs with PCE below US$1.25
PPP 2005
Individuals in HHs with PCE below US$2.00
PPP 2005
Poverty status Poor Non-poor Poor
Non-poor Poor
Non-poor Poor
Non-poor Poor
Non-poor
All Disability prevalence (base) 23.75 11.20 * 18.87 12.14 * 18.20 12.10 * 18.53 12.21 * 17.95 10.70 * Disability prevalence
(expanded) 34.87 18.57 * 27.83 19.86 * 26.24 20.13 * 27.46 20.02 * 26.92 18.16 *
Rural
Disability prevalence (base) 24.05 11.78 * 19.13 11.78 * 18.11 14.71 19.37 14.14 19.11 10.34 * Disability prevalence
(expanded) 35.34 17.62 * 26.48 20.07 27.14 21.56 29.27 20.59 26.82 18.55 *
Urban Disability prevalence (base) 23.56 11.10 * 18.41 12.18 18.26 11.70 * 17.94 11.89 * 17.32 10.74 * Disability prevalence
(expanded) 34.55 18.74 * 30.28 19.84 * 25.60 19.91 * 26.19 19.93 * 26.98 18.12 *
Note: a For explanations on the disability measures, see notes in text or Table 1. b Multidimensional variable as developed by Alkire and Foster method k=40%, as described in text. c For explanations on the calculation of the asset index, see text. d PCE refers to monthly, non-medical household per-capita expenditures. * T-Test suggests significant difference from "Non-poor" at 5%. HH stands for household.
Source: Authors' calculations based on WHS. All estimates are weighted and adjust for WHS complex design.
Conclusion
In conclusion, in Brazil, descriptive analysis of WHS data suggests that disability is associated with lower economic well-being for all the individual- and household- level well-being dimensions under study. Households with disabilities are overrepresented in the bottom asset index and PCE quintiles, have higher rates of PPP US$2 a day poverty, own fewer assets, have lower mean PCE, and have a higher ratio of medical to total expenditures. Additionally, households with disabilities report lower access to high quality living conditions. At the individual level, working-age persons with disabilities have lower rates of employment and primary education completion and higher rates of multidimensional poverty.
208
C.3.2 Disability Profile: Dominican Republic Prevalence of disability among working-age population, 18-65 years (Table 1)
In the Dominican Republic, disability prevalence stands at 8.7 percent among working-age individuals. With the expanded measure of disability, prevalence goes up to 13.3 percent.
Disability prevalence among women is close to double that among men (11.2 percent versus 6.3 percent). The difficulties that most commonly found among females include seeing/recognizing at arm’s length, concentrating/remembering things, and learning a new task. Concentration and sight are also the most frequent difficulties among men. For every disability type, women report difficulties at higher rates than men except for self-care: the difficulties with the largest differences across men and women are difficulties in seeing at arm’s length and in learning a new task.
Demographic characteristics (Table 2)
Working-age persons with disabilities are more likely to be female and older. Persons with disabilities are 63 percent female, compared to 48 percent of persons without disabilities. The average individual with a disability is six years older than the average individual without a disability (mean age: 41 versus 35 years, p<0.05). The oldest age group (46-65 years) makes up 40 percent of working-age persons with disabilities, compared to only 22 percent for persons without disabilities (Chi-sq<0.05).
Education and labor market status (Table 2)
As a group, individuals with disabilities have lower primary school completion and are less likely to work compared to individuals without disabilities. The average person has less than three years of education regardless of disability status. For the country as a whole, 42 percent reporting disabilities have completed primary school compared to 50 percent for individuals not reporting disabilities (Chi-sq<0.05).
Persons with disabilities show higher rates of non-employment than other persons (46 percent versus 37 percent, Chi-sq<0.05). The breakdown by type of employment held amongst the employed is similar across disability status. A statistically significant difference appears using the expanded definition of disability and suggests that persons with (expanded) disabilities rely more heavily on self-employment than individuals with no disabilities (58 percent to 47 percent respectively, Chi-sq<0.05).
Household characteristics, assets, living conditions and expenditures (Table 3)
Comparing households with a working-age adult with a disability to other households, we find no significant difference in average household size, but the average number of children in the household is lower (mean number of children: 1.50 versus 1.74, p<0.05). The percentage of households headed by males is lower for households with a disabled member compared to other households (63 percent versus 73 percent, Chi-sq<0.05).

209
Table 1: Dominican Republic: Prevalence of Disability among Working-Age (18-65) Population
All Rural Urban
All Seeing/recognizing across the road 3.3% 3.1% 3.4% Seeing/recognizing at arm's length 4.6% 4.0% 5.0% Moving around 2.8% 3.0% 2.7% Concentrating/remembering things 4.0% 4.1% 4.0% Self-care 1.0% 0.3% 1.4% Personal relationships 1.0% 1.2% 0.8% Learning a new task 3.5% 3.8% 3.3% Dealing with conflict 1.6% 1.0% 1.9% Disability prevalence
a 8.7% 7.8% 9.3%
Disability prevalence (expanded)b 13.3% 13.0% 13.6%
Males Seeing/recognizing across the road 2.0% 2.5% 1.6% Seeing/recognizing at arm's length 3.0% 2.3% 3.6% Moving around 1.8% 1.8% 1.8% Concentrating/remembering things 3.1% 2.8% 3.2% Self-care 1.2% 0.2% 2.0% Personal relationships 1.0% 1.4% 0.8% Learning a new task 2.1% 1.8% 2.4% Dealing with conflict 1.6% 1.2% 1.9% Disability prevalence
a 6.3% 5.4% 7.0%
Disability prevalence (expanded)b 9.5% 8.7% 10.1%
Females Seeing/recognizing across the road 4.6% 3.7% 5.1% Seeing/recognizing at arm's length 6.2% 6.0% 6.3% Moving around 3.9% 4.4% 3.6% Concentrating/remembering things 5.0% 5.5% 4.7% Self-care 0.7% 0.5% 0.8% Personal relationships 0.9% 1.1% 0.8% Learning a new task 4.9% 6.3% 4.1% Dealing with conflict 1.5% 0.7% 1.9% Disability prevalence
a 11.2% 10.8% 11.5%
Disability prevalence (expanded)b 17.3% 18.2% 16.8%
Number of observations (unweighted) 3,552 1,571 1,981 Number of observations (weighted) 9,344,603 3,754,897 5,589,705
Note: a. Base measure of disability prevalence: A person is considered to have a disability as per the base measure if he/she reports that he/she is unable to do or has severe or extreme difficulty for at least one of the following: seeing/recognizing people across the road; moving around; concentrating or remembering things; or self care.
b. Expanded measure of disability prevalence: A person has a disability as per the expanded measure if he/she reports that he/she is unable to do or has severe or extreme difficulty for at least one of the following: seeing/recognizing people across the road; moving around; concentrating or remembering things; self care; seeing/recognizing object at arm's length; personal relationships/ participation in the community; learning a new task; or dealing with conflicts/tension with others.
Source: Authors' calculations based on WHS. All estimates are weighted and adjusted for WHS complex design.

210
Table 2: Dominican Republic: Sample Means across Disability Status among Working-Age (18-65) Individuals a b
By disability (base) By disability (expanded)
All Rural Urban All Rural Urban Yes No Yes No Yes No Yes No Yes No Yes No
Demographics Female 0.63 0.48 # 0.62 0.44 # 0.63 0.50 # 0.64 0.47 # 0.63 0.42 # 0.64 0.50 #
Male 0.37 0.52 # 0.38 0.56 # 0.37 0.50 # 0.36 0.53 # 0.37 0.58 # 0.36 0.50 #
Married 0.30 0.23 - 0.39 0.18 # 0.24 0.26 - 0.29 0.22 # 0.32 0.18 # 0.28 0.26 - Age 40.90 35.29 42.20 35.29 40.17 35.29 40.29 35.10 40.46 35.11 40.18 35.09 (1.08) (0.29) * (1.82) (0.49) * (1.36) (0.38) * (0.90) (0.30) * (1.54) (0.52) * (1.12) (0.37) *
18-30 0.28 0.43 # 0.23 0.43 # 0.31 0.43 # 0.28 0.44 # 0.27 0.44 # 0.29 0.43 #
31-45 0.32 0.35 # 0.35 0.35 # 0.30 0.35 # 0.35 0.35 # 0.37 0.35 # 0.34 0.35 #
46-65 0.40 0.22 # 0.42 0.21 # 0.38 0.22 # 0.37 0.21 # 0.36 0.21 # 0.37 0.22 # Urban 0.64 0.59 - - - 0.61 0.60 - - - Rural 0.36 0.41 - - - 0.39 0.40 - - - Education and labor market status Years of education 2.72 2.79 2.23 2.44 3.00 3.03 2.66 2.80 2.26 2.45 2.92 3.05 (0.11) (0.05) - (0.13) (0.04) - (0.14) (0.07) - (0.08) (0.05) - (0.08) (0.05) * (0.11) (0.07) - Less than primary school
0.58 0.50 # 0.71 0.63 - 0.51 0.41 - 0.61 0.49 # 0.73 0.62 # 0.53 0.40 #
Primary school completed
0.42 0.50 # 0.29 0.37 - 0.49 0.59 - 0.39 0.51 # 0.27 0.38 # 0.47 0.60 #
Not employed 0.46 0.37 # 0.42 0.37 - 0.48 0.38 # 0.46 0.37 # 0.48 0.36 # 0.45 0.38 #
Employed 0.54 0.63 # 0.58 0.63 - 0.52 0.62 # 0.54 0.63 # 0.52 0.64 # 0.55 0.62 #
Type of employment among the employed . Government 0.10 0.12 - 0.10 0.10 - 0.10 0.13 - 0.09 0.12 # 0.07 0.11 - 0.11 0.13 -
. Non-government 0.36 0.40 - 0.30 0.35 - 0.40 0.44 - 0.32 0.41 # 0.28 0.36 - 0.34 0.45 -
. Self-employed 0.54 0.47 - 0.60 0.54 - 0.51 0.43 - 0.58 0.47 # 0.65 0.54 - 0.55 0.42 -
. Employer - 0.00 - - - - - 0.00 - - 0.00 # - - - - 0.00 -
Multidimensional poverty indicator
Multidimensionally poor (AF Method
k/d=40%)c
0.38 0.27 # 0.54 0.40 # 0.29 0.18 # 0.34 0.27 # 0.47 0.40 - 0.26 0.18 #
Number of observations
(unweighted)
354 3,198 134 1,437 220 1,761 497 3,039 191 1,374 306 1,665
Note: a For details on the disability measures, see notes in Table 1. b Standard deviations are in parentheses and are adjusted for survey clustering and stratification, estimates are weighted. c Multidimensional measure developed by Alkire and Foster method k/d=40%, as described in text. * T-Test suggests significant Difference from "No" at 5%. # Pearson's Chi-Sq Test, p-value less than 5%.
Source: Authors' calculations based on WHS. All estimates are weighted and adjust for WHS complex design.

211
Table 3: Dominican Republic: Characteristics and Economic Well-being of Households across Disability Status a b
By disability (base) By disability (expanded)
All Rural Urban All Rural Urban HHs of
working-age
adults with
disability
Other HHs
HHs of working-
age adults with
disability
Other HHs
HHs of working-
age adults with
disability
Other HHs
HHs of working-
age adults with
disability
Other HHs
HHs of working-
age adults with
disability
Other HHs
HHs of working-
age adults with
disability
Other HHs
Demographics
Household size 3.82 4.05 3.68 4.00 3.90 4.09 3.82 4.07 3.73 4.01 3.87 4.10
(0.15) (0.05) - (0.24) (0.08) - (0.19) (0.07) - (0.13) (0.06) - (0.17) (0.08) - (0.18) (0.07) -
Number of children 0-17 1.50 1.74 1.62 1.77 1.43 1.72 1.53 1.75 1.60 1.78 1.48 1.73
(0.11) (0.05) * (0.20) (0.06) - (0.13) (0.07) * (0.09) (0.05) * (0.14) (0.06) - (0.11) (0.07) *
Male headed household 0.63 0.73 # 0.78 0.79 - 0.55 0.69 # 0.65 0.73 # 0.74 0.80 - 0.59 0.69 #
Assets
Asset index c 63.04 64.17 49.41 51.97 71.25 71.82 64.23 64.04 51.72 51.77 71.96 71.73
(1.96) (1.09) - (2.97) (1.76) - (1.62) (1.03) - (1.67) (1.10) - (2.47) (1.73) - (1.49) (1.07) -
Asset Deprivation d 0.23 0.19 - 0.41 0.31 - 0.13 0.11 - 0.20 0.19 - 0.34 0.32 - 0.12 0.11 -
Living conditions d
Household lacks electricity 0.11 0.08 - 0.27 0.18 # 0.02 0.01 - 0.09 0.08 - 0.21 0.18 - 0.02 0.01 -
Household lacks clean water source
0.17 0.17 - 0.29 0.29 - 0.11 0.09 - 0.16 0.17 - 0.24 0.30 - 0.11 0.09 -
Household lacks adequate sanitation
0.21 0.20 - 0.29 0.25 - 0.16 0.17 - 0.21 0.20 - 0.27 0.25 - 0.17 0.17 -
Household lacks a hard floor 0.04 0.06 - 0.08 0.11 - 0.01 0.02 - 0.05 0.06 - 0.12 0.11 - 0.01 0.03 -
Household cooks on wood, charcoal, or dung
0.13 0.12 - 0.30 0.26 - 0.04 0.03 - 0.13 0.12 - 0.27 0.26 - 0.04 0.03 -
Household non-medical PCE (International $, PPP 2005)
Mean 127.38 118.10 91.37 95.67 147.84 132.44 140.36 115.25 133.14 89.15 144.80 131.88
(12.49) (5.75) - (13.66) (8.01) - (17.56) (8.17) - (17.21) (5.60) - (41.08) (5.20) - (13.17) (8.48) -
Median 78.69 71.19 62.52 58.03 83.57 79.70 77.38 70.93 62.87 58.03 90.27 77.38
Medical expenditures
Ratio of medical expenditures to total expenditures
0.17 0.10 0.17 0.10 0.18 0.10 0.16 0.10 0.15 0.10 0.16 0.10
(0.02) (0.00) * (0.04) (0.01) - (0.02) (0.01) * (0.01) (0.00) * (0.03) (0.01) - (0.01) (0.01) *

212
Table 3: Dominican Republic: Characteristics and Economic Well-being of Households across Disability Status (Continued)
By Disability By Disability (Expanded)
All Rural Urban All Rural Urban HHs of
working-age
adults with
disability
Other HHs
HHs of working-
age adults with
disability
Other HHs
HHs of working-
age adults with
disability
Other HHs
HHs of working-
age adults with
disability
Other HHs
HHs of working-
age adults with
disability
Other HHs
HHs of working-
age adults with
disability
Other HHs
Household poverty indicators
Bottom asset index score quintilec
0.26 0.19 - 0.54 0.38 # 0.09 0.07 - 0.22 0.20 - 0.47 0.39 - 0.07 0.08 -
Bottom PCE quintile, non-medical expenditurese
0.21 0.20 - 0.27 0.26 - 0.18 0.16 - 0.20 0.20 - 0.25 0.27 - 0.17 0.16 -
Extremely poor (PCE below US$1.25 in 2005 PPP)
0.20 0.18 - 0.26 0.25 - 0.16 0.14 - 0.18 0.19 - 0.25 0.25 - 0.14 0.14 -
Poor (PCE below US$2 in 2005 PPP)
0.35 0.35 - 0.44 0.44 - 0.29 0.30 - 0.34 0.35 - 0.43 0.44 - 0.29 0.30 -
Number of observations
(unweighted) 354 3,198 134 1,437 220 1,761 497 3,039 191 1,374 306 1,665
Note: a Standard deviations are in parentheses and are adjusted for survey clustering and stratification, estimates are weighted. * T-Test suggests significant difference from "None" at 5%. # Pearson's Chi-Sq Test, p-value less than 5%. b For explanations on the disability measures, see text or Table 1. c For explanations on the calculation of the asset index, see text. d Explanations for calculations for asset and living condition deprivations follow. For more information, see text. - Assets: The assets indicator considers small assets as TVs, radios, telephones (landline or mobile), refrigerators, washers, motorcycles, and big assets as cars or trucks. We require the household to have a car or any two of the other assets to be considered non-deprived. - Electricity: If household does not have electricity. - Drinking water: If water source does not meet MDG definitions, or is more than 30-minute walk from water source. - Sanitation: If toilet facilities do not meet MDG definitions, or the toilet is shared. - Flooring: If the floor is dirt or sand. - Cooking fuel: If they cook with wood, charcoal, or dung. e PCE quintiles for non-medical expenditures were calculated for all working-age households. HH stands for Household.
Source: Authors' calculations based on WHS. All estimates are weighted and adjusted for WHS complex design.

213
Asset index scores show no significant difference when measured across disability status. The left panel of Figure 1 shows the CDF of the asset index scores for both households with and without disabilities, with little difference between the two. A second indicator for asset ownership considers small assets including TVs, radios, telephones (landline or mobile), refrigerators, washers, motorcycles, and big assets including cars or trucks. We require the household to have a car or any two of the other assets to be considered non-deprived. The percentage of households that are asset-deprived, by this measure, is higher for households with disabilities compared to other households (23 percent versus 19 percent), however this difference is not statistically significant. In addition, the share of households lacking electricity, a clean water source, adequate sanitation, and a hard floor is similar across household disability status.
Figure 1: Dominican Republic: Cumulative Distribution of Asset Index Score and
Per Capita Household Expenditures
Median per-capita total monthly, non-medical PCE are higher for households with disabilities compared to other households (median PCE: US$78.69 versus US$71.19).17 Differences in mean PCE across disability status are not statistically significant (mean PCE: US$127.38 versus US$118.10). The right panel of Figure 1 shows the cumulative distribution function of non-medical expenditures for both households with and without disabilities. Despite similar results for asset ownership and PCE, households with disabilities show a much higher ratio of medical to total monthly expenditures (17 percent versus 10 percent, p<0.05).
17 Monthly PCE Figures are denoted in international $, PPP 2005, adjusted for inflation.

214
Disability and poverty (Tables 2, 3, and 4; Figures 2a, 2b, 3a, and 3b)
Poverty is compared across disability status using five different methods to identify the poor: a multidimensional method, the bottom asset index or PCE quintile, and living under US$1.25 or US$2.00 a day.
Multidimensional poverty rates are shown at the bottom of Table 2 and in Figure 2a. Individuals with disabilities face higher multidimensional poverty rates compared to persons without disabilities (38 percent versus 27 percent, Chi-sq<0.05). This result is similar across rural/ urban regions and for both disability measures. The spider chart in Figure 2b compares individuals with disabilities to those without across each dimension used in this poverty measure. The plots represent deprivation rates for each dimension. The plot for persons with disabilities falls well outside of the plot for persons without disabilities in three dimensions: no employment, less than primary education, and medical expense ratio above 10 percent, reflecting higher rates of deprivation in these areas.
Figure 2a: Dominican Republic: Multidimensional Poverty
Rates for Individuals with and without Disabilities
-
0.20
0.40
0.60
All Rural Urban
With Disability No Disability
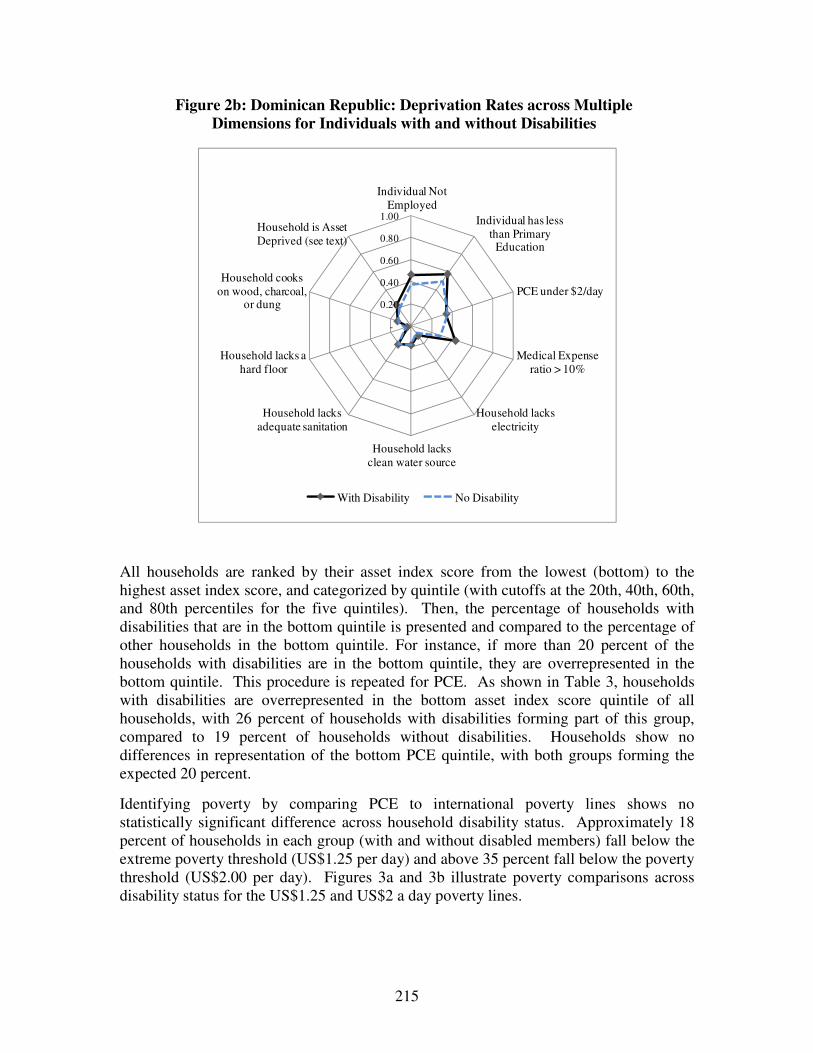
215
Figure 2b: Dominican Republic: Deprivation Rates across Multiple Dimensions for Individuals with and without Disabilities
-
0.20
0.40
0.60
0.80
1.00
Individual Not Employed
Individual has less than Primary
Education
PCE under $2/day
Medical Expense ratio > 10%
Household lacks electricity
Household lacks clean water source
Household lacks adequate sanitation
Household lacks a hard floor
Household cooks on wood, charcoal,
or dung
Household is Asset Deprived (see text)
With Disability No Disability
All households are ranked by their asset index score from the lowest (bottom) to the highest asset index score, and categorized by quintile (with cutoffs at the 20th, 40th, 60th, and 80th percentiles for the five quintiles). Then, the percentage of households with disabilities that are in the bottom quintile is presented and compared to the percentage of other households in the bottom quintile. For instance, if more than 20 percent of the households with disabilities are in the bottom quintile, they are overrepresented in the bottom quintile. This procedure is repeated for PCE. As shown in Table 3, households with disabilities are overrepresented in the bottom asset index score quintile of all households, with 26 percent of households with disabilities forming part of this group, compared to 19 percent of households without disabilities. Households show no differences in representation of the bottom PCE quintile, with both groups forming the expected 20 percent.
Identifying poverty by comparing PCE to international poverty lines shows no statistically significant difference across household disability status. Approximately 18 percent of households in each group (with and without disabled members) fall below the extreme poverty threshold (US$1.25 per day) and above 35 percent fall below the poverty threshold (US$2.00 per day). Figures 3a and 3b illustrate poverty comparisons across disability status for the US$1.25 and US$2 a day poverty lines.

216
Figure 3a: Dominican Republic: Poverty Rates (Percentage below US$1.25 a Day) for Household with/without a Disabled Member
Figure 3b: Dominican Republic: Poverty Rates (Percentage below US$2.00 a Day) for Household with/without a Disabled Member
0.00
0.20
0.40
0.60
All Rural Urban
With Disability No Disability
0.00
0.20
0.40
0.60
All Rural Urban
With Disability No Disability
Table 4 shows the disability prevalence for the poor versus the non-poor, using each of the five definitions of poverty studied above. Disability prevalence is approximately four percentage points higher for the multidimensional poor (p<0.05). For instance, using the base disability measure for the entire country, 11.87 percent of multidimensionally poor persons have a disability, compared to 7.49 percent of non-poor persons (p<0.05).
Across the other four poverty definitions used, differences in disability prevalence across poverty status are not statistically significant (whether measured as a comparison of the bottom versus upper quintiles for asset index and PCE, or measured as falling below or above a US$1.25 and US$2 a day poverty line).
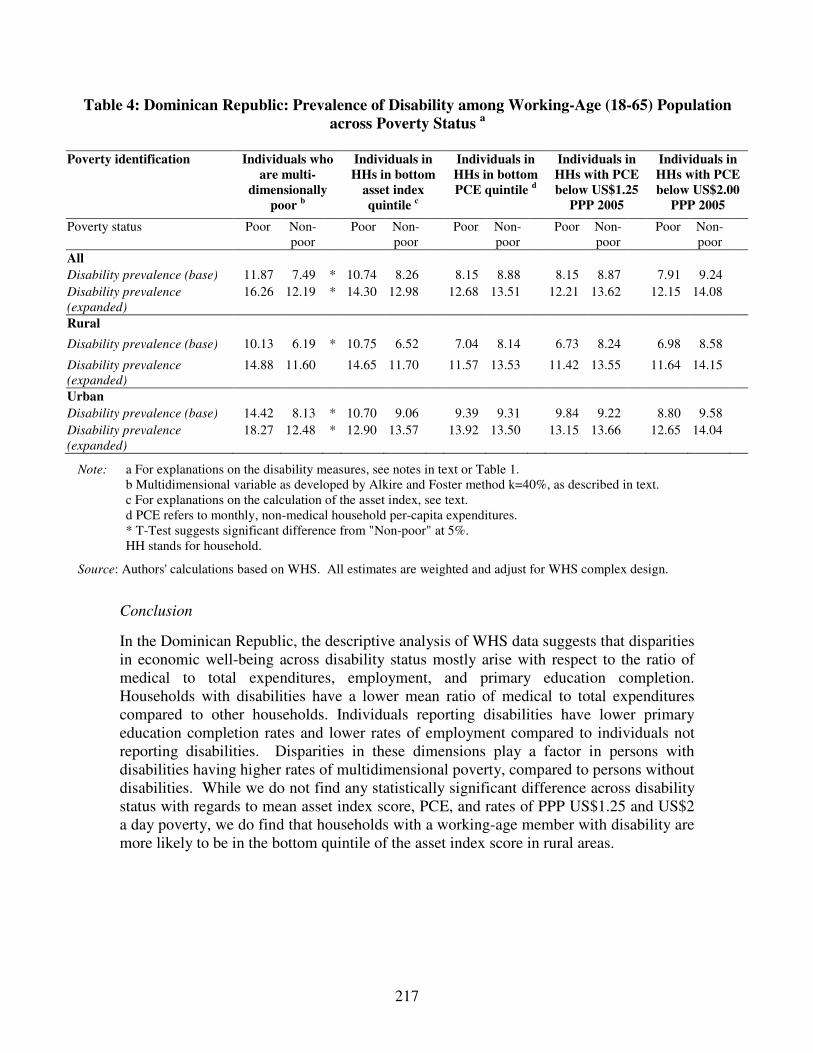
217
Table 4: Dominican Republic: Prevalence of Disability among Working-Age (18-65) Population across Poverty Status a
Poverty identification Individuals who
are multi-dimensionally
poor b
Individuals in HHs in bottom
asset index quintile c
Individuals in HHs in bottom PCE quintile d
Individuals in HHs with PCE below US$1.25
PPP 2005
Individuals in HHs with PCE below US$2.00
PPP 2005
Poverty status Poor Non-poor
Poor Non-poor
Poor Non-poor
Poor Non-poor
Poor Non-poor
All Disability prevalence (base) 11.87 7.49 * 10.74 8.26 8.15 8.88 8.15 8.87 7.91 9.24 Disability prevalence
(expanded)
16.26 12.19 * 14.30 12.98 12.68 13.51 12.21 13.62 12.15 14.08
Rural
Disability prevalence (base) 10.13 6.19 * 10.75 6.52 7.04 8.14 6.73 8.24 6.98 8.58
Disability prevalence
(expanded)
14.88 11.60 14.65 11.70 11.57 13.53 11.42 13.55 11.64 14.15
Urban Disability prevalence (base) 14.42 8.13 * 10.70 9.06 9.39 9.31 9.84 9.22 8.80 9.58 Disability prevalence
(expanded)
18.27 12.48 * 12.90 13.57 13.92 13.50 13.15 13.66 12.65 14.04
Note: a For explanations on the disability measures, see notes in text or Table 1. b Multidimensional variable as developed by Alkire and Foster method k=40%, as described in text. c For explanations on the calculation of the asset index, see text. d PCE refers to monthly, non-medical household per-capita expenditures. * T-Test suggests significant difference from "Non-poor" at 5%. HH stands for household.
Source: Authors' calculations based on WHS. All estimates are weighted and adjust for WHS complex design.
Conclusion
In the Dominican Republic, the descriptive analysis of WHS data suggests that disparities in economic well-being across disability status mostly arise with respect to the ratio of medical to total expenditures, employment, and primary education completion. Households with disabilities have a lower mean ratio of medical to total expenditures compared to other households. Individuals reporting disabilities have lower primary education completion rates and lower rates of employment compared to individuals not reporting disabilities. Disparities in these dimensions play a factor in persons with disabilities having higher rates of multidimensional poverty, compared to persons without disabilities. While we do not find any statistically significant difference across disability status with regards to mean asset index score, PCE, and rates of PPP US$1.25 and US$2 a day poverty, we do find that households with a working-age member with disability are more likely to be in the bottom quintile of the asset index score in rural areas.

218
C.3.3 Disability Profile: Mexico Prevalence of disability among working-age population, 18-65 years (Table 1)
In the Mexico, disability prevalence stands at 5.3 percent among working-age individuals. With the expanded measure of disability, prevalence goes up to 7.4 percent.
Prevalence rates in rural and urban areas are close (5.1 percent versus 5.4 percent respectively), while rates for women are higher than those for men (6.5 percent versus 4.0 percent respectively). When using the expanded measure of disability, prevalence rates increase by 2.7 percentage points for females and 1.6 percentage points for men. The most common difficulties for both males and females are those in seeing/recognizing across the road and at arm’s length.
Demographic characteristics (Table 2)
Demographic characteristics around gender, age, and marital status differ across disability. Sixty-three percent of persons with disabilities are female, compared to 51 percent of non-disabled persons (Chi-sq<0.05). The average individual with a disability is seven years older than the average individual without a disability (mean age: 42 versus 35 years, p<0.05). The oldest age group (46-65 years) makes up 43 percent of working-age persons with disabilities, compared to only 21 percent for persons without disabilities (Chi-sq<0.05). A higher percentage of individuals with disabilities are married compared to others (60 percent versus 55 percent, Chi-sq<0.05).
Education and labor market status (Table 2)
Individuals with disabilities are less educated and have lower employment rates than their non-disabled counterparts for the entire country, and within rural and urban areas. Results are similar using the expanded definition of disability.
The average person with a disability has 4.01 years of education, compared to 4.20 for the average person without a disability (p<0.05). For persons living in rural areas, 38 percent reporting disability have completed primary school compared to 55 percent for individuals not reporting disabilities (Chi-sq<0.05). For urban individuals, primary school completion is 69 percent and 83 percent for persons with and without disabilities respectively (Chi-sq<0.05).
For the country as a whole, 39 percent of persons with disabilities are employed, compared to 56 percent of non-disabled, working-age persons (Chi-sq<0.05). Additionally, the type of work that employed individuals do differs across disability status, as disabled individuals rely more heavily on self-employment compared to non-disabled individuals (53 percent versus 46 percent, Chi-sq<0.05).
Household characteristics, assets, living conditions, and expenditures (Table 3)
On average, households with a working-age adult with a disability have fewer members than other households (mean size: 4.26 versus 4.40, p<0.05) and fewer children in the household (mean number of children: 1.62 versus 1.77, p<0.05). The percentage of households headed by males is lower for households with a disabled member compared to other households (74 percent versus 82 percent, Chi-sq<0.05).

219
Table 1: Mexico: Prevalence of Disability among Working-Age (18-65) Population
All Rural Urban
All Seeing/recognizing across the road 2.4% 2.3% 2.5% Seeing/recognizing at arm's length 2.3% 2.7% 2.1% Moving around 1.7% 1.8% 1.7% Concentrating/remembering things 1.8% 1.8% 1.9% Self-care 0.6% 0.7% 0.6% Personal relationships 0.8% 0.5% 1.0% Learning a new task 1.5% 1.6% 1.5% Dealing with conflict 1.2% 1.3% 1.1% Disability prevalence
a 5.3% 5.1% 5.4%
Disability prevalence (expanded)b 7.4% 7.6% 7.4%
Males Seeing/recognizing across the road 1.9% 1.9% 1.9% Seeing/recognizing at arm's length 1.8% 2.1% 1.6% Moving around 1.3% 1.7% 1.2% Concentrating/remembering things 1.3% 1.6% 1.2% Self-care 0.6% 1.0% 0.5% Personal relationships 0.7% 0.5% 0.8% Learning a new task 0.9% 1.0% 0.9% Dealing with conflict 0.8% 1.0% 0.8% Disability prevalence
a 4.0% 4.6% 3.8%
Disability prevalence (expanded)b 5.6% 6.7% 5.2%
Females Seeing/recognizing across the road 2.9% 2.7% 3.0% Seeing/recognizing at arm's length 2.8% 3.3% 2.6% Moving around 2.0% 1.8% 2.1% Concentrating/remembering things 2.4% 2.0% 2.5% Self-care 0.6% 0.4% 0.7% Personal relationships 1.0% 0.5% 1.1% Learning a new task 2.0% 2.2% 2.0% Dealing with conflict 1.5% 1.5% 1.5% Disability prevalence
a 6.5% 5.5% 6.8%
Disability prevalence (expanded)b 9.2% 8.6% 9.3%
Number of observations (unweighted) 33,835 7,946 25,889 Number of observations (weighted) 106,800,000 26,248,248 80,508,960
Note: a. Base measure of disability prevalence: A person is considered to have a disability as per the base measure if he/she reports that he/she is unable to do or has severe or extreme difficulty for at least one of the following: seeing/recognizing people across the road; moving around; concentrating or remembering things; or self care.
b. Expanded measure of disability prevalence: A person has a disability as per the expanded measure if he/she reports that he/she is unable to do or has severe or extreme difficulty for at least one of the following: seeing/recognizing people across the road; moving around; concentrating or remembering things; self care; seeing/recognizing object at arm's length; personal relationships/participation in the community; learning a new task; or dealing with conflicts/tension with others.
Source: Authors' calculations based on WHS. All estimates are weighted and adjusted for WHS complex design.
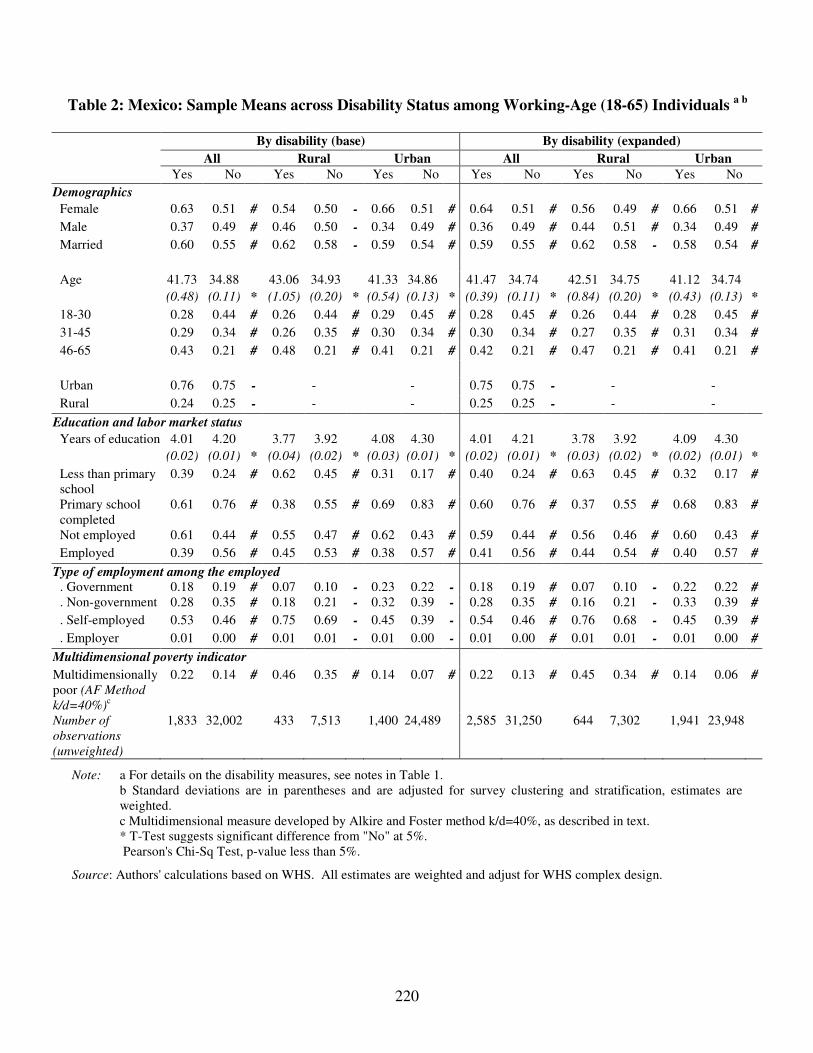
220
Table 2: Mexico: Sample Means across Disability Status among Working-Age (18-65) Individuals a b
By disability (base) By disability (expanded)
All Rural Urban All Rural Urban Yes No Yes No Yes No Yes No Yes No Yes No
Demographics
Female 0.63 0.51 # 0.54 0.50 - 0.66 0.51 # 0.64 0.51 # 0.56 0.49 # 0.66 0.51 #
Male 0.37 0.49 # 0.46 0.50 - 0.34 0.49 # 0.36 0.49 # 0.44 0.51 # 0.34 0.49 #
Married 0.60 0.55 # 0.62 0.58 - 0.59 0.54 # 0.59 0.55 # 0.62 0.58 - 0.58 0.54 #
Age 41.73 34.88 43.06 34.93 41.33 34.86 41.47 34.74 42.51 34.75 41.12 34.74
(0.48) (0.11) * (1.05) (0.20) * (0.54) (0.13) * (0.39) (0.11) * (0.84) (0.20) * (0.43) (0.13) *
18-30 0.28 0.44 # 0.26 0.44 # 0.29 0.45 # 0.28 0.45 # 0.26 0.44 # 0.28 0.45 #
31-45 0.29 0.34 # 0.26 0.35 # 0.30 0.34 # 0.30 0.34 # 0.27 0.35 # 0.31 0.34 #
46-65 0.43 0.21 # 0.48 0.21 # 0.41 0.21 # 0.42 0.21 # 0.47 0.21 # 0.41 0.21 #
Urban 0.76 0.75 - - - 0.75 0.75 - - -
Rural 0.24 0.25 - - - 0.25 0.25 - - -
Education and labor market status
Years of education 4.01 4.20 3.77 3.92 4.08 4.30 4.01 4.21 3.78 3.92 4.09 4.30
(0.02) (0.01) * (0.04) (0.02) * (0.03) (0.01) * (0.02) (0.01) * (0.03) (0.02) * (0.02) (0.01) *
Less than primary school
0.39 0.24 # 0.62 0.45 # 0.31 0.17 # 0.40 0.24 # 0.63 0.45 # 0.32 0.17 #
Primary school completed
0.61 0.76 # 0.38 0.55 # 0.69 0.83 # 0.60 0.76 # 0.37 0.55 # 0.68 0.83 #
Not employed 0.61 0.44 # 0.55 0.47 # 0.62 0.43 # 0.59 0.44 # 0.56 0.46 # 0.60 0.43 #
Employed 0.39 0.56 # 0.45 0.53 # 0.38 0.57 # 0.41 0.56 # 0.44 0.54 # 0.40 0.57 #
Type of employment among the employed
. Government 0.18 0.19 # 0.07 0.10 - 0.23 0.22 - 0.18 0.19 # 0.07 0.10 - 0.22 0.22 #
. Non-government 0.28 0.35 # 0.18 0.21 - 0.32 0.39 - 0.28 0.35 # 0.16 0.21 - 0.33 0.39 #
. Self-employed 0.53 0.46 # 0.75 0.69 - 0.45 0.39 - 0.54 0.46 # 0.76 0.68 - 0.45 0.39 #
. Employer 0.01 0.00 # 0.01 0.01 - 0.01 0.00 - 0.01 0.00 # 0.01 0.01 - 0.01 0.00 #
Multidimensional poverty indicator
Multidimensionally poor (AF Method
k/d=40%)c
0.22 0.14 # 0.46 0.35 # 0.14 0.07 # 0.22 0.13 # 0.45 0.34 # 0.14 0.06 #
Number of
observations
(unweighted)
1,833 32,002 433 7,513 1,400 24,489 2,585 31,250 644 7,302 1,941 23,948
Note: a For details on the disability measures, see notes in Table 1. b Standard deviations are in parentheses and are adjusted for survey clustering and stratification, estimates are weighted. c Multidimensional measure developed by Alkire and Foster method k/d=40%, as described in text. * T-Test suggests significant difference from "No" at 5%. Pearson's Chi-Sq Test, p-value less than 5%.
Source: Authors' calculations based on WHS. All estimates are weighted and adjust for WHS complex design.

221
Table 3: Mexico: Characteristics and Economic Well-being of Households across Disability Status a b
By disability (base) By disability (expanded)
All Rural Urban All Rural Urban
HHs of working-
age adults with
disability
Other HHs
HHs of working-
age adults with
disability
Other HHs
HHs of working-
age adults with
disability
Other HHs
HHs of working-
age adults with
disability
Other HHs
HHs of working-
age adults with
disability
Other HHs
HHs of working-
age adults with
disability
Other HHs
Demographics
Household size 4.26 4.40 4.68 4.73 4.14 4.29 4.31 4.40 4.61 4.73 4.21 4.28
(0.07) (0.03) * (0.16) (0.06) - (0.07) (0.02) * (0.06) (0.02) - (0.15) (0.06) - (0.06) (0.02) -
Number of children 0-17 1.62 1.77 2.02 2.23 1.50 1.60 1.64 1.77 1.96 2.24 1.53 1.60
(0.05) (0.03) * (0.13) (0.06) - (0.05) (0.02) * (0.05) (0.03) * (0.12) (0.06) * (0.05) (0.02) -
Male headed household 0.74 0.82 # 0.78 0.86 # 0.72 0.81 # 0.74 0.82 # 0.78 0.86 # 0.73 0.81 #
Assets
Asset index c 81.63 81.02 65.85 64.01 86.43 86.94 80.84 81.07 64.79 64.04 86.33 86.96
(0.61) (0.48) - (1.90) (1.43) - (0.34) (0.25) - (0.68) (0.48) - (1.93) (1.42) - (0.33) (0.25) *
Asset Deprivation d 0.01 0.01 - 0.02 0.02 - 0.01 0.00 # 0.01 0.01 - 0.01 0.02 - 0.01 0.00 #
Living conditions d
Household lacks DVD/VCR 0.02 0.02 - 0.06 0.05 - 0.00 0.00 - 0.02 0.01 - 0.07 0.05 - 0.00 0.00 -
Household lacks clean water source
0.04 0.05 - 0.14 0.14 - 0.01 0.01 - 0.05 0.05 - 0.15 0.14 - 0.01 0.01 -
Household lacks adequate sanitation
0.04 0.05 - 0.17 0.15 - 0.01 0.01 # 0.05 0.05 - 0.16 0.16 - 0.01 0.01 -
Household lacks a hard floor 0.07 0.10 # 0.21 0.27 # 0.03 0.04 - 0.09 0.10 - 0.22 0.27 # 0.04 0.04 -
Household cooks on wood, charcoal, or dung
0.12 0.14 - 0.40 0.43 - 0.03 0.03 - 0.13 0.14 - 0.43 0.43 - 0.03 0.03 -
Household non-medical PCE (International $, PPP 2005)
Mean 247.55 190.16 170.64 117.01 270.89 215.63 239.49 189.49 158.04 116.54 267.36 214.72
(28.90) (6.72) * (46.17) (9.57) - (34.88) (8.56) - (24.08) (6.72) * (34.50) (9.62) - (29.90) (8.55) -
Median 71.15 71.15 37.44 39.13 83.35 85.38 71.15 71.15 39.85 39.13 82.22 85.38
Medical expenditures Ratio of medical expenditures to total expenditures
0.08 0.04 0.07 0.05 0.08 0.04 0.07 0.04 0.06 0.05 0.07 0.04
(0.01) (0.00) * (0.01) (0.00) * (0.01) (0.00) * (0.01) (0.00) * (0.01) (0.00) - (0.01) (0.00) *

222
Table 3: Mexico: Characteristics and Economic Well-being of Households across Disability Status (Continued)
By disability (base) By disability (expanded)
All Rural Urban All Rural Urban
HHs of working-
age adults with
disability
Other HHs
HHs of working-
age adults with
disability
Other HHs
HHs of working-
age adults with
disability
Other HHs
HHs of working-
age adults with
disability
Other HHs
HHs of working-
age adults with
disability
Other HHs
HHs of working-
age adults with
disability
Other HHs
Household poverty indicators
Bottom asset index score quintile c 0.18 0.20 # 0.54 0.57 - 0.07 0.07 - 0.20 0.20 - 0.56 0.57 - 0.07 0.07 -
Bottom PCE quintile, non-medical expenditures e
0.20 0.20 - 0.44 0.45 - 0.13 0.11 - 0.21 0.20 - 0.44 0.45 - 0.13 0.11 -
Extremely poor (PCE below US$1.25 in 2005 PPP)
0.19 0.18 - 0.43 0.42 - 0.12 0.10 - 0.19 0.18 - 0.42 0.42 - 0.12 0.10 -
Poor (PCE below US$2 in 2005 PPP)
0.35 0.35 - 0.61 0.64 - 0.27 0.25 - 0.36 0.35 - 0.61 0.64 - 0.27 0.25 -
Number of observations
(unweighted) 1,833 32,002 433 7,513 1,400 24,489 2,585 31,250 644 7,302 1,941 23,948
Note: a Standard deviations are in parentheses and are adjusted for survey clustering and stratification, estimates are weighted. * T-Test suggests Significant Difference from "None" at 5%. # Pearson's Chi-Sq Test, p-value less than 5%. b For explanations on the disability measures, see text or Table 1. c For explanations on the calculation of the asset index, see text. d Explanations for calculations for asset and living condition deprivations follow. For more information, see text. - Assets: The assets indicator considers small assets as TVs, radios, telephones (landline or mobile), refrigerators, washers, motorcycles, and
big assets as cars or trucks. We require the household to have a car or any two of the other assets to be considered non-deprived. - Electricity: If household does not have electricity. - Drinking water: If water source does not meet MDG definitions, or is more than 30-minute walk from water source. - Sanitation: If toilet facilities do not meet MDG definitions, or the toilet is shared. - Flooring: If the floor is dirt or sand. - Cooking Fuel: If they cook with wood, charcoal, or dung. e PCE quintiles for non-medical expenditures were calculated for all working-age households. HH stands for Household.
Source: Authors' calculations based on WHS. All estimates are weighted and adjusted for WHS complex design.

223
Asset index scores show no significant difference when measured across disability status. The left panel of Figure 1 shows the CDF of the asset index scores for both households with and without disabilities, with little difference between the two. A second indicator for asset ownership considers small assets including TVs, radios, telephones (landline or mobile), refrigerators, washers, motorcycles, and big assets including cars or trucks. We require the household to have a car or any two of the other assets to be considered non-deprived. The percentage of households that are asset-deprived, by this measure, is close to 1 percent for both groups. Differences in livings conditions across household disability status are also statistically insignificant.
Figure 1: Mexico: Cumulative Distribution of Asset Index Score and Per Capita
Household Expenditures
Note: HH stands for Household.
Median per-capita total monthly, non-medical PCE are similar for households with disabilities compared to other households (median PCE: US$71.15 for each group).18 Mean PCE is higher for households with disabilities than other households (mean PCE: US$247.55 versus US$190.16, p<0.05). The right panel of Figure 1 shows the cumulative distribution function of non-medical expenditures for both households with and without disabilities. In addition to higher non-medical expenditures, households with disabilities show a higher ratio of medical to total monthly expenditures (8 percent versus 4 percent, p<0.05).
18 Monthly PCE Figures are denoted in international $, PPP 2005, adjusted for inflation.

224
Disability and poverty (Tables 2, 3, and 4; Figures 2a, 2b, 3a, and 3b)
Poverty is compared across disability status using five different methods to identify the poor: a multidimensional method, the bottom asset index or PCE quintile, and living under US$1.25 or US$2.00 a day.
Multidimensional poverty rates are shown at the bottom of Table 2 and in Figure 2a. Individuals with disabilities face higher multidimensional poverty rates compared to persons without disabilities (22 percent versus 14 percent, Chi-sq<0.05). This result is similar across rural/ urban regions and for both disability measures. The spider chart in Figure 2b compares individuals with disabilities to those without across each dimension used in this poverty measure. The plots represent deprivation rates for each dimension. The plot for persons with disabilities falls outside of the plot for persons without disabilities in three dimensions: no employment, no primary education, and medical expense ratio above 10 percent, reflecting higher rates of deprivation in these areas.
Figure 2a: Mexico: Multidimensional Poverty Rates for Individuals with and without Disabilities
-
0.20
0.40
0.60
0.80
All Rural Urban
With Disability No Disability
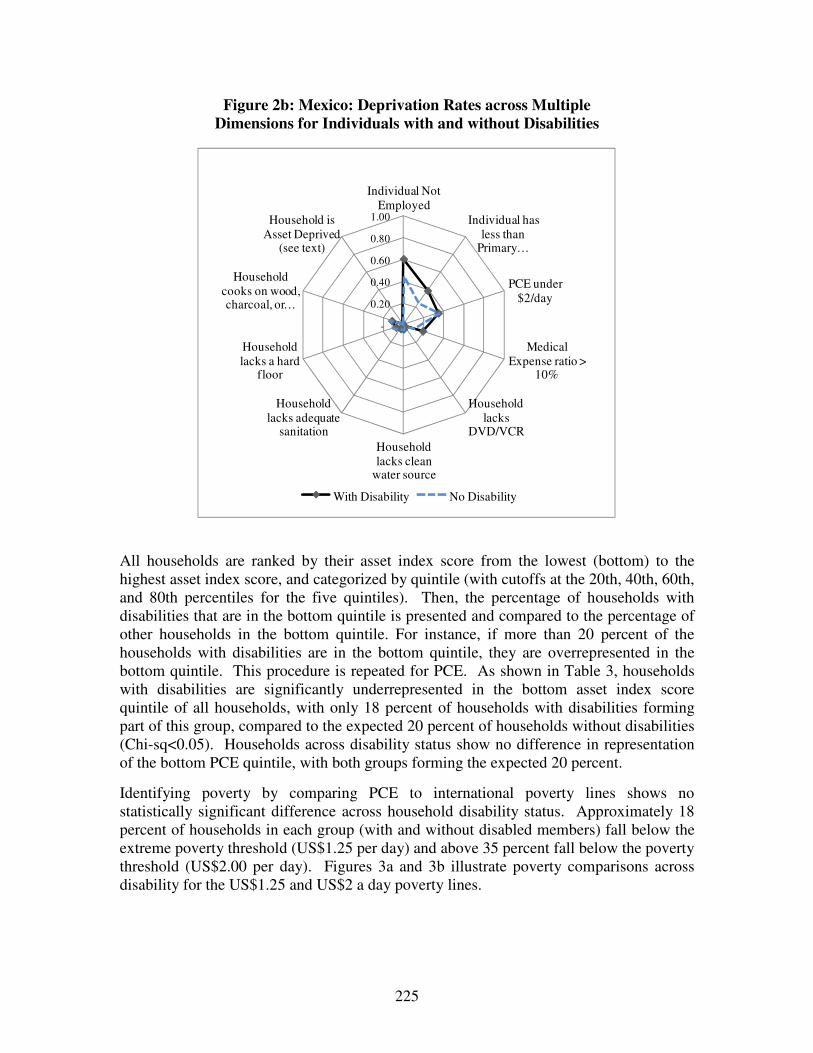
225
Figure 2b: Mexico: Deprivation Rates across Multiple Dimensions for Individuals with and without Disabilities
-
0.20
0.40
0.60
0.80
1.00
Individual Not Employed
Individual has less than
Primary …
PCE under $2/day
Medical Expense ratio >
10%
Household lacks
DVD/VCRHousehold lacks clean
water source
Household lacks adequate
sanitation
Household lacks a hard
floor
Household cooks on wood, charcoal, or …
Household is Asset Deprived
(see text)
With Disability No Disability
All households are ranked by their asset index score from the lowest (bottom) to the highest asset index score, and categorized by quintile (with cutoffs at the 20th, 40th, 60th, and 80th percentiles for the five quintiles). Then, the percentage of households with disabilities that are in the bottom quintile is presented and compared to the percentage of other households in the bottom quintile. For instance, if more than 20 percent of the households with disabilities are in the bottom quintile, they are overrepresented in the bottom quintile. This procedure is repeated for PCE. As shown in Table 3, households with disabilities are significantly underrepresented in the bottom asset index score quintile of all households, with only 18 percent of households with disabilities forming part of this group, compared to the expected 20 percent of households without disabilities (Chi-sq<0.05). Households across disability status show no difference in representation of the bottom PCE quintile, with both groups forming the expected 20 percent.
Identifying poverty by comparing PCE to international poverty lines shows no statistically significant difference across household disability status. Approximately 18 percent of households in each group (with and without disabled members) fall below the extreme poverty threshold (US$1.25 per day) and above 35 percent fall below the poverty threshold (US$2.00 per day). Figures 3a and 3b illustrate poverty comparisons across disability for the US$1.25 and US$2 a day poverty lines.

226
Figure 3a: Mexico: Poverty Rates (Percentage below US$1.25 a day) for
Household with/without a Disabled Member
Figure 3b: Mexico: Poverty Rates (Percentage below US$2.00 a day) for
Household with/without a Disabled Member
0.00
0.20
0.40
0.60
0.80
All Rural Urban
With Disability No Disability
0.00
0.20
0.40
0.60
0.80
All Rural Urban
With Disability No Disability
Table 4 shows the disability prevalence for the poor versus the non-poor, using each of the five definitions of poverty studied above. Disability prevalence is approximately two to nine percentage points higher for the multidimensional poor, depending on the disability measures employed and the area analyzed (p<0.05 for each). Using the base disability measure for the entire country, 8.30 percent of multidimensionally poor persons have a disability, compared to 4.81 percent of non-poor persons (p<0.05). Across the other four poverty definitions used, differences in disability prevalence across poverty status are not statistically significant (whether measured as a comparison of the bottom versus upper quintiles for asset index and PCE, or measured as falling below or above the US$1.25 and US$2 a day poverty lines).

227
Table 4: Mexico: Prevalence of Disability among Working-Age (18-65) Population across Poverty Status a
Poverty identification Individuals
who are multidimensionally
poor b
Individuals in HHs in bottom
asset index quintile c
Individuals in HHs in bottom PCE quintile d
Individuals in HHs with PCE below US$1.25
PPP 2005
Individuals in HHs with PCE below US$2.00
PPP 2005 Poverty status Poor Non-
poor Poor Non-
poor Poor Non-
poor Poor Non-
poor Poor Non-
poor
All Disability prevalence (base) 8.30 4.81 * 4.79 5.42 5.66 5.21 5.79 5.18 5.44 5.22 Disability prevalence
(expanded)
11.83 6.72 * 7.41 7.45 8.02 7.29 8.10 7.28 7.82 7.22
Rural
Disability prevalence (base) 6.67 4.20 * 4.83 5.37 5.13 5.01 5.31 4.88 4.93 5.34
Disability prevalence
(expanded)
9.79 6.47 * 7.56 7.75 7.78 7.53 7.91 7.44 7.47 7.98
Urban Disability prevalence (base) 10.96 4.95 * 4.66 5.42 6.30 5.25 6.42 5.25 5.84 5.20 Disability prevalence
(expanded)
15.18 6.78 * 6.99 7.40 8.31 7.24 8.36 7.25 8.11 7.10
Note: a For explanations on the disability measures, see notes in text or Table 1. b Multidimensional variable as developed by Alkire and Foster method k=40%, as described in text. c For explanations on the calculation of the asset index, see text. d PCE refers to monthly, non-medical household per-capita expenditures. * T-Test suggests significant difference from "Non-poor" at 5%. HH stands for household.
Source: Authors' calculations based on WHS. All estimates are weighted and adjust for WHS complex design.
Conclusion
In Mexico, descriptive analysis of WHS data suggests that disability is associated with lower levels of economic well-being across a number of individual- and household- level indicators. At the individual level, working-age persons with disabilities have lower employment rates, rely more heavily on self-employment, and have lower primary education completion rates. In addition, individuals with disabilities are found to have higher rates of multidimensional poverty. At the household level, households with disabilities have a higher ratio of medical to total expenditures. On the other hand, households with disabilities, on average, have higher mean PCE than other households.
228
C.3.4 Disability Profile: Paraguay Prevalence of disability among working-age population, 18-65 years (Table 1)
In Paraguay, disability prevalence among working-age individuals stands at 6.9 percent. With the expanded measure of disability, prevalence goes up to 11.2 percent.
Prevalence rates are similar across rural and urban areas (7.1 percent versus 6.7 percent respectively) but differ across gender. Prevalence rates for women are double those of men (9.7 percent versus 4.0 percent respectively). The discrepancy in gender is driven by the higher rates of difficulty for females for every task. Seeing/recognizing at arm’s length and concentrating/ remembering things have the highest prevalence rates for males, females, and in both rural and urban areas.
Demographic characteristics (Table 2)
Age, gender, and marital characteristics differ significantly across disability. Persons with disabilities are 71 percent female compared to 49 percent for persons without disabilities. The average individual with a disability is eight years older than the average individual without a disability (mean age: 42 versus 34 years p<0.05). The oldest age group (46-65 years) makes up 45 percent of working-age persons with disabilities, compared to only 20 percent for persons without disabilities (Chi-sq<0.05). Forty-nine percent of individuals with disability are married, compared to 41 percent of individuals without.
Education and labor market status (Table 2)
Individuals with disabilities have lower educational attainment and employment. Persons with disabilities have approximately 0.45 less years of education (mean age: 3.29 - 2.84 years, p<0.05) and lower completion rates of primary school compared to persons without disabilities (56 percent versus 72 percent, Chi-sq<0.05). This gap in primary school completion rates is especially high in rural areas (38 percent versus 56 percent, Chi-sq<0.05).
Forty-nine percent of persons with disabilities are employed, compared to 65 percent of persons without disabilities (Chi-sq<0.05). Again, the gap is greater in rural areas (47 percent versus 66 percent non-disabled employed, Chi-sq<0.05). Differences in the type of work that employed individuals do are also statistically significant across disability status, with self-employment making up a greater percentage of employment for persons with disabilities (68 percent versus 52 percent, Chi-sq<0.05).
Household characteristics, assets, living conditions, and expenditures (Table 3)
Comparing households with a working-age adult with a disability to other households, we find no significant difference in average household size or number of children. However, a lower percentage of households with disabilities are headed by a male member (71 percent versus 76 percent for other households, Chi-sq<0.05).

229
Table 1: Paraguay: Prevalence of Disability among Working-Age (18-65) Population
All Rural Urban
All Seeing/recognizing across the road 2.6% 2.8% 2.5% Seeing/recognizing at arm's length 4.0% 5.5% 2.9% Moving around 1.7% 1.7% 1.7% Concentrating/remembering things 3.5% 3.6% 3.4% Self-care 0.5% 0.7% 0.4% Personal relationships 1.0% 0.9% 1.0% Learning a new task 2.3% 3.0% 1.8% Dealing with conflict 1.9% 1.4% 2.2% Disability prevalence
a 6.9% 7.1% 6.7%
Disability prevalence (expanded)b 11.2% 11.7% 10.9%
Males Seeing/recognizing across the road 1.4% 1.5% 1.3% Seeing/recognizing at arm's length 2.8% 3.6% 2.1% Moving around 0.8% 1.0% 0.6% Concentrating/remembering things 1.8% 2.1% 1.5% Self-care 0.4% 0.5% 0.4% Personal relationships 0.5% 0.7% 0.4% Learning a new task 1.2% 1.5% 1.0% Dealing with conflict 1.4% 1.5% 1.4% Disability prevalence
a 4.0% 4.4% 3.5%
Disability prevalence (expanded)b 7.6% 8.3% 7.0%
Females Seeing/recognizing across the road 3.8% 4.3% 3.5% Seeing/recognizing at arm's length 5.2% 7.8% 3.6% Moving around 2.6% 2.4% 2.6% Concentrating/remembering things 5.2% 5.4% 5.1% Self-care 0.6% 0.9% 0.5% Personal relationships 1.4% 1.3% 1.5% Learning a new task 3.4% 4.7% 2.6% Dealing with conflict 2.3% 1.3% 3.0% Disability prevalence
a 9.7% 10.4% 9.3%
Disability prevalence (expanded)b 14.9% 15.9% 14.2%
Number of observations (unweighted) 4,561 2,436 2,125 Number of observations (weighted) 7,054,755 3,069,450 3,985,304
Note: a. Base measure of disability prevalence: A person is considered to have a disability as per the base measure if he/she reports that he/she is unable to do or has severe or extreme difficulty for at least one of the following: seeing/recognizing people across the road; moving around; concentrating or remembering things; or self care.
b. Expanded measure of disability prevalence: A person has a disability as per the expanded measure if he/she reports that he/she is unable to do or has severe or extreme difficulty for at least one of the following: seeing/recognizing people across the road; moving around; concentrating or remembering things; self care; seeing/recognizing object at arm's length; personal relationships/ participation in the community; learning a new task; or dealing with conflicts/tension with others.
Source: Authors' calculations based on WHS. All estimates are weighted and adjusted for WHS complex design.

230
Table 2: Paraguay: Sample Means across Disability Status among Working-Age (18-65) Individuals a b
By Disability By Disability (Expanded)
All Rural Urban All Rural Urban Yes No Yes No Yes No Yes No Yes No Yes No
Demographics
Female 0.71 0.49 # 0.66 0.44 # 0.76 0.52 # 0.66 0.48 # 0.61 0.43 # 0.71 0.52 #
Male 0.29 0.51 # 0.34 0.56 # 0.24 0.48 # 0.34 0.52 # 0.39 0.57 # 0.29 0.48 #
Married 0.49 0.41 # 0.53 0.43 # 0.46 0.40 - 0.50 0.40 # 0.58 0.42 # 0.44 0.39 -
Age 41.98 34.06 44.11 34.17 40.23 33.97 40.88 33.80 43.43 33.74 38.76 33.85
(0.89) (0.23) * (1.15) (0.30) * (1.28) (0.33) * (0.71) (0.23) * (0.86) (0.30) * (1.05) (0.34) *
18-30 0.24 0.46 # 0.19 0.45 # 0.27 0.47 # 0.27 0.47 # 0.20 0.46 # 0.33 0.47 #
31-45 0.31 0.34 # 0.28 0.35 # 0.34 0.33 # 0.30 0.34 # 0.31 0.35 # 0.29 0.34 #
46-65 0.45 0.20 # 0.53 0.20 # 0.39 0.20 # 0.43 0.19 # 0.49 0.19 # 0.38 0.19 #
Urban 0.55 0.57 - - - 0.55 0.57 - - -
Rural 0.45 0.43 - - - 0.45 0.43 - - -
Education and labor market status
Years of education 2.84 3.29 2.37 2.72 3.23 3.73 2.91 3.30 2.43 2.73 3.31 3.74
(0.08) (0.03) * (0.08) (0.03) * (0.12) (0.05) * (0.07) (0.03) * (0.07) (0.03) * (0.10) (0.05) *
Less than primary school
0.44 0.28 # 0.62 0.44 # 0.29 0.15 # 0.43 0.27 # 0.62 0.44 # 0.28 0.14 #
Primary school completed
0.56 0.72 # 0.38 0.56 # 0.71 0.85 # 0.57 0.73 # 0.38 0.56 # 0.72 0.86 #
Not employed 0.51 0.35 # 0.53 0.34 # 0.50 0.35 # 0.51 0.34 # 0.48 0.34 # 0.53 0.34 #
Employed 0.49 0.65 # 0.47 0.66 # 0.50 0.65 # 0.49 0.66 # 0.52 0.66 # 0.47 0.66 #
Type of employment among the employed
Government 0.06 0.12 # 0.02 0.07 - 0.09 0.17 # 0.07 0.12 # 0.05 0.06 - 0.09 0.17 #
Non-government 0.26 0.34 # 0.16 0.22 - 0.34 0.43 # 0.26 0.34 # 0.14 0.23 - 0.37 0.43 #
Self-employed 0.68 0.52 # 0.82 0.71 - 0.57 0.38 # 0.66 0.52 # 0.81 0.70 - 0.53 0.37 #
Employer - 0.02 # - 0.00 - - 0.02 # 0.01 0.02 # - 0.01 - 0.01 0.02 #
Multidimensional Poverty Indicator
Multidimensionally poor (AF Method
k/d=40%)c
0.40 0.29 # 0.65 0.52 # 0.18 0.12 # 0.40 0.29 # 0.65 0.52 # 0.20 0.11 #
Number of
observations
(unweighted)
359 4,202 201 2,235 158 1,967 585 3,975 329 2,107 256 1,868
Note: a For details on the disability measures, see notes in Table 1. b Standard deviations are in parentheses and are adjusted for survey clustering and stratification, estimates are weighted. c Multidimensional measure developed by Alkire and Foster method k/d=40%, as described in text. * T-Test suggests significant difference from "No" at 5%. # Pearson's Chi-Sq Test, p-value less than 5%.
Source: Authors' calculations based on WHS. All estimates are weighted and adjust for WHS complex design.
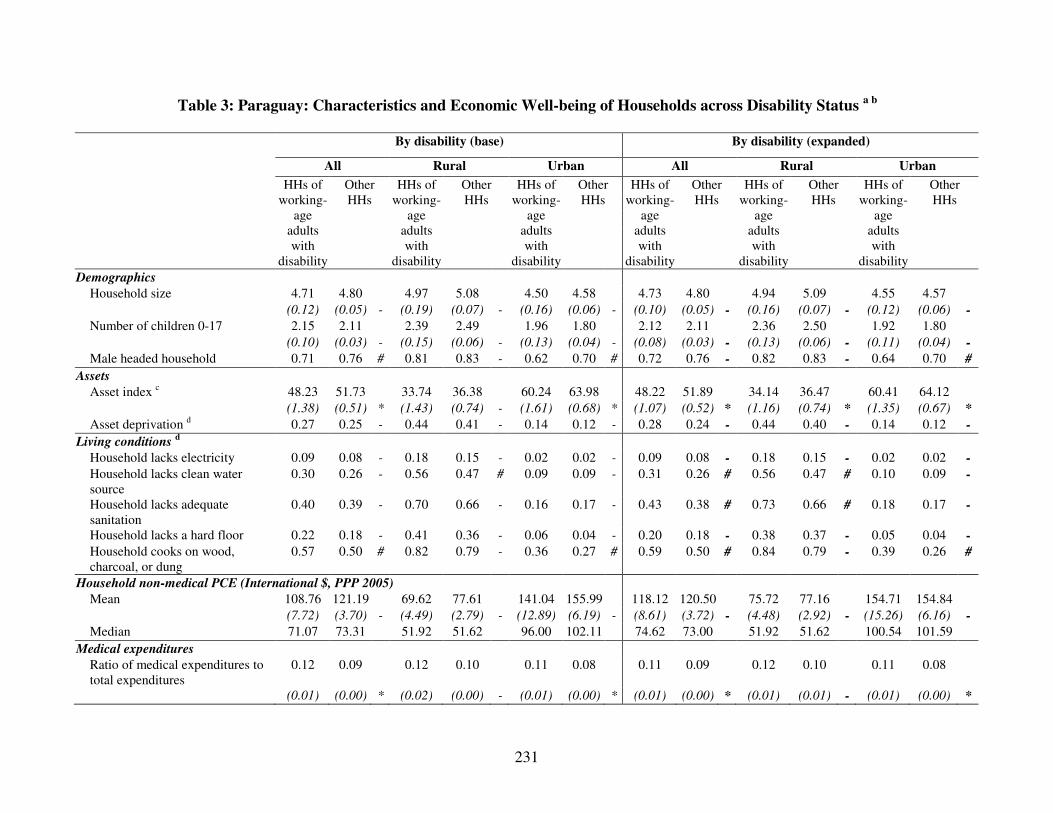
231
Table 3: Paraguay: Characteristics and Economic Well-being of Households across Disability Status a b
By disability (base) By disability (expanded)
All Rural Urban All Rural Urban
HHs of working-
age adults with
disability
Other HHs
HHs of working-
age adults with
disability
Other HHs
HHs of working-
age adults with
disability
Other HHs
HHs of working-
age adults with
disability
Other HHs
HHs of working-
age adults with
disability
Other HHs
HHs of working-
age adults with
disability
Other HHs
Demographics
Household size 4.71 4.80 4.97 5.08 4.50 4.58 4.73 4.80 4.94 5.09 4.55 4.57
(0.12) (0.05) - (0.19) (0.07) - (0.16) (0.06) - (0.10) (0.05) - (0.16) (0.07) - (0.12) (0.06) -
Number of children 0-17 2.15 2.11 2.39 2.49 1.96 1.80 2.12 2.11 2.36 2.50 1.92 1.80
(0.10) (0.03) - (0.15) (0.06) - (0.13) (0.04) - (0.08) (0.03) - (0.13) (0.06) - (0.11) (0.04) -
Male headed household 0.71 0.76 # 0.81 0.83 - 0.62 0.70 # 0.72 0.76 - 0.82 0.83 - 0.64 0.70 #
Assets
Asset index c 48.23 51.73 33.74 36.38 60.24 63.98 48.22 51.89 34.14 36.47 60.41 64.12
(1.38) (0.51) * (1.43) (0.74) - (1.61) (0.68) * (1.07) (0.52) * (1.16) (0.74) * (1.35) (0.67) *
Asset deprivation d 0.27 0.25 - 0.44 0.41 - 0.14 0.12 - 0.28 0.24 - 0.44 0.40 - 0.14 0.12 -
Living conditions d
Household lacks electricity 0.09 0.08 - 0.18 0.15 - 0.02 0.02 - 0.09 0.08 - 0.18 0.15 - 0.02 0.02 -
Household lacks clean water source
0.30 0.26 - 0.56 0.47 # 0.09 0.09 - 0.31 0.26 # 0.56 0.47 # 0.10 0.09 -
Household lacks adequate sanitation
0.40 0.39 - 0.70 0.66 - 0.16 0.17 - 0.43 0.38 # 0.73 0.66 # 0.18 0.17 -
Household lacks a hard floor 0.22 0.18 - 0.41 0.36 - 0.06 0.04 - 0.20 0.18 - 0.38 0.37 - 0.05 0.04 -
Household cooks on wood, charcoal, or dung
0.57 0.50 # 0.82 0.79 - 0.36 0.27 # 0.59 0.50 # 0.84 0.79 - 0.39 0.26 #
Household non-medical PCE (International $, PPP 2005)
Mean 108.76 121.19 69.62 77.61 141.04 155.99 118.12 120.50 75.72 77.16 154.71 154.84
(7.72) (3.70) - (4.49) (2.79) - (12.89) (6.19) - (8.61) (3.72) - (4.48) (2.92) - (15.26) (6.16) -
Median 71.07 73.31 51.92 51.62 96.00 102.11 74.62 73.00 51.92 51.62 100.54 101.59
Medical expenditures
Ratio of medical expenditures to total expenditures
0.12 0.09 0.12 0.10 0.11 0.08 0.11 0.09 0.12 0.10 0.11 0.08
(0.01) (0.00) * (0.02) (0.00) - (0.01) (0.00) * (0.01) (0.00) * (0.01) (0.01) - (0.01) (0.00) *
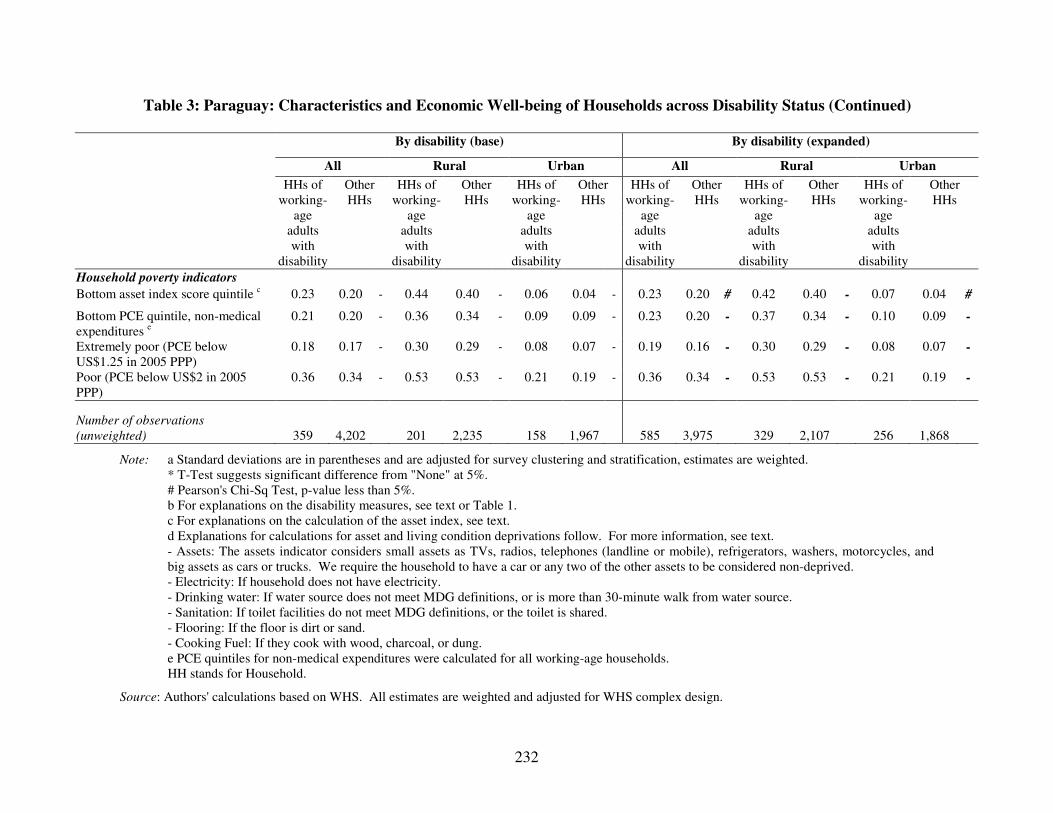
232
Table 3: Paraguay: Characteristics and Economic Well-being of Households across Disability Status (Continued)
By disability (base) By disability (expanded)
All Rural Urban All Rural Urban
HHs of working-
age adults with
disability
Other HHs
HHs of working-
age adults with
disability
Other HHs
HHs of working-
age adults with
disability
Other HHs
HHs of working-
age adults with
disability
Other HHs
HHs of working-
age adults with
disability
Other HHs
HHs of working-
age adults with
disability
Other HHs
Household poverty indicators
Bottom asset index score quintile c 0.23 0.20 - 0.44 0.40 - 0.06 0.04 - 0.23 0.20 # 0.42 0.40 - 0.07 0.04 #
Bottom PCE quintile, non-medical expenditures e
0.21 0.20 - 0.36 0.34 - 0.09 0.09 - 0.23 0.20 - 0.37 0.34 - 0.10 0.09 -
Extremely poor (PCE below US$1.25 in 2005 PPP)
0.18 0.17 - 0.30 0.29 - 0.08 0.07 - 0.19 0.16 - 0.30 0.29 - 0.08 0.07 -
Poor (PCE below US$2 in 2005 PPP)
0.36 0.34 - 0.53 0.53 - 0.21 0.19 - 0.36 0.34 - 0.53 0.53 - 0.21 0.19 -
Number of observations
(unweighted) 359 4,202 201 2,235 158 1,967 585 3,975 329 2,107 256 1,868
Note: a Standard deviations are in parentheses and are adjusted for survey clustering and stratification, estimates are weighted. * T-Test suggests significant difference from "None" at 5%. # Pearson's Chi-Sq Test, p-value less than 5%. b For explanations on the disability measures, see text or Table 1. c For explanations on the calculation of the asset index, see text. d Explanations for calculations for asset and living condition deprivations follow. For more information, see text. - Assets: The assets indicator considers small assets as TVs, radios, telephones (landline or mobile), refrigerators, washers, motorcycles, and big assets as cars or trucks. We require the household to have a car or any two of the other assets to be considered non-deprived. - Electricity: If household does not have electricity. - Drinking water: If water source does not meet MDG definitions, or is more than 30-minute walk from water source. - Sanitation: If toilet facilities do not meet MDG definitions, or the toilet is shared. - Flooring: If the floor is dirt or sand. - Cooking Fuel: If they cook with wood, charcoal, or dung. e PCE quintiles for non-medical expenditures were calculated for all working-age households. HH stands for Household.
Source: Authors' calculations based on WHS. All estimates are weighted and adjusted for WHS complex design.

233
Households with disabilities have a lower asset ownership score than other households (48.23 versus 51.73 respectively, p<0.05). The left panel of Figure 1 shows the CDF of asset index scores for both households with and without disabilities. The CDFs for the two groups are relatively close but the CDF for households with disabilities resides to the left and above the CDF for households without disabilities, suggesting lower asset ownership levels for households with disabilities.
A second indicator for asset ownership considers small assets including TVs, radios, telephones (landline or mobile), refrigerators, washers, motorcycles, and big assets including cars or trucks. We require the household to have a car or any two of the other assets to be considered non-deprived. The percentage of households that are asset-deprived, by this measure, is higher for households with disabilities (27 percent versus 25 percent), but this difference is not statistically significant. The share of households lacking adequate cooking fuel sources is higher for households with a working-age adult with disability (Chi-sq<0.05).
Figure 1: Paraguay: Cumulative Distribution of Asset Index Score and Per Capita
Household Expenditures
Note: HH stands for household.
Median household non-medical PCEs are similar for households with disabilities compared to other households (median PCE: US$71.07 versus US$73.31).19 While we find no significant difference in mean PCE (US$108.76 versus US$121.19 for other households), households with disabilities have a higher mean ratio of medical to total expenditures (12 percent versus 9 percent for other households, p<0.05). The right panel of Figure 1 shows the cumulative distribution function of non-medical expenditures for both households with and without disabilities. The combination of similar PCE, higher 19 Monthly PCE Figures are denoted in international $, PPP 2005, adjusted for inflation.
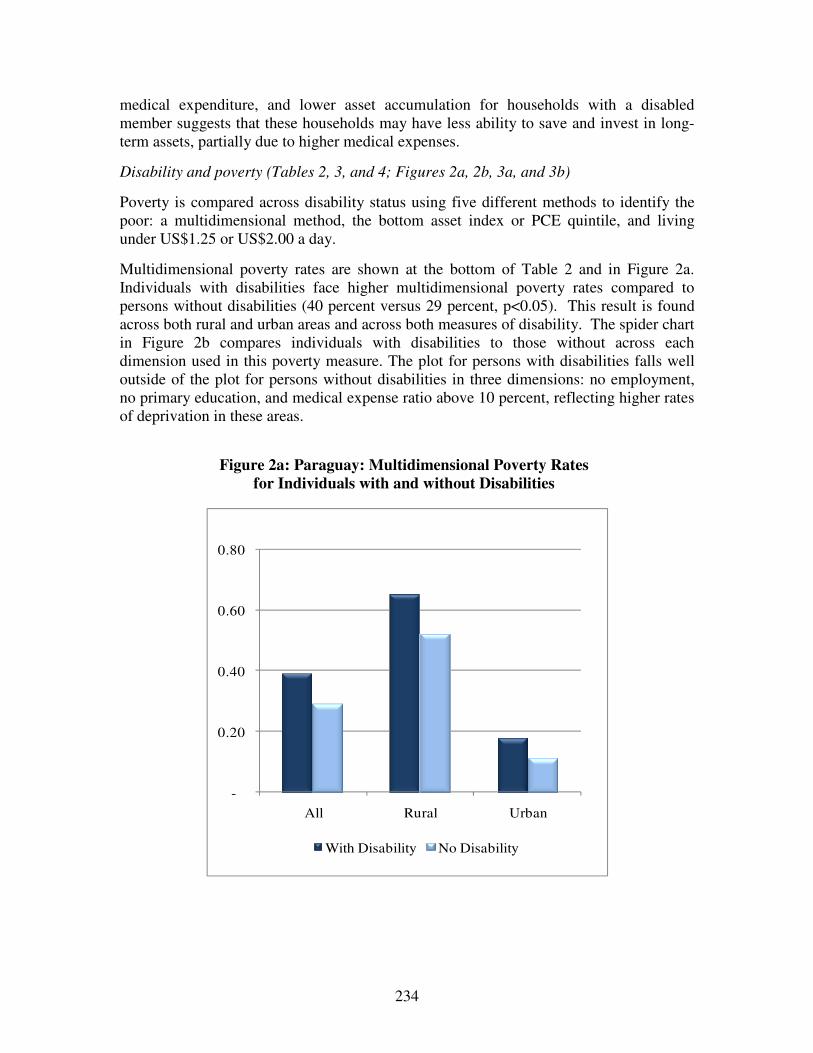
234
medical expenditure, and lower asset accumulation for households with a disabled member suggests that these households may have less ability to save and invest in long-term assets, partially due to higher medical expenses.
Disability and poverty (Tables 2, 3, and 4; Figures 2a, 2b, 3a, and 3b)
Poverty is compared across disability status using five different methods to identify the poor: a multidimensional method, the bottom asset index or PCE quintile, and living under US$1.25 or US$2.00 a day.
Multidimensional poverty rates are shown at the bottom of Table 2 and in Figure 2a. Individuals with disabilities face higher multidimensional poverty rates compared to persons without disabilities (40 percent versus 29 percent, p<0.05). This result is found across both rural and urban areas and across both measures of disability. The spider chart in Figure 2b compares individuals with disabilities to those without across each dimension used in this poverty measure. The plot for persons with disabilities falls well outside of the plot for persons without disabilities in three dimensions: no employment, no primary education, and medical expense ratio above 10 percent, reflecting higher rates of deprivation in these areas.
Figure 2a: Paraguay: Multidimensional Poverty Rates
for Individuals with and without Disabilities
-
0.20
0.40
0.60
0.80
All Rural Urban
With Disability No Disability
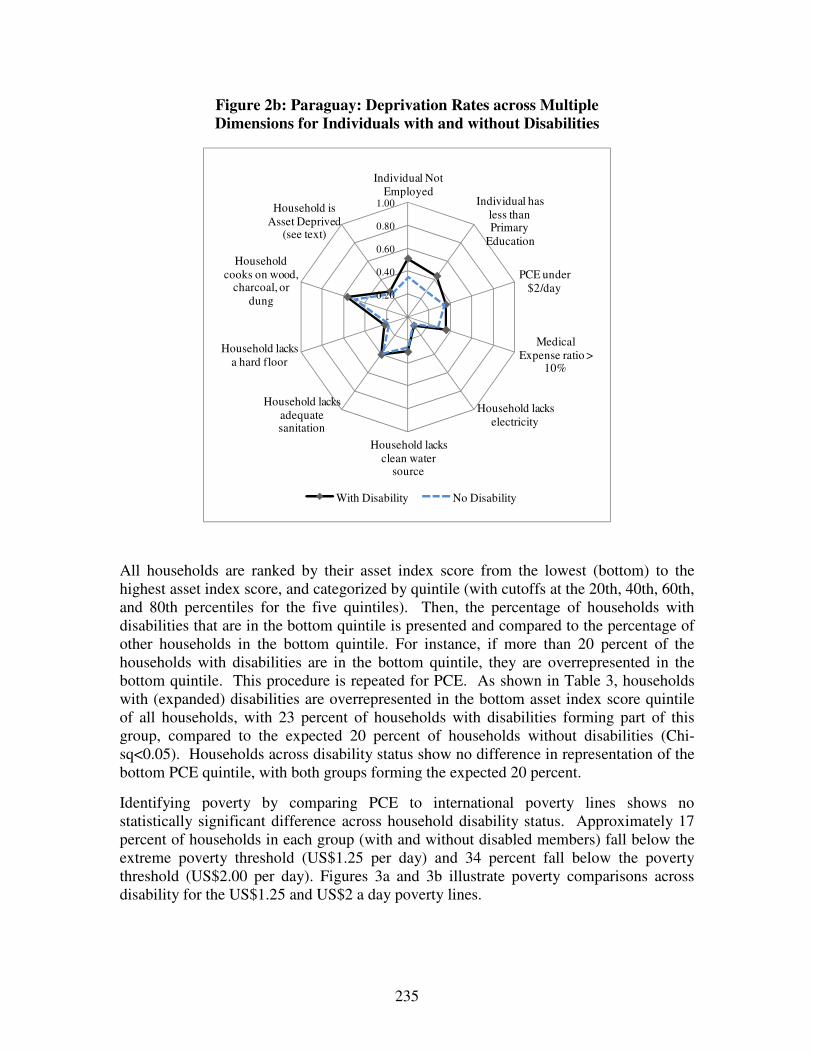
235
Figure 2b: Paraguay: Deprivation Rates across Multiple Dimensions for Individuals with and without Disabilities
-
0.20
0.40
0.60
0.80
1.00
Individual Not Employed
Individual has less than Primary
Education
PCE under $2/day
Medical Expense ratio >
10%
Household lacks electricity
Household lacks clean water
source
Household lacks adequate sanitation
Household lacks a hard floor
Household cooks on wood,
charcoal, or dung
Household is Asset Deprived
(see text)
With Disability No Disability
All households are ranked by their asset index score from the lowest (bottom) to the highest asset index score, and categorized by quintile (with cutoffs at the 20th, 40th, 60th, and 80th percentiles for the five quintiles). Then, the percentage of households with disabilities that are in the bottom quintile is presented and compared to the percentage of other households in the bottom quintile. For instance, if more than 20 percent of the households with disabilities are in the bottom quintile, they are overrepresented in the bottom quintile. This procedure is repeated for PCE. As shown in Table 3, households with (expanded) disabilities are overrepresented in the bottom asset index score quintile of all households, with 23 percent of households with disabilities forming part of this group, compared to the expected 20 percent of households without disabilities (Chi-sq<0.05). Households across disability status show no difference in representation of the bottom PCE quintile, with both groups forming the expected 20 percent.
Identifying poverty by comparing PCE to international poverty lines shows no statistically significant difference across household disability status. Approximately 17 percent of households in each group (with and without disabled members) fall below the extreme poverty threshold (US$1.25 per day) and 34 percent fall below the poverty threshold (US$2.00 per day). Figures 3a and 3b illustrate poverty comparisons across disability for the US$1.25 and US$2 a day poverty lines.

236
Figure 3a: Paraguay: Poverty Rates (Percentage below US$1.25 a day) for
Household with/without a Disabled Member
Figure 3b: Paraguay: Poverty Rates (Percentage below US$2.00 a day) for
Household with/without a Disabled Member
0.00
0.20
0.40
0.60
All Rural Urban
With Disability No Disability
0.00
0.20
0.40
0.60
All Rural Urban
With Disability No Disability
Table 4 shows the disability prevalence for the poor versus the non-poor, using each of the five definitions of poverty studied above. Disability prevalence ranges from three to eight percentage points higher for the multidimensional poor, compared to the non-poor, ranging across rural and urban area and for both disability measures (p<0.05). Using the base disability measure for the entire country, 9.06 percent of multidimensionally poor persons have a disability, compared to 5.93 percent of non-poor persons (p<0.05).
Across the other four poverty definitions used, differences in disability prevalence across poverty status are not statistically significant (whether measured as a comparison of the bottom versus upper quintiles for asset index and PCE, or measured as falling below or above the US$1.25 and US$2 a day poverty lines).
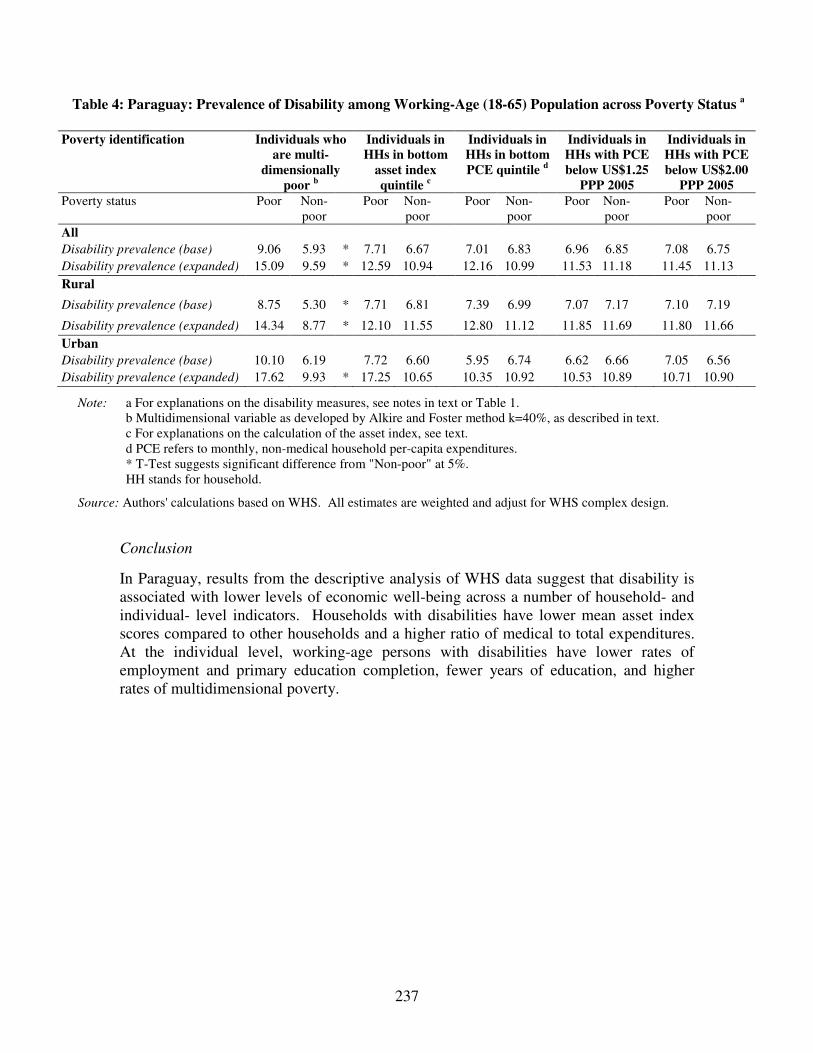
237
Table 4: Paraguay: Prevalence of Disability among Working-Age (18-65) Population across Poverty Status a
Poverty identification Individuals who
are multi-dimensionally
poor b
Individuals in HHs in bottom
asset index quintile c
Individuals in HHs in bottom PCE quintile d
Individuals in HHs with PCE below US$1.25
PPP 2005
Individuals in HHs with PCE below US$2.00
PPP 2005 Poverty status Poor Non-
poor Poor Non-
poor Poor Non-
poor Poor Non-
poor Poor Non-
poor
All Disability prevalence (base) 9.06 5.93 * 7.71 6.67 7.01 6.83 6.96 6.85 7.08 6.75 Disability prevalence (expanded) 15.09 9.59 * 12.59 10.94 12.16 10.99 11.53 11.18 11.45 11.13
Rural
Disability prevalence (base) 8.75 5.30 * 7.71 6.81 7.39 6.99 7.07 7.17 7.10 7.19
Disability prevalence (expanded) 14.34 8.77 * 12.10 11.55 12.80 11.12 11.85 11.69 11.80 11.66
Urban Disability prevalence (base) 10.10 6.19 7.72 6.60 5.95 6.74 6.62 6.66 7.05 6.56 Disability prevalence (expanded) 17.62 9.93 * 17.25 10.65 10.35 10.92 10.53 10.89 10.71 10.90
Note: a For explanations on the disability measures, see notes in text or Table 1. b Multidimensional variable as developed by Alkire and Foster method k=40%, as described in text. c For explanations on the calculation of the asset index, see text. d PCE refers to monthly, non-medical household per-capita expenditures. * T-Test suggests significant difference from "Non-poor" at 5%. HH stands for household.
Source: Authors' calculations based on WHS. All estimates are weighted and adjust for WHS complex design.
Conclusion
In Paraguay, results from the descriptive analysis of WHS data suggest that disability is associated with lower levels of economic well-being across a number of household- and individual- level indicators. Households with disabilities have lower mean asset index scores compared to other households and a higher ratio of medical to total expenditures. At the individual level, working-age persons with disabilities have lower rates of employment and primary education completion, fewer years of education, and higher rates of multidimensional poverty.
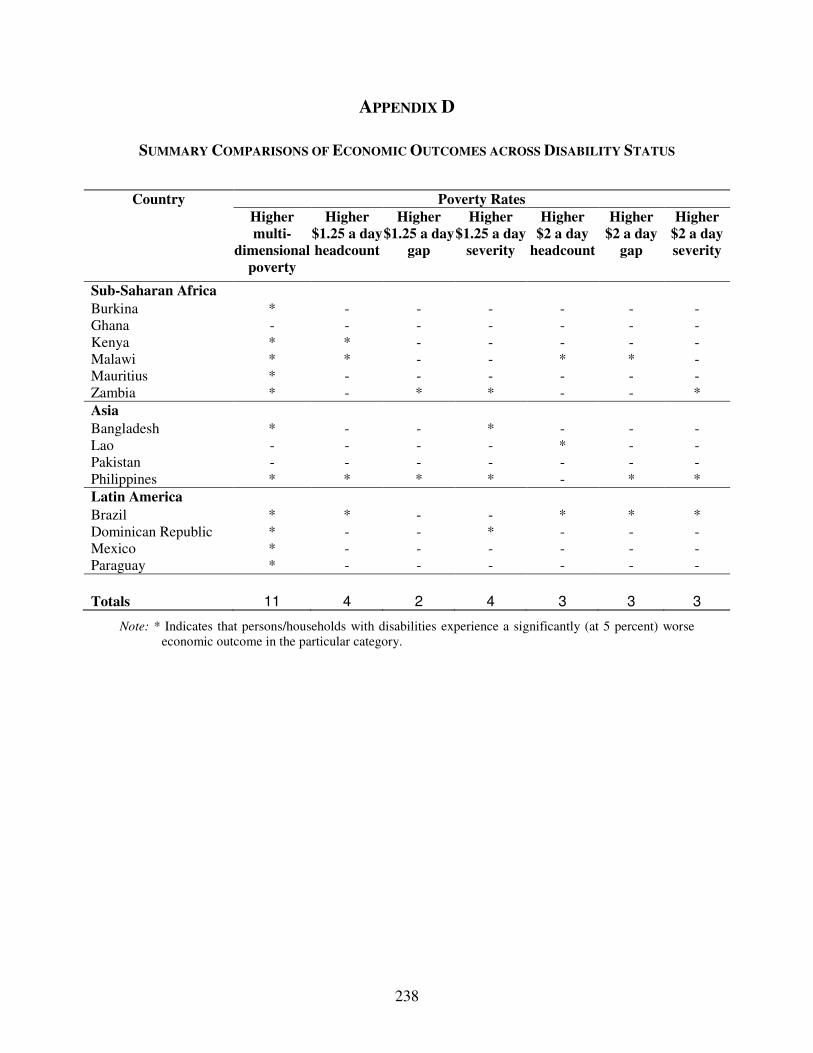
238
APPENDIX D
SUMMARY COMPARISONS OF ECONOMIC OUTCOMES ACROSS DISABILITY STATUS
Country Poverty Rates
Higher multi-
dimensional poverty
Higher $1.25 a day headcount
Higher $1.25 a day
gap
Higher $1.25 a day
severity
Higher $2 a day
headcount
Higher $2 a day
gap
Higher $2 a day severity
Sub-Saharan Africa Burkina * - - - - - - Ghana - - - - - - - Kenya * * - - - - - Malawi * * - - * * - Mauritius * - - - - - - Zambia * - * * - - * Asia Bangladesh * - - * - - - Lao - - - - * - - Pakistan - - - - - - - Philippines * * * * - * * Latin America Brazil * * - - * * * Dominican Republic * - - * - - - Mexico * - - - - - - Paraguay * - - - - - -
Totals 11 4 2 4 3 3 3
Note: * Indicates that persons/households with disabilities experience a significantly (at 5 percent) worse economic outcome in the particular category.


Social Protection Discussion Paper Series Titles No. Title 1109 Disability and Poverty in Developing Countries: A Snapshot from the World
Health Survey by Sophie Mitra, Aleksandra Posarac and Brandon Vick, April 2011 1108 Advancing Adult Learning in Eastern Europe and Central Asia by Christian Bodewig and Sarojini Hirshleifer, April 2011 (online only) 1107 Results Readiness in Social Protection & Labor Operations by Laura Rawlings, Maddalena Honorati, Gloria Rubio and Julie Van Domelen,
February 2011 1106 Results Readiness in Social Protection & Labor Operations: Technical Guidance
Notes for Social Service Delivery Projects by Julie Van Domelen, February 2011 1105 Results Readiness in Social Protection & Labor Operations: Technical Guidance
Notes for Social Safety Nets Task Teams by Gloria Rubio, February 2011 1104 Results Readiness in Social Protection & Labor Operations: Technical Guidance
Notes for Social Funds Task Teams by Julie Van Domelen, February 2011 1103 Results Readiness in Social Protection & Labor Operations: Technical Guidance
Notes for Labor Markets Task Teams by Maddalena Honorati, February 2011 1102 Natural Disasters: What is the Role for Social Safety Nets? by Larissa Pelham, Edward Clay and Tim Braunholz, February 2011 1101 North-South Knowledge Sharing on Incentive-based Conditional Cash Transfer
Programs by Lawrence Aber and Laura B. Rawlings, January 2011 1008 Social Policy, Perceptions and the Press: An Analysis of the Media’s Treatment
of Conditional Cash Transfers in Brazil by Kathy Lindert and Vanina Vincensini, December 2010 (online only) 1007 Bringing Financial Literacy and Education to Low and Middle Income
Countries: The Need to Review, Adjust, and Extend Current Wisdom by Robert Holzmann, July 2010 (online only) 1006 Key Characteristics of Employment Regulation in the Middle East and North
Africa by Diego F. Angel-Urdinola and Arvo Kuddo with support from Kimie Tanabe
and May Wazzan, July 2010 (online only)

1005 Non-Public Provision of Active Labor Market Programs in Arab-Mediterranean Countries: An Inventory of Youth Programs
by Diego F. Angel-Urdinola, Amina Semlali and Stefanie Brodmann, July 2010 (online only)
1004 The Investment in Job Training: Why Are SMEs Lagging So Much Behind? by Rita K. Almeida and Reyes Aterido, May 2010 (online only) 1003 Disability and International Cooperation and Development: A Review of Policies
and Practices by Janet Lord, Aleksandra Posarac, Marco Nicoli, Karen Peffley, Charlotte
McClain-Nhlapo and Mary Keogh, May 2010 1002 Toolkit on Tackling Error, Fraud and Corruption in Social Protection Programs by Christian van Stolk and Emil D. Tesliuc, March 2010 (online only) 1001 Labor Market Policy Research for Developing Countries: Recent Examples from
the Literature - What do We Know and What should We Know? by Maria Laura Sanchez Puerta, January 2010 (online only)
0931 The Korean Case Study: Past Experience and New Trends in Training Policies by Young-Sun Ra and Kyung Woo Shim, December 2009 (online only) 0930 Migration Pressures and Immigration Policies: New Evidence on the Selection of
Migrants by Johanna Avato, December 2009 (online only) 0929 Ex-Ante Methods to Assess the Impact of Social Insurance Policies on Labor
Supply with an Application to Brazil by David A. Robalino, Eduardo Zylberstajn, Helio Zylberstajn and
Luis Eduardo Afonso, December 2009 (online only) 0928 Rethinking Survivor Benefits by Estelle James, December 2009 (online only) 0927 How Much Do Latin American Pension Programs Promise to Pay Back? by Alvaro Forteza and Guzmán Ourens, December 2009 (online only) 0926 Work Histories and Pension Entitlements in Argentina, Chile and Uruguay by Alvaro Forteza, Ignacio Apella, Eduardo Fajnzylber, Carlos Grushka, Ianina
Rossi and Graciela Sanroman, December 2009 (online only) 0925 Indexing Pensions
by John Piggott and Renuka Sane, December 2009 (online only) 0924 Towards Comprehensive Training by Jean Fares and Olga Susana Puerto, November 2009 0923 Pre-Employment Skills Development Strategies in the OECD by Yoo Jeung Joy Nam, November 2009

0922 A Review of National Training Funds by Richard Johanson, November 2009 0921 Pre-Employment Vocational Education and Training in Korea by ChangKyun Chae and Jaeho Chung, November 2009 0920 Labor Laws in Eastern European and Central Asian Countries: Minimum Norms
and Practices by Arvo Kuddo, November 2009 (online only) 0919 Openness and Technological Innovation in East Asia: Have They Increased the
Demand for Skills? by Rita K. Almeida, October 2009 (online only) 0918 Employment Services and Active Labor Market Programs in Eastern European
and Central Asian Countries by Arvo Kuddo, October 2009 (online only) 0917 Productivity Increases in SMEs: With Special Emphasis on In-Service Training
of Workers in Korea by Kye Woo Lee, October 2009 (online only)
0916 Firing Cost and Firm Size: A Study of Sri Lanka's Severance Pay System
by Babatunde Abidoye, Peter F. Orazem and Milan Vodopivec, September 2009 (online only)
0915 Personal Opinions about the Social Security System and Informal Employment:
Evidence from Bulgaria by Valeria Perotti and Maria Laura Sánchez Puerta, September 2009
0914 Building a Targeting System for Bangladesh based on Proxy Means Testing by Iffath A. Sharif, August 2009 (online only) 0913 Savings for Unemployment in Good or Bad Times: Options for Developing
Countries by David Robalino, Milan Vodopivec and András Bodor, August 2009 (online
only) 0912 Social Protection for Migrants from the Pacific Islands in Australia and New
Zealand by Geoff Woolford, May 2009 (online only) 0911 Human Trafficking, Modern Day Slavery, and Economic Exploitation
by Johannes Koettl, May 2009 0910 Unemployment Insurance Savings Accounts in Latin America: Overview and
Assessment by Ana M. Ferrer and W. Craig Riddell, June 2009 (online only) 0909 Definitions, Good Practices, and Global Estimates on the Status of Social
Protection for International Migrants by Johanna Avato, Johannes Koettl, and Rachel Sabates-Wheeler, May 2009
(online only) 0908 Regional Overview of Social Protection for Non-Citizens in the Southern
African Development Community (SADC) by Marius Olivier, May 2009 (online only)
0907 Introducing Unemployment Insurance to Developing Countries by Milan Vodopivec, May 2009 (online only) 0906 Social Protection for Refugees and Asylum Seekers in the Southern Africa
Development Community (SADC) by Mpho Makhema, April 2009 (online only) 0905 How to Make Public Works Work: A Review of the Experiences by Carlo del Ninno, Kalanidhi Subbarao and Annamaria Milazzo, May 2009
(online only) 0904 Slavery and Human Trafficking: International Law and the Role of the World
Bank by María Fernanda Perez Solla, April 2009 (online only) 0903 Pension Systems for the Informal Sector in Asia edited by Landis MacKellar, March 2009 (online only) 0902 Structural Educational Reform: Evidence from a Teacher’s Displacement
Program in Armenia by Arvo Kuddo, January 2009 (online only) 0901 Non-performance of the Severance Pay Program in Slovenia by Milan Vodopivec, Lilijana Madzar, Primož Dolenc, January 2009 (online
only)
To view Social Protection Discussion papers published prior to 2009, please visit www.worldbank.org/sp.

About this series
Abstract
This study aims to contribute to the empirical research on social and economic conditions of people with disabilities in developing countries. Using comparable data and methods across countries, this study presents a snapshot of economic and poverty situation of working-age persons with disabilities and their households in 15 developing countries. The study uses data from the World Health Survey conducted by the World Health Organization. The countries for this study are: Burkina Faso, Ghana, Kenya, Malawi, Mauritius, Zambia, and Zimbabwe in Africa; Bangladesh, Lao People’s Democratic Republic (Lao PDR), Pakistan, and the Philippines in Asia; and Brazil, Dominican Republic, Mexico, and Paraguay in Latin America and the Caribbean. The selection of the countries was driven by the data quality.
HUMAN DEVELOPMENT NETWORK
About this series...
Social Protection Discussion Papers are published to communicate the results of The World Bank’s work to the development community with the least possible delay. The typescript manuscript of this paper therefore has not been prepared in accordance with the procedures appropriate to formally edited texts. The findings, interpretations, and conclusions expressed herein are those of the author(s), and do not necessarily reflect the views of the International Bank for Reconstruction and Development / The World Bank and its affiliated organizations, or those of the Executive Directors of The World Bank or the governments they represent. The World Bank does not guarantee the accuracy of the data included in this work. For free copies of this paper, please contact the Social Protection Advisory Service, The World Bank, 1818 H Street, N.W., Room G7-703, Washington, D.C. 20433 USA. Telephone: (202) 458-5267, Fax: (202) 614-0471, E-mail: [email protected] or visit the Social Protection website at www.worldbank.org/sp.
Disability and Poverty in Developing Countries: A Snapshot from the World Health Survey
Sophie Mitra, Aleksandra Posarac and Brandon Vick
S P D I S C U S S I O N P A P E R
January 2011
NO. 1109


![Disability and Poverty[1]](https://img.pdfslide.net/doc/110x75/53fcc47fdab5ca94038b48fc/disability-and-poverty1.jpg)