Embed Size (px)
Citation preview
Research Service, Parliamentary Library,
Department of Parliamentary Services
Research Paper No. 2, 2006
DISADVANTAGE AND OTHER SOCIO-ECONOMIC ASPECTS OF VICTORIA’S ELECTORAL DISTRICTS – 2001 CENSUS (SEIFA)
This paper analyses socio-economic aspects of Victoria’s Electoral Districts derived from the Australian Bureau of Statistics’ ‘Socio-Economic Indexes for Australia’ (SEIFA) for the 2001 census.
Bella Lesman Research Officer February 2006
This Research Paper is part of a series of papers produced by the Library’s Research Service. Research Papers are intended to provide in-depth coverage and detailed analysis of topics of interest to Members of Parliament.
__________________________________________________________________________
P a r l i a m e n t o f V i c t o r i a

Parliamentary Library Research Service
Contents ______________________________________________________________ Introduction 1 Indexes Ranked by Electoral Districts 2 List of Tables 1 Index Relative Socio-Economic Disadvantage 3 Table 1.1 Index of Relative Socio-Economic Disadvantage 4 Table 1.2 Electoral Districts Ranked by Index of Relative 5 Socio-Economic Disadvantage 2 Index of Relative Socio-Economic Advantage/Disadvantage 6 Table 2.1 Index of Relative Socio-Economic Advantage/Disadvantage 7 Table 2.2 Electoral Districts Ranked by Index of Relative 8 Socio-Economic Advantage/Disadvantage 3 Index of Economic Resources 9 Table 3.1 Index of Economic Resources 10 Table 3.2 Electoral Districts Ranked by Index of Economic Resources 11 4 Index of Education and Occupation 12 Table 4.1 Index of Education and Occupation 13 Table 4.1 Electoral Districts Ranked by Index of Education 14 and Occupation 5 Joint Table of Indexes 15 List of Maps 18 Index Relative Socio-Economic Disadvantage Map 1.1. Legislative Assembly Districts – Outer 19 Map 1.2 Legislative Assembly Districts – Inner 20
Index of Relative Socio-Economic Advantage/Disadvantage Map 2.1. Legislative Assembly Districts – Outer 21 Map 2.2 Legislative Assembly Districts – Inner 22
Index of Economic Resources Map 3.1. Legislative Assembly Districts – Outer 23 Map 3.2 Legislative Assembly Districts – Inner 24
Index of Education and Occupation Map 4.1. Legislative Assembly Districts – Outer 25 Map 4.2 Legislative Assembly Districts - Inner 26 Explanatory Notes 27 Endnotes 30 References 31

Parliamentary Library Research Service
Parliamentary Library Research Service
Introduction Every five years the Australian Bureau of Statistics conducts a census of population and housing, collecting a diverse range of social and economic data such as age, ethnicity, income, education, employment, occupation, internet usage and so on. One method of analysing the data is to examine the variables individually. This approach was used to produce Victorian State Electorate Rankings – 2001 Census1, a previous Research Service publication which compares electorates across a range of selected individual census variables. An alternative approach is to examine a single composite or index of a large number of related variables, which indicates a particular aspect of the socio-economic profile of the population of an area. The ABS has used the statistical technique called principal component analysis2 to apply this approach to the 2001 census data. The result is a set of four Socio-Economic Indexes which each focus on a different aspect of the social and economic conditions of an area. These Socio-Economic Indexes for Australia (SEIFA) are derived from data collected at the level of the census collection district3 (CCD), the smallest geographical area of the census. By taking the weighted average4, using population counts from the 2001 census, across all of the CCDs which make up each electoral district, we can create SEIFA index scores for each electoral district. In addition to enabling a unique picture of the socio-economic profile of each electorate, the index scores lend themselves to a comparative ranking of electorates against each other. Four indexes are addressed to each of the Electoral Districts as follows: Index of Relative Socio-Economic Disadvantage This index is derived from attributes such as income, educational attainment, unemployment, and dwellings without motor vehicles and focuses on low income earners, relatively lower educational attainment and high unemployment. Index of Relative Socio-Economic Advantage/Disadvantage Unlike the previous index which focuses only on disadvantage, this index is a continuum of advantage to disadvantage. It is derived from attributes relating to income, education, occupation, wealth and living conditions. Index of Economic Resources This index reflects the profile of the economic resources of families within each electorate. It is derived from attributes relating to income, expenditure and assets of families, such as family income, rent paid, mortgage repayments, and dwelling size.
1
Parliamentary Library Research Service
Index of Education and Occupation This index is derived from attributes such as the proportion of people with a higher qualification or those employed in a skilled occupation. It reflects the educational and occupational structure of communities. Joint Table of Indexes In addition to examining each of the indexes individually, looking at how electorates score across all of the indexes can provide some insight into the degree of heterogeneity or homogeneity within an electorate. To that end, a joint table of indexes has been included in this paper. While many electorates present similarly low or similarly high index scores across all of the indexes, indicating a degree of homogeneity throughout these electorates, there are some electorates that score variably across the indexes, indicating a greater degree of diversity within them. Please note that the indexes are ‘ordinal measures’, not ‘interval measures’, and therefore may only be used to determine the order of electorates, not arithmetic differences between them, eg. an electorate with an index value of 500 does not have twice as much disadvantage as an electorate with an index value of 1,000. Indexes Ranked by Electoral Districts Each index is presented in two tables. The first table displays an alphabetical list of electoral districts, the political party which holds the seat following the 2002 election, and the accompanying index5. To enable easy recognition of high and low scores, the index scores have been standardised by the ABS to have a mean of 1,000 across all CCDs in Australia. The second table ranks electoral districts by index score. Where more than one electorate share the same index score, they are simply ranked in alphabetical order. Maps Following on from the tables are maps showing the distribution of each index for regional and metropolitan electorates respectively. The maps commence on page 19. Please see the Explanatory Notes and a List of the Index Variables used for each of the indexes on page 27. Throughout this publication ABS data is used with permission from the Australian Bureau of Statistics.
2
Parliamentary Library Research Service
1. Index of Relative Socio-Economic Disadvantage This index is made up of a composite of all the available variables from the 2001 census that either reflects or measures disadvantage. It only includes variables that are measures or indicators of disadvantage, and in this respect differs from the three other indexes, which include variables associated with both advantage and disadvantage. The index encompasses: low income earners, relatively lower educational attainment, high unemployment, unskilled occupations, public housing rental households, one-parent families, lack of English language fluency, Aboriginal and Torres Strait Islanders and dwellings without motor vehicles. For all of the indexes, low index scores denote disadvantage. Because the Index of Relative Socio-Economic Disadvantage only gauges disadvantage, it is on a continuum of low disadvantage (high index scores) to high disadvantage (low index scores). This has been done in order to retain consistency with the three other indexes which are all on a continuum of advantage (high scores) to disadvantage (low scores). Thus, for the Index of Relative Socio-economic Disadvantage: low index scores will reflect areas of high disadvantage and high index scores reflect areas of low disadvantage or a lack of disadvantage. For example, in Table 1.1 on the next page, Albert Park with an index score of 1,083 has a relatively lower level of disadvantage than Altona with an index score of 992. Where more than one electorate share the same index score, they are simply ranked in alphabetical order. Summary Analysis Greatest Disadvantage = Derrimut (index 848) Lowest Disadvantage = Malvern (index 1,124) The median electorates (where there are an equal number of electorates above and below the index score) = Northcote and Bendigo East As Table1.2 indicates, the ten lowest ranking electorates, i.e. those with the greatest relative socio-economic disadvantage, are located in metropolitan Melbourne's western, northern and south-eastern suburbs and the metropolitan/rural fringe seat of Lara, west of Melbourne. All are held by the ALP and are indicative of lower incomes and qualifications, and high unemployment and unskilled occupations in these areas. The majority of the ten next seats however, are non-metropolitan, with Bendigo West scoring the highest level of relative disadvantage among these. The ten highest ranking seats are almost exclusively Liberal Party held seats in the inner metropolitan and the eastern suburbs of Melbourne - indicative of a lack of disadvantage in these areas, that is, high incomes and qualifications, low unemployment and skilled occupations.
3
Parliamentary Library Research Service
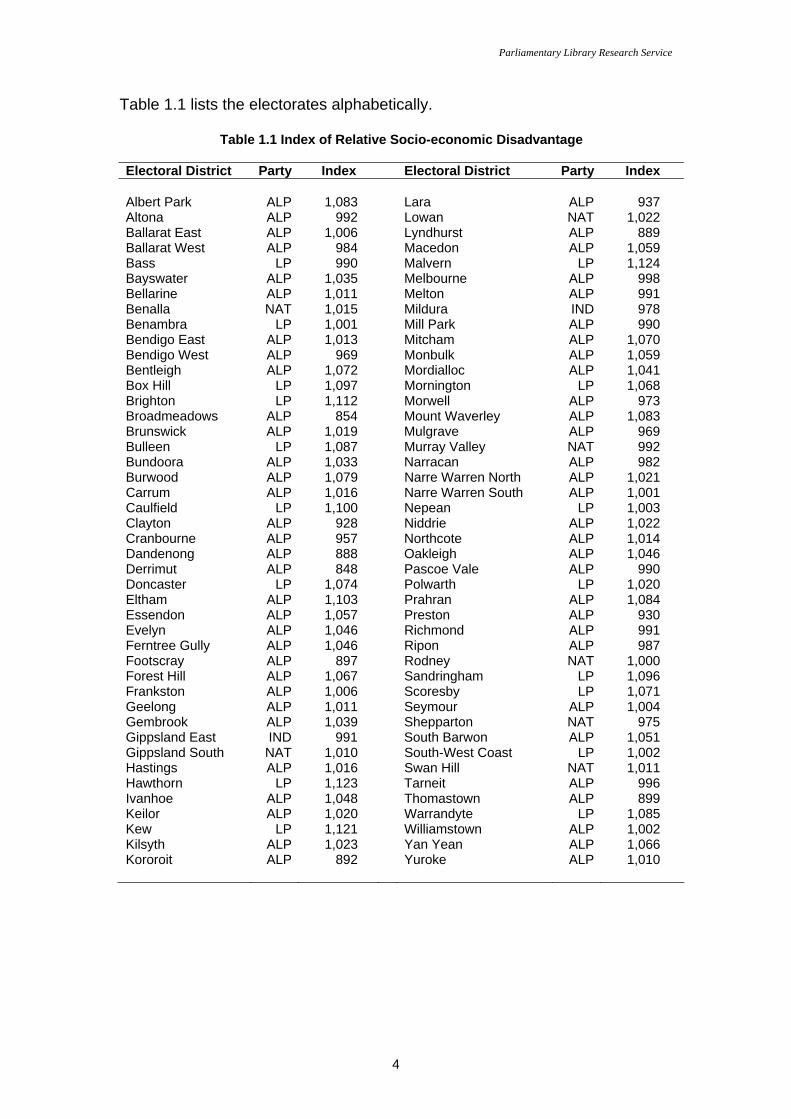
Table 1.1 lists the electorates alphabetically.
Table 1.1 Index of Relative Socio-economic Disadvantage Electoral District Party Index Electoral District Party Index Albert Park ALP 1,083 Lara ALP 937 Altona ALP 992 Lowan NAT 1,022 Ballarat East ALP 1,006 Lyndhurst ALP 889 Ballarat West ALP 984 Macedon ALP 1,059 Bass LP 990 Malvern LP 1,124 Bayswater ALP 1,035 Melbourne ALP 998 Bellarine ALP 1,011 Melton ALP 991 Benalla NAT 1,015 Mildura IND 978 Benambra LP 1,001 Mill Park ALP 990 Bendigo East ALP 1,013 Mitcham ALP 1,070 Bendigo West ALP 969 Monbulk ALP 1,059 Bentleigh ALP 1,072 Mordialloc ALP 1,041 Box Hill LP 1,097 Mornington LP 1,068 Brighton LP 1,112 Morwell ALP 973 Broadmeadows ALP 854 Mount Waverley ALP 1,083 Brunswick ALP 1,019 Mulgrave ALP 969 Bulleen LP 1,087 Murray Valley NAT 992 Bundoora ALP 1,033 Narracan ALP 982 Burwood ALP 1,079 Narre Warren North ALP 1,021 Carrum ALP 1,016 Narre Warren South ALP 1,001 Caulfield LP 1,100 Nepean LP 1,003 Clayton ALP 928 Niddrie ALP 1,022 Cranbourne ALP 957 Northcote ALP 1,014 Dandenong ALP 888 Oakleigh ALP 1,046 Derrimut ALP 848 Pascoe Vale ALP 990 Doncaster LP 1,074 Polwarth LP 1,020 Eltham ALP 1,103 Prahran ALP 1,084 Essendon ALP 1,057 Preston ALP 930 Evelyn ALP 1,046 Richmond ALP 991 Ferntree Gully ALP 1,046 Ripon ALP 987 Footscray ALP 897 Rodney NAT 1,000 Forest Hill ALP 1,067 Sandringham LP 1,096 Frankston ALP 1,006 Scoresby LP 1,071 Geelong ALP 1,011 Seymour ALP 1,004 Gembrook ALP 1,039 Shepparton NAT 975 Gippsland East IND 991 South Barwon ALP 1,051 Gippsland South NAT 1,010 South-West Coast LP 1,002 Hastings ALP 1,016 Swan Hill NAT 1,011 Hawthorn LP 1,123 Tarneit ALP 996 Ivanhoe ALP 1,048 Thomastown ALP 899 Keilor ALP 1,020 Warrandyte LP 1,085 Kew LP 1,121 Williamstown ALP 1,002 Kilsyth ALP 1,023 Yan Yean ALP 1,066 Kororoit ALP 892 Yuroke ALP 1,010
4
Parliamentary Library Research Service
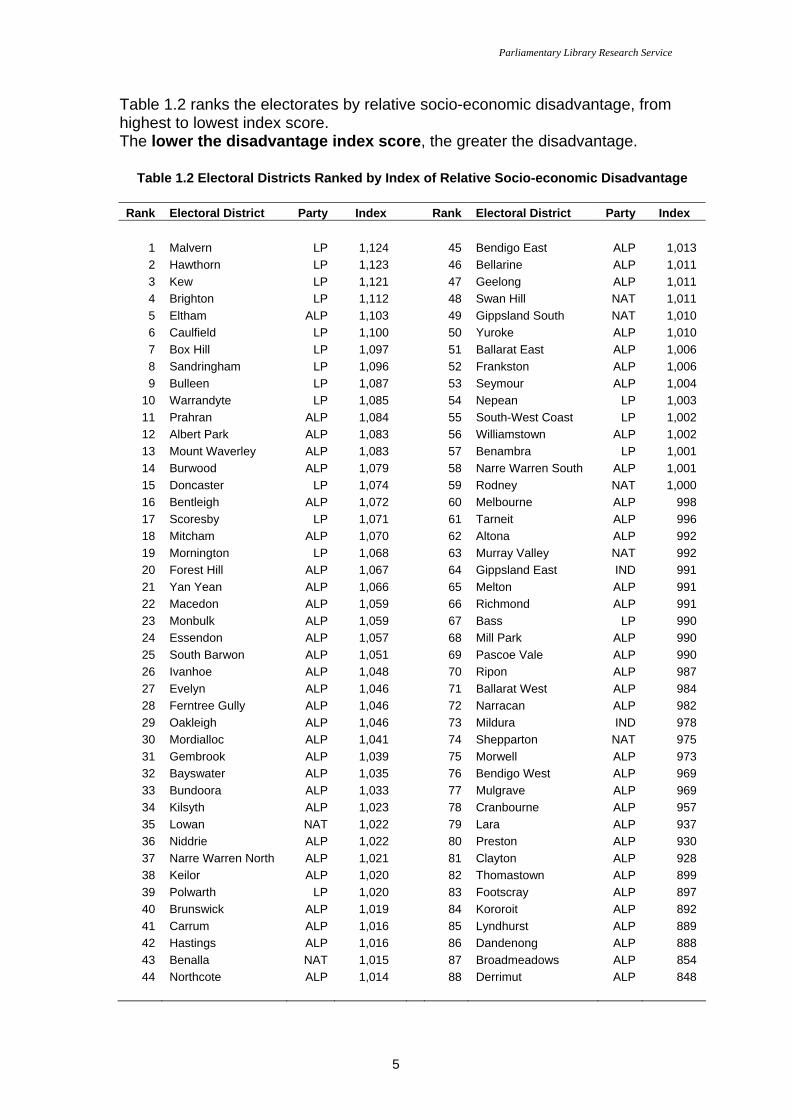
Table 1.2 ranks the electorates by relative socio-economic disadvantage, from highest to lowest index score. The lower the disadvantage index score, the greater the disadvantage.
Table 1.2 Electoral Districts Ranked by Index of Relative Socio-economic Disadvantage Rank Electoral District Party Index Rank Electoral District Party Index
1 Malvern LP 1,124 45 Bendigo East ALP 1,013 2 Hawthorn LP 1,123 46 Bellarine ALP 1,011 3 Kew LP 1,121 47 Geelong ALP 1,011 4 Brighton LP 1,112 48 Swan Hill NAT 1,011 5 Eltham ALP 1,103 49 Gippsland South NAT 1,010 6 Caulfield LP 1,100 50 Yuroke ALP 1,010 7 Box Hill LP 1,097 51 Ballarat East ALP 1,006 8 Sandringham LP 1,096 52 Frankston ALP 1,006 9 Bulleen LP 1,087 53 Seymour ALP 1,004
10 Warrandyte LP 1,085 54 Nepean LP 1,003 11 Prahran ALP 1,084 55 South-West Coast LP 1,002 12 Albert Park ALP 1,083 56 Williamstown ALP 1,002 13 Mount Waverley ALP 1,083 57 Benambra LP 1,001 14 Burwood ALP 1,079 58 Narre Warren South ALP 1,001 15 Doncaster LP 1,074 59 Rodney NAT 1,000 16 Bentleigh ALP 1,072 60 Melbourne ALP 998 17 Scoresby LP 1,071 61 Tarneit ALP 996 18 Mitcham ALP 1,070 62 Altona ALP 992 19 Mornington LP 1,068 63 Murray Valley NAT 992 20 Forest Hill ALP 1,067 64 Gippsland East IND 991 21 Yan Yean ALP 1,066 65 Melton ALP 991 22 Macedon ALP 1,059 66 Richmond ALP 991 23 Monbulk ALP 1,059 67 Bass LP 990 24 Essendon ALP 1,057 68 Mill Park ALP 990 25 South Barwon ALP 1,051 69 Pascoe Vale ALP 990 26 Ivanhoe ALP 1,048 70 Ripon ALP 987 27 Evelyn ALP 1,046 71 Ballarat West ALP 984 28 Ferntree Gully ALP 1,046 72 Narracan ALP 982 29 Oakleigh ALP 1,046 73 Mildura IND 978 30 Mordialloc ALP 1,041 74 Shepparton NAT 975 31 Gembrook ALP 1,039 75 Morwell ALP 973 32 Bayswater ALP 1,035 76 Bendigo West ALP 969 33 Bundoora ALP 1,033 77 Mulgrave ALP 969 34 Kilsyth ALP 1,023 78 Cranbourne ALP 957 35 Lowan NAT 1,022 79 Lara ALP 937 36 Niddrie ALP 1,022 80 Preston ALP 930 37 Narre Warren North ALP 1,021 81 Clayton ALP 928 38 Keilor ALP 1,020 82 Thomastown ALP 899 39 Polwarth LP 1,020 83 Footscray ALP 897 40 Brunswick ALP 1,019 84 Kororoit ALP 892 41 Carrum ALP 1,016 85 Lyndhurst ALP 889 42 Hastings ALP 1,016 86 Dandenong ALP 888 43 Benalla NAT 1,015 87 Broadmeadows ALP 854 44 Northcote ALP 1,014 88 Derrimut ALP 848
5
Parliamentary Library Research Service
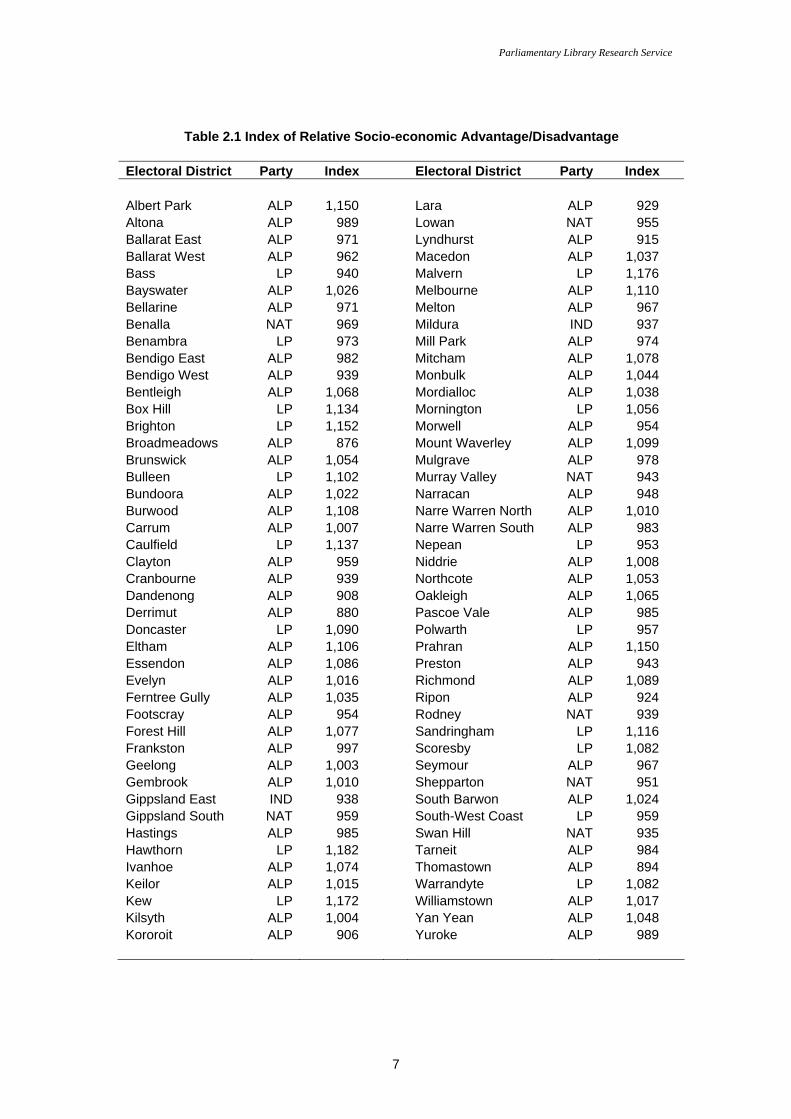
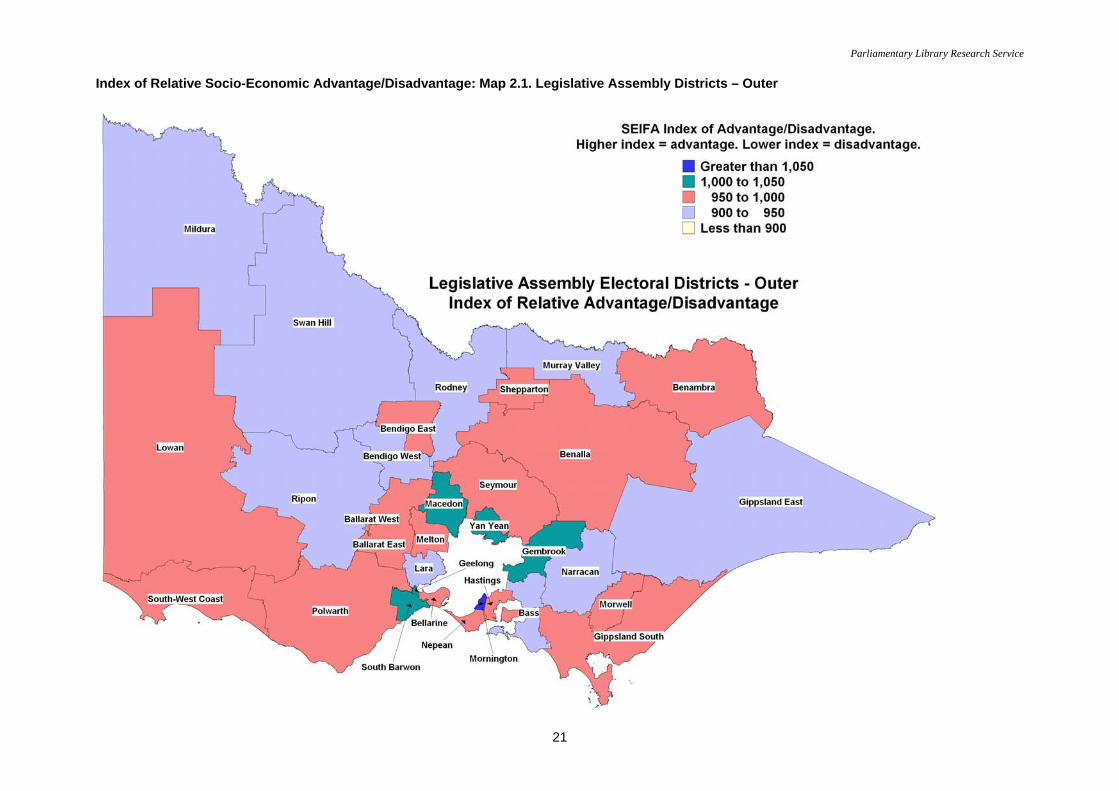
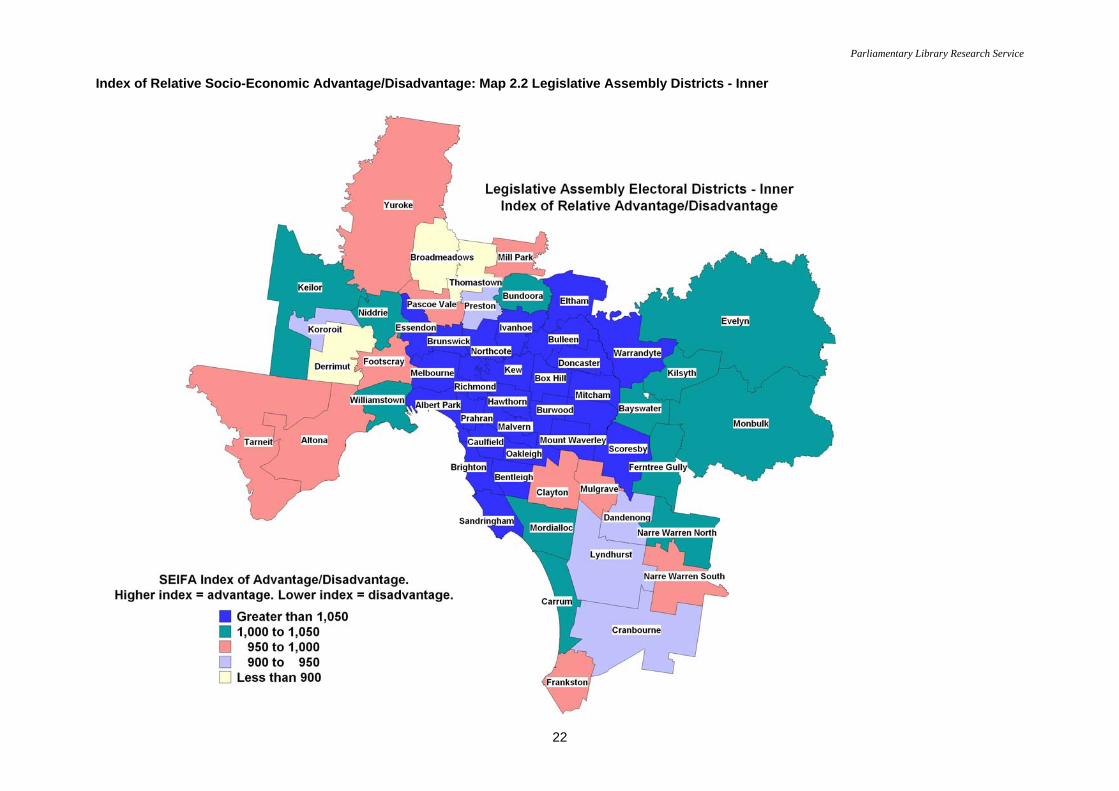
2. Index of Relative Socio-Economic Advantage/Disadvantage Unlike the previous index which focuses only on disadvantage, this index measures an area's well-being, and is a continuum of advantage to disadvantage. It is derived from attributes relating to income, education, occupation, employment status, internet usage and size of dwelling. Scoring well on this index indicates that an area has a relatively high proportion of people with high incomes, tertiary qualifications and professional occupations and a low proportion of people with low incomes, lack of qualifications and unskilled occupations. A low score on this index indicates the reverse scenario. It is possible to illustrate the difference between the disadvantage index and the advantage/disadvantage index by looking at the seat of Richmond. In Table 1.2, which ranks electoral districts by relative socio-economic disadvantage, Richmond ranks 66 among the 88 electorates with an index value of 991. Remember, this index only measures disadvantage and reflects the electorate’s population of low income earners, unskilled occupations, public housing, high unemployment, lack of English language fluency and so on. By contrast Table 2.2, which ranks electoral districts by relative socio-economic advantage/disadvantage, Richmond ranks 16 among the 88 electorates, with an index value of 1,089. This reflects Richmond’s other population, its affluent professional class. Summary Analysis Greatest Advantage/Disadvantage = Hawthorn (index 1,182) Lowest Advantage/Disadvantage = Broadmeadows (index 876) Median Electorates = Geelong and Frankston Affirming conventional wisdom, the highest rating electorates for socio-economic advantage are concentrated in inner Melbourne and the eastern suburbs, reflecting high incomes, high qualifications, high employment and a skilled workforce. In contrast to this, many rural and regional electorates ranked among the lowest twenty seats, reflecting lower incomes, higher unemployment and lower workforce skills. The very lowest seats are a mirror image of the highest ranking in the disadvantage index, i.e. Labor held seats in Melbourne's western, south-eastern and northern suburbs. Table 2.1 on the next page, lists the electorates alphabetically.
6
Parliamentary Library Research Service
Table 2.1 Index of Relative Socio-economic Advantage/Disadvantage Electoral District Party Index Electoral District Party Index Albert Park ALP 1,150 Lara ALP 929 Altona ALP 989 Lowan NAT 955 Ballarat East ALP 971 Lyndhurst ALP 915 Ballarat West ALP 962 Macedon ALP 1,037 Bass LP 940 Malvern LP 1,176 Bayswater ALP 1,026 Melbourne ALP 1,110 Bellarine ALP 971 Melton ALP 967 Benalla NAT 969 Mildura IND 937 Benambra LP 973 Mill Park ALP 974 Bendigo East ALP 982 Mitcham ALP 1,078 Bendigo West ALP 939 Monbulk ALP 1,044 Bentleigh ALP 1,068 Mordialloc ALP 1,038 Box Hill LP 1,134 Mornington LP 1,056 Brighton LP 1,152 Morwell ALP 954 Broadmeadows ALP 876 Mount Waverley ALP 1,099 Brunswick ALP 1,054 Mulgrave ALP 978 Bulleen LP 1,102 Murray Valley NAT 943 Bundoora ALP 1,022 Narracan ALP 948 Burwood ALP 1,108 Narre Warren North ALP 1,010 Carrum ALP 1,007 Narre Warren South ALP 983 Caulfield LP 1,137 Nepean LP 953 Clayton ALP 959 Niddrie ALP 1,008 Cranbourne ALP 939 Northcote ALP 1,053 Dandenong ALP 908 Oakleigh ALP 1,065 Derrimut ALP 880 Pascoe Vale ALP 985 Doncaster LP 1,090 Polwarth LP 957 Eltham ALP 1,106 Prahran ALP 1,150 Essendon ALP 1,086 Preston ALP 943 Evelyn ALP 1,016 Richmond ALP 1,089 Ferntree Gully ALP 1,035 Ripon ALP 924 Footscray ALP 954 Rodney NAT 939 Forest Hill ALP 1,077 Sandringham LP 1,116 Frankston ALP 997 Scoresby LP 1,082 Geelong ALP 1,003 Seymour ALP 967 Gembrook ALP 1,010 Shepparton NAT 951 Gippsland East IND 938 South Barwon ALP 1,024 Gippsland South NAT 959 South-West Coast LP 959 Hastings ALP 985 Swan Hill NAT 935 Hawthorn LP 1,182 Tarneit ALP 984 Ivanhoe ALP 1,074 Thomastown ALP 894 Keilor ALP 1,015 Warrandyte LP 1,082 Kew LP 1,172 Williamstown ALP 1,017 Kilsyth ALP 1,004 Yan Yean ALP 1,048 Kororoit ALP 906 Yuroke ALP 989
7
Parliamentary Library Research Service
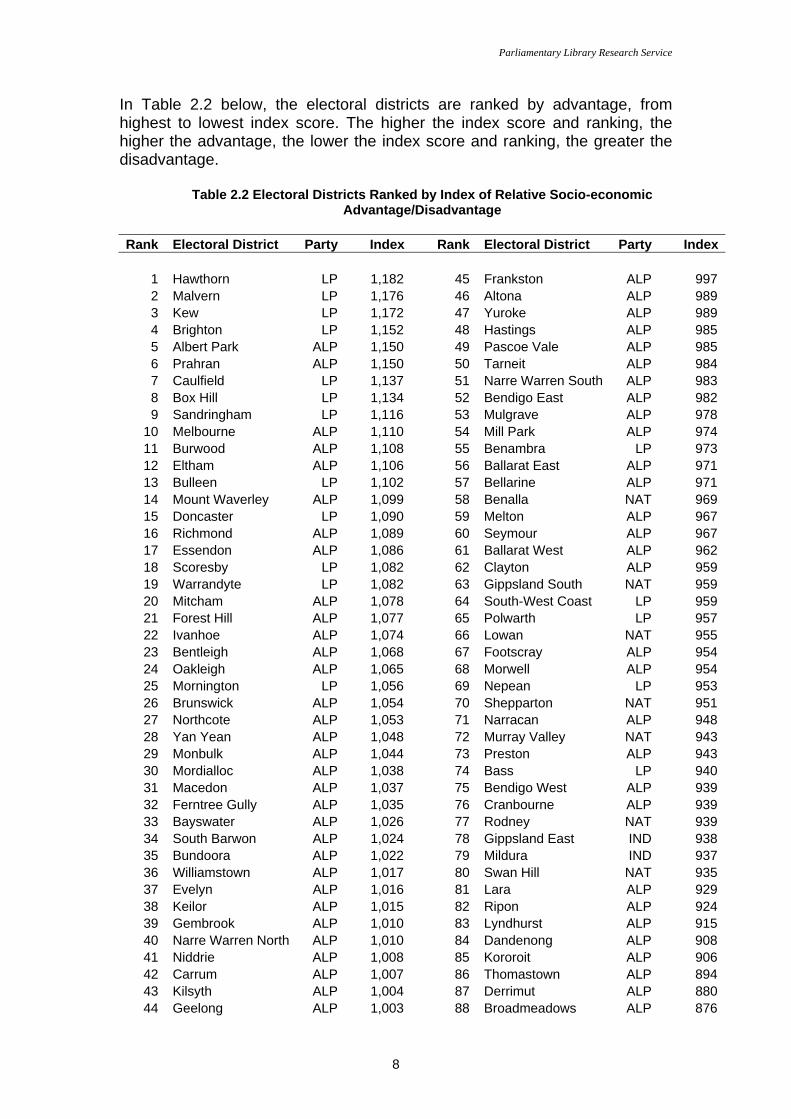
In Table 2.2 below, the electoral districts are ranked by advantage, from highest to lowest index score. The higher the index score and ranking, the higher the advantage, the lower the index score and ranking, the greater the disadvantage.
Table 2.2 Electoral Districts Ranked by Index of Relative Socio-economic Advantage/Disadvantage
Rank Electoral District Party Index Rank Electoral District Party Index
1 Hawthorn LP 1,182 45 Frankston ALP 997 2 Malvern LP 1,176 46 Altona ALP 989 3 Kew LP 1,172 47 Yuroke ALP 989 4 Brighton LP 1,152 48 Hastings ALP 985 5 Albert Park ALP 1,150 49 Pascoe Vale ALP 985 6 Prahran ALP 1,150 50 Tarneit ALP 984 7 Caulfield LP 1,137 51 Narre Warren South ALP 983 8 Box Hill LP 1,134 52 Bendigo East ALP 982 9 Sandringham LP 1,116 53 Mulgrave ALP 978
10 Melbourne ALP 1,110 54 Mill Park ALP 974 11 Burwood ALP 1,108 55 Benambra LP 973 12 Eltham ALP 1,106 56 Ballarat East ALP 971 13 Bulleen LP 1,102 57 Bellarine ALP 971 14 Mount Waverley ALP 1,099 58 Benalla NAT 969 15 Doncaster LP 1,090 59 Melton ALP 967 16 Richmond ALP 1,089 60 Seymour ALP 967 17 Essendon ALP 1,086 61 Ballarat West ALP 962 18 Scoresby LP 1,082 62 Clayton ALP 959 19 Warrandyte LP 1,082 63 Gippsland South NAT 959 20 Mitcham ALP 1,078 64 South-West Coast LP 959 21 Forest Hill ALP 1,077 65 Polwarth LP 957 22 Ivanhoe ALP 1,074 66 Lowan NAT 955 23 Bentleigh ALP 1,068 67 Footscray ALP 954 24 Oakleigh ALP 1,065 68 Morwell ALP 954 25 Mornington LP 1,056 69 Nepean LP 953 26 Brunswick ALP 1,054 70 Shepparton NAT 951 27 Northcote ALP 1,053 71 Narracan ALP 948 28 Yan Yean ALP 1,048 72 Murray Valley NAT 943 29 Monbulk ALP 1,044 73 Preston ALP 943 30 Mordialloc ALP 1,038 74 Bass LP 940 31 Macedon ALP 1,037 75 Bendigo West ALP 939 32 Ferntree Gully ALP 1,035 76 Cranbourne ALP 939 33 Bayswater ALP 1,026 77 Rodney NAT 939 34 South Barwon ALP 1,024 78 Gippsland East IND 938 35 Bundoora ALP 1,022 79 Mildura IND 937 36 Williamstown ALP 1,017 80 Swan Hill NAT 935 37 Evelyn ALP 1,016 81 Lara ALP 929 38 Keilor ALP 1,015 82 Ripon ALP 924 39 Gembrook ALP 1,010 83 Lyndhurst ALP 915 40 Narre Warren North ALP 1,010 84 Dandenong ALP 908 41 Niddrie ALP 1,008 85 Kororoit ALP 906 42 Carrum ALP 1,007 86 Thomastown ALP 894 43 Kilsyth ALP 1,004 87 Derrimut ALP 880 44 Geelong ALP 1,003 88 Broadmeadows ALP 876
8
Parliamentary Library Research Service
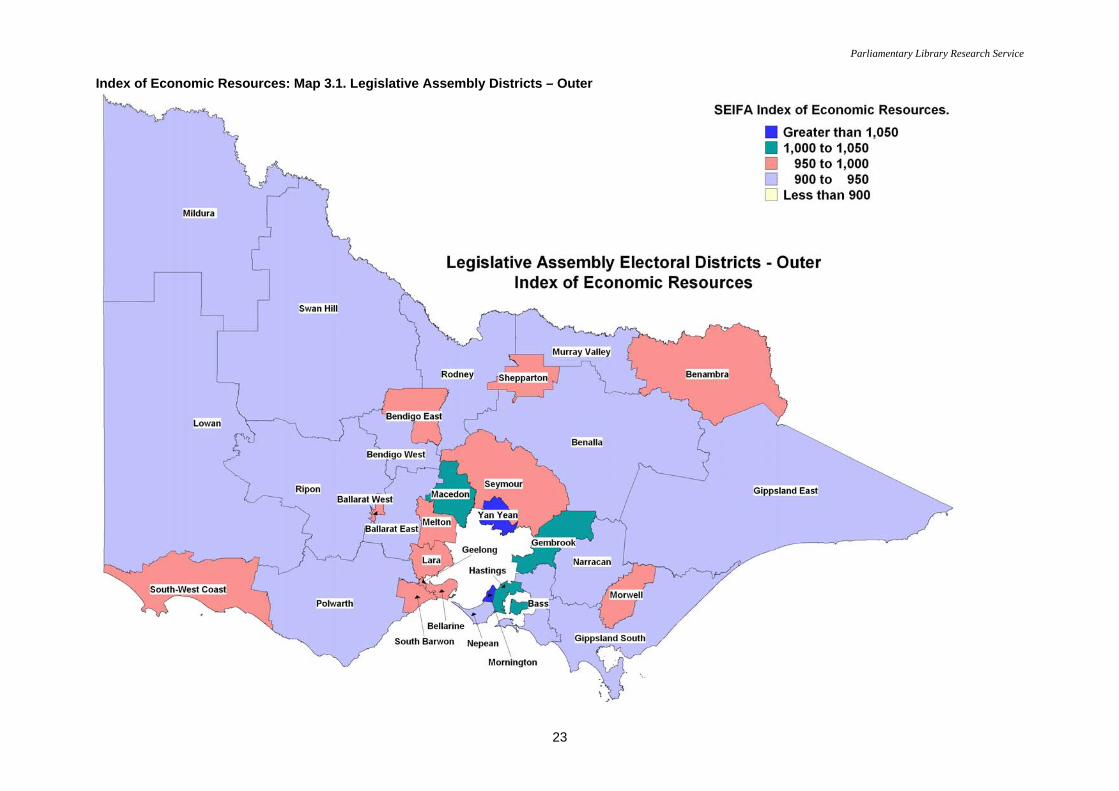
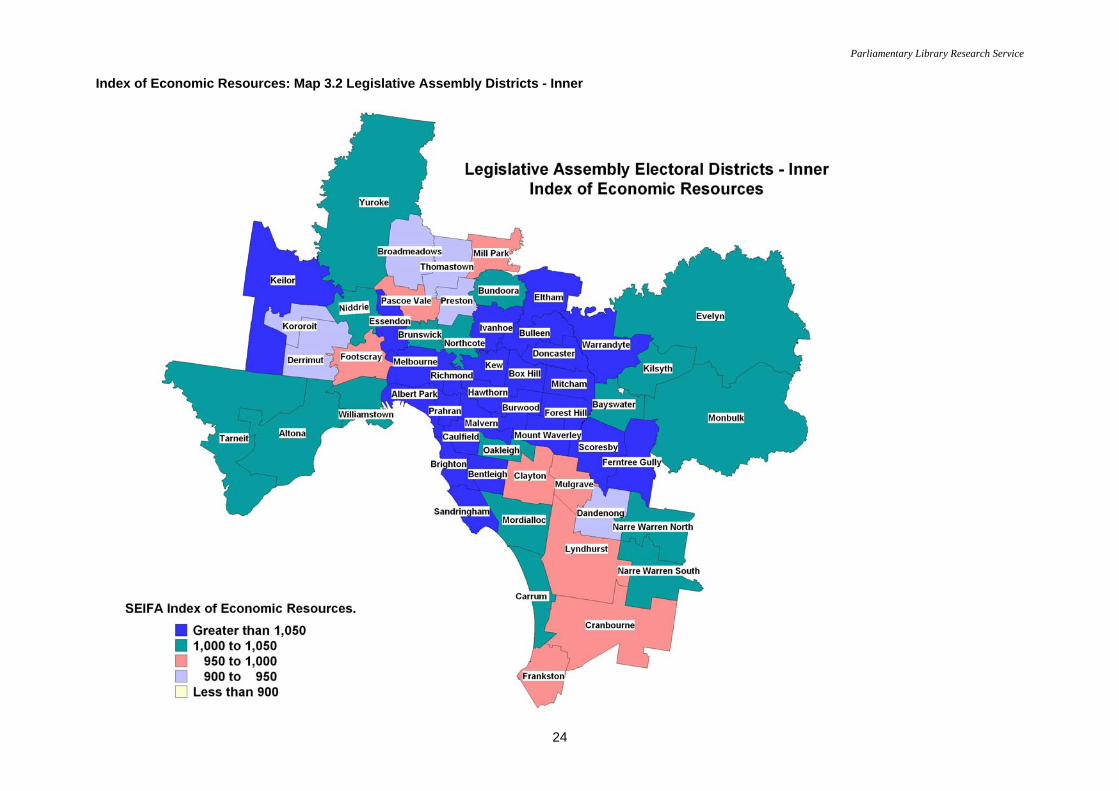
3. Index of Economic Resources The Index of Economic Resources is derived from attributes relating to income, expenditure and the assets of families, such as family income, rent paid, mortgage repayments and dwelling size. High index scores reflect high incomes, large mortgages and/or rental payments and large dwellings, while low index scores reflect low income families and smaller dwellings. Summary Analysis Greatest Economic Resources = Malvern (index 1,163) Lowest Economic Resources = Ripon (index 907) Median electorates = Bundoora and Kilsyth The index of economic resources, like the two previous indexes, presents the highest index scores in inner metropolitan and eastern suburb electorates of Melbourne. Unlike the previous indexes however, rural and regional seats predominated in the ten lowest ranking electorates - along with Labor held seats in the northern suburbs of Melbourne, indicative of lower income, mortgage and rental payments and larger families with dependents which affect disposable incomes. See Table 3.1 on the next page, which lists the electorates alphabetically.
9
Parliamentary Library Research Service
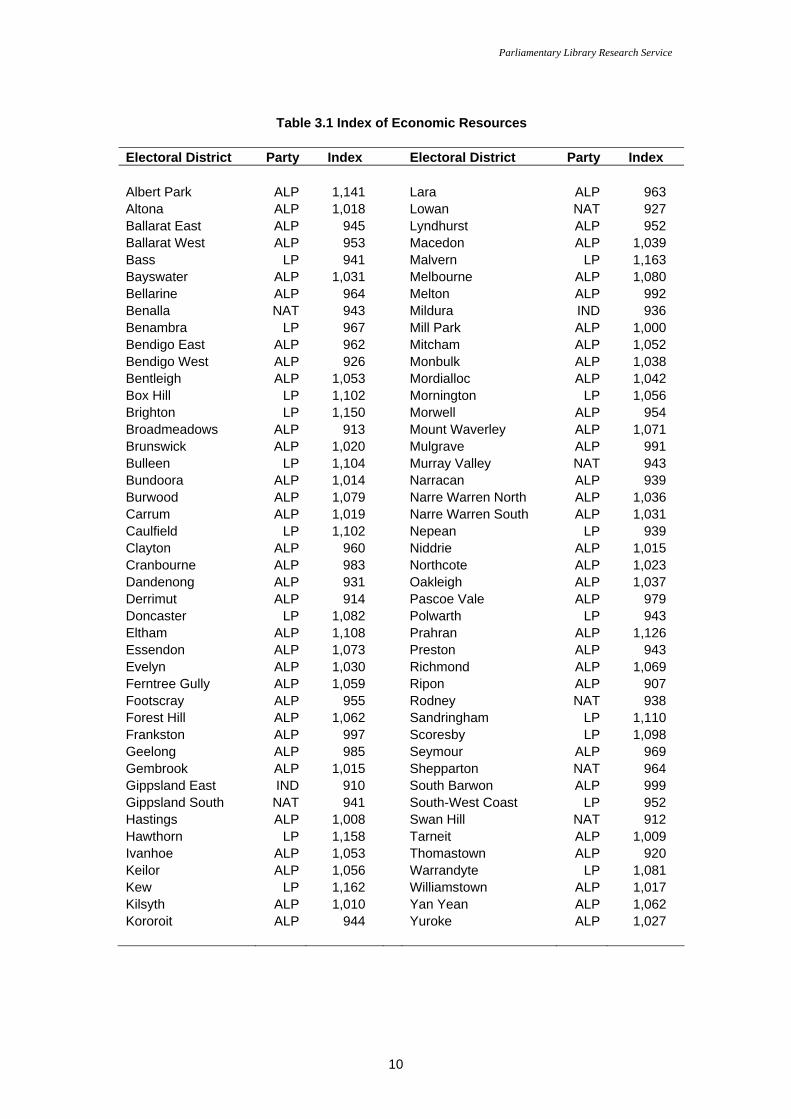
Table 3.1 Index of Economic Resources
Electoral District Party Index Electoral District Party Index Albert Park ALP 1,141 Lara ALP 963 Altona ALP 1,018 Lowan NAT 927 Ballarat East ALP 945 Lyndhurst ALP 952 Ballarat West ALP 953 Macedon ALP 1,039 Bass LP 941 Malvern LP 1,163 Bayswater ALP 1,031 Melbourne ALP 1,080 Bellarine ALP 964 Melton ALP 992 Benalla NAT 943 Mildura IND 936 Benambra LP 967 Mill Park ALP 1,000 Bendigo East ALP 962 Mitcham ALP 1,052 Bendigo West ALP 926 Monbulk ALP 1,038 Bentleigh ALP 1,053 Mordialloc ALP 1,042 Box Hill LP 1,102 Mornington LP 1,056 Brighton LP 1,150 Morwell ALP 954 Broadmeadows ALP 913 Mount Waverley ALP 1,071 Brunswick ALP 1,020 Mulgrave ALP 991 Bulleen LP 1,104 Murray Valley NAT 943 Bundoora ALP 1,014 Narracan ALP 939 Burwood ALP 1,079 Narre Warren North ALP 1,036 Carrum ALP 1,019 Narre Warren South ALP 1,031 Caulfield LP 1,102 Nepean LP 939 Clayton ALP 960 Niddrie ALP 1,015 Cranbourne ALP 983 Northcote ALP 1,023 Dandenong ALP 931 Oakleigh ALP 1,037 Derrimut ALP 914 Pascoe Vale ALP 979 Doncaster LP 1,082 Polwarth LP 943 Eltham ALP 1,108 Prahran ALP 1,126 Essendon ALP 1,073 Preston ALP 943 Evelyn ALP 1,030 Richmond ALP 1,069 Ferntree Gully ALP 1,059 Ripon ALP 907 Footscray ALP 955 Rodney NAT 938 Forest Hill ALP 1,062 Sandringham LP 1,110 Frankston ALP 997 Scoresby LP 1,098 Geelong ALP 985 Seymour ALP 969 Gembrook ALP 1,015 Shepparton NAT 964 Gippsland East IND 910 South Barwon ALP 999 Gippsland South NAT 941 South-West Coast LP 952 Hastings ALP 1,008 Swan Hill NAT 912 Hawthorn LP 1,158 Tarneit ALP 1,009 Ivanhoe ALP 1,053 Thomastown ALP 920 Keilor ALP 1,056 Warrandyte LP 1,081 Kew LP 1,162 Williamstown ALP 1,017 Kilsyth ALP 1,010 Yan Yean ALP 1,062 Kororoit ALP 944 Yuroke ALP 1,027
10
Parliamentary Library Research Service
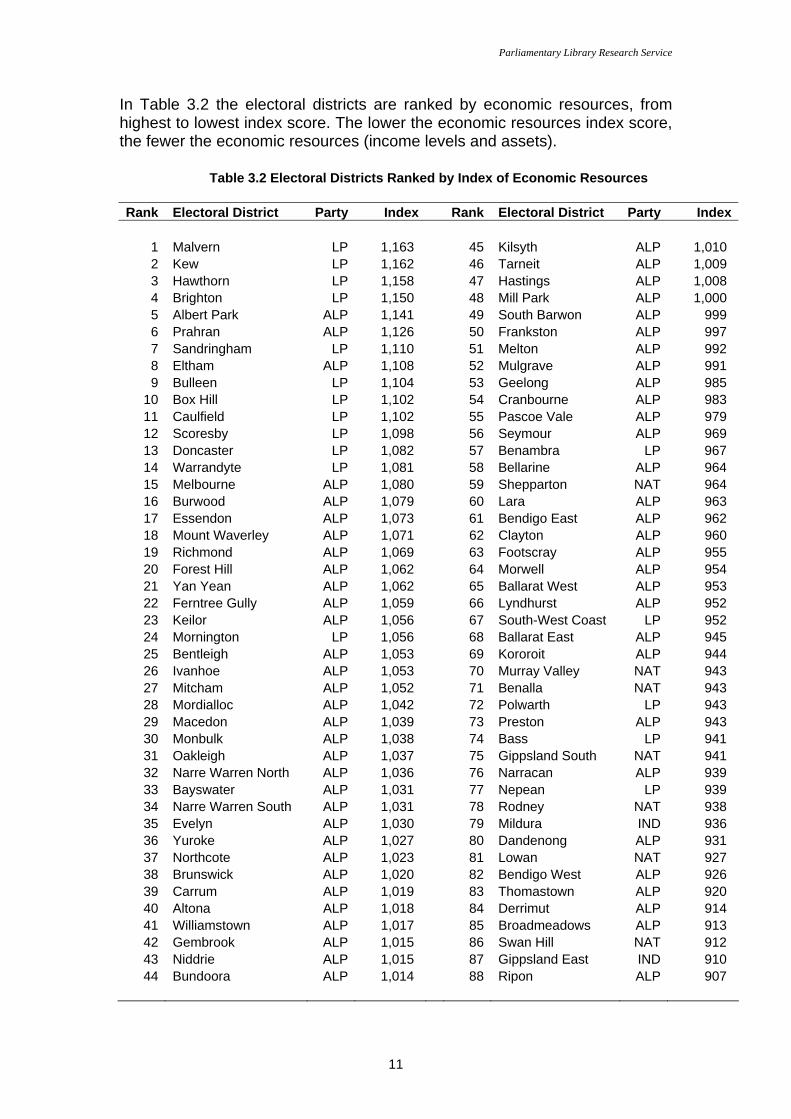
In Table 3.2 the electoral districts are ranked by economic resources, from highest to lowest index score. The lower the economic resources index score, the fewer the economic resources (income levels and assets).
Table 3.2 Electoral Districts Ranked by Index of Economic Resources Rank Electoral District Party Index Rank Electoral District Party Index
1 Malvern LP 1,163 45 Kilsyth ALP 1,010 2 Kew LP 1,162 46 Tarneit ALP 1,009 3 Hawthorn LP 1,158 47 Hastings ALP 1,008 4 Brighton LP 1,150 48 Mill Park ALP 1,000 5 Albert Park ALP 1,141 49 South Barwon ALP 999 6 Prahran ALP 1,126 50 Frankston ALP 997 7 Sandringham LP 1,110 51 Melton ALP 992 8 Eltham ALP 1,108 52 Mulgrave ALP 991 9 Bulleen LP 1,104 53 Geelong ALP 985
10 Box Hill LP 1,102 54 Cranbourne ALP 983 11 Caulfield LP 1,102 55 Pascoe Vale ALP 979 12 Scoresby LP 1,098 56 Seymour ALP 969 13 Doncaster LP 1,082 57 Benambra LP 967 14 Warrandyte LP 1,081 58 Bellarine ALP 964 15 Melbourne ALP 1,080 59 Shepparton NAT 964 16 Burwood ALP 1,079 60 Lara ALP 963 17 Essendon ALP 1,073 61 Bendigo East ALP 962 18 Mount Waverley ALP 1,071 62 Clayton ALP 960 19 Richmond ALP 1,069 63 Footscray ALP 955 20 Forest Hill ALP 1,062 64 Morwell ALP 954 21 Yan Yean ALP 1,062 65 Ballarat West ALP 953 22 Ferntree Gully ALP 1,059 66 Lyndhurst ALP 952 23 Keilor ALP 1,056 67 South-West Coast LP 952 24 Mornington LP 1,056 68 Ballarat East ALP 945 25 Bentleigh ALP 1,053 69 Kororoit ALP 944 26 Ivanhoe ALP 1,053 70 Murray Valley NAT 943 27 Mitcham ALP 1,052 71 Benalla NAT 943 28 Mordialloc ALP 1,042 72 Polwarth LP 943 29 Macedon ALP 1,039 73 Preston ALP 943 30 Monbulk ALP 1,038 74 Bass LP 941 31 Oakleigh ALP 1,037 75 Gippsland South NAT 941 32 Narre Warren North ALP 1,036 76 Narracan ALP 939 33 Bayswater ALP 1,031 77 Nepean LP 939 34 Narre Warren South ALP 1,031 78 Rodney NAT 938 35 Evelyn ALP 1,030 79 Mildura IND 936 36 Yuroke ALP 1,027 80 Dandenong ALP 931 37 Northcote ALP 1,023 81 Lowan NAT 927 38 Brunswick ALP 1,020 82 Bendigo West ALP 926 39 Carrum ALP 1,019 83 Thomastown ALP 920 40 Altona ALP 1,018 84 Derrimut ALP 914 41 Williamstown ALP 1,017 85 Broadmeadows ALP 913 42 Gembrook ALP 1,015 86 Swan Hill NAT 912 43 Niddrie ALP 1,015 87 Gippsland East IND 910 44 Bundoora ALP 1,014 88 Ripon ALP 907
11
Parliamentary Library Research Service
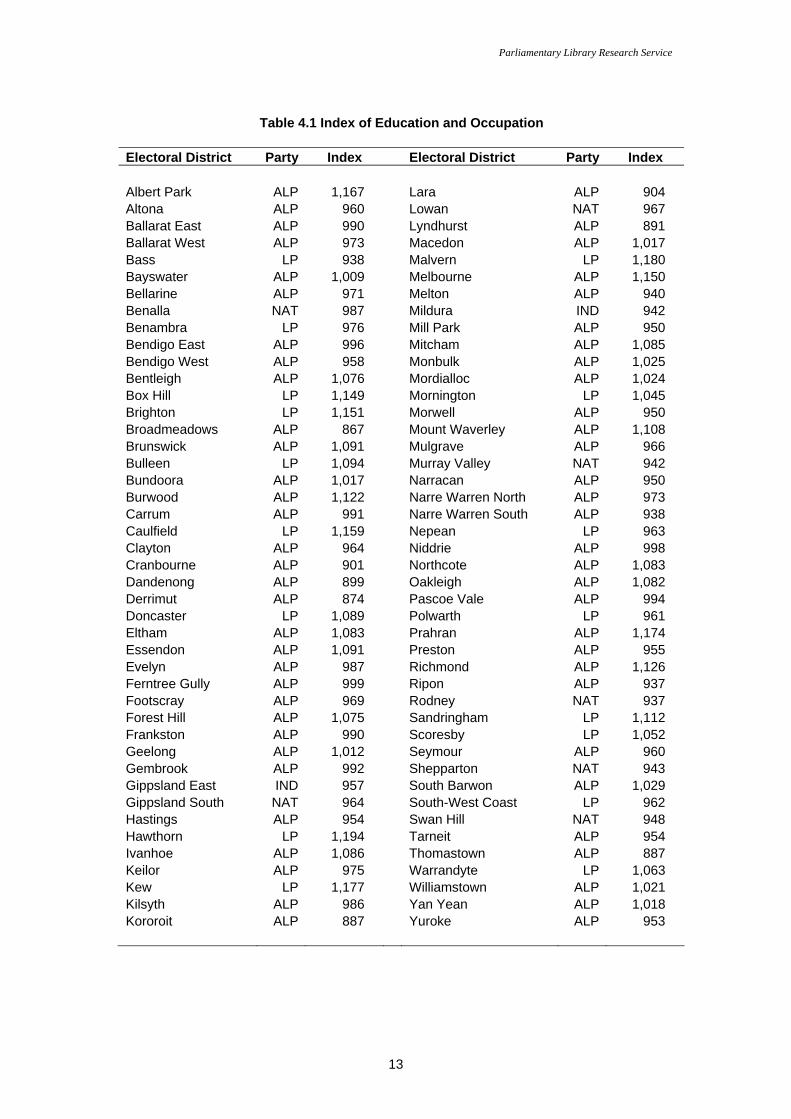
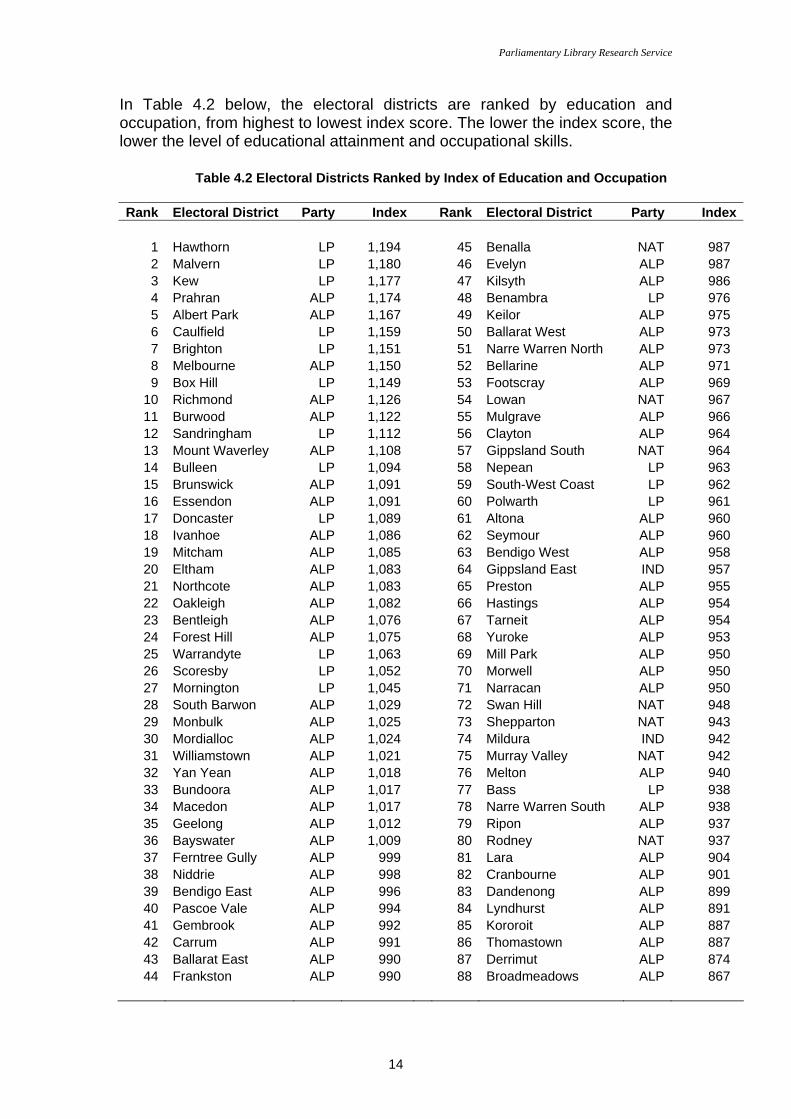
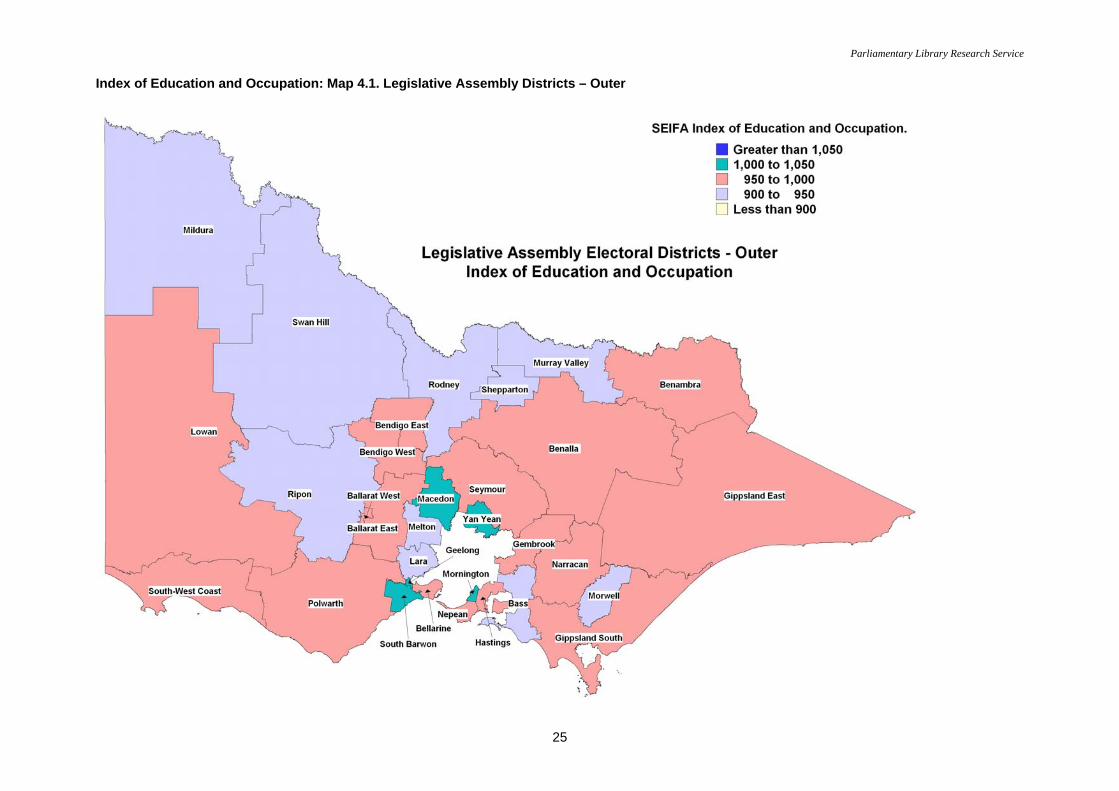
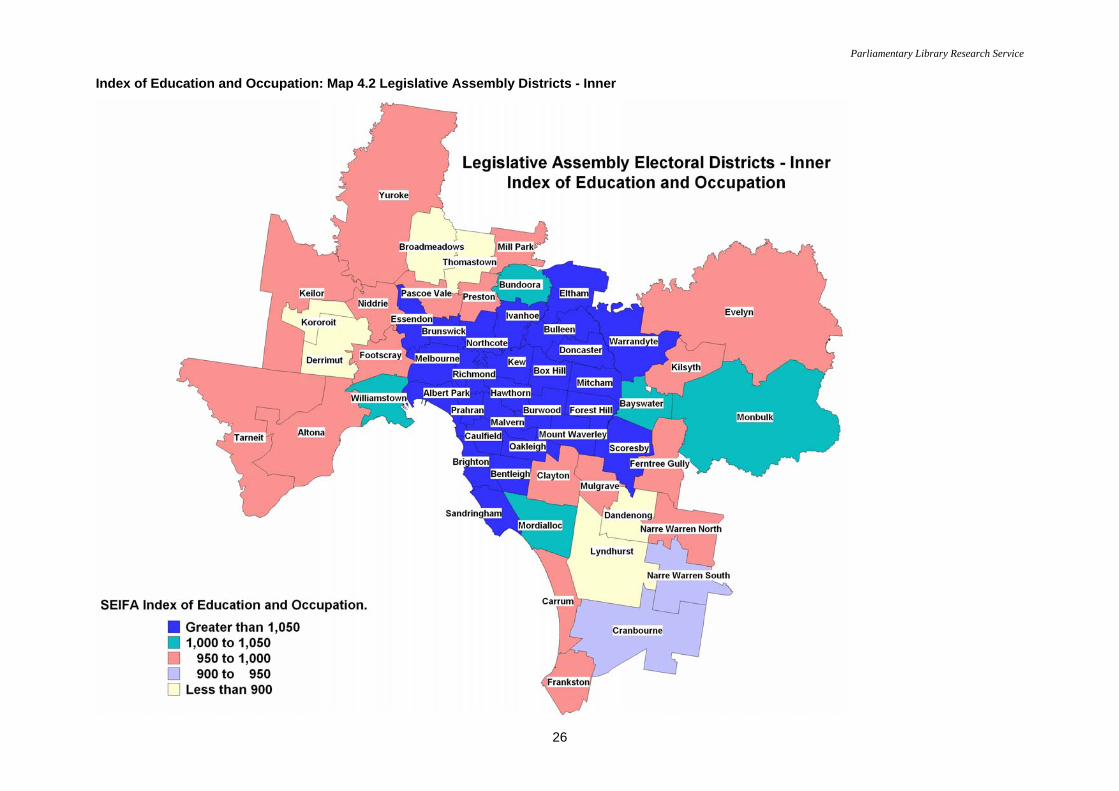
4. Index of Education and Occupation Derived from attributes such as the proportion of people with a higher qualification, or undertaking a higher qualification, and those employed in a skilled occupation, this index reflects the educational and occupational structure of communities. High index scores denote a high concentration of people with higher educational qualifications, or undertaking further study, and persons employed in higher skilled occupations. Low index scores denote a concentration of people with relatively lower qualifications, occupational skills or unemployed persons. Summary Analysis Greatest Education and Occupation = Hawthorn (index 1,194) Lowest Education and Occupation = Broadmeadows (index 867) Median Electorates = Frankston and Benalla Consistent with the three previous indexes, this index also presents the highest index scores in inner metropolitan and the eastern suburbs electorates of Melbourne, reflecting higher occupational skills, employment and qualifications in these areas, in addition to their proximity to institutions for higher education. The ten lowest ranking electorates, i.e. those with the lowest index for education and occupation are located in metropolitan Melbourne's western, northern and south-eastern suburbs and the electorates of Lara, Rodney and Ripon. All but the seat of Rodney (Nat) are held by the ALP. Rural and regional electorates predominated in the next ten lowest scoring seats. Table 4.1 on the next page lists electorates alphabetically, while in Table 4.2, the electorates are ranked from highest index scores to lowest.
12
Parliamentary Library Research Service
Table 4.1 Index of Education and Occupation
Electoral District Party Index Electoral District Party Index Albert Park ALP 1,167 Lara ALP 904 Altona ALP 960 Lowan NAT 967 Ballarat East ALP 990 Lyndhurst ALP 891 Ballarat West ALP 973 Macedon ALP 1,017 Bass LP 938 Malvern LP 1,180 Bayswater ALP 1,009 Melbourne ALP 1,150 Bellarine ALP 971 Melton ALP 940 Benalla NAT 987 Mildura IND 942 Benambra LP 976 Mill Park ALP 950 Bendigo East ALP 996 Mitcham ALP 1,085 Bendigo West ALP 958 Monbulk ALP 1,025 Bentleigh ALP 1,076 Mordialloc ALP 1,024 Box Hill LP 1,149 Mornington LP 1,045 Brighton LP 1,151 Morwell ALP 950 Broadmeadows ALP 867 Mount Waverley ALP 1,108 Brunswick ALP 1,091 Mulgrave ALP 966 Bulleen LP 1,094 Murray Valley NAT 942 Bundoora ALP 1,017 Narracan ALP 950 Burwood ALP 1,122 Narre Warren North ALP 973 Carrum ALP 991 Narre Warren South ALP 938 Caulfield LP 1,159 Nepean LP 963 Clayton ALP 964 Niddrie ALP 998 Cranbourne ALP 901 Northcote ALP 1,083 Dandenong ALP 899 Oakleigh ALP 1,082 Derrimut ALP 874 Pascoe Vale ALP 994 Doncaster LP 1,089 Polwarth LP 961 Eltham ALP 1,083 Prahran ALP 1,174 Essendon ALP 1,091 Preston ALP 955 Evelyn ALP 987 Richmond ALP 1,126 Ferntree Gully ALP 999 Ripon ALP 937 Footscray ALP 969 Rodney NAT 937 Forest Hill ALP 1,075 Sandringham LP 1,112 Frankston ALP 990 Scoresby LP 1,052 Geelong ALP 1,012 Seymour ALP 960 Gembrook ALP 992 Shepparton NAT 943 Gippsland East IND 957 South Barwon ALP 1,029 Gippsland South NAT 964 South-West Coast LP 962 Hastings ALP 954 Swan Hill NAT 948 Hawthorn LP 1,194 Tarneit ALP 954 Ivanhoe ALP 1,086 Thomastown ALP 887 Keilor ALP 975 Warrandyte LP 1,063 Kew LP 1,177 Williamstown ALP 1,021 Kilsyth ALP 986 Yan Yean ALP 1,018 Kororoit ALP 887 Yuroke ALP 953
13
Parliamentary Library Research Service
In Table 4.2 below, the electoral districts are ranked by education and occupation, from highest to lowest index score. The lower the index score, the lower the level of educational attainment and occupational skills.
Table 4.2 Electoral Districts Ranked by Index of Education and Occupation Rank Electoral District Party Index Rank Electoral District Party Index
1 Hawthorn LP 1,194 45 Benalla NAT 987 2 Malvern LP 1,180 46 Evelyn ALP 987 3 Kew LP 1,177 47 Kilsyth ALP 986 4 Prahran ALP 1,174 48 Benambra LP 976 5 Albert Park ALP 1,167 49 Keilor ALP 975 6 Caulfield LP 1,159 50 Ballarat West ALP 973 7 Brighton LP 1,151 51 Narre Warren North ALP 973 8 Melbourne ALP 1,150 52 Bellarine ALP 971 9 Box Hill LP 1,149 53 Footscray ALP 969
10 Richmond ALP 1,126 54 Lowan NAT 967 11 Burwood ALP 1,122 55 Mulgrave ALP 966 12 Sandringham LP 1,112 56 Clayton ALP 964 13 Mount Waverley ALP 1,108 57 Gippsland South NAT 964 14 Bulleen LP 1,094 58 Nepean LP 963 15 Brunswick ALP 1,091 59 South-West Coast LP 962 16 Essendon ALP 1,091 60 Polwarth LP 961 17 Doncaster LP 1,089 61 Altona ALP 960 18 Ivanhoe ALP 1,086 62 Seymour ALP 960 19 Mitcham ALP 1,085 63 Bendigo West ALP 958 20 Eltham ALP 1,083 64 Gippsland East IND 957 21 Northcote ALP 1,083 65 Preston ALP 955 22 Oakleigh ALP 1,082 66 Hastings ALP 954 23 Bentleigh ALP 1,076 67 Tarneit ALP 954 24 Forest Hill ALP 1,075 68 Yuroke ALP 953 25 Warrandyte LP 1,063 69 Mill Park ALP 950 26 Scoresby LP 1,052 70 Morwell ALP 950 27 Mornington LP 1,045 71 Narracan ALP 950 28 South Barwon ALP 1,029 72 Swan Hill NAT 948 29 Monbulk ALP 1,025 73 Shepparton NAT 943 30 Mordialloc ALP 1,024 74 Mildura IND 942 31 Williamstown ALP 1,021 75 Murray Valley NAT 942 32 Yan Yean ALP 1,018 76 Melton ALP 940 33 Bundoora ALP 1,017 77 Bass LP 938 34 Macedon ALP 1,017 78 Narre Warren South ALP 938 35 Geelong ALP 1,012 79 Ripon ALP 937 36 Bayswater ALP 1,009 80 Rodney NAT 937 37 Ferntree Gully ALP 999 81 Lara ALP 904 38 Niddrie ALP 998 82 Cranbourne ALP 901 39 Bendigo East ALP 996 83 Dandenong ALP 899 40 Pascoe Vale ALP 994 84 Lyndhurst ALP 891 41 Gembrook ALP 992 85 Kororoit ALP 887 42 Carrum ALP 991 86 Thomastown ALP 887 43 Ballarat East ALP 990 87 Derrimut ALP 874 44 Frankston ALP 990 88 Broadmeadows ALP 867
14
Parliamentary Library Research Service
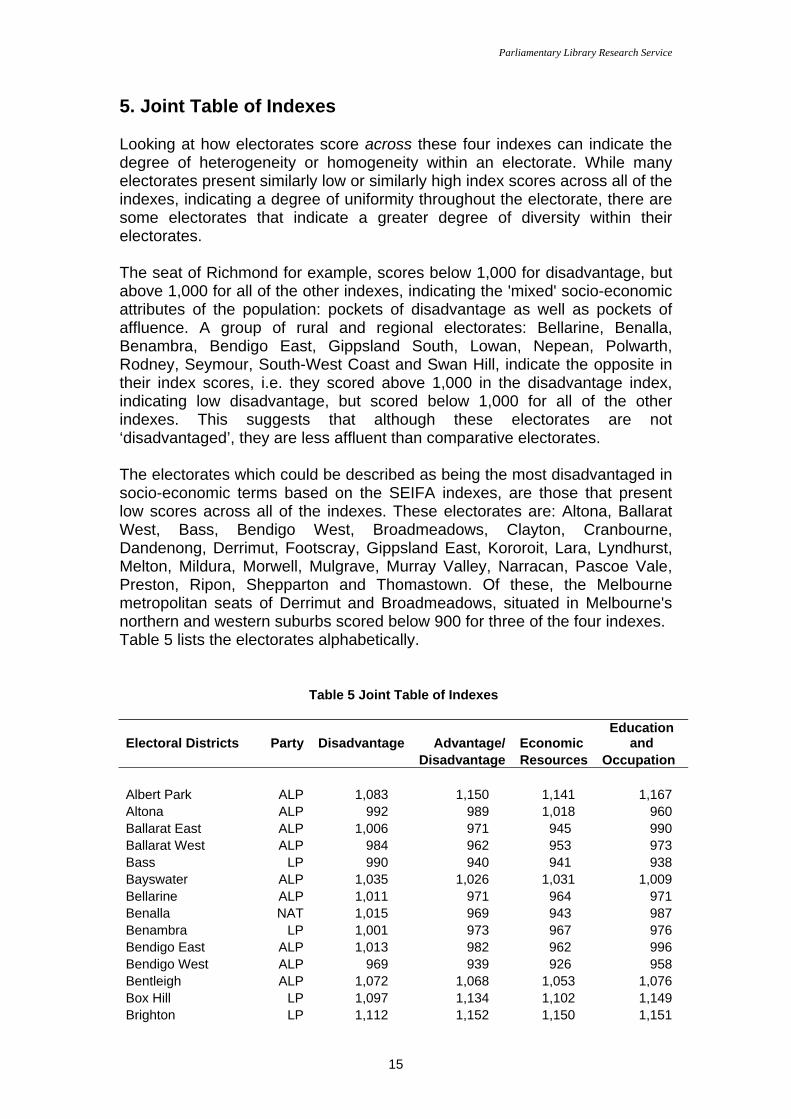
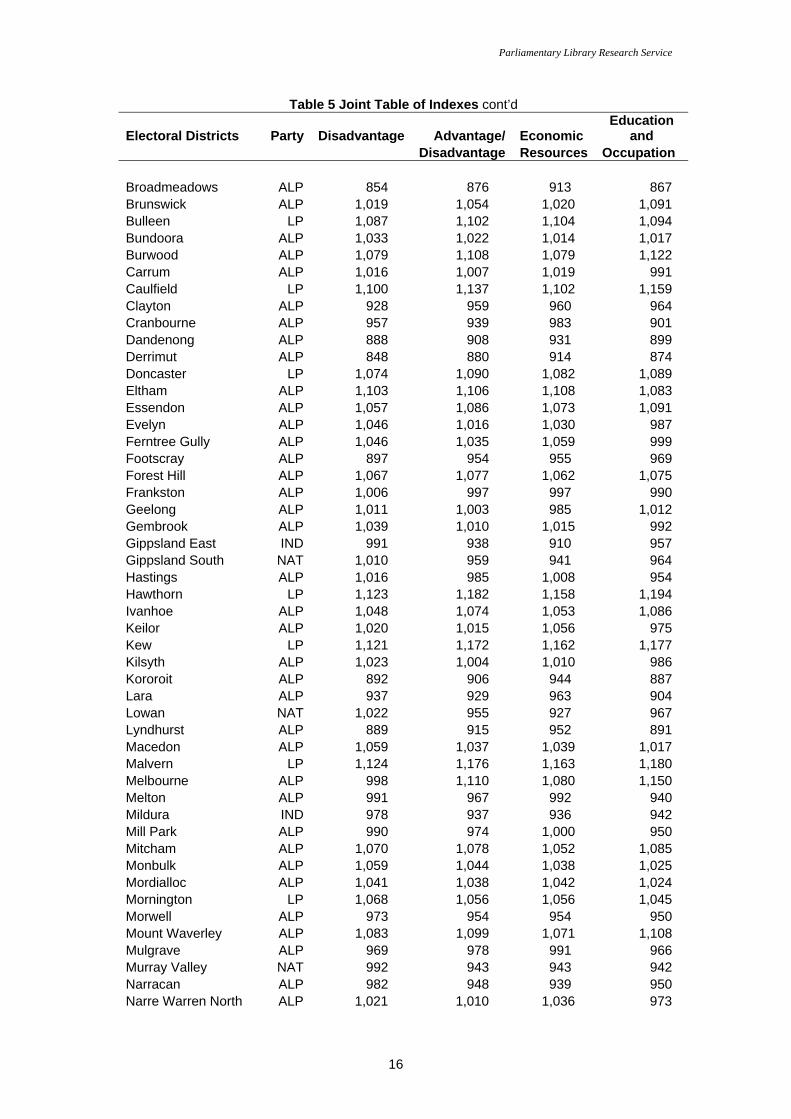
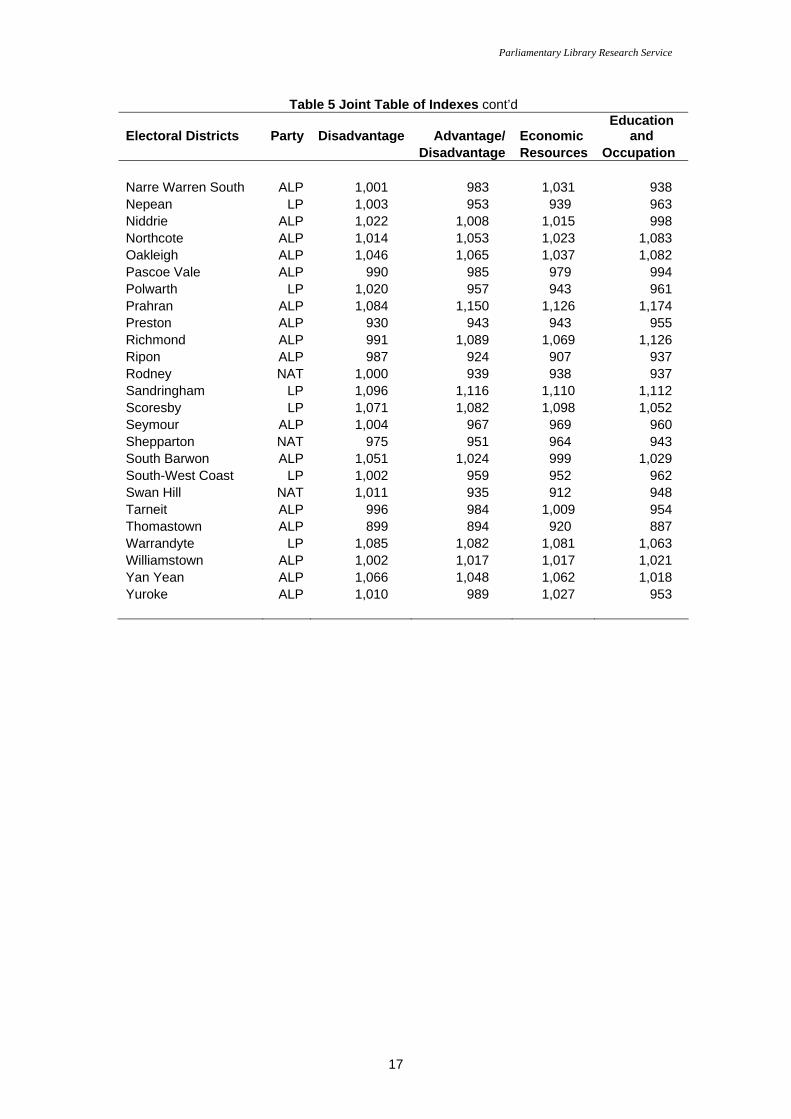
5. Joint Table of Indexes Looking at how electorates score across these four indexes can indicate the degree of heterogeneity or homogeneity within an electorate. While many electorates present similarly low or similarly high index scores across all of the indexes, indicating a degree of uniformity throughout the electorate, there are some electorates that indicate a greater degree of diversity within their electorates. The seat of Richmond for example, scores below 1,000 for disadvantage, but above 1,000 for all of the other indexes, indicating the 'mixed' socio-economic attributes of the population: pockets of disadvantage as well as pockets of affluence. A group of rural and regional electorates: Bellarine, Benalla, Benambra, Bendigo East, Gippsland South, Lowan, Nepean, Polwarth, Rodney, Seymour, South-West Coast and Swan Hill, indicate the opposite in their index scores, i.e. they scored above 1,000 in the disadvantage index, indicating low disadvantage, but scored below 1,000 for all of the other indexes. This suggests that although these electorates are not ‘disadvantaged’, they are less affluent than comparative electorates. The electorates which could be described as being the most disadvantaged in socio-economic terms based on the SEIFA indexes, are those that present low scores across all of the indexes. These electorates are: Altona, Ballarat West, Bass, Bendigo West, Broadmeadows, Clayton, Cranbourne, Dandenong, Derrimut, Footscray, Gippsland East, Kororoit, Lara, Lyndhurst, Melton, Mildura, Morwell, Mulgrave, Murray Valley, Narracan, Pascoe Vale, Preston, Ripon, Shepparton and Thomastown. Of these, the Melbourne metropolitan seats of Derrimut and Broadmeadows, situated in Melbourne's northern and western suburbs scored below 900 for three of the four indexes. Table 5 lists the electorates alphabetically.
Table 5 Joint Table of Indexes
Electoral Districts Party Disadvantage Advantage/ Economic Education
and Disadvantage Resources Occupation Albert Park ALP 1,083 1,150 1,141 1,167 Altona ALP 992 989 1,018 960 Ballarat East ALP 1,006 971 945 990 Ballarat West ALP 984 962 953 973 Bass LP 990 940 941 938 Bayswater ALP 1,035 1,026 1,031 1,009 Bellarine ALP 1,011 971 964 971 Benalla NAT 1,015 969 943 987 Benambra LP 1,001 973 967 976 Bendigo East ALP 1,013 982 962 996 Bendigo West ALP 969 939 926 958 Bentleigh ALP 1,072 1,068 1,053 1,076 Box Hill LP 1,097 1,134 1,102 1,149 Brighton LP 1,112 1,152 1,150 1,151
15
Parliamentary Library Research Service
Table 5 Joint Table of Indexes cont’d
Electoral Districts Party Disadvantage Advantage/ Economic Education
and Disadvantage Resources Occupation Broadmeadows ALP 854 876 913 867 Brunswick ALP 1,019 1,054 1,020 1,091 Bulleen LP 1,087 1,102 1,104 1,094 Bundoora ALP 1,033 1,022 1,014 1,017 Burwood ALP 1,079 1,108 1,079 1,122 Carrum ALP 1,016 1,007 1,019 991 Caulfield LP 1,100 1,137 1,102 1,159 Clayton ALP 928 959 960 964 Cranbourne ALP 957 939 983 901 Dandenong ALP 888 908 931 899 Derrimut ALP 848 880 914 874 Doncaster LP 1,074 1,090 1,082 1,089 Eltham ALP 1,103 1,106 1,108 1,083 Essendon ALP 1,057 1,086 1,073 1,091 Evelyn ALP 1,046 1,016 1,030 987 Ferntree Gully ALP 1,046 1,035 1,059 999 Footscray ALP 897 954 955 969 Forest Hill ALP 1,067 1,077 1,062 1,075 Frankston ALP 1,006 997 997 990 Geelong ALP 1,011 1,003 985 1,012 Gembrook ALP 1,039 1,010 1,015 992 Gippsland East IND 991 938 910 957 Gippsland South NAT 1,010 959 941 964 Hastings ALP 1,016 985 1,008 954 Hawthorn LP 1,123 1,182 1,158 1,194 Ivanhoe ALP 1,048 1,074 1,053 1,086 Keilor ALP 1,020 1,015 1,056 975 Kew LP 1,121 1,172 1,162 1,177 Kilsyth ALP 1,023 1,004 1,010 986 Kororoit ALP 892 906 944 887 Lara ALP 937 929 963 904 Lowan NAT 1,022 955 927 967 Lyndhurst ALP 889 915 952 891 Macedon ALP 1,059 1,037 1,039 1,017 Malvern LP 1,124 1,176 1,163 1,180 Melbourne ALP 998 1,110 1,080 1,150 Melton ALP 991 967 992 940 Mildura IND 978 937 936 942 Mill Park ALP 990 974 1,000 950 Mitcham ALP 1,070 1,078 1,052 1,085 Monbulk ALP 1,059 1,044 1,038 1,025 Mordialloc ALP 1,041 1,038 1,042 1,024 Mornington LP 1,068 1,056 1,056 1,045 Morwell ALP 973 954 954 950 Mount Waverley ALP 1,083 1,099 1,071 1,108 Mulgrave ALP 969 978 991 966 Murray Valley NAT 992 943 943 942 Narracan ALP 982 948 939 950 Narre Warren North ALP 1,021 1,010 1,036 973
16
Parliamentary Library Research Service
Table 5 Joint Table of Indexes cont’d
Electoral Districts Party Disadvantage Advantage/ Economic Education
and Disadvantage Resources Occupation Narre Warren South ALP 1,001 983 1,031 938 Nepean LP 1,003 953 939 963 Niddrie ALP 1,022 1,008 1,015 998 Northcote ALP 1,014 1,053 1,023 1,083 Oakleigh ALP 1,046 1,065 1,037 1,082 Pascoe Vale ALP 990 985 979 994 Polwarth LP 1,020 957 943 961 Prahran ALP 1,084 1,150 1,126 1,174 Preston ALP 930 943 943 955 Richmond ALP 991 1,089 1,069 1,126 Ripon ALP 987 924 907 937 Rodney NAT 1,000 939 938 937 Sandringham LP 1,096 1,116 1,110 1,112 Scoresby LP 1,071 1,082 1,098 1,052 Seymour ALP 1,004 967 969 960 Shepparton NAT 975 951 964 943 South Barwon ALP 1,051 1,024 999 1,029 South-West Coast LP 1,002 959 952 962 Swan Hill NAT 1,011 935 912 948 Tarneit ALP 996 984 1,009 954 Thomastown ALP 899 894 920 887 Warrandyte LP 1,085 1,082 1,081 1,063 Williamstown ALP 1,002 1,017 1,017 1,021 Yan Yean ALP 1,066 1,048 1,062 1,018 Yuroke ALP 1,010 989 1,027 953
17
Parliamentary Library Research Service
List of Maps
The following pages present each of the indexes graphically, in maps of outer (regional) and inner (metropolitan) electorates. Please see the legend attached to each map for details of the index ranges.
Index of Relative Socio-Economic Disadvantage Map 1.1. Legislative Assembly Districts – Outer Map 1.2 Legislative Assembly Districts – Inner
Index of Relative Socio-Economic Advantage/Disadvantage Map 2.1. Legislative Assembly Districts – Outer Map 2.2 Legislative Assembly Districts – Inner
Index of Economic Resources Map 3.1. Legislative Assembly Districts – Outer Map 3.2 Legislative Assembly Districts – Inner
Index of Education and Occupation Map 4.1. Legislative Assembly Districts – Outer Map 4.2 Legislative Assembly Districts - Inner
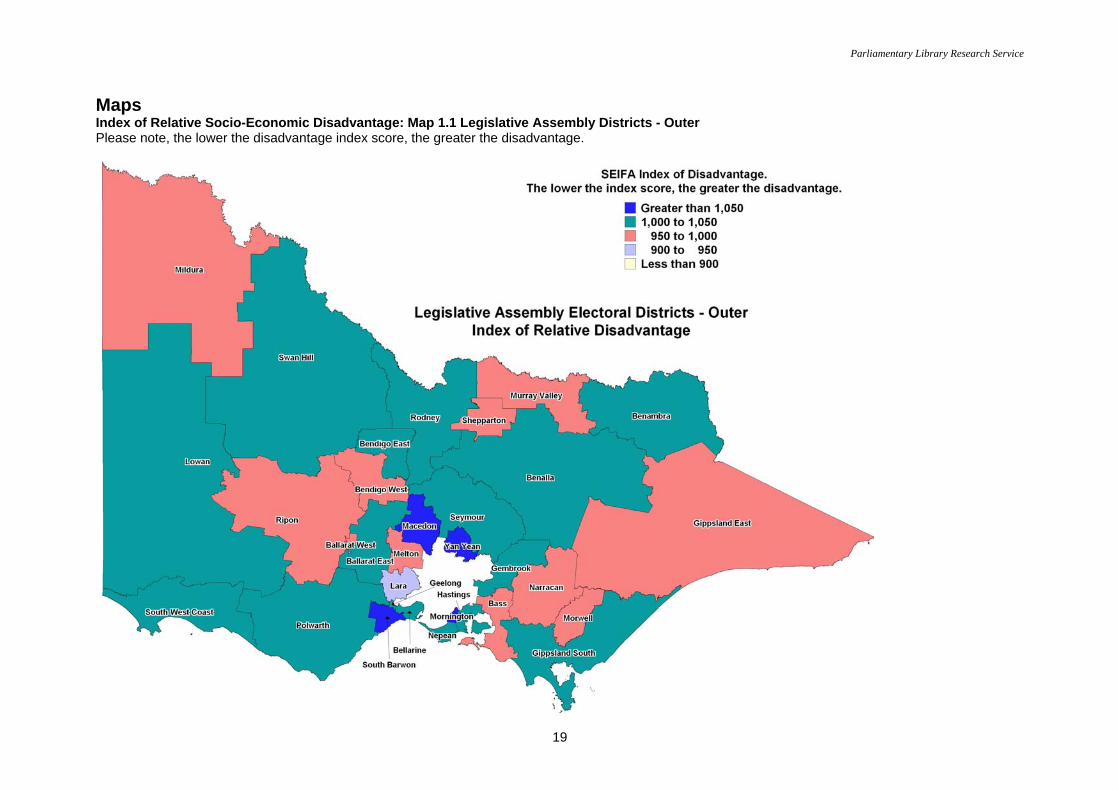
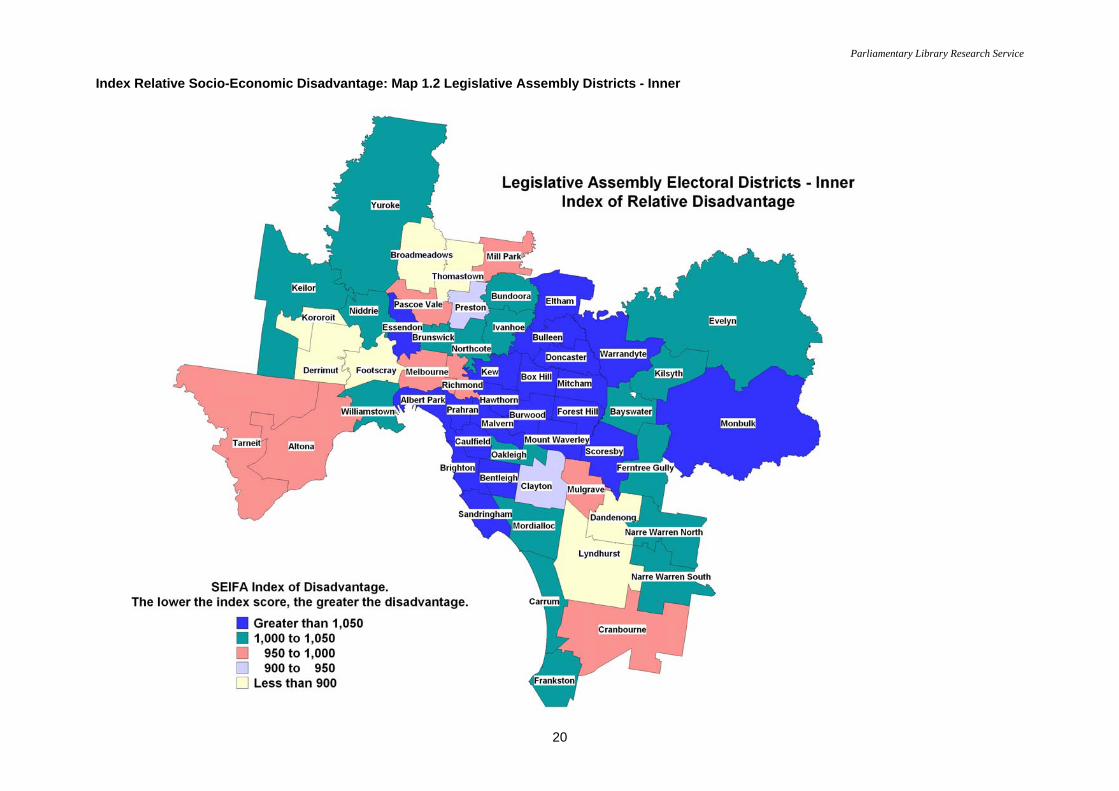
The gradations of colour on these maps are from darkest to lightest, and basically represent advantage to disadvantage. Hence, darkest equates to highest advantage, lightest equates to highest disadvantage. Maps 1.1 and 1.2 only display levels of disadvantage, so that darkest equates to lowest disadvantage and in common with all of the maps, lightest equates to highest disadvantage.
18
Parliamentary Library Research Service
Maps Index of Relative Socio-Economic Disadvantage: Map 1.1 Legislative Assembly Districts - Outer Please note, the lower the disadvantage index score, the greater the disadvantage.
19
Parliamentary Library Research Service
Index Relative Socio-Economic Disadvantage: Map 1.2 Legislative Assembly Districts - Inner
20
Parliamentary Library Research Service
Index of Relative Socio-Economic Advantage/Disadvantage: Map 2.1. Legislative Assembly Districts – Outer
21
Parliamentary Library Research Service
Index of Relative Socio-Economic Advantage/Disadvantage: Map 2.2 Legislative Assembly Districts - Inner
22
Parliamentary Library Research Service
Index of Economic Resources: Map 3.1. Legislative Assembly Districts – Outer
23
Parliamentary Library Research Service
Index of Economic Resources: Map 3.2 Legislative Assembly Districts - Inner
24
Parliamentary Library Research Service
Index of Education and Occupation: Map 4.1. Legislative Assembly Districts – Outer
25
Parliamentary Library Research Service
Index of Education and Occupation: Map 4.2 Legislative Assembly Districts - Inner
26
Parliamentary Library Research Service
Explanatory Notes
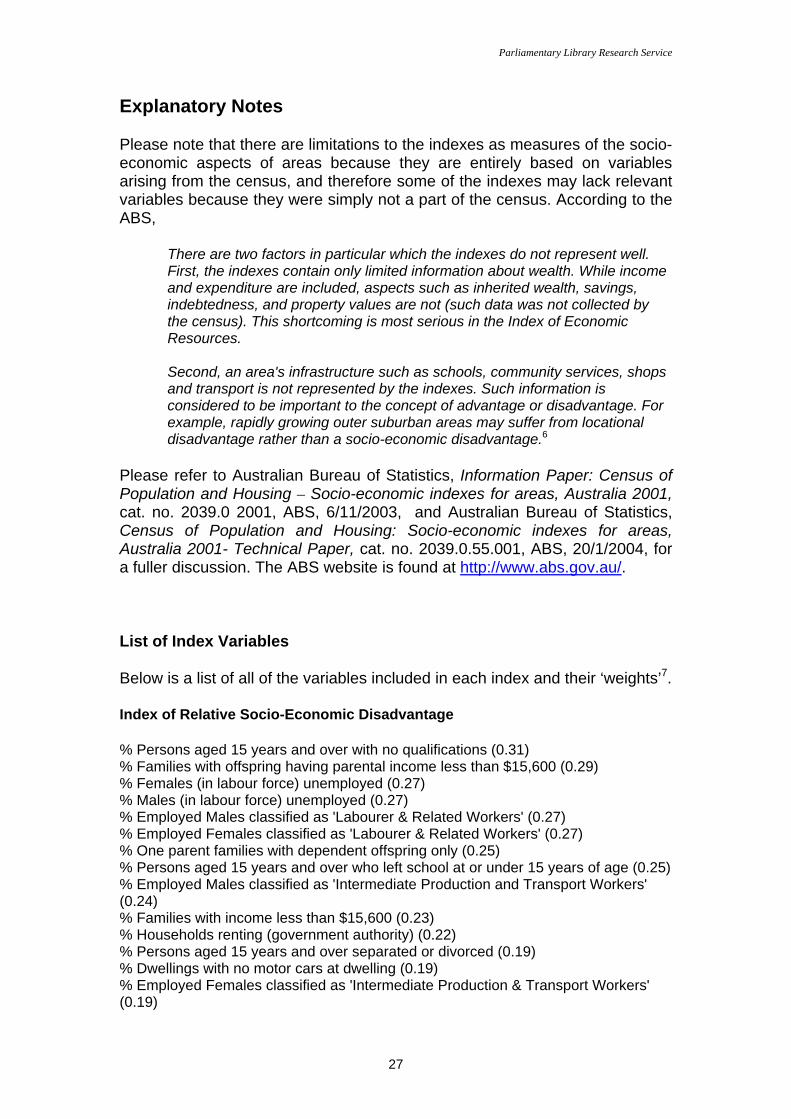
Please note that there are limitations to the indexes as measures of the socio-economic aspects of areas because they are entirely based on variables arising from the census, and therefore some of the indexes may lack relevant variables because they were simply not a part of the census. According to the ABS,
There are two factors in particular which the indexes do not represent well. First, the indexes contain only limited information about wealth. While income and expenditure are included, aspects such as inherited wealth, savings, indebtedness, and property values are not (such data was not collected by the census). This shortcoming is most serious in the Index of Economic Resources. Second, an area's infrastructure such as schools, community services, shops and transport is not represented by the indexes. Such information is considered to be important to the concept of advantage or disadvantage. For example, rapidly growing outer suburban areas may suffer from locational disadvantage rather than a socio-economic disadvantage.6
Please refer to Australian Bureau of Statistics, Information Paper: Census of Population and Housing – Socio-economic indexes for areas, Australia 2001, cat. no. 2039.0 2001, ABS, 6/11/2003, and Australian Bureau of Statistics, Census of Population and Housing: Socio-economic indexes for areas, Australia 2001- Technical Paper, cat. no. 2039.0.55.001, ABS, 20/1/2004, for a fuller discussion. The ABS website is found at http://www.abs.gov.au/.
List of Index Variables
Below is a list of all of the variables included in each index and their ‘weights’7.
Index of Relative Socio-Economic Disadvantage
% Persons aged 15 years and over with no qualifications (0.31) % Families with offspring having parental income less than $15,600 (0.29) % Females (in labour force) unemployed (0.27) % Males (in labour force) unemployed (0.27) % Employed Males classified as 'Labourer & Related Workers' (0.27) % Employed Females classified as 'Labourer & Related Workers' (0.27) % One parent families with dependent offspring only (0.25) % Persons aged 15 years and over who left school at or under 15 years of age (0.25) % Employed Males classified as 'Intermediate Production and Transport Workers' (0.24) % Families with income less than $15,600 (0.23) % Households renting (government authority) (0.22) % Persons aged 15 years and over separated or divorced (0.19) % Dwellings with no motor cars at dwelling (0.19) % Employed Females classified as 'Intermediate Production & Transport Workers' (0.19)
27
Parliamentary Library Research Service
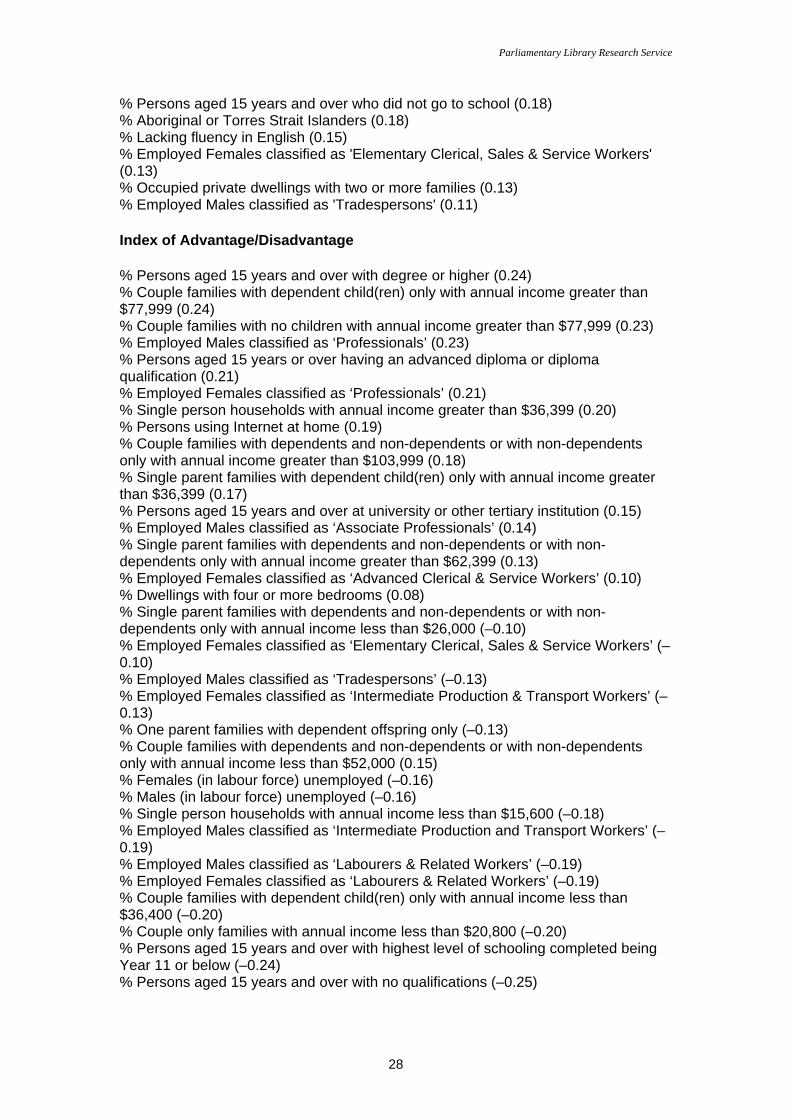
% Persons aged 15 years and over who did not go to school (0.18) % Aboriginal or Torres Strait Islanders (0.18) % Lacking fluency in English (0.15) % Employed Females classified as 'Elementary Clerical, Sales & Service Workers' (0.13) % Occupied private dwellings with two or more families (0.13) % Employed Males classified as 'Tradespersons' (0.11)
Index of Advantage/Disadvantage
% Persons aged 15 years and over with degree or higher (0.24) % Couple families with dependent child(ren) only with annual income greater than $77,999 (0.24) % Couple families with no children with annual income greater than $77,999 (0.23) % Employed Males classified as ‘Professionals’ (0.23) % Persons aged 15 years or over having an advanced diploma or diploma qualification (0.21) % Employed Females classified as ‘Professionals’ (0.21) % Single person households with annual income greater than $36,399 (0.20) % Persons using Internet at home (0.19) % Couple families with dependents and non-dependents or with non-dependents only with annual income greater than $103,999 (0.18) % Single parent families with dependent child(ren) only with annual income greater than $36,399 (0.17) % Persons aged 15 years and over at university or other tertiary institution (0.15) % Employed Males classified as ‘Associate Professionals’ (0.14) % Single parent families with dependents and non-dependents or with non-dependents only with annual income greater than $62,399 (0.13) % Employed Females classified as ‘Advanced Clerical & Service Workers’ (0.10) % Dwellings with four or more bedrooms (0.08) % Single parent families with dependents and non-dependents or with non-dependents only with annual income less than $26,000 (–0.10) % Employed Females classified as ‘Elementary Clerical, Sales & Service Workers’ (–0.10) % Employed Males classified as ‘Tradespersons’ (–0.13) % Employed Females classified as ‘Intermediate Production & Transport Workers’ (–0.13) % One parent families with dependent offspring only (–0.13) % Couple families with dependents and non-dependents or with non-dependents only with annual income less than $52,000 (0.15) % Females (in labour force) unemployed (–0.16) % Males (in labour force) unemployed (–0.16) % Single person households with annual income less than $15,600 (–0.18) % Employed Males classified as ‘Intermediate Production and Transport Workers’ (–0.19) % Employed Males classified as ‘Labourers & Related Workers’ (–0.19) % Employed Females classified as ‘Labourers & Related Workers’ (–0.19) % Couple families with dependent child(ren) only with annual income less than $36,400 (–0.20) % Couple only families with annual income less than $20,800 (–0.20) % Persons aged 15 years and over with highest level of schooling completed being Year 11 or below (–0.24) % Persons aged 15 years and over with no qualifications (–0.25)
28
Parliamentary Library Research Service
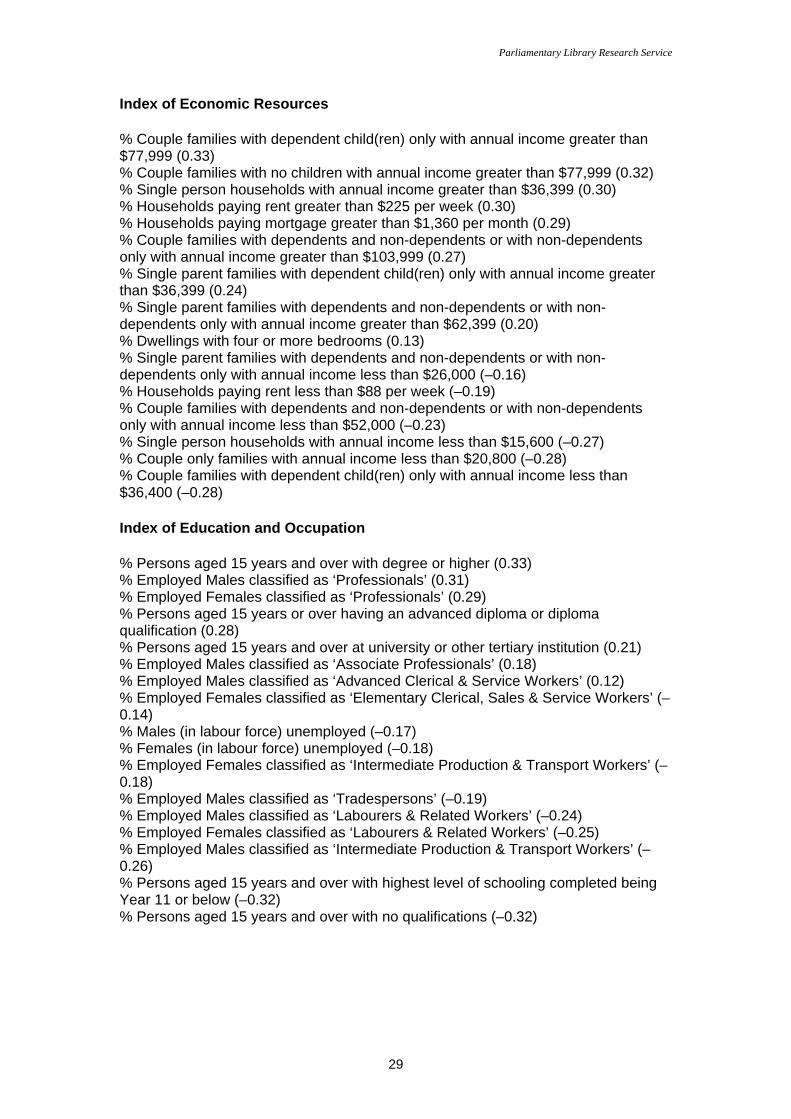
Index of Economic Resources
% Couple families with dependent child(ren) only with annual income greater than $77,999 (0.33) % Couple families with no children with annual income greater than $77,999 (0.32) % Single person households with annual income greater than $36,399 (0.30) % Households paying rent greater than $225 per week (0.30) % Households paying mortgage greater than $1,360 per month (0.29) % Couple families with dependents and non-dependents or with non-dependents only with annual income greater than $103,999 (0.27) % Single parent families with dependent child(ren) only with annual income greater than $36,399 (0.24) % Single parent families with dependents and non-dependents or with non-dependents only with annual income greater than $62,399 (0.20) % Dwellings with four or more bedrooms (0.13) % Single parent families with dependents and non-dependents or with non-dependents only with annual income less than $26,000 (–0.16) % Households paying rent less than $88 per week (–0.19) % Couple families with dependents and non-dependents or with non-dependents only with annual income less than $52,000 (–0.23) % Single person households with annual income less than $15,600 (–0.27) % Couple only families with annual income less than $20,800 (–0.28) % Couple families with dependent child(ren) only with annual income less than $36,400 (–0.28)
Index of Education and Occupation
% Persons aged 15 years and over with degree or higher (0.33) % Employed Males classified as ‘Professionals’ (0.31) % Employed Females classified as ‘Professionals’ (0.29) % Persons aged 15 years or over having an advanced diploma or diploma qualification (0.28) % Persons aged 15 years and over at university or other tertiary institution (0.21) % Employed Males classified as ‘Associate Professionals’ (0.18) % Employed Males classified as ‘Advanced Clerical & Service Workers’ (0.12) % Employed Females classified as ‘Elementary Clerical, Sales & Service Workers’ (–0.14) % Males (in labour force) unemployed (–0.17) % Females (in labour force) unemployed (–0.18) % Employed Females classified as ‘Intermediate Production & Transport Workers’ (–0.18) % Employed Males classified as ‘Tradespersons’ (–0.19) % Employed Males classified as ‘Labourers & Related Workers’ (–0.24) % Employed Females classified as ‘Labourers & Related Workers’ (–0.25) % Employed Males classified as ‘Intermediate Production & Transport Workers’ (–0.26) % Persons aged 15 years and over with highest level of schooling completed being Year 11 or below (–0.32) % Persons aged 15 years and over with no qualifications (–0.32)
29
Parliamentary Library Research Service
Endnotes
1 Lesman, Bella (2004) Victorian State Electorate Rankings – 2001 Census, Research Paper No. 2, Parliamentary Library, Department of Parliamentary Services, Melbourne.
2 Principal Component Analysis is a multivariate data analysis tool which, “summarises groups of social and economic variables, calculating weights that will give the best summary for the underlying variables.’ Each of the SEIFA indexes uses a different set of underlying variables.” Australian Bureau of Statistics (2003) Information Paper: Census of Population and Housing – Socio-economic indexes for areas, Australia 2001, Cat. no. 2039.0, ABS, Canberra, p.9. 3 A Census Collection District (CCD) is a census workload area in which one collector can deliver and collect census forms within the designated time. There are generally about 230 dwellings per CCD in urban areas and fewer in rural ones. It is the smallest geographic area of the 2001 census. 4 To calculate a weighted average, each CCD score is multiplied by its census population count. The total score of all the CCDs in the region is divided by the total regional population count. Australian Bureau of Statistics (2003) Information Paper, op. cit., p.6. 5 An Index number is a statistic which assigns a single number to several individual statistics in order to quantify trends. It is a single composite of several variables that are recognised as contributing to a particular dimension and which may reflect the population profile of these variables. Australian Bureau of Statistics (2003) Information Paper, op. cit., p.12. 6 ibid., p.18. 7 The variables are grouped by the value of their weight to indicate the contribution of each variable to the index. Australian Bureau of Statistics (2003) Information Paper, op. cit., p.21.
30
Parliamentary Library Research Service
References
Australian Bureau of Statistics (2003) Census of Population and Housing: Socio-Economic Indexes for Areas (SEIFA), Victoria - Data Only, 2001, Cat. no. 2033.2.55.001, ABS, Canberra. Australian Bureau of Statistics (2003) Census of Population and Housing: Socio-Economic Indexes for Areas (SEIFA), Victoria, 2001, Product no. 2033.2.30.001, ABS, Canberra.
Australian Bureau of Statistics (2004) Census of Population and Housing: Socio-economic indexes for areas, Australia 2001-Technical Paper, Cat. no. 2039.0.55.001, ABS, Canberra.
Australian Bureau of Statistics (2003) Information Paper: Census of Population and Housing – Socio-economic indexes for areas, Australia 2001, Cat. no. 2039.0, ABS, Canberra.
31

© 2006 Library, Department of Parliamentary Services, Parliament of Victoria Except to the extent of the uses permitted under the Copyright Act 1968, no part of this document may be reproduced or transmitted in any form or by any means including information storage and retrieval systems, without the prior written consent of the Department of Parliamentary Services, other than by Members of the Victorian Parliament in the course of their official duties. Research Service This paper has been prepared by the Research Service for use by Members of the Victorian Parliament. The Service prepares briefings and publications for Parliament in response to Members, and in anticipation of their requirements, undertaking research in areas of contemporary concern to the Victorian legislature. While it is intended that all information provided is accurate, it does not represent professional legal opinion. Research publications present current information as at the time of printing. They should not be considered as complete guides to the particular subject or legislation covered. The views expressed are those of the author(s). Enquiries Enquiries should be addressed to: Dr Greg Gardiner Senior Research Officer Victorian Parliamentary Library Parliament House Spring St, Melbourne Victoria 3002 T: (03) 9651 8640 F: (03) 9654 1339
Information about Research Publications is available on the Internet at: http://www.parliament.vic.gov.au