Embed Size (px)
Citation preview
Socio-Economic Disadvantage and the prevalence of disability Bruce Bradbury, Kate Norris and David Abello
SPRC Report 1/01 Social Policy Research Centre University of New South Wales January 2001
2
Socio-Economic Disadvantage and the Prevalence of Disability
A Report Prepared by the Social Policy Research Centre, University of New South Wales
for the Victorian Department of Human Services, DisAbility Services
February 2001
By Bruce Bradbury, Kate Norris and David Abello
We would like to thank Tony Eardley, Michael Fine, Brenda Whitmore-Seidel, Glenn Foard and members of the DHS reference group for comments on earlier drafts of this report, and Diana Encel and Lynda Pawley for their editorial and production assistance.
Copyright © 2000 State of Victoria. Reproduced with the permission of the Victorian Minister for Community Services. Unauthorised reproduction and other uses comprised in the copyright are prohibited without permission.
SPRC
3
Contents
Abstract .................................................................................................................................................. 6
1 Introduction.............................................................................................................................. 7
1.1 Background................................................................................................................................ 7 1.2 Objectives and Scope................................................................................................................. 8 1.3 The Current Equity Funding Model........................................................................................... 9
2 The Relationship Between Disability and Disadvantage .................................................... 10
2.1 Previous Research on the Association Between Socio-Economic Characteristics and Disability.................................................................................................................................. 10
2.2 Modelling the Link Between Disability, Disadvantage and Location ..................................... 12
3 Evidence from the ABS 1998 Survey of Disability, Ageing and Carers ............................ 18
3.1 The Australian Bureau of Statistics Survey of Disability, Ageing and Carers, 1998............... 18 3.2 Age, Sex and Birthplace .......................................................................................................... 19 3.3 Education ................................................................................................................................. 20 3.4 Labour Market Outcomes ........................................................................................................ 21 3.5 Income and Housing ................................................................................................................ 22 3.6 Area of Residence.................................................................................................................... 23 3.7 Aboriginality............................................................................................................................ 26 3.8 Multivariate Analysis............................................................................................................... 27 3.9 Characteristics Associated with Disability Amongst Children ................................................ 30
4 The Socio-Economic Characteristics of Victoria�s Regions ............................................... 34
4.1 Geographic Data Directly Available from the SDAC 1998 Survey......................................... 34 4.2 1996 Census Information on the Nine Victorian Regions ....................................................... 35
5 Implications for the Regional Distribution of Disability .................................................... 43
5.1 Objectives ................................................................................................................................ 43 5.2 Adjustments for Age and Gender............................................................................................. 43 5.3 Adjustment for Socio-Economic Characteristics ..................................................................... 46 5.4 Implications ............................................................................................................................. 49
6 Appendix: Review of the Key Literature ............................................................................. 51
7 References............................................................................................................................... 71
SOCIO-ECONOMIC DISADVANTAGE AND THE PREVALENCE OF DISABILITY
4
Tables Table 3.1 Percentage of Each Age and Sex Group who have a Severe or Profound Disability..... 19 Table 3.2 Disability Rates by Country of Birth.............................................................................. 20 Table 3.3 Disability Status by Labour Force Status ....................................................................... 21 Table 3.4 Labour Force Status by Disability Status ....................................................................... 21 Table 3.5 Logistic Regression Results: Females (15-64 years) ..................................................... 27 Table 3.6 Logistic Regression Results: Males (15-64 years) ......................................................... 28 Table 3.7 Logistic Regression Results � Household Level ............................................................ 30 Table 3.8 Child Disability Rates by Household Income and Family Type .................................... 31 Table 3.9 Child Disability Rates by Labour Force Status of Mother ............................................. 31 Table 3.10 Child Disability Rates by Labour Force Status of Father............................................... 31 Table 3.11 Parental Employment Rates by Disability Status of Child............................................. 32 Table 3.12 Child Disability Rates by Parent�s Educational Attainment .......................................... 32 Table 4.1 Australian Disability Rates, by Age and Sex ................................................................. 34 Table 4.2 Victorian Disability Rates, by Age and Sex................................................................... 34 Table 4.3 Disability Rates, Children in Australia and Victoria...................................................... 35 Table 4.4 Age and Gender Distribution by Region........................................................................ 36 Table 4.5 Non-Participation Rate, by Region and Age Group....................................................... 37 Table 4.6 Cumulative Personal Weekly Income Distribution, by Region: Persons Aged 15-64 ... 37 Table 4.7 Personal Weekly Income Distribution, by Region: Persons Aged 5-64......................... 38 Table 4.8 Weekly Household Income Distribution, by Region: All Persons................................. 38 Table 4.9 Cumulative Household Weekly Income Distribution, by Region: All Households ....... 39 Table 4.10 Within-Region Distribution of the Index of Relative Socio-Economic Disadvantage... 42 Table 5.1 Regional Funding Distribution, Regression Compared with Current Model ................. 44 Table 5.2 Logistic Regression Coefficients ................................................................................... 46 Table 5.3 Relative Funding Arrangements based on Regression Analysis .................................... 47
SPRC
5
Figures Figure 2.1 Disadvantage and Disability...................................................................................... 13 Figure 2.2 The Assumed Causal Model...................................................................................... 15 Figure 2.3 A More Comprehensive Causal Model ..................................................................... 16 Figure 3.1 Disability Rates by Highest Level of Educational Attainment and Age ................... 20 Figure 3.2 Disability Rates by Personal Income......................................................................... 22 Figure 3.3 Disability Rates, by Household Income Ranges ....................................................... 22 Figure 3.4 Disability Rates by Housing Tenure Type and Age .................................................. 23 Figure 3.5 Disability Rates by IRSED Decile ............................................................................ 25 Figure 3.6 Rates of Disability in Capital City vs. Balance of State, by IRSED Decile .............. 29 Figure 3.7 Children, Disability Rates by Decile of Index of Socio-economic Disadvantage ..... 33 Figure 4.1 Index of Relative Socio-Economic Disadvantage, Comparing the Regions ............. 39 Figure 4.2 The Five ABS Socio-Economic Indices for Areas (SEIFA) ..................................... 41 Figure 5.1 Funding Relative to Age by Sex Model .................................................................... 48
SOCIO-ECONOMIC DISADVANTAGE AND THE PREVALENCE OF DISABILITY
6
Abstract
What is the extent of the relationship between disability and socio-economic disadvantage? What are the implications of this relationship for estimates of the prevalence of disability in the regions of Victoria, and hence for the funding decisions of the Department of Human Services? These are the primary concerns of this report prepared for the Victorian Department of Human Services, DisAbility Services by the Social Policy Research Centre.
The report draws upon a comprehensive literature review and data from the 1998 ABS Survey of Disability Ageing and Carers (SDAC) to establish a strong association between disability and socio-economic disadvantage, particularly for the group of interest to DisAbility Services, people who are severely or profoundly disabled. This association remains clearly apparent using both cross-tabulations of social indicators at the personal and household level, for adults and children, and by using a multivariate logistic regression analysis.
Data from the 1996 Australian Census are combined with data from the 1998 SDAC in an extension of the existing equity funding model, to provide estimates of the prevalence of disability in each of the nine Victorian regions. Suggestions are made as to how this information might be used to best target future allocations of growth funding to the different regions. The limitations of the modeling method used are explained in the context of the causal relationships between disability, disadvantage and location.
SPRC
7
1 Introduction
What is the relationship between socio-economic disadvantage and disability, and what are the implications of this relationship for regionally-based disability service funding models? The Social Policy Research Centre was commissioned by the DisAbility Services branch of the Victorian Department of Human Services (DHS) to examine these questions. This report addresses these issues with particular reference to the socio-economic environment of Victoria, and the regional funding model employed by DisAbility Services.
The report is in five main sections. This first section defines the objectives of the research project. It also introduces the key conceptual issues involved in considering the relationship between socio-economic disadvantage and disability, and the implications of this for the spatial distribution of disability. Section 2 provides a summary of the previous research undertaken in this area (with a more detailed description of previous research attached as an Appendix).
Section 3 then describes Australian patterns in the relationship between disability and the socio-economic characteristics of individuals, families and households. This section is based primarily upon new analysis undertaken for this project using the confidentialised unit record file of the Australian Bureau of Statistics (ABS) 1998 Survey of Disability, Ageing and Carers. In Section 4 we then consider the patterns of socio-economic disadvantage found in the different funding regions of Victoria, using a variety of Census-based indicators.
Section 5 then integrates these two sets of data to provide estimates of the differential extent of disability in these regions. It discusses the implications and limitations of these estimates for regional equity funding models.
1.1 Background
Over time and in different national settings, a range of different approaches have been used to address problems encountered in the planning and finance of care services for people with disabilities of different ages (Fine, Graham and Webb, 1991). However, the paucity of accurate data on the residential location of the target population in Australian States makes the planning and financing of care services an exceedingly difficult task.
The Disability Program of the Department of Human Services, DisAbility Services, Victoria has a budget of approximately $670 million for 2000-2001. Most of this budget is allocated to the nine DHS regions for the provision or purchase of a range of specialist services for people with disabilities. It is desired that funds be allocated between these different regions in an equitable manner that reflects both the need for services in each region and the cost of delivering services.
Currently the program uses a regional equity approach in its allocation of funds. This is based on estimates of the population of each region in each age/sex category, together with an adjustment to the funding for some regions to take account of greater levels of socio-economic disadvantage (see below for more details).
SOCIO-ECONOMIC DISADVANTAGE AND THE PREVALENCE OF DISABILITY
8
The adjustment is made on the basis of previous research, which has shown an association between socio-economic disadvantage and the prevalence of disability. The key goal of the present study is to provide further information that will permit a more detailed understanding of this relationship, and hence assist in future refinements to the equity-based funding formula.
1.2 Objectives and Scope
More specifically, this report has two key objectives.
• To document the extent of any relationship between severe or profound disability and socio-economic disadvantage.
• To analyse the implications of this relationship for estimates of the extent of disability in different regions, and hence for regional funding models.
It is important to note at the outset that there are several ways in which socio-economic disadvantage might be relevant to funding models for disability services. First, disadvantage may be associated with disability, implying that economically disadvantaged regions may contain more people with disabilities than might be expected on the basis of general population estimates. This relationship is the focus of this report.
In addition, it may be the case that for a given level of disability (or, more precisely, impairment) a person with access to fewer economic resources will require greater public assistance. This would suggest a need for additional resources for disadvantaged regions. Similarly, there may be institutional reasons that might influence regional funding patterns. For example, service delivery institutions may be historically located in particular areas and expensive to move. Both of these issues, however, are beyond the scope of this report.
Following the scope of the Victorian Disability Program, this project focuses on those people with disabilities who are aged between 5 and 64. In our statistical analysis, we approximate the target population for these services by restricting the analysis to those who fall into the ABS categories of severe or profound disability. Because the ABS disability surveys only collect socio-economic information for those people living in households, we confine our attention to this group.1 The results are therefore only relevant to the non-institutionalised disabled population.
In this report, socio-economic advantage and disadvantage are defined in terms of the degree of access to the social and economic resources of Australian society. In principle, resources include income and wealth as conventionally measured, but also access to social services and public goods. In practice, we must draw on a more limited range of variables, which provide indicators of access to social resources. These include income, education, and country of birth, together with the ABS regional indicators of advantage and disadvantage. As well as looking at the association
1 For instance, while the index of relative socio-economic disadvantage is given for those people
living in cared accommodation, the survey does not give information about the labour force status or income of these people.

SPRC
9
between disability and disadvantage at the individual level, we also examine the relationship between personal disability and family and household characteristics.
1.3 The Current Equity Funding Model
The current funding model used by the disability program in Victoria involves a number of steps. First, national rates of severe and profound disability within each age/sex group are estimated from the ABS Disability survey. These are applied to Census-based age/sex population estimates in each region to obtain a �baseline� estimate of the relative numbers of people with disabilities in the different regions. Additional adjustments are then made to reflect the higher prevalence of disability amongst particular groups and/or the higher costs of delivering services due to social or geographical factors. These adjustments are as follows.
• Rural regions receive a 0.05 additional weighting to assist in the delivery of services in areas outside metropolitan Melbourne (ie the funding of rural regions is increased by five per cent above the baseline estimate). This weighting is not applied if a region�s historical funding base is more than 120 per cent above its estimated population share.
• Indigenous people in each region received a weighting of 2. That is, it is assumed that the rate of disability is twice as high among indigenous people than in the general population. This approach mirrors that adopted in the Commonwealth State Disability Agreement with respect to the distribution of Commonwealth monies to the States and Territories.
• The populations of the two regions (Western and Northern Metropolitan) with the highest level of socio-economic disadvantage, as measured by the ABS Index of Relative Socio-Economic Disadvantage (IRSED), receive an additional weighting of 0.1. That is, it is assumed that their rate of disability is 10 per cent higher than the average.
The estimates of disability prevalence and need arising from these calculations are then used to generate an equity funding model for distribution of the DisAbility Services Budget across the different regions. However, because of the need to take account of historical patterns of service location, this formula is currently used in conjunction with a rule that no region�s allocation should fall below its existing resource base.
The goal of this present report is to provide evidence relevant for further refinements of the equity funding model � in particular the adjustments made for aboriginality and socio-economic disadvantage. As mentioned above, funding adjustments to take account of the cost of delivering services or historical patterns fall outside the scope of this report.
SOCIO-ECONOMIC DISADVANTAGE AND THE PREVALENCE OF DISABILITY
10
2 The Relationship Between Disability and Disadvantage
2.1 Previous Research on the Association Between Socio-Economic Characteristics and Disability
There has been a substantial volume of previous research describing the associations between demographic and socio-economic characteristics and disability.2 We outline the results from a number of studies in the Appendix. The key conclusions from this research can be summarised as follows.
Age and gender In Australia and the USA age is a strong predictor of disability. Within some age groups, disability prevalence also varies between the genders. In Australia, in 1998, male children were significantly more likely than their female age peers to have a disability. Younger males (15 to 44 years of age) and older males (60 to 79 year) of age) were more likely to have a disability.
Low income Research from both the UK and the USA has shown a strong link between prevalence of disability and low income. In the UK an analysis showed that three-quarters of families with a member with a disability were concentrated in the bottom half of the income distribution. Research in the USA found that most people with a physical impairment were concentrated in the bottom one-fifth of the income distribution. Research has also found that poverty and the prevalence of childhood disability are also related. In Australia, in 1977, the Henderson Inquiry established a strong link between disability (and the degree of �severity� of disability) and poverty in Australia. King has shown the relationship persists into the present.
Employment and labour force participation In the UK in the mid 1980s, labour force participation was low for people with a disability and unemployment was high. This pattern is repeated in Australia with, in 1998, half of people with a disability (including those without activity restriction) in the labour force (compared with four-fifths of non-disabled) and 11.5 per cent unemployed (compared with 7.8 per cent of non-disabled). As the severity of disability increases, unemployment increases and labour force participation reduces. Women with a disability have lower participation rates than men with a disability.
Labour market segmentation and income from employment In the Netherlands the rise in the number of disability insurance beneficiaries through the late 1960s and 1970s has been linked to economic decline and its variable effects on industry (particularly reducing employment levels in manufacturing and allied industries) and a heightening awareness of disability, injury and occupational health and safety. In the UK people with a disability are more likely to occupy the lower paid segments of the labour force. There is also evidence showing that some disabled people are being paid less than their non-disabled counterparts in the same
2 Unless specified, the term �disabled� refers in this Section and the Appendix to all degrees of
restriction, not just severe and profound disability.
SPRC
11
occupations. In Sweden people with a disability are unskilled workers to a larger extent than non-disabled people, and more likely to work in service and operative occupations. Deregulation of wage setting during the 1980s in Sweden has also been implicated in employers basing wage setting on their assessment of individual abilities, which they underestimate in the case of workers with disabilities. In general, employment does not necessarily reduce the socio-economic disadvantage of people with a disability, who are more likely to work in part-time jobs without award conditions.
The costs of disability In the UK, the costs of disability have their greatest impact on people with lower incomes. Policy responses in Australia to the additional costs of disability have generally covered only part of these costs. Research has shown that the mobility costs of people with severe physical disability and vision impairment were five times the value of the mobility allowance (based on 1990 values). The additional costs of disability further reduce the benefits of labour market participation, with about 70 per cent of those receiving support in open employment from Disability Services Act funded services requiring assistance with activities of everyday life.
Ethnicity and country of birth In Australia, the prevalence of disability varies considerably by country of birth, (though it appears this may be primarily an age effect), with the highest rates among those born in the UK, Ireland and New Zealand and the lowest among those born in South-East, North-East, Southern and Central Asia. People from a non-English speaking background are under-represented among consumers of Commonwealth State Disability Agreement (CSDA) services (4.6 per cent in Victoria in 1998). Those CSDA consumers who were born overseas comprised six per cent (nationally) compared with 22 per cent of the Australian population born overseas. In two USA studies, the prevalence of disability was shown to vary among ethnic groups, with �Blacks� having twice the disability prevalence of �Whites�.
Aboriginality Statistics show that indigenous Australians are severely socio-economically disadvantaged. There are difficulties associated with the identification of indigenous people with disabilities. Subcultural meanings attached to �disability� can confound the measurement of disability prevalence, with an Aboriginal identity more central than a disability identity. In 1993 a full census of Aboriginal people usually resident in the Taree area (of NSW) was conducted showing that community members were more than twice as likely as non-indigenous Australians to have a disability.
Educational achievement In Australia, people with a disability (including those with mild, moderate and no activity restriction) were much more likely to have a lower level of educational attainment, with one-tenth of those completing Year 12, one third of those leaving at age 15 or earlier and almost one half of those who never attended school having a disability. In the USA a similar correlation between education and disability was found. Australian research has shown, in 1990, that literacy difficulties were a significant employment barrier among Department of Social Security Invalid Pension
SOCIO-ECONOMIC DISADVANTAGE AND THE PREVALENCE OF DISABILITY
12
recipients and that those with post-school qualifications were out of work for shorter periods.
Family structure A study conducted in Victoria has found that parents with an intellectual disability are disadvantaged both by their disability, and by an inability to reduce further disadvantage. Studies in the UK and the USA have shown that single parent families were more likely to have a child with a disability than double parent families. A piece of UK research has found that when maternal education and income are controlled for, the differences disappear. A USA study, on the other hand� established a high correlation between single parents and children with disabilities, with single parenthood exerting an independent effect on the probability of disability. However, some UK studies have challenged the idea that disability in young people increases the risk of family break-up or reduces the possibilities of forming new families. It has also been established that men whose partners are women with disabilities are more likely to have a lower status occupation than men whose female partners are non-disabled.
Rural and remote location Rural and remote people with a disability in New South Wales and their families/communities display a large number of factors some of which lead to greater costs on people with a disability and families with a member with a disability, than those living in metropolitan areas. Among factors raised were transport, employment, education, respite care and accommodation. USA research has found a higher prevalence of disability in rural areas in the southern states.
2.2 Modelling the Link Between Disability, Disadvantage and Location
Explanations for the associations between disability and socio-economic disadvantage generally fall into one of three groups.
First, and most obviously, is a causal relationship running from disability to disadvantage. In industrial and post-industrial societies, most (but not all) disabilities reduce the income-earning potential of individuals. Similarly, the disability of one family member may reduce the employment opportunities of other family members due to their additional caring responsibilities (and the lack of accommodation of those responsibilities in the labour market).
SPRC
13
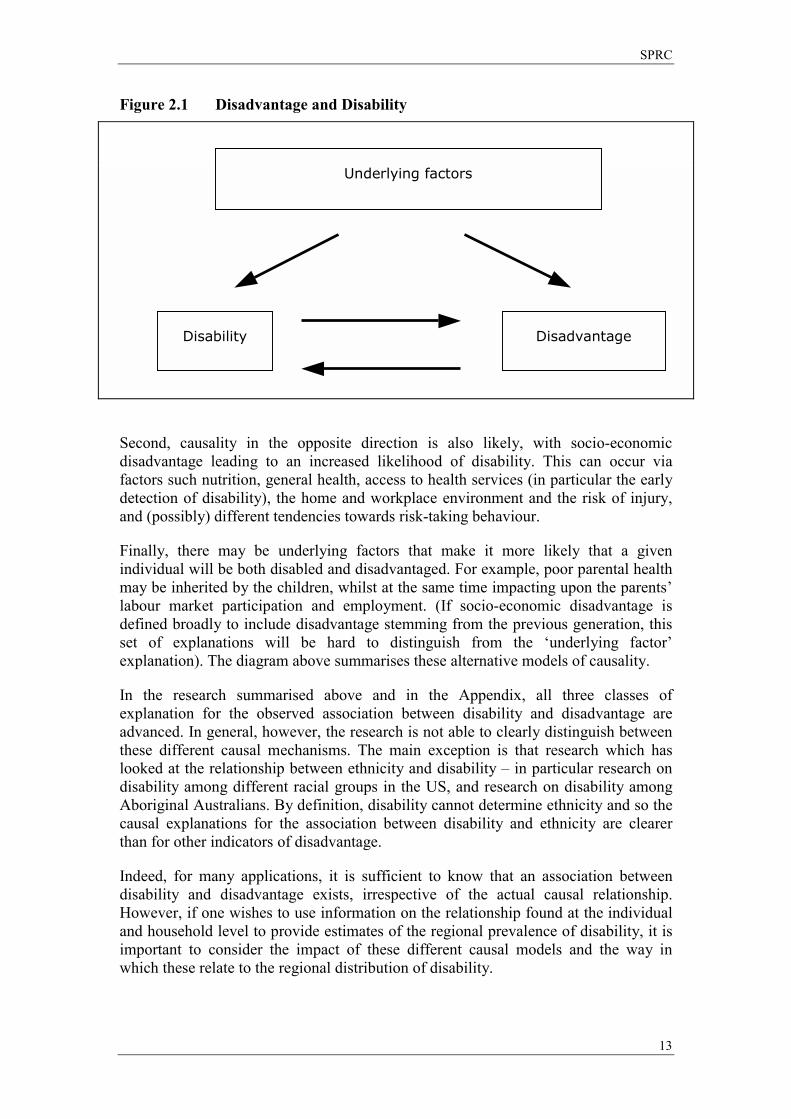
Figure 2.1 Disadvantage and Disability
Second, causality in the opposite direction is also likely, with socio-economic disadvantage leading to an increased likelihood of disability. This can occur via factors such nutrition, general health, access to health services (in particular the early detection of disability), the home and workplace environment and the risk of injury, and (possibly) different tendencies towards risk-taking behaviour.
Finally, there may be underlying factors that make it more likely that a given individual will be both disabled and disadvantaged. For example, poor parental health may be inherited by the children, whilst at the same time impacting upon the parents� labour market participation and employment. (If socio-economic disadvantage is defined broadly to include disadvantage stemming from the previous generation, this set of explanations will be hard to distinguish from the �underlying factor� explanation). The diagram above summarises these alternative models of causality.
In the research summarised above and in the Appendix, all three classes of explanation for the observed association between disability and disadvantage are advanced. In general, however, the research is not able to clearly distinguish between these different causal mechanisms. The main exception is that research which has looked at the relationship between ethnicity and disability � in particular research on disability among different racial groups in the US, and research on disability among Aboriginal Australians. By definition, disability cannot determine ethnicity and so the causal explanations for the association between disability and ethnicity are clearer than for other indicators of disadvantage.
Indeed, for many applications, it is sufficient to know that an association between disability and disadvantage exists, irrespective of the actual causal relationship. However, if one wishes to use information on the relationship found at the individual and household level to provide estimates of the regional prevalence of disability, it is important to consider the impact of these different causal models and the way in which these relate to the regional distribution of disability.
Underlying factors
Disability Disadvantage
SOCIO-ECONOMIC DISADVANTAGE AND THE PREVALENCE OF DISABILITY
14
In Section 3 below we provide results reinforcing those of the previous research showing that there is indeed a substantial association between disability and disadvantage at both the personal and household level. Disabled people are more likely to be disadvantaged, and vice versa. In Section 4, we also show that there are substantial differences in the extent of socio-economic disadvantage in the different disability funding regions in Victoria.
Do these two facts together imply that disadvantaged regions will contain more people with disabilities than would be expected on the basis of demographic patterns? The answer to this question depends upon the precise causal relationships between disadvantage, disability and residential location.
Unfortunately, in Australia, there is very little direct evidence on the prevalence of disability in different regions. In Section 5, therefore, we use a well-known imputation method to estimate the numbers of disabled people in each region. This is an extension of the age-sex based weighting used in the current funding formula for disability services in Victoria. This approach utilises the observed relationships between disability and disadvantage and between disadvantage and location to impute the relationship between disability and location (over and above that due to demographic patterns).
The essence of the methodology can be summarised as follows (to simplify the presentation, we ignore the relationship of disability with age and gender). First, we calculate the prevalence of disability within each socio-economic group across the whole of Australia (a variety of indicators are used). Then, within each region, we apply these prevalence rates to the people in each socio-economic group to estimate the total number of disabled people in the region.
For example, if the population is divided into two socio-economic groups, the national prevalence of disability is 10 and 5 per cent in groups 1 and 2 respectively, and a particular region has 40 per cent of people in group 1 and 60 per cent in group 2, then we estimate the disability prevalence in that region as 0.1×0.4 + 0.05×0.6 = 0.07, or 7 per cent.
This method will accurately estimate the prevalence of disability in each region as long as we can assume that the prevalence of disability within a given socio-economic group is the same in all regions. That is, as long as the national relationship between disability and disadvantage also applies to the people living within every region.
As a first approximation, this assumption may be reasonable. However, it does have strong implications for the patterns of association between disability, disadvantage and location. In particular, the overall relationship that we estimate between disability and region must arise solely via the links between region and socio-economic status and between socio-economic status and disability. That is, there is no direct link between disability and location. The only reason that some regions have more disabled than expected on the basis of demographic patterns is because they have more disadvantaged people.
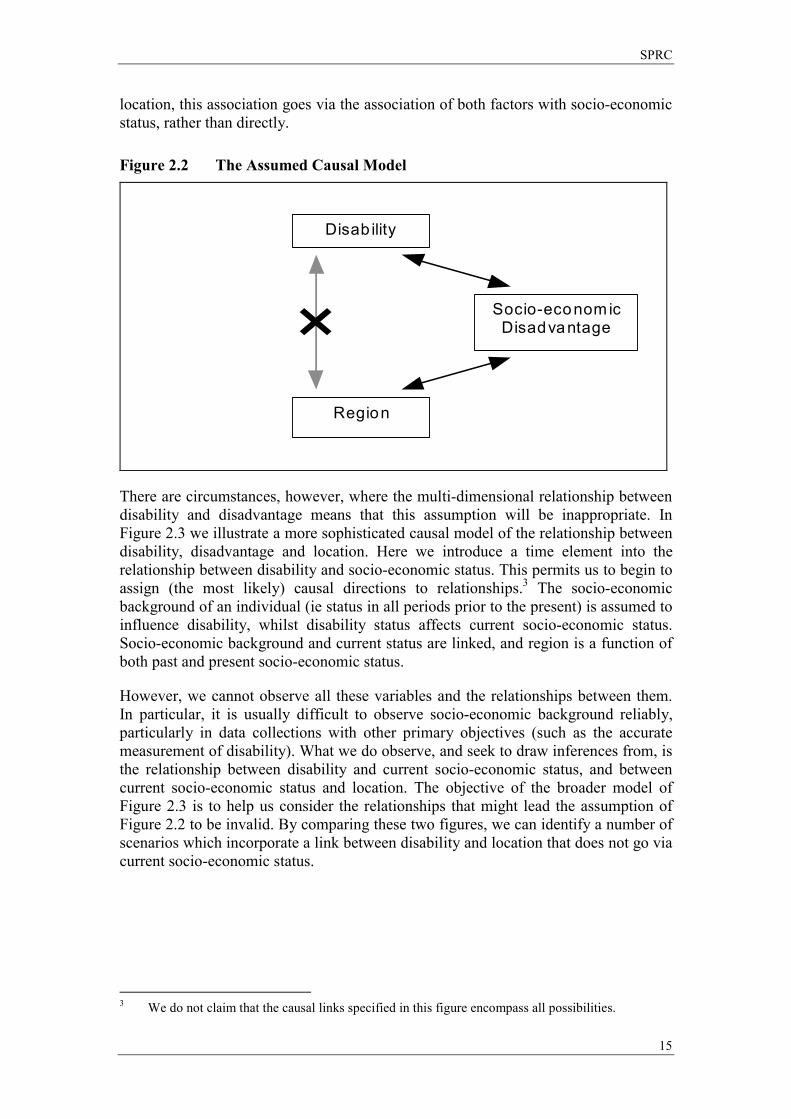
The causal model that is implied by this modelling assumption is illustrated in Figure 2.2. We assume that, whilst there may be an association between disability and
SPRC
15
location, this association goes via the association of both factors with socio-economic status, rather than directly.
Figure 2.2 The Assumed Causal Model
Disab ility
Socio-econom ic Disadvantage
Region
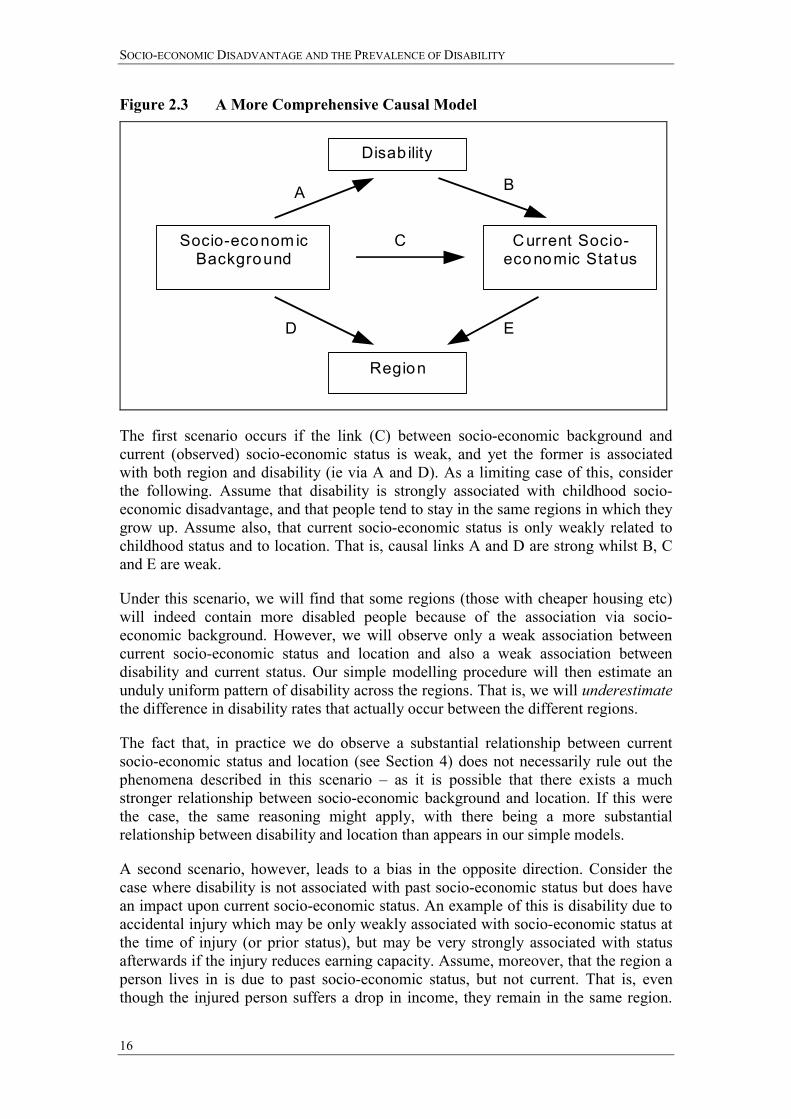
There are circumstances, however, where the multi-dimensional relationship between disability and disadvantage means that this assumption will be inappropriate. In Figure 2.3 we illustrate a more sophisticated causal model of the relationship between disability, disadvantage and location. Here we introduce a time element into the relationship between disability and socio-economic status. This permits us to begin to assign (the most likely) causal directions to relationships.3 The socio-economic background of an individual (ie status in all periods prior to the present) is assumed to influence disability, whilst disability status affects current socio-economic status. Socio-economic background and current status are linked, and region is a function of both past and present socio-economic status.
However, we cannot observe all these variables and the relationships between them. In particular, it is usually difficult to observe socio-economic background reliably, particularly in data collections with other primary objectives (such as the accurate measurement of disability). What we do observe, and seek to draw inferences from, is the relationship between disability and current socio-economic status, and between current socio-economic status and location. The objective of the broader model of Figure 2.3 is to help us consider the relationships that might lead the assumption of Figure 2.2 to be invalid. By comparing these two figures, we can identify a number of scenarios which incorporate a link between disability and location that does not go via current socio-economic status.
3 We do not claim that the causal links specified in this figure encompass all possibilities.
SOCIO-ECONOMIC DISADVANTAGE AND THE PREVALENCE OF DISABILITY
16
Figure 2.3 A More Comprehensive Causal Model
Disab ility
Region
Current Socio-economic Status
Socio-econom ic Background
A
D
C
E
B
The first scenario occurs if the link (C) between socio-economic background and current (observed) socio-economic status is weak, and yet the former is associated with both region and disability (ie via A and D). As a limiting case of this, consider the following. Assume that disability is strongly associated with childhood socio-economic disadvantage, and that people tend to stay in the same regions in which they grow up. Assume also, that current socio-economic status is only weakly related to childhood status and to location. That is, causal links A and D are strong whilst B, C and E are weak.
Under this scenario, we will find that some regions (those with cheaper housing etc) will indeed contain more disabled people because of the association via socio-economic background. However, we will observe only a weak association between current socio-economic status and location and also a weak association between disability and current status. Our simple modelling procedure will then estimate an unduly uniform pattern of disability across the regions. That is, we will underestimate the difference in disability rates that actually occur between the different regions.
The fact that, in practice we do observe a substantial relationship between current socio-economic status and location (see Section 4) does not necessarily rule out the phenomena described in this scenario � as it is possible that there exists a much stronger relationship between socio-economic background and location. If this were the case, the same reasoning might apply, with there being a more substantial relationship between disability and location than appears in our simple models.
A second scenario, however, leads to a bias in the opposite direction. Consider the case where disability is not associated with past socio-economic status but does have an impact upon current socio-economic status. An example of this is disability due to accidental injury which may be only weakly associated with socio-economic status at the time of injury (or prior status), but may be very strongly associated with status afterwards if the injury reduces earning capacity. Assume, moreover, that the region a person lives in is due to past socio-economic status, but not current. That is, even though the injured person suffers a drop in income, they remain in the same region.
SPRC
17
Also, past status is generally associated with current status. In the context of Figure 2.3, this implies that causal links B, C and D are strong whilst A and E are weak.
Under this scenario, we will observe an association between disability and current socio-economic status. In addition, even though there is no direct causal link between them, we will also observe an association between current socio-economic status and region. This is because they are both associated with past socio-economic status. These two associations will lead us to conclude that the more disadvantaged regions have more disabled people. However, our (almost) randomly disabled people are by definition, evenly spread across the regions. In this case therefore, the simple model will overestimate the difference in disability prevalence rates between the regions.
Both these scenarios have in common the assumption that the location in which people live is only weakly related to current socio-economic status, but is related to past socio-economic status. They imply different biases for the simple model depending upon the relative strengths of the causality to or from disability and socio-economic status (ie A vs B). As described here they may appear unlikely scenarios � and they do lead to possible biases in either direction.
However, estimation biases could be introduced by less extreme versions of such models, and these scenarios are not the only possible ones that would invalidate the simple causal model underlying our estimation process. We have been unable to find previous research addressing these policy modelling issues. More research addressing the full model summarised in Figure 2.3 would be required to more comprehensively assess the likely biases that arise from the use of simplified modelling methods. In the meantime, however, we believe that the simple estimation methods used in this report are still better than the alternative assumption which is to assume that there is no inter-regional association between disadvantage and disability.
SOCIO-ECONOMIC DISADVANTAGE AND THE PREVALENCE OF DISABILITY
18
3 Evidence from the ABS 1998 Survey of Disability, Ageing and Carers
How strong is the relationship between disability and socio-economic disadvantage in Australia at the end of the 20th Century? In this Section we examine in detail the relationships found in the ABS Survey of Disability, Ageing and Carers conducted in 1998 (hereafter SDAC 98). The ABS disability surveys provide a unique source of information on the household context of disability, which make them almost ideal for addressing these research questions. The results in this report are based on the confidentialised unit record file available from the survey.
3.1 The Australian Bureau of Statistics Survey of Disability, Ageing and Carers, 1998
In line with the Project Brief, we approximate the Disability Program target group as those people aged between 5-64 and categorised by the ABS as having a severe or profound core activity restriction. We focus mainly on the group aged 15-64 here, considering those aged 5-14 separately in Section 3.9 below (also see Table 3.1).
The SDAC 98 covers both urban and rural Australia, but does not cover remote and sparsely populated areas. As the SDAC 98 technical paper (ABS, 1999c), this exclusion is only an issue for the Northern Territory. Prisoners, non-Australian diplomatic personnel and non-Australian defence personnel and their dependants are not included in the survey. The survey only collects the appropriate socio-economic data for those people living in private households and so we look solely at the household component of the SDAC 98, covering usual residents of private dwellings. Therefore we exclude from the analysis those people who are in �cared accommodation�, such as nursing homes and hospitals. Along with private dwellings (which make up 94.2 per cent of the original survey sample), the household accommodation includes self-care retirement homes, hotels/motels/caravan parks etc., hostels and refuges, religious and educational institutions and Aboriginal settlements.4 For reasons of confidentiality, there is very little regional information available in the unit record file, and so all our estimates here are for Australia as a whole rather than for Victoria or sub-regions. Similarly, sample size restrictions mean that the survey is not suitable for the analysis of small population groups such as indigenous
4 �The cared accommodation component covered residents of hospitals, nursing homes, aged care
and disability hostels and other homes such as children's homes, who had been, or were expected to be, living there for at least three months. The household component covers: private dwellings such as houses, flats, home units, townhouses tents and other structures used as private places of residence at the time of the survey, including dwellings in retirement villages which had no nursing home or hostel care on site; and non-private dwellings such as hotels, motels, boarding houses, educational and religious institutions, guest houses, construction camps, short-term caravan parks, youth camps and camping grounds, staff quarters and self care components of retirement villages which had a cared accommodation component.� (ABS, 1999c p.10).
If a group home is sign posted outside, then it will be included as a �special dwelling�. If it is not sign posted, and not listed as a special dwelling on a list drawn from telephone directories and community organisations such as churches compiled for the Census then it is likely to be included in the household component. Identifying disabled group homes is therefore not guaranteed.
SPRC
19
Australians. (For this reason, and to ensure confidentiality, the ABS does not include an indicator of Aboriginality in the SDAC). We discuss other research results for this group in more detail in Section 3.7 below.
We begin with a series of bi-variate analyses showing how disability rates vary across different personal characteristics. These are then brought together in Section 3.8 in a multi-variate logistic regression modelling the probability of having a disability.
The bivariate tabulations allow us to begin developing a sense of the characteristics common to people with a severe or profound activity restriction. These tabulations use person level weights,5 so that the figures are representative of the Australian household population. The term �disabled� is used throughout the data analysis sections to refer to people with a severe or profound activity restriction only. Those with mild or moderate restrictions or long term health conditions appear with the rest of the population and are termed �not disabled� for our purposes. �Sample size� refers to the unweighted number of observations.
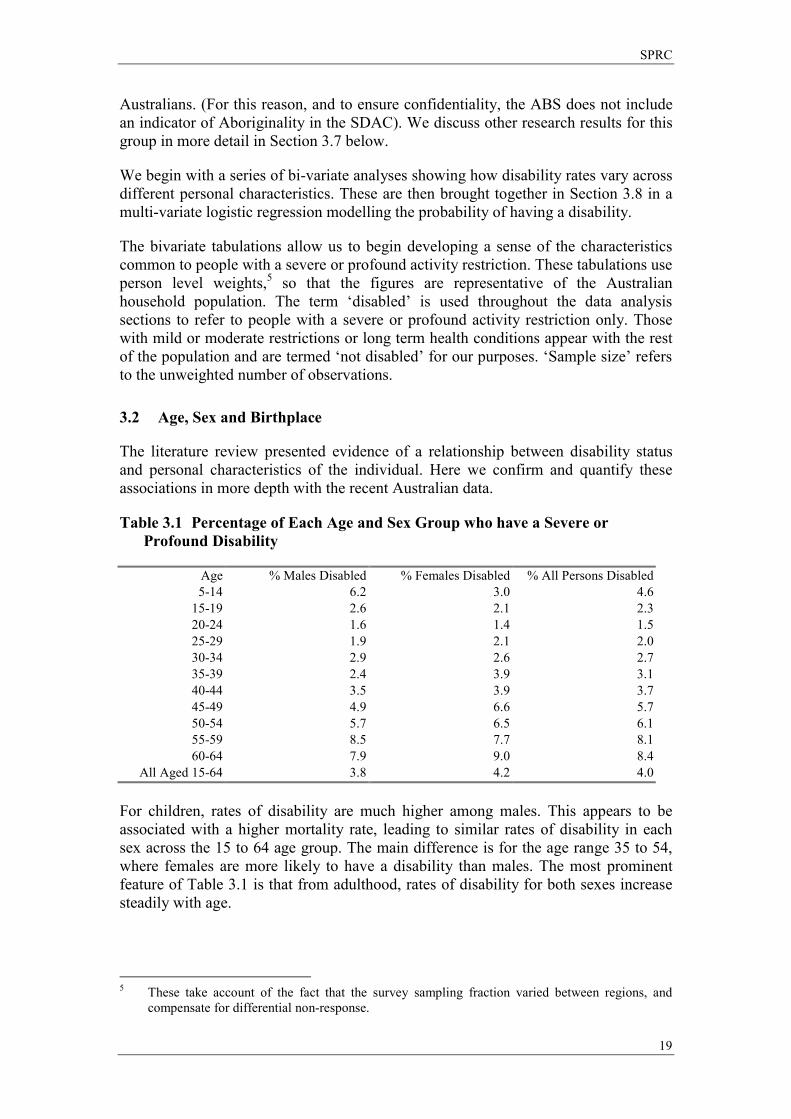
3.2 Age, Sex and Birthplace
The literature review presented evidence of a relationship between disability status and personal characteristics of the individual. Here we confirm and quantify these associations in more depth with the recent Australian data.
Table 3.1 Percentage of Each Age and Sex Group who have a Severe or Profound Disability
Age % Males Disabled % Females Disabled % All Persons Disabled 5-14 6.2 3.0 4.6
15-19 2.6 2.1 2.3 20-24 1.6 1.4 1.5 25-29 1.9 2.1 2.0 30-34 2.9 2.6 2.7 35-39 2.4 3.9 3.1 40-44 3.5 3.9 3.7 45-49 4.9 6.6 5.7 50-54 5.7 6.5 6.1 55-59 8.5 7.7 8.1 60-64 7.9 9.0 8.4
All Aged 15-64 3.8 4.2 4.0 For children, rates of disability are much higher among males. This appears to be associated with a higher mortality rate, leading to similar rates of disability in each sex across the 15 to 64 age group. The main difference is for the age range 35 to 54, where females are more likely to have a disability than males. The most prominent feature of Table 3.1 is that from adulthood, rates of disability for both sexes increase steadily with age.
5 These take account of the fact that the survey sampling fraction varied between regions, and
compensate for differential non-response.
SOCIO-ECONOMIC DISADVANTAGE AND THE PREVALENCE OF DISABILITY
20
Table 3.2 Disability Rates by Country of Birth
Country of Birth % Disabled Sample Size Australia 3.8 18274
NZ + Oceania / Antarctica / Other 2.8 709 United Kingdom + Ireland 5.6 1902
Europe 6.1 1635 Africa 4.0 450
Asia 2.0 1352 The Americas 3.1 237
Of those people living in Australia who were born in the UK or Ireland, 5.6 per cent have a disability. This compares with a much lower rate of disability among New Zealand born or Asian born Australian residents. (This could be age related if UK born residents are older on average than Asian born residents). The SDAC 98 shows that within the group of the population who have a severe or profound disability, only 71.6 per cent are Australian born. Yet DisAbility Services Branch (1999, p.40) states that �The overwhelming majority (92 per cent) of clients were born in Australia�. Thus, it appears that people born overseas are accessing the services of the Program at a rate lower than might be expected on the basis of their disability prevalence.
3.3 Education
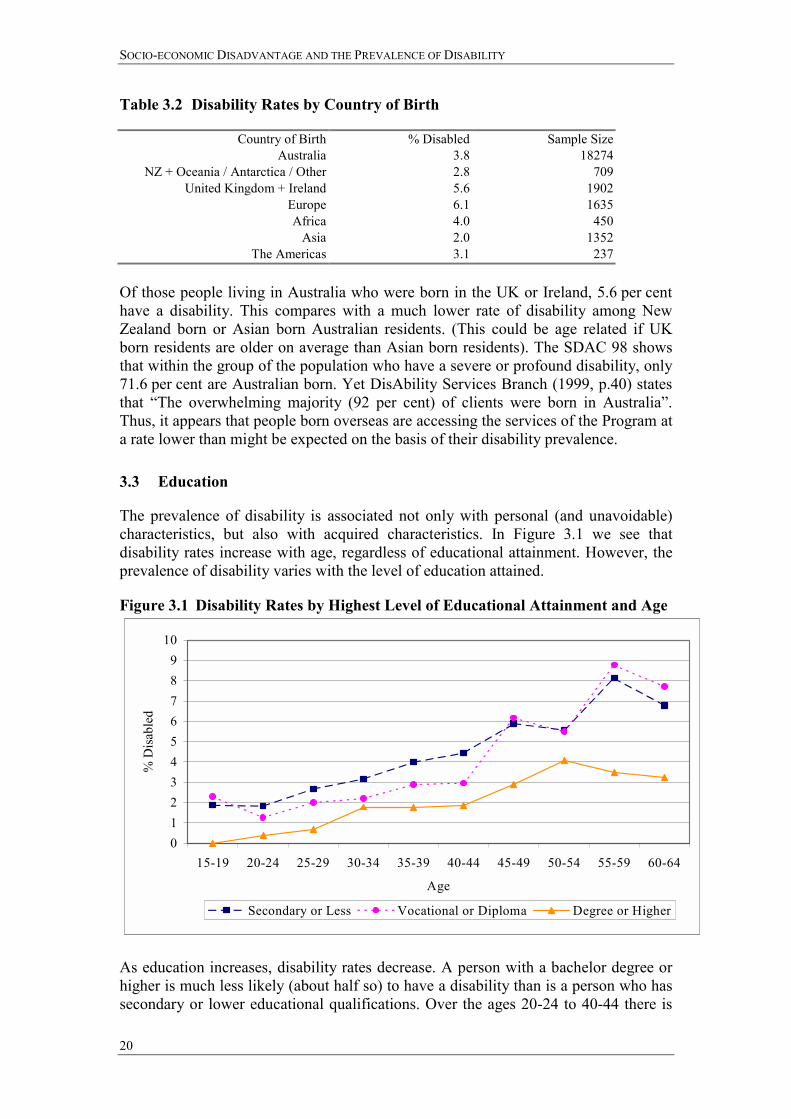
The prevalence of disability is associated not only with personal (and unavoidable) characteristics, but also with acquired characteristics. In Figure 3.1 we see that disability rates increase with age, regardless of educational attainment. However, the prevalence of disability varies with the level of education attained.
Figure 3.1 Disability Rates by Highest Level of Educational Attainment and Age
0123456789
10
15-19 20-24 25-29 30-34 35-39 40-44 45-49 50-54 55-59 60-64
Age
% D
isab
led
Secondary or Less Vocational or Diploma Degree or Higher
As education increases, disability rates decrease. A person with a bachelor degree or higher is much less likely (about half so) to have a disability than is a person who has secondary or lower educational qualifications. Over the ages 20-24 to 40-44 there is
SPRC
21
also a difference between having a vocational education as opposed to secondary or less. However, this difference between the lower two categories weakens with age.
The education differential accords with either causal direction between disability and disadvantage. One example of disability causing disadvantage, is that of a deaf student who requires a note taker. The increased cost of education makes them less likely to undertake further education. An example of causality in the reverse direction is that of relatively disadvantaged, less educated individuals are more likely to be involved in physically strenuous or risk-taking work, increasing their chance of acquiring a disability.
3.4 Labour Market Outcomes
Table 3.3 shows that people with disabilities make up 10.6 per cent of the working age population not in the labour force. Table 3.4 shows this relationship from the opposite perspective; 65.3 per cent of the disabled sample are not in the labour force. This rate is almost three times higher than that for the remainder of the population. The proportion of disabled people in full time employment exceeds the proportion that is in part time employment (though the proportion of workers who are part-time is higher for people with disabilities). The lower prevalence of unemployment for people with disabilities is unlikely to reflect successful job placement.6
Table 3.3 Disability Status by Labour Force Status
% in each Status Disabled Sample Size Employed FT 1.4 11901 Employed PT 2.6 5066 Unemployed 6.0 1501
NILF 10.6 6091 Table 3.4 Labour Force Status by Disability Status
Employed Employed Full-Time Part-Time Unemployed NILF Total %
Not Disabled 50.4 20.5 6.4 22.7 100 Disabled 17.4 13.4 3.8 65.3 100
We can also calculate the impact of disability on household labour force participation. A household with a member with a severe or profound disability will have a lower mean total number of hours worked by approximately 10 hours.7 It is possible that the presence of a disabled household member will impact not only on their personal socio-economic well-being but on that of their cohabitants as well. In Section 3.9 we examine this question further in relation to children with a disability.
6 Note that the proportion of people who are unemployed is different to the unemployment rate,
which is the number of people who are unemployed divided by the number employed plus those who are unemployed.
7 The hours worked variable is given in ranges in the SDAC 98. The midpoints of these ranges are taken and then added to other household members� hours, so that this mean is an approximation.
SOCIO-ECONOMIC DISADVANTAGE AND THE PREVALENCE OF DISABILITY
22
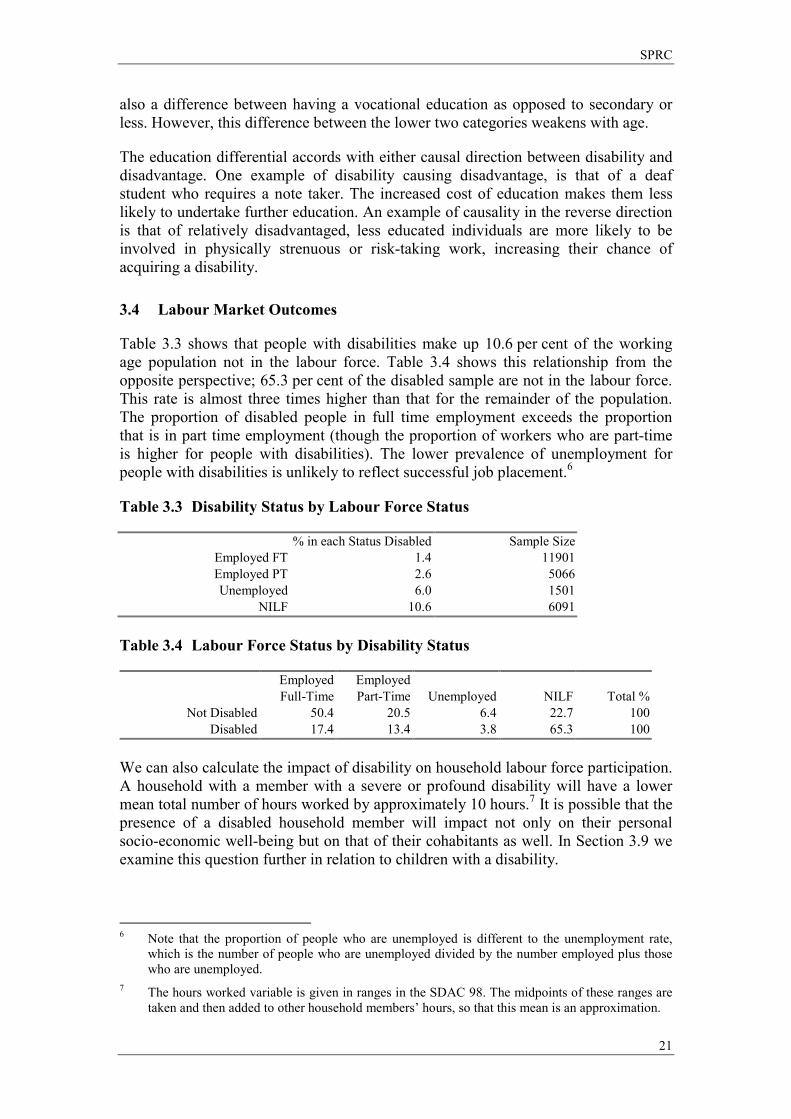
3.5 Income and Housing
The SDAC 98 confirms the expected link between low income and disability. In Figure 3.2, disability rates are given, broken down by personal income ranges. There is a clear downward trend. As income increases, the prevalence of disability decreases. The disability rate faced by people earning less than $200 per week is roughly seven per cent. This compares with only one to 1.5 per cent for those with personal incomes of $600 or more per week.
Figure 3.2 Disability Rates by Personal Income
0
1
2
3
4
5
6
7
8
<200 200-399 400-599 600-799 800-999 1000+
Personal Incom e ($ per week)
% D
isab
led
Figure 3.3 Disability Rates, by Household Income Ranges
0
1
2
3
4
5
6
7
8
9
10
<200 200-399 400-599 600-799 800-999 1000+
Household Income ($ per week)
% D
isab
led
The relationship between low income and disability persists with household income. There is a downward trend between household income and disability prevalence,
SPRC
23
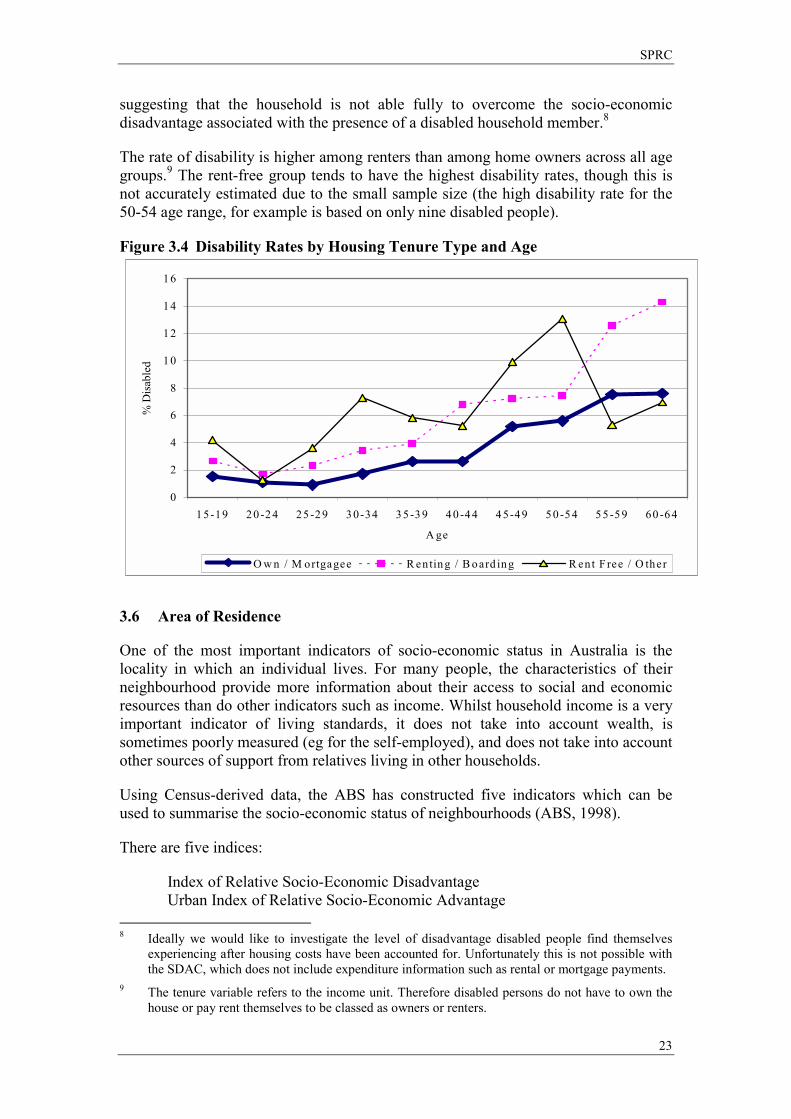
suggesting that the household is not able fully to overcome the socio-economic disadvantage associated with the presence of a disabled household member.8
The rate of disability is higher among renters than among home owners across all age groups.9 The rent-free group tends to have the highest disability rates, though this is not accurately estimated due to the small sample size (the high disability rate for the 50-54 age range, for example is based on only nine disabled people).
Figure 3.4 Disability Rates by Housing Tenure Type and Age
0
2
4
6
8
10
12
14
16
15-19 20-24 25-29 30-34 35-39 40-44 45-49 50-54 55-59 60-64
A ge
% D
isab
led
O w n / M ortgagee R enting / B oard ing R ent F ree / O ther
3.6 Area of Residence
One of the most important indicators of socio-economic status in Australia is the locality in which an individual lives. For many people, the characteristics of their neighbourhood provide more information about their access to social and economic resources than do other indicators such as income. Whilst household income is a very important indicator of living standards, it does not take into account wealth, is sometimes poorly measured (eg for the self-employed), and does not take into account other sources of support from relatives living in other households.
Using Census-derived data, the ABS has constructed five indicators which can be used to summarise the socio-economic status of neighbourhoods (ABS, 1998).
There are five indices:
Index of Relative Socio-Economic Disadvantage Urban Index of Relative Socio-Economic Advantage
8 Ideally we would like to investigate the level of disadvantage disabled people find themselves
experiencing after housing costs have been accounted for. Unfortunately this is not possible with the SDAC, which does not include expenditure information such as rental or mortgage payments.
9 The tenure variable refers to the income unit. Therefore disabled persons do not have to own the house or pay rent themselves to be classed as owners or renters.
SOCIO-ECONOMIC DISADVANTAGE AND THE PREVALENCE OF DISABILITY
24
Rural Index of Relative Socio-Economic Advantage Index of Economic Resources Index of Education and Occupation.
The indices are calculated for each Census collectors� district (CD) in Australia (usually comprising about 200 dwellings). They are derived from counts of the number of people and households in the CD with particular characteristics. They are thus an indicator of the characteristics of the locality rather than reflecting the characteristics of any particular household. The numerical value of the indices has no direct interpretation.10 It is the relative values that need to be considered � with higher values in all cases indicating a more favourable outcome (ie less disadvantage).
The Index of Relative Socio-Economic Disadvantage (IRSED) is derived from attributes such as low income, low educational attainment, high unemployment and jobs in relatively unskilled occupations. The Urban Index of Socio-Economic Advantage takes into account the percentage of households with high incomes, the fraction of the workforce in different occupations and home and car ownership. The Rural Index is similar, but with less weight given to occupation. The Index of Economic Resources focuses on housing and prevalence of high incomes, whilst the final index focuses on the education and occupation characteristics of the region.
In the SDAC 98, each household is assigned a decile group of the IRSED that has been calculated for the CD in which they reside. The other indices are not available, but this index is probably the most appropriate for our purposes. Whilst it is clearly an imperfect indicator of the full extent of socio-economic disadvantage in a region, it does encompass a wide range of factors that one might expect to be correlated with disadvantage. In ABS validation testing it also correlates strongly with subjective evaluations of the status of different regions (ABS, 1998). More specifically, the IRSED is based upon the following regional characteristics (See ABS, 1998).
Persons aged 15 and over with no qualifications (%) Families with income less than 15,600 (%) Families with offspring having parental income less than $15,600 (%) Females (in labour force) unemployed (%) Males (in labour force) unemployed (%) Employed females classified as �Labourer & Related Workers� (%) Employed males classified as �Labourer & Related Workers� (%) Employed males classified as �Intermediate Production and Transport Workers� (%) Persons aged 15 and over who left school at or under 15 years (%) One parent families with dependent offspring only (%) Households renting (government authority) (%) Persons aged 15 and over separated or divorced (%) Dwellings with no motor cars at dwelling (%) Employed females classified as �Intermediate Production and Transport Workers� Employed females classified as �Elementary Clerical, Sales and Service� Employed males classified as �Tradespersons� (%) Persons 15 and over who did not go to school (%) Aboriginal or Torres Strait Islanders (%)
10 Scores are arbitrarily scaled to have a mean of 1000 and a standard deviation of 100 across all of
Australia.
SPRC
25
Occupied private dwellings with two or more families (%) Lacking fluency in English (%).
It is important to note that, even though many of the characteristics that make up the index may not be directly relevant to people with disabilities, the index itself may still be a relevant indicator. For example, disability is likely to lead to non-participation in the labour market rather than unemployment (see Section 3.4). However, both of these factors reduce income and may force people to move to areas of lower housing costs. Indeed the cost of living in a given region (defined broadly to include housing and transport expenditures and availability of services) is probably the key factor underlying the division of areas into high and low status.
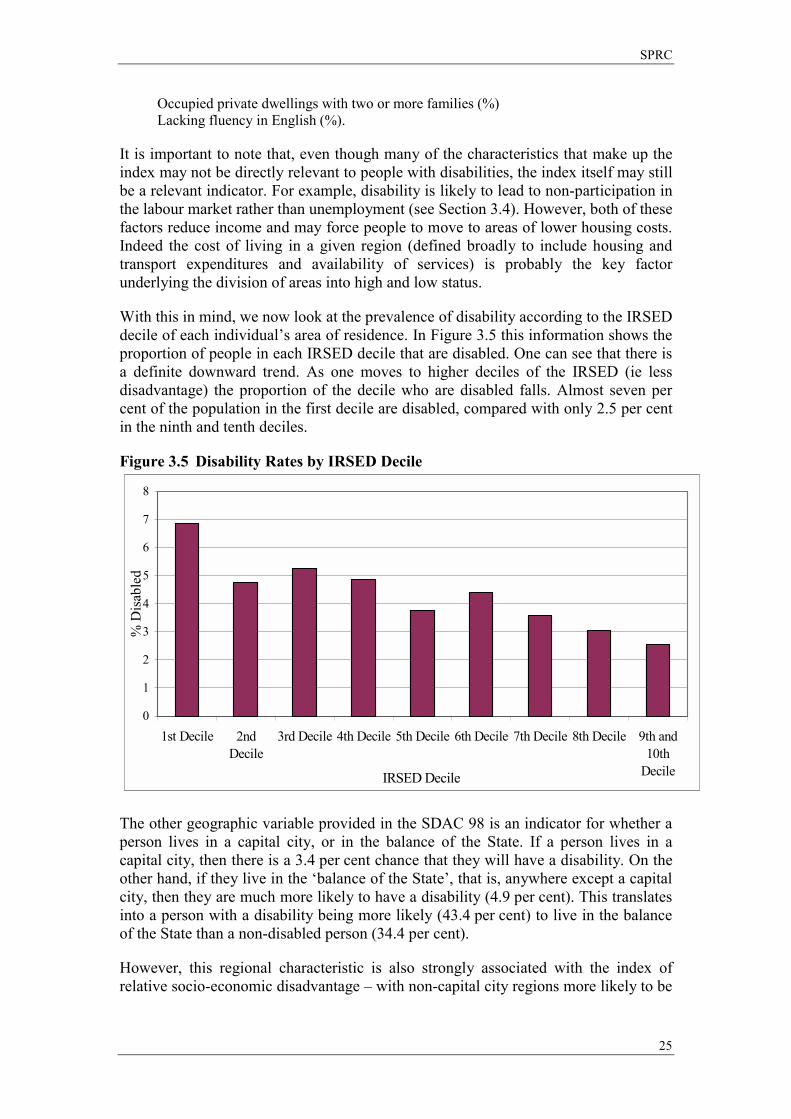
With this in mind, we now look at the prevalence of disability according to the IRSED decile of each individual�s area of residence. In Figure 3.5 this information shows the proportion of people in each IRSED decile that are disabled. One can see that there is a definite downward trend. As one moves to higher deciles of the IRSED (ie less disadvantage) the proportion of the decile who are disabled falls. Almost seven per cent of the population in the first decile are disabled, compared with only 2.5 per cent in the ninth and tenth deciles.
Figure 3.5 Disability Rates by IRSED Decile
0
1
2
3
4
5
6
7
8
1st Decile 2ndDecile
3rd Decile 4th Decile 5th Decile 6th Decile 7th Decile 8th Decile 9th and10th
DecileIRSED Decile
% D
isab
led
The other geographic variable provided in the SDAC 98 is an indicator for whether a person lives in a capital city, or in the balance of the State. If a person lives in a capital city, then there is a 3.4 per cent chance that they will have a disability. On the other hand, if they live in the �balance of the State�, that is, anywhere except a capital city, then they are much more likely to have a disability (4.9 per cent). This translates into a person with a disability being more likely (43.4 per cent) to live in the balance of the State than a non-disabled person (34.4 per cent).
However, this regional characteristic is also strongly associated with the index of relative socio-economic disadvantage � with non-capital city regions more likely to be
SOCIO-ECONOMIC DISADVANTAGE AND THE PREVALENCE OF DISABILITY
26
disadvantaged. We explore the interaction between these two characteristics further in Section 3.8 below.
3.7 Aboriginality
As we stated earlier it is not possible to use the SDAC to examine the prevalence of disability among Australian Aboriginals, because of both sample size and confidentiality. However there is extensive evidence from other research that indigenous Australians suffer severe socio-economic disadvantage and have a much higher prevalence of disability.
According to Gething (1995), indigenous Australians have a median income two-thirds of that of the general population. Adult mortality rates compare with those in the poorest third world countries, at 53 for men and 58 for women compared with 74 and 80 respectively for the general population. Diseases of the circulatory system, injury, poisoning and cancer are almost three times more likely to be a cause of death, while deaths from respiratory disease are seven times higher.
In the national evaluation of CSDA services indigenous recipients were more likely to report physical disability, developmental delay, acquired brain impairment, specific learning disabilities and attention deficit disorder, and hearing impairments. They were less likely to report vision impairment and intellectual disability than non-indigenous recipients (AIHW, 1999).
It is possible that disability prevalence is underestimated in the Aboriginal communities. Gething (1995) observes from her consultations with indigenous communities in New South Wales that having a disability is often not relevant as an identity in the Aboriginal context, where issues to do with being Aboriginal are more important. Only highly visible conditions such as severe mobility impairment, strokes, spinal cord injury and amputation are regarded as �disabilities�. Hidden disabilities often have little meaning to the individual or community.
A key study on the relative prevalence of disability among Aboriginal Australians comes from a 1993 census of Aboriginal people usually resident in the Taree area. Thompson and Snow (1994) found that of the 907 people resident in the area, 25 per cent were identified as having one or more disabilities, 13.7 per cent were identified as being handicapped by their disability and 5.1 per cent as being severely handicapped. After adjustment for differences in the age structure of Aboriginal and non-Aboriginal populations, the Aboriginal population was more likely to report a disability (2.5 times higher for males and 2.9 times for females), more likely to report handicap (1.7 times higher for males and 1.8 times for females) and more likely to report severe disability (2.4 times higher for males and 2.3 times for females). For males the most frequent primary disabling condition was �slow at learning� (16.2 per cent). The most frequent condition for females was asthma (15.5 per cent). The authors claim that the Aboriginal population in Taree is similar to others in South East and South West Australia where similar levels of disability and handicap would be found.
SPRC
27
3.8 Multivariate Analysis
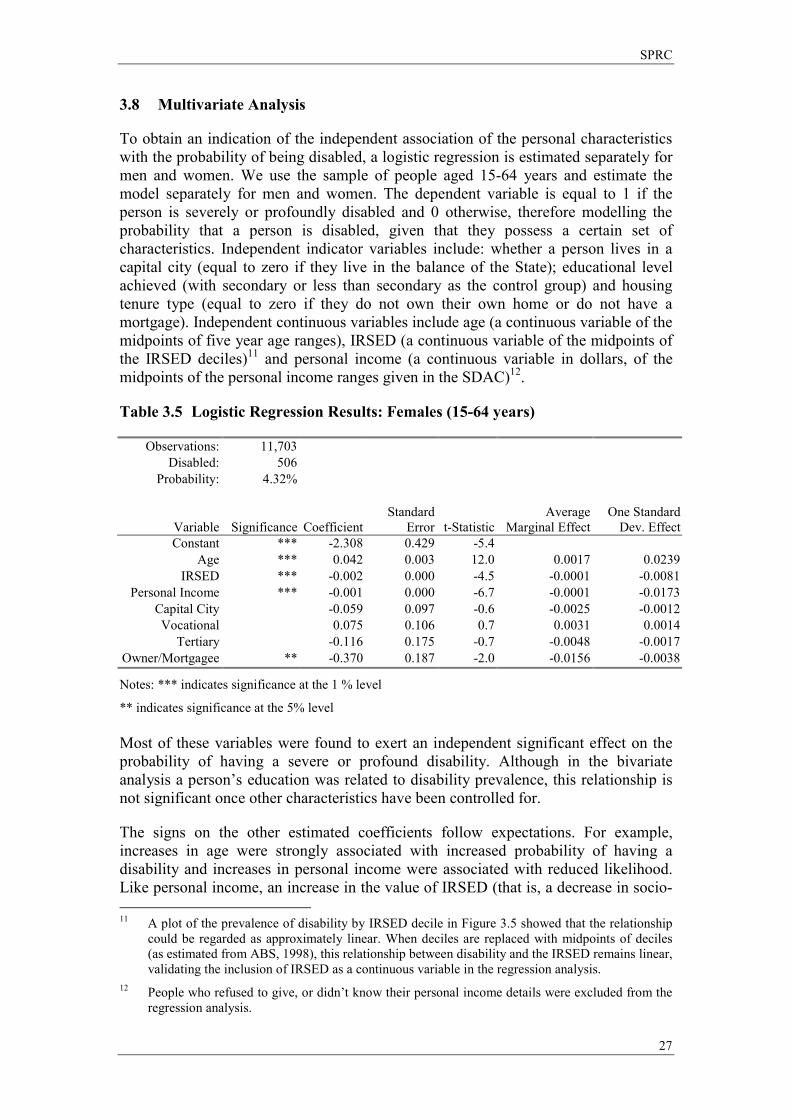
To obtain an indication of the independent association of the personal characteristics with the probability of being disabled, a logistic regression is estimated separately for men and women. We use the sample of people aged 15-64 years and estimate the model separately for men and women. The dependent variable is equal to 1 if the person is severely or profoundly disabled and 0 otherwise, therefore modelling the probability that a person is disabled, given that they possess a certain set of characteristics. Independent indicator variables include: whether a person lives in a capital city (equal to zero if they live in the balance of the State); educational level achieved (with secondary or less than secondary as the control group) and housing tenure type (equal to zero if they do not own their own home or do not have a mortgage). Independent continuous variables include age (a continuous variable of the midpoints of five year age ranges), IRSED (a continuous variable of the midpoints of the IRSED deciles)11 and personal income (a continuous variable in dollars, of the midpoints of the personal income ranges given in the SDAC)12.
Table 3.5 Logistic Regression Results: Females (15-64 years)
Observations: 11,703 Disabled: 506
Probability: 4.32%
Variable
Significance Coefficient Standard
Error t-StatisticAverage
Marginal EffectOne Standard
Dev. EffectConstant *** -2.308 0.429 -5.4
Age *** 0.042 0.003 12.0 0.0017 0.0239 IRSED *** -0.002 0.000 -4.5 -0.0001 -0.0081
Personal Income *** -0.001 0.000 -6.7 -0.0001 -0.0173 Capital City -0.059 0.097 -0.6 -0.0025 -0.0012 Vocational 0.075 0.106 0.7 0.0031 0.0014
Tertiary -0.116 0.175 -0.7 -0.0048 -0.0017 Owner/Mortgagee ** -0.370 0.187 -2.0 -0.0156 -0.0038
Notes: *** indicates significance at the 1 % level
** indicates significance at the 5% level Most of these variables were found to exert an independent significant effect on the probability of having a severe or profound disability. Although in the bivariate analysis a person�s education was related to disability prevalence, this relationship is not significant once other characteristics have been controlled for.
The signs on the other estimated coefficients follow expectations. For example, increases in age were strongly associated with increased probability of having a disability and increases in personal income were associated with reduced likelihood. Like personal income, an increase in the value of IRSED (that is, a decrease in socio- 11 A plot of the prevalence of disability by IRSED decile in Figure 3.5 showed that the relationship
could be regarded as approximately linear. When deciles are replaced with midpoints of deciles (as estimated from ABS, 1998), this relationship between disability and the IRSED remains linear, validating the inclusion of IRSED as a continuous variable in the regression analysis.
12 People who refused to give, or didn�t know their personal income details were excluded from the regression analysis.
SOCIO-ECONOMIC DISADVANTAGE AND THE PREVALENCE OF DISABILITY
28
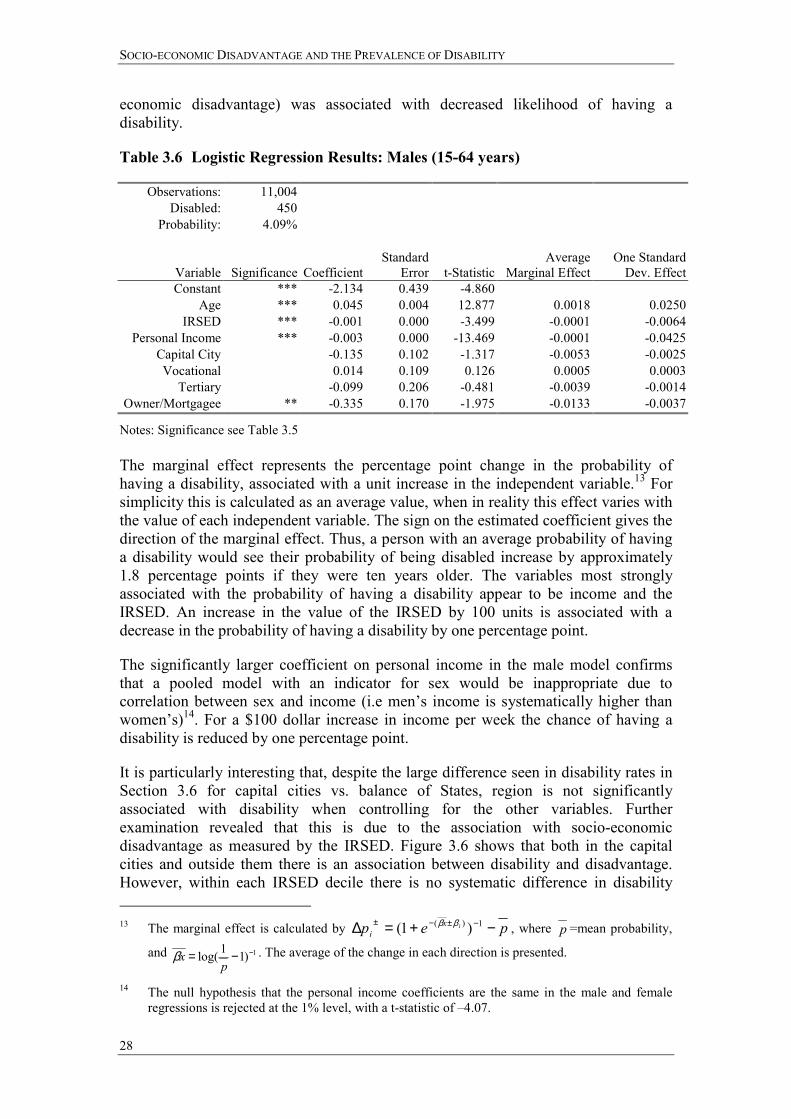
economic disadvantage) was associated with decreased likelihood of having a disability.
Table 3.6 Logistic Regression Results: Males (15-64 years)
Observations: 11,004 Disabled: 450
Probability: 4.09%
Variable
Significance Coefficient Standard
Error
t-Statistic Average
Marginal EffectOne Standard
Dev. EffectConstant *** -2.134 0.439 -4.860
Age *** 0.045 0.004 12.877 0.0018 0.0250IRSED *** -0.001 0.000 -3.499 -0.0001 -0.0064
Personal Income *** -0.003 0.000 -13.469 -0.0001 -0.0425Capital City -0.135 0.102 -1.317 -0.0053 -0.0025Vocational 0.014 0.109 0.126 0.0005 0.0003
Tertiary -0.099 0.206 -0.481 -0.0039 -0.0014Owner/Mortgagee ** -0.335 0.170 -1.975 -0.0133 -0.0037
Notes: Significance see Table 3.5 The marginal effect represents the percentage point change in the probability of having a disability, associated with a unit increase in the independent variable.13 For simplicity this is calculated as an average value, when in reality this effect varies with the value of each independent variable. The sign on the estimated coefficient gives the direction of the marginal effect. Thus, a person with an average probability of having a disability would see their probability of being disabled increase by approximately 1.8 percentage points if they were ten years older. The variables most strongly associated with the probability of having a disability appear to be income and the IRSED. An increase in the value of the IRSED by 100 units is associated with a decrease in the probability of having a disability by one percentage point.
The significantly larger coefficient on personal income in the male model confirms that a pooled model with an indicator for sex would be inappropriate due to correlation between sex and income (i.e men�s income is systematically higher than women�s)14. For a $100 dollar increase in income per week the chance of having a disability is reduced by one percentage point.
It is particularly interesting that, despite the large difference seen in disability rates in Section 3.6 for capital cities vs. balance of States, region is not significantly associated with disability when controlling for the other variables. Further examination revealed that this is due to the association with socio-economic disadvantage as measured by the IRSED. Figure 3.6 shows that both in the capital cities and outside them there is an association between disability and disadvantage. However, within each IRSED decile there is no systematic difference in disability 13 The marginal effect is calculated by pep ix
i −+=∆ −±−± 1)( )1( ββ , where p =mean probability,
and 1)11log( −−=p
xβ . The average of the change in each direction is presented.
14 The null hypothesis that the personal income coefficients are the same in the male and female regressions is rejected at the 1% level, with a t-statistic of �4.07.
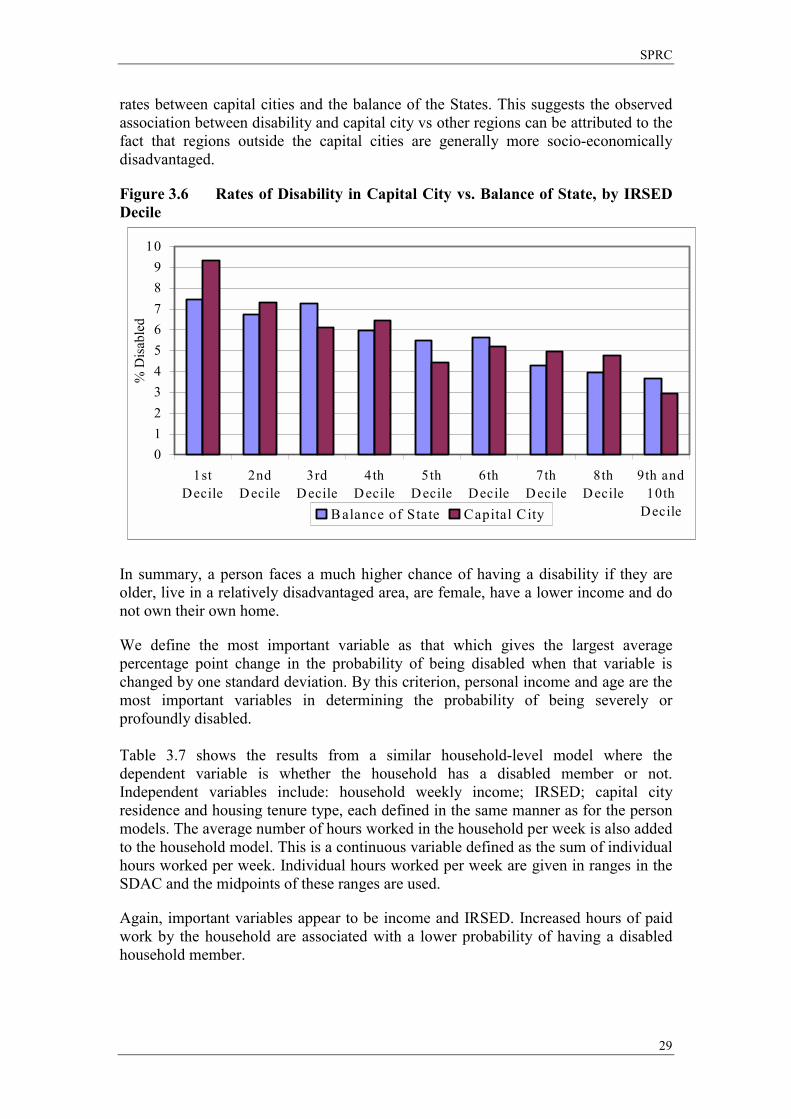
SPRC
29
rates between capital cities and the balance of the States. This suggests the observed association between disability and capital city vs other regions can be attributed to the fact that regions outside the capital cities are generally more socio-economically disadvantaged.
Figure 3.6 Rates of Disability in Capital City vs. Balance of State, by IRSED Decile
0123456789
10
1stDecile
2ndD ecile
3rdD ecile
4thD ecile
5thD ecile
6thDecile
7thD ecile
8thD ecile
9th and10th
Decile
% D
isab
led
B alance of State Capital City
In summary, a person faces a much higher chance of having a disability if they are older, live in a relatively disadvantaged area, are female, have a lower income and do not own their own home.
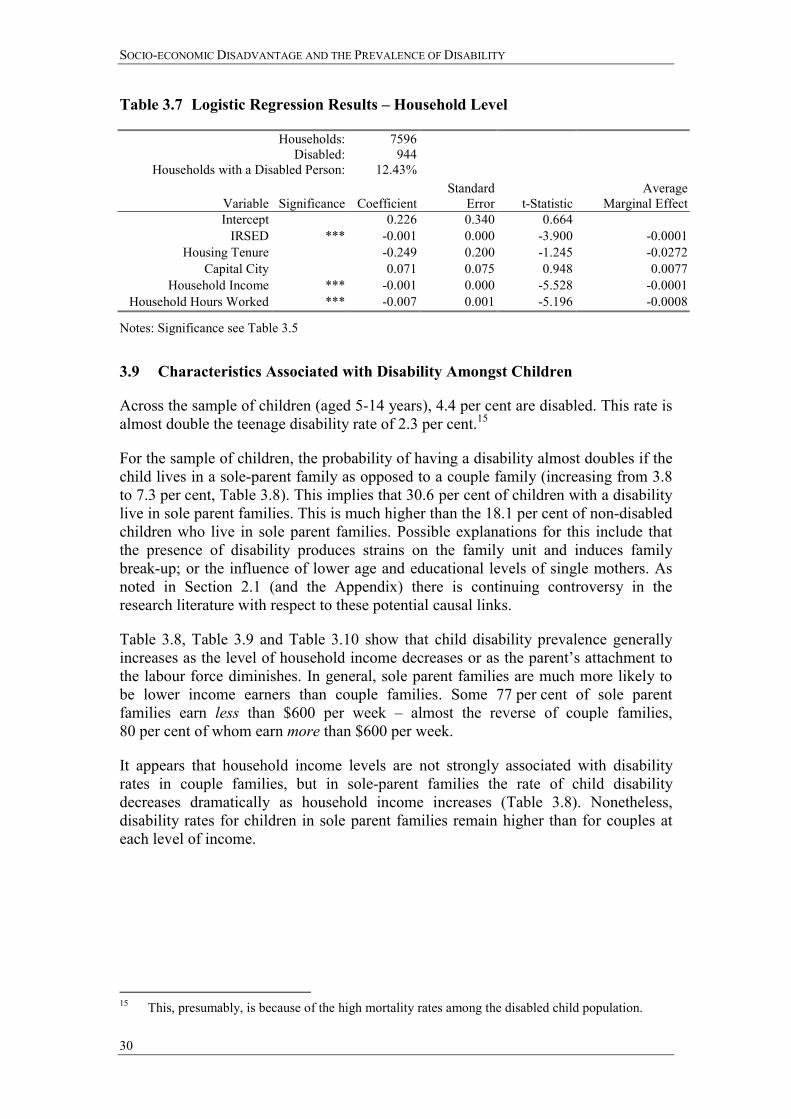
We define the most important variable as that which gives the largest average percentage point change in the probability of being disabled when that variable is changed by one standard deviation. By this criterion, personal income and age are the most important variables in determining the probability of being severely or profoundly disabled. Table 3.7 shows the results from a similar household-level model where the dependent variable is whether the household has a disabled member or not. Independent variables include: household weekly income; IRSED; capital city residence and housing tenure type, each defined in the same manner as for the person models. The average number of hours worked in the household per week is also added to the household model. This is a continuous variable defined as the sum of individual hours worked per week. Individual hours worked per week are given in ranges in the SDAC and the midpoints of these ranges are used.
Again, important variables appear to be income and IRSED. Increased hours of paid work by the household are associated with a lower probability of having a disabled household member.
SOCIO-ECONOMIC DISADVANTAGE AND THE PREVALENCE OF DISABILITY
30
Table 3.7 Logistic Regression Results � Household Level
Households:Disabled:
Households with a Disabled Person:
7596 944
12.43%
Variable Significance
Coefficient Standard
Error
t-Statistic Average
Marginal EffectIntercept 0.226 0.340 0.664
IRSED *** -0.001 0.000 -3.900 -0.0001Housing Tenure -0.249 0.200 -1.245 -0.0272
Capital City 0.071 0.075 0.948 0.0077Household Income *** -0.001 0.000 -5.528 -0.0001
Household Hours Worked *** -0.007 0.001 -5.196 -0.0008
Notes: Significance see Table 3.5
3.9 Characteristics Associated with Disability Amongst Children
Across the sample of children (aged 5-14 years), 4.4 per cent are disabled. This rate is almost double the teenage disability rate of 2.3 per cent.15
For the sample of children, the probability of having a disability almost doubles if the child lives in a sole-parent family as opposed to a couple family (increasing from 3.8 to 7.3 per cent, Table 3.8). This implies that 30.6 per cent of children with a disability live in sole parent families. This is much higher than the 18.1 per cent of non-disabled children who live in sole parent families. Possible explanations for this include that the presence of disability produces strains on the family unit and induces family break-up; or the influence of lower age and educational levels of single mothers. As noted in Section 2.1 (and the Appendix) there is continuing controversy in the research literature with respect to these potential causal links.
Table 3.8, Table 3.9 and Table 3.10 show that child disability prevalence generally increases as the level of household income decreases or as the parent�s attachment to the labour force diminishes. In general, sole parent families are much more likely to be lower income earners than couple families. Some 77 per cent of sole parent families earn less than $600 per week � almost the reverse of couple families, 80 per cent of whom earn more than $600 per week.
It appears that household income levels are not strongly associated with disability rates in couple families, but in sole-parent families the rate of child disability decreases dramatically as household income increases (Table 3.8). Nonetheless, disability rates for children in sole parent families remain higher than for couples at each level of income.
15 This, presumably, is because of the high mortality rates among the disabled child population.
SPRC
31
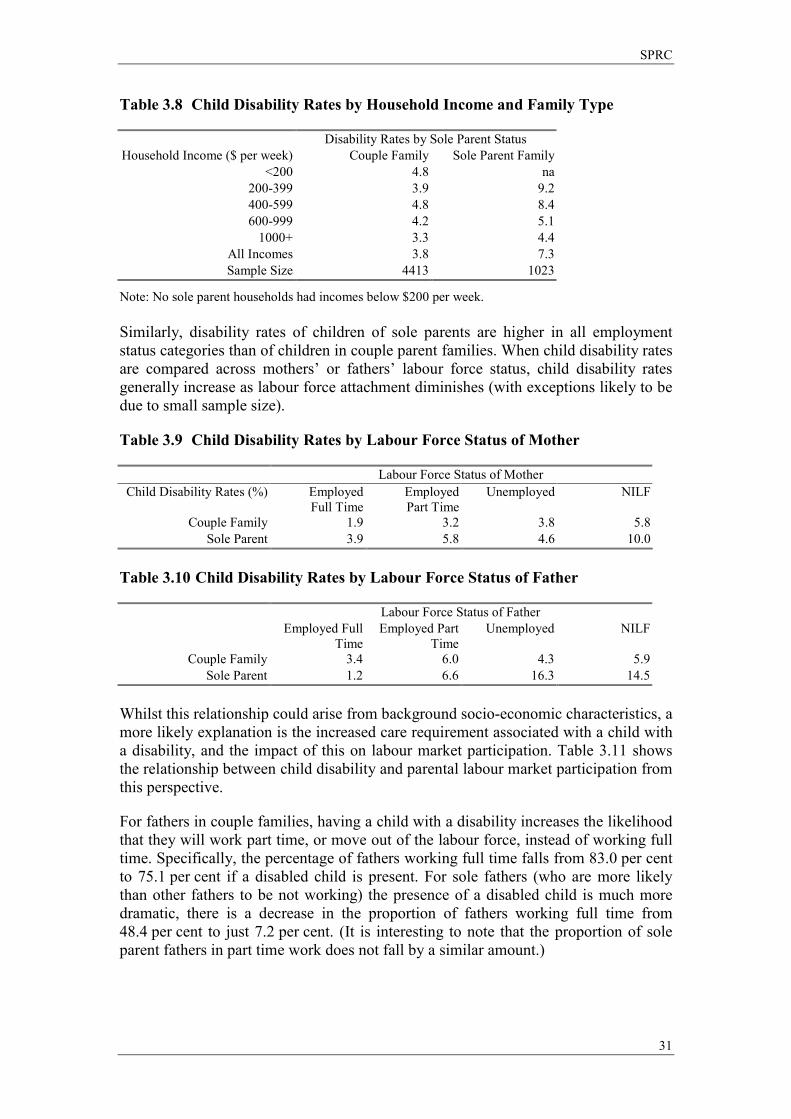
Table 3.8 Child Disability Rates by Household Income and Family Type
Disability Rates by Sole Parent Status Household Income ($ per week) Couple Family Sole Parent Family
<200 4.8 na 200-399 3.9 9.2 400-599 4.8 8.4 600-999 4.2 5.1
1000+ 3.3 4.4 All Incomes 3.8 7.3 Sample Size 4413 1023
Note: No sole parent households had incomes below $200 per week. Similarly, disability rates of children of sole parents are higher in all employment status categories than of children in couple parent families. When child disability rates are compared across mothers� or fathers� labour force status, child disability rates generally increase as labour force attachment diminishes (with exceptions likely to be due to small sample size).
Table 3.9 Child Disability Rates by Labour Force Status of Mother
Labour Force Status of Mother Child Disability Rates (%) Employed
Full Time Employed Part Time
Unemployed NILF
Couple Family 1.9 3.2 3.8 5.8 Sole Parent 3.9 5.8 4.6 10.0
Table 3.10 Child Disability Rates by Labour Force Status of Father
Labour Force Status of Father Employed Full
TimeEmployed Part
TimeUnemployed NILF
Couple Family 3.4 6.0 4.3 5.9 Sole Parent 1.2 6.6 16.3 14.5
Whilst this relationship could arise from background socio-economic characteristics, a more likely explanation is the increased care requirement associated with a child with a disability, and the impact of this on labour market participation. Table 3.11 shows the relationship between child disability and parental labour market participation from this perspective.
For fathers in couple families, having a child with a disability increases the likelihood that they will work part time, or move out of the labour force, instead of working full time. Specifically, the percentage of fathers working full time falls from 83.0 per cent to 75.1 per cent if a disabled child is present. For sole fathers (who are more likely than other fathers to be not working) the presence of a disabled child is much more dramatic, there is a decrease in the proportion of fathers working full time from 48.4 per cent to just 7.2 per cent. (It is interesting to note that the proportion of sole parent fathers in part time work does not fall by a similar amount.)
SOCIO-ECONOMIC DISADVANTAGE AND THE PREVALENCE OF DISABILITY
32
The comparison between couple and sole parent mothers is not as stark. Nonetheless, regardless of family type, the presence of a disabled child again impacts strongly on the likelihood that a mother is in the labour force.
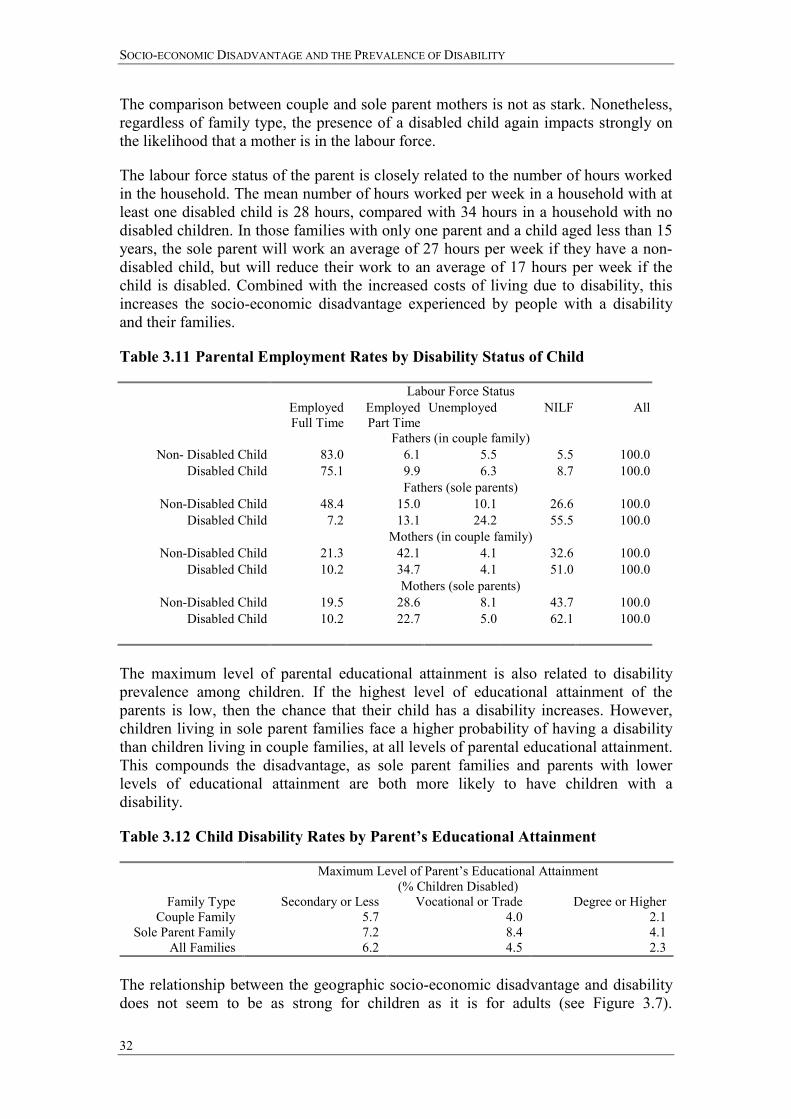
The labour force status of the parent is closely related to the number of hours worked in the household. The mean number of hours worked per week in a household with at least one disabled child is 28 hours, compared with 34 hours in a household with no disabled children. In those families with only one parent and a child aged less than 15 years, the sole parent will work an average of 27 hours per week if they have a non-disabled child, but will reduce their work to an average of 17 hours per week if the child is disabled. Combined with the increased costs of living due to disability, this increases the socio-economic disadvantage experienced by people with a disability and their families.
Table 3.11 Parental Employment Rates by Disability Status of Child
Labour Force Status Employed
Full Time Employed Part Time
Unemployed NILF All
Fathers (in couple family) Non- Disabled Child 83.0 6.1 5.5 5.5 100.0
Disabled Child 75.1 9.9 6.3 8.7 100.0 Fathers (sole parents)
Non-Disabled Child 48.4 15.0 10.1 26.6 100.0 Disabled Child 7.2 13.1 24.2 55.5 100.0 Mothers (in couple family)
Non-Disabled Child 21.3 42.1 4.1 32.6 100.0 Disabled Child 10.2 34.7 4.1 51.0 100.0 Mothers (sole parents)
Non-Disabled Child 19.5 28.6 8.1 43.7 100.0 Disabled Child 10.2 22.7 5.0 62.1 100.0
The maximum level of parental educational attainment is also related to disability prevalence among children. If the highest level of educational attainment of the parents is low, then the chance that their child has a disability increases. However, children living in sole parent families face a higher probability of having a disability than children living in couple families, at all levels of parental educational attainment. This compounds the disadvantage, as sole parent families and parents with lower levels of educational attainment are both more likely to have children with a disability.
Table 3.12 Child Disability Rates by Parent�s Educational Attainment
Maximum Level of Parent�s Educational Attainment (% Children Disabled)
Family Type Secondary or Less Vocational or Trade Degree or Higher Couple Family 5.7 4.0 2.1
Sole Parent Family 7.2 8.4 4.1 All Families 6.2 4.5 2.3
The relationship between the geographic socio-economic disadvantage and disability does not seem to be as strong for children as it is for adults (see Figure 3.7).
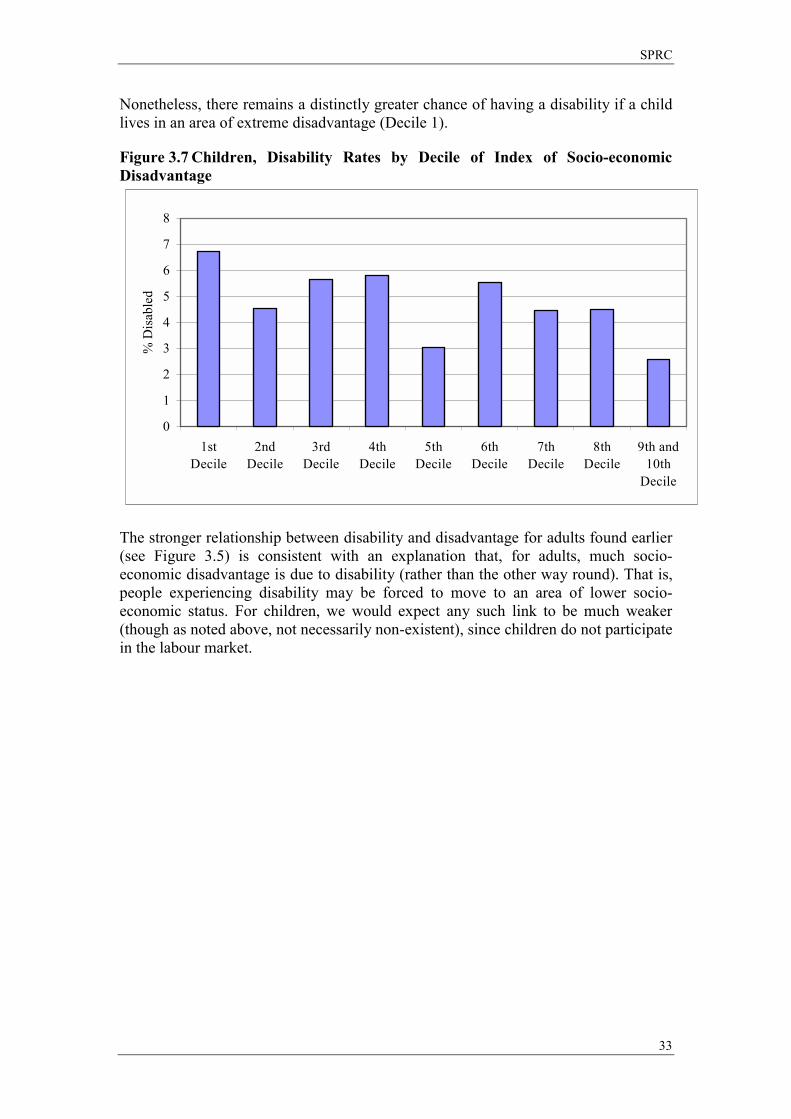
SPRC
33
Nonetheless, there remains a distinctly greater chance of having a disability if a child lives in an area of extreme disadvantage (Decile 1).
Figure 3.7 Children, Disability Rates by Decile of Index of Socio-economic Disadvantage
0
1
2
3
4
5
6
7
8
1stDecile
2ndDecile
3rdDecile
4thDecile
5thDecile
6thDecile
7thDecile
8thDecile
9th and10th
Decile
% D
isab
led
The stronger relationship between disability and disadvantage for adults found earlier (see Figure 3.5) is consistent with an explanation that, for adults, much socio-economic disadvantage is due to disability (rather than the other way round). That is, people experiencing disability may be forced to move to an area of lower socio-economic status. For children, we would expect any such link to be much weaker (though as noted above, not necessarily non-existent), since children do not participate in the labour market.
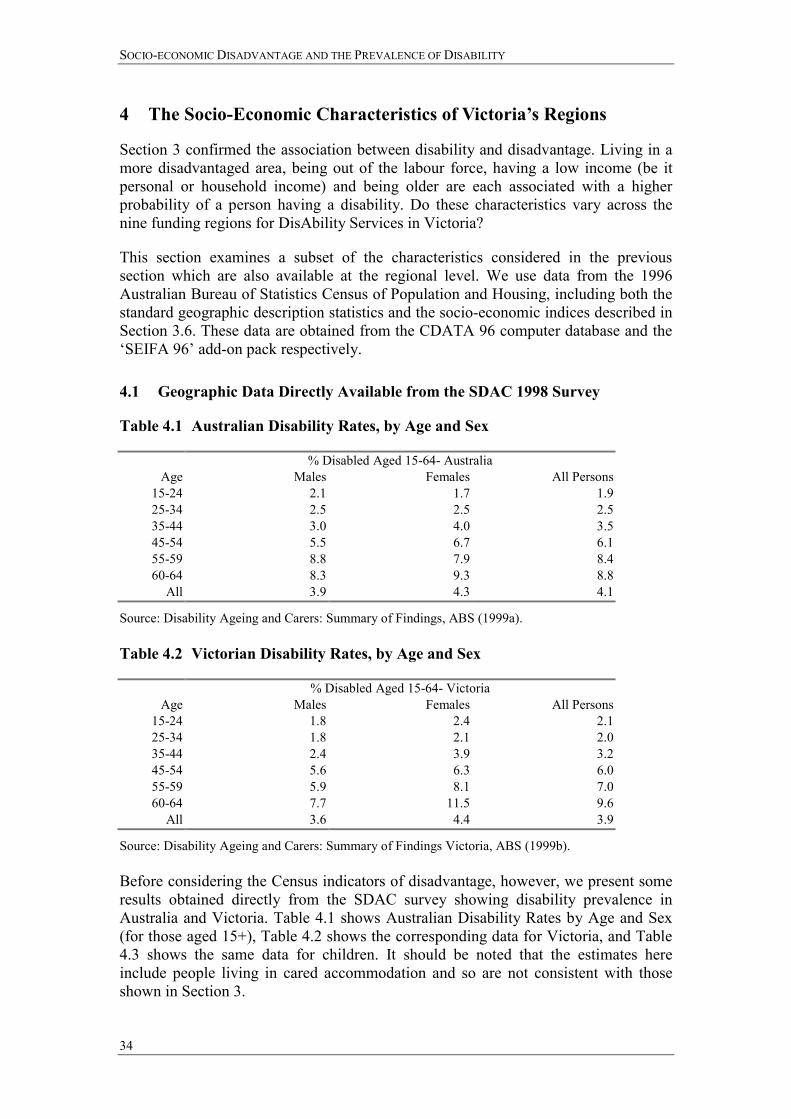
SOCIO-ECONOMIC DISADVANTAGE AND THE PREVALENCE OF DISABILITY
34
4 The Socio-Economic Characteristics of Victoria�s Regions
Section 3 confirmed the association between disability and disadvantage. Living in a more disadvantaged area, being out of the labour force, having a low income (be it personal or household income) and being older are each associated with a higher probability of a person having a disability. Do these characteristics vary across the nine funding regions for DisAbility Services in Victoria?
This section examines a subset of the characteristics considered in the previous section which are also available at the regional level. We use data from the 1996 Australian Bureau of Statistics Census of Population and Housing, including both the standard geographic description statistics and the socio-economic indices described in Section 3.6. These data are obtained from the CDATA 96 computer database and the �SEIFA 96� add-on pack respectively.
4.1 Geographic Data Directly Available from the SDAC 1998 Survey
Table 4.1 Australian Disability Rates, by Age and Sex
% Disabled Aged 15-64- Australia Age Males Females All Persons
15-24 2.1 1.7 1.925-34 2.5 2.5 2.535-44 3.0 4.0 3.545-54 5.5 6.7 6.155-59 8.8 7.9 8.460-64 8.3 9.3 8.8
All 3.9 4.3 4.1
Source: Disability Ageing and Carers: Summary of Findings, ABS (1999a). Table 4.2 Victorian Disability Rates, by Age and Sex
% Disabled Aged 15-64- Victoria Age Males Females All Persons
15-24 1.8 2.4 2.125-34 1.8 2.1 2.035-44 2.4 3.9 3.245-54 5.6 6.3 6.055-59 5.9 8.1 7.060-64 7.7 11.5 9.6
All 3.6 4.4 3.9
Source: Disability Ageing and Carers: Summary of Findings Victoria, ABS (1999b). Before considering the Census indicators of disadvantage, however, we present some results obtained directly from the SDAC survey showing disability prevalence in Australia and Victoria. Table 4.1 shows Australian Disability Rates by Age and Sex (for those aged 15+), Table 4.2 shows the corresponding data for Victoria, and Table 4.3 shows the same data for children. It should be noted that the estimates here include people living in cared accommodation and so are not consistent with those shown in Section 3.
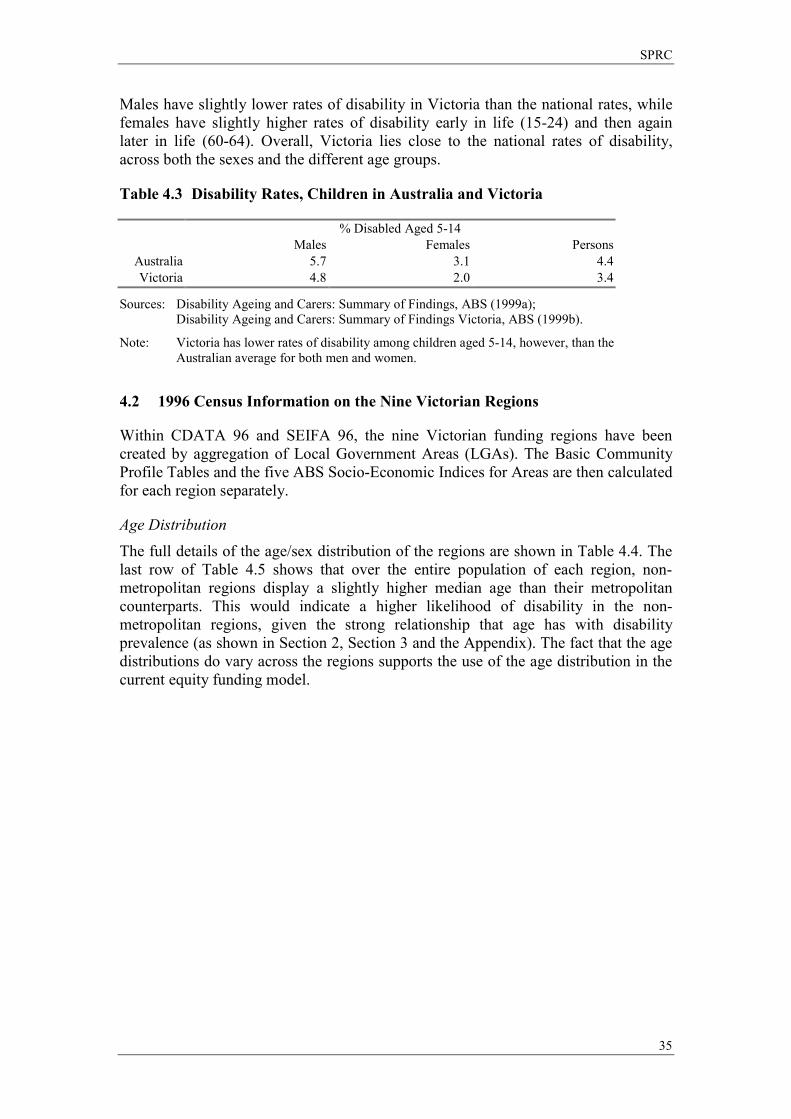
SPRC
35
Males have slightly lower rates of disability in Victoria than the national rates, while females have slightly higher rates of disability early in life (15-24) and then again later in life (60-64). Overall, Victoria lies close to the national rates of disability, across both the sexes and the different age groups.
Table 4.3 Disability Rates, Children in Australia and Victoria
% Disabled Aged 5-14 Males Females Persons
Australia 5.7 3.1 4.4Victoria 4.8 2.0 3.4
Sources: Disability Ageing and Carers: Summary of Findings, ABS (1999a); Disability Ageing and Carers: Summary of Findings Victoria, ABS (1999b).
Note: Victoria has lower rates of disability among children aged 5-14, however, than the Australian average for both men and women.
4.2 1996 Census Information on the Nine Victorian Regions
Within CDATA 96 and SEIFA 96, the nine Victorian funding regions have been created by aggregation of Local Government Areas (LGAs). The Basic Community Profile Tables and the five ABS Socio-Economic Indices for Areas are then calculated for each region separately.
Age Distribution The full details of the age/sex distribution of the regions are shown in Table 4.4. The last row of Table 4.5 shows that over the entire population of each region, non-metropolitan regions display a slightly higher median age than their metropolitan counterparts. This would indicate a higher likelihood of disability in the non-metropolitan regions, given the strong relationship that age has with disability prevalence (as shown in Section 2, Section 3 and the Appendix). The fact that the age distributions do vary across the regions supports the use of the age distribution in the current equity funding model.
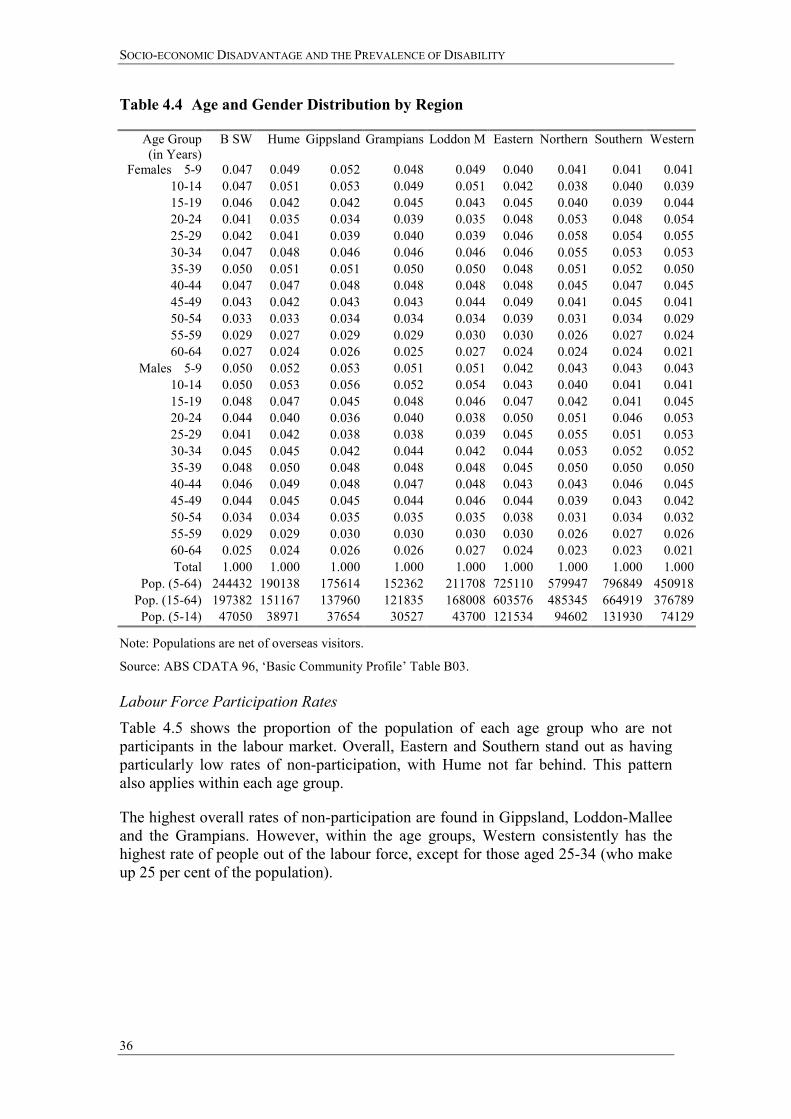
SOCIO-ECONOMIC DISADVANTAGE AND THE PREVALENCE OF DISABILITY
36
Table 4.4 Age and Gender Distribution by Region
Age Group (in Years)
B SW Hume Gippsland Grampians Loddon M Eastern Northern Southern Western
Females 5-9 0.047 0.049 0.052 0.048 0.049 0.040 0.041 0.041 0.041 10-14 0.047 0.051 0.053 0.049 0.051 0.042 0.038 0.040 0.039 15-19 0.046 0.042 0.042 0.045 0.043 0.045 0.040 0.039 0.044 20-24 0.041 0.035 0.034 0.039 0.035 0.048 0.053 0.048 0.054 25-29 0.042 0.041 0.039 0.040 0.039 0.046 0.058 0.054 0.055 30-34 0.047 0.048 0.046 0.046 0.046 0.046 0.055 0.053 0.053 35-39 0.050 0.051 0.051 0.050 0.050 0.048 0.051 0.052 0.050 40-44 0.047 0.047 0.048 0.048 0.048 0.048 0.045 0.047 0.045 45-49 0.043 0.042 0.043 0.043 0.044 0.049 0.041 0.045 0.041 50-54 0.033 0.033 0.034 0.034 0.034 0.039 0.031 0.034 0.029 55-59 0.029 0.027 0.029 0.029 0.030 0.030 0.026 0.027 0.024 60-64 0.027 0.024 0.026 0.025 0.027 0.024 0.024 0.024 0.021
Males 5-9 0.050 0.052 0.053 0.051 0.051 0.042 0.043 0.043 0.043 10-14 0.050 0.053 0.056 0.052 0.054 0.043 0.040 0.041 0.041 15-19 0.048 0.047 0.045 0.048 0.046 0.047 0.042 0.041 0.045 20-24 0.044 0.040 0.036 0.040 0.038 0.050 0.051 0.046 0.053 25-29 0.041 0.042 0.038 0.038 0.039 0.045 0.055 0.051 0.053 30-34 0.045 0.045 0.042 0.044 0.042 0.044 0.053 0.052 0.052 35-39 0.048 0.050 0.048 0.048 0.048 0.045 0.050 0.050 0.050 40-44 0.046 0.049 0.048 0.047 0.048 0.043 0.043 0.046 0.045 45-49 0.044 0.045 0.045 0.044 0.046 0.044 0.039 0.043 0.042 50-54 0.034 0.034 0.035 0.035 0.035 0.038 0.031 0.034 0.032 55-59 0.029 0.029 0.030 0.030 0.030 0.030 0.026 0.027 0.026 60-64 0.025 0.024 0.026 0.026 0.027 0.024 0.023 0.023 0.021 Total 1.000 1.000 1.000 1.000 1.000 1.000 1.000 1.000 1.000
Pop. (5-64) 244432 190138 175614 152362 211708 725110 579947 796849 450918 Pop. (15-64) 197382 151167 137960 121835 168008 603576 485345 664919 376789 Pop. (5-14) 47050 38971 37654 30527 43700 121534 94602 131930 74129
Note: Populations are net of overseas visitors.
Source: ABS CDATA 96, �Basic Community Profile� Table B03. Labour Force Participation Rates Table 4.5 shows the proportion of the population of each age group who are not participants in the labour market. Overall, Eastern and Southern stand out as having particularly low rates of non-participation, with Hume not far behind. This pattern also applies within each age group.
The highest overall rates of non-participation are found in Gippsland, Loddon-Mallee and the Grampians. However, within the age groups, Western consistently has the highest rate of people out of the labour force, except for those aged 25-34 (who make up 25 per cent of the population).
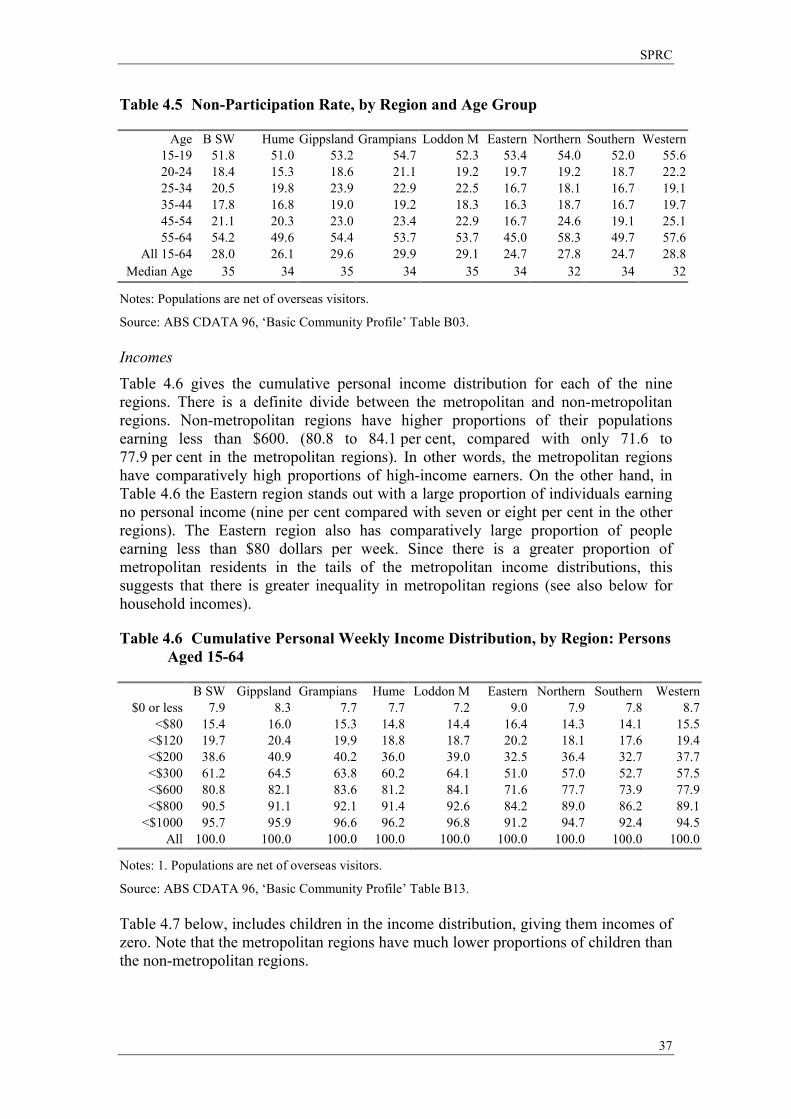
SPRC
37
Table 4.5 Non-Participation Rate, by Region and Age Group
Age B SW Hume Gippsland Grampians Loddon M Eastern Northern Southern Western15-19 51.8 51.0 53.2 54.7 52.3 53.4 54.0 52.0 55.6
20-24 18.4 15.3 18.6 21.1 19.2 19.7 19.2 18.7 22.2 25-34 20.5 19.8 23.9 22.9 22.5 16.7 18.1 16.7 19.1 35-44 17.8 16.8 19.0 19.2 18.3 16.3 18.7 16.7 19.7 45-54 21.1 20.3 23.0 23.4 22.9 16.7 24.6 19.1 25.1 55-64 54.2 49.6 54.4 53.7 53.7 45.0 58.3 49.7 57.6
All 15-64 28.0 26.1 29.6 29.9 29.1 24.7 27.8 24.7 28.8Median Age 35 34 35 34 35 34 32 34 32
Notes: Populations are net of overseas visitors.
Source: ABS CDATA 96, �Basic Community Profile� Table B03. Incomes Table 4.6 gives the cumulative personal income distribution for each of the nine regions. There is a definite divide between the metropolitan and non-metropolitan regions. Non-metropolitan regions have higher proportions of their populations earning less than $600. (80.8 to 84.1 per cent, compared with only 71.6 to 77.9 per cent in the metropolitan regions). In other words, the metropolitan regions have comparatively high proportions of high-income earners. On the other hand, in Table 4.6 the Eastern region stands out with a large proportion of individuals earning no personal income (nine per cent compared with seven or eight per cent in the other regions). The Eastern region also has comparatively large proportion of people earning less than $80 dollars per week. Since there is a greater proportion of metropolitan residents in the tails of the metropolitan income distributions, this suggests that there is greater inequality in metropolitan regions (see also below for household incomes).
Table 4.6 Cumulative Personal Weekly Income Distribution, by Region: Persons Aged 15-64
B SW Gippsland Grampians Hume Loddon M Eastern Northern Southern Western $0 or less 7.9 8.3 7.7 7.7 7.2 9.0 7.9 7.8 8.7
<$80 15.4 16.0 15.3 14.8 14.4 16.4 14.3 14.1 15.5 <$120 19.7 20.4 19.9 18.8 18.7 20.2 18.1 17.6 19.4 <$200 38.6 40.9 40.2 36.0 39.0 32.5 36.4 32.7 37.7 <$300 61.2 64.5 63.8 60.2 64.1 51.0 57.0 52.7 57.5 <$600 80.8 82.1 83.6 81.2 84.1 71.6 77.7 73.9 77.9 <$800 90.5 91.1 92.1 91.4 92.6 84.2 89.0 86.2 89.1
<$1000 95.7 95.9 96.6 96.2 96.8 91.2 94.7 92.4 94.5 All 100.0 100.0 100.0 100.0 100.0 100.0 100.0 100.0 100.0
Notes: 1. Populations are net of overseas visitors.
Source: ABS CDATA 96, �Basic Community Profile� Table B13. Table 4.7 below, includes children in the income distribution, giving them incomes of zero. Note that the metropolitan regions have much lower proportions of children than the non-metropolitan regions.
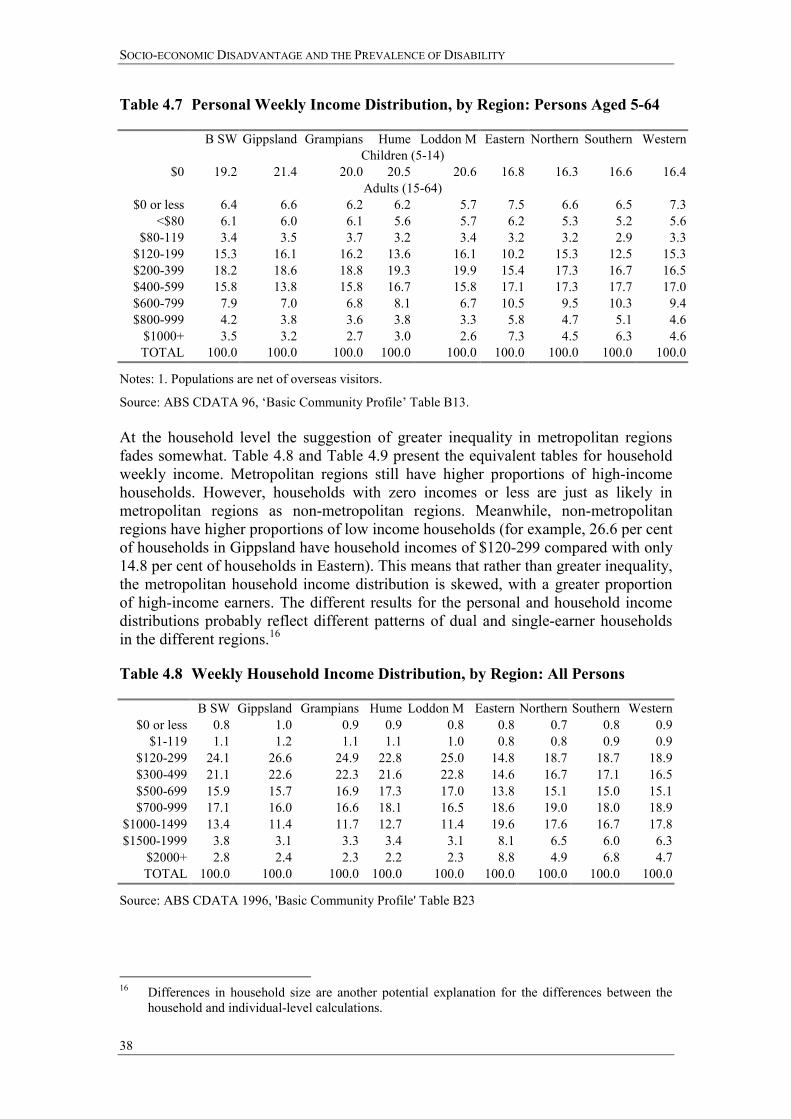
SOCIO-ECONOMIC DISADVANTAGE AND THE PREVALENCE OF DISABILITY
38
Table 4.7 Personal Weekly Income Distribution, by Region: Persons Aged 5-64
B SW Gippsland Grampians Hume Loddon M Eastern Northern Southern Western Children (5-14)
$0 19.2 21.4 20.0 20.5 20.6 16.8 16.3 16.6 16.4 Adults (15-64)
$0 or less 6.4 6.6 6.2 6.2 5.7 7.5 6.6 6.5 7.3 <$80 6.1 6.0 6.1 5.6 5.7 6.2 5.3 5.2 5.6
$80-119 3.4 3.5 3.7 3.2 3.4 3.2 3.2 2.9 3.3 $120-199 15.3 16.1 16.2 13.6 16.1 10.2 15.3 12.5 15.3 $200-399 18.2 18.6 18.8 19.3 19.9 15.4 17.3 16.7 16.5 $400-599 15.8 13.8 15.8 16.7 15.8 17.1 17.3 17.7 17.0 $600-799 7.9 7.0 6.8 8.1 6.7 10.5 9.5 10.3 9.4 $800-999 4.2 3.8 3.6 3.8 3.3 5.8 4.7 5.1 4.6
$1000+ 3.5 3.2 2.7 3.0 2.6 7.3 4.5 6.3 4.6 TOTAL 100.0 100.0 100.0 100.0 100.0 100.0 100.0 100.0 100.0
Notes: 1. Populations are net of overseas visitors.
Source: ABS CDATA 96, �Basic Community Profile� Table B13. At the household level the suggestion of greater inequality in metropolitan regions fades somewhat. Table 4.8 and Table 4.9 present the equivalent tables for household weekly income. Metropolitan regions still have higher proportions of high-income households. However, households with zero incomes or less are just as likely in metropolitan regions as non-metropolitan regions. Meanwhile, non-metropolitan regions have higher proportions of low income households (for example, 26.6 per cent of households in Gippsland have household incomes of $120-299 compared with only 14.8 per cent of households in Eastern). This means that rather than greater inequality, the metropolitan household income distribution is skewed, with a greater proportion of high-income earners. The different results for the personal and household income distributions probably reflect different patterns of dual and single-earner households in the different regions.16
Table 4.8 Weekly Household Income Distribution, by Region: All Persons
B SW Gippsland Grampians Hume Loddon M Eastern Northern Southern Western $0 or less 0.8 1.0 0.9 0.9 0.8 0.8 0.7 0.8 0.9
$1-119 1.1 1.2 1.1 1.1 1.0 0.8 0.8 0.9 0.9 $120-299 24.1 26.6 24.9 22.8 25.0 14.8 18.7 18.7 18.9 $300-499 21.1 22.6 22.3 21.6 22.8 14.6 16.7 17.1 16.5 $500-699 15.9 15.7 16.9 17.3 17.0 13.8 15.1 15.0 15.1 $700-999 17.1 16.0 16.6 18.1 16.5 18.6 19.0 18.0 18.9
$1000-1499 13.4 11.4 11.7 12.7 11.4 19.6 17.6 16.7 17.8 $1500-1999 3.8 3.1 3.3 3.4 3.1 8.1 6.5 6.0 6.3
$2000+ 2.8 2.4 2.3 2.2 2.3 8.8 4.9 6.8 4.7 TOTAL 100.0 100.0 100.0 100.0 100.0 100.0 100.0 100.0 100.0
Source: ABS CDATA 1996, 'Basic Community Profile' Table B23
16 Differences in household size are another potential explanation for the differences between the
household and individual-level calculations.
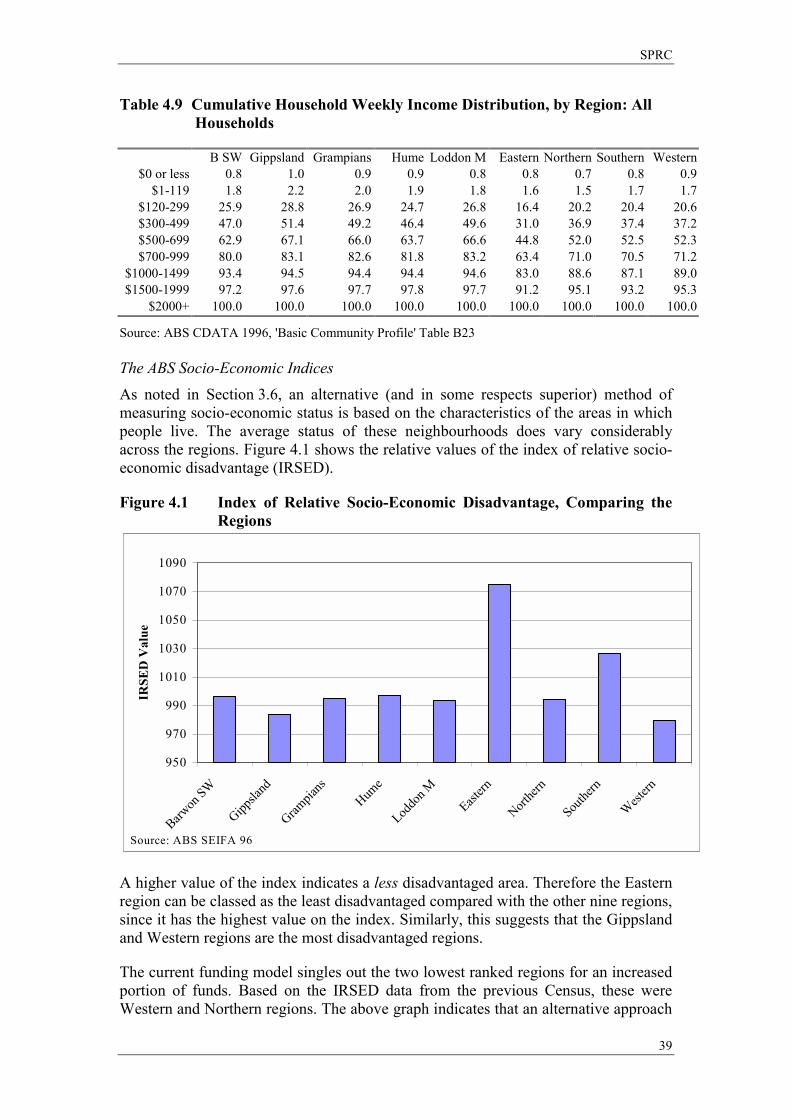
SPRC
39
Table 4.9 Cumulative Household Weekly Income Distribution, by Region: All Households
B SW Gippsland Grampians Hume Loddon M Eastern Northern Southern Western $0 or less 0.8 1.0 0.9 0.9 0.8 0.8 0.7 0.8 0.9
$1-119 1.8 2.2 2.0 1.9 1.8 1.6 1.5 1.7 1.7 $120-299 25.9 28.8 26.9 24.7 26.8 16.4 20.2 20.4 20.6 $300-499 47.0 51.4 49.2 46.4 49.6 31.0 36.9 37.4 37.2 $500-699 62.9 67.1 66.0 63.7 66.6 44.8 52.0 52.5 52.3 $700-999 80.0 83.1 82.6 81.8 83.2 63.4 71.0 70.5 71.2
$1000-1499 93.4 94.5 94.4 94.4 94.6 83.0 88.6 87.1 89.0 $1500-1999 97.2 97.6 97.7 97.8 97.7 91.2 95.1 93.2 95.3
$2000+ 100.0 100.0 100.0 100.0 100.0 100.0 100.0 100.0 100.0
Source: ABS CDATA 1996, 'Basic Community Profile' Table B23 The ABS Socio-Economic Indices As noted in Section 3.6, an alternative (and in some respects superior) method of measuring socio-economic status is based on the characteristics of the areas in which people live. The average status of these neighbourhoods does vary considerably across the regions. Figure 4.1 shows the relative values of the index of relative socio-economic disadvantage (IRSED).
Figure 4.1 Index of Relative Socio-Economic Disadvantage, Comparing the Regions
950
970
990
1010
1030
1050
1070
1090
Barwon
SW
Gippsla
nd
Grampia
nsHum
e
Loddo
n MEast
ern
Northe
rn
Southe
rn
West
ern
IRSE
D V
alue
Source: ABS SEIFA 96
A higher value of the index indicates a less disadvantaged area. Therefore the Eastern region can be classed as the least disadvantaged compared with the other nine regions, since it has the highest value on the index. Similarly, this suggests that the Gippsland and Western regions are the most disadvantaged regions.
The current funding model singles out the two lowest ranked regions for an increased portion of funds. Based on the IRSED data from the previous Census, these were Western and Northern regions. The above graph indicates that an alternative approach
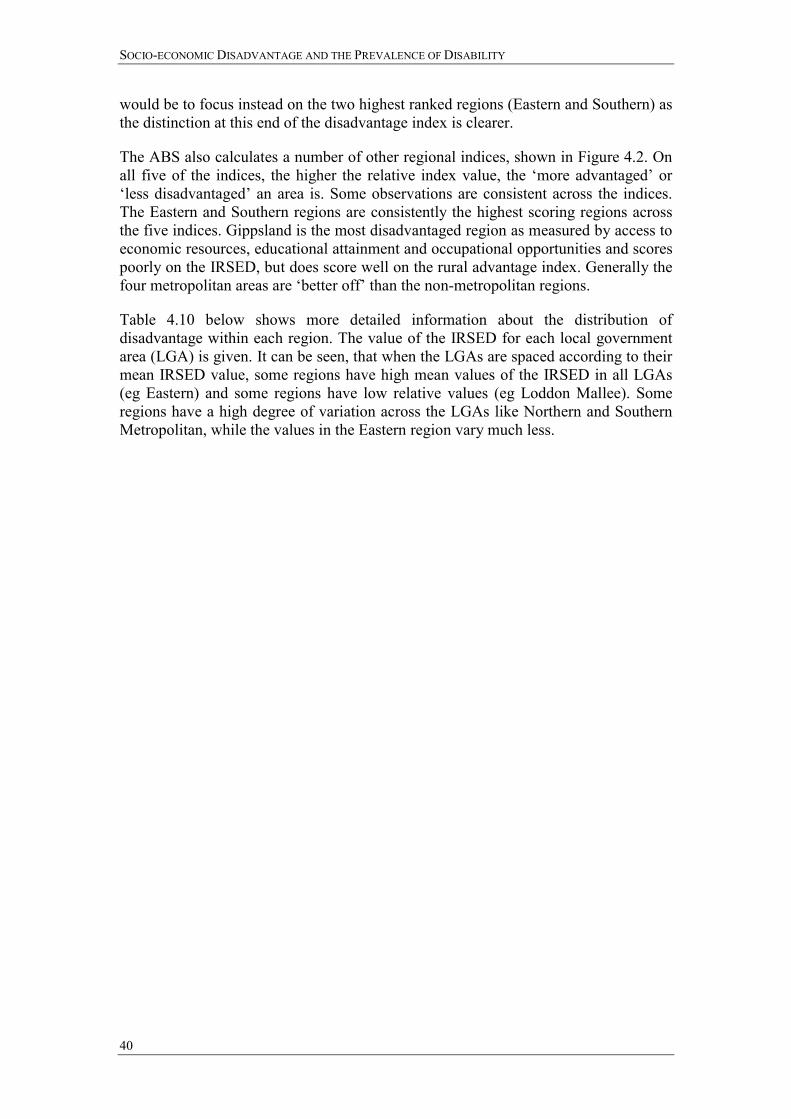
SOCIO-ECONOMIC DISADVANTAGE AND THE PREVALENCE OF DISABILITY
40
would be to focus instead on the two highest ranked regions (Eastern and Southern) as the distinction at this end of the disadvantage index is clearer.
The ABS also calculates a number of other regional indices, shown in Figure 4.2. On all five of the indices, the higher the relative index value, the �more advantaged� or �less disadvantaged� an area is. Some observations are consistent across the indices. The Eastern and Southern regions are consistently the highest scoring regions across the five indices. Gippsland is the most disadvantaged region as measured by access to economic resources, educational attainment and occupational opportunities and scores poorly on the IRSED, but does score well on the rural advantage index. Generally the four metropolitan areas are �better off� than the non-metropolitan regions.
Table 4.10 below shows more detailed information about the distribution of disadvantage within each region. The value of the IRSED for each local government area (LGA) is given. It can be seen, that when the LGAs are spaced according to their mean IRSED value, some regions have high mean values of the IRSED in all LGAs (eg Eastern) and some regions have low relative values (eg Loddon Mallee). Some regions have a high degree of variation across the LGAs like Northern and Southern Metropolitan, while the values in the Eastern region vary much less.
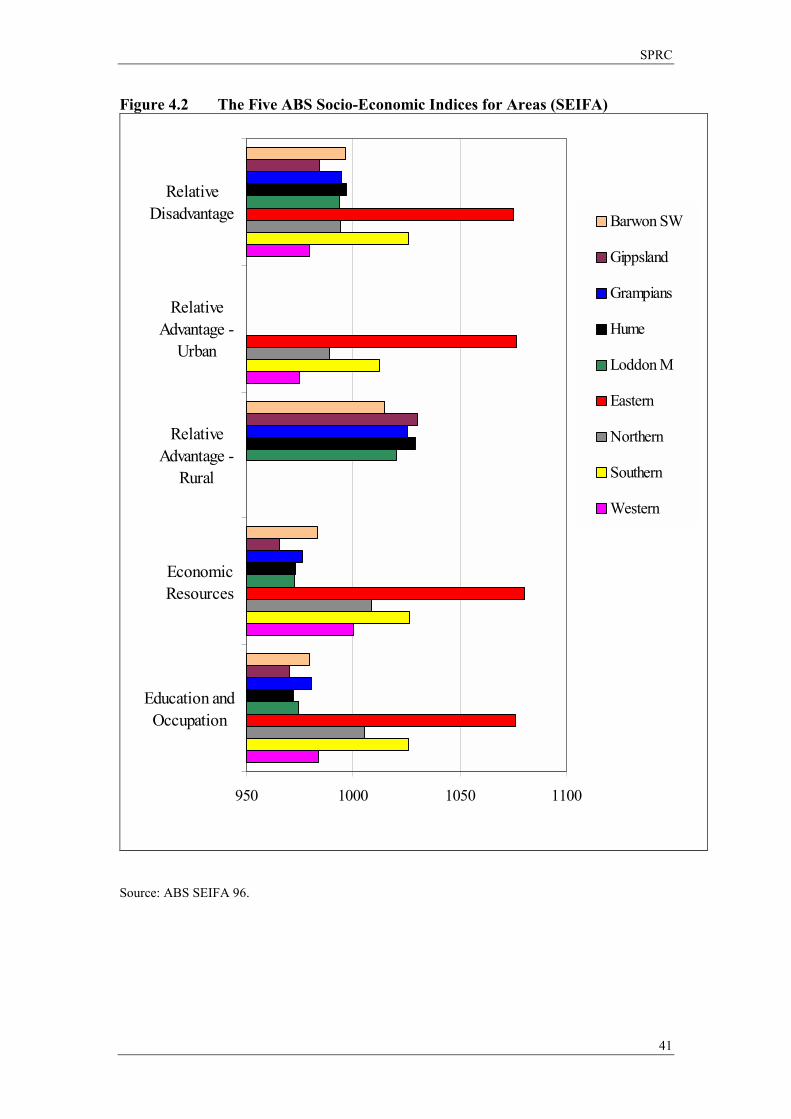
SPRC
41
Figure 4.2 The Five ABS Socio-Economic Indices for Areas (SEIFA)
950 1000 1050 1100
RelativeDisadvantage
RelativeAdvantage -
Urban
RelativeAdvantage -
Rural
EconomicResources
Education andOccupation
Barwon SW
Gippsland
Grampians
Hume
Loddon M
Eastern
Northern
Southern
Western
Source: ABS SEIFA 96.
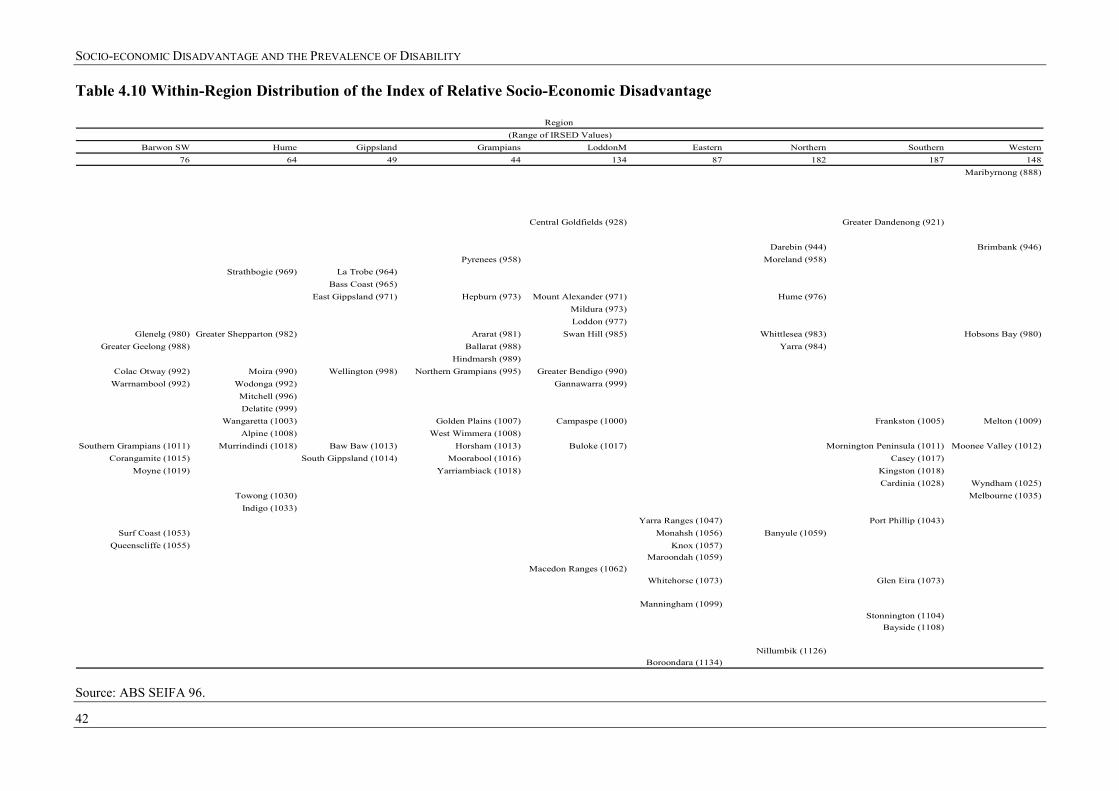
SOCIO-ECONOMIC DISADVANTAGE AND THE PREVALENCE OF DISABILITY
42
Table 4.10 Within-Region Distribution of the Index of Relative Socio-Economic Disadvantage
Region (Range of IRSED Values)
Barwon SW Hume Gippsland Grampians LoddonM Eastern Northern Southern Western76 64 49 44 134 87 182 187 148
Maribyrnong (888)
Central Goldfields (928) Greater Dandenong (921)
Darebin (944) Brimbank (946)Pyrenees (958) Moreland (958)
Strathbogie (969) La Trobe (964)Bass Coast (965)
East Gippsland (971) Hepburn (973) Mount Alexander (971) Hume (976)Mildura (973)Loddon (977)
Glenelg (980) Greater Shepparton (982) Ararat (981) Swan Hill (985) Whittlesea (983) Hobsons Bay (980)Greater Geelong (988) Ballarat (988) Yarra (984)
Hindmarsh (989)Colac Otway (992) Moira (990) Wellington (998) Northern Grampians (995) Greater Bendigo (990)
Warrnambool (992) Wodonga (992) Gannawarra (999)Mitchell (996)Delatite (999)
Wangaretta (1003) Golden Plains (1007) Campaspe (1000) Frankston (1005) Melton (1009)Alpine (1008) West Wimmera (1008)
Southern Grampians (1011) Murrindindi (1018) Baw Baw (1013) Horsham (1013) Buloke (1017) Mornington Peninsula (1011) Moonee Valley (1012)Corangamite (1015) South Gippsland (1014) Moorabool (1016) Casey (1017)
Moyne (1019) Yarriambiack (1018) Kingston (1018)Cardinia (1028) Wyndham (1025)
Towong (1030) Melbourne (1035)Indigo (1033)
Yarra Ranges (1047) Port Phillip (1043)Surf Coast (1053) Monahsh (1056) Banyule (1059)
Queenscliffe (1055) Knox (1057)Maroondah (1059)
Macedon Ranges (1062)Whitehorse (1073) Glen Eira (1073)
Manningham (1099)Stonnington (1104)
Bayside (1108)
Nillumbik (1126)Boroondara (1134)
Source: ABS SEIFA 96.
SPRC
43
5 Implications for the Regional Distribution of Disability
5.1 Objectives
In Section 3 we have shown that people with a variety of socio-economic disadvantages are more likely to have a disability. Section 4 then showed that there is indeed substantial variation in the extent of socio-economic disadvantage in the different regions of Victoria. Does this imply that there will be more people with disabilities in those regions that have greater disadvantage, and if so how great is the difference?
As was elaborated in Section 2.2, the answer to this question is not straightforward, as it depends upon the nature of the causal links between disability, disadvantage and location. In order to estimate the way in which socio-economic characteristics influence the numbers of disabled people in different regions it is necessary to make some simplifying assumptions about the relationship between these three factors. In particular, we must assume that the relationship between disability and location is fully mediated via the relationship of both with observed socio-economic characteristics.
In Section 2.2, we outlined two scenarios where this simplifying assumption might not hold. In the examples outlined, the key issue is that location might be more directly associated with past rather than current socio-economic status. If this is the case, the modelling procedure that we use can lead to either an under- or an over- estimate of the extent of regional diversity in disability rates depending upon the precise causal relationship between disability and socio-economic disadvantage.
However, we believe that, though it is not perfect, the modelling method that we use in this section is the best method we currently have available to estimate the way in which socio-economic characteristics will influence the regional distribution of disability.
5.2 Adjustments for Age and Gender
The method that we use to extrapolate the household-level relationship between disability and disadvantage is an extension of the method currently employed to take account of age and gender differences between regions.
This current method involves two steps, and we replicate this here using data from the 1996 Census and 1998 SDAC. First, the prevalence of severe and profound disability within each age/sex group is calculated using national prevalence rates available from the SDAC. This information is shown in Table 3.1 on page 19. As noted earlier, the most important pattern is the initial decline and then steady increase in disability with age after the teenage years.
Second, within each region, this prevalence rate is applied to the estimated population in each age/sex group to obtain an estimate of the number of people with a severe or profound disability in each age/sex group within the region. Regional population distribution information is shown in Table 4.4 (on page 36); the actual numbers in each age/sex group can be obtained by multiplying the fractional distribution by the
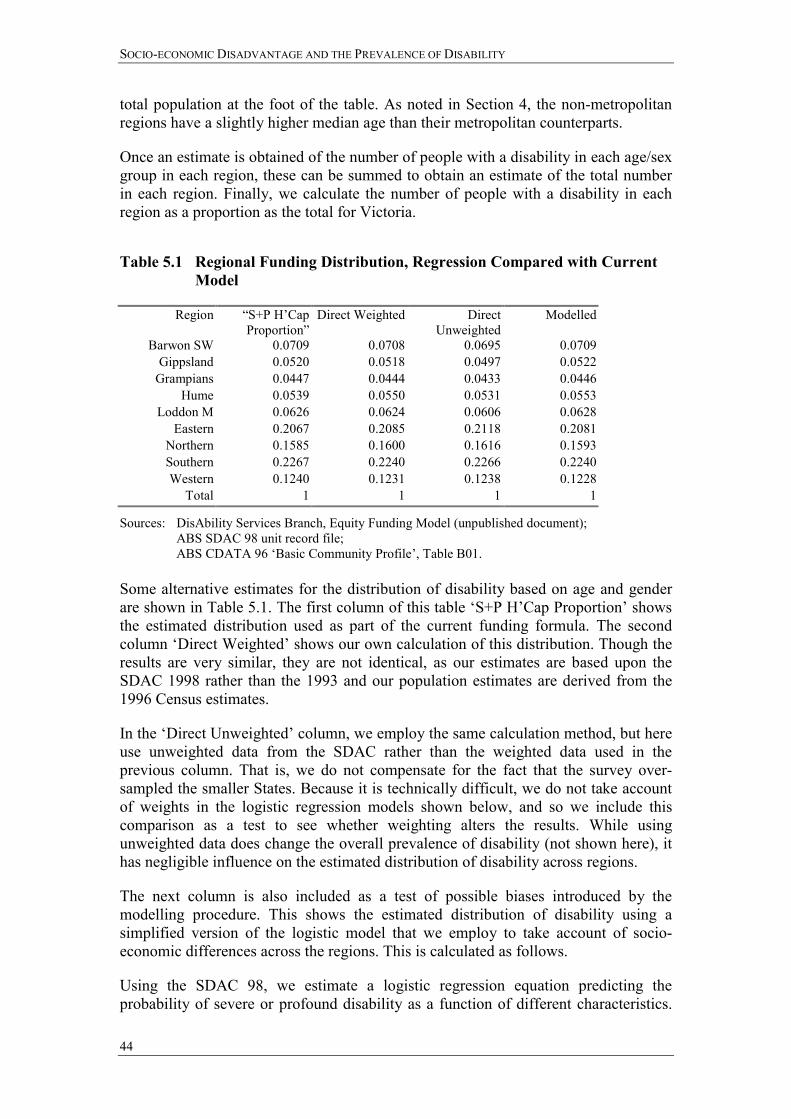
SOCIO-ECONOMIC DISADVANTAGE AND THE PREVALENCE OF DISABILITY
44
total population at the foot of the table. As noted in Section 4, the non-metropolitan regions have a slightly higher median age than their metropolitan counterparts.
Once an estimate is obtained of the number of people with a disability in each age/sex group in each region, these can be summed to obtain an estimate of the total number in each region. Finally, we calculate the number of people with a disability in each region as a proportion as the total for Victoria.
Table 5.1 Regional Funding Distribution, Regression Compared with Current
Model
Region �S+P H�Cap Proportion�
Direct Weighted Direct Unweighted
Modelled
Barwon SW 0.0709 0.0708 0.0695 0.0709 Gippsland 0.0520 0.0518 0.0497 0.0522
Grampians 0.0447 0.0444 0.0433 0.0446 Hume 0.0539 0.0550 0.0531 0.0553
Loddon M 0.0626 0.0624 0.0606 0.0628 Eastern 0.2067 0.2085 0.2118 0.2081
Northern 0.1585 0.1600 0.1616 0.1593 Southern 0.2267 0.2240 0.2266 0.2240 Western 0.1240 0.1231 0.1238 0.1228
Total 1 1 1 1
Sources: DisAbility Services Branch, Equity Funding Model (unpublished document); ABS SDAC 98 unit record file; ABS CDATA 96 �Basic Community Profile�, Table B01.
Some alternative estimates for the distribution of disability based on age and gender are shown in Table 5.1. The first column of this table �S+P H�Cap Proportion� shows the estimated distribution used as part of the current funding formula. The second column �Direct Weighted� shows our own calculation of this distribution. Though the results are very similar, they are not identical, as our estimates are based upon the SDAC 1998 rather than the 1993 and our population estimates are derived from the 1996 Census estimates.
In the �Direct Unweighted� column, we employ the same calculation method, but here use unweighted data from the SDAC rather than the weighted data used in the previous column. That is, we do not compensate for the fact that the survey over-sampled the smaller States. Because it is technically difficult, we do not take account of weights in the logistic regression models shown below, and so we include this comparison as a test to see whether weighting alters the results. While using unweighted data does change the overall prevalence of disability (not shown here), it has negligible influence on the estimated distribution of disability across regions.
The next column is also included as a test of possible biases introduced by the modelling procedure. This shows the estimated distribution of disability using a simplified version of the logistic model that we employ to take account of socio-economic differences across the regions. This is calculated as follows.
Using the SDAC 98, we estimate a logistic regression equation predicting the probability of severe or profound disability as a function of different characteristics.
SPRC
45
This follows a similar form to that estimated in Section 3. That is we assume that for person i, the probability of having a disability, pi, can be modelled as;
pi = L(Xi'b)
where Xi is a vector of explanatory variables, b is a vector of parameters to be estimated, and L is the logistic transformation function. The estimates of b for a simple model, where X comprises only 0/1 variables identifying membership of each age and sex group, are shown in the first column of Table 5.2. Higher values of the parameters imply a greater likelihood of having a disability, but because of the non-linear nature of the logistic transform, a direct interpretation of these parameters is difficult.
We then obtain an estimate of the average probability of disability within each region, p using the approximation that;
b)'XL( p ≈
where X is the average value of each of the explanatory variables within each region. When X is a vector of binary variables flagging membership of each age/sex group, X is simply the proportions of the population in each age/sex group as shown in Table 4.4. Because of the non-linear nature of the logistic transformation, this estimate is only approximate.
When we calculate these mean probabilities for each region using the regression based on age/sex group membership we do find that the estimates are slightly different from those obtained via the direct calculation. However, this difference is uniform across all regions, and so the modelled distribution of the distribution across the regions, shown as the last column in Table 5.1 above, is essentially identical to that found using the methods shown in the other columns.
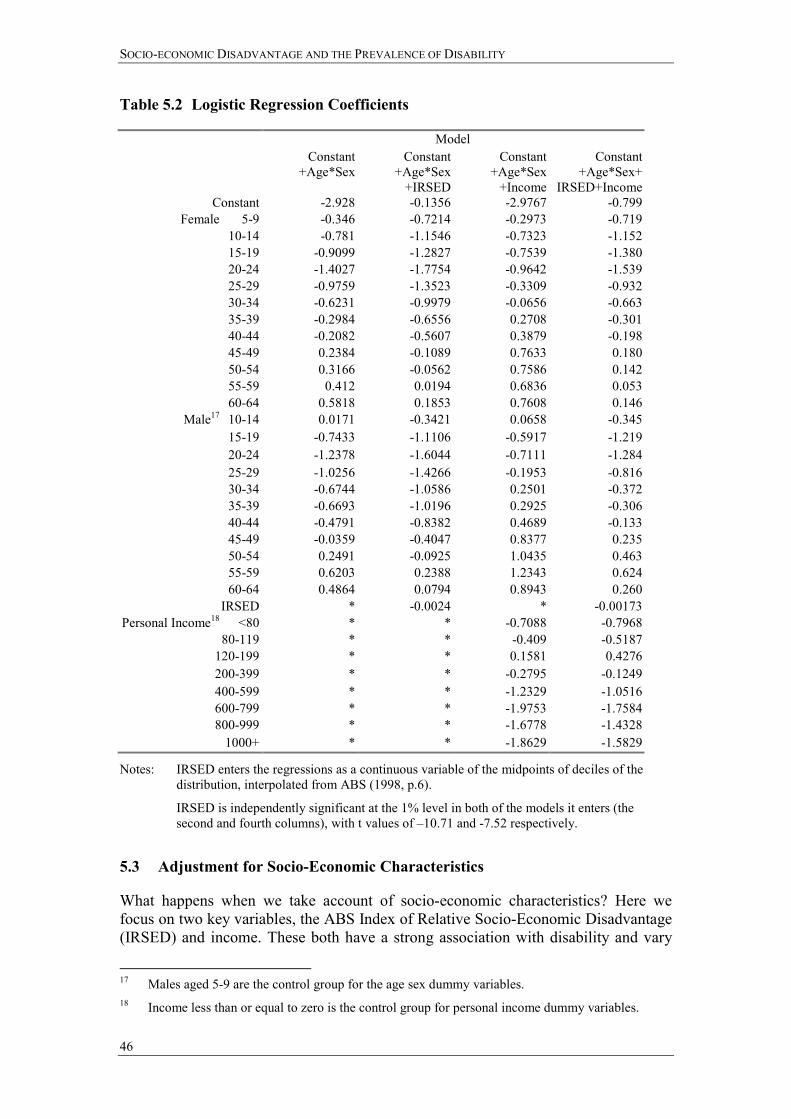
SOCIO-ECONOMIC DISADVANTAGE AND THE PREVALENCE OF DISABILITY
46
Table 5.2 Logistic Regression Coefficients
Model Constant
+Age*Sex Constant
+Age*Sex +IRSED
Constant +Age*Sex
+Income
Constant +Age*Sex+
IRSED+Income Constant -2.928 -0.1356 -2.9767 -0.799
Female 5-9 -0.346 -0.7214 -0.2973 -0.719 10-14 -0.781 -1.1546 -0.7323 -1.152 15-19 -0.9099 -1.2827 -0.7539 -1.380 20-24 -1.4027 -1.7754 -0.9642 -1.539 25-29 -0.9759 -1.3523 -0.3309 -0.932 30-34 -0.6231 -0.9979 -0.0656 -0.663 35-39 -0.2984 -0.6556 0.2708 -0.301 40-44 -0.2082 -0.5607 0.3879 -0.198 45-49 0.2384 -0.1089 0.7633 0.180 50-54 0.3166 -0.0562 0.7586 0.142 55-59 0.412 0.0194 0.6836 0.053 60-64 0.5818 0.1853 0.7608 0.146
Male17 10-14 0.0171 -0.3421 0.0658 -0.345 15-19 -0.7433 -1.1106 -0.5917 -1.219 20-24 -1.2378 -1.6044 -0.7111 -1.284 25-29 -1.0256 -1.4266 -0.1953 -0.816 30-34 -0.6744 -1.0586 0.2501 -0.372 35-39 -0.6693 -1.0196 0.2925 -0.306 40-44 -0.4791 -0.8382 0.4689 -0.133 45-49 -0.0359 -0.4047 0.8377 0.235 50-54 0.2491 -0.0925 1.0435 0.463 55-59 0.6203 0.2388 1.2343 0.624 60-64 0.4864 0.0794 0.8943 0.260
IRSED * -0.0024 * -0.00173 Personal Income18 <80 * * -0.7088 -0.7968
80-119 * * -0.409 -0.5187 120-199 * * 0.1581 0.4276 200-399 * * -0.2795 -0.1249 400-599 * * -1.2329 -1.0516 600-799 * * -1.9753 -1.7584 800-999 * * -1.6778 -1.4328
1000+ * * -1.8629 -1.5829
Notes: IRSED enters the regressions as a continuous variable of the midpoints of deciles of the distribution, interpolated from ABS (1998, p.6).
IRSED is independently significant at the 1% level in both of the models it enters (the second and fourth columns), with t values of �10.71 and -7.52 respectively.
5.3 Adjustment for Socio-Economic Characteristics
What happens when we take account of socio-economic characteristics? Here we focus on two key variables, the ABS Index of Relative Socio-Economic Disadvantage (IRSED) and income. These both have a strong association with disability and vary
17 Males aged 5-9 are the control group for the age sex dummy variables. 18 Income less than or equal to zero is the control group for personal income dummy variables.

SPRC
47
considerably across the regions. The method used to estimate their impact is precisely the same as for the modelling of the age and sex distribution described above.
The last three columns of Table 5.2 show the parameter estimates obtained when we add the IRSED to the logistic regression, add income categories instead, and finally add both the index of relative socio-economic disadvantage and income to the regression. On the basis of these parameter estimates we then calculate the distribution of people with disabilities across regions. Rather than present these results directly, however, we present them in a way that is more consistent with the current method of developing the funding formula.
Table 5.3 Relative Funding Arrangements based on Regression Analysis
Relative to DHS S+P Proportion
Relative to Modelled Age by Sex Proportion
Region S+P with Socio-Economic Factor
Age*Sex +IRSED Age*Sex +Income Age*Sex +IRSED+Income
Barwon SW 0.9725 1.0452 1.0574 1.0869Gippsland 0.9725 1.0771 1.1046 1.1601
Grampians 0.9725 1.0504 1.0992 1.1326Hume 0.9725 1.0456 1.0566 1.0865
Loddon M 0.9725 1.0533 1.1073 1.1452Eastern 0.9725 0.8683 0.9106 0.8179
Northern 1.0698 1.0483 1.0155 1.0505Southern 0.9725 0.9731 0.9547 0.9366Western 1.0698 1.0846 1.0199 1.0790
These patterns are shown in Table 5.3 and in Figure 5.1. The first column of this table indicates how socio-economic status is incorporated into the current funding formula. This column has been calculated as follows. The current funding formula implies an additional 10 per cent socio-economic weighting for the Western and Northern metro regions. (We ignore here the weighting for Aboriginality and for rurality as we have no direct data on the former, and the rurality adjustment is for reasons other than disability prevalence.) After adding this weighting, we then calculate the distribution of the disability population across the nine regions and express these numbers relative to the estimated distribution based solely on the age/sex distribution.
Note that the additional 10 per cent socio-economic weighting for the Western and Northern metro regions does not translate into an increase of 10 per cent in the share of growth funds. This is because increasing the weighting of two regions also increases the estimate of total disability numbers. The first column of Table 5.3 shows that this increased weighting of 10 per cent translates to an increase in the share of growth funds of 6.98 per cent for these two regions and a decrease of 2.75 per cent for the other regions.19 This is relative to the funding that would be predicted on the basis of the age/sex distribution across the regions.
In the second column we undertake the same calculation, but here we show the impact of including the IRSED into the regression. Again, in order to identify clearly the effect of the IRSED, we express the estimation in terms of funding shares relative to that obtained simply on the basis of age and sex. In other words, if one were to follow 19 The 10 per cent re-appears in the ratios with 1.0698 / 0.9725 = 1.1.
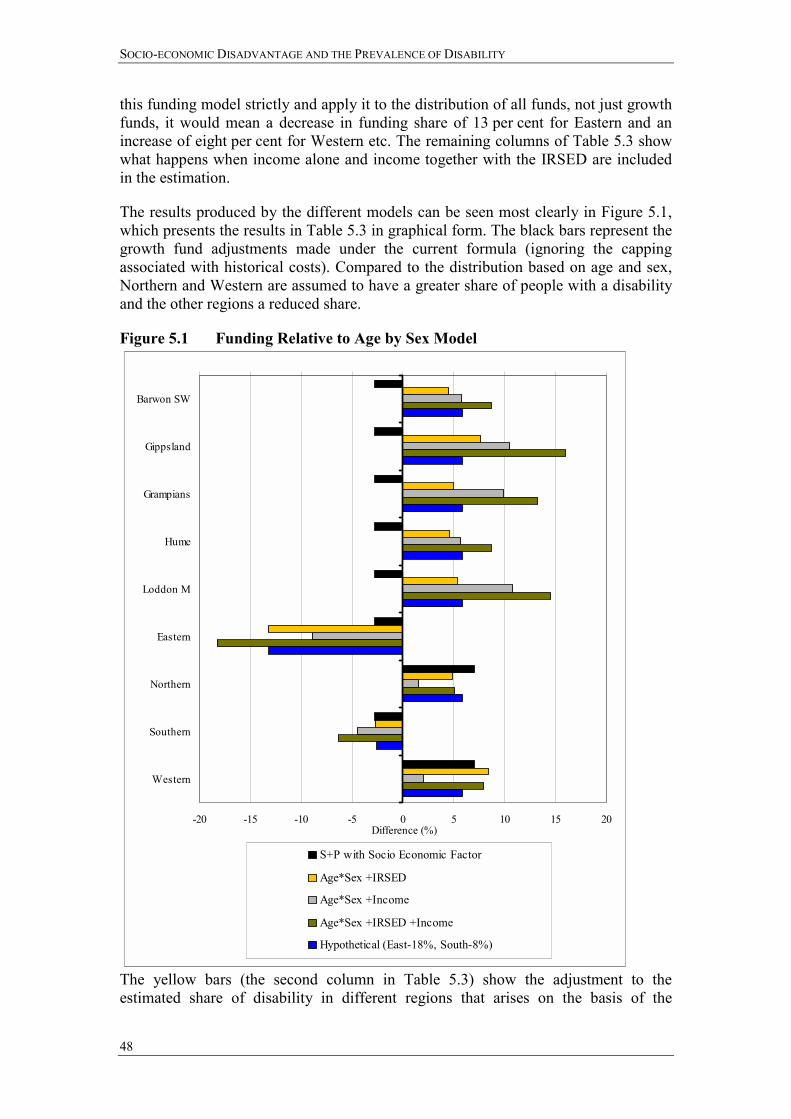
SOCIO-ECONOMIC DISADVANTAGE AND THE PREVALENCE OF DISABILITY
48
this funding model strictly and apply it to the distribution of all funds, not just growth funds, it would mean a decrease in funding share of 13 per cent for Eastern and an increase of eight per cent for Western etc. The remaining columns of Table 5.3 show what happens when income alone and income together with the IRSED are included in the estimation.
The results produced by the different models can be seen most clearly in Figure 5.1, which presents the results in Table 5.3 in graphical form. The black bars represent the growth fund adjustments made under the current formula (ignoring the capping associated with historical costs). Compared to the distribution based on age and sex, Northern and Western are assumed to have a greater share of people with a disability and the other regions a reduced share.
Figure 5.1 Funding Relative to Age by Sex Model
-20 -15 -10 -5 0 5 10 15 20
Barwon SW
Gippsland
Grampians
Hume
Loddon M
Eastern
Northern
Southern
Western
Difference (%)
S+P with Socio Economic Factor
Age*Sex +IRSED
Age*Sex +Income
Age*Sex +IRSED +Income
Hypothetical (East-18%, South-8%)
The yellow bars (the second column in Table 5.3) show the adjustment to the estimated share of disability in different regions that arises on the basis of the
SPRC
49
different values of the IRSED in different regions. They therefore reflect the values of the index shown in Figure 4.1.
Within the metropolitan regions, the IRSED leads to similar conclusions to the existing equity model, with Eastern and Southern assumed to have a smaller share of people with disabilities (compared to their population), and Northern and Western a larger share. Across the whole State, however, the patterns are somewhat different. Here, the two outlier regions are the two most advantaged, Eastern and Southern. Compared to these regions, the other regions have very similar values for the IRSED, and hence similar equity adjustments under this model.
If we were to use a simple adjustment to take account of IRSED values of each region, it would be to decrease the relative share of the Eastern and Southern regions (and by definition, to increase the share of all other regions).
The picture with respect to income is different, however, particularly the comparison between the metropolitan and non-metropolitan regions. As was shown earlier in Section 4.2, the non-metropolitan regions have significantly lower incomes than the metropolitan regions. This difference is generally greater than the difference in the ABS socio-economic indices.
Consequently, when income is used as the indicator of greater disadvantage-related prevalence of disability, the rural regions are predicted to have a greater share of Victoria�s disabled population. This is shown in the third column in Table 5.3 (labelled �Age*Sex + Income�) and by the grey bars in Figure 5.1. Based on the distribution of income, Eastern and Southern are still the best-off regions � and by implication the regions with a relatively low share of people with disabilities. However, Eastern does not stand out as much as it does on the IRSED. All the non-metropolitan regions, however, are estimated to have higher shares of disability than the Northern and Western regions.
Finally, when we estimate a model taking account of variations in both the index of relative socio-economic disadvantage and incomes, we get results which combine the patterns of each (the last column of Table 5.3 and the olive green bars of Figure 5.1). Both income and the socio-economic characteristics of the region of residence are independently associated with probability of disability.
5.4 Implications
What do these results imply for equity-based adjustments to funding models? In Section 3 of this report we have shown that there is indeed a strong association between disadvantage and disability. Section 4 showed that socio-economic disadvantage does vary considerably across the nine Victorian funding regions. Which of these models combining the two sets of results is most appropriate?
As was noted in Section 2.2, the modelling framework that we use rests upon a number of simplifying assumptions about the way in which disability, disadvantage and location are inter-related. Depending upon the direction of causality between disability and disadvantage, it is possible to imagine causal structures which imply that our estimates are either under- or over-estimates of the diversity of disability prevalence across regions.
SOCIO-ECONOMIC DISADVANTAGE AND THE PREVALENCE OF DISABILITY
50
Both these more comprehensive models have in common an assumption that the link between socio-economic disadvantage and current location may be weak, with the link between location and disability going via past rather than current socio-economic status. In order to minimise the risk that our estimates may be biased because of these interrelationships, we therefore prefer the indicator of socio-economic status that is most strongly linked with geographic location � the IRSED index. This is based upon the socio-economic characteristics of the location in which a person resides and so provides the most robust measure of those aspects of socio-economic advantage which are associated with geographic location.
The implied socio-economic weighting represented by this indicator is represented by the yellow bars in Figure 5.1 (Age*Sex+IRSED). This suggests that it is the Eastern and (to a lesser extent) Southern regions which have fewer people with disabilities than might be expected on the basis of age and gender, with the other regions having a reasonably equal prevalence. In particular, there appears to be no systematic difference between the less advantaged urban areas and the non-metropolitan regions. This is supported by the evidence presented earlier (Figure 3.6), which showed that within each IRSED decile, there was no systematic difference in disability rates between capital cities and the remainder of Australia.
One could base the growth funding formula directly upon the estimates in Table 5.3 and Figure 5.1. However, given the limitations of the estimation methods available to us, it is probably more appropriate to apply a simplified version. Consequently, the blue (Hypothetical) lines in Figure 5.1 show the results from a growth funding formula that only differentiates Eastern and Southern from the other regions.20 These results are calculated by applying a socio-economic weighting of �18 and �8 per cent to the Eastern and Southern regions respectively. Because this also reduces the total number for Victoria, this translates to a smaller drop in (growth) funding of around 13 and 3 per cent for these two regions respectively (as shown in the figure).21
Note that such �equity-based� adjustments are calculated with the objective of reflecting the higher prevalence of disability in disadvantaged regions. They take no account of the possible greater needs for service delivery in disadvantaged (or remote) regions. Also, they take no account of the higher rate of disability among the Aboriginal population. The evidence presented earlier in Section 3.7 is supportive of the current funding model assumption that their disability rates are twice that of the non-Aboriginal population.
20 Two possible outliers with higher disability prevalence are Western and Gippsland. However,
these two regions are still closer to the middle-ranking regions than is the Southern region. 21 Recall that the current funding formula implies an additional 10 per cent socio-economic
weighting for the Western and Northern metro regions. In terms of the impact on the total share of funding, this means an increase in funding share of 7 per cent for these two regions and a decrease of 3 per cent for the other regions. In all cases, these results are relative to the funding that would be predicted on the basis of the age/sex distribution across the regions.

SPRC
51
6 Appendix: Review of the Key Literature
Summary
There are two approaches to measurement of the prevalence of disability: one focused on impairment and the other on disability. The first produces data about functional limitations and the second produces data about activity restrictions and handicap. Since 1981, there have been calls to move to approaches based on activity restriction, acknowledging that impairment is not the only factor leading to disability and restrictions to activities of daily life and social participation. Reflecting this, the International Classification of Impairments, Disabilities and Handicaps (ICIDH), released in 1981, has been under review since 1995. A draft International Classification of Functioning and Disability (ICIDH-2), has been produced introducing key concepts around the contextual factors that effect activity and participation restrictions. In response to the ICIDH-2, the Australian Bureau of Statistics (ABS) changed its concepts of disability for the 1998 Survey of Disability, Ageing and Carers (SDAC).
Research from both the UK and the USA has shown a strong link between prevalence of disability and low income. In the UK, an analysis showed that three-quarters of families with a member with a disability were concentrated in the bottom half of the income distribution. Research in the USA found that most people with a physical impairment were concentrated in the bottom one-fifth of the income distribution. Research from the USA has also found that poverty and the prevalence of childhood disability are related. In Australia, the Henderson Inquiry (Commission of Inquiry into Poverty, 1977) established a strong link between disability (and the degree of �severity� of disability) and poverty with 21.4 per cent of �adult income units� (people with a disability) very poor compared with 2.7 per cent for others. Reproducing the Henderson Inquiry�s methodology, King (1997) has shown the relationship persists into the present, with 26.7 per cent of �adult income units� (people with a disability) below the Henderson poverty line.
In the UK in the mid-1980s, labour force participation was low for people with a disability and unemployment was high. This pattern is repeated in Australia with, in 1998, half of the people with a disability (including those without activity restriction) in the labour force (compared with four-fifths of non-disabled people) and 11.5 per cent unemployed (compared with 7.8 per cent of non-disabled).
In the Netherlands the rise in the number of disability insurance beneficiaries through the late 1960s and 1970s has been linked to economic decline and its variable effects on industry (particularly reducing employment levels in manufacturing and allied industries) and a heightening awareness of disability, injury and occupational health and safety. In the UK people with a disability are more likely to occupy the lower paid segments of the labour force. In Sweden, people with a disability are unskilled workers to a larger extent than non-disabled people, and work in service and operative occupations to a larger extent. Further to this, deregulation of wage-setting during the 1980s in Sweden has been implicated in employers basing wage-setting on their assessment of individual abilities, which they underestimate in the case of workers with disabilities. In Australia, employment does not necessarily reduce the

SOCIO-ECONOMIC DISADVANTAGE AND THE PREVALENCE OF DISABILITY
52
socio-economic disadvantage of people with a disability who are more likely to work in part-time jobs without award conditions.
In the UK, the costs of disability have their greatest impact on people with lower incomes. Policy responses in Australia to the additional costs of disability have fallen short, with evidence that costs continue to outweigh forms of government assistance. Research has shown that the mobility costs of people with severe physical disability and vision impairment were five times the value of the mobility allowance (based on 1990 values). The additional costs of disability further reduce the socio-economic advantage of labour market participation, with about 70 per cent of those receiving support in open employment from services funded by the Disability Services Act requiring assistance with activities of everyday life.
Statistics show that indigenous Australians are severely socio-economically disadvantaged. There are difficulties associated with the identification of indigenous people with disabilities in the national audit of Commonwealth State Disability Agreement (CSDA) services. Subcultural meanings attached to �disability� can confound the measurement of disability prevalence, with an aboriginal identity more central than a disability identity. In 1993, a full census of Aboriginal people usually resident in the Taree area (of NSW) showed that community members were more than twice as likely as non-indigenous Australians to have a disability.
In Australia, the prevalence of disability varies considerably with country of birth, (though it appears this may be an age effect), with the highest prevalence rates among those born in the UK, Ireland and New Zealand and the lowest among those born in Southeast, Northeast and Southern and Central Asia. People from a non-English speaking background are under-represented among consumers of CSDA services (4.6 per cent in Victoria in 1997-98). Those CSDA consumers who were born overseas comprised six per cent (nationally) compared with 22 per cent of the Australian population born overseas. In two USA studies, the prevalence of disability was shown to vary among ethnic groups, with �Blacks� having twice the rate of prevalence of �Whites�.
In Australia and the USA the prevalence of disability varies across age groups, between sexes and in age distribution between the sexes. In Australia, in 1998, male children were significantly more likely than their female age peers, to have a disability. Younger males (15 to 44 years of age) and older males (60 to 79 years of age) were more likely to have a disability.
In Australia, people with a disability (including those with mild, moderate and no activity restriction) were much more likely to have a lower level of educational attainment, with one-tenth of those completing Year 12, one-third of those leaving at age 15 or earlier and almost one half of those who never attended school having a disability. Research has shown that, in 1990, literacy difficulties were a significant employment barrier among Department of Social Security Invalid Pension recipients and that those with post-school qualifications were out of work for shorter periods. In the USA a similar correlation between education and disability was found.
A study conducted in Victoria has found that parents with an intellectual disability are disadvantaged both by their disability, and by an inability to reduce further disadvantage. Studies in the UK and the USA have shown that single parent families
SPRC
53
were more likely to have a child with a disability than dual parent families. One piece of UK research has found that when maternal education and income are controlled for, the differences disappear. A USA study, on the other hand established a high correlation between single parents and children with disabilities, with single parenthood exerting an independent effect on the probability of disability. Further UK studies challenge the idea that disability in young people increases the risk of family break-up or reduces the possibilities of forming new families and have established that men whose partners are women with disabilities are more likely to have a lower status occupation than men whose female partners are non-disabled.
People with a disability living in rural and remote areas in NSW and their families/communities identify a large number of factors (such as transport, employment, education, respite care and accommodation) which lead to greater costs for people with a disability and families with a member with a disability than for those living in metropolitan areas. Research in the UK has examined the relationship between local activist groups and public policy on disability access. It concluded that the absence of national guidelines on accessibility and consultation with people with a disability, the reliance of access groups on the characteristics of individual bureaucrats and the reliance on existing mainstream social, cultural and historical support for marginalised groups in particular locations, determines the characteristics of the access groups and their degree of success. USA research has found a higher prevalence of disability in rural areas in the southern states.
The composition of CSDA disability service consumers by impairment type does not reflect the composition of the general population of people with a disability.
The profile of Disability Support Pension (DSP) recipients differs considerably from those people with a severe or profound disability.
Measurement of the Prevalence of Impairment, Disability and Activity Restriction
Internationally, surveys of people with a disability fall into two categories: those focusing on impairment and disability tend to produce data related to functional limitation; and those focusing on disability and the resulting handicap produce data relating to handicap and restrictions on activity. Concerns with the various approaches used in Australia, raised by practitioners at an Australian Institute of Health and Welfare (AIHW) national workshop on disability measurement in 1994 included:
• over-medicalisation and the focus on �level� of impairment;
• individualisation of disability as a characteristic of the person rather than an effect of physical, social and cultural barriers;
• the tendency to adopt linear models (e.g. disease/ disorder ! impairment ! disability ! handicap);
• little consideration of the impact of limitation/restriction in performing social roles on the production of further disorder or impairment;
SOCIO-ECONOMIC DISADVANTAGE AND THE PREVALENCE OF DISABILITY
54
• the multiplying effects of other socio-demographic factors such as age, gender, race and level of education that are often ignored in assessing �levels� of impairment, disability and handicap; and
• social role disadvantage that is relative and that measurement needs to account for, e.g. socio-economic position (AIHW, 1994).
Walker (1981) reviewed the methods used internationally for establishing the level of financial need of people with a disability within income support arrangements and services (in countries providing social welfare benefits and services). He proposed a disability (rather than impairment-based) model of assessment on the basis of nine activities of self-care and household management, nine activities of social communication and participation and eleven activities for employment capacity.
Walker observed that the contemporary methods used:
• reflected medical opinion about the degree of impairment compared with predetermined percentage bands;
• had changed very little since the early industrial period (industrial development and military experience) and tended to focus on anatomical loss and physical impairment;
• had created inequities between different groups of people with a disability, institutionalising those inequities: i.e. a higher status for those injured at work or in war, differential rates of benefit based on pre-disability earnings or entitlements under work insurance; and
• often excluded people over retirement age.
Obviously other factors can compound the restricting effects of disability. In a survey of Department of Social Security (DSS) benefit recipients about barriers to employment, participants identified their medical condition or health as the main barrier. The others in order were: age, too long out of the work force, skill or education level, employer�s attitude to sickness or disability, lost confidence, no jobs available, reading or writing problems, access to transport, effect of working on pension or benefit, cost of job search, cost of transport, loss of concessions/fringe benefits, other assistance required, other transport issues and child care responsibilities (Jonczyk and Smith, 1990).
First issued by the World Health Organisation (WHO) in 1980, the ICIDH has appeared in 15 languages and its three part structure has been accepted world-wide as providing both a scientific model of disability and the basis for a common language for clinical use, data collection, and research. The three core aspects of the ICIDH are defined as follows.
• �Impairment� is any loss or abnormality of psychological, physiological, or anatomical structure or function.
SPRC
55
• �Disability� is any restriction or lack (resulting from an impairment) of ability to perform an activity in the manner or within the range considered normal for a human being.
• �Handicap� is a disadvantage for a given individual, resulting from an impairment or a disability, that limits or prevents the fulfilment of a role that is normal (depending on the age, sex and social and cultural factors) for that individual. (WHO, 1980 cited in AIHW, 1994)
In response to international calls for its revision WHO began, in 1995, developing ICIDH-2, which it plans to release in 2001. The core concepts of the ICIDH-2 are defined as follows.
• �Body Functions� are the physiological or psychological functions of body systems.
• �Body Structures� are anatomical parts of the body such as organs, limbs and their components.
• �Impairments� are problems in body function or structure as a significant deviation or loss.
• �Activity� is the performance of a task or action by an individual.
• �Activity limitations� are difficulties in performance of activities.
• �Participation� is an individual�s involvement in life situations in relation to health conditions, body functions or structures, activities, and contextual factors.
• �Participation Restrictions� are problems an individual may have in the manner or extent of involvement in life situations.
• �Contextual Factors� are composed of:
• �Environmental Factors�: the physical, social and attitudinal environment in which people live and conduct their lives; and
• �Personal Factors�: features of the individual that are not part of a health condition or functional state. (WHO, 2000)
In 1993, the ABS trialled two questions about disability that were included in a Census Test, conducted in Melbourne. They were checked with follow-up interviews. The findings were that:
• the concept of disability is complex and subjective;
• it does not lend itself to producing reliable data through self-enumeration where there is no interviewer to provide additional information;
• even for those with severe disability, it is difficult to accurately measure this concept using a census methodology; and
SOCIO-ECONOMIC DISADVANTAGE AND THE PREVALENCE OF DISABILITY
56
• given the unreliability of the data it would not be sufficiently accurate to provide usable small area data for small population groups. (Widdowson, 1994)
As noted in AIHW (1999a) the definition of the concepts of disability in the Survey of Disability, Ageing and Carers (SDAC) (1998) were changed to reflect the ICIDH-2. The survey was based on �activity restriction� rather than �handicap�, using five specific restrictions equivalent to the areas of �handicap� used in ABS SDAC 1993: communication, mobility, self care, schooling and employment. It canvassed information on the need for assistance, difficulty, or use of aids or equipment to perform tasks. A person was considered to have a disability if he/she had one of the following, which had lasted or was likely to last for six months or more:
• loss of sight (not corrected by glasses);
• loss of hearing (with difficulty communicating or use of aids);
• loss of speech;
• chronic or recurring pain that restricts everyday activities;
• breathing difficulties that restrict everyday activities;
• blackouts, fits or loss of consciousness;
• difficulty learning or understanding;
• incomplete use of arms or fingers;
• difficulty gripping;
• incomplete use of feet or legs;
• a nervous or emotional condition that restricts everyday activities;
• restriction in physical activities or physical work;
• disfigurement or deformity;
• needing help or supervision because of a mental illness or condition;
• head injury, stroke or other brain damage, with long-term effects that restrict everyday activities;
• treatment for any other long-term condition, and with restriction in everyday activities; or
• any other long-term condition that restricts everyday activities.
Specific restrictions are:
• core activity restrictions; and/or
SPRC
57
• schooling or employment restrictions.
Core activities are:
• self care: bathing or showering, dressing, eating, using the toilet and managing incontinence;
• mobility: moving around at home and away from home; getting into or out of a bed or chair; and using public transport; and
• communication: understanding and being understood by others, strangers, family and friends.
Core activity restriction may be:
• profound: unable to perform a core activity, or always needing assistance;
• severe: sometimes needing assistance to perform a core activity;
• moderate: not needing assistance, but having difficulty performing a core activity; or
• mild: having no difficulty performing a core activity, but using aids or equipment because of disability. (ABS, 1999a)
National and International Evidence of Disability Prevalence and Low Income
Analysis of a 1985-86 UK Office of Population Censuses and Surveys (OPCS) survey of people with a disability living in households showed a strong link between disability and low income. The findings of the research (Martin and White, 1988) were based on weighted estimates of family units with a member with a disability. Apart from providing demographics of people with disability, the census provides financial information. The distribution of family units with a member with a disability across equivalent income deciles for the total population showed that family units with a member with a disability were concentrated in the lower deciles, with almost three-quarters of families with a member with a disability being concentrated in the bottom half of the income distribution.
According to Mirowsky and Nongzhuang Hu (1996), in the USA the effect of income on physical impairment steepens below the 20th percentile of household income, with over half this effect concentrated between the lowest and the sixth percentile. Increases in household income have little impact on the prevalence of physical impairment above the 20th percentile. The authors used two USA data sets, the 1990 USA Survey of Work, Family and Well-Being and the National Survey of Personal Health Practices and Consequences taken over 1979 and 1980, to test five hypotheses about the relationship between disability and low income. Cross-sectional regressions show the relative strengths of these hypothetical factors. The five hypotheses are:
• �basic-needs hypothesis�: higher income predicts lower impairment up to a point where basic needs have been met, but not beyond;
SOCIO-ECONOMIC DISADVANTAGE AND THE PREVALENCE OF DISABILITY
58
• �resource-substitution hypothesis�: education reduces the strength of the association between income and physical impairment such that increments in income have diminishing effects at higher levels of income because of the coinciding higher levels of education;
• �compounding-problems hypothesis�: income reduces the rise of impairment over time and impairment reduces the rise of income over time;
• �status-lifestyle hypothesis�: adjusting for exercise substantially and significantly reduces the non-linear association between income and impairment; and
• �social-background hypothesis�: adjusting for sex, race, marriage and education substantially and significantly reduces the non-linear association between income and impairment.
The authors reached several conclusions.
• Income reduces physical impairment in part because it helps people meet their basic physical needs for food, clothing, shelter and care, which for most USA residents occurs at the 20th percentile of household income (about $20 000 in 1989, the survey being based on 1989 income). Lower income predicts steeper increases in physical impairment over time (lower income predicts increased economic hardship which in turn predicts sharper increases in physical impairment over time).
• Education increases the level of household income and decreases the effect of income on impairment. Income decreases impairment more for people with lower education, and less for people with higher education. Any difference or change in income impacts more greatly on those at the lower end of the socio-economic scale.
• The compounding of economic and health problems contributes to the steep gradient of impairment at the lowest percentiles of income. Physical impairment slows or reverses the rise of income and the decline of economic problems otherwise expected between the ages of 18 and 65. Lower income and greater economic hardship accelerate the rise of impairment, at about the rate of one per cent per year.
• The amount of exercise taken does not account for the concentration of impairment with low income.
In their study, Mirowsky and Nongzhuang Hu (1996) found that shared social precursors account for 33.3 per cent to 59.2 per cent of the cross-sectional correlation between income and physical impairment, with education and gender playing the greatest part. Low education reduces income while sharpening the impact of low income on economic hardship and physical impairment. These effects compound over the life cycle. By slowing the rise of income and speeding the rise of impairment, low education concentrates poverty and disability together.
In another USA study, Holzer III et al. (1996) drew on responses to four items in the Decennial USA Census of Population and Housing, relating to: work limits because
SPRC
59
of disability, inability to work, mobility limits and personal care limitations). Independent variables included type of residence (household, institution or other), urban versus rural farm and non-farm, sex, age, education level, ethnicity and poverty. The sample consisted of about five per cent of the populations of 14 Southern States who completed the long form of the 1990 USA Census.
They found that individuals below the poverty line have much higher prevalence rates of disability than those above it. Work limitations were reported by 49.1 per cent of individuals below the poverty line compared with 10.8 per cent above (poverty rates were not reported for institutional residents). Inability to work was reported by 38.8 per cent of those below the poverty line compared with 6.8 per cent above. Mobility limits were reported by 20.7 per cent of those below the poverty line compared with 3.6 per cent above. Personal care limitations were reported by 19.4 per cent of those below the poverty line compared with 4.3 per cent above.
The interaction of age with poverty demonstrated cumulative and multiplicative effects with those both poor and old reporting work disabilities (50 per cent), mobility limitations (28.0 per cent) and personal care limitations (19.9 per cent).
The research establishes that significant increases in disability are associated with being institutionalised, from a rural area, female, elderly, less educated, black and poor. These effects appear to contribute independently to the overall distribution of disability in the South of the USA.
Further research from the USA (Newacheck, 1998) has established a relationship there between poverty and childhood disability prevalence. It was drawn from a cross-sectional descriptive analysis performed on data from 99 513 children younger than 18 years of age who were included in the 1992-94 (USA) National Health Interview Survey. Among its findings were that the prevalence of disability is higher among those who are living below the poverty line (9.62 per cent for poor children compared with 5.73 per cent for non-poor children). A multivariate analysis of various factors showed that age, sex, family income and family structure exerted an independent effect on the probability of disability.
In Australia, the Henderson Inquiry (Commission of Inquiry into Poverty, 1977) established a link between poverty and disability prevalence. The findings of its commissioned report were:
• the prevalence of poverty among people with a disability varied from country to country according to economic system and the amount of costs that fall on people with a disability and their families;
• loss of income was the primary source of poverty for people with a disability acquired after reaching working age;
• for those with congenital or childhood disabilities, the main source of poverty was the prospect of relying on a pension or low income from work. Costs during childhood mainly fell on parents with little State or Federal Government relief available for the financial burden; and
SOCIO-ECONOMIC DISADVANTAGE AND THE PREVALENCE OF DISABILITY
60
• �secondary poverty� is forced upon people who would otherwise manage, if they did not have high costs to live independently, including medical and hospital costs, equipment, higher transport costs, accommodation costs and modifications, and costs associated with employment.
Of the �sick/invalid� adult income units identified in the Henderson Inquiry, 21.4 per cent were considered very poor or below the poverty line, compared with 2.7 per cent of income units without a disability (Commission of Inquiry into Poverty 1977, cited in Gleeson, 1998).
King (1997) has shown that before housing costs, the link between poverty and disability is now greater. Using the Henderson Inquiry�s disability categories, he estimates that 26.7 per cent of households headed by �sick� or �invalid� persons were in poverty in March 1996, before housing costs, compared with the Henderson Inquiry�s estimate of 21.4 per cent. After housing costs the situation is quite different, with 17.9 per cent in poverty in 1972-73 and 6.2 per cent in poverty in March 1996. King suggests that outright home ownership or public renting would reduce housing costs and therefore, vulnerability to poverty.
King�s study is based on comparisons of two data sets, the 1973 National Survey of Income Costs and Amenities, and the 1990 ABS Survey of Incomes, Housing Costs and Amenities. The 1990 data have been subjected to a �considerable detailed manipulation � to generate an estimated income distribution for March 1996� (King, 1997: 16). King was not able to exactly replicate the Henderson categories. The Henderson Inquiry defined its �sick or invalid� category as �those income units whose head had been out of full-time work for eight weeks or more in the last year with the main reason being sickness, accident or disability� (King, 1997: 4) compared with the 1996 estimates which were defined at a single point of time for those income units whose heads received a sickness allowance, disability support pension or war service disability payment.
Employment and Labour Force Participation
The OPCS in the UK uses a severity of disability scale (based on activity restriction) with 1 as the �least severe� and 10 as the �most severe�. According to Berthoud et al. (1993), based on the 1985-86 survey of people with a disability, employment rates for disabled males, according to the OPCS severity of disability scales, showed that while non-disabled males had an employment rate of 85 per cent, disabled males in severity scales 1 to 2 had an employment rate of 51 per cent, those in scales 3 to 4 had an employment rate 41 per cent, those in 5 to 6 had an employment rate of 27 per cent and those in 7 to 10 a rate of 15 per cent.
Model estimates of employment probability across age groups showed a greater disadvantage with age. Those 25 to 34 year olds in severity scale 1 to 2 had an employment rate of 41 per cent (compared with 77 per cent for non-disabled age peers). Those in the same severity scale 55 to 59 years of age had an employment rate of 24 per cent (compared with 62 per cent for their non-disabled age peers). At the other end of the severity scale, those 25 to 34 year olds in severity scale 7 to 10 had an employment rate of 15 per cent (compared with 85 per cent for their non-disabled age peers) while those in the same severity scale 55 to 59 years of age had an employment
SPRC
61
rate of almost two per cent, compared with 62 per cent for their non-disabled age peers.
The same pattern is evident in the effects of age and severity of disability on women�s employment prospects, though the participation rates are much lower (with a 44 per cent employment rate at the lower severity level and 11 per cent at the higher severity level, compared with non-disabled women�s employment rate of 63 per cent).
A further piece of research was conducted in the UK by Hirst and Baldwin (1994) based on a sample of 409 young people with a disability, identified by the OPCS during the same survey. The research was concerned with issues relating to the childhood/adulthood transition of people with a disability. The control group was matched in age and gender composition and location. Of interest here are demographic comparisons of young people with a disability and a control group:
• 35 per cent of the sample were in paid employment (compared with 67 per cent of the control); and
• people in the sample were more likely to have a household head not in the labour market (22 per cent compared with 15 per cent), possibly because they were more likely to have a female household head (16 per cent compared with 11 per cent).
In Australia, in 1993, the estimated labour participation rate of all people with a disability (including those with mild, moderate or no activity restriction) 15 to 64 years of age was 46.5 per cent compared with 73.6 per cent of the total population. Of those in the labour force 21 per cent were unemployed compared with 11.3 per cent of the national labour force (ABS, 1994).
In 1998, the estimated participation rate for all working age people with a disability (including those with mild, moderate or no activity restriction) was 53.2 per cent compared with 80.1 per cent for non-disabled. The unemployment rate of people with a disability in the labour force was 11.5 per cent compared with 7.8 per cent for the non-disabled. People with a disability made up 31.8 per cent of those not in the work force. Males with a disability had a participation rate of 60.3 per cent compared with 89.2 per cent for non-disabled males. Males with a disability had an unemployment rate of 13.5 per cent compared with that of non-disabled males, 7.7 per cent. Females with a disability had a participation rate of 45.5 per cent compared with 71.0 per cent for non-disabled females. Females with a disability had an unemployment rate of 8.6 per cent compared with that of non-disabled females, 8.0 per cent (ABS, 1999a).
Occupation, Industry and Earnings
In the Netherlands, van den Bosch and Petersen (1982) looked at the sharp increase of the prevalence of disability insurance beneficiaries and its relation to increasing unemployment between 1968 and 1979, at the level of industry sectors. The authors concluded that legal criteria for making awards, and differences in worker health, by sector or industry are not factors in the overall increase. They found that increases can be explained by altered perceptions of �health� across all sectors (with the greater focus on workers� rights to occupational health and safety), and the effects of a deteriorating economic situation that impacts differently across the different sectors of
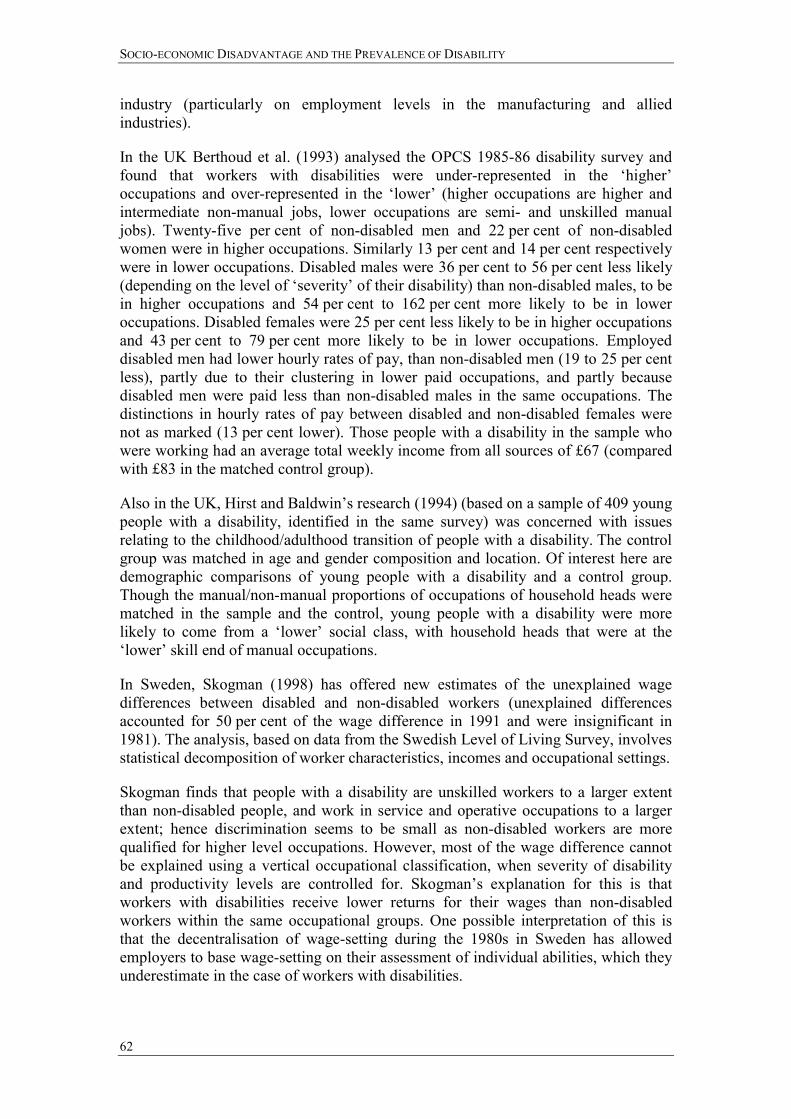
SOCIO-ECONOMIC DISADVANTAGE AND THE PREVALENCE OF DISABILITY
62
industry (particularly on employment levels in the manufacturing and allied industries).
In the UK Berthoud et al. (1993) analysed the OPCS 1985-86 disability survey and found that workers with disabilities were under-represented in the �higher� occupations and over-represented in the �lower� (higher occupations are higher and intermediate non-manual jobs, lower occupations are semi- and unskilled manual jobs). Twenty-five per cent of non-disabled men and 22 per cent of non-disabled women were in higher occupations. Similarly 13 per cent and 14 per cent respectively were in lower occupations. Disabled males were 36 per cent to 56 per cent less likely (depending on the level of �severity� of their disability) than non-disabled males, to be in higher occupations and 54 per cent to 162 per cent more likely to be in lower occupations. Disabled females were 25 per cent less likely to be in higher occupations and 43 per cent to 79 per cent more likely to be in lower occupations. Employed disabled men had lower hourly rates of pay, than non-disabled men (19 to 25 per cent less), partly due to their clustering in lower paid occupations, and partly because disabled men were paid less than non-disabled males in the same occupations. The distinctions in hourly rates of pay between disabled and non-disabled females were not as marked (13 per cent lower). Those people with a disability in the sample who were working had an average total weekly income from all sources of £67 (compared with £83 in the matched control group).
Also in the UK, Hirst and Baldwin�s research (1994) (based on a sample of 409 young people with a disability, identified in the same survey) was concerned with issues relating to the childhood/adulthood transition of people with a disability. The control group was matched in age and gender composition and location. Of interest here are demographic comparisons of young people with a disability and a control group. Though the manual/non-manual proportions of occupations of household heads were matched in the sample and the control, young people with a disability were more likely to come from a �lower� social class, with household heads that were at the �lower� skill end of manual occupations.
In Sweden, Skogman (1998) has offered new estimates of the unexplained wage differences between disabled and non-disabled workers (unexplained differences accounted for 50 per cent of the wage difference in 1991 and were insignificant in 1981). The analysis, based on data from the Swedish Level of Living Survey, involves statistical decomposition of worker characteristics, incomes and occupational settings.
Skogman finds that people with a disability are unskilled workers to a larger extent than non-disabled people, and work in service and operative occupations to a larger extent; hence discrimination seems to be small as non-disabled workers are more qualified for higher level occupations. However, most of the wage difference cannot be explained using a vertical occupational classification, when severity of disability and productivity levels are controlled for. Skogman�s explanation for this is that workers with disabilities receive lower returns for their wages than non-disabled workers within the same occupational groups. One possible interpretation of this is that the decentralisation of wage-setting during the 1980s in Sweden has allowed employers to base wage-setting on their assessment of individual abilities, which they underestimate in the case of workers with disabilities.
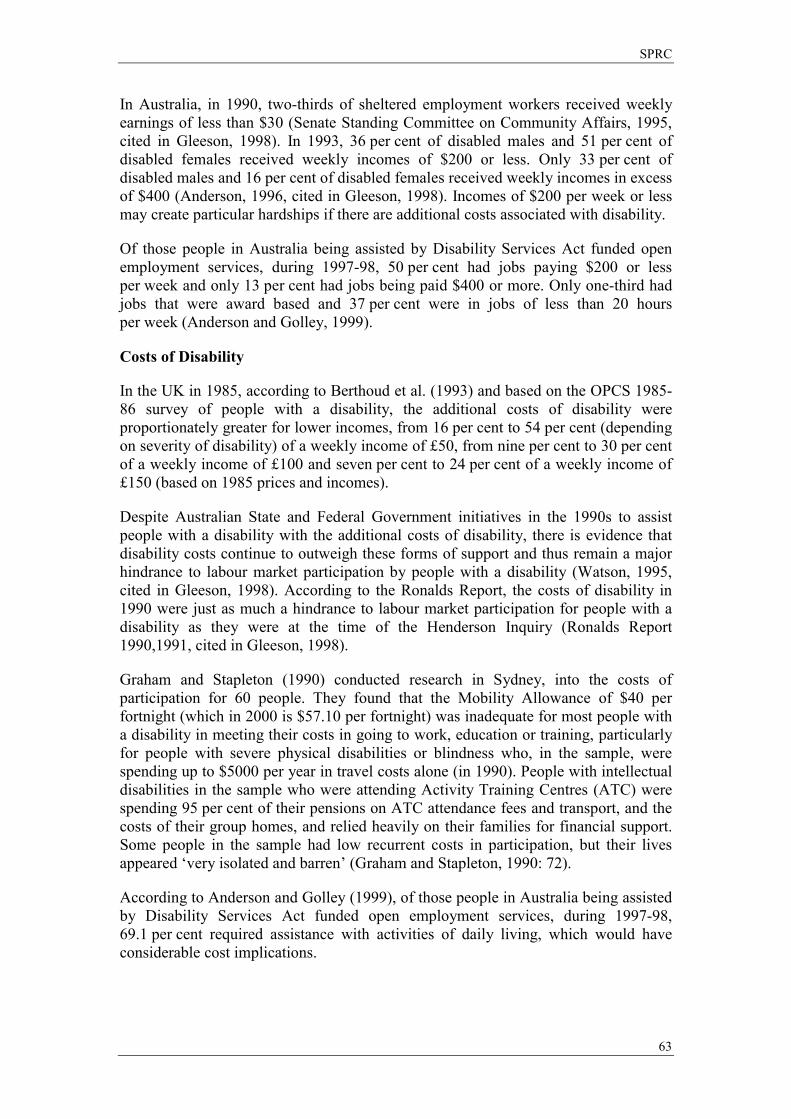
SPRC
63
In Australia, in 1990, two-thirds of sheltered employment workers received weekly earnings of less than $30 (Senate Standing Committee on Community Affairs, 1995, cited in Gleeson, 1998). In 1993, 36 per cent of disabled males and 51 per cent of disabled females received weekly incomes of $200 or less. Only 33 per cent of disabled males and 16 per cent of disabled females received weekly incomes in excess of $400 (Anderson, 1996, cited in Gleeson, 1998). Incomes of $200 per week or less may create particular hardships if there are additional costs associated with disability.
Of those people in Australia being assisted by Disability Services Act funded open employment services, during 1997-98, 50 per cent had jobs paying $200 or less per week and only 13 per cent had jobs being paid $400 or more. Only one-third had jobs that were award based and 37 per cent were in jobs of less than 20 hours per week (Anderson and Golley, 1999).
Costs of Disability
In the UK in 1985, according to Berthoud et al. (1993) and based on the OPCS 1985-86 survey of people with a disability, the additional costs of disability were proportionately greater for lower incomes, from 16 per cent to 54 per cent (depending on severity of disability) of a weekly income of £50, from nine per cent to 30 per cent of a weekly income of £100 and seven per cent to 24 per cent of a weekly income of £150 (based on 1985 prices and incomes).
Despite Australian State and Federal Government initiatives in the 1990s to assist people with a disability with the additional costs of disability, there is evidence that disability costs continue to outweigh these forms of support and thus remain a major hindrance to labour market participation by people with a disability (Watson, 1995, cited in Gleeson, 1998). According to the Ronalds Report, the costs of disability in 1990 were just as much a hindrance to labour market participation for people with a disability as they were at the time of the Henderson Inquiry (Ronalds Report 1990,1991, cited in Gleeson, 1998).
Graham and Stapleton (1990) conducted research in Sydney, into the costs of participation for 60 people. They found that the Mobility Allowance of $40 per fortnight (which in 2000 is $57.10 per fortnight) was inadequate for most people with a disability in meeting their costs in going to work, education or training, particularly for people with severe physical disabilities or blindness who, in the sample, were spending up to $5000 per year in travel costs alone (in 1990). People with intellectual disabilities in the sample who were attending Activity Training Centres (ATC) were spending 95 per cent of their pensions on ATC attendance fees and transport, and the costs of their group homes, and relied heavily on their families for financial support. Some people in the sample had low recurrent costs in participation, but their lives appeared �very isolated and barren� (Graham and Stapleton, 1990: 72).
According to Anderson and Golley (1999), of those people in Australia being assisted by Disability Services Act funded open employment services, during 1997-98, 69.1 per cent required assistance with activities of daily living, which would have considerable cost implications.
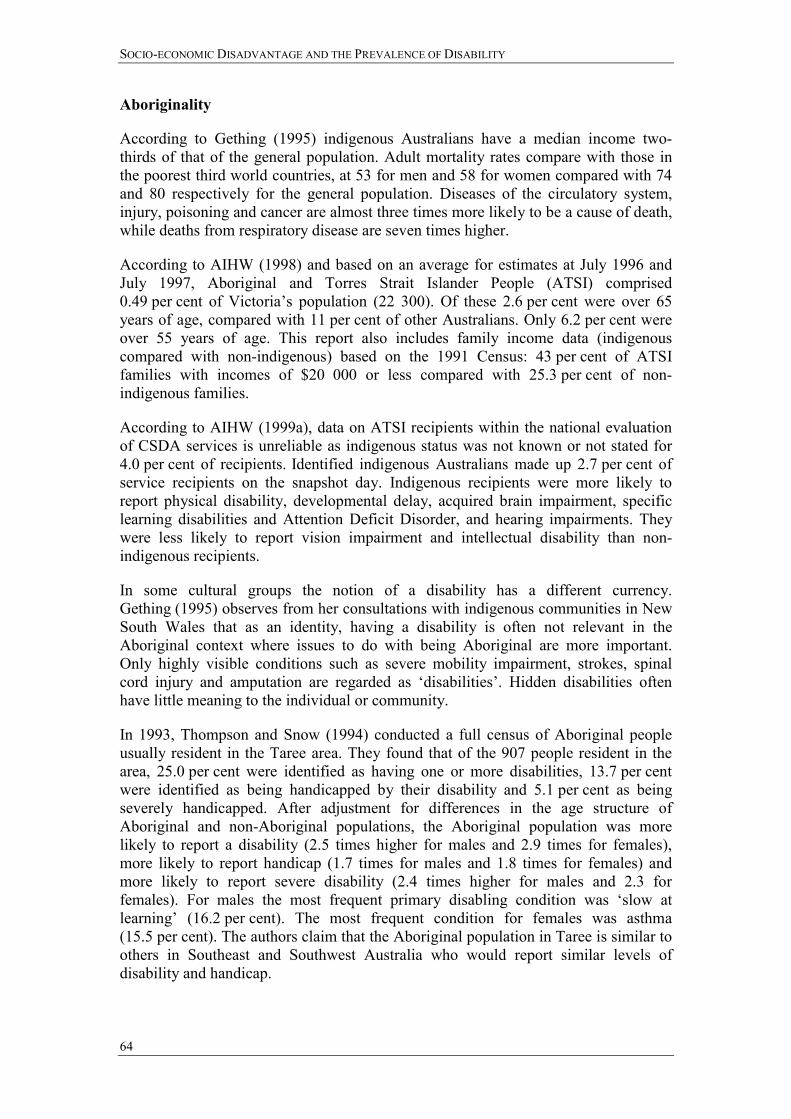
SOCIO-ECONOMIC DISADVANTAGE AND THE PREVALENCE OF DISABILITY
64
Aboriginality
According to Gething (1995) indigenous Australians have a median income two-thirds of that of the general population. Adult mortality rates compare with those in the poorest third world countries, at 53 for men and 58 for women compared with 74 and 80 respectively for the general population. Diseases of the circulatory system, injury, poisoning and cancer are almost three times more likely to be a cause of death, while deaths from respiratory disease are seven times higher.
According to AIHW (1998) and based on an average for estimates at July 1996 and July 1997, Aboriginal and Torres Strait Islander People (ATSI) comprised 0.49 per cent of Victoria�s population (22 300). Of these 2.6 per cent were over 65 years of age, compared with 11 per cent of other Australians. Only 6.2 per cent were over 55 years of age. This report also includes family income data (indigenous compared with non-indigenous) based on the 1991 Census: 43 per cent of ATSI families with incomes of $20 000 or less compared with 25.3 per cent of non-indigenous families.
According to AIHW (1999a), data on ATSI recipients within the national evaluation of CSDA services is unreliable as indigenous status was not known or not stated for 4.0 per cent of recipients. Identified indigenous Australians made up 2.7 per cent of service recipients on the snapshot day. Indigenous recipients were more likely to report physical disability, developmental delay, acquired brain impairment, specific learning disabilities and Attention Deficit Disorder, and hearing impairments. They were less likely to report vision impairment and intellectual disability than non-indigenous recipients.
In some cultural groups the notion of a disability has a different currency. Gething (1995) observes from her consultations with indigenous communities in New South Wales that as an identity, having a disability is often not relevant in the Aboriginal context where issues to do with being Aboriginal are more important. Only highly visible conditions such as severe mobility impairment, strokes, spinal cord injury and amputation are regarded as �disabilities�. Hidden disabilities often have little meaning to the individual or community.
In 1993, Thompson and Snow (1994) conducted a full census of Aboriginal people usually resident in the Taree area. They found that of the 907 people resident in the area, 25.0 per cent were identified as having one or more disabilities, 13.7 per cent were identified as being handicapped by their disability and 5.1 per cent as being severely handicapped. After adjustment for differences in the age structure of Aboriginal and non-Aboriginal populations, the Aboriginal population was more likely to report a disability (2.5 times higher for males and 2.9 times for females), more likely to report handicap (1.7 times for males and 1.8 times for females) and more likely to report severe disability (2.4 times higher for males and 2.3 for females). For males the most frequent primary disabling condition was �slow at learning� (16.2 per cent). The most frequent condition for females was asthma (15.5 per cent). The authors claim that the Aboriginal population in Taree is similar to others in Southeast and Southwest Australia who would report similar levels of disability and handicap.
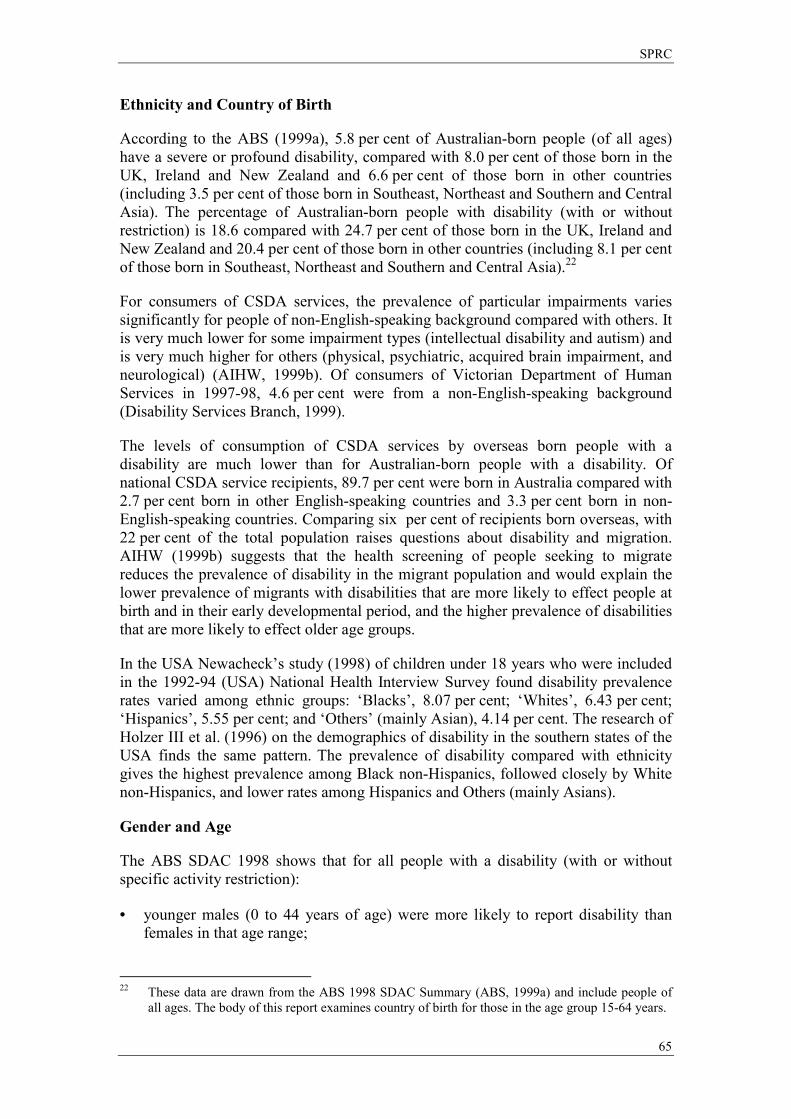
SPRC
65
Ethnicity and Country of Birth
According to the ABS (1999a), 5.8 per cent of Australian-born people (of all ages) have a severe or profound disability, compared with 8.0 per cent of those born in the UK, Ireland and New Zealand and 6.6 per cent of those born in other countries (including 3.5 per cent of those born in Southeast, Northeast and Southern and Central Asia). The percentage of Australian-born people with disability (with or without restriction) is 18.6 compared with 24.7 per cent of those born in the UK, Ireland and New Zealand and 20.4 per cent of those born in other countries (including 8.1 per cent of those born in Southeast, Northeast and Southern and Central Asia).22
For consumers of CSDA services, the prevalence of particular impairments varies significantly for people of non-English-speaking background compared with others. It is very much lower for some impairment types (intellectual disability and autism) and is very much higher for others (physical, psychiatric, acquired brain impairment, and neurological) (AIHW, 1999b). Of consumers of Victorian Department of Human Services in 1997-98, 4.6 per cent were from a non-English-speaking background (Disability Services Branch, 1999).
The levels of consumption of CSDA services by overseas born people with a disability are much lower than for Australian-born people with a disability. Of national CSDA service recipients, 89.7 per cent were born in Australia compared with 2.7 per cent born in other English-speaking countries and 3.3 per cent born in non-English-speaking countries. Comparing six per cent of recipients born overseas, with 22 per cent of the total population raises questions about disability and migration. AIHW (1999b) suggests that the health screening of people seeking to migrate reduces the prevalence of disability in the migrant population and would explain the lower prevalence of migrants with disabilities that are more likely to effect people at birth and in their early developmental period, and the higher prevalence of disabilities that are more likely to effect older age groups.
In the USA Newacheck�s study (1998) of children under 18 years who were included in the 1992-94 (USA) National Health Interview Survey found disability prevalence rates varied among ethnic groups: �Blacks�, 8.07 per cent; �Whites�, 6.43 per cent; �Hispanics�, 5.55 per cent; and �Others� (mainly Asian), 4.14 per cent. The research of Holzer III et al. (1996) on the demographics of disability in the southern states of the USA finds the same pattern. The prevalence of disability compared with ethnicity gives the highest prevalence among Black non-Hispanics, followed closely by White non-Hispanics, and lower rates among Hispanics and Others (mainly Asians).
Gender and Age
The ABS SDAC 1998 shows that for all people with a disability (with or without specific activity restriction):
• younger males (0 to 44 years of age) were more likely to report disability than females in that age range;
22 These data are drawn from the ABS 1998 SDAC Summary (ABS, 1999a) and include people of
all ages. The body of this report examines country of birth for those in the age group 15-64 years.

SOCIO-ECONOMIC DISADVANTAGE AND THE PREVALENCE OF DISABILITY
66
• male children were significantly more likely to report disability (4.6 per cent of 0 to 4 year old males compared with 2.8 per cent of females, and 12.1 per cent of 4 to 14 year old males compared with 6.7 per cent of females);
• males 60 to 79 years of age were more likely to report disability than females; and
• overall, males were slightly more likely to report disability than females (19.6 per cent of males compared with 19.1 per cent of females.
Newacheck�s study (1998) of children under 18 years who were included in the 1992-94 (USA) National Health Interview Survey found that prevalence of disability varied with age. Of those 6 years of age and under 3.32 per cent had a disability. Of those six to 11 years of age, 7.93 per cent had a disability. Of those 12 to 17 yrs of age, 8.43 per cent had a disability. There was a higher prevalence of disability among males (7.58 per cent) than females (5.29 per cent).
The research of Holzer III et al. (1996) on the demographics of disability in the southern states of the USA found that for each category of disability (work limits because of disability, unable to work, mobility limits and personal care limitations), females aged 16 years and over had higher levels reported than males (14.3 per cent, 10.9 per cent, 6.8 per cent and 6.6 per cent compared with males, 14.0 per cent, 8.8 per cent, 4.4 per cent and 5.3 per cent). This is not reflected in Australian data. Age was the largest factor with the prevalence of disability among those aged over 65 years (ten times higher than that for under 24 years).
Education
According to ABS SDAC 1998 Summary Paper, of those who were currently in education, 7.3 per cent had a disability. Of those who finished Year 12, 10.7 per cent were people with a disability; of those who did not complete Year 12, 19.1 per cent were people with a disability, and of those who left school when aged 15 years or less, 35.7 per cent had a disability. Of those who had never attended school, 42 per cent were people with a disability.
Department of Social Security research analysing the barriers to employment facing beneficiaries with a disability, found (in a sample of 642) that:
• difficulties with reading and writing were identified by 35 per cent of those aged under 25 and 27.4 per cent of those aged 25 to 44, as a barrier to employment;
• only 16 per cent of participants had attended the highest level of secondary schooling available. Over half had left school by the time they were 15 years of age. Nineteen per cent had proceeded to complete a post-school qualification, mainly in the trades; and
• those with post-school qualifications had been out of the work force for shorter periods, on average, than those without. (Jonczyk and Smith, 1990)
The research of Holzer III et al. (1996) on the demographics of disability in the southern states of the USA found that the level of education correlates highly with disability. Work limits and inability to work were reported by 24.9 per cent and
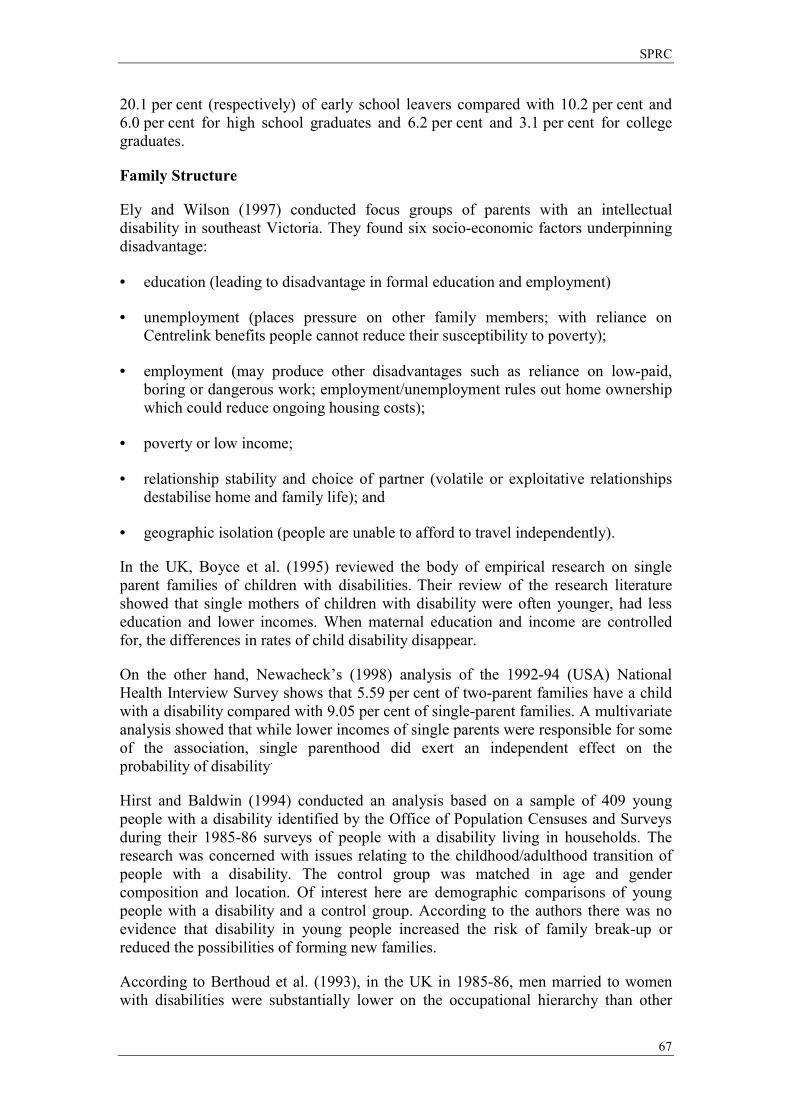
SPRC
67
20.1 per cent (respectively) of early school leavers compared with 10.2 per cent and 6.0 per cent for high school graduates and 6.2 per cent and 3.1 per cent for college graduates.
Family Structure
Ely and Wilson (1997) conducted focus groups of parents with an intellectual disability in southeast Victoria. They found six socio-economic factors underpinning disadvantage:
• education (leading to disadvantage in formal education and employment)
• unemployment (places pressure on other family members; with reliance on Centrelink benefits people cannot reduce their susceptibility to poverty);
• employment (may produce other disadvantages such as reliance on low-paid, boring or dangerous work; employment/unemployment rules out home ownership which could reduce ongoing housing costs);
• poverty or low income;
• relationship stability and choice of partner (volatile or exploitative relationships destabilise home and family life); and
• geographic isolation (people are unable to afford to travel independently).
In the UK, Boyce et al. (1995) reviewed the body of empirical research on single parent families of children with disabilities. Their review of the research literature showed that single mothers of children with disability were often younger, had less education and lower incomes. When maternal education and income are controlled for, the differences in rates of child disability disappear.
On the other hand, Newacheck�s (1998) analysis of the 1992-94 (USA) National Health Interview Survey shows that 5.59 per cent of two-parent families have a child with a disability compared with 9.05 per cent of single-parent families. A multivariate analysis showed that while lower incomes of single parents were responsible for some of the association, single parenthood did exert an independent effect on the probability of disability.
Hirst and Baldwin (1994) conducted an analysis based on a sample of 409 young people with a disability identified by the Office of Population Censuses and Surveys during their 1985-86 surveys of people with a disability living in households. The research was concerned with issues relating to the childhood/adulthood transition of people with a disability. The control group was matched in age and gender composition and location. Of interest here are demographic comparisons of young people with a disability and a control group. According to the authors there was no evidence that disability in young people increased the risk of family break-up or reduced the possibilities of forming new families.
According to Berthoud et al. (1993), in the UK in 1985-86, men married to women with disabilities were substantially lower on the occupational hierarchy than other
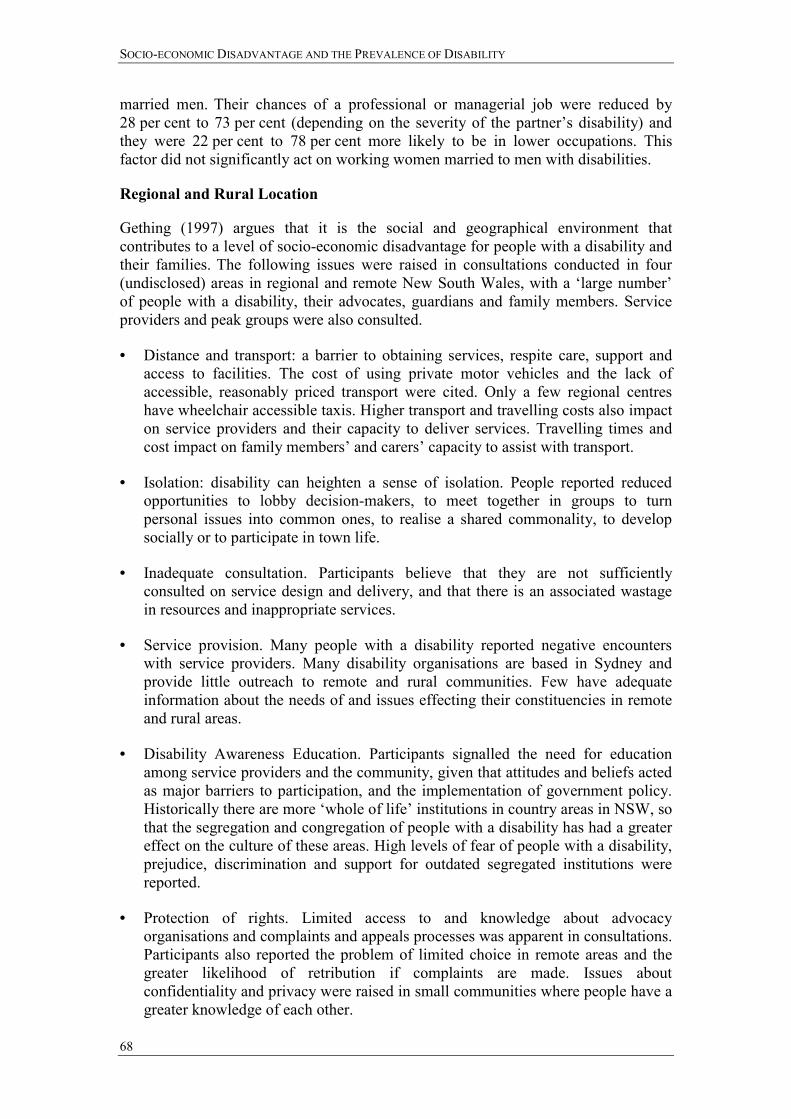
SOCIO-ECONOMIC DISADVANTAGE AND THE PREVALENCE OF DISABILITY
68
married men. Their chances of a professional or managerial job were reduced by 28 per cent to 73 per cent (depending on the severity of the partner�s disability) and they were 22 per cent to 78 per cent more likely to be in lower occupations. This factor did not significantly act on working women married to men with disabilities.
Regional and Rural Location
Gething (1997) argues that it is the social and geographical environment that contributes to a level of socio-economic disadvantage for people with a disability and their families. The following issues were raised in consultations conducted in four (undisclosed) areas in regional and remote New South Wales, with a �large number� of people with a disability, their advocates, guardians and family members. Service providers and peak groups were also consulted.
• Distance and transport: a barrier to obtaining services, respite care, support and access to facilities. The cost of using private motor vehicles and the lack of accessible, reasonably priced transport were cited. Only a few regional centres have wheelchair accessible taxis. Higher transport and travelling costs also impact on service providers and their capacity to deliver services. Travelling times and cost impact on family members� and carers� capacity to assist with transport.
• Isolation: disability can heighten a sense of isolation. People reported reduced opportunities to lobby decision-makers, to meet together in groups to turn personal issues into common ones, to realise a shared commonality, to develop socially or to participate in town life.
• Inadequate consultation. Participants believe that they are not sufficiently consulted on service design and delivery, and that there is an associated wastage in resources and inappropriate services.
• Service provision. Many people with a disability reported negative encounters with service providers. Many disability organisations are based in Sydney and provide little outreach to remote and rural communities. Few have adequate information about the needs of and issues effecting their constituencies in remote and rural areas.
• Disability Awareness Education. Participants signalled the need for education among service providers and the community, given that attitudes and beliefs acted as major barriers to participation, and the implementation of government policy. Historically there are more �whole of life� institutions in country areas in NSW, so that the segregation and congregation of people with a disability has had a greater effect on the culture of these areas. High levels of fear of people with a disability, prejudice, discrimination and support for outdated segregated institutions were reported.
• Protection of rights. Limited access to and knowledge about advocacy organisations and complaints and appeals processes was apparent in consultations. Participants also reported the problem of limited choice in remote areas and the greater likelihood of retribution if complaints are made. Issues about confidentiality and privacy were raised in small communities where people have a greater knowledge of each other.
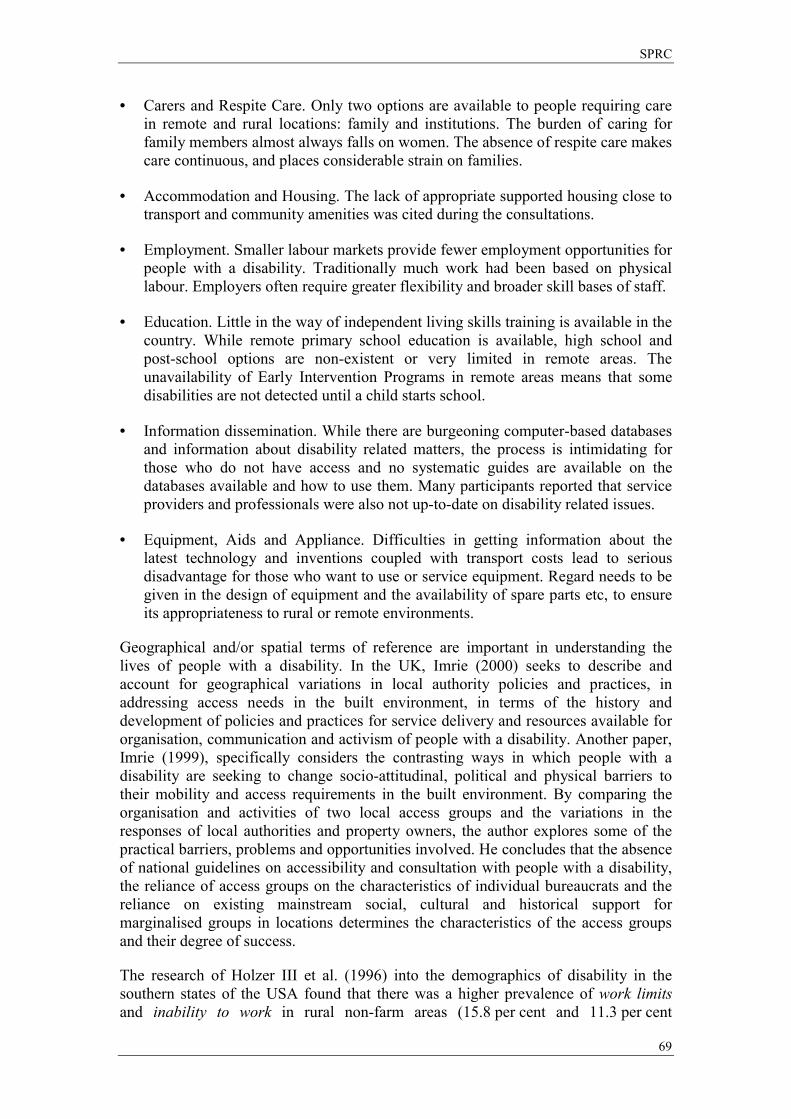
SPRC
69
• Carers and Respite Care. Only two options are available to people requiring care in remote and rural locations: family and institutions. The burden of caring for family members almost always falls on women. The absence of respite care makes care continuous, and places considerable strain on families.
• Accommodation and Housing. The lack of appropriate supported housing close to transport and community amenities was cited during the consultations.
• Employment. Smaller labour markets provide fewer employment opportunities for people with a disability. Traditionally much work had been based on physical labour. Employers often require greater flexibility and broader skill bases of staff.
• Education. Little in the way of independent living skills training is available in the country. While remote primary school education is available, high school and post-school options are non-existent or very limited in remote areas. The unavailability of Early Intervention Programs in remote areas means that some disabilities are not detected until a child starts school.
• Information dissemination. While there are burgeoning computer-based databases and information about disability related matters, the process is intimidating for those who do not have access and no systematic guides are available on the databases available and how to use them. Many participants reported that service providers and professionals were also not up-to-date on disability related issues.
• Equipment, Aids and Appliance. Difficulties in getting information about the latest technology and inventions coupled with transport costs lead to serious disadvantage for those who want to use or service equipment. Regard needs to be given in the design of equipment and the availability of spare parts etc, to ensure its appropriateness to rural or remote environments.
Geographical and/or spatial terms of reference are important in understanding the lives of people with a disability. In the UK, Imrie (2000) seeks to describe and account for geographical variations in local authority policies and practices, in addressing access needs in the built environment, in terms of the history and development of policies and practices for service delivery and resources available for organisation, communication and activism of people with a disability. Another paper, Imrie (1999), specifically considers the contrasting ways in which people with a disability are seeking to change socio-attitudinal, political and physical barriers to their mobility and access requirements in the built environment. By comparing the organisation and activities of two local access groups and the variations in the responses of local authorities and property owners, the author explores some of the practical barriers, problems and opportunities involved. He concludes that the absence of national guidelines on accessibility and consultation with people with a disability, the reliance of access groups on the characteristics of individual bureaucrats and the reliance on existing mainstream social, cultural and historical support for marginalised groups in locations determines the characteristics of the access groups and their degree of success.
The research of Holzer III et al. (1996) into the demographics of disability in the southern states of the USA found that there was a higher prevalence of work limits and inability to work in rural non-farm areas (15.8 per cent and 11.3 per cent
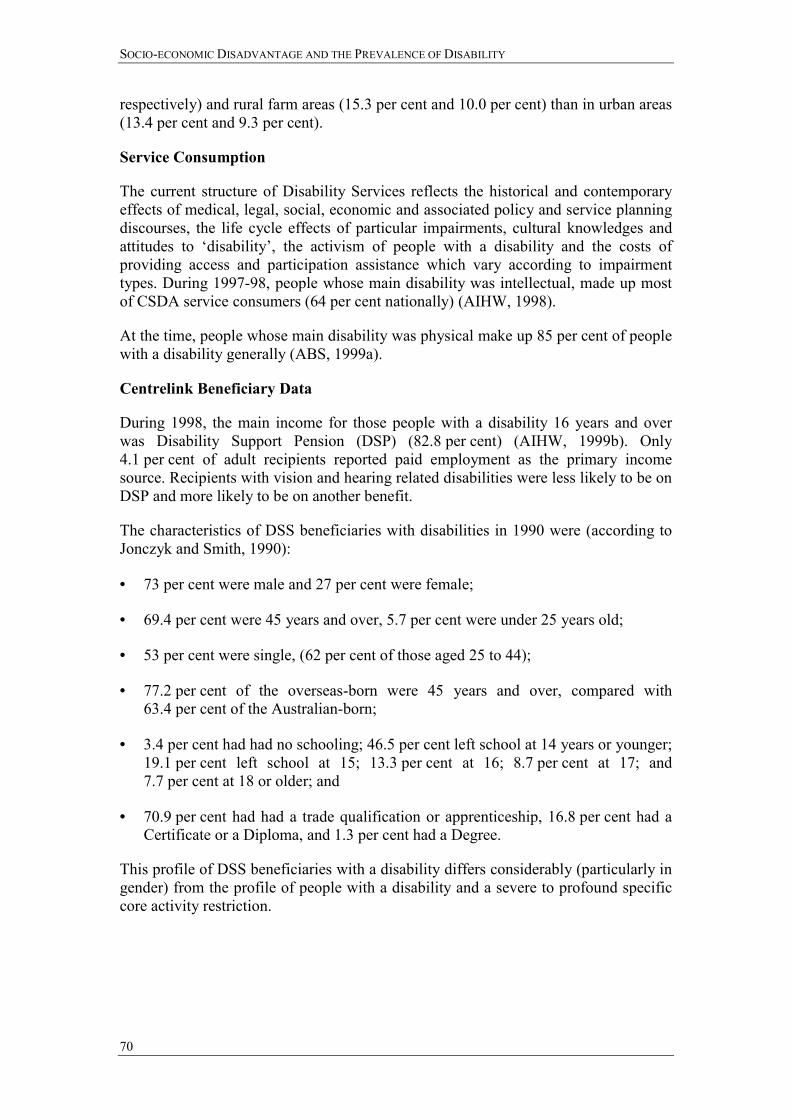
SOCIO-ECONOMIC DISADVANTAGE AND THE PREVALENCE OF DISABILITY
70
respectively) and rural farm areas (15.3 per cent and 10.0 per cent) than in urban areas (13.4 per cent and 9.3 per cent).
Service Consumption
The current structure of Disability Services reflects the historical and contemporary effects of medical, legal, social, economic and associated policy and service planning discourses, the life cycle effects of particular impairments, cultural knowledges and attitudes to �disability�, the activism of people with a disability and the costs of providing access and participation assistance which vary according to impairment types. During 1997-98, people whose main disability was intellectual, made up most of CSDA service consumers (64 per cent nationally) (AIHW, 1998).
At the time, people whose main disability was physical make up 85 per cent of people with a disability generally (ABS, 1999a).
Centrelink Beneficiary Data
During 1998, the main income for those people with a disability 16 years and over was Disability Support Pension (DSP) (82.8 per cent) (AIHW, 1999b). Only 4.1 per cent of adult recipients reported paid employment as the primary income source. Recipients with vision and hearing related disabilities were less likely to be on DSP and more likely to be on another benefit.
The characteristics of DSS beneficiaries with disabilities in 1990 were (according to Jonczyk and Smith, 1990):
• 73 per cent were male and 27 per cent were female;
• 69.4 per cent were 45 years and over, 5.7 per cent were under 25 years old;
• 53 per cent were single, (62 per cent of those aged 25 to 44);
• 77.2 per cent of the overseas-born were 45 years and over, compared with 63.4 per cent of the Australian-born;
• 3.4 per cent had had no schooling; 46.5 per cent left school at 14 years or younger; 19.1 per cent left school at 15; 13.3 per cent at 16; 8.7 per cent at 17; and 7.7 per cent at 18 or older; and
• 70.9 per cent had had a trade qualification or apprenticeship, 16.8 per cent had a Certificate or a Diploma, and 1.3 per cent had a Degree.
This profile of DSS beneficiaries with a disability differs considerably (particularly in gender) from the profile of people with a disability and a severe to profound specific core activity restriction.
SPRC
71
7 References
Anderson, I. (1996), The Status of Women with Disabilities in Australia: A Collection of National Statistics for Australia, unpublished report prepared for Women with Disabilities Australia, Canberra.
Anderson, P. and L. Golley (1999), Open Employment Services for People with Disabilities, Australian Institute of Health and Welfare, Canberra.
Australian Bureau of Statistics (ABS) (1994), Disability, Ageing and Carers: Summary of Findings, (1993 Survey), Catalogue No. 4430.0, ABS, Canberra.
Australian Bureau of Statistics (ABS) (1998), 1996 Census of Population and Housing: Socio-Economic Indexes for Areas (Information paper), Catalogue No. 2039.0, ABS, Canberra.
Australian Bureau of Statistics (ABS) (1999a), Disability, Ageing and Carers: Summary of Findings, (1998 Survey), Catalogue No. 4430.0, ABS, Canberra.
Australian Bureau of Statistics (ABS) (1999b), Disability, Ageing and Carers: Summary Tables Victoria, (1998 Survey), Product No. 4430.2.40.001, ABS, Canberra.
Australian Bureau of Statistics (ABS) (1999c), Technical Paper: Survey of Disability Ageing and Carers, Australia, Confidentialised Unit Record File, ABS, Canberra.
Australian Institute of Health and Welfare (1994), Measurement of Disability, Workshop Proceedings, 21-22, February, AGPS, Canberra.
Australian Institute of Health and Welfare (1998), Expenditure on Health Services for Aboriginal and Torres Strait Islander People, AIHW, Canberra.
Australian Institute of Health and Welfare, (1999a), Australia�s Welfare 1999: Services and Assistance, Chapter 7, Canberra, 214-69.
Australian Institute of Health and Welfare (1999b), Disability Support Services Provided Under the Commonwealth / State Disability Agreement: National Data 1998, Canberra.
Berthoud, R., J. Lakey and S. McKay (1993), The Economic Problems of Disabled People, Policy Studies Institute, London.
Boyce, G., B. Miller, K. White and M. Godfrey (1995), �Single parenting in families of children with disabilities�, Marriage and Family Review, 20 (3/4), Haworth Press.
Commission of Inquiry into Poverty (1977), The Relationship between Poverty and Disability in Australia, Social/Medical Aspects of Poverty Series, Canberra.
DisAbility Services Branch (1999), Victorian Services for People with Disabilities 1998: Disability Support Services Provided under the Commonwealth/State Disability Agreement, Department of Human Services, State Government of Victoria, Annual Report, November, Melbourne, Victoria.
Ely, E. and C. Wilson (1997), Setting Up for Success, Service Provision for Parents who have an Intellectual Disability, South East Resource Action Centre Inc, Melbourne.
SOCIO-ECONOMIC DISADVANTAGE AND THE PREVALENCE OF DISABILITY
72
Fine, M., S. Graham and A. Webb (1991), Benchmarks and Other Approaches to Planning Community Support Services: A Review of International Experience, SPRC Reports and Proceedings No. 94, Social Policy Research Centre, University of New South Wales, Sydney.
Gething, L. (1995), �A case study of Australian Aboriginal people with disabilities�, Australian Disability Review, 2, 77-88.
Gething, L. (1997), �Sources of double disadvantage for people with disabilities living in remote and rural areas of New South Wales, Australia�, Disability and Society, 12 (4), 413-531.
Gleeson, B. (1998), �Disability and poverty�, in R. Fincher and J. Nieuwenhuysen, eds, Australian Poverty: Then and Now, Melbourne University Press.
Graham, S. and C. Stapleton (1990), �The extra costs of disability�, in P. Saunders, ed., Social Policy in Australia: What Future for the Welfare State, SPRC Reports and Proceedings, No.80, Social Policy Research Centre, University of New South Wales, Sydney, 103-112.
Hirst, M. and S. Baldwin (1994), Unequal Opportunities � Growing up Disabled, Social Policy Research Unit, University of York.
Holzer III, C., H.T. Nguyen, H. F. Goldsmith and W. Thompson (1996), �Demographics of disability in the South�, Community Mental Health Journal, 32 (8), 431-43, Human Sciences Press, New York.
Imrie, R. (1999), �The role of access groups in facilitating accessible environments for disabled people�, Disability and Society, 14(4), 463-82.
Imrie, R. (2000), �Disabling environments and the geography of access policies and practices�, Disability and Society, 15(1), 5-24.
Jonczyk, J. and T. Smith (1990), Crossing the Barriers: A Survey of the Barriers to Employment for DSS Clients with Disabilities, Policy Research Paper No. 58, Department of Social Security, Canberra.
King, A. (1997), The Changing Face of Australian Poverty: A Comparison of 1996 Estimates and the 1972-73 Findings from the Commission of Inquiry, Discussion Paper No.23, National Centre for Social, Economic and Economic Modelling, University of Canberra.
Martin, J. and A. White (1988), OPCS Surveys of Disability in Great Britain, Report No. 2, The Financial Circumstances of Disabled Adults Living in Private Households, Office of Population Censuses and Surveys, Social Survey Division, London.
Mirowsky, J. and P. Nongzhuang Hu (1996), �Physical impairment and the diminishing effects of income�, Social Forces, 74(3), 1073-96.
Newacheck, P. (1998), �Prevalence and impact of disabling chronic conditions in childhood�, American Journal of Public Health, 88(4), 610-17.
Public Health Information Development Unit (PHIDU) (2000), A Social Health Atlas of Australia, 2nd Edition: Volume 3, Victoria, (Accessed on 9/6/2000 at http://www.publichealth.gov.au/phidu.htm), University of Adelaide.

SPRC
73
Senate Standing Committee on Community Affairs (1995), Employment for People with Disabilities, Senate Standing Committee on Community Affairs Secretariat, Canberra.
Ronalds, C. (1990), National Employment Initiatives for People with Disabilities - A Discussion Paper, AGPS, Canberra.
Ronalds, C. (1991), Report of the National Consultations with People with Disabilities, AGPS, Canberra.
Skogman, P. (1998), Occupational Attainment and Earnings for Disabled Workers, Working Paper 3/1998, Institutet för Social Forskning, Stockholms Universitet.
Thomson, N. and C. Snow (1994), Disability and Handicap Among Aborigines of the Taree Area of New South Wales, No. 9, Aboriginal and Torres Strait Islander Health Services, AGPS, Canberra.
van den Bosch, F.A.J. and C. Petersen (1982), �Incidence of disability by sector of industry: an explanation�, International Social Security Review, 82(2), 196-204.
Walker, A. (1981), �Assessing the severity of disability for the allocation of benefits and services�, International Social Security Review, 81(3), 274-91.
Watson, J.W. (1995), �We do without�: A Report about the Costs of Having a Disability, unpublished mimeograph, Shadow Minister for Disability Services (WA), Perth.
Widdowson, J. (1994), Disability Census Test: November 1993, Census Working Paper No. 94/3, Australian Bureau of Statistics, Canberra.
World Health Organisation (WHO) (2000), The International Classification of Functioning and Disability (ICIDH-2), (Accessed on 20/6/2000 at http://www.who.int/whosis/icidh/index.html ), WHO, Geneva.