Embed Size (px)
Citation preview

Disaster Prevention through a harmonized Framework for High
Reliability Organisations
Agwu Emele Agwua*, Ashraf Labiba, Sara Hadleigh-Dunnb,
*Corresponding author: [email protected], Tel: +1-780-205-2376
a Department of Operations and Systems Management, Faculty of Business and Law, University of Portsmouth,
Portland Building, P01 3DE, United Kingdom
b Strategy Enterprise and Innovation, Faculty of Business and Law, University of Portsmouth, Richmond
Building, P01 3DE, United Kingdom
Abstract
The increasing havoc wrecked by catastrophic incidents on organisations worldwide, as well as the increasing
devastating effects of these incidents, has necessitated the development of a framework to improve the
reliability of organisations. Despite operating in tightly coupled and complex technologies, high reliability
organisations (HROs) continue to operate mindfully with minimal incidents. Given that most disasters have
occurred in organisations and industries not considered as truly HROs, this paper argues that applying
organisational learning from HROs across diverse organisations in different industries could potentially reduce
organisational disasters. This paper recognised the numerous researches in HRO theory, but noticed the
unavailability of a harmonized measurable framework that could be standardized and applied across diverse
organisations. Using the HRO principles, this paper conducted a research in 8 organisations, in 3 industries
across 2 continents. It developed the organisational reliability maturity model (ORM2) to track the progression
organisations through 5 maturity levels. It developed the framework for organisational reliability maturity
(FORM) to measure maturity levels of organisations, predict potentials for disasters, benchmark, and
improvement organisations. It is hoped that this paper will deepen existing research in disaster prevention and
HRO theory, while opening up new areas of knowledge.
Keywords: Disasters, Organisational Learning, High Reliability Organisations, Maturity, Benchmarking,
Organisational Improvement, Framework

1. Introduction
The old English saying “don’t spoil the ship for a ha'p'orth of tar”, which means that one should not risk the
failure of a large project by trying to make savings on trivial things, suggests that catastrophic failures could be
prevented by implementing minor but timely activities. Studies have shown that most catastrophic failures have
been caused by series of seemingly minor and retrospectively avoidable individual and organisational
behaviours (Labib & Read, 2013; 2015; Labib, 2014; Savioja et al, 2014; Waring, 2015; Harvey et al, 2016; Li,
2016). Despite operating with complex technologies in highly hazardous environments, and with tightly coupled
processes, where minor failures could result in catastrophes, certain organisations continue to operate with
nearly error free and harm free performance. They continuously avoid failures, or operate such that failures do
not result in catastrophe. Should catastrophic failures eventually occur, these organisations are able to withstand
the consequences. Weick & Sutcliffe, (2007; 2015) referred to them as High Reliability Organisations (HROs).
Given the continuously remarkable safety records, these highly reliable organisations are therefore highly safer
organisations.
Research into organisational reliability has been conducted in a number of industries. These have included
transportation, aviation and military (Roberts et al, 1994; La Porte & Consolini, 1998; Busby, 2006; Jeffcott et
al, 2006; O’Neil, 2011); nuclear (Bierly & Spender, 1995; Ashley et al, 2009); fire and disasters (Keller, 2004;
Weick & Sutcliffe, 2007; Berardi, 2010); and healthcare (Baker et al, 2006; Frankel et al 2006; Madsen et al,
2006; Roberts et al 2005; Stralen et al 2006; Tamuz & Harrison, 2006; Vogus & Sutcliffe, 2007a; Costella et al,
2009; Riley, 2009; Samuels, 2010; Sutcliffe, 2011; Hales & Chakravorty, 2016). There have also been some
HRO research with respect to space (Schulman, 2008); energy (Hoffmann et al, 1995; Miller, 2009; Hopkins,
2009; Lekka & Sugden, 2011); education (Stringfield, 1995; Taylor & Angelle, 2000; Azzaro, 2005; Bellamy et
al, 2005; Stringfield et al, 2008); food retail (Ciravenga & Brenes, 2016); Information technology ( Valorinta,
2009; Carlo et al, 2012) and virtual organisations (Grabowski & Roberts, 2016). Some have aimed at the
relationship with other concepts such as resilience engineering (Aven & Krohn, 2014; Righi et al, 2015;
Bergstrom et al, 2015; Haavik et al, 2016; Harvey et al, 2016; Le Coze, 2016) and safety (Vogus & Sutcliffe,
2007a; Vogus & Sutcliffe, 2007b; Ausserhofer et al, 2013; Vogus et al, 2014; Vogus & Iacobucci, 2016). There
is no evidence of a research conducted across different types of organisations at the same time to test the theory,
demonstrate how it could be progressively achieved. Such research would not only provide a balanced
perspective about the HRO theory, but would also show the extent to which the theory could be standardized

across organisations with diverse characteristics. Furthermore, HRO researches have been mostly reactive.
While some have studied how the HRO theory could have helped avoid catastrophic events retrospectively,
others have mostly studied the HROs with the view to understanding behaviours make them reliable – the end
point. This research is more interested in the “journey” than the “end point” - it is more interested in how
organisations could become reliable.
This paper expands the HRO study to different and diverse organisations at the same time horizon using the
same methodology in an attempt to obtain a balanced data. It tries to demonstrate that organisations could make
progressive improvements over time as they tend towards higher reliability. To achieve this, there must be a
means to measure the expected behaviours from HROs, assess the extent to which organisations exhibit these
behaviours, as well as a framework that guides the organisation towards becoming HROs. Zietsma et al (2002)
had identified the four feed-forward learning process as means for organisations to learn in the face of
considerable external changes. Tsoukas & Mylonopoulos (2004) focused on the processes, practices and
strategies through which knowledge is constructed and created in organisations. While these are important
aspects towards achieving reliability, they do not specify simplified step wise approaches for adoption. Weick
et al (2008) acknowledges the need for a roadmap for HRO implementation. Hales & Chakravorty (2015)
attempted to “articulate” these and “show how to systematically implement HROs using a soft research methods
approach moderated with mindfulness”. This purely qualitative work involved a close collaboration between the
researchers and the different people within a hospital on issues of organisational reliability, as well as training
and mentoring. It does not however answer some basic question: How do we measure the reliability of the
organisation? At what point does the organisation move from being reliable to not being reliable or vice versa?
How do we compare the reliability of different organisations? How do we measure which organisation to apply
these systematic processes to? These could be achieved through a staged maturity framework.
Chassin & Loeb (2011; 2013) had developed a staged maturity model to guide organisations towards the path of
higher reliability (Sullivan et al, 2016). This had focused on the organisational characteristics of leadership,
safety culture and process improvement, mapped in three maturity stages of minimal, developing and
approaching reliability. They rightly recommended organisational self-assessment as an important first step.
While this is very detailed within the context it addresses, the model focuses narrowly on a healthcare
organisation with no clear path to expand to different industries. Furthermore, they focused narrowly on the

three dimensions of leadership, safety culture and process improvement. While these are worthy characteristics,
organisational mindfulness goes beyond leadership and safety culture. It is concerned with a focus on a ‘clear
and detailed comprehension of emerging threats, and on factors that interfere with such comprehension’ (Weick
& Sutcliffe, 2007). It is organisational consciousness characterized by ‘being (1) situated in the present, (2)
sensitive to context and perspectives, (3) guided (but not governed) by rules and routines’ (Langer, 2014).
Mindfulness ensures everyone, not just leadership, works and communicates collectively with a common
purpose to focus on what really matters based on current situational realities (Sutcliffe et al, 2016; Agwu, 2018).
Organisational mindfulness comprises of five interrelated behaviours at multiple organisational levels:
preoccupation with failure, reluctance to simplify, sensitivity to operations, commitment to resilience, and
deference to expertise (Weick & Sutcliffe, 2015). Developing the model in line with these five interrelated
behaviours at multiple organisational levels would therefore make more sense. It would enhance the
identification of expected behaviours at different maturity levels for each of the five mindfulness principles,
making it easy to actualize the organisational self-assessment goal identified by Chassin & Loeb (2011; 2013),
and develop improvement plan.
The paper therefore developed the Organisational Reliability Maturity Model (ORM2) as a five stage maturity
model that maps organisations into various stages of organisational reliability. It further developed the
Framework for Organisational Reliability Maturity (FORM), a framework that leverages on the Organisational
Reliability Maturity Model (ORM2) to develop a stepwise organisational reliability learning and improvement
process. The research behind this paper was conducted in eight organisations purposively selected from three
industries between July 2016 and January 2017, using the same research methods. The next section will further
discuss some related concepts such as disasters, HROs and organisational learning. Section three will describe
the data collection and analysis process, and the results. Section four will describe the proposed maturity model
and measurement framework for organisational reliability maturity, while section five will describe the various
applications of the measurement framework. Section six shall conclude paper.

2.0 Disasters, HROs and Organisational Learning
2.1 Disasters
Labib & Read (2015) considered disasters as black swans with the distinct attributes of rarity, extreme impact,
and retrospective predictability. Within the late twentieth and the twenty first centuries, the incidence of
disasters has accelerated. This is due in part to the increasing complexity of the world and its technologies
(Taleb, 2010), increasing populations and environmental changes (Rougier et al, 2010), and increasing
stakeholder demands. A trend of these safety incidents over the years ties the causative factors to mostly
organisational and individual errors. Reviews of the 1912 Titanic disaster that killed an estimated 1514
passengers and crew, considered management decisions and other human factors as key causative factors (Labib
& Read, 2013). The March 2005 BP Texas city disaster led to 15 fatalities, injured 170 people, and resulted in
damages worth hundreds of millions of dollars (Labib & Read, 2013). Again, management decisions and
employees’ actions and inactions were considered to be the major causative factors. Similarly, management
decisions were among the contributory factors to the April 1986 Chernobyl nuclear disaster in Ukraine (INSAG,
1992), NASA’s Columbia’s incident of 2003 (Labib & Read, 2013); the 2010 BP Deep water horizon incident;
(Labib, 2014); the Rio-Paris Flight 447 (Moura et al, 2016), the 2011 Fukushima nuclear disaster (Labib &
Harris, 2015), and the 2000 Concorde crash (Labib, 2014) all share similar characteristics of the significance of
management and people related retrospectively avoidable causative factors. In some cases, the organisations
involved could not recover from the social and financial impact of these disasters. In some other cases, the
organisations were resilient and withstood the financial and social impact and evolved to become stronger and
more competitive organisations. This paper hopes to tap from the understanding of the differences between
these organisations to develop a harmonized framework for organisational reliability.
A lot of organisations and industries could certainly benefit from HRO theory implementation. Hudson (2007)
described the need to oil and gas organisations highly reliable. This is more imperative given the frequency and
severity of incidents within the industry over the last few decades. Although the work by Hudson (2007) stayed
more within the ambits of safety, it however set the stage for a more robust HRO implementation for oil and gas
organisations. The work developed a staged maturity model that tracks the safety culture of organisations
through five maturity levels: ‘pathological’, reactive, ‘calculative’, ‘proactive’, and ‘generative’. Alothman
(2016) used two analytical paradigms – the quantitative scales audit and the qualitative template analysis to
assess the organisational reliability of an oil and gas organisation.

The manufacturing cluster is often overlooked by the HRO researchers despite the potential for disasters. Since
the Lawrence Massachusetts Pemberton Mill disaster in January 10 1960 that resulted in 145 fatalities and 166
serious injuries, the manufacturing industry has continued to witness catastrophic incidents. Between September
2012 and April 2013 (table 1), recorded industrial disasters contributed to over 1530 mostly retrospectively
avoidable loss of lives, potentially preventable through mindfulness.
Table 1: List of Industrial Disasters
In most of these disasters the “ha'p'orth of tar” was neglected, and in other cases, the acceptable behaviours
changed and perceptions of ‘norm’ shifted. Food contamination could also be another major source of disasters
and history is rife with such incidents with multiple fatalities. 732 people were infected with E.coli in 1993
when Jack in the Box restaurant served infected burger across 73 locations in the United States (Schlosser,
2001; Nestle, 2010). 4 children died, and 178 people were left with permanent damage. E.coli outbreak has
affected so many other major restaurant chains including KFC, McDonald’s, Sizzler, Wendy’s, and Taco Bell
all with catastrophic consequences. Burger King was forced to recall 25 million pounds of beef from 650
locations in 1997 after E. coli contamination got 16 customers sick (Janofsky, 1997). In 2003, 640 people were
affected and 4 died in Pennsylvania, USA, when tainted tomatoes at Chi-Chi’s restaurant caused a hepatitis A
outbreak. The reputation of the organisation never recovered. The reputation of Chipotle took a major hit in
Date Incident Location Effect
January 10. 1860 Pemberton Mill Factory Collapse
Lawrence,
Massachusetts, USA 154 Fatalities, 166 injuries
March 20. 1905 Shoe factory explosion
Brockton, Massachusetts,
USA 58 Fatalities, 150 Injuries
March 25. 1911 Triangle Shirtwaist Factory fire New York City, USA Over 100 Fatalities
Nov 23. 1984 MESIT Factory Collapse Czechoslovakia 18 Fatalities, 43 Injuries
May 4. 1988 PEPCON Chemical Explosion Nevada, USA 2 Fatalities, Over 300 Injuries
May 10. 1992 Kader Toy Factory Fire Thailand 188 Fatalities, Multiple Injuries
May 13. 2000 Enscede Fireworks Depot Disaster Enscede, The Netherlands
24 Fatalities, 947 injuries, 1500
homes destroyed, Over US$300
million insured losses
Nov 3. 2004 Seest Fireworks factory Disaster Kolding, Denmark
1 fatality, 24 Injuries, 2107
buildings destroyed, about 100
million Euros insured damage
Dec 6. 2006 Falk Gear Factory Explosion Milwaukee, Wisconsin
3 fatalities, 47 Injuries, Multiple
building damages.
April 18. 2007 Qinghe Steel Factory Disaster China 32 Fatalities, multiplr injuries
Feb 1. 2008 Fireworks Fire Disaster Istanbul, Turkey 22 Fatalities, over 100 Injuries
Sept 11. 2012 Ali Garments Factory Explosion Karachi, Pakistan 289 Fatalities, Multiple Injuries
Nov 24. 2012 Tasreen Factory Disaster Dhaka, Bangladesh 112 Fatalities, Multiple Injuries
April 24. 2013 Savar Factory Disaster Dhaka, Bangladesh 1,129 Fatalities, Multiple Injuries

2015, when an affected almost 500 customers across 14 states of America (Carr, 2016). 43 restaurants were
closed, the stock shrunk by 30%, and nearly one-third of the sales disappeared. This paper posits that these
disasters could have been avoided had these organisations taken steps towards improving their mindfulness by
adopting the principles of high reliability organisations.
2.2 High Reliability Organisation (HRO) Theory
Perrow (1984), had described the inevitability of accidents in complex organisations with the argument that no
matter how well a system is managed, accidents are inevitable, as long as the system is characterised by
complexity and tight coupling.The HRO researchers countered this with the argument that some organizations,
despite complex technologies and tightly coupled processes, have consistently prevented and contained
catastrophic failures (Roberts, 1990; LaPorte & Consolini, 1998) by creating and reinforcing certain behaviours
(Weick & Roberts, 1993). Since the first research in the 1980s, different researchers have studied HROs from
different theoretical lenses. Despite their diverse views, their point of commonality considers HROs as nearly
error free and harms free organizations (Vogus & Welbourne, 2003). Weick & Sutcliffe (2001; 2007; 2015)
developed five behaviours that enhance the reliability of an organisation. The first three deal with the capacity
of the organisations to anticipate unexpected problems. These are preoccupation with failure, reluctance to
simplify, and sensitivity to operations.
Preoccupation with failure is a characteristic of HROs that enables them to actively seek for signals within their
systems that could indicate a potential for failure. They continuously learn and improve and consider near
misses as progressive cautions that drive proactive and pre-emptive analyses of possible vulnerabilities
(Sutcliffe, 2011). They avoid being reactive with failures, rather continuously focus on potential points of failure
through management and organisational cultural progressions (Hales & Chakravorty, 2016). Key preoccupation
behaviours of observing, reporting and documenting near misses and incidents are key steps to eliminate or
reduce the incubation period in Turner’s man-made disaster model (Turner, 1978). The lookouts in Titanic had
noticed some haze within the horizon ahead of them but failed to report (Barratt, 2010), thus lack of
preoccupation ended up being one of the reasons for the Titanic disaster.
Reluctance to simplify shows how organisations continuously balance simplification and standardization of
processes, with undue generalisations. They have standardized processes, yet actively seek divergent viewpoints
that question received wisdom, uncover blind spots and detect changing demands (Sutcliffe, 2011). The NASA
Challenger disaster could have been prevented had the management not oversimplified the flaw in the O-Rings
designs when their engineers reported the issue. They had known for over 11 years prior to the crash that the
design of the O-rings in the solid rocket booster had a potentially catastrophic flaw, yet they disregarded several
warnings from their engineers about the potential catastrophic implication of launching the rocket at low
temperatures (Vaughan 1997). They waived 6 launch constraints related to O-rings that could have prevented
the launch, and by extension, the disaster. They oversimplified the problem and wrongly defined it as an
acceptable risk. With time, these became norms – norm that would lead to catastrophe. Vaughan (1997) called
this a “normalization of deviance”, a situation where “people within the organization become so much
accustomed to a deviant behaviour that they don't consider it as deviant, despite the fact that they far exceed
their own rules for the elementary safety”. The Challenger example is closely related to preoccupation with
failure. NASA received warnings about the potential for disaster, with similar occurrences in the past. The
organisation did not consider these near misses as progressive cautions to drive proactive and pre-emptive
analyses of possible vulnerabilities (Sutcliffe, 2011).
Finally, sensitivity to operations is the HRO characteristics that determine their responsiveness to the details of
their operations, with the right staffing, competence levels, and motivation. They recognize that a solution to
one problem may create another problem; they therefore maintain a big picture of their processes and mix their
awareness and alertness of expectations with actions that unfold in real time (Weick & Sutcliffe, 2015).
Investigations into the Piper Alpha disaster (Broadribb, 2014), BP Texas City incident (Labib & Read, 2013)
and the Deep Water Horizon incident (Labib, 2014) revealed that the disasters resulted from behaviours related
to sensitivity to operations. These include inadequate communication among staff, inadequate communication
between staff and management, insufficient duty of care, poor operational decision making by those responsible,
breakdown of the chain of command, and inadequate maintenance and safety practices. Others include deviation
from procedures, inadequate supervision, unclear chain of command, ambiguity in roles and responsibilities,
inadequate hazard identification, inadequate trainings, and delays in reacting to signals.
The last two are principles are concerned with the capacity of the organisations to contain the unanticipated
problems when they occur. These are commitment to resilience, and deference to expertise.
Commitment to Resilience is concerned with the ability of organisations to not only effectively anticipate errors

but also to cope with and bounce back from errors and ‘unexpected events’ (Weick and Sutcliffe, 2015; Lekka,
2011). The Columbia shuttle had no emergency response processes built into the system to enable effective
rescue missions and on-orbit repairs by the shuttle astronauts should the need arise. The emergency response
practices leading up to the Texas City and Deepwater Horizon incidents were considered inadequate and at best
chaotic by the post disaster investigations.
Deference to Expertise on the other hand shows that HROs rely on a hierarchical structure with clearly defined
roles and responsibilities during normal operations. During emergencies however, decision making is yielded to
people with the most subject matter knowledge and experience, irrespective of their rank (Weick & Sutcliffe,
2015). The Piper Alpha incident (Broadribb, 2014), is a clear example of the dangers of not deferring to
expertise during emergencies. The staff at the neighbouring platforms Tartan and Claymore were experienced
enough to know they should shut down their facilities to reduce the effect of the incident, but waited for
shutdown instructions from their hierarchical leadership. The longer they waited for their hierarchical superiors,
the more oil was pumped into already flaming Piper Alpha the higher the disaster escalation. Organisations must
therefore learn from HROs.
2.3 Organisational Learning
Organisational learning is a critical component for organisations to develop competitive advantage (Un &
Cuervo-Cazurra, 2004; Tsoukas & Mylonopoulus, 2004). For organisational learning to be effective, there must
be a flow of knowledge, as well as a reinforcement or change in behaviours (Saka-Helmhout, 2007). Zietsma et
al (2002) acknowledged that organisational learning could be achieved through well-defined processes. Tsoukas
& Mylonopoulus (2004) agreed with the well-defined process approach and argued that such knowledge
presupposes work and that for the knowledge to be effective there must be clear cut strategies and incentives to
shape it. This paper develops the views of Zietsma et al (2002) and Tsoukas & Mylonopoulus (2004) further by
developing the maturity model and maturity framework that outlines well defined processes and clear cut
strategies to advance organisational learning. Given the benefits of adopting HROs, it is clear that non-
traditional HROs should begin to learn from the HROs. Weick (2002) considered organisational learning from
the mindfulness perspective and outlined mindful behaviours that HROs work to improve on, and which
organisations must learn from as they tend towards organisational maturity. Provera et al (2010) enhanced this
further with emphasis on the “no blame approach to organisation learning” as exhibited by HROs. This paper
agrees with both the perspectives Weick (2002) and Provera et al (2010), but argues that learning from HROs
should be more holistic than narrow and should be backed by empirical data. This paper therefore embarked on
research across different organisations in diverse industries in search of empirical data to back up these
arguments and in the process developed the framework to measure the mindfulness of organisations with the
measurement focusing on specifying the degree of maturity with each dimension (construct) of HRO
mindfulness.
2.4 Maturity Models
Maturity models are frameworks that describe the methodical progression through successive stages of maturity
with incremental maturity behavior towards the desired maturity behaviour. Despite some criticism of maturity
models especially in small and medium scale organizations (Beadell, 2009; Huang & Zhang, 2010; Uskarci &
Demirors, 2017), research indicates that organisations with higher maturity levels are expected to have
competitive advantages in the marketplace (Backlund et al, 2014; Nikkhou et al, 2016), and as such would
provide opportunities for continuous organisational learning. Uskarci & Demirors (2017) noted that most of
these short comings would largely be the result of the quality and motivation levels of employees during
implementation. It would therefore be imperative to emphasize that positive contributions of employees during
implementation is key to the success of the maturity model for any size of organisation. Crosby’s (1979) quality
management maturity model paved the way for research into maturity models. It mapped organisations into five
maturity levels: Uncertainty, Awakening, Enlightenment, Wisdom, and Certainty. It worked on the premise that
organisations could progress through the five levels and strive towards “perfection” at level “certainty”. Recent
similar maturity models include maintenance management maturity model (Antil, 1991; Fernandez et al, 2003;
Oliveira, 2012), the energy management maturity model (Introna et al, 2014), the portfolio management
maturity model (Nikkhou et al, 2016), and the maturity model for production management (Kosieradzka, 2017).
Whereas Crosby’s model stems from quality, ORM2 stems from reliability. Labib et al (2009) had discussed the
many similarities between quality and reliability. They defined reliability as the ‘ability of an item to perform a
required function under given conditions for a given time interval', and quality as the 'ability of an item to
perform a required function under given conditions'. In other words, quality is fitness for purpose at an instant of
time, whereas reliability is also fitness for purpose but over a period of time’. Given these similarities, the
maturity model that originated from the quality domain could help organisations achieve higher reliability. As
most disasters have occurred in organizations outside the traditional HROs, while HROs have sustained relative

stability in reliability and safety, this paper expects the HRO behaviours to be the benchmark behaviours for
maturity level five.
3.0 Methodology
3.1 Data Collection
The research was conducted using a quota based purposive sampling technique to determine organisations
where rich and contrasting information would be obtained. The three industries: oil and gas, beverage
manufacturing, and restaurant chains, were selected to highlight industries often ignored by HRO researchers,
but with potentials for incidents of catastrophic proportions. The organisations were purposively selected with
considerations to contrasting sizes, geographical spread, age, and market share, to reduce potential bias and add
depth and diversity to the data. Organisation A was purposively selected due to perceived expectations that it
should mirror the expected behaviours from an HRO. This is purely for triangulation purposes and to help
identify and establish benchmark behaviours for organisational reliability. Organisations B, C, D are peers
within the oil and gas industry with contrasting sizes, geographical spread and years in operation. Organisations
E and F; and G and G are also peers with contrasting characteristics. Table 2 describes the organisations. The
organisations are not necessarily the same level of risk takers but the expectation is that in this diversity, the
different behaviours of diverse organisations at different maturity levels could help deepen the research.
Table 2: Summary of organisations
The sample was demographically stratified in terms of current responsibility and years of experience.
Considering current responsibility, the research adopted a medium span of control (Gupta, 2010) of 10-20% -
20-40% - 40-60% ratio for managers, supervisors, and staff. Span of control here refers to the number of direct
reports a particular manager or supervisor has at any given time. The research used a five level experience
Organisation Considerations Questionnaires Interviews
A
Multinational organization. Expected enhanced processes and
culture. To be used for triangulation 40 6
B
Multinational organization. Expected enhanced processes and
culture. Large employee base. 50 10
C
cal organization. Smaller than B, but Larger than D. Newer than
B, but older than D. 30 5
D Local organization. New. Small employee base 30 5
E Large operational base. National spread. Decades of operation. 50 10
F Regional operational base. New organization 50 10
G Regional operational base. New organization 50 10
H Large operations base. National spread. Decades of operation. 70 15
RESEARCH PARTICIPAPTION
Oil and Gas
Beverage Manufacturing
Restaurant Chain

stratification of below three years; between three to seven years; above seven years and below 15 years; 15 to 25
years; and above 25 years to enhance diversity of responses.
The research adopted a pragmatic philosophy. It combined surveys and interviews to obtain objective, verifiable
and generalizable data, as well as capture the subjective realities inferred through feelings, intuitions,
experiences and individual world views of the diverse respondents. Input to the questionnaires came from
Weick & Sutcliffe (2007; 2015) and input from industry experts and refined after the pilot survey. The survey
differs from Weick & Sutcliffe (2007; 2015) by increasing the range of questions to include the contributions by
industry experts and introducing check questions to enhance the research reliability. In addition, the research
introduced a five points rating scale in place of the combination of two point and three points scales used by
Weick & Sutcliffe (2007). Finally the questions followed a logical sequence of events as they would occur in
real life, while the respondent is made to become part of the research by the consistent use of the pronouns ‘we’
and ‘our’. The questionnaire has five sections with each section representing one of the five HRO principles. For
all questions, the responses ranges from one to five with one representing strongly disagree and five
representing strongly disagree. The organisational reliability behaviours are expected to improve as the response
tends towards five from one.
The interviews were semi-structured with questions based on the questionnaires but geared towards obtaining
the personal impressions of the interviewee. These were used to triangulate and validate the results. The
selection of interviewees followed the same methods as the questionnaires and stratified to accommodate
diversity in terms of experience and responsibility. The questions were designed to get the interviewee talking
with “what”, and “how” questions and follow up questions. For example: “If someone interrupts the process to
forestall a catastrophic failure, what would happen? What if it turns out to be a false alarm?”
3.2 The Results
In terms of responsibilities, the result validated the expected span of control with an average ratio of 15% - 37%
- 48% ratio for managers – supervisors – staff as shown on the table below. A – H represents the 8 organisations
and the figures represent the total percentage of respondents for each of the organisation.
Table 3 – Demographic Spread based on Responsibilities
A B C D E F G H Total AverageShop Floor 57.50% 40.00% 56.67% 50.00% 46.00% 40.00% 50.00% 42.86% 383.02% 48%Supervisors 30.00% 40.00% 33.33% 33.33% 40.00% 40.00% 40.00% 42.86% 299.52% 37%Managers 12.50% 20.00% 10.00% 16.67% 14.00% 20.00% 10.00% 14.29% 117.45% 15%
Total 100.00% 100.00% 100.00% 100.00% 100.00% 100.00% 100.00% 100.00% 100%
RESPONSIBILITIES

There was also a fairly average even split among the various demographics in terms of the years of experience.
The service organisations G and H however had very little representation in the medium to higher experience
groups. This was probably due to weaker compensation and welfare packages in these organisations and is
perhaps worth a further research.
Table 4 – Demographic Spread based on Years of Experience
Tables 5 to 9 show the results of the survey based the five HRO principles. Columns A to H represent the eight
organisations, while the figures represent the generalized average for each organisation for each response level.
Considering the respondents’ assessment of their organisations’ preoccupation with failure, company A at
74.17% mostly showed the behaviours expected from HROs. All the other organisations exhibited behaviours
indicative of varying levels of maturity. Similar results were obtained when assessing the responses based on the
other HRO principles as shown in tables 6, 7, 8, and 9.
Table 5 – Assessing Preoccupation with Failure
Table 6 – Assessing Reluctance to Simplify
Table 7 – Assessing Sensitivity to Operations
A B C D E F G H Total Average> 25 17.50% 12.50% 16.67% 23.33% 20.00% 4.00% 0.00% 0.00% 94.00% 11.75%
15 - 25 30.00% 27.50% 43.33% 26.67% 18.00% 8.00% 6.00% 1.43% 160.93% 20.12%>7<15 17.50% 35.00% 20.00% 26.67% 32.00% 28.00% 18.00% 2.86% 180.03% 22.50%
3 - 7 Yrs 17.50% 15.00% 16.67% 16.67% 18.00% 38.00% 40.00% 54.29% 216.12% 27.01%< 3 17.50% 10.00% 3.33% 6.67% 12.00% 22.00% 36.00% 41.43% 148.93% 18.62%
100.00%
YEARS OF EXPERIENCE
A B C D E F G H Average
Strongly Agree 74.17 7.50 7.56 1.11 2.80 0.27 0.00 0.00 93.40 11.68
Partially Agree 11.33 25.83 20.44 23.56 7.33 3.07 2.53 0.76 94.86 11.86
Neither Agree nor Disasgree 9.83 33.67 38.44 35.78 17.33 16.93 13.73 9.52 175.25 21.91
Partially Disgree 4.67 17.50 22.22 26.22 24.80 38.93 37.47 40.67 212.48 26.56
Strongly Disagree 0.00 15.50 11.33 13.33 47.73 40.80 46.27 49.05 224.01 28.00
Total 100.00 100.00 100.00 100.00 100.00 100.00 100.00 100.00 100.00
PREOCCUPATION WITH FAILURE
A B C D E F G H Average
Strongly Agree 91.46 15.63 0.28 5.56 2.83 2.50 0.00 0.00 118.25 14.78
Partially Agree 8.54 22.71 16.94 18.89 23.00 12.83 3.67 3.33 109.92 13.74
Neither Agree nor Disasgree 0.00 30.21 30.00 25.56 32.83 28.00 28.50 27.98 203.07 25.38
Partially Disgree 0.00 24.79 35.83 28.89 27.17 32.83 41.00 43.93 234.44 29.31
Strongly Disagree 0.00 6.67 16.94 21.11 14.17 23.83 26.83 24.76 134.32 16.79
Total 100.00 100.00 100.00 100.00 100.00 100.00 100.00 100.00 100.00
RELUCTANCE TO SIMPLIFY
Strongly Agree A B C D E F G H Average
Strongly Agree 86.82 19.77 8.48 20.00 8.73 5.64 0.18 0.91 150.53 18.82
Partially Agree 9.09 27.05 24.85 32.12 23.82 18.36 6.91 7.14 149.34 18.67
Neither Agree nor Disasgree 2.27 32.50 35.76 20.30 28.18 24.91 31.45 26.88 202.26 25.28
Partially Disgree 1.82 15.68 25.15 16.97 24.91 28.55 38.36 40.00 191.44 23.93
Strongly Disagree 0.00 5.00 5.76 10.61 14.36 22.55 23.09 25.06 106.43 13.30
Total 100.00 100.00 100.00 100.00 100.00 100.00 100.00 100.00 100.00
SENSITIVITY TO OPERATIONS
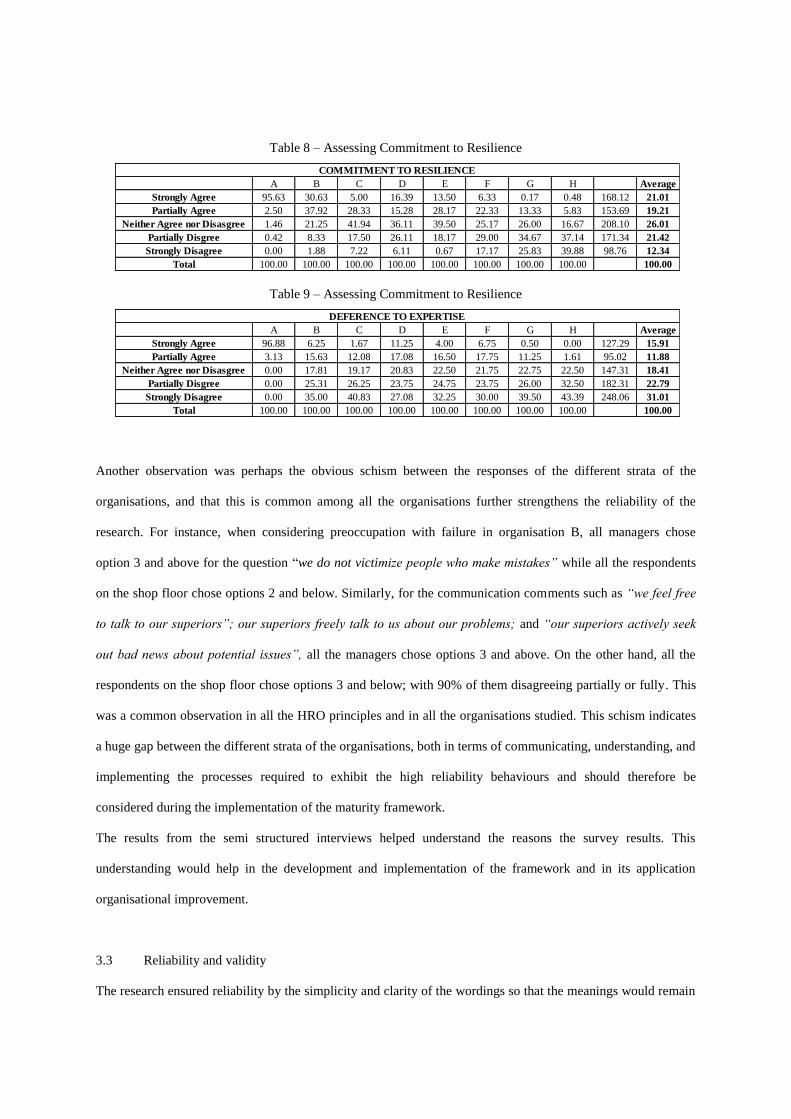
Table 8 – Assessing Commitment to Resilience
Table 9 – Assessing Commitment to Resilience
Another observation was perhaps the obvious schism between the responses of the different strata of the
organisations, and that this is common among all the organisations further strengthens the reliability of the
research. For instance, when considering preoccupation with failure in organisation B, all managers chose
option 3 and above for the question “we do not victimize people who make mistakes” while all the respondents
on the shop floor chose options 2 and below. Similarly, for the communication comments such as “we feel free
to talk to our superiors”; our superiors freely talk to us about our problems; and “our superiors actively seek
out bad news about potential issues”, all the managers chose options 3 and above. On the other hand, all the
respondents on the shop floor chose options 3 and below; with 90% of them disagreeing partially or fully. This
was a common observation in all the HRO principles and in all the organisations studied. This schism indicates
a huge gap between the different strata of the organisations, both in terms of communicating, understanding, and
implementing the processes required to exhibit the high reliability behaviours and should therefore be
considered during the implementation of the maturity framework.
The results from the semi structured interviews helped understand the reasons the survey results. This
understanding would help in the development and implementation of the framework and in its application
organisational improvement.
3.3 Reliability and validity
The research ensured reliability by the simplicity and clarity of the wordings so that the meanings would remain
A B C D E F G H Average
Strongly Agree 95.63 30.63 5.00 16.39 13.50 6.33 0.17 0.48 168.12 21.01
Partially Agree 2.50 37.92 28.33 15.28 28.17 22.33 13.33 5.83 153.69 19.21
Neither Agree nor Disasgree 1.46 21.25 41.94 36.11 39.50 25.17 26.00 16.67 208.10 26.01
Partially Disgree 0.42 8.33 17.50 26.11 18.17 29.00 34.67 37.14 171.34 21.42
Strongly Disagree 0.00 1.88 7.22 6.11 0.67 17.17 25.83 39.88 98.76 12.34
Total 100.00 100.00 100.00 100.00 100.00 100.00 100.00 100.00 100.00
COMMITMENT TO RESILIENCE
A B C D E F G H Average
Strongly Agree 96.88 6.25 1.67 11.25 4.00 6.75 0.50 0.00 127.29 15.91
Partially Agree 3.13 15.63 12.08 17.08 16.50 17.75 11.25 1.61 95.02 11.88
Neither Agree nor Disasgree 0.00 17.81 19.17 20.83 22.50 21.75 22.75 22.50 147.31 18.41
Partially Disgree 0.00 25.31 26.25 23.75 24.75 23.75 26.00 32.50 182.31 22.79
Strongly Disagree 0.00 35.00 40.83 27.08 32.25 30.00 39.50 43.39 248.06 31.01
Total 100.00 100.00 100.00 100.00 100.00 100.00 100.00 100.00 100.00
DEFERENCE TO EXPERTISE

the same with different respondents. To verify this, responses within similar strata in the same organisation were
mostly similar and consistent. Responses in alternative forms of questions introduced at random throughout the
questionnaire were also mostly similar. Table 10 shows a comparison of the alternative forms ‘we have well
defined emergency plans’ and ‘we have well defined contingency plans’ in the commitment to resilience section.
A well-developed emergency response plan would normally have a well-developed contingency plan and as
such similar responses was expected, and mostly similar responses were obtained.
Table 10 – Comparison of the results from the emergency/contingency check questions
A similar result was obtained from all the alternative forms including in the deference to expertise section as
shown in table 11 for the questions: ‘people in the organisation value expertise over rank’ and ‘we are expected
to take expert decisions irrespective of position or rank’.
Table 11 – Comparison of the results from the expertise over rank check questions
4.0 The Framework
4.1 The Organisational Reliability Maturity Model (ORM2)
The first step towards maturing organisations towards reliability would be to develop an objective and
measureable framework to measure organisational reliability. As a popular adage goes, “you can’t manage what
you can’t measure”, or as some others choose to put it, “you can’t improve what you can’t measure”. The
research developed the organisational reliability maturity model (ORM2), as a 5S model that tracks the
progression of organisations through 5 maturity levels (table 12). 5S here refers to the five maturity stages:
silent, starter, stable, sustain, and summit. ORM2 comprises of 25 boxes containing 25 sets of organisational
Availability of defined emergency plan Availability of defined contingency plan
Company A 100% at level 5 100% at level 5
Company B 100% at levels 4 & 5 100% at levels 4 & 5
Company C 100% at levels 4 & 5 100% at levels 4 & 5
Company D 100% at levels 4 & 5 100% at levels 4 & 5
Company E 32% (5), 30% (4), 26% (3), 12% (2), 0% (1) 32% (5), 30% (4), 26% (3), 12% (2), 0% (1)
Company F 100% at levels 1-3, 78% of which are at levels 1-2. 100% at levels 1-3, 88% of which are at levels 1-2.
Company G 100% at levels 1 - 3 100% at levels 1 - 3
Company H 0% (5), 0% (4), 8% (3), 38% (2), 54% (1) 0% (5), 0% (4), 8% (3), 38% (2), 54% (1)
Value expertise over rank Expert decisions irrespective of position or rank
Company A 100% at level 5 100% at level 5
Company B 100% at level 1 & 2 90% at level 1 & 2
Company C 0% (5), 0% (4), 6.67% (3), 36.6% (2), 56.6% (1) 0% (5), 0% (4), 6.67% (3), 36.6% (2), 56.6% (1)
Company D 100% at level 1 & 2 87% at level 1 & 2
Company E 100% at level 1 & 2 82% at level 1 & 2
Company F 100% at level 1 & 2 92% at level 1 & 2
Company G 100% at level 1 & 2 97% at level 1 & 2
Company H 100% at level 1 & 2 96% at level 1 & 2

reliability behaviours. The maturity levels are on the x-axis with incremental maturity behaviours as the boxes
progress towards the right hand side. The y-axis represents the five HRO principles. This means that for each
HRO principle, there are five sets of organisational reliability behaviours, with incremental improvements as the
levels increase from level 1 (silent) towards level 5 (summit). The model begins with a “silent” period (level
1), a passive period characterised by lack of standardized processes, poor communication, inadequate
procedures, combative and punitive relationships, and a false sense of safety and security – an “if it ain’t broke,
don’t fix it mentality”. As the organisation begins to realise the dangers of remaining in a “silent” period, it
begins to develop some processes. It also begins to take steps towards improving communication, developing
procedures, trainings, and competence development exercises. It begins to encourage near miss and incident
reporting. The organisation at this stage is considered a “starter” and is said to have begun its teething process.
At a point, the processes and procedures for most jobs and will become fully developed and everyone will
understand and work the process with an almost mechanical precision. People comply because they have to. In
most cases, the organisation would have slogans such as “if you decide not to comply with the process, you have
decided not to work with us”. The emphasis is clear: comply or be sacked, and people are therefore compelled to
comply. Employees would attend meetings at regular times because they have to, attend trainings because they
have to, and participate in appraisals because they must. This is the “stable” stage, where the organisation is
expected to be fully standardized and working with clockwork efficiency.
At level 4, “sustain”, the people begin to understand and agree with the reasons for the processes and
procedures and actually begin to take the initiative to own the process. They begin to see themselves as
stakeholders to help sustain the process. An emergency drill will no longer be seen as a necessary burden to
please the leaders, but as a necessary tool towards personal and organisational resilience. People begin to own
their learning and development and would begin to see feedback as a positive process for organisational and
personal improvement. The organisation would begin to proactively feed lessons learned back into the process
to improve it. The organisation begins to value and reward sceptics and those that think outside the box and
meetings will begin to become useful avenues for improvement discussions. The final level is the “summit”, a
stage where the relationships between the leaders and the led, and among the people in the organisation becomes
very respectful, people actively seek 360 degrees feedback and accept the objective feedback as a performance
improvement opportunity. People are mindful of the operations and take proactive decisions to safeguard and
improve the process. Everyone works proactively without coercion, with a common purpose to improve and
sustain the organisation. Organisations in level five are highly reliable and the behaviours included here are

selected based on numerous previous HRO studies. ORM2 sets out the expected behaviours for each maturity
level. It becomes more useful when applied with the measureable framework for organisational reliability
maturity (FORM). The elements that enhance mindfulness are not exhaustive, therefore the elements included
within each maturity stage under each HRO principle (table 12) is not exhaustive. Industries could use this
framework and extend mindfulness behaviours specific to such industry.

Table 12: Organisational Reliability Maturity Model (ORM2) – The 5S Model
Level 1 (Silent) Level 2 (Starter) Level 3 (Stable) Level 4 (Sustain) Level 5 (Summit)
Preoccupation
with Failure
Failure/Near Misses are not reported.
Punishment for people that cause incidents.
Management difficult to approach.
Continuous mindset that failure will not
happen. If a failure occurs, someone is always
to blame.
Failure/Near misses sometimes reported and
rectified. Root causes may not be identified.
People that cause incidents are perceived as
incompetent but may not be punished. Some
communication with a few people.
Failure/Near misses reporting process exists and
is generally enforced. Root causes identified.
People often blamed. Superiors communicates
with frontline to give clear instructions.
Failure/Near misses reported. Root causes identified and
people not blamed. Clear and open communications.
Worst case scenarios considered in planning. Lessons
learned documented.
Failure/Near Miss identified, categorized, documented.
Root causes identified. Root causes resolved with no
blame on people. Lessons learned reviewed periodically
and used to improve the system. People that report near
misses/failure are actively rewarded. Superiors actively
seek out bad news. Clear and open communication
between superiors and front line staff. Planning
considers worst case scenarios. Continuous reviews to
seek out hot spots.
Reluctance to
Simplify
Skeptics and people that challenge the norm
are mostly victimized and punished as
disruptors.
Skeptics and people who challenge the norm
may not be punished, but may be viewed
negatively
A process for challenging the process exists. It
is ok to challenge the norm. Implementation
may be delayed by layers of bureaucracy.
Views from skeptics and out of the box thinkers are
respected and often implemented by management.
Management actively creates forums for people to
challenge the norm and out of the box thinkers are
rewarded.
Sensitivity to
Operations
Meetings are rare without quality: no focus
on long/short term team/organization.
Leaders are unaware of frontline issues.
People generally do not understand jobs
outside their specialty. Feedback is viewed as
a process of negative reinforcement. There is
no feedback process. People are generally
overworked and stressed out. Complaints are
viewed as insubordination and could be
punished
Occasional meetings with no defined terms of
reference. Leaders request for and receive
reports as desired. People may understand jobs
outside their competencies, but rarely get
involved. People generally do not care about
feedback. Might receive one during annual
appraisal. There are occasional breaks to relieve
work stress
Regular Meetings with defined terms of
reference. A clearly defined work report
process exists and is enforced. A formal process
exists and is generally enforced for people to
learn jobs outside their competencies and get
involved. A feedback process exists and is
generally enforced. There is a process to
manage workloads
Regular Meetings are regular with defined terms of
reference and individual roles/responsibilities. Leaders
generally get involved in the frontline day to day
activities and therefore receive first hand reports.
People are generally willing to get involved in jobs
outside their competencies and the opportunities exist
for them to do so. People generally give and receive
feedback at defined times without coercion. Leaders
continuously monitor workloads and add resources as
required.
Meetings are regular with defined terms of reference and
individual roles/responsibilities. It is clear how
everyone's roles fits into the big picture. Frontline and
leaders are generally free with one another and interact
freely in day to day operations. People are rewarded for
getting involved in jobs outside their competencies.
People actively seek feedback, and perceive 360*
feedback as constructive exercises. Leaders continuously
work with staff to monitor workloads and would
collectively determine need for additional resources.
Commitment to
Resilience
The company does not organize/sponsor
trainings. Competencies and skills are not
assessed. There are no emergency response
and contingency plans.
Trainings exist, but only used to reward favoured
staff. Individual leaders assess competencies and
skills in their own way. There are emergency
response and contingency plans but people are
generally not aware of them. Drills are regarded
as nuisance.
There is a formalized training and
competence/skills assessment for all staff and
the plan is generally enforced. Emergency drills
are done and people are mandated to
participate. People are generally mandated to
understand the emergency
response/contingency plans
Leaders and staff work together to identify training and
development gaps and close them. Competence
assessment is an ongoing process and feedback is
constructive. People actively seek to understand and
review emergency response and contingency plans.
People regard drills as ways to potentially save lives
People generally have more than enough skills for their
jobs and to act during emergencies. Competence and
skills assessment is a proactive process. Emergency
response and contingency plans are robust and
implementation is a shared responsibility among all
staff. Everyone trusts one another and relies on one
another during emergencies.
Deference to
Expertise
In an emergency, the most senior person
takes responsibility irrespective experience.
It is difficult to know who has the most
expertise for each emergency.
People generally know who has the most
expertise during an emergency. Hierarchical
rank takes precedent during emergencies. The
most senior person feels insulted if not in charge
during emergencies.
There is a formal process to determine who
takes responsibility during each emergency.
The most senior person yields responsibility to the
person with the most expertise for during each
emergency. The expert accepts the responsibility
professionally and yields back after the emergency.
Expertise for all emergencies is readily available
There is a mutual respect for one another's jobs. No job
is considered more important than the other. People are
encouraged to take expert decisions irrespective of
hierarchy during emergencies. People feel responsible
until problems are resolved.
ORGANIZATIONAL RELIABILITY MATURITY MODEL

4.2 The Framework for Organisational Reliability Maturity (FORM)
The framework has multi-faceted features; the most significant of which is the standardized measurement for
organisational reliability. With this measurement come four different functions. First, it is a health check that
assesses the current maturity level of organisations. Secondly, the framework could use the current
organisational reliability behaviours to predict the future direction of the organisation. The third function is the
ability to benchmark organisations against desired maturity standards. The final function lies in the ability to
enhance organisational learning and performance improvement. To develop FORM, the organisation must first
conduct a survey using ORM2 or its variant tailored to suit organisational needs. This has been field tested in
eight diverse organisations with similar results.
Using the values obtained from the survey as summarized in tables 5 to 9, Table 13 shows FORM table for
company C. All subsequent tables will pull data from tables 5 to 9, which is the summary of the research data.
Table 13: Framework for Organisational Reliability Maturity (FORM)
The five HRO principles are mapped into five levels that correspond with the five maturity levels on the
Organisational Reliability Maturity Model (ORM2). The values corresponding with each HRO principle is the
average percentage score for all the respondents in each of the five maturity levels and sums up to 100%. The
levels on the other hand correspond with the selections 1 to 5 on the questionnaire. This means that for this
organisation, 7.56% of the respondents consider the organisation to exhibit the maturity level 5 behaviours in
their preoccupation with failure. 40.83% on the other hand consider the organisation to be at maturity level 1 in
their deference to expertise behaviours. Maturity levels could be determined at individual HRO principle level
or at the general organisation level. The maturity of the organisation is determined by the level with the highest
average score. The average score column is a simple average of responses from the five HRO principles in each
maturity level. With 33.06% as the highest average score, company C is considered to be at maturity level 3
(stable). The performance in each of five principles could give an indication of how much resources the
organisation could commit to one principle over the others to achieve improvement.
Level
Preoccupation with
Failure
Reluctance to
Simplify
Sensitivity to
Operations
Commitment to
Resilience
Deference to
Expertise
Average
Score Pull
5 7.56 0.28 8.48 5.00 1.67 4.60 0.14
4 20.44 16.94 24.85 28.33 12.08 20.53 0.62
3 38.44 30.00 35.76 41.94 19.17 33.06 0.00
2 22.22 35.83 25.15 17.50 26.25 25.39 0.77
1 11.33 16.94 5.76 7.22 40.83 16.42 0.50
COMPANY C (OIL &GAS))

The last column is the pull, and it indicates the maturity level where the organisation has the most potential of
slipping into given prevailing conditions. Pull (P) is a simple probability:
𝑷 = 𝟏 − (𝑹 − 𝑹𝒊)/𝑹
R is the average score for the assigned maturity level of the organisation, while Ri is the average score for the
maturity level under consideration. For Table 13, 33.06% is the highest average score R. Considering level 5
(summit), the average score Ri is 4.6%. Substituting R and Ri in the pull calculation above, the pull towards level
5 (summit) will be 0.14. The same process is applied to other maturity level to obtain their pull. From these
calculations, the pull is highest towards maturity level 2 (starter) at 0.77. This means that the organisation has
the highest probability of slipping into a level 2 (starter) from its current maturity level 3 (stable), given its
prevailing organisational reliability behaviours. There is an equally strong pull towards level 1(silent) at 0.50
and organisation must be careful not only to slide into level 2 (starter), but could potentially move further down
towards level 1(silent). 0.5 is considered the low pull, while 0.77 is considered the high pull. The framework
shows that the higher the pull, the more the probability of the organisation to move towards that maturity level.
In addition to applying the pull to the entire organisation considering the averages of the HRO principles, it can
be applied to each HRO principle to determine its potential risk factors to the organisation.
Table 14: Framework for Organisational Reliability Maturity (FORM) for individual HRO principles
In table 14 above, the pull is applied to the preoccupation to failure and the commitment to resilience principles.
Company C is at maturity level 3 (stable) on both principles but is being pulled differently on both. It is strongly
pulled at 0.58 down towards level 2 (starter) in preoccupation to failure, and at 0.68 up towards level 4 (sustain)
in commitment to resilience. The pull in this instance could help the organisation prioritize resources to achieve
a higher overall maturity level. The sum of all the values in each HRO principle, as well as the sum of the
Level
Preoccupation with
Failure Pull
Commitment to
Resilience Pull
Average Pull for
all 5 Principles
5 7.56 0.20 5.00 0.12 0.11
4 20.44 0.53 28.33 0.68 0.60
3 38.44 0.00 41.94 0.00 0.00
2 22.22 0.58 17.50 0.42 0.77
1 11.33 0.29 7.22 0.17 0.50
FRAMEWORK FOR ORGANISATIONAL RELIABILITY MATURITY
COMPANY C (OIL &GAS))

average scores should always be 100%. All numbers, except the pull, are percentages of responses. The next
section describes the various applications of FORM and ORM2.
5.0 Applications of FORM and ORM2
5.1 Assessing organisations
Table 15 shows organisation H to be at maturity level 2 (starter), with an average score of 38.85%. It also shows
the individual strengths and weaknesses of the organisation with respect to each of the five HRO principles. It
show for instance that although “H” is generally at maturity level 2 (starter), it is at level 1 (silent) in its
preoccupation with failure, commitment to resilient, and deference to expertise behaviours. The framework
therefore helps organisations to perform a health check. ‘H’ would observe the very thin line between its level 2
and level 1 positions, where it could easily slide from one to the other. It would also understand the need to
improve its performances in preoccupation with failure, commitment to resilience, and deference to expertise.
With this measurement, the organisation could then begin to develop improvement measures.
Table 15: Framework for Organisational Reliability Framework (FORM) for Company H
5.2 Predicting the future and preventing potential disasters
Being able to predict the future is the elusive crystal ball that all have desired and few have achieved. This
framework utilizes the ORM2 and the assessment in section 5.1 to predict future behaviour of the organisations.
Organisations with lower maturity levels have weaker organisational reliability behaviours, and are potentially
more prone to disasters Perhaps, understanding such future behaviour could potentially become the key to
incident prevention. Using company G as an example (table 16), the organisation currently on maturity level 2
(starter), could potentially retrogress to maturity level 1(silent) if it continues with its current behavioural
trends. The pull of 0.91 towards level 1 (silent) is very strong and would more likely cause the organisation to
retrogress towards level 1 than improve towards level 3 where the pull is 0.69. This suggests that given current
practices, the organisation is an “accident waiting to happen” with an increasing potential for an incident.
Level
Preoccupation with
Failure
Reluctance to
Simplify
Sensitivity to
Operations
Commitment to
Resilience
Deference to
Expertise
Average
Score Pull
5 0.00 0.00 0.91 0.48 0.00 0.28 0.01
4 0.76 3.33 7.14 5.83 1.61 3.74 0.10
3 9.52 27.98 26.88 16.67 22.50 20.71 0.53
2 40.67 43.93 40.00 37.14 32.50 38.85 0.00
1 49.05 24.76 25.06 39.88 43.39 36.43 0.94
FRAMEWORK FOR ORGANISATIONAL RELIABILITY
COMPANY H (RESTAURANT CHAIN)

Table 16: Framework for Organisational Reliability Framework (FORM) for Company G
This predictive feature is much more useful when utilized at the level of individual HRO principles. The
organisation is already at the lowest level in its preoccupation with failure and deference to expertise. This
means that near misses and incidents are not reported, and that the communication line between management
and frontline is very difficult at best. It also means that expertise is often sacrificed on the altar of hierarchy.
Combining these behaviours suggests that a disaster could be imminent. The potential is not only very high; the
ability of the organisation to manage the disaster when it occurs is very low. On the other hand, the organisation
could be predicted to improve to level 3 (stable) in its reluctance to simplify, sensitivity to operations, and
commitment to resilience. The pull towards levels 3 and 1 in commitment to resilience are too similar that the
correct prediction might be too close to call between improving towards level 3, and retrogressing towards level
1. In such instance, it would be safe to assume a worst case scenario. From table 15, company H is at level 2 in
its reluctance to simplify. With a strong pull towards level 1, the organisation could be predicted to retrogress
towards level 1 with a much higher probability of catastrophic incidents.
Without previous baseline data, it might be challenging to show if the pull is towards improvement of away
from improvement. For instance, from table 16, the average pull of 0.91 could indicate that the current reliability
behaviours are pulling the organisation towards level 1. However, an earlier pull of 0.99 towards level 1and a
lower pull of 0.61 towards level 3 could indicate that the organisation is actually improving towards level 3.
This means that for an effective prediction, the baseline measurements must be established.
5.3 Benchmarking organisations
Organisations could use this framework to benchmark against a desired maturity level, against best in class,
against peers, or for internal benchmarking. Best in class here would mean HROs. One of the first steps here
would be to obtain baseline measurements using the process outlined in section 5.1. Objective data collection
should not be limited to surveys but could be extended to action research and case studies based on its
organisational realities. Table 17 shows a high level comparison of the 8 organisations surveyed. Black
Level
Preoccupation with
Failure
Reluctance to
Simplify
Sensitivity to
Operations
Commitment to
Resilience
Deference to
Expertise
Average
Score Pull
5 0.00 0.00 0.18 0.17 0.50 0.17 0.00
4 2.53 3.67 6.91 13.33 11.25 7.54 0.21
3 13.73 28.50 31.45 26.00 22.75 24.49 0.69
2 37.47 41.00 38.36 34.67 26.00 35.50 0.00
1 46.27 26.83 23.09 25.83 39.50 32.30 0.91
COMPANY G (RESTAURANT CHAIN)

coloured boxes represent the current average maturity level, while grey coloured boxes represent the high pull.
Assuming company A is the benchmark, all other organisations would compare their average maturity levels, as
well as the levels for the individual HRO principles against company A’s performance.
Table 17: Comparing average organisational maturity
For instance, company B has a stable organisational reliability maturity (level 3) with a pull of 0.95 towards
level 4 (sustain). Similarly, companies C, D, and E have stable maturity levels (level 3) but with pulls of 0.77,
0.88, and 0.82 respectively towards level 2 (starter). On the other hand, companies F, G, and H are on maturity
levels 2, with pulls of 0.88, 0.91, and 0.94 respectively towards level 1 (silent). At a glance, each organisation
could see the degree to which they are apart from the best in class. Figure 5 shows a graphical visualization of
table 17.
Figure 5 – A graph showing a high level comparison of the organisations
The blue curve represents the current maturity level and corresponds with the black boxes on table 17. The red
curve represents the high pull and corresponds with the grey coloured boxes in table 17. The graph simplifies
the representation, while the table gives some more details. The graph easily shows that company A is more
mature than B, and B is more mature than C (because of the pull). For C, D, and E, and F, G, and H, the
differences are not very apparent on the graph but become clearer from the details on table 17.
The framework could also provide a detailed benchmark of the individual HRO principles for the organisations
as shown on table 18 and expanded further on figure 6 to figure 10.
ORGANIZATIONS SILENT STARTER STABLE SUSTAIN SUMMIT LEGEND
COMPANY A
COMPANY B 0.47 0.68 ML 0.95 0.59 ML CURRENT MATURITY LEVEL
COMPANY C 0.59 0.77 ML 0.62 0.14 HIGH PULL
COMPANY D 0.56 0.88 ML 0.77 0.39
COMPANY E 0.77 0.82 ML 0.69 0.22
COMPANY F 0.88 ML 0.76 0.49 0.14
COMPANY G 0.91 ML 0.69 0.21 0
COMPANY H 0.94 ML 0.53 0.1 0.01
COMPARING THE MATURITY OF THE ORGANIZATIONS
0
1
2
3
4
5
6
LEVEL
PULL
Mat
uri
ty L
evel

Table 18: Detailed organisational maturity comparison
Considering preoccupation with failure, ‘B’, ‘C’, and ‘D’ are on level 3. ‘B’, pulling towards level 4, is more
mature than ‘C’ and ‘D’ that are pulling towards level 2. Applying the pull calculation to ‘C’ and ‘D’ will show
that ‘C’ with a pull of 0.65 towards level 2 is more matured with respect to preoccupation with failure than ‘D’
with a pull of 0.73 towards level 2. The same process could be applied to all the other HRO principles.
Figure 6 – A graph showing a comparison of the organisations in terms of their preoccupation with failure.
ORGANIZATIONS SILENT STARTER STABLE SUSTAIN SUMMIT
COMPANY A
Preoccupation with failure 0.00 4.67 9.83 11.33 74.17
Reluctance to Simplify 0.00 0.00 0.00 8.54 91.46
Sensitivity to operations 0.00 1.82 2.27 9.09 86.82
Commitment to resilience 0.00 0.42 1.46 2.50 95.63
Deference to expertise 0.00 0.00 0.00 3.13 96.88
COMPANY B
Preoccupation with failure 15.50 17.50 33.67 25.83 7.50
Reluctance to Simplify 6.67 24.79 30.21 22.71 15.63
Sensitivity to operations 5.00 15.68 32.50 27.05 19.77
Commitment to resilience 1.88 8.33 21.25 37.92 30.63
Deference to expertise 35.00 25.31 17.81 15.63 6.25
COMPANY C
Preoccupation with failure 11.33 22.22 38.44 20.44 7.56
Reluctance to Simplify 16.94 35.83 30.00 16.94 0.28
Sensitivity to operations 5.76 25.15 35.76 24.85 8.48
Commitment to resilience 7.22 17.50 41.94 28.33 5.00
Deference to expertise 40.83 26.25 19.17 12.08 1.67
COMPANY D
Preoccupation with failure 13.33 26.22 35.78 23.56 1.11
Reluctance to Simplify 21.11 28.89 25.56 18.89 5.56
Sensitivity to operations 10.61 16.97 20.30 32.12 20.00
Commitment to resilience 6.11 26.11 36.11 15.28 16.39
Deference to expertise 27.08 23.75 20.83 17.08 11.25
COMPARING THE MATURITY OF THE ORGANIZATIONS
COMPANY E
Preoccupation with failure 47.73 24.80 17.33 7.33 2.80
Reluctance to Simplify 14.17 27.17 32.83 23.00 2.83
Sensitivity to operations 14.36 24.91 28.18 23.82 8.73
Commitment to resilience 0.67 18.17 39.50 28.17 13.50
Deference to expertise 32.25 24.75 22.50 16.50 4.00
COMPANY F
Preoccupation with failure 40.80 38.93 16.93 3.07 0.27
Reluctance to Simplify 23.83 32.83 28.00 12.83 2.50
Sensitivity to operations 22.55 28.55 24.91 18.36 5.64
Commitment to resilience 17.17 29.00 25.17 22.33 6.33
Deference to expertise 30.00 23.75 21.75 17.75 6.75
COMPANY G
Preoccupation with failure 46.27 37.47 13.73 2.53 0.00
Reluctance to Simplify 26.83 41.00 28.50 3.67 0.00
Sensitivity to operations 23.09 38.36 31.45 6.91 0.18
Commitment to resilience 25.83 34.67 26.00 13.33 0.17
Deference to expertise 39.50 26.00 22.75 11.25 0.50
COMPANY H
Preoccupation with failure 49.05 40.67 9.52 0.76 0.00
Reluctance to Simplify 24.76 43.93 27.98 3.33 0.00
Sensitivity to operations 25.06 40.00 26.88 7.14 0.91
Commitment to resilience 39.88 37.14 16.67 5.83 0.48
Deference to expertise 43.39 32.50 22.50 1.61 0.00
COMPARING THE MATURITY OF THE ORGANIZATIONS
0
1
2
3
4
5
6
PREOCCUPATION WITHFAILURE LEVEL
PREOCCUPATION WITHFAILURE PULL
Mat
uri
ty L
evel

Figure 7 – A graph showing a comparison of the organisations in terms of their reluctance to simplify.
Figure 8 – A graph showing a comparison of the organisations in terms of their sensitivity to operations.
Figure 9 – A graph showing a comparison of the organisations in terms of their commitment to resilience.
Figure 10 – A graph showing a comparison of the organisations in terms of their deference to expertise.
0
1
2
3
4
5
6
RELUCTANCE TOSIMPLIFY LEVEL
RELUCTANCE TOSIMPLIFY PULL
0
1
2
3
4
5
6
SENSITIVITY TOSIMPLIFY LEVEL
SENSITIVITY TOSIMPLIFY PULL
0123456
COMMITMENT TORESILIENCE LEVEL
COMMITMENT TORESILIENCE PULL
0
1
2
3
4
5
6
DEFERENCE TOEXPERTISE LEVEL
DEFERENCE TOEXPERTISE PULL
Mat
uri
ty L
evel
M
atu
rity
Lev
el
Mat
uri
ty L
evel
M
atu
rity
Lev
el

Finally the framework could also benchmark against peers. A high level comparison of companies C and D
(table 19) shows both organisations to be close on the average high level behaviours. They are both on the same
maturity level 3 with pulls towards level 2. There are also fairly pulled towards level 4 at 0.62 and 0.77
respectively.
Table 19: High level comparison of companies C and D
A closer look at the detailed comparison (table 20) would highlight the key differences. In their sensitivity to
operations, company C is at maturity level 3 with slightly more pull level 2, while Company D is more mature at
level 4 with slightly higher pull towards level 3 is slightly. All the HRO principles for the peers could be
compared in the same way.
Table 20: Detailed comparison of companies C and D
5.4 Organisational learning and Improvement using FORM
The route organisations would choose to improve their organisational reliability would be determined by
amount of resources they are willing to commit. For best results, a gradual and wholesome implementation is
suggested. The improvement actions would normally be in a gradual and stepwise manner, in which case, the
organisations would take incremental actions to improve their maturity one level at a time and grow the maturity
over time. This approach is similar to the observations of O’Neil & Krane (2012) where they concluded that
HRO characteristics improve incrementally over a long period of time as long as the leadership commits to
supporting the change and are able to motivate the whole organisation to support the initiative. This gradual and
incremental approach could potentially pose some challenges in cases where the pull towards a higher maturity
level is very high. A pull of 0.95 towards from level 3 towards level 4 (Company B in table 17) suggests that the
organisation already exhibits a lot of level 4 behaviours. A smarter decision in this case would therefore be to
ORGANIZATIONS SILENT STARTER STABLE SUSTAIN SUMMIT
COMPANY C 0.59 0.77 ML 0.62 0.14
COMPANY D 0.56 0.88 ML 0.77 0.39
COMPARING THE MATURITY OF THE ORGANIZATIONS
ORGANIZATIONS SILENT STARTER STABLE SUSTAIN SUMMIT
COMPANY C
Preoccupation with failure 11.33 22.22 38.44 20.44 7.56 LEGEND
Reluctance to Simplify 16.94 35.83 30.00 16.94 0.28
Sensitivity to operations 5.76 25.15 35.76 24.85 8.48 ML CURRENT MATURITY LEVEL
Commitment to resilience 7.22 17.50 41.94 28.33 5.00 HIGH PULL
Deference to expertise 40.83 26.25 19.17 12.08 1.67
COMPANY D
Preoccupation with failure 13.33 26.22 35.78 23.56 1.11 LEGEND
Reluctance to Simplify 21.11 28.89 25.56 18.89 5.56
Sensitivity to operations 10.61 16.97 20.30 32.12 20.00 ML CURRENT MATURITY LEVEL
Commitment to resilience 6.11 26.11 36.11 15.28 16.39 HIGH PULL
Deference to expertise 27.08 23.75 20.83 17.08 11.25
COMPARING THE MATURITY OF THE ORGANIZATIONS

begin to implement level 5 behaviours instead of committing resources on level 4 behaviours. Where the
organisation is at maturity level 5, it would be expected to sustain the maturity by continuously assessing its
behaviours against the level 5 behaviours.
Vogus & Sutcliffe (2007b), O’Neil & Krane (2012) and Weick & Sutcliffe (2015) cited leadership and policy
makers, as well as the trust in these leaders as the engines that drives the organisational reliability improvement.
They would make the policies and act build trust among organisation towards mindfulness. This trust eventually
begins to drive the organisation towards maturity. Where an organisation is unable to the commit resources
required to implement all 5 HRO principles at the same time, it could chose to commit more resources to its
weakest principle(s) as a means of boosting the average maturity level. This route must be used in conjunction
with an organisational risk analysis. Labib et al (2009), in their work on total reliability and maintenance
management awards observed that although all measures of quality are important, there are different weights
assigned to different factors in the design of the elements of such an award. This paper assumes an equal
weighting for all the 5 HRO principles. An organisational risk analysis might recommend a different weighting
for the principles due to the prevalent risk factors. Company B might for instance, consider preoccupation with
failure to be its most vulnerable point and could choose to commit more resources to it. This does not preclude
the organisation from striving for reliability in all five principles as one of the defining characteristics of
collective mindfulness is the simultaneous presence of high levels of each of the five HRO principles. A future
research will investigate the applicability of different weighting scales for the HRO principles.
The Organisational Reliability Maturity Model (ORM2) is used in conjunction with the Framework for
Organisational Reliability Maturity (FORM) to propose organisational improvement behaviours. Considering
Company G and H (table 21), both organisations are at maturity level 2 with pulls towards level 1

Table 21: Applying ORM2 to Company G and Company H
From ORM2, and considering preoccupation with failure, both organisations do not report near misses or
incidents, neither is there a process in place to manage incidents. They consider failure to be the result of
someone’s error and there are punishments for people found to cause a failure. The managements are considered
as being difficult to approach. Both organisations pull strongly towards level 2 at 0.81 and 0.83 respectively,
meaning that a large percentage may have already started to report some incidents or near misses, but there is no
defined process to manage incidents, neither is there a formal communication channel with management. A
smart recommendation would therefore be for the organisations to begin to implement level 3 behaviours. Such
behaviour would include developing and implementing a formalised incident management process,
communication process, and rewards process. A robust incident management process would include a feedback
process to improve future process design, modify existing process or implement cultural change. Similarly, both
organisations are also on maturity level 2 in their reluctance to simplify with high pulls of 0.70 and 0.64
respectively. Again, the smart recommendation would be to implement level 3 behaviours that aim at process
standardisation.
While Company H is at level 1 in commitment to resilience with a high pull of 0.93 towards level 2, Company G
is at level 2 with a high pull of 0.75 towards level 3. Company H would therefore be smart enough to begin to
encourage level 3 behaviours, while Company G would encourage level 4 behaviours. All the behaviours would
be defined in ORM2. Finally both organisations are at level 1 in their deference to expertise. While Company H
has a pull of 0.75 towards level 2, Company G has a pull of 0.68 towards level 2. Company H is additionally
being pulled strongly 0.52 towards level 3, while Company G is additionally being pulled strongly at 0.58
towards level 3. The smart choice would therefore be to begin to encourage level 4 behaviours in both
Level
Preoccupation with
Failure
Reluctance to
Simplify
Sensitivity to
Operations
Commitment to
Resilience
Deference to
Expertise
Average
Score Pull
5 0.00 0.00 0.91 0.48 0.00 0.28 0.01
4 0.76 3.33 7.14 5.83 1.61 3.74 0.10
3 9.52 27.98 26.88 16.67 22.50 20.71 0.53
2 40.67 43.93 40.00 37.14 32.50 38.85 0.00
1 49.05 24.76 25.06 39.88 43.39 36.43 0.94
Level
Preoccupation with
Failure
Reluctance to
Simplify
Sensitivity to
Operations
Commitment to
Resilience
Deference to
Expertise
Average
Score Pull
5 0.00 0.00 0.18 0.17 0.50 0.17 0.00
4 2.53 3.67 6.91 13.33 11.25 7.54 0.21
3 13.73 28.50 31.45 26.00 22.75 24.49 0.69
2 37.47 41.00 38.36 34.67 26.00 35.50 0.00
1 46.27 26.83 23.09 25.83 39.50 32.30 0.91
COMPANY H (RESTAURANT CHAIN)
COMPANY G (RESTAURANT CHAIN)

organisations. At level 4, the most senior would normally yield responsibility to the most experienced people
during an emergency with emphasis is on yield, as the process is intentional and not out of coercion.
6.0 Conclusions
The paper explores important and often neglected aspects of HRO research – How can organisations become
reliable? How do we measure the reliability of the organisation? Can this measurement be extended to diverse
organisations? To what purpose would this be? Our development of ORM2 a staged maturity model for
organisational reliability and FORM, the framework for organisational reliability maturity, as well as their
deployment in eight diverse organisations in different industries leads us to conclude that it is possible to
measure organisational reliability and develop a standardized framework for it. We also conclude that HRO
principle could potentially be deployed by any organisation irrespective of location, size, or type of industry. We
recommend a staged and gradual implementation for best results. We also conclude that organisations could use
this measurement framework for self-assessment, to predict the potential to improve or retrogress, to
benchmark, and for organisational learning and performance improvement towards higher reliability. We find
that with an improved mindfulness, organisations would tend towards more error free operations and therefore
towards improved safety. We also find that this framework has the key features of scalability, simplicity, and
ease of use.
Future research extend the diversity and expand the study further into more industries and organisations with
varying degrees of complexity, coupling, size, and age. This research used an equal weighting scale for all HRO
behaviours. Another research would seek to investigate the applicability of different weighting scales for the
HRO behaviours as done for quality dimension and see if this could potentially help organisations towards
higher reliability.

References
Alothman, A. (2016) A detailed view of high reliability organization models in the oil industry. Oil Gas Res
2:119. doi: 10.4172/2472-0518.1000119
Antil, P. (1991) The maintenance organisational maturity grid, Maintenance Conference, March, COMAC
Publications, Birmingham
Ashley, H. M., Farris, R. K., & Richards, R. E. (2009) Achieving high reliability operations through multi-
program integration, Sixth American Nuclear Society International Topical Meeting on Nuclear Plant
Instrumentation, Illinois: LaGrange Park
Ausserhofer, D., Schubert, M., Desmedt, M., Blegen, M. A., De Geest, S., & Schwendimann, R. (2013) The
association of patient safety climate and nurse-related organizational factors with selected patient outcomes: A
cross-sectional survey. International journal of nursing studies, 50(2), 240-252
Aven, T. & Krohn, B. S. (2014) A new perspective on how to understand, assess and manage risk and the
unforeseen. Reliability Engineering and System Safety, 121, pp.1-10
Azzaro, J. A. (2005) Understanding a high performance university development organisation: leadership and
best practices, PhD thesis
Backlund, F., Chronéer, D., & Sundqvist, E. (2014) Project management maturity models–A critical review: A
case study within Swedish engineering and construction organizations. Procedia-Social and Behavioural
Sciences, 119, 837-846
Baker, D. P., Day, R., & Salas, E. (2006) Teamwork as an essential component of high reliability organisations,
Health Research and Educational Trust, 41 (4), 1576-1598
Barratt, N. (2010). Lost voices from the titanic: the definitive oral history, London: Random House. ISBN 978-
1-84809-151-1
Beadell, B. B, (2009) CMMI as contemporary iron cage: a grounded analysis from the perspective of practicing
engineers in defence engineering. The school of education of the University of St. Thomas, St. Paul, Minnesota
Bellamy, G. T., Crawford, L., Marshall, L. H., & Coulter, G. A. (2005) The fail-safe schools challenge:
leadership possibilities from high reliability organisations. Educational Administration Quarterly; 41(3): 383-
412
Berardi, P. J. (2010) Measuring high reliability characteristics of the organisation, US: Kansas City Fire

Department http://www.usfa.fema.gov/pdf/efop/efo44533.pdf, assessed 20th November 2016
Bergström, J., van Winsen, R., & Henriqson, E. (2015) On the rationale of resilience in the domain of safety: A
literature review. Reliability Engineering & System Safety, 141, 131-141.
Bierly, P. E., & Spender, J. C. (1995) Culture and high reliability organisations: The case of a nuclear
submarine. Journal of Management, 21 (4), 639-656
Broadribb, M. P. (2015) What have we really learned? Twenty five years after Piper Alpha. Process Safety
Progress, 34(1), 16-23
Busby, J. S. (2006) Failure to mobilize in reliability-seeking organisations: two cases from the UK railway. J
Manage Stud; 43(6): 1375- 1393
Carr, A. (2016) Chipotle eats itself. Fast Company, https://www.fastcompany.com/3064068/chipotle-eats-itself
assessed June 17, 2018
Carlo, J. L., Lyytinen, K., & Boland Jr, R. J. (2012) Dialectics of Collective Minding: Contradictory
Appropriations of Information Technology in a High-Risk Project. MIS Quarterly, 36(4), 1081-1108
Chassin, M. R., & Loeb, J. M. (2011) The ongoing quality improvement journey: next stop, high
reliability. Health Affairs, 30(4), 559-568
Chassin, M. R., & Loeb, J. M. (2013) High-Reliability Health Care: Getting There from Here. Milbank
Quarterly, 91(3), 459-490
Ciravegna, L., & Brenes, E. R. (2016) Learning to become a high reliability organisation in the food retail
business. Journal of Business Research, 69(10), 4499-4506
Costella, M. F., Saurin, T. A., & Guimaraes, L. B. (2009) A method for assessing health and safety management
systems from the resilience engineering perspective, Safety Science, 47, 1056-1067
Crosby, P. B. (1979) Quality is free: the art of making quality certain, New York, NY: McGraw-Hill Companies
Fernandez, O., Labib, A.W., Walmesly, R., & Petty, D. J. (2003) A decision support maintenance management
system: development and implementation, International Journal of Quality & Reliability Management, 20(8),
pp. 965-979
Frankel, A. S., Leonard, M. W., & Denham, C. R. (2006) Fair and just culture, team behaviour, and leadership
engagement: The tools to achieve high reliability. Health Services Research, 41 (4), 1690-1709

Grabowski, M. & Roberts, K. H. (2016) Reliability seeking virtual organizations: Challenges for high reliability
organizations and resilience engineering. Safety Science
Gupta, A. (2010) Organization’s size and span of control. Practical Management: Transforming Theories into
Practices
Haavik, T. K., Antonsen, S., Rosness, R., & Hale, A. (2016) HRO and RE: a pragmatic perspective, Safety
Science
Hales, D. N. & Chakravorty, S. S. (2016) Creating high reliability organisations using mindfulness. Journal of
Business Research, 69(8), 2873-2881
Harvey, E. J., Waterson, P., & Dainty, A. R. (2016) Applying HRO and resilience engineering to construction:
Barriers and opportunities. Safety Science
Hofmann, D., Jacobs, R., & Landy, F. (1995) High reliability process industries: Individual, micro and macro
organisational influences on performance, Journal of Safety Research, 26 (3), 131-149
Hopkins, A. (2009) Failure to learn: The BP Texas City refinery disaster, Australia: CCH Australian Limited.
Huang, D. & Zhang, W. (2010) CMMI in medium & small enterprises: problems and solutions, in: Proceedings
of the 2nd IEEE International Conference on Information Management and Engineering, 2010, pp. 171–174
INSAG-7 (1992) The Chernobyl Accident: Updating of insag-1, a report by the international nuclear safety
advisory group, international atomic energy agency, Vienna, Austria
Introna, V., Cesarotti, V., Benedetti, M., Biagiotti, S., & Rotunno, R. (2014) Energy Management Maturity
Model: An organizational tool to foster the continuous reduction of energy consumption in companies. Journal
of Cleaner Production, 83, 108-117
Janofsky, M. (1997) 25 million pounds of beef is recalled. A New York Times publication
https://www.nytimes.com/1997/08/22/us/25-million-pounds-of-beef-is-recalled.html assessed June 12, 2018
Jeffcott, S., Pidgeon, N., Weyman, A., & Walls, J. (2006) Risk, trust, and safety culture in UK train operating
companies. Risk Anal; 26(5): 1105-1121
Keller, P. (2004) Managing the unexpected in prescribed fire and fire use operations: a workshop on the high
reliability organisation. Fort Collins, CO: US Department of Agriculture, Forest Service, Rocky Mountain
Research Station

Kosieradzka, A. (2017). Maturity Model for Production Management. Procedia Engineering, 182, 342-349
La Porte, T., & Consolini, P. (1998) Theoretical and operational challenges of ‘high reliability organisations’:
air traffic control and aircraft carriers, International Journal of Public Administration, 21 (6-8), 847-852
Labib, A. (2014) Learning from failures: decision analysis of major disasters, Elsevier
Labib, A.W., Franlund, J., & Vamvalis, C. (2009) Benchmarking Best Practice: Towards a Total Reliability &
Maintenance Management Award, Journal of Maintenance & Asset Management, ISSN 0952-2110, Vol 4 No
25, pp 34-39
Labib, A. & Harris, M. J. (2015) Learning how to learn from failures - the Fukushima nuclear
disaster. Engineering Failure Analysis, 47, 117-128
Labib, A. & Read, M. (2013) Not just rearranging the deckchairs on the Titanic: Learning from failures through
Risk and Reliability Analysis. Safety science, 51(1), pp.397-413
Labib, A., & Read, M. (2015) A hybrid model for learning from failures: the Hurricane Katrina disaster. Expert
Systems with Applications, 42(21), 7869-7881
Langer, E. J. (2014). Mindfulness: 25th anniversary ed. A Merloyd Lawrence Book, Da Capo Lifelong Books
Le Coze, J. C. (2016) Vive la diversité! High Reliability Organisation (HRO) and Resilience Engineering
(RE). Safety Science
Lekka, C. (2011) High reliability organisations, a review of the literature, Health and Safety Laboratory for
Health and Safety Executives, RR 899
Lekka, C., and Sugden, C. (2011) Successes and challenges of implementing high reliability principles: a case
study of a UK oil refinery, Process Safety and Environmental Protection.
Li, W., Zhang, L. and Liang, W. (2017) An Accident Causation Analysis and Taxonomy (ACAT) model of
complex industrial system from both system safety and control theory perspectives, Safety science, 92, pp.94-
103
Madsen, P., Desai, V., Roberts, K., & Wong, D. (2006) Mitigating hazards through continuing design: the birth
and evolution of a paediatric intensive care unit, Organisation Science, 17 (2), 239-248
Miller, B. M., and Horsley, S. J. (2009) Digging deeper: crisis management in the coal industry, Journal of
Applied Communication Research; 37(3): 298-316

Moura, R., Beer, M., Patelli, E., Lewis, J., & Knoll, F. (2016) Learning from major accidents to improve system
design. Safety science, 84, 37-45
Nestle, Marion (2010) Safe Food: The Politics of Food Safety, 2nd Revised ed. Berkeley, CA: University of
California Press
Nikkhou, S., Taghizadeh, K., & Hajiyakhchali, S. (2016) Designing a Portfolio Management Maturity Model
(Elena). Procedia-Social and Behavioral Sciences, 226, 318-325
O’Neil, P. D. (2011) High reliability systems and the provision of a critical transportation service, J
Contingencies and Crisis Management; 19(3): 158-168
O'Neil, P. D., & Krane, D. (2012). Policy and Organizational Change in the Federal Aviation Administration:
The Ontogenesis of a High‐Reliability Organization. Public Administration Review, 72(1), 98-111.
Oliveira, M. A., Lopes, I. and Figueiredo, D. L. (2012) Maintenance management based on organisation
maturity level, International Conference on Industrial Engineering and Operations Management ICIEOM July 9
– 11
Perrow, C. (1984) Normal accidents: Living with high-risk technologies. New York: Basic
Books
Provera, B., Montefusco, A., & Canato, A. (2010) A ‘no blame’approach to organizational learning. British
Journal of Management, 21(4), 1057-1074
Righi, A. W., Saurin, T. A., & Wachs, P. (2015) A systematic literature review of resilience engineering:
Research areas and a research agenda proposal. Reliability Engineering & System Safety, 141, 142-152
Riley, W. (2009) High reliability and implications for nursing leaders, J Nurs Manag; 17(2): 238-246
Roberts, K. (1990) Some characteristics of one type of high reliability organisation. Organisation Science, 1 (2),
160-176
Roberts, K., Stout, S., & Halern, J. (1994) Decision dynamics in two high reliability military organisations,
Management Science vol. 40(5), pp614-24
Roberts, K., Desai, V., & Madsen, P. (2005) Reliability enhancement and demise at Back Bay Medical Centre
Children’s hospital, In P. Carayon (Ed.), Handbook of human factors and ergonomics in healthcare and patient
safety (pp. 249-258). London: Erlbaum

Rougier, J., Sparks, S., Aspinall, W., Cornell, S., Crosweller, S., Edwards, T., Freer, J., Hill, L., & Hincks, T.,
(2010) SAPPUR: NERC scoping study on uncertainty and risk in natural hazards, BRISK, University of Bristol
Saka-Helmhout, A. (2007) Unravelling learning within multinational corporations, British Journal of
Management, 18, pp. 294–310
Samuels, J. G. (2010) The application of high-reliability theory to promote pain management, J Nurs Adm;
40(11):471-6
Savioja, P., Norros, L., Salo, L., & Aaltonen, I. (2014) Identifying resilience in proceduralised accident
management activity of NPP operating crews. Safety Science, 68, pp.258-274
Schlosser, Eric (2001) Fast Food Nation. London: Penguin Books
Schulman, P. (2008) Assessing NASA’s safety culture: the limits and possibilities of high-reliability theory,
Arjen Boin 2008; 68(6): 1050–1062
Stralen, van, D., Calderon, R., Clements, P., Daniel, A., Rao, R., Padgett, J., Kausen, B., and Roberts, K. (2006)
High reliability organisation methods facilitate initiation of mechanical ventilation in a paediatric nursing home,
Society of Critical Care Medicine, 35th
Critical Care Congress, San Francisco, California, January 7-11
Stringfield, S. (1995) Attempting to enhance students’ learning through innovative programs: the case for
schools evolving into high reliability organisations. School Effectiveness and School Improvement 1995;
6(1):67-96
Stringfield, S., Reynolds, D., and Schaffer, E.C. (2008) Improving secondary students’ academic achievement
through a focus on reform reliability: 4- and 9-year findings from the high reliability schools project, School
Effectiveness and School Improvement; 19(4):409-428
Sullivan, J. L., Rivard, P. E., Shin, M. H., & Rosen, A. K. (2016) Applying the High Reliability Health Care
Maturity model to assess hospital performance: A VA case study. Joint Commission journal on quality and
patient safety, 42(9), 389-399
Sutcliffe, K. M. (2011) High reliability organisations (HROs), Best Practice & Research Clinical
Anaesthesiology, Volume 25, Issue 2, June, Pages 133-144, ISSN 1521-6896
Sutcliffe, K. M., Vogus, T. J., & Dane, E. (2016). Mindfulness in organisations: A cross-level review. Annual
Review of Organisational Psychology and Organisational Behavior, 3, 55-81
Taleb, N. N. (2010). The black swan: The impact of the highly improbable. Penguin Books.
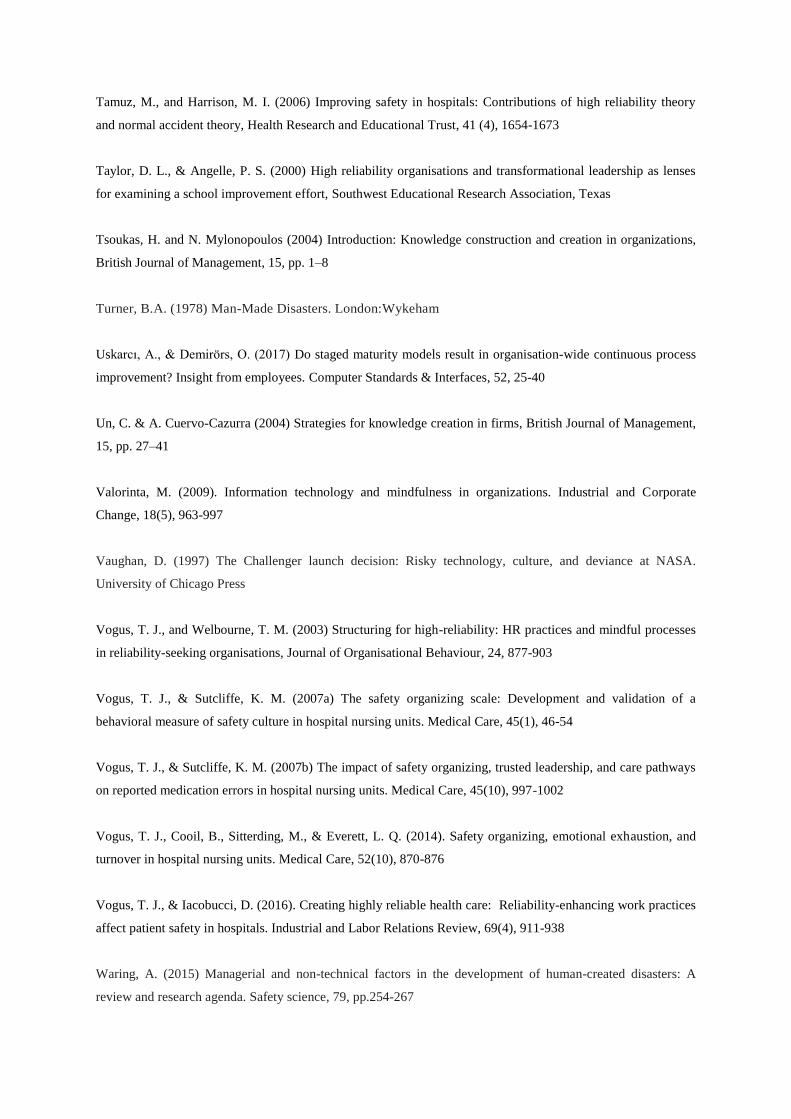
Tamuz, M., and Harrison, M. I. (2006) Improving safety in hospitals: Contributions of high reliability theory
and normal accident theory, Health Research and Educational Trust, 41 (4), 1654-1673
Taylor, D. L., & Angelle, P. S. (2000) High reliability organisations and transformational leadership as lenses
for examining a school improvement effort, Southwest Educational Research Association, Texas
Tsoukas, H. and N. Mylonopoulos (2004) Introduction: Knowledge construction and creation in organizations,
British Journal of Management, 15, pp. 1–8
Turner, B.A. (1978) Man-Made Disasters. London:Wykeham
Uskarcı, A., & Demirörs, O. (2017) Do staged maturity models result in organisation-wide continuous process
improvement? Insight from employees. Computer Standards & Interfaces, 52, 25-40
Un, C. & A. Cuervo-Cazurra (2004) Strategies for knowledge creation in firms, British Journal of Management,
15, pp. 27–41
Valorinta, M. (2009). Information technology and mindfulness in organizations. Industrial and Corporate
Change, 18(5), 963-997
Vaughan, D. (1997) The Challenger launch decision: Risky technology, culture, and deviance at NASA.
University of Chicago Press
Vogus, T. J., and Welbourne, T. M. (2003) Structuring for high-reliability: HR practices and mindful processes
in reliability-seeking organisations, Journal of Organisational Behaviour, 24, 877-903
Vogus, T. J., & Sutcliffe, K. M. (2007a) The safety organizing scale: Development and validation of a
behavioral measure of safety culture in hospital nursing units. Medical Care, 45(1), 46-54
Vogus, T. J., & Sutcliffe, K. M. (2007b) The impact of safety organizing, trusted leadership, and care pathways
on reported medication errors in hospital nursing units. Medical Care, 45(10), 997-1002
Vogus, T. J., Cooil, B., Sitterding, M., & Everett, L. Q. (2014). Safety organizing, emotional exhaustion, and
turnover in hospital nursing units. Medical Care, 52(10), 870-876
Vogus, T. J., & Iacobucci, D. (2016). Creating highly reliable health care: Reliability-enhancing work practices
affect patient safety in hospitals. Industrial and Labor Relations Review, 69(4), 911-938
Waring, A. (2015) Managerial and non-technical factors in the development of human-created disasters: A
review and research agenda. Safety science, 79, pp.254-267
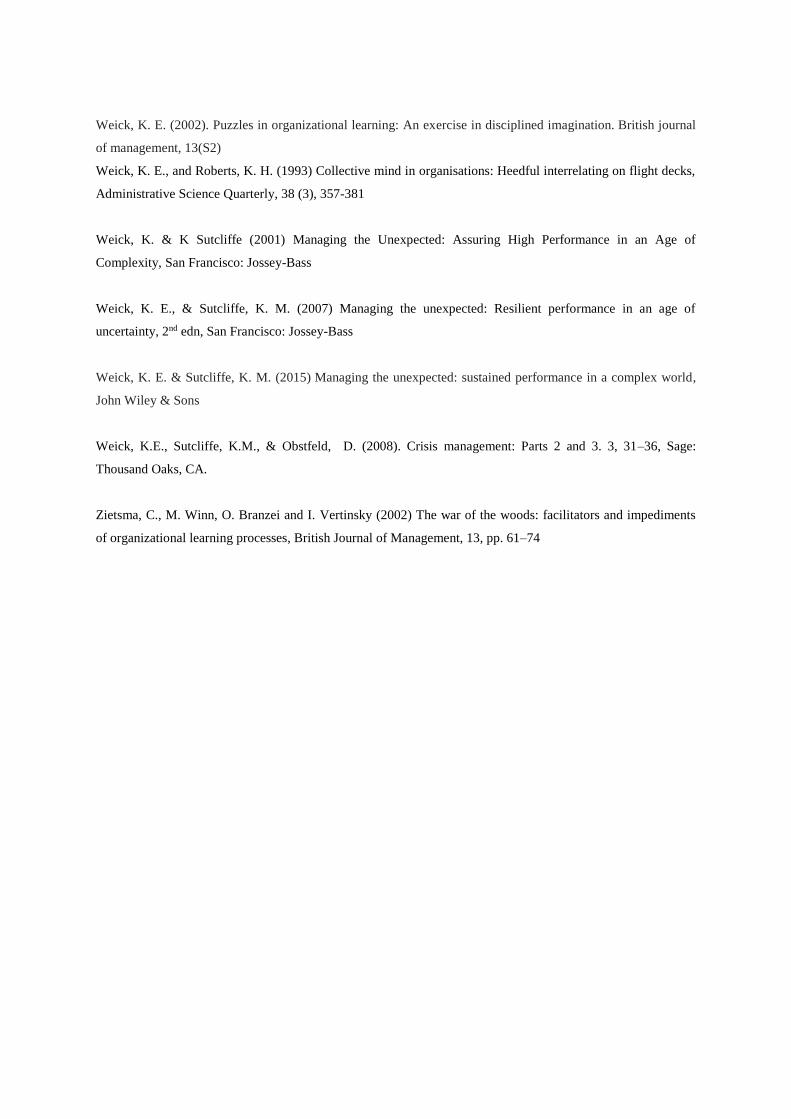
Weick, K. E. (2002). Puzzles in organizational learning: An exercise in disciplined imagination. British journal
of management, 13(S2)
Weick, K. E., and Roberts, K. H. (1993) Collective mind in organisations: Heedful interrelating on flight decks,
Administrative Science Quarterly, 38 (3), 357-381
Weick, K. & K Sutcliffe (2001) Managing the Unexpected: Assuring High Performance in an Age of
Complexity, San Francisco: Jossey-Bass
Weick, K. E., & Sutcliffe, K. M. (2007) Managing the unexpected: Resilient performance in an age of
uncertainty, 2nd edn, San Francisco: Jossey-Bass
Weick, K. E. & Sutcliffe, K. M. (2015) Managing the unexpected: sustained performance in a complex world,
John Wiley & Sons
Weick, K.E., Sutcliffe, K.M., & Obstfeld, D. (2008). Crisis management: Parts 2 and 3. 3, 31–36, Sage:
Thousand Oaks, CA.
Zietsma, C., M. Winn, O. Branzei and I. Vertinsky (2002) The war of the woods: facilitators and impediments
of organizational learning processes, British Journal of Management, 13, pp. 61–74


![[Challenge:Future] Disaster Prevention](https://img.pdfslide.net/doc/110x75/553a72504a7959d9368b4576/challengefuture-disaster-prevention.jpg)