Embed Size (px)
Citation preview
Disclosures on the OHS Financial Risk Paradox: External Reporting to Corporate Monitors or
Mushrooms?
Sharron O'Neill
Kevin Clarke
and
Jack Flanagan
2
Disclosures on the OHS Financial Risk Paradox: External Reporting to Corporate Monitors or Mushrooms?
On July 23, 2009 headlines on the front page of the Australian Financial Review announced
“Poor Safety Record Hits [Company X] Output” (AFR 2009 pp1,19). Stories ran too in The
Sydney Morning Herald and The Age, forecasting a US$5 billion (35%) decrease in earnings
from an expected $15.9 billion to US$10 billion due primarily to the impact of poor safety on
production levels (Fitzgerald 2009b, a). The firm’s seven fatalities during the 2009 financial
year1 followed 11 work-related deaths that had occurred in 2008. Notably, the 2008 Annual
Report Chairman’s Review had cited “another record profit increase of $US15.4 billion, the
seventh consecutive full-year profit increase”, describing it as “a stellar year for the
Company and its shareholders” (Argus 2008 p6) but failing to mention the other result that
had been steadily rising to a record2 level in 2008, namely the deaths of eleven workers
including six company employees. Instead, the Chairman’s Review stated, “our response [to
Asian demand] has been to streamline our business to enable us to produce as much
product as possible within the non-negotiable framework of the highest safety and
environmental standards” (Argus 2008 p6). With the death of three more workers in separate
incidents in the first two months of the 2009 financial year the workers, unions, regulators,
politicians, public and the company’s management had had enough and production was
shutdown on multiple occasions during the year to investigate fatal incidents (AFR 2009;
Fitzgerald 2009a; Stafford 2009).
This example illustrates the financial risk paradox that occupational health and safety
presents for managers and shareholders. On the one hand, higher financial returns may be
realised by those firms prepared to accept higher levels of OHS risk. This is because efforts
to make workplaces more competitive and productive (such as restructuring, downsizing,
intensification of workload and increasing work pace) are often associated with increasing
risk of health and safety failure (Frederick and Lessin 2000, p10; Watson et al. 2003). At the
same time, organisations engaging in OHS training, hazard identification and control
programs incur additional but measurable, implementation expenses (Ginter 1979, Reber et
al. 1993, Chen and Chan 2004). Recognition of this risk – return relationship is the
underpinning motivation for OHS regulation around the globe. 1 In the week immediately following the release of these newspaper articles, the firm reported another two work-
related fatalities at separate incidents in different locations, one on 28th July and the other on 29th. 2 Annual fatalities in the firm’s operations had risen steadily from 3 in 2005 to 11 by 2008. The highest number of
employee fatalities since merger was also reported in 2008 (6 employees). Details of annual employee and contractor fatalities since the company’s formation through merger are as follows: 11 workers in 2002 (no breakdown provided), 3 workers in 2003 (all employees, no contractors), 17 workers in 2004 (five employees 12 contractors), 3 workers in 2005 (all employees, no contractors), 3 workers in 2006 (plus two contractors, one employee), 8 workers in 2007 (three employees, five contractors, total) and 11 workers in 2008 (six employees, five contractors) and 7 workers in 2009 (two employees and five contractors).
3
On the other hand however, where OHS risk results in a serious incident, such as those
causing severe injury, illness or fatality, the financial risk returns are likely to be both
negative and significant. These not only manifest in the form of operational losses, as
illustrated above, but also in regulatory, legal, compensatory and reputational costs. Indeed,
there are numerous examples in which the pursuit of increased productivity or profit has
preceded serious and often catastrophic safety failures. These include the 1988 Piper Alpha
oil rig explosion costing $US 3.4 billion in losses and 167 lives (Whyte 2006, 2009) and the
2006 BP Texas City disaster which killed 15 workers, injured 180 others and led to a US$
87.4 million fine for the firm (Cummins 2006; Fromartz 2006; Clark 2009). The cost-cutting and
cost-benefit analyses implicated in the compromised safety systems which allowed these
disasters to occur have also been suggested as contributory factors in local incidents such
as the 1998 ESSO explosion at Longford, Victoria which killed 2 people, injured 8, left the
city of Melbourne without gas for two weeks and cost the company $2 million in fines and an
estimated $500 million in restoration costs (Hopkins 2000; Gooch 2002). Furthermore,
additional risks associated with OHS failures include the risk of increasing regulation, the
impact of damage to corporate reputation and externalities such as the estimated annual
$55.2 billion3 human cost of work-related injury and illness in Australia.
Given this financial paradox, the way in which managers balance their OHS risk – return
relationship is likely to be of interest to shareholders and other corporate stakeholders.
Indeed, prior research has revealed stakeholder demand for the corporate disclosure of
OHS information and there is a long history of voluntary corporate reporting on OHS in
Annual Reports and more recently in corporate sustainability reports (see for example, Maunders and Foley 1974; Andrew et al. 1989; Guthrie and Parker 1989; Gray et al. 1995; Deegan et
al. 2000; Adams 2004; Brown et al. 2005; Brown and Butcher 2005; O'Neill and Deegan 2009b).
Nevertheless, despite identifying the presence of this OHS information in external reports,
there has been relatively little academic consideration of the quality of this performance data
for shareholder monitoring of OHS risk.
The motivation for this study is therefore rooted in the lack of clarity about the metrics used
by Australian firms to communicate OHS performance, and risk, to shareholders. This study
aims to address this gap by providing empirical evidence as to the dominant OHS
performance metric(s) offered in publicly available corporate reports. These results will
contribute to an understanding of the quality of OHS disclosures by Australian firms and the
3 This reflects the estimated actual cost for the 2005-6 year only and excludes those costs associated with pain, suffering and early death (estimated in prior studies to be an additional 141% of actual cost – see for example (NOHSC 2004)). The total actual annual ‘human cost’ of injury and illness in Australia is estimated at $57.5billion of which approximately 4% is borne by employers and the remaining 96% is borne by external stakeholders (ASCC 2009).
4
extent to which existing practices of reporting on OHS permit shareholders (and other
stakeholders) to draw conclusions about an organisation’s inherent OHS risk.
The structure of this paper is outlined as follows: section two provides a review of the
literature, identifying and critiquing available metrics for evaluating and reporting on OHS
performance. Section three develops a theoretical framework for the study. In section four
the method employed to gather empirical evidence is described and the results are then
presented and discussed in section five. Finally, the conclusions, limitations and
suggestions for further research are presented in section six.
1. Literature review
In the financial markets, corporate financial disclosures provide critical metrics on which
investors, creditors and others rely when assessing a company’s financial performance and
position as an input to economic decision-making. Poor quality information can have an
effect on a company’s share price, credit rating and reputation so it is important that the
financial information reported by companies to investors and creditors has credibility4. Such
credibility is enhanced by the process by which accounting standards are developed as well
as the application, monitoring and enforcement of those standards. The development of
disclosure rules and their monitoring, as required by the Corporations Act 2001, is currently
effected through bodies such as the Australian Accounting Standards Board (AASB) and the
Auditing and Assurance Standards Board (AUASB) and overseen by the Financial
Reporting Council (FRC) and the Australian Securities and Investments Commission (ASIC).
The AASB’s statement of accounting concepts (SAC2) defines the objective of financial
reporting as follows;
The general purpose financial reports are prepared to provide users with
information about the reporting entity which is useful for making and evaluating
decisions about the allocation of scarce resources (ICAA 2009 p3).
The Financial Reporting Handbook (ICAA 2009) suggests that “when general purpose
financial reports meet this objective, they will also be a means by which managements and
governing bodies discharge their accountability to those users” (p3). External financial
reporting requires managers to include information for users about changes in on
organisation’s financial position, performance and risk.
4 After the collapse of several high-profile companies, including Enron in 2001, the International Federation of Accountants (IFAC) commissioned a study aimed at restoring credibility to the financial reporting process internationally (Task Force on Rebuilding Public Confidence in Financial Reporting, (2003) Rebuilding Public Confidence in Financial Reporting, IFAC, New York) so accountants are aware of an ongoing need to monitor the credibility of corporate financial information being disclose
5
There is no specific requirement within existing accounting standards however, for listed
companies to publicly disclose OHS performance data, nor is OHS risk identified as a
specific risk area of concern in AASB reporting requirements. Nevertheless, research has
confirmed the disclosure of OHS performance to be of high importance to stakeholder
groups including shareholders, employees, trade unions, regulators, suppliers, creditors and
academics (Tilt 1994; Deegan et al. 2000; O'Neill and Deegan 2009b). Indeed, a recent
survey of 135 stakeholders found injury and illness severity data to be important to 100% of
respondents and very important to 73% (O'Neill and Deegan 2009b). Given the uncertainty
surrounding the point at which the financial returns associated with operating at particular
levels of OHS risk crystallise into financial penalties, the provision of relevant and reliable
OHS performance information is critical to enable shareholders to make informed
assessments of the risk of OHS failures and the associated financial implications.
The long-standing provision of (primarily non-financial) OHS performance information in
external corporate reports recognises the relevance of this data to the economic decisions
of organisational stakeholders5. Despite this, there has been little critique of the OHS
performance data voluntary provided in annual and sustainability reports with two notable
exceptions. These are Brown and Butcher’s (2005) study of disclosures by New Zealand
firms which identified the rate of lost time through injury to be the most common, but not the
only, measure of injury performance presented and O’Neill and Deegan’s (2009a)
examination of large mining firm disclosures which identified the disclosure of lost time
metrics to be dominant but decreasing over time, while the disclosure of more aggregated
‘recordable injury’ data was increasing. The implications for accountability arising from the
disclosure of these and other OHS outcome metrics are identified below.
OHS performance metrics
The severity of outcomes relating to work-related injuries and illnesses can differ widely. An
injury might, for example, result in a cut finger requiring two stitches that heals in a week or it
may lead to the permanent and total incapacity of an employee. The unit of measurement is
therefore particularly important in any assessment of OHS performance. This is because
outcome severity, in general, and the incidence of long term disability or incapacity, in
particular, is the primary driver of financial and non-financial consequences arising from
OHS failures (NOHSC 2004; McDonald 2006; ASCC 2009). Analysis of Australian economic
data suggests the 64,000 work-related injuries and illnesses that result in full or partial work-
5 It also recognises the importance of OHS information to the decisions of non-financial stakeholders such as employees and other external stakeholders who may have a more ‘social’ interest in the data.
6
related ‘incapacity’6 (14%) account for 88% of the total annual economic cost of $57.5
billion, or 5.9% of GDP (ASCC 2009). Conversely, the 85% of incidents resulting in short or
long term temporary absence account for only 9% of the total cost ($5billion).
Furthermore, the past 20 years of research has provided detailed knowledge of workplace
hazards and OHS cause-effect relationships, rendering the vast majority of OHS damage
fundamentally avoidable (Chhokar 1987; Reason 1993; Borys 2000; Hopkins 2005; Al-Tuwaijri
2008, pvii). Research has also confirmed a robust inverse relationship between the
preventative OHS control efforts of employers and the subsequent frequency and severity of
workplace injury and illness (Ginter 1979; Chelius 1991). Consequently, the ability for
stakeholders to assess changes in the incidence of high severity injury and illness is critical
to any meaningful examination of the financial implications of OHS risk.
However, two alternate approaches to classifying OHS outcomes are evident in the
literature. The first is a severity-focused approach that classifies outcomes according to the
extent of worker impairment. As indicated above, these impairment-based classifications
mirror the differing magnitudes of financial and non-financial consequences associated with
various types of work-related injury and illness outcomes. Consequently these data are
likely to be of interest to a wide range of organisational stakeholders (Hopkins 2006; McDonald
2006; O'Neill 2009; O'Neill and Deegan 2009b). The use of classified indicators of OHS severity
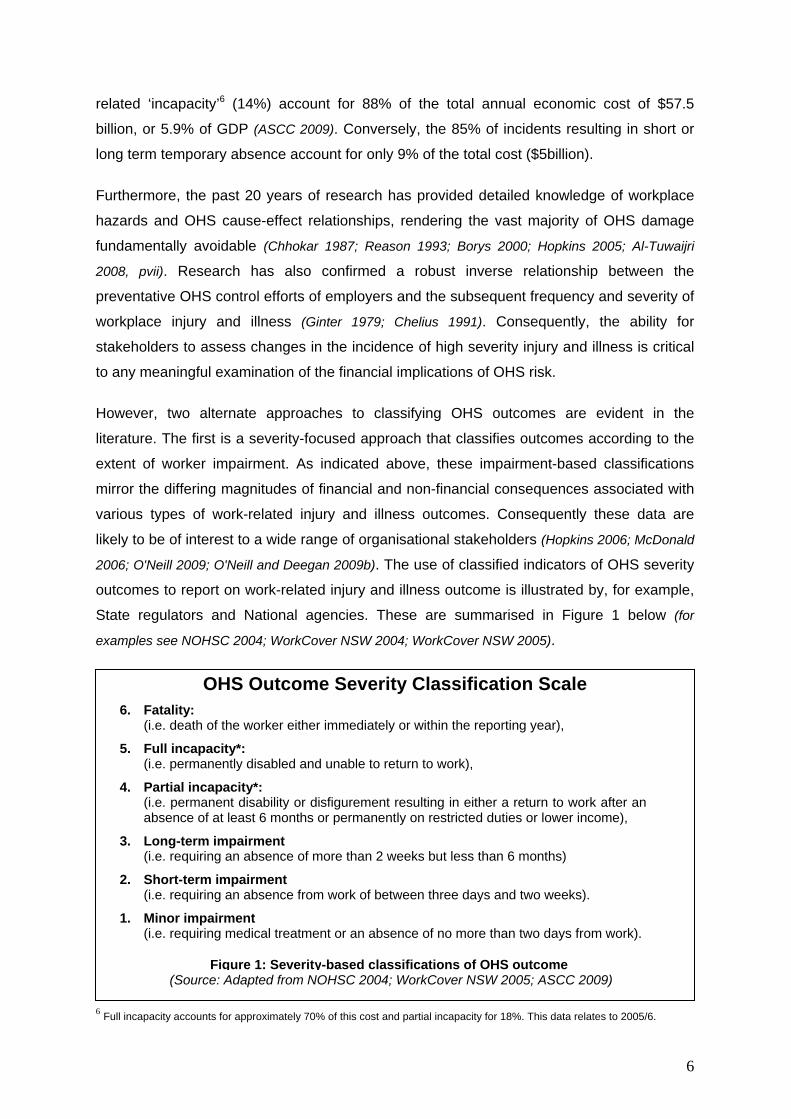
outcomes to report on work-related injury and illness outcome is illustrated by, for example,
State regulators and National agencies. These are summarised in Figure 1 below (for
examples see NOHSC 2004; WorkCover NSW 2004; WorkCover NSW 2005).
OHS Outcome Severity Classification Scale 6. Fatality: (i.e. death of the worker either immediately or within the reporting year),
5. Full incapacity*: (i.e. permanently disabled and unable to return to work),
4. Partial incapacity*: (i.e. permanent disability or disfigurement resulting in either a return to work after an
absence of at least 6 months or permanently on restricted duties or lower income),
3. Long-term impairment (i.e. requiring an absence of more than 2 weeks but less than 6 months)
2. Short-term impairment (i.e. requiring an absence from work of between three days and two weeks).
1. Minor impairment (i.e. requiring medical treatment or an absence of no more than two days from work).
(Source: Adapted from NOHSC 2004; WorkCover NSW 2005; ASCC 2009) 6 Full incapacity accounts for approximately 70% of this cost and partial incapacity for 18%. This data relates to 2005/6.
Figure 1: Severity-based classifications of OHS outcome
7
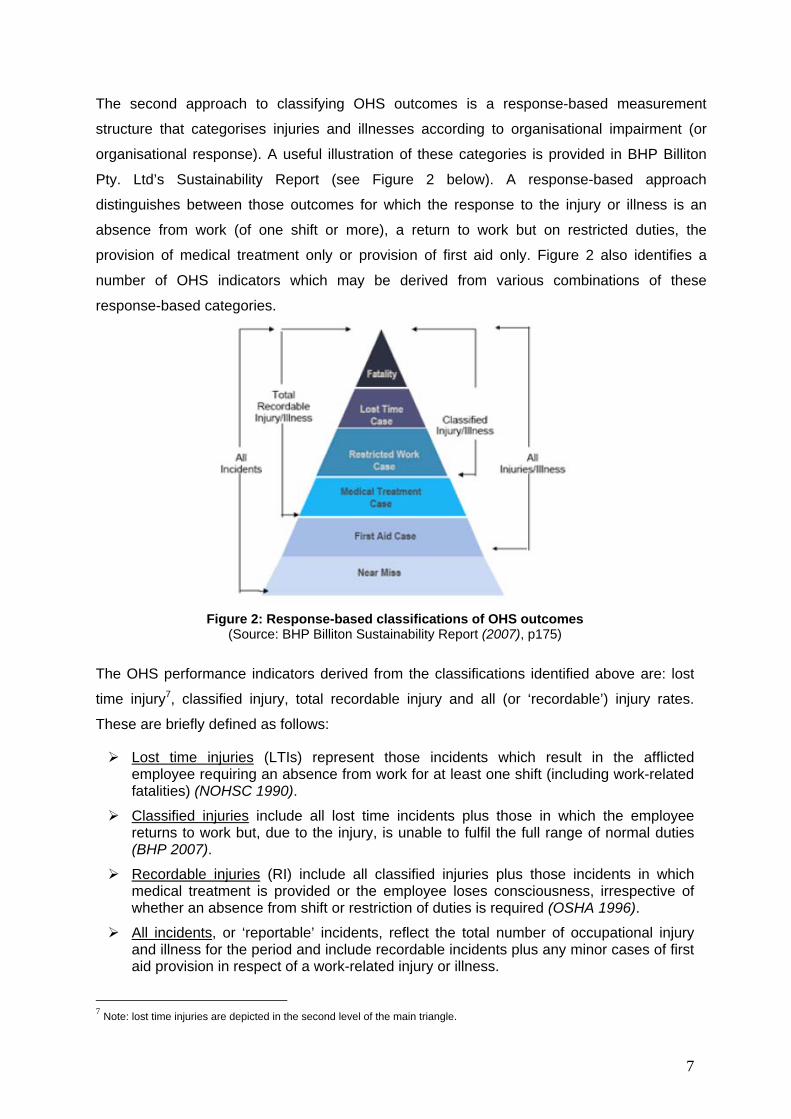
The second approach to classifying OHS outcomes is a response-based measurement
structure that categorises injuries and illnesses according to organisational impairment (or
organisational response). A useful illustration of these categories is provided in BHP Billiton
Pty. Ltd’s Sustainability Report (see Figure 2 below). A response-based approach
distinguishes between those outcomes for which the response to the injury or illness is an
absence from work (of one shift or more), a return to work but on restricted duties, the
provision of medical treatment only or provision of first aid only. Figure 2 also identifies a
number of OHS indicators which may be derived from various combinations of these
response-based categories.
Figure 2: Response-based classifications of OHS outcomes
(Source: BHP Billiton Sustainability Report (2007), p175)
The OHS performance indicators derived from the classifications identified above are: lost
time injury7, classified injury, total recordable injury and all (or ‘recordable’) injury rates.
These are briefly defined as follows:
Lost time injuries (LTIs) represent those incidents which result in the afflicted employee requiring an absence from work for at least one shift (including work-related fatalities) (NOHSC 1990).
Classified injuries include all lost time incidents plus those in which the employee returns to work but, due to the injury, is unable to fulfil the full range of normal duties (BHP 2007).
Recordable injuries (RI) include all classified injuries plus those incidents in which medical treatment is provided or the employee loses consciousness, irrespective of whether an absence from shift or restriction of duties is required (OSHA 1996).
All incidents, or ‘reportable’ incidents, reflect the total number of occupational injury and illness for the period and include recordable incidents plus any minor cases of first aid provision in respect of a work-related injury or illness.
7 Note: lost time injuries are depicted in the second level of the main triangle.
8
Notably, the least aggregated of these response-based classifications, lost time injury,
accumulates all category 2, 3, 4, 5 and 6 OHS outcomes identified in the severity scale
above, from those resulting in a single day’s absence from work through to fatality. This
level of data aggregation means that while differences in the number of lost time or
recordable injuries can reflect changes in the number of workers’ compensation claims
lodged, they are generally poor indicators of the level of financial risk associated with the
incidence of serious injury and illness (categories 4-5 in particular).
By measuring the total number of days lost due to injury and illness in each response-based
category, highly aggregated measures of outcome severity, such as an average rate of
days lost per injury, may be derived. However again, the relatively high volume of low
consequence outcomes may render invisible changes in the number of serious incidents.
Consequently, response-based metrics are typically incapable of providing useful
information on serious OHS outcomes8 (Hopkins 1994; Horwitz and McCall 2004; O'Neill et al.
2008). This review has demonstrated that while measures of OHS outcome severity are
critical for assessing financial and non-financial OHS risk, different approaches to
measuring and communicating severity are available. Those performance indicators based
around categories of worker impairment are clearly more capable providing insight into
changes in OHS risk, and therefore more relevant to shareholders, than those based on
increasingly aggregated classifications organisational response (or treatment).
Guidance for external reporting on OHS performance
The accounting profession has, to date, failed to provide either an accounting standard or
other recommendations to guide corporate external reporting on OHS performance. Given
the absence of interest from the accounting profession, the safety profession has recently
begun to consider the development of a clear OHS performance assessment and reporting
framework9. This is likely to extend to listed companies the framework offered by the
Occupational Health and Safety (Commonwealth employees) Act which requires Public
Sector organisations to report on OHS using severity based classifications of performance.
Until such a framework for external reporting is developed however, Australian firms may
instead refer to the Australian Standard, AS1885: Australian National Injury Recording
Standard (NOHSC 1990) and apply the guidelines for internal review to external disclosure.
In particular, AS1885 provides guidelines to managers for evaluating the effectiveness of
OHS controls and recommends organisations monitor three key aspects of OHS
8 For a detailed comparison of severity-based versus treatment-based indicators see O’Neill et.al. (2008) 9 The peak Australian OHS professional body, the Safety Institute of Australia, has recently begun a National project to develop an OHS performance measurement and reporting framework.
9
performance: the incidence of injury or disease, the frequency of injury or disease and the
severity of injury or disease. AS1885 proposed to measure severity using a highly
aggregated indicator, the Average Time Lost Rate (ATLR), which measures the total days
lost to any injury or illness as a proportion of the total number of injury or illness incidents
(see Table 1 below). Identification of changes in average overall severity may be possible10
although the Average Time Lost Rate is unlikely to permit users to distinguish between
changes in the most relevant (severity category 4 and 5) incidents relative to the typically
high volume but low consequence (category 2 and 3) incidents.
Alternatively, Australian firms may look to the European-based Global Reporting Initiative’s
(GRI) sustainability reporting guidelines for direction on external corporate OHS disclosure.
Within the ever more global marketplace, the GRI guidelines appear increasingly
institutionalised in corporate social reporting practice. They are also promoted by Australian
industry and professional associations11, including both CPA Australia and the Institute of
Chartered Accountants in Australia, as appropriate models for external reporting on CSR
performance issues (CPA Australia 2007, 2008; ICAA 2008).
Unlike AS1885, the GRI guidelines focus specifically on providing a framework for external
corporate social responsibility (or sustainability) reporting. GRI recommendations for
reporting on OHS performance also advocate the presentation of indicators of occupational
injury and illness incidence, frequency and severity although incidence is limited to the
incidence of fatality only and severity is measured as a Lost Day Rate (calculated as total
number of lost days as a proportion of total hours worked). Unfortunately, the GRI’s lost day
rate provides a less useful measure of serious incapacity than that offered by AS1885 above
because it measures lost days as a rate of total hours worked (rather than total incidents).
This means a high LDR may simply signify change in the number, rather than severity, of
injuries and illnesses. The OHS performance indicators recommended by both the GRI
guidelines and the AS1885 Australian Standard are contrasted in Table 1 below.
Issuing Body Indicator(s) Note Standards Australia: AS1885.1 (Australia)
• Average lost time rate (days lost per lost time incidents)
• Lost time injury incidence • Lost time injury frequency rate
Lost time definition excludes all commuting injuries, restricted duties and all non-compensated injury or disease (see http://www.saiglobal.com).
Global reporting initiative: LA7 (OHS) Indicators
(Multi-national)
• Lost day rate (per 200,000 hours worked) • Lost time injury frequency rate • Number of fatalities
Lost day definition includes commuting injuries but excludes restricted duties
(see http://www.globalreporting.org)
Table 1: Recommendations for evaluating OHS performance 10 An exception may exist where there are significant changes in the volume of high, versus low consequence incidents. 11 See for example, recommendations for public reporting offered by CPA Australia, the Institute of Chartered Accountants.
10
Together, three alternative approaches to quantifying and reporting on OHS outcome
severity are identified above. These include stratified measures of OHS severity (as
identified in Figure 1) and the two average duration rates identified in Table 1 above.
Clearly, the stratified severity approach will provide the most relevant and reliable data on
changes in OHS severity and will therefore be the most relevant of the three approaches for
informing shareholders and other stakeholders about changes in OHS risk. However, in the
absence of mandatory OHS reporting requirements, or other directives to guide the choice
of metrics used within and reported by organisations, managers are free to choose the
approach they consider most appropriate. As noted above, there has to date been limited
academic critique of current OHS disclosures practices. This study therefore seeks to
identify and explain the choice of metrics used to report externally on OHS performance.
2. Theory development
A potential explanation for a manger’s choice of OHS accounting method, or in this case
choice of reported OHS performance indicators, may be offered by positive accounting
theory. Jensen and Meckling (1976) defined the agency relationship as a contract in which
one or more principals (shareholders) engage an agent (the manager) “to perform some
service on their behalf which involves delegating some decision-making authority to the
agent” (p308). Within this principal – agent relationship, information asymmetries exist which
may permit adverse selection. That is, enable the manager to use private information to
engage in activities different from that desired by the shareholder, with the information
asymmetry “rendering the principal incapable of determining whether the agent made the
appropriate choice” (Belkaoui and Jones 2000 p375). In this case, information asymmetry
exists because managers (agents) may have private information about the existing level of
OHS risk and the extent to which controls for health and safety hazards are both employed
and effective. OHS failures can have potentially significant financial implications which are
not readily visible to shareholders. The nature of accountability therefore requires the agent
(manager) to engage in actions toward the achievement of a particular goal, such as
effective prevention of serious injury, and that these actions, and consequences, be
“rendered visible by some form of account(ing)” (Power 1991 p32).
Since both agent and principal are “assumed to be motivated by self-interest… but also
aware of their common interest”, they are likely to engage in monitoring behaviour (Belkaoui
and Jones 2000 p374). Shareholders can use accounting information as one means of
monitoring and enforcing contracts so as to reduce the agency costs associated with
opportunistic or dysfunctional behaviours while corporate managers have an incentive to
disclose information to shareholders to demonstrate they are not acting in a manner
11
detrimental to shareholder interests (Belkaoui and Jones 2000; Gaffikin 2008; Deegan 2009). The
provision of OHS disclosures will be most relevant where the inherent operational health
and safety risk is high. This suggests that managers of firms operating in industries
perceived to be hazardous are likely to provide voluntary OHS disclosures to stakeholders.
These seek to reduce agency costs by demonstrating that OHS risk is managed effectively
and the risk of high OHS failure cost is therefore low. The following proposition is offered:
P1: Managers of firms operating in high (OHS) risk industries will provide OHS performance information to shareholders.
Furthermore, Watts and Zimmerman (1978) suggest that individuals are innovative and
resourceful in pursuing their self-interest, with “the obvious implication…[being] that
management lobbies on accounting standards based on its own self-interest” (p113) and
selects accounting methods that promote wealth-maximisation and avoid political costs
(Belkaoui and Jones 2000). As outlined above, higher financial returns may be available for
those firms, and workers, prepared to accept higher levels of OHS risk. Consequently
employers may lack the incentive to invest in injury and illness prevention at socially
desirable levels (Chelius 1991). Conversely however, should serious injury occur (failures
resulting in incapacity or fatality) the financial and political consequences can be significant.
This presents a clear risk paradox.
The political cost hypothesis suggests that politically sensitive firms will seek to reduce the
possibility of adverse attention, and the related costs of this attention, by adopting
accounting methods that lead to a reduction in reported profits (Watts and Zimmerman 1978).
These seek to avoid political sanctions that may be associated with excess profits. This
assumes however, that “at least some users of accounting information must be unable or
unwilling to unravel completely the effects of earnings management” (Fields et al. 2001 p260).
Deegan (2006) describes this as the ability of managers “to fool those involved in the
political process” although he also suggests that some “individuals will elect to remain
rationally uninformed” (p251).
Extending this argument to voluntary disclosures on OHS performance suggests managers
will seek to avoid the political costs, and related sanctions, that may be associated with
those OHS failures resulting in serious injury and illness. They will therefore choose from the
available suite of metrics, those OHS indicators which do not explicitly draw attention to
serious OHS outcomes. As noted above, the most relevant indicators for communicating
OHS performance to shareholders and other stakeholders are based on total fatal and non-
fatal OHS outcomes and severity indicators of permanent (category 4 & 5) versus temporary
(category 2 & 3) impairment. This extension of the political cost hypothesis suggests
12
managers are more likely to instead choose to avoid disclosing fatality data and instead of
presenting stratified severity metrics, disclose only average injury duration rates. These
duration rates could be perceived by less informed users as discharging accountability for
serious injury (severity) despite their inability to highlight changes in the serious incapacities
that drive financial and non-financial OHS outcomes. The second proposition is therefore;
P2: Managers are likely to provide an aggregated measure of injury and illness duration rather than impairment-based performance indicators of outcome severity.
The ability for managers to communicate OHS performance using aggregated duration,
rather than severity measures, assumes, as Deegan (2006) suggests, that at least some
users are either unable or unwilling to appreciate the effect of the choice of accounting
method (OHS indicator) on the quality of information provided. The extent to which duration
measures are provided, and accepted, as metrics for monitoring the severity of OHS
outcomes will reflect the ability of shareholders to make an informed assessment of the OHS
risk to which they are ultimately exposed.
3. Method
Previous research has identified that large firms are more likely than small firms to report to
stakeholders on corporate social and environmental information (of which OHS performance
is a part), with the relationship between organisational size and disclosure described as
“empirically robust” (Milne 2002). The present study therefore targeted for examination
Annual and Sustainability Reports issued by the largest 50 firms listed on the Australian
Stock Exchange (ASX) in November 2007. These comprised a range of industries, from
those with an historically high rate of serious injury and illness, such as mining and energy,
manufacturing and utilities to those with historically lower rates such as retail, insurance and
finance (see Appendix 1 for a complete list of sampled firms, by industry). To evaluate the
stability of OHS metrics presented over time and the influence of the GRI guidelines on
reporting, reports issued at equal points across the previous decade were reviewed. The
study therefore targeted reports issued in the years 1997, 2000, 2003 and 2006.
Annual Reports for each of the 50 firms were located and downloaded from the Connect 4
database. The corporate website for each firm was then examined to locate publicly
available Sustainability Reports. A substantial increase in CSR reporting over time was
identified with no sampled firms producing a stand-alone sustainability report in 1997 and
44% of sampled firms releasing sustainability reports in 2006. The final sample comprised
182 Annual Reports and 33 Sustainability Reports, a total of 215 corporate reports. Table 2
13
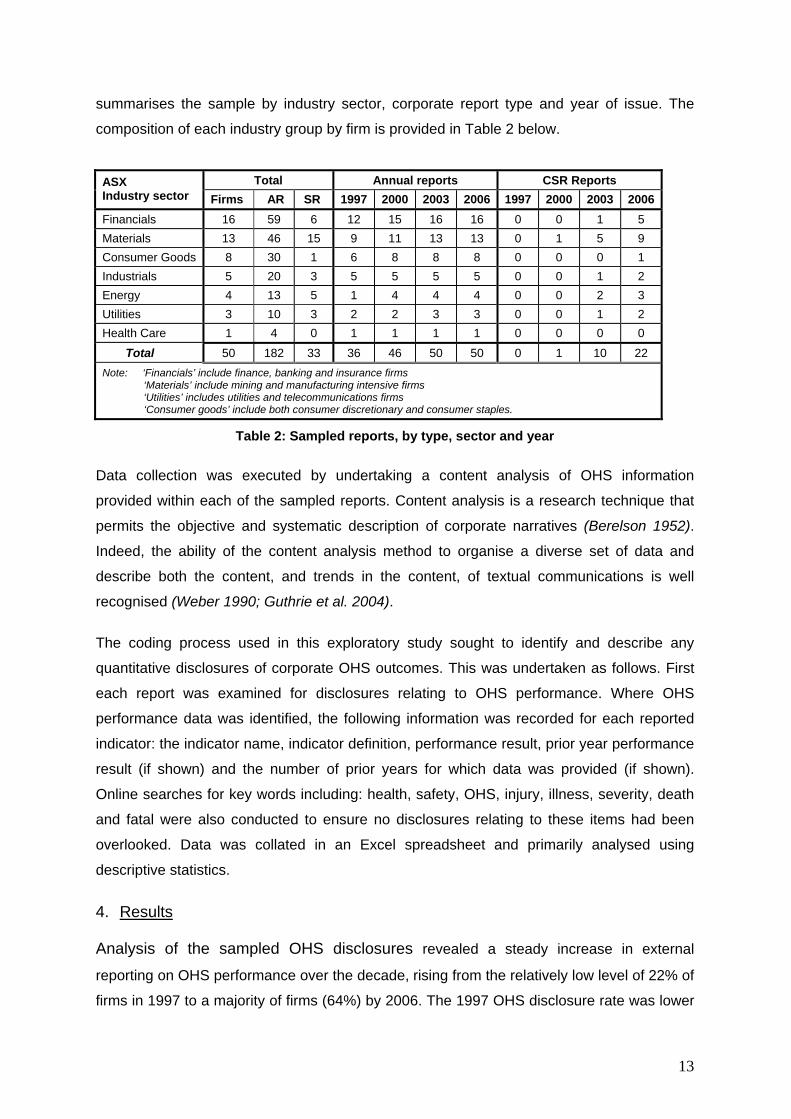
summarises the sample by industry sector, corporate report type and year of issue. The
composition of each industry group by firm is provided in Table 2 below.
Total Annual reports CSR Reports ASX Industry sector Firms AR SR 1997 2000 2003 2006 1997 2000 2003 2006Financials 16 59 6 12 15 16 16 0 0 1 5 Materials 13 46 15 9 11 13 13 0 1 5 9 Consumer Goods 8 30 1 6 8 8 8 0 0 0 1 Industrials 5 20 3 5 5 5 5 0 0 1 2 Energy 4 13 5 1 4 4 4 0 0 2 3 Utilities 3 10 3 2 2 3 3 0 0 1 2 Health Care 1 4 0 1 1 1 1 0 0 0 0
Total 50 182 33 36 46 50 50 0 1 10 22 Note: ‘Financials’ include finance, banking and insurance firms ‘Materials’ include mining and manufacturing intensive firms ‘Utilities’ includes utilities and telecommunications firms ‘Consumer goods’ include both consumer discretionary and consumer staples.
Table 2: Sampled reports, by type, sector and year
Data collection was executed by undertaking a content analysis of OHS information
provided within each of the sampled reports. Content analysis is a research technique that
permits the objective and systematic description of corporate narratives (Berelson 1952).
Indeed, the ability of the content analysis method to organise a diverse set of data and
describe both the content, and trends in the content, of textual communications is well
recognised (Weber 1990; Guthrie et al. 2004).
The coding process used in this exploratory study sought to identify and describe any
quantitative disclosures of corporate OHS outcomes. This was undertaken as follows. First
each report was examined for disclosures relating to OHS performance. Where OHS
performance data was identified, the following information was recorded for each reported
indicator: the indicator name, indicator definition, performance result, prior year performance
result (if shown) and the number of prior years for which data was provided (if shown).
Online searches for key words including: health, safety, OHS, injury, illness, severity, death
and fatal were also conducted to ensure no disclosures relating to these items had been
overlooked. Data was collated in an Excel spreadsheet and primarily analysed using
descriptive statistics.
4. Results
Analysis of the sampled OHS disclosures revealed a steady increase in external
reporting on OHS performance over the decade, rising from the relatively low level of 22% of
firms in 1997 to a majority of firms (64%) by 2006. The 1997 OHS disclosure rate was lower
14
than expected given that prior CSR disclosure research has identified OHS information to be
the most common CSR disclosures offered by large firms (for example see Guthrie and Parker
1989; Kolk 2003; Brown et al. 2005; Brown and Butcher 2005; Vuontisjarva 2006).
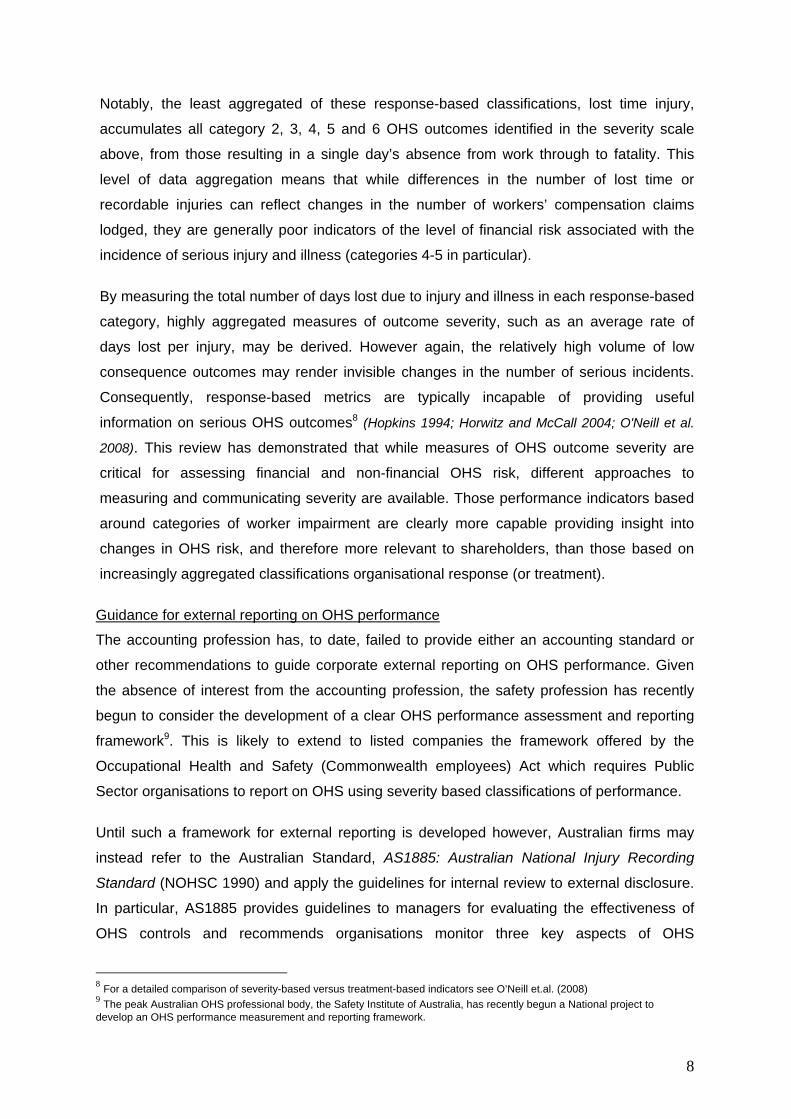
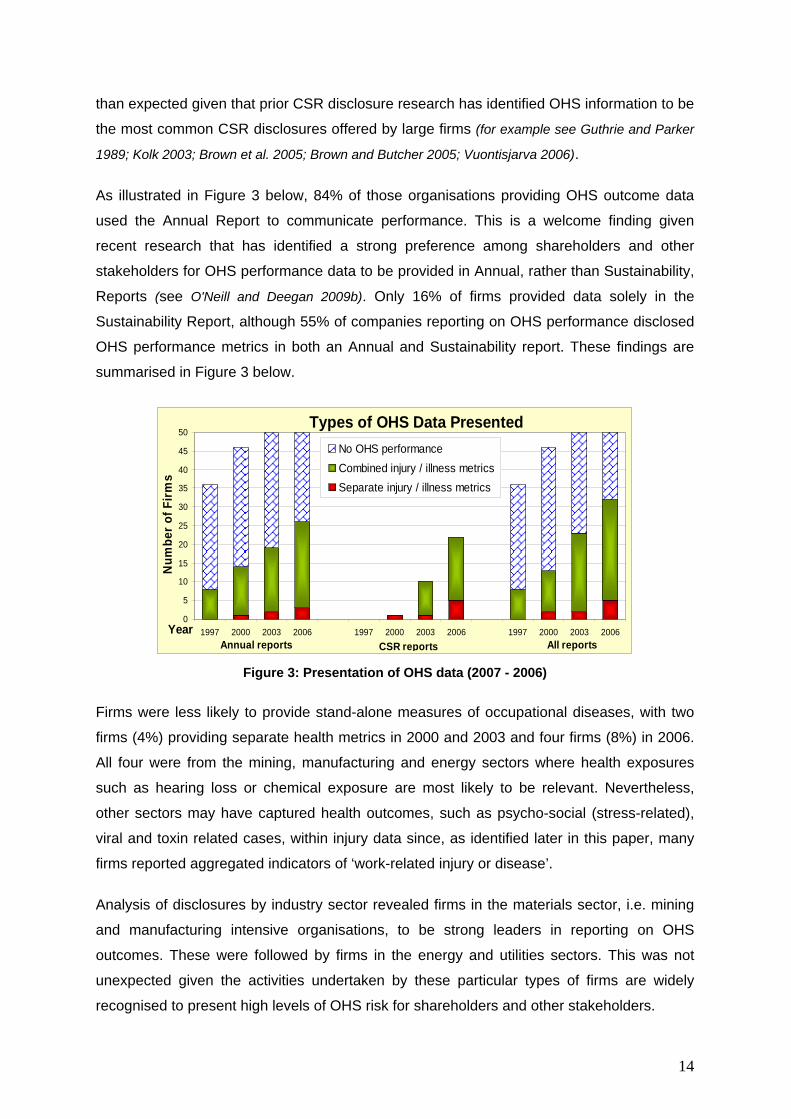
As illustrated in Figure 3 below, 84% of those organisations providing OHS outcome data
used the Annual Report to communicate performance. This is a welcome finding given
recent research that has identified a strong preference among shareholders and other
stakeholders for OHS performance data to be provided in Annual, rather than Sustainability,
Reports (see O'Neill and Deegan 2009b). Only 16% of firms provided data solely in the
Sustainability Report, although 55% of companies reporting on OHS performance disclosed
OHS performance metrics in both an Annual and Sustainability report. These findings are
summarised in Figure 3 below.
Types of OHS Data Presented
0
5
10
15
20
25
30
35
40
45
50
1997 2000 2003 2006 1997 2000 2003 2006 1997 2000 2003 2006Year
Num
ber o
f Firm
s
No OHS performanceCombined injury / illness metricsSeparate injury / illness metrics
Annual reports CSR reports All reports Figure 3: Presentation of OHS data (2007 - 2006)
Firms were less likely to provide stand-alone measures of occupational diseases, with two
firms (4%) providing separate health metrics in 2000 and 2003 and four firms (8%) in 2006.
All four were from the mining, manufacturing and energy sectors where health exposures
such as hearing loss or chemical exposure are most likely to be relevant. Nevertheless,
other sectors may have captured health outcomes, such as psycho-social (stress-related),
viral and toxin related cases, within injury data since, as identified later in this paper, many
firms reported aggregated indicators of ‘work-related injury or disease’.
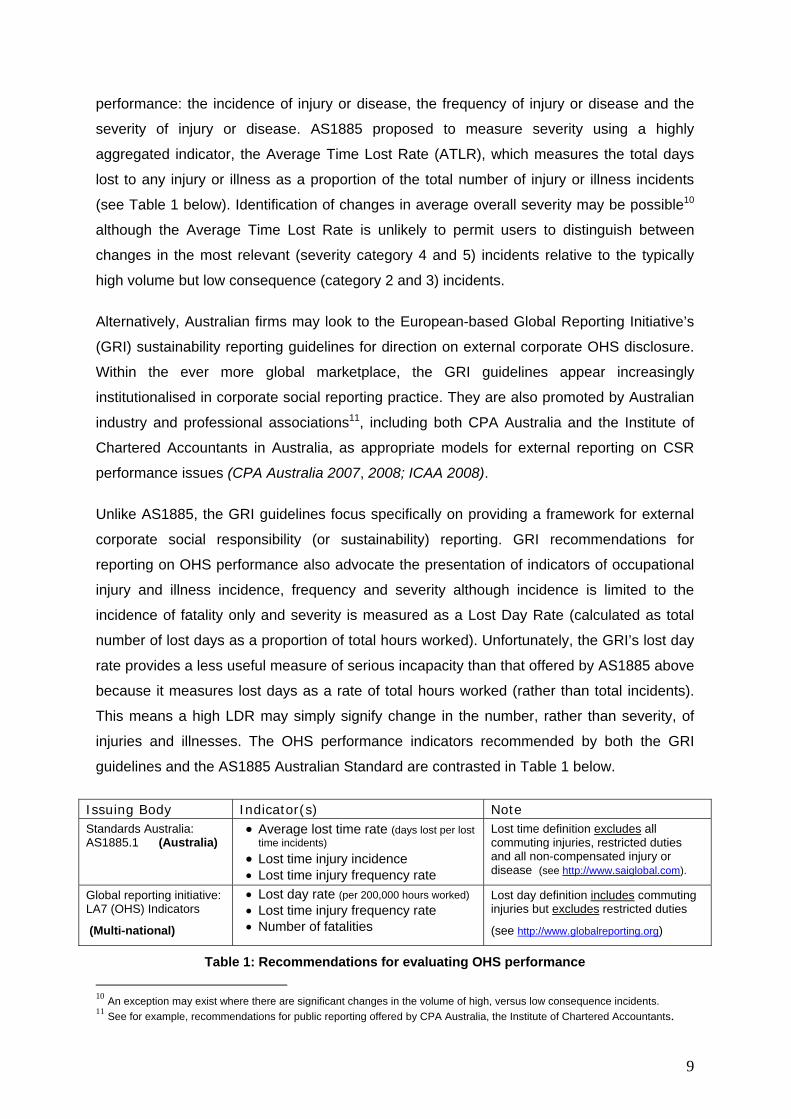
Analysis of disclosures by industry sector revealed firms in the materials sector, i.e. mining
and manufacturing intensive organisations, to be strong leaders in reporting on OHS
outcomes. These were followed by firms in the energy and utilities sectors. This was not
unexpected given the activities undertaken by these particular types of firms are widely
recognised to present high levels of OHS risk for shareholders and other stakeholders.
15
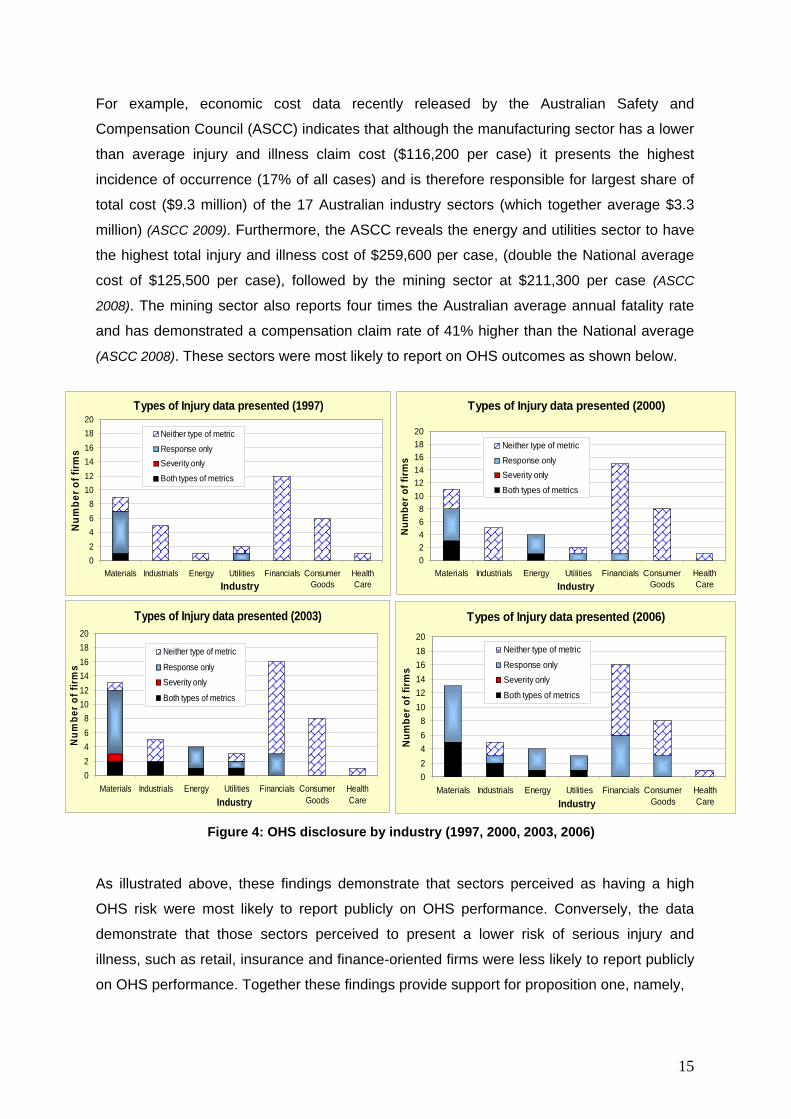
For example, economic cost data recently released by the Australian Safety and
Compensation Council (ASCC) indicates that although the manufacturing sector has a lower
than average injury and illness claim cost ($116,200 per case) it presents the highest
incidence of occurrence (17% of all cases) and is therefore responsible for largest share of
total cost ($9.3 million) of the 17 Australian industry sectors (which together average $3.3
million) (ASCC 2009). Furthermore, the ASCC reveals the energy and utilities sector to have
the highest total injury and illness cost of $259,600 per case, (double the National average
cost of $125,500 per case), followed by the mining sector at $211,300 per case (ASCC
2008). The mining sector also reports four times the Australian average annual fatality rate
and has demonstrated a compensation claim rate of 41% higher than the National average
(ASCC 2008). These sectors were most likely to report on OHS outcomes as shown below.
Types of Injury data presented (1997)
02468
101214161820
Materials Industrials Energy Utilities Financials ConsumerGoods
HealthCareIndustry
Num
ber o
f firm
s
Neither type of metric
Response onlySeverity only
Both types of metrics
Types of Injury data presented (2000)
02468
101214161820
Materials Industrials Energy Utilities Financials ConsumerGoods
HealthCareIndustry
Num
ber o
f firm
s
Neither type of metric
Response onlySeverity only
Both types of metrics
Types of Injury data presented (2003)
02468
101214161820
Materials Industrials Energy Utilities Financials ConsumerGoods
HealthCareIndustry
Num
ber o
f firm
s
Neither type of metric
Response onlySeverity only
Both types of metrics
Types of Injury data presented (2006)
02468
101214161820
Materials Industrials Energy Utilities Financials ConsumerGoods
HealthCareIndustry
Num
ber o
f firm
s
Neither type of metric
Response onlySeverity only
Both types of metrics
Figure 4: OHS disclosure by industry (1997, 2000, 2003, 2006)
As illustrated above, these findings demonstrate that sectors perceived as having a high
OHS risk were most likely to report publicly on OHS performance. Conversely, the data
demonstrate that those sectors perceived to present a lower risk of serious injury and
illness, such as retail, insurance and finance-oriented firms were less likely to report publicly
on OHS performance. Together these findings provide support for proposition one, namely,
16
P1: Managers of firms operating in high (OHS) risk industries will provide
OHS performance information to shareholders.
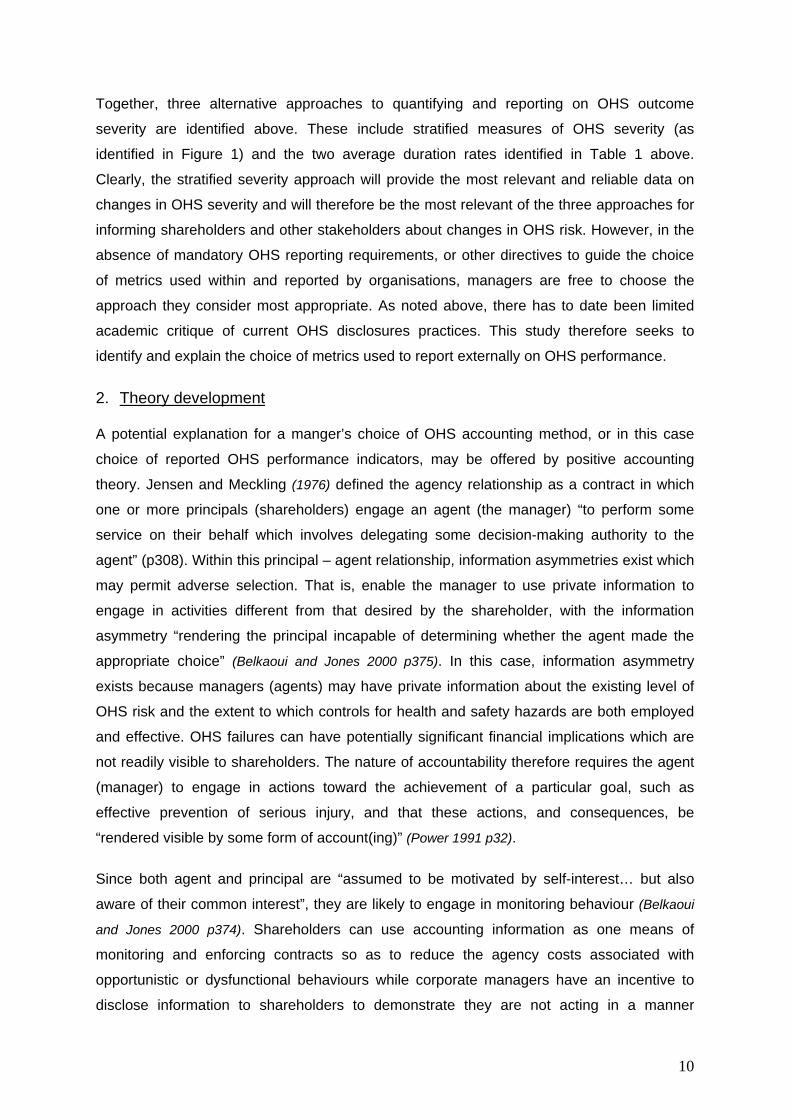
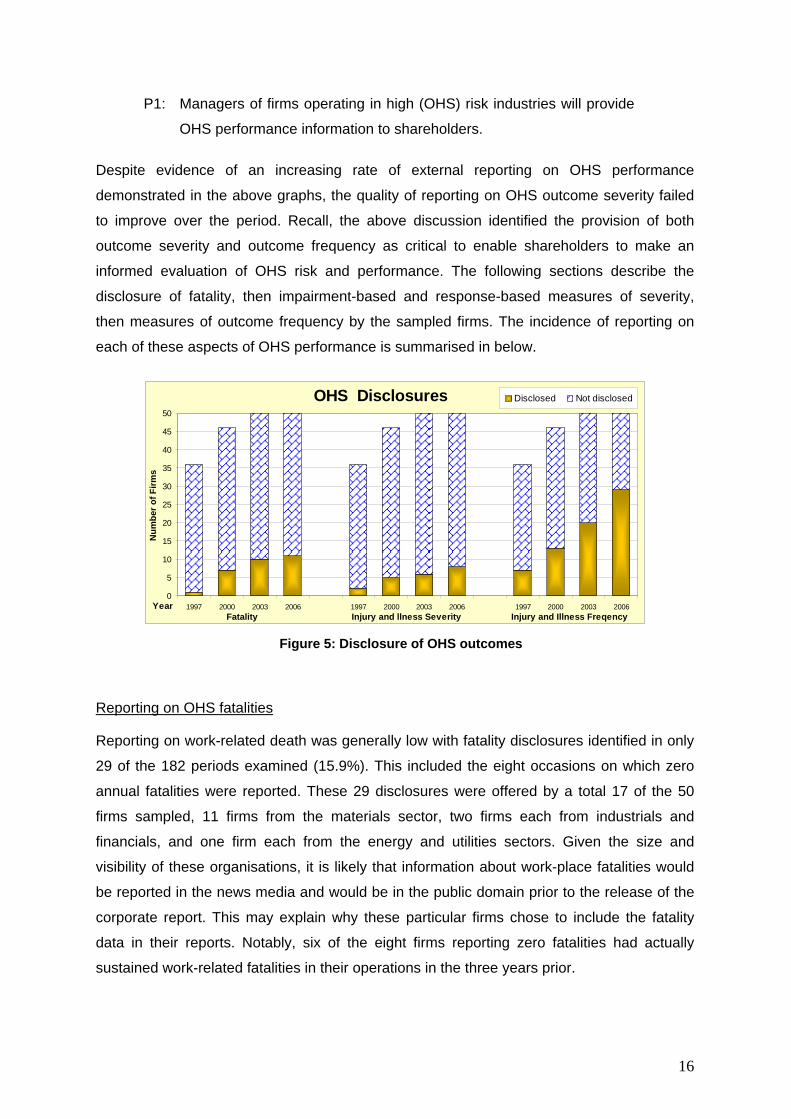
Despite evidence of an increasing rate of external reporting on OHS performance
demonstrated in the above graphs, the quality of reporting on OHS outcome severity failed
to improve over the period. Recall, the above discussion identified the provision of both
outcome severity and outcome frequency as critical to enable shareholders to make an
informed evaluation of OHS risk and performance. The following sections describe the
disclosure of fatality, then impairment-based and response-based measures of severity,
then measures of outcome frequency by the sampled firms. The incidence of reporting on
each of these aspects of OHS performance is summarised in below.
OHS Disclosures
0
5
10
15
20
25
30
35
40
45
50
1997 2000 2003 2006 1997 2000 2003 2006 1997 2000 2003 2006Year
Num
ber o
f Firm
s
Disclosed Not disclosed
Fatality Injury and llness Severity Injury and Illness Freqency Figure 5: Disclosure of OHS outcomes
Reporting on OHS fatalities
Reporting on work-related death was generally low with fatality disclosures identified in only
29 of the 182 periods examined (15.9%). This included the eight occasions on which zero
annual fatalities were reported. These 29 disclosures were offered by a total 17 of the 50
firms sampled, 11 firms from the materials sector, two firms each from industrials and
financials, and one firm each from the energy and utilities sectors. Given the size and
visibility of these organisations, it is likely that information about work-place fatalities would
be reported in the news media and would be in the public domain prior to the release of the
corporate report. This may explain why these particular firms chose to include the fatality
data in their reports. Notably, six of the eight firms reporting zero fatalities had actually
sustained work-related fatalities in their operations in the three years prior.
17
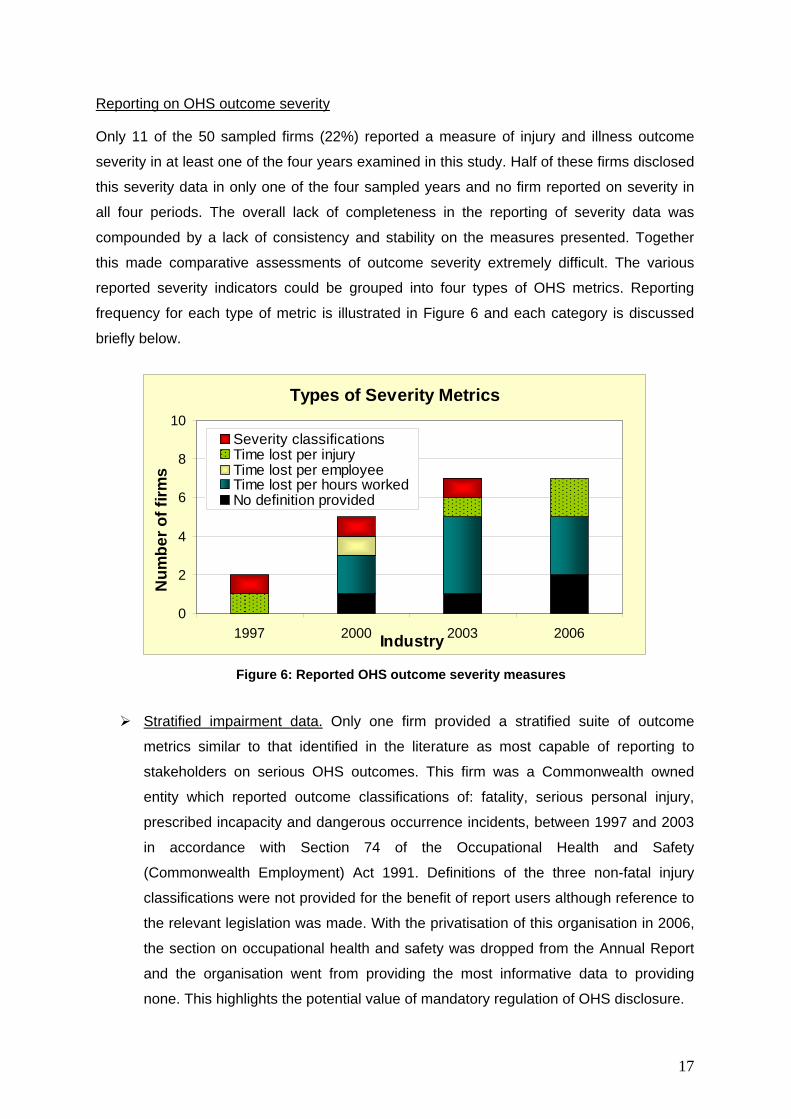
Reporting on OHS outcome severity
Only 11 of the 50 sampled firms (22%) reported a measure of injury and illness outcome
severity in at least one of the four years examined in this study. Half of these firms disclosed
this severity data in only one of the four sampled years and no firm reported on severity in
all four periods. The overall lack of completeness in the reporting of severity data was
compounded by a lack of consistency and stability on the measures presented. Together
this made comparative assessments of outcome severity extremely difficult. The various
reported severity indicators could be grouped into four types of OHS metrics. Reporting
frequency for each type of metric is illustrated in Figure 6 and each category is discussed
briefly below.
Types of Severity Metrics
0
2
4
6
8
10
1997 2000 2003 2006Industry
Num
ber o
f firm
s
Severity classificationsTime lost per injuryTime lost per employeeTime lost per hours workedNo definition provided
Figure 6: Reported OHS outcome severity measures
Stratified impairment data. Only one firm provided a stratified suite of outcome
metrics similar to that identified in the literature as most capable of reporting to
stakeholders on serious OHS outcomes. This firm was a Commonwealth owned
entity which reported outcome classifications of: fatality, serious personal injury,
prescribed incapacity and dangerous occurrence incidents, between 1997 and 2003
in accordance with Section 74 of the Occupational Health and Safety
(Commonwealth Employment) Act 1991. Definitions of the three non-fatal injury
classifications were not provided for the benefit of report users although reference to
the relevant legislation was made. With the privatisation of this organisation in 2006,
the section on occupational health and safety was dropped from the Annual Report
and the organisation went from providing the most informative data to providing
none. This highlights the potential value of mandatory regulation of OHS disclosure.
18
Time lost per incident. A single, aggregated measure of ‘time lost per injury’ was
reported by four firms: one ‘materials’ firm in 1997 only, one ‘industrials’ firm in 2003
and 2006 only, and a second ‘materials’ firm and one ‘utilities’ firm each in 2006 only.
As shown in Appendix 2 these firms appeared to adopt one of three different
calculation methods. The two materials firms reported measures of days per lost time
injury (each in one year only), the utilities firm reported a measure of ‘days away due
to lost time or restricted duties per injury’ in 2003 only while the ‘industrials’ firm
reported an ALTR, a measure of “average number of actual days lost due to an LTI”
in 2003 and 2006 which “includes permanent contractor hours and injuries”. This
ALTR indicator appeared to capture time lost per injury although the denominator
was not explicitly stated.
Each of these ‘time lost per injury’ metrics broadly reflected the duration indicator
recommended by the Australian Standard, AS1885. The rate of reporting on duration
per injury was however was very low. This may reflect either a reluctance to report
injury and illness duration or may demonstrate a lack of attention to this Australian
Standard by sampled firms12.
Time lost per employee. Also illustrated in Figure 6 is the single instance in which an
indicator of ‘time lost per employee’ was reported. This was disclosed by Firm 6 in
the year 2000 only. This aggregated duration metric has decreasing significance as
the total number of employees increase. Firm 6 went on to report an equally less
informative measure of ‘time lost per time worked’ in the 2003 Annual Report and
failed to provide any measure of severity in 2006.
Time lost per time worked. This was the most commonly reported measure of
duration with six firms reporting a duration rate of time lost per time worked and a
further two firms reporting what appeared to be duration metrics although neither
were adequately defined in the respective reports. Interestingly, only two firms
employed the GRI’s recommended duration rate of days lost per 200,000 hours.
Three other firms reported an alternate rate of days lost per 1,000,000 hours. If two
firms with the same underlying performance were to each report one of these ‘Injury
severity’ indicators, the results provided by the firm using 1,000,000 hours would
appear five times more favourable than the firm using 200,000. Stakeholders who
failed to read the fine print may not realise that the indicators present quite different
assessments of performance.
12 Note: various Australian Standards have attracted criticism for not being made publicly available to firms. Instead
organisations seeking to apply the standards need to purchase copies from SAI Global.
19
Furthermore, firms did not report the same types of metrics consistently over time.
One materials firm changed from reporting an average time lost per injury metric in
2000 to the less relevant lost workdays per 200,000 work hours in 2003 and then lost
workdays per 200,000 man hours in 2006 (one assumes that work hours and man
hours are synonymous). Some firms kept the same indicator title from one year to
the next but changed the underlying calculation method. For example, one energy
firm (Firm 6), provided an Injury Severity Rate, defined as time lost per employee in
2000 then provided an Injury Severity Rate defined as a rate of hours lost to injury
per million hours worked in 2003. For others, changes from year to year were
potentially less significant and simply reflected inconsistent use of terminology. For
example, Firm 3 reported an LTISR: Lost time injury Severity Rate, defined in 2003
as “Full days lost in LTIs per million hours worked” and defined in 2006 as “injury
days per million exposure hours”. One would hope that for this firm an ‘injury day’
held the same meaning as a ‘full day lost due to an LTI' and also that ‘exposure
hours’ were equal to ‘hours worked’. Other reported duration indicators included the
percentage of hours lost due to workplace injury as a percentage of hours worked
(Firm 4) and ‘days lost or with restricted duties because of a recordable case per
200,000 hours worked (Firm 5).
Additional duration metrics were presented but poorly defined. These included the
DLTI: defined only as ‘rate of days lost to injury and restricted duty’, although failing
to specify the relevant denominator. Similarly various firms offered indicators labelled
Injury severity (Firm 9) or Weighted Average Injury severity (Firm 5) without providing
any indication as to what these actually measured. One firm reported that the Lost
Time Injury Rate had deteriorated and that both the number and severity of lost time
injuries had improved since the previous year. This did not make sense unless the
indicator was a measure of time lost to time worked and there had been a substantial
decrease in hours worked for the period. No downtime was explicitly reported. The
report issued by another firm stated that the primary indicator of severity was the
number of Total Days Lost or Restricted Due to Workplace Injuries but then failed to
provide this data. Further into the report was the statement; “The two measures we
use are Recordable Case Frequency Rate and Severity rate”. Again, the report failed
to provide severity data and instead disclosed rates of Recordable Case Frequency
and Lost Workday Case Frequency.
These examples illustrate the poor quality of most metrics used to report on severity and
duration. The overall lack of completeness and lack of consistency, in both the choice of
20
metrics and the underpinning measurement methodologies, restricted the degree to which
outcome severity could be compared, either across firms or even across time within a given
firm. In addition, the majority of disclosures failed to take into account the number of injuries
actually sustained in a period, and were therefore incapable of identifying whether time lost
had resulted from those serious injury or illness occurrences that drive shareholder and
stakeholder impact or rather from a high volume of low consequence events with immaterial
social or financial impact.
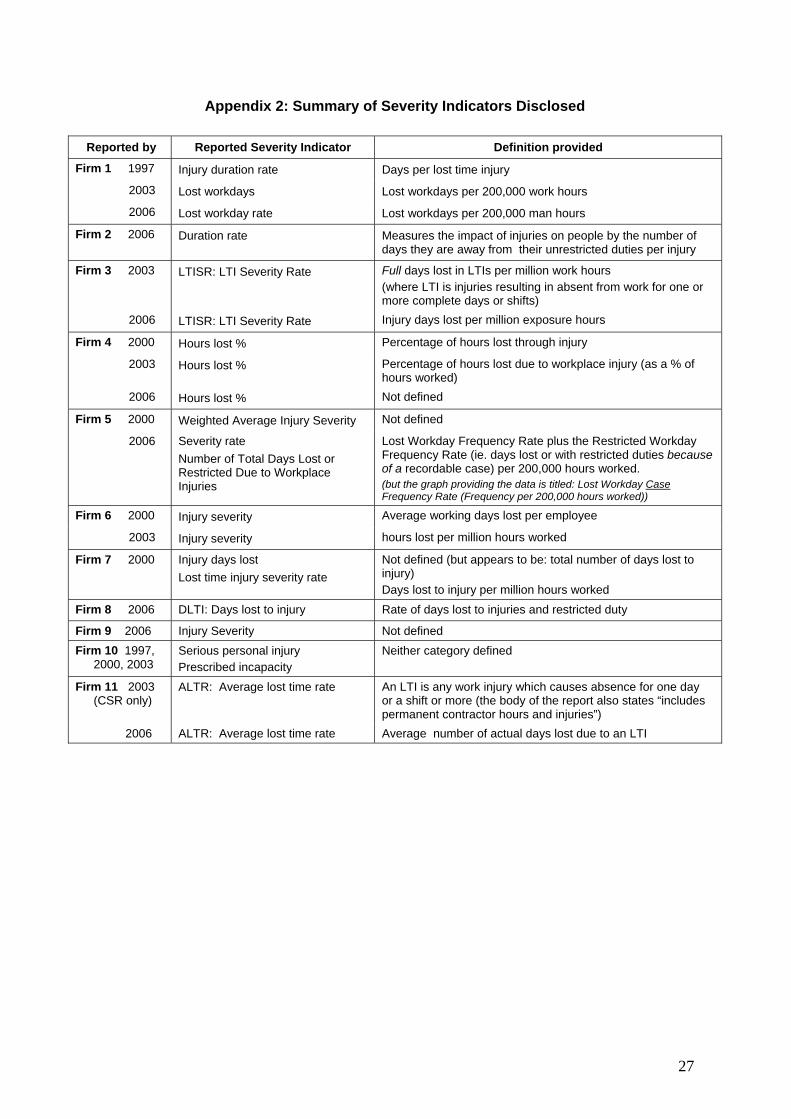
A summary of the various severity and duration metrics discussed above is provided, by
firm, in Appendix 2. Together these findings demonstrate that firms are more likely to
present highly aggregated duration metrics, primarily time lost per hours worked, than to
present severity data that will explicitly identify changes in performance for each level of
short term, long term and permanent incapacity outcome. This was consistent with the
proposition that managers will seek to avoid the political costs that may be associated with
divulging serious OHS injury and illness by instead choosing accounting methods that
present highly aggregated duration. Indeed, two thirds of the sampled firms failed to present
severity data at all, instead choosing to report only on the frequency of OHS outcomes.
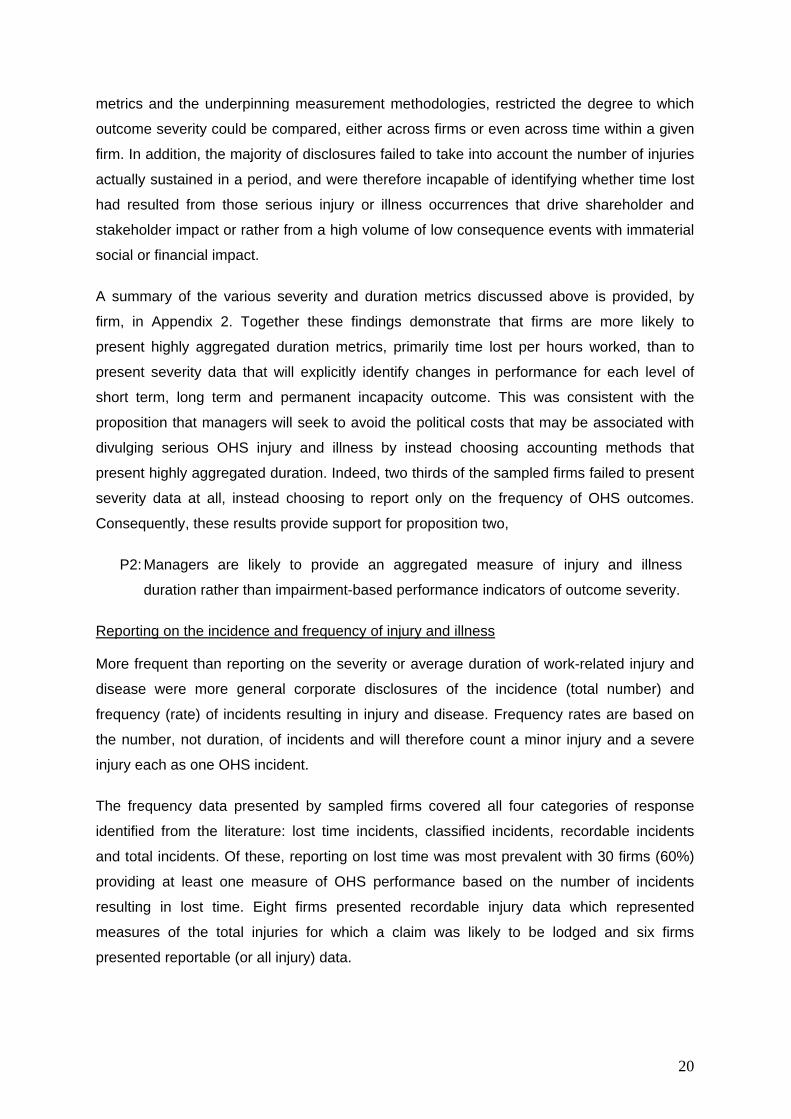
Consequently, these results provide support for proposition two,
P2: Managers are likely to provide an aggregated measure of injury and illness
duration rather than impairment-based performance indicators of outcome severity.
Reporting on the incidence and frequency of injury and illness
More frequent than reporting on the severity or average duration of work-related injury and
disease were more general corporate disclosures of the incidence (total number) and
frequency (rate) of incidents resulting in injury and disease. Frequency rates are based on
the number, not duration, of incidents and will therefore count a minor injury and a severe
injury each as one OHS incident.
The frequency data presented by sampled firms covered all four categories of response
identified from the literature: lost time incidents, classified incidents, recordable incidents
and total incidents. Of these, reporting on lost time was most prevalent with 30 firms (60%)
providing at least one measure of OHS performance based on the number of incidents
resulting in lost time. Eight firms presented recordable injury data which represented
measures of the total injuries for which a claim was likely to be lodged and six firms
presented reportable (or all injury) data.
21
These firms did not however, report on the frequency13 of lost time (and other outcome
classifications) but collectively disclosed a variety of metrics that each reflected a measure
of frequency. The subsequently diverse range of indicators meant that OHS performance
was largely incomparable across the reports, due to both the different types of outcome
classifications presented by firms (eg LTI versus RI) and the many different definitions
employed (or withheld). These variations were evident between firms and also across the
reports issued by individual firms in different years. This suggests that organisations develop
OHS metrics internally rather than follow externally available calculation methods. The
provision of clear definitions within each report was therefore critical to understanding the
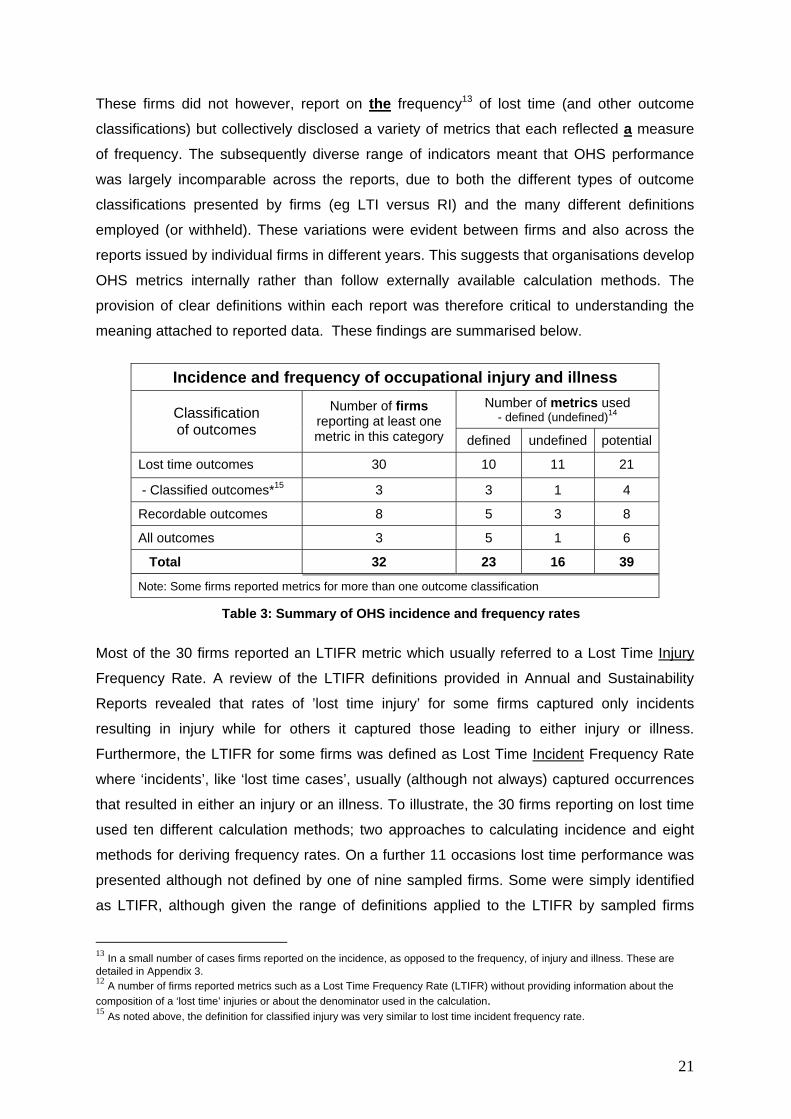
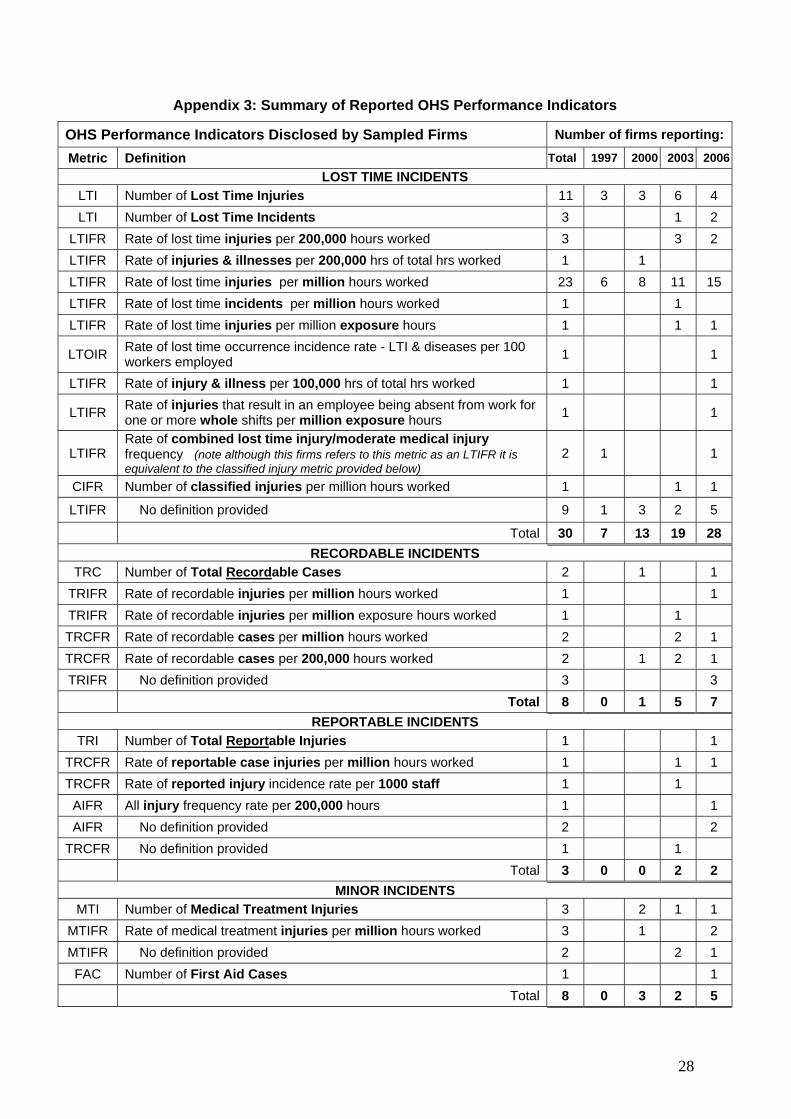
meaning attached to reported data. These findings are summarised below.
Incidence and frequency of occupational injury and illness
Number of metrics used - defined (undefined)14 Classification
of outcomes Number of firms
reporting at least one metric in this category defined undefined potential
Lost time outcomes 30 10 11 21
- Classified outcomes*15 3 3 1 4
Recordable outcomes 8 5 3 8
All outcomes 3 5 1 6
Total 32 23 16 39
Note: Some firms reported metrics for more than one outcome classification
Table 3: Summary of OHS incidence and frequency rates
Most of the 30 firms reported an LTIFR metric which usually referred to a Lost Time Injury
Frequency Rate. A review of the LTIFR definitions provided in Annual and Sustainability
Reports revealed that rates of ’lost time injury’ for some firms captured only incidents
resulting in injury while for others it captured those leading to either injury or illness.
Furthermore, the LTIFR for some firms was defined as Lost Time Incident Frequency Rate
where ‘incidents’, like ‘lost time cases’, usually (although not always) captured occurrences
that resulted in either an injury or an illness. To illustrate, the 30 firms reporting on lost time
used ten different calculation methods; two approaches to calculating incidence and eight
methods for deriving frequency rates. On a further 11 occasions lost time performance was
presented although not defined by one of nine sampled firms. Some were simply identified
as LTIFR, although given the range of definitions applied to the LTIFR by sampled firms
13 In a small number of cases firms reported on the incidence, as opposed to the frequency, of injury and illness. These are detailed in Appendix 3. 12 A number of firms reported metrics such as a Lost Time Frequency Rate (LTIFR) without providing information about the composition of a ‘lost time’ injuries or about the denominator used in the calculation. 15 As noted above, the definition for classified injury was very similar to lost time incident frequency rate.
22
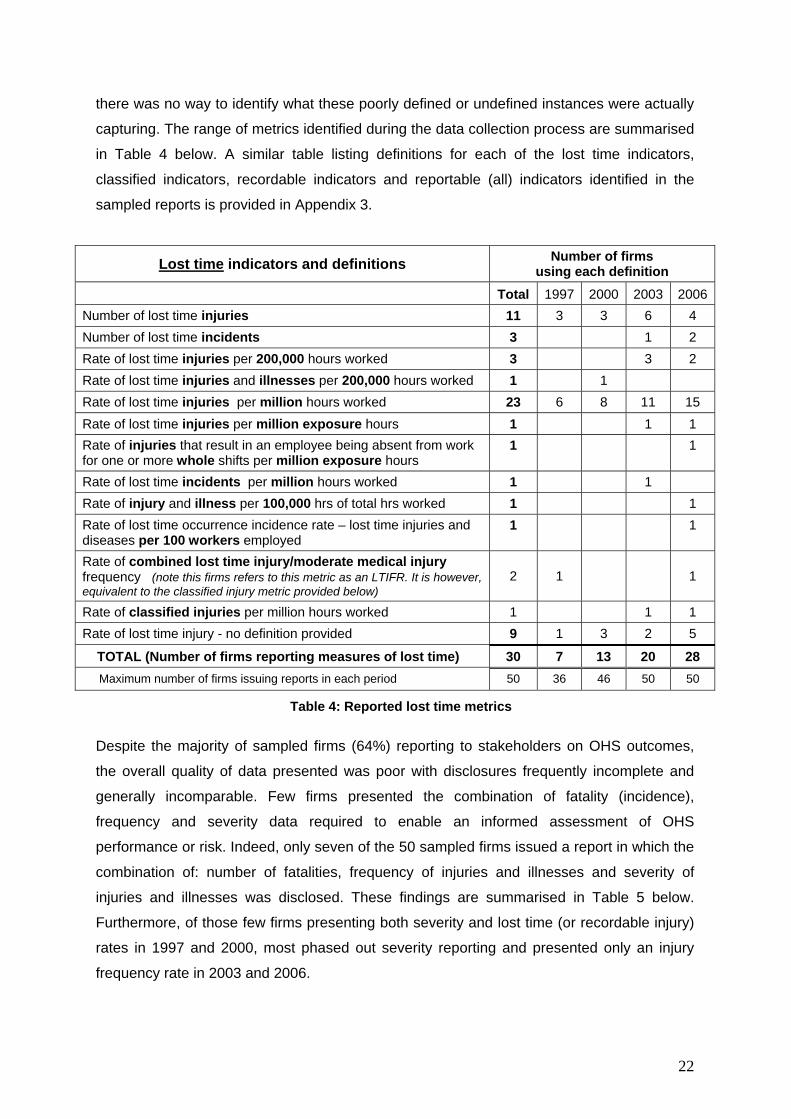
there was no way to identify what these poorly defined or undefined instances were actually
capturing. The range of metrics identified during the data collection process are summarised
in Table 4 below. A similar table listing definitions for each of the lost time indicators,
classified indicators, recordable indicators and reportable (all) indicators identified in the
sampled reports is provided in Appendix 3.
Lost time indicators and definitions Number of firms using each definition
Total 1997 2000 2003 2006Number of lost time injuries 11 3 3 6 4 Number of lost time incidents 3 1 2 Rate of lost time injuries per 200,000 hours worked 3 3 2 Rate of lost time injuries and illnesses per 200,000 hours worked 1 1 Rate of lost time injuries per million hours worked 23 6 8 11 15 Rate of lost time injuries per million exposure hours 1 1 1 Rate of injuries that result in an employee being absent from work for one or more whole shifts per million exposure hours
1 1
Rate of lost time incidents per million hours worked 1 1 Rate of injury and illness per 100,000 hrs of total hrs worked 1 1 Rate of lost time occurrence incidence rate – lost time injuries and diseases per 100 workers employed
1 1
Rate of combined lost time injury/moderate medical injury frequency (note this firms refers to this metric as an LTIFR. It is however, equivalent to the classified injury metric provided below)
2 1 1
Rate of classified injuries per million hours worked 1 1 1 Rate of lost time injury - no definition provided 9 1 3 2 5
TOTAL (Number of firms reporting measures of lost time) 30 7 13 20 28 Maximum number of firms issuing reports in each period 50 36 46 50 50
Table 4: Reported lost time metrics
Despite the majority of sampled firms (64%) reporting to stakeholders on OHS outcomes,
the overall quality of data presented was poor with disclosures frequently incomplete and
generally incomparable. Few firms presented the combination of fatality (incidence),
frequency and severity data required to enable an informed assessment of OHS
performance or risk. Indeed, only seven of the 50 sampled firms issued a report in which the
combination of: number of fatalities, frequency of injuries and illnesses and severity of
injuries and illnesses was disclosed. These findings are summarised in Table 5 below.
Furthermore, of those few firms presenting both severity and lost time (or recordable injury)
rates in 1997 and 2000, most phased out severity reporting and presented only an injury
frequency rate in 2003 and 2006.
23
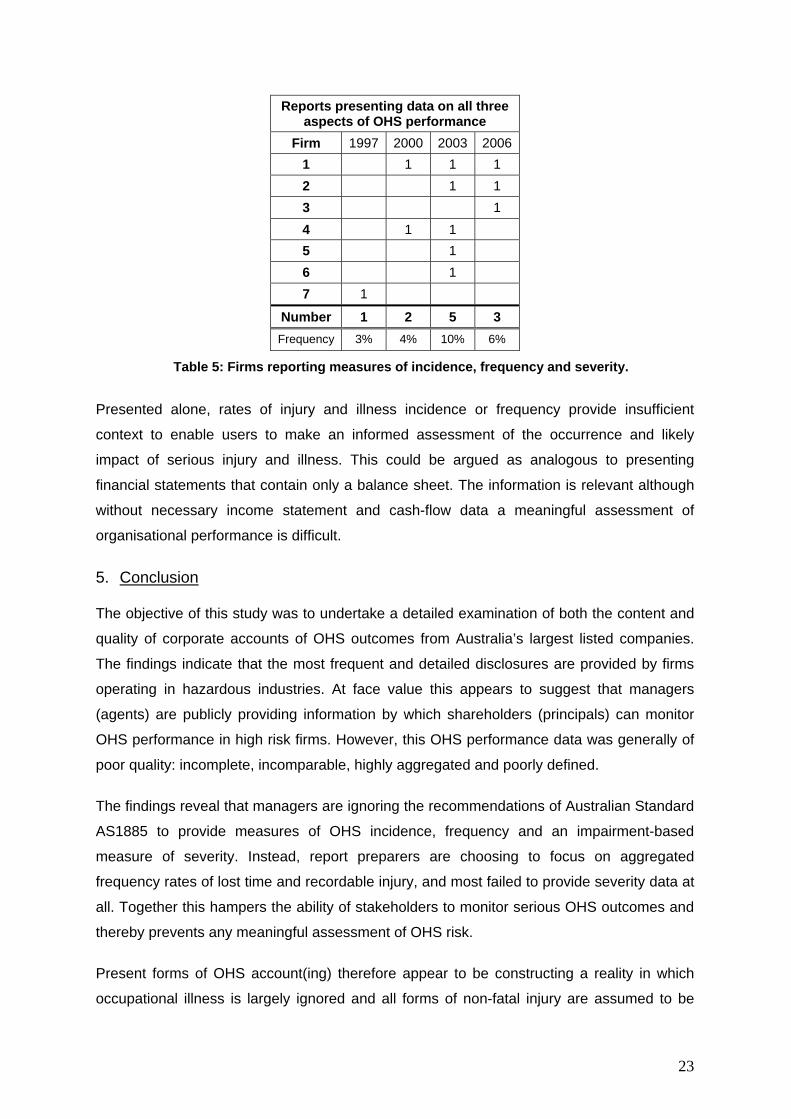
Reports presenting data on all three aspects of OHS performance
Firm 1997 2000 2003 20061 1 1 1 2 1 1 3 1 4 1 1 5 1 6 1 7 1
Number 1 2 5 3 Frequency 3% 4% 10% 6%
Table 5: Firms reporting measures of incidence, frequency and severity.
Presented alone, rates of injury and illness incidence or frequency provide insufficient
context to enable users to make an informed assessment of the occurrence and likely
impact of serious injury and illness. This could be argued as analogous to presenting
financial statements that contain only a balance sheet. The information is relevant although
without necessary income statement and cash-flow data a meaningful assessment of
organisational performance is difficult.
5. Conclusion
The objective of this study was to undertake a detailed examination of both the content and
quality of corporate accounts of OHS outcomes from Australia’s largest listed companies.
The findings indicate that the most frequent and detailed disclosures are provided by firms
operating in hazardous industries. At face value this appears to suggest that managers
(agents) are publicly providing information by which shareholders (principals) can monitor
OHS performance in high risk firms. However, this OHS performance data was generally of
poor quality: incomplete, incomparable, highly aggregated and poorly defined.
The findings reveal that managers are ignoring the recommendations of Australian Standard
AS1885 to provide measures of OHS incidence, frequency and an impairment-based
measure of severity. Instead, report preparers are choosing to focus on aggregated
frequency rates of lost time and recordable injury, and most failed to provide severity data at
all. Together this hampers the ability of stakeholders to monitor serious OHS outcomes and
thereby prevents any meaningful assessment of OHS risk.
Present forms of OHS account(ing) therefore appear to be constructing a reality in which
occupational illness is largely ignored and all forms of non-fatal injury are assumed to be
24
equal - a sprained ankle and a broken neck, each presented as a single injury event,
concealing the incidence of serious damage and ignoring the related financial and social
implications. This failure to adopt an accounting method that will distinguish between high
and low severity incidents effectively ‘smooths’ variations in OHS performance and thereby
manages stakeholder perceptions of OHS outcomes.
These reporting choices are potentially explained by agency theory as efforts by managers
to reduce the political costs associated with explicitly identifying cases of permanent
disability – the primary driver of financial and non-financial OHS consequences.
Furthermore, like deferring income to a future period to smooth reported earnings, choosing
a measurement method that captures only the number, but not the duration, of injuries and
illnesses will effectively smooth OHS performance from one period to the next so as not to
draw attention to unexpected changes in the incidence and duration of serious disability.
Together these findings suggest agency theory explanations relating to accounting method
choice and earnings management processes may be extended to emerging practices of
CSR disclosure. The reliance on secondary data in this study however, presents a limitation
in that the motivations of managers are not directly observable and highlights an opportunity
for future research that might seek to identify whether the choice of OHS indicators are, as it
would appear, strategic efforts to reduce potential political costs associated with serious
OHS damage or, alternatively, whether the poor quality of data simply reflects a lack of
understanding of most appropriate metrics for assessing OHS performance and reporting
this to shareholders. The practical implications of these findings lie in the strong support
they provide for calls to mandate appropriate accounts of OHS performance, and in
particular those calls for the requirements of s299(1)f of the Corporations Act to be extended
so as to require company Directors to report on OHS breaches and OHS performance
(using measures of fatality, impairment-based severity and recordable incident frequency).
Overall these results suggest that, in their current form, corporate OHS disclosures are
incapable of providing the relevant, reliable and comparable information needed to make an
informed assessment of the incidence of serious and long term disability. Given that these
particular OHS outcomes are the primary drivers of material changes in both financial and
non-financial consequences, existing practices of external corporate OHS reporting are
therefore inadequate for providing a meaningful appreciation of the OHS risk to which
stakeholders are exposed. Consequently, those shareholders who seek to monitor the
extent to which managers might trade lower levels of OHS risk for wealth maximisation are
likely to be left in the dark.
25
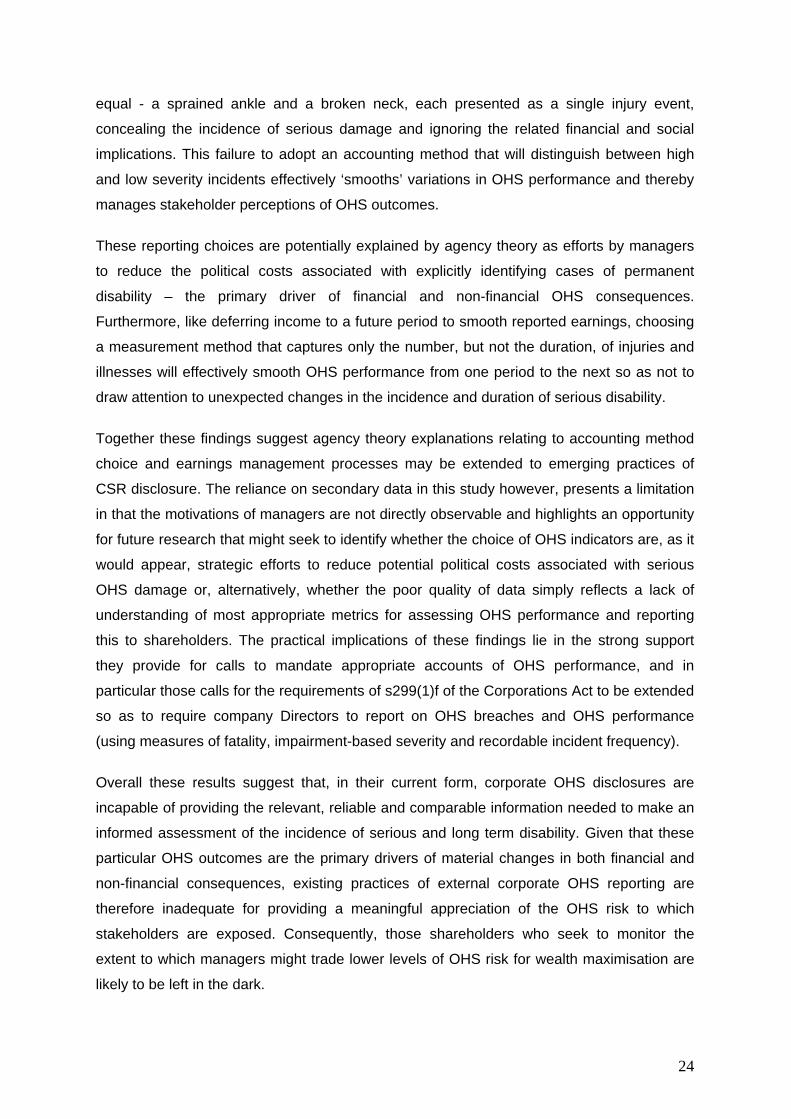
6. Appendices
Appendix 1: Overview of the sample
ASX Code Company Annual
reports Sustainability
reports Industry Code
AGL Australian Gas Light Company 4 1 Utilities ALL Aristocrat Leisure Limited 4 0 Consumer Goods ALN Alinta Limited 2 0 Utilities AMC Amcor Limited 4 2 Materials AMP AMP Limited 3 0 Financials ANZ Australia & New Zealand Banking Ltd. 4 1 Financials AWC Alumina Limited (WMC/AWC) 4 0 Materials AXA AXA Asia Pacific Holdings Limited 4 0 Financials BHP BHP Billiton Limited 4 2 Materials BIL Brambles Industries Limited 4 0 Industrials BLD Boral Limited 4 1 Materials BSL Bluescope Steel Limited 2 1 Materials CBA Commonwealth Bank Of Australia 4 0 Financials CCL Coca-Cola Amatil Limited 4 0 Consumer Goods CML Coles Myer Limited 4 1 Consumer Goods CNP Centro Properties Group 3 0 Financials CSL CSL Limited 4 0 Health Care CTX Caltex Australia Limited 3 1 Energy FGL Foster's Group Limited 4 0 Consumer Goods FXJ Fairfax (John) Holdings Limited 4 0 Consumer Goods GPT General Property Trust 4 0 Financials IAG Insurance Australia Group Limited 2 1 Financials ILU Iluka Resources Limited 4 0 Materials JHX James Hardie Industries N.V. 4 0 Materials LLC Lend Lease Corporation Limited 4 0 Financials MBL Macquarie Bank Limited 4 0 Financials MIG Macquarie Infrastructure Group 4 0 Industrials NAB National Australia Bank Limited 4 1 Financials NCM Newcrest Mining Limited 4 2 Materials ORG Origin Energy Limited 3 2 Energy ORI Orica Limited 4 3 Materials OXR Oxiana Limited 4 1 Materials PBL Publishing & Broadcasting Limited 3 0 Consumer Goods PPX Paperlinx Limited 3 1 Materials
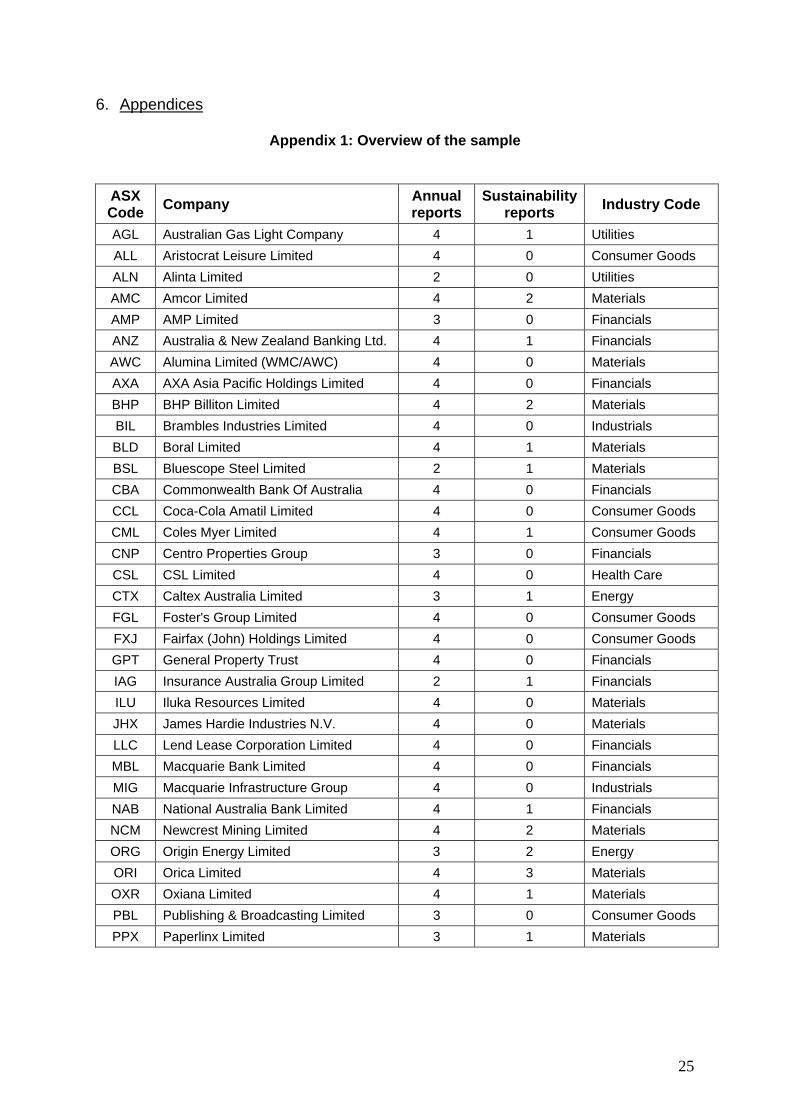
26
ASX Code Company (Continued) Annual
reports Sustainability
reports Industry Code
QAN Qantas Airways Limited 4 0 Industrials QBE QBE Insurance Group Limited 4 0 Financials RIN Rinker Group Limited 2 0 Materials RIO Rio Tinto Limited 3 2 Materials SGB St George Bank Limited 4 0 Financials SGP Stockland 4 1 Financials STO Santos Limited 4 1 Energy SUN Suncorp-Metway Limited. 4 0 Financials TAH Tabcorp Holdings Limited 4 0 Consumer Goods TCL Transurban Group 4 1 Industrials TLS Telstra Corporation Limited. 4 2 Telecommunications WBC Westpac Banking Corporation 4 0 Financials WDC Westfield Group 3 2 Financials WES Wesfarmers Limited 4 2 Industrials WOW Woolworths Limited 3 0 Consumer Goods WPL Woodside Petroleum Limited 3 1 Energy
TOTAL SAMPLED REPORTS 182 33
27
Appendix 2: Summary of Severity Indicators Disclosed
Reported by Reported Severity Indicator Definition provided
Firm 1 1997 Injury duration rate Days per lost time injury
2003 Lost workdays Lost workdays per 200,000 work hours
2006 Lost workday rate Lost workdays per 200,000 man hours
Firm 2 2006 Duration rate Measures the impact of injuries on people by the number of days they are away from their unrestricted duties per injury
Firm 3 2003
LTISR: LTI Severity Rate Full days lost in LTIs per million work hours (where LTI is injuries resulting in absent from work for one or more complete days or shifts)
2006 LTISR: LTI Severity Rate Injury days lost per million exposure hours
Firm 4 2000 Hours lost % Percentage of hours lost through injury
2003 Hours lost % Percentage of hours lost due to workplace injury (as a % of hours worked)
2006 Hours lost % Not defined Firm 5 2000 Weighted Average Injury Severity Not defined
2006 Severity rate Number of Total Days Lost or Restricted Due to Workplace Injuries
Lost Workday Frequency Rate plus the Restricted Workday Frequency Rate (ie. days lost or with restricted duties because of a recordable case) per 200,000 hours worked. (but the graph providing the data is titled: Lost Workday Case Frequency Rate (Frequency per 200,000 hours worked))
Firm 6 2000 Injury severity Average working days lost per employee
2003 Injury severity hours lost per million hours worked
Firm 7 2000 Injury days lost Lost time injury severity rate
Not defined (but appears to be: total number of days lost to injury) Days lost to injury per million hours worked
Firm 8 2006 DLTI: Days lost to injury Rate of days lost to injuries and restricted duty
Firm 9 2006 Injury Severity Not defined Firm 10 1997,
2000, 2003 Serious personal injury Prescribed incapacity
Neither category defined
Firm 11 2003 (CSR only)
ALTR: Average lost time rate An LTI is any work injury which causes absence for one day or a shift or more (the body of the report also states “includes permanent contractor hours and injuries”)
2006 ALTR: Average lost time rate Average number of actual days lost due to an LTI
28
Appendix 3: Summary of Reported OHS Performance Indicators
OHS Performance Indicators Disclosed by Sampled Firms Number of firms reporting:
Metric Definition Total 1997 2000 2003 2006LOST TIME INCIDENTS
LTI Number of Lost Time Injuries 11 3 3 6 4 LTI Number of Lost Time Incidents 3 1 2
LTIFR Rate of lost time injuries per 200,000 hours worked 3 3 2 LTIFR Rate of injuries & illnesses per 200,000 hrs of total hrs worked 1 1 LTIFR Rate of lost time injuries per million hours worked 23 6 8 11 15 LTIFR Rate of lost time incidents per million hours worked 1 1 LTIFR Rate of lost time injuries per million exposure hours 1 1 1
LTOIR Rate of lost time occurrence incidence rate - LTI & diseases per 100 workers employed 1 1
LTIFR Rate of injury & illness per 100,000 hrs of total hrs worked 1 1
LTIFR Rate of injuries that result in an employee being absent from work for one or more whole shifts per million exposure hours 1 1
LTIFR Rate of combined lost time injury/moderate medical injury frequency (note although this firms refers to this metric as an LTIFR it is equivalent to the classified injury metric provided below)
2 1 1
CIFR Number of classified injuries per million hours worked 1 1 1
LTIFR No definition provided 9 1 3 2 5
Total 30 7 13 19 28 RECORDABLE INCIDENTS
TRC Number of Total Recordable Cases 2 1 1 TRIFR Rate of recordable injuries per million hours worked 1 1 TRIFR Rate of recordable injuries per million exposure hours worked 1 1 TRCFR Rate of recordable cases per million hours worked 2 2 1 TRCFR Rate of recordable cases per 200,000 hours worked 2 1 2 1 TRIFR No definition provided 3 3
Total 8 0 1 5 7 REPORTABLE INCIDENTS
TRI Number of Total Reportable Injuries 1 1 TRCFR Rate of reportable case injuries per million hours worked 1 1 1 TRCFR Rate of reported injury incidence rate per 1000 staff 1 1
AIFR All injury frequency rate per 200,000 hours 1 1 AIFR No definition provided 2 2
TRCFR No definition provided 1 1 Total 3 0 0 2 2
MINOR INCIDENTS MTI Number of Medical Treatment Injuries 3 2 1 1
MTIFR Rate of medical treatment injuries per million hours worked 3 1 2 MTIFR No definition provided 2 2 1 FAC Number of First Aid Cases 1 1
Total 8 0 3 2 5
29
7. References
Adams, C. A. (2004). "The Ethical, Social and Environmental Reporting-Performance Portrayal Gap." Accounting, Auditing and Accountability Journal, 17(5): 731-757.
AFR (2009). "Poor Safety Record Hits BHP Output". Australian Financial Review, 23 July. Al-Tuwaijri, S. A. (2008). Beyond Deaths and Injuries: The ILO's Role in Promoting Safe and Healthy Jobs,
Seoul, Korea June. Andrew, B., Gul, F., Guthrie, J. and Teoh, H. Y. (1989). "A Note on Corporate Social Disclosure Practices in
Developing Countries: The Case of Malaysia and Singapore." British Accounting Review, 21: 371-376. Argus, D. (2008). "Chairman's Review", in, BHP Billiton Annual Report, Melbourne, Australia, BHP Billiton
Limited. ASCC (2008). Information Sheet: Mining, Australian Safety and Compensation Council, Commonwealth of
Australia, Canberra. ASCC (2009). The Cost of Work-related Injury and Illness for Australian Employers, Workers and the
Community: 2005-06, Australian Safety and Compensation Council, Canberra. Belkaoui, A. and Jones, S. (2000). Accounting Theory, Southbank, Victoria, Nelson Thomson Learning Berelson, B. (1952). Content Analysis in Communication Research Glencoe Ill, Free Press BHP (2007). "BHP Billiton Sustainability Report". Melbourne, Australia, BHP Billiton Limited. Borys, D. (2000). "Seeing the Wood for the Trees: A Systems Approach to OH&S Management." National
Occupational Health and Safety Management Systems Conference Sydney Brown, A., Tower, G. and Taplin, R. (2005). "Human Resources Disclosures in the Annual Reports of Pacific
Island Countries' Entities." Asia Pacific Journal of Human Resources, 43(2): 252-272. Brown, J. and Butcher, F. (2005). "Reporting on Occupational Health and Safety in Annual Reports: A Look at
Disclosure Practices in New Zealand." New Zealand Journal of Employment Relations, 30(1): 1-22. Chelius, J. R. (1991). "Role of Workers' Compensation in Developing Safer Workplaces." Monthly Labor Review,
114(9): 22. Chhokar, J. S. (1987). "Safety at the Workplace: A Behavioural Approach." International Labour Review, 126(2):
169-178. Clark, A. (2009). "US Safety Authorities Impose Record GBP53 Million Fine on BP for Texas City Failings ". The
Guardian, 30 October. CPA Australia. (2007). "CSR and the Profession." from http://www.cpaaustralia.com.au/cps/rde/exch/SID-
3F57FECB. CPA Australia. (2008). "Fact Sheets on Sustainability Reporting." from http://www.cpaaustralia.com.au/. Cummins, C. (2006). "U.S. Cites Cost Cuts' Role in BP Refinery Blast". The Wall Street Journal, 31 October. Deegan, C. (2009). Financial Accounting Theory. 3rd Edition, Sydney, McGraw Hill Australia Deegan, C., Rankin, M. and Voght, P. (2000). "Firms' Disclosure Reactions to Major Social Incidents: Australian
Evidence." Accounting Forum, 24(1): 101-130. Fields, T., Lys, T. and Vincent, L. (2001). "Empirical Research on Accounting Choice." Journal of Accounting and
Economics, 31: 255-307. Fitzgerald, B. (2009a). "BHP Falls Off the Peak - Facing a Sharp Profit Slump". Sydney Morning Herald, Sydney,
23 July. Fitzgerald, B. (2009b). "BHP Profit Likely to Fall by $US5b". The Age, Canberra, 23 July.
30
Frederick, J. and Lessin, N. (2000). "Blame the Worker: The Rise of Behavioral-Based Safety Programs." Multinational Monitor, 21(11): 10-17.
Fromartz, S. (2006). "BP Factory Accident Traced to Cost Cutting". The Wall Street Journal, 30 October. Gaffikin, M. (2008). Accounting Theory: Research, Regulation and Accounting Practice, Frenchs Forest NSW,
Pearson Education Australia Ginter, E. M. (1979). "Communications and Cost-Benefit Aspects of Employee Safety." Management Accounting,
60(11): 24. Gooch, L. (2002). "Coroner Blames ESSO for Longford Disaster". The Age, Melbourne, 15 November. Gray, R., Kouhy, R. and Lavers, S. (1995). "Corporate Social and Environmental Reporting: A Review of the
Literature and a Longitudinal Study of UK Disclosure." Accounting, Auditing and Accountability Journal, 8(2): 47-77.
Guthrie, J. and Parker, L. D. (1989). "Corporate Social Reporting: A Rebuttal of Legitimacy Theory." Accounting
and Business Research, 19(76): 343-352. Guthrie, J., Petty, R., Yongvanich, K. and Ricceri, F. (2004). "Using Content Analysis as a Research Method to
Inquire into Intellectual Capital Reporting." Journal of Intellectual Capital, 5(2): 282-293. Hopkins, A. (1994). "The Limits of Lost Time Injury Frequency Rates", in W. Australia, Positive Performance
Indicators for OHS: Beyond Lost Time Injuries, Canberra, Commonwealth of Australia, Australian Government Publishing Service: 29-36.
Hopkins, A. (2000). Lessons from Longford: The Esso Gas Plant Explosion, Sydney, CCH Australia Limited Hopkins, A. (2005). Safety Culture and Risk: The Organisational Causes of Disasters, CCH Australia Hopkins, A. (2006). "Studying Organisational Cultures and their Effects on Safety." Safety Science, 44: 875-889. Horwitz, I. B. and McCall, B. P. (2004). "The Impact of Shift Work on the Risk and Severity of Injuries for Hospital
Employees: An Analysis Using Oregon Workers' Compensation Data." Occupational Medicine, 54(8): 556-563.
ICAA (2008). Broad Based Business Reporting: The Complete Reporting Tool, The Institute of Chartered
Accountants in Australia, Sydney. ICAA (2009). Financial Reporting Handbook 2009, Sydney, Commonwealth of Australia Jensen, M. C. and Meckling, W. H. (1976). "Theory of the Firm: Managerial Behaviour Agency Costs and
Ownership Structure." Journal of Financial Economics, 3: 305-360. Kolk, A. (2003). "Trends in Sustainability Reporting by the Fortune Global 250." Business Strategy and the
Environment, 12(5): 279-291. Maunders, K. and Foley, G. (1974). "Accounting Information, Employees and Collective Bargaining." Journal of
Business Finance and Accounting, 1(1): 109-127. McDonald, G. L. (2006). "Better Words, Models and Concepts - Better Safety". The Safety Conference. Sydney,
Geoff McDonald and Associates Pty Ltd. Milne, M. J. (2002). "Positive Accounting Theory, Political Costs and Social Disclosure Analyses: A Critical
Look." Critical Perspectives on Accounting, 13: 369-395. NOHSC (1990). "AS1885.1: Workplace Injury and Disease Recording Standard". Australian Standard. Australia,
SIA Global. NOHSC (2004). The Cost of Work-Related Injury and Illness for Australian Employers, Workers and the
Community, Australian Government, National Occupational Health and Safety Commission, Canberra. O'Neill, S. (2009). "Accounting for Lost Time: An Examination of Corporate Accounts of Occupational Health and
Safety". School of Business and Law, RMIT, Melbourne, Draft PhD Thesis.
31
O'Neill, S. and Deegan, C. (2009a). "OHS Disclosure: Corporate Accountability or the Insitutionalisation of Safewash?" Working paper. Faculty of Economics and Business, University of Sydney.
O'Neill, S. and Deegan, C. (2009b). "Relevance Lost: Defining Stakeholder Demand for Corporate OHS
Disclosure". Working paper, The University of Sydney. O'Neill, S., McDonald, G. L. and Deegan, C. (2008). "Accounting for Lost Time: Might the Facts Suggest a
Fiction?" Accounting and Finance Association of Australia and New Zealand (AFAANZ) Annual Conference. Sydney, Australia.
OSHA. (1996). "Occupational Injury and Illness Recording and Reporting Requirements - 61:4029-4067."
Retrieved 12 August 2008, from http://www.osha.gov/pls/oshaweb/. Power, M. (1991). "Auditing and Environmental Expertise: Between Protest and Professionalisation." Accounting,
Auditing and Accountability Journal: 30-42. Reason, J. (1993). "Managing the Management of Risk: New Approaches to Organisational Safety", in B.
Wilpert, T. Quale and Hove Erlbaum and Associates Ltd, Reliability and Safety in Hazardous Work Systems.
Stafford, P. (2009). "BHP Billiton Profit Tipped to Dive, Shares Flat." Smart Company, Price Waterhouse
Coopers, http://www/smartcompany.com.au/economy/20090723-BHP-Billiton-Profit-Tipped-to-Dive-Shares-Flat-Economy-Roundup.html, Accessed: February 6, 2010
Tilt, C. A. (1994). "The Influence of External Pressure Groups on Corporate Social Disclosure: Some empirical
evidence." Accounting, Auditing and Accountability Journal, 7(4): 47. Vuontisjarva, T. (2006). "Corporate Social Reporting in the European Context and Human Resource Disclosures:
An Analysis of Finnish Companies." Journal of Business Ethics, 69: 331-354. Watson, I., Buchanan, J., Campbell, I. and Briggs, C. (2003). Fragmented Futures: New Challenges in Working
Life, Leichhardt, The Federation Press Watts, R. L. and Zimmerman, J. L. (1978). "Towards a Positive Theory of the Determination of Accounting
Standards." The Accounting Review, 53(1): 112-134. Weber, R. P. (1990). Basic Content Analysis. 2nd Edition, Newbury Park, California, Sage
Publications.Quantitative Applications in the Social Sciences Paper Series. Whyte, D. (2006). "Regulating Safety, Regulating Profit: Cost-Cutting, Injury and Death in the British North Sea
after Piper Alpha", in E. Tucker, Working Disasters, The Politics of Recognition and Response, New York, Baywood Publishing.
Whyte, D. (2009). "All At Sea: An Historical OHS Lesson, The Piper Alpha Disaster - Productivity Versus Safety".
Say Safety. 14: 5. WorkCover NSW (2004). Statistical Bulletin 2002/2003: New South Wales Workers Compensation, Knowledge
Management Branch: Workcover New South Wales, Sydney. WorkCover NSW (2005). Statistical Bulletin 2004/2005, Knowledge Management Branch: Workcover New South
Wales, Sydney.