Embed Size (px)
Citation preview
The Psychological Record, 2011, 61, 561–582
The research reported in this article is based on the doctoral thesis of the first author in partial fulfillment of the requirements for the doctoral degree in psychology from Washington University. Portions of this work were presented at the Eating Disorder Research Society Conference in Pittsburgh, PA, October 2007, and at the Society of Behavioral Medicine Conference in San Diego, CA, March 2008.
This study was supported by National Science Foundation Doctoral Dissertation Research Grant SES-0648516. Preparation of the manuscript was supported by National Institutes of Health (NIH) Grant 055308 to the second and third authors and National Institute of Child Health and Development Grant R01HD36904, National Institute of Mental Health Grant 1K24MH070446-01, National Institute of Diabetes and Digestive and Kidney Diseases Grant R03DK065757, and NIH Grants R01064153 and K24070446 to the fifth author.
Our thanks to Ellen Fitzsimmons and Lindsay Bodell for their invaluable assistance with participant recruitment and data entry.
Correspondence concerning this article should be addressed to Jamie Manwaring, [email protected], or Leonard Green, Washington University, Department of Psychology, Campus Box 1125, St. Louis, MO 63130. E-mail: [email protected]
Discounting of Various types of rewarDs by women with anD without binge eating DisorDer: eViDence
for general rather than specific Differences
Jamie L. Manwaring, Leonard Green, Joel Myerson,
Michael J Strube, and Denise E. Wilfley
Washington University
The present study compared the extent to which obese women with binge eating disorder (BED), obese women without BED, and controls discounted delayed and probabilistic money and directly consumable rewards: food, massage time, and preferred sedentary activity. Of spe-cial interest was whether the BED group differed from the other groups in terms of their discounting of all three types of directly consumable rewards or only in their discounting of food. Overall, the BED group tended to discount both delayed and probabilistic rewards of all types more steeply than the obese and control groups. Thus, rather than finding differences specific to particular types of rewards, we find that women with BED are generally more impatient when choices involve delayed rewards and more risk averse when they involve probabilistic rewards. These results suggest a temperamental difference associated with BED that cannot be accounted for by the concomitant obesity. Key words: discounting, binge eating disorder, obesity, impulsivity, decision making
The hallmark feature of binge eating disorder (BED) is the consump-tion of unambiguously large amounts of food accompanied by a sense of losing control (American Psychiatric Association, 1994). Studies have con-sistently found differences between the clinical profiles of obese individu-als with BED and those without BED (Marcus, 1993; Yanovski, Gormally,
562 MANWARING ET AL.
Leser, Gwirtsman, & Yanovski, 1994). In comparison to non-BED obese in-dividuals, individuals with BED have more chaotic eating habits, exhibit higher levels of eating disinhibition, and endorse higher levels of general and eating-disorder psychopathology (e.g., Wilfley, Schwartz, Spurrell, & Fairburn, 2000; Yanovski et al., 1992). Cognitive-behavioral and interper-sonal psychotherapies have been shown to be effective in the treatment of BED (Wilfley et al., 2002). Even so, approximately one third of patients relapse following treatment (Safer, Lively, Telch, & Agras, 2002). A better understanding of the nature of binge eating and obesity may lead to im-provements in treatment.
The DSM-IV definition of BED includes criteria that could be considered impulsive, such as lack of control over eating (Nasser, Gluck, & Geliebter, 2004), and this loss of control over eating is closely related to psychologi-cal markers of distress common in BED (Colles, Dixon, & O’Brien, 2008). Studies using questionnaires to assess impulsivity have found that indi-viduals with BED are more impulsive than obese individuals without BED (de Zwaan et al., 1994; Fassino et al., 2002; Galanti, Gluck, & Geliebter, 2007; Nasser et al., 2004) and engage in binge eating more impulsively than individuals with bulimia nervosa (Raymond et al., 1999). In addition, mo-tor impulsivity, as measured by the Barratt Impulsivity Scale (BIS; Patton, Stanford, & Barratt, 1995), has been found to be positively correlated with BED criteria (Nasser et al., 2004), and scores on the BIS have been reported to be a significant predictor of test-meal intake by obese binge eaters (Galanti et al., 2007).
Despite the number of psychiatric diagnoses for which impulsivity is one of the criteria (e.g., pathological gambling, attention-deficit/hyperac-tivity disorder), there is considerable disagreement concerning the nature of impulsivity. In the personality literature, definitions of impulsivity vary widely and have included such concepts as an inability to wait, insensi-tivity to consequences, novelty seeking, risk taking, motor impulsivity, nonplanning impulsivity, and cognitive impulsivity (Ainslie, 1975; Barratt & Patton, 1983; Cloninger, 1987; Eysenck, 1993; Rachlin & Green, 1972). It appears that the only consensus among researchers is that impulsivity is multidimensional in nature (Crean, de Wit, & Richards, 2000; Evenden, 1999; Helmers, Young, & Pihl, 1995; Kirby & Finch, 2010; Reynolds, Ortengren, Richards, & de Wit, 2006).
Given this controversy, an increasing number of researchers have used a behavioral definition, according to which impulsivity is a tendency to choose smaller, more immediate rewards over larger, more delayed re-wards (Ainslie, 1975; Rachlin, 1995). When an individual selects a smaller but more immediate reward, the value of the larger reward is said to have been discounted, where discounting is defined as the decrease in value of a reward as the time one will have to wait for it is increased (for a review, see Green & Myerson, 2004). Researchers studying discounting have consis-tently found that the decrease in the subjective value of delayed rewards is well described by the hyperboloid function:
V = A / (1 + bX )S, (1)
where V represents the subjective value of the reward, A represents its magnitude, b is a parameter governing the rate at which subjective value
563DISCOUNTING BY WOMEN WITH BED
decreases as the delay until receiving the reward increases, X is the delay, and s is a parameter that represents the nonlinear scaling of amount and/or time. When s = 1.0, the discounting function is a simple hyperbola. When s < 1.0, as is often the case, the discounting curve decreases less sharply at higher delay values than does a simple hyperbola with the same discounting rate parameter, b. If two groups differ with respect to their discounting, then separate discounting functions that differ in one or both of the parameters will be necessary to describe their data.
Steep discounting of delayed rewards is associated with abuse of a variety of different substances. Individuals who abuse alcohol, nicotine, cocaine, methamphetamines, and opioids not only discount delayed re-wards more steeply than controls but also discount their abused substance more steeply than money (Baker, Johnson, & Bickel, 2003; Coffey, Gudleski, Saladin, & Brady, 2003; Hoffman et al., 2006; Kirby & Petry, 2004; Kirby, Petry, & Bickel, 1999; Mitchell, Fields, D’Esposito, & Boettiger, 2005; Odum & Rainaud, 2003; Reynolds et al., 2007). These findings are often interpreted as implying that individuals who steeply discount delayed outcomes are impulsive and give insufficient weight to their best interests in the long term.
It is possible that BED involves a kind of substance abuse in which food is the abused substance. Consistent with this conceptualization, it is possible that women with BED choose the reward of immediate food con-sumption because they steeply discount the delayed consequences of their eating behavior. This possibility has received little study to date, although several studies have examined the relation between obesity and discount-ing. Two studies, Nederkoorn, Smulders, Havermans, Roefs, and Jansen (2006) and Weller, Cook, Avsar, and Cox (2008), compared discounting of delayed money in obese and nonobese participants but obtained conflict-ing results, perhaps because Weller et al. matched groups on income and IQ whereas Nederkoorn et al. did not. A third study (Rasmussen, Lawyer, & Reilly, 2010) reported that the discounting of food, but not money, was correlated with percent body fat, although body mass index (BMI) was not related to the discounting of either type of reward.
Only one previous study has examined discounting in women with BED. Davis, Patte, Curtis, and Reid (2010) observed a difference between normal-weight controls and obese women with and without BED in the dis-counting of delayed money, but this difference was not significant after controlling for level of education. Clearly, more research is needed in this area, and for reasons described next, studies that examine both the dis-counting of food as well as the discounting of other directly consumable rewards are especially needed.
Although substance abusers tend to discount their substance of abuse more steeply than money, it is unclear whether this tendency is unique to abused substances, or even to substance abusers. It is possible that the steep discounting of abused substances merely reflects the general ten-dency of people to discount delayed, directly consumable rewards more steeply than monetary rewards (Odum & Rainaud, 2003; Estle, Green, Myerson, & Holt, 2007). For example, Estle et al. compared the discounting of abused and nonabused directly consumable substances (beer vs. soda and candy) and found that participants (non-substance-abusing college stu-dents) discounted delayed monetary rewards less steeply than the directly
564 MANWARING ET AL.
consumable rewards, which were all discounted at equivalent rates. Estle et al. also examined probability discounting and found no difference be-tween money and the directly consumable rewards. Although these results are consistent with the hypothesis that delayed abused substances are steeply discounted because they are directly consumable, and not because of anything peculiar about abused substances per se, it should be noted that the participants in the Estle et al. and Odum and Rainaud studies were not substance abusers. Indeed, no previous study has compared de-lay discounting of directly consumable rewards by substance abusers and controls.
Impulsivity may be associated with risk taking as well as with an in-ability to delay gratification (Whiteside & Lynam, 2001). Interestingly, the same mathematical function that describes delay discounting also de-scribes probability discounting. That is, Equation 1, with X equal to the odds against receiving a reward (rather than the delay until its receipt), has been shown repeatedly to accurately describe the discounting of probabi-listic rewards (Green & Myerson, 2004).
Whereas steep discounting of delayed rewards is indicative of impa-tience, steep discounting of probabilistic rewards represents risk-averse behavior, rather than risk-taking behavior. Risk-taking behavior would be associated with shallow discounting of probabilistic rewards, indicat-ing that an individual’s choices are more controlled by the magnitude of a reward involved than by the likelihood of actually receiving it (Green & Myerson, 2004). Thus, if impatience and risk taking are both indicative of a general tendency toward making impulsive choices, then a negative cor-relation between delay and probability discounting would be predicted.
Perhaps surprisingly, Myerson, Green, Hanson, Holt, and Estle (2003) found that the steepness with which individuals discounted delayed and probabilistic rewards was, if anything, positively correlated. Similar results were observed in a reanalysis of the Estle et al. (2007) data by Green and Myerson (2010). In both cases, however, the samples were college students. It remains possible that the predicted negative correlation would be observed in clinical samples of individuals who tend to score high on self-report mea-sures of impulsivity, such as samples of individuals with BED (de Zwaan et al., 1994; Fassino et al., 2002; Galanti et al., 2007; Nasser et al., 2004).
Accordingly, the current study examined both delay and probability discounting of different types of rewards by obese women diagnosed with BED, obese women without BED, and nonobese, non-binge-eating women. We compared the degree to which participants discounted money and food (a directly consumable and potentially abused reward), as well as two other directly consumable rewards: a preferred sedentary activity and massage time. At issue was whether obese individuals with BED would differ from controls in how steeply they discount all of these rewards, consistent with the view that individuals with BED have a general problem with impulsive behavior, or whether they would differ from controls only in regard to po-tentially abused food rewards. Also of interest was whether their discount-ing would differ from that of controls only when rewards were delayed, only when they were probabilistic, or both, and whether obese women with BED would differ from those without BED. In addition to these behavioral discounting measures, impulsivity was measured using standardized questionnaires.
565DISCOUNTING BY WOMEN WITH BED
method
participants
Ninety women (ages 18 to 65 years) were recruited from the St. Louis, MO, area using media advertisements. All eligible participants were offered $30 as well as free group behavioral weight-loss treatment at a later date as compensation for their participation. The BED group consisted of 30 obese (i.e., BMI ≥ 30) women meeting DSM-IV BED criteria1 (American Psychiatric Association, 1994); the obese group consisted of 30 obese, non-binge-eating2
women; and the control group consisted of 30 non-binge-eating women with BMIs ranging from 18 to 27 (see Table 1).
Table 1Demographic Characteristics
GroupControl (n = 30) Obese (n = 30) BED (n = 30)
Age (in years) 43.8 (12.38) 48.8 (9.56) 49.5 (9.58)BMI (kg/m2) 23.3 (2.38) 42.6 (7.80) 42.0 (9.79)
Years of education 15.7 (2.15) 15.7 (1.98) 15.2 (2.02)RaceWhite 24 (80.0%) 21 (70.0%) 25 (83.3%)Black 4 (13.3%) 9 (30.0%) 4 (13.3%)
Hispanic 1 (3.3%) 0 (0.0%) 1 (3.3%)Asian 1 (3.3%) 0 (0.0%) 0 (0.0%)
Income*< $40K 12 (40.0%) 7 (23.3%) 11 (36.7%)
$40K–$80K 7 (23.3%) 14 (46.7%) 9 (30.0%)> $80K 10 (33.3%) 9 (30.0%) 10 (33.3%)
* One control participant did not provide income information.
Interested individuals were contacted by phone to determine initial eligi-bility. Exclusion criteria included a reading level lower than sixth grade, past traumatic head injury, pregnancy, psychosis or severe (suicidal) depression within the past 3 months, and not being within driving distance of the study site. To meet criteria for the BED and obese groups, participants had to meet DSM-IV BED criteria and the non-binge-eating criteria, respectively, as measured by the standardized Eating Disorders Examination, an investigator-based inter-view with established reliability and validity (Fairburn & Cooper, 1993; Rizvi, Peterson, Crow, & Agras, 2000). If a potential participant was found to be cur-rently engaged in other eating-disorder behavior (e.g., purging), she was offered treatment referrals. Institutional review board approval was obtained for this study, and all participants provided written informed consent.
1 BED criteria includes recurrent (average at least two times/week) episodes of binge
eating (eating an amount of food in a discrete period of time that most people would consider
unambiguously large, with a sense of loss of control) over the past 6 months and absence of
regular use of inappropriate compensatory behaviors (e.g., vomiting).
2 Non-binge eating is defined as less than three binges in the past 6 months and no more
than one binge in any one month.
566 MANWARING ET AL.
procedure
Delay and probability discounting tasks. Participants were tested in-dividually in a small room. They were provided with verbal and written instructions stating that the purpose of the study was to examine their choices in situations involving hypothetical rewards: amounts of money, a snack food selected by the participant, a preferred sedentary activity, and massage time. The instructions included the statement, “There are no correct or incorrect choices. We are interested in the option you would prefer.”
The type of computerized task (delay and probability discounting) was crossed with the amount of reward (40 units and 100 units) and type of re-ward (money, food, sedentary activity, and massage time), yielding 16 condi-tions. Each participant was studied in all 16 of these conditions, with half of the participants randomly assigned to receive the delay discounting condi-tions first, and the other half assigned to receive the probability discounting conditions first. Within each task, the order of the reward types was deter-mined randomly, and within each type of reward, the order of the amounts was determined randomly.
For the delay discounting task, participants were instructed that two amounts of a hypothetical reward (money, food, sedentary activity, mas-sage time) would appear on the computer screen; one amount could be re-ceived immediately, whereas the other amount could be received after some specified period of time. For the probability discounting task, participants were instructed that one amount could be received “for sure,” whereas the other amount could be received with some specified probability. The experi-ment began after six practice trials. For money, the units were dollars; for food, the units were the smallest appropriate amount (e.g., a candy bar, a small bag of chips); for sedentary activity and massage time, the units were minutes.
For each amount in the delay discounting task, the participant made six choices at each of five delays: 1 week, 1 month, 6 months, 1 year, and 3 years. An adjusting-amount procedure that converges rapidly on the amount of immediate reward equal in subjective value to the delayed reward was used (for a detailed description, see Du, Green, & Myerson, 2002). The first choice at each delay was between a delayed reward and an immediate reward that was one half the amount of the delayed reward. For example, if the delayed reward was $100 in 6 months, then the immediate reward was $50 now. For subsequent choices, the size of the adjustment was half of the previous adjustment. This procedure was repeated until the participant made six choices. An analogous adjusting-amount procedure was used to estimate the subjective value of probabilistic rewards. For each amount in the probability discounting task, the participant made six choices at each of five probabilities: 90%, 75%, 50%, 25%, and 10% chance. The subjective values of delayed and probabilistic rewards, estimated using the adjusting-amount procedure, were then expressed as a proportion of the actual amounts (i.e., 40 and 100 units), resulting in measures of relative subjective value that then could be easily averaged across amounts.
self-report measures. Two instruments—the Barratt Impulsiveness Scale-11 (BIS-11; Patton et al., 1995) and the UPPS Impulsive Behavior Scale (UPPS; Whiteside & Lynam, 2001)—were used to assess self-reported im-pulsivity. The BIS-11 is a 30-item measure consisting of three subscales:
567DISCOUNTING BY WOMEN WITH BED
Nonplanning, Attentional Impulsiveness, and Motor Impulsiveness. The UPPS is a 45-item measure derived from the five factor model of personal-ity and consists of four subscales: Urgency, Sensation Seeking, (Lack of) Premeditation, and (Lack of) Perseverance (Whiteside & Lynam, 2001), which have been found to discriminate between different eating disorders (Claes, Vandereycken, & Vertommen, 2005) and have both construct and divergent va-lidity (Whiteside, Lynam, Miller, & Reynolds, 2005). The 53-item Brief Symptom Inventory (BSI; Derogatis & Melisaratos, 1983) was used to assess participants’ “overall psychopathology,” as measured by the Global Severity Index.
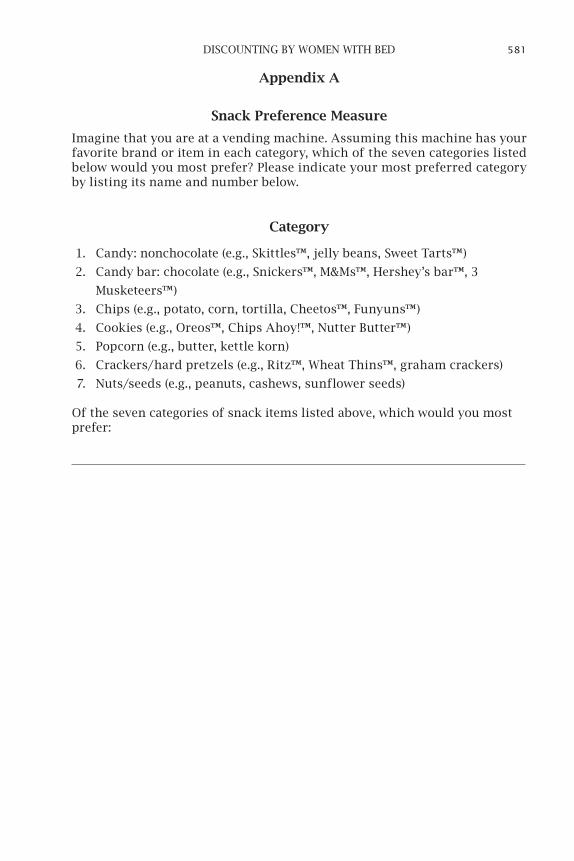
A snack preference measure (see Appendix A) was developed and used to determine each participant’s preferred snack food. It consisted of seven categories of snack foods (nonchocolate candy, chocolate candy bar, chips, cookies, popcorn, crackers/hard pretzels, and nuts/seeds). A 12-item leisure activities questionnaire (see Appendix B), similar to those used in other studies of sedentary activity (e.g., Epstein & Roemmich, 2001), also was de-veloped and used to obtain the participant’s preferred sedentary activity.
analysis
One way to assess the degree to which individual participants dis-counted each of the delayed and probabilistic rewards is by calculating the area under their empirical discounting curves (AuC; Myerson, Green, & Warusawitharana, 2001). The AuC provides a theoretically neutral measure of the degree of discounting and as such is widely used to assess impul-sivity on discounting tasks. Examination of the distributions of the AuC values revealed substantial skew and consistent differences in skew among the groups. Because this skew presumably reflected the nature of the dif-ferences among the groups, its removal via transformation would not be ap-propriate. For similar reasons, we chose not to remove outliers or otherwise select individuals to exclude from the analyses based on their data. Instead, statistical analyses focused on how the median subjective values of the vari-ous rewards changed as a function of the delay until the reward would be received and the odds against receiving these rewards.
For each pair of groups (BED vs. obese, BED vs. controls, and obese vs. controls) and type of delayed or probabilistic reward, multiple nonlinear re-gression was used to test whether the groups differed with respect to their discounting. More specifically, we tested the hypothesis that a full model, which fit a separate hyperboloid discounting function (Equation 1) to the data from each of the groups being compared, accounted for a significantly greater proportion of variance than a reduced model in which a single hy-perboloid discounting function was fit to the data from both groups.
For this analysis, we compared the variance accounted for by a full model with four parameters (one b and one s for each group) with the variance accounted for by a (nested) reduced model with only two param-eters (one b and one s) using an incremental F test. In order to minimize Type I error, we restricted the number of statistical tests being performed by averaging the data from the small- and large-amount conditions by taking the mean of the medians at each delay, and we did not test for differences among the discounting of different types of rewards, except to compare food with the average of the other two nonmonetary rewards (i.e., a preferred sedentary activity and massage time). Thus, the analyses
568 MANWARING ET AL.
focused on whether, for each type of reward, the groups needed to be de-scribed by separate discounting functions or whether a single discount-ing function would suffice, and whether, for each group, food needed to be described by a different discounting function than the other two nonmonetary rewards.
results
Table 1 provides demographic characteristics for each of the three groups. The average BMIs for the BED group (42.0; SD = 9.79) and the obese group (42.6; SD = 7.80) are classified as being in the extreme obesity range (National Heart Lung and Blood Institute, 1998) and did not differ sig-nificantly from each other. The control group had an average BMI of 23.3 (SD = 2.38). Other than the difference in BMI between the control and BED/obese groups (ps < .001), no significant demographic differences existed among the groups (ps > .05).
Discounting of Delayed rewards
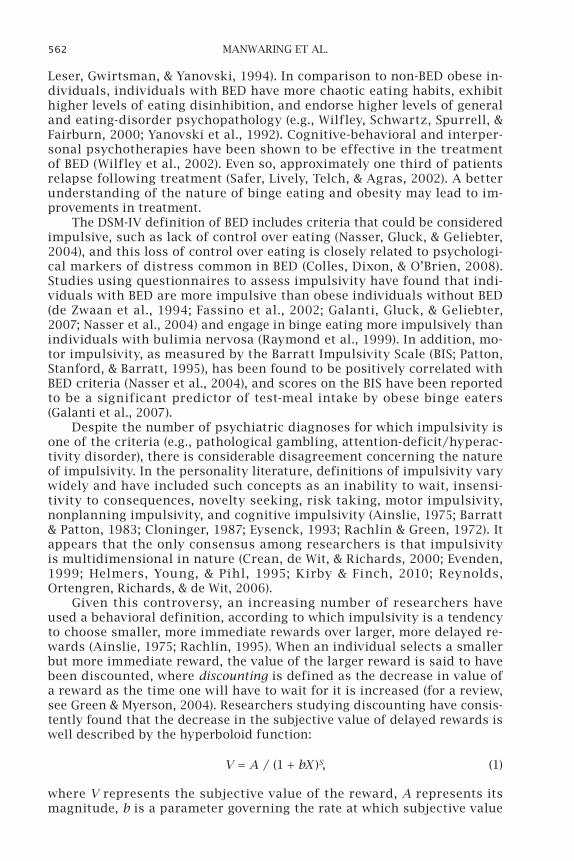
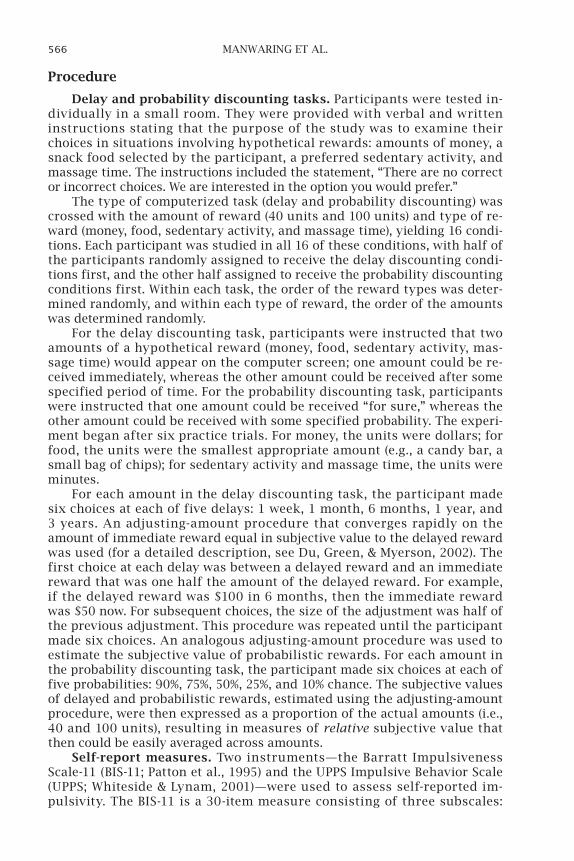
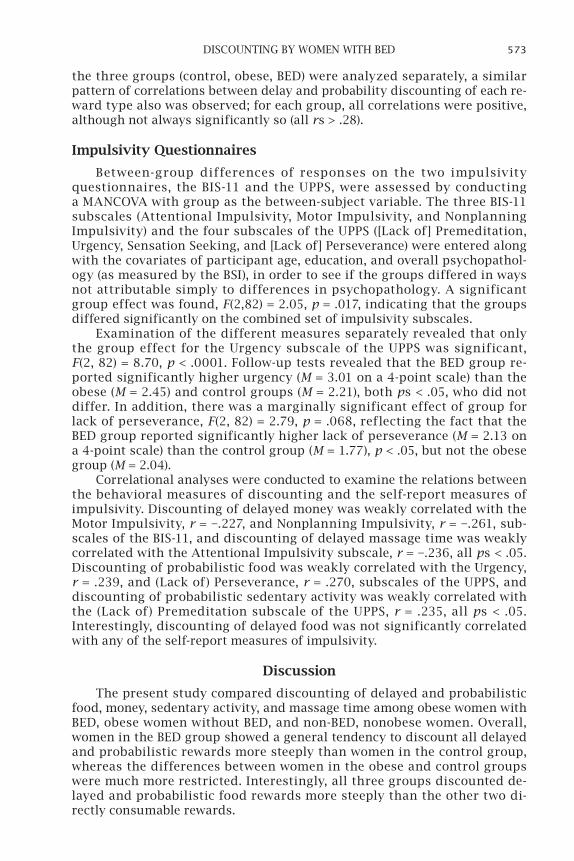
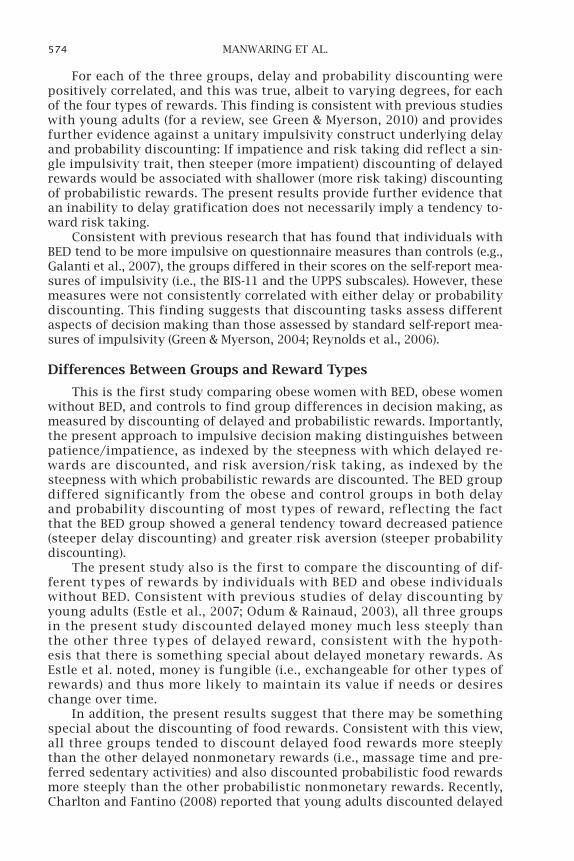
Inspection of the distributions of the relative subjective values of the de-layed nonmonetary rewards revealed that they tended to be highly skewed, resulting in skewed distributions of AuC measures, particularly so for the BED group. Importantly, when the data from all rewards were combined, BED participants differed significantly in skew from obese and control partici-pants (p < .005) as assessed by randomization and bootstrap tests (Noreen, 1989), whereas obese participants did not differ from the controls. This may be seen in Figure 1, which presents box plots of the AuC values for the de-layed rewards, averaged across the two amounts, for the control, obese, and BED groups.
Each box in Figure 1 represents the results for a different type of delayed reward. The bottom and top represent the 25th and 75th percentiles, respec-tively, and the horizontal line within each box represents the 50th percentile (group median). The vertical lines (“whiskers”) extending from the boxes rep-resent the minimum and maximum values that are not outliers, and outliers are represented by the solid circles at the end of these lines. Outliers are de-fined as values above the 90th percentile or below the 10th percentile. Positive skewness is indicated by a box that extends higher above the median line than it does below and a top whisker that is longer than the bottom whisker. The box plots show that the BED group had lower median AuCs (indicating greater delay discounting) than the obese and control groups for all four types of re-ward and that they typically showed greater positive skew as well.
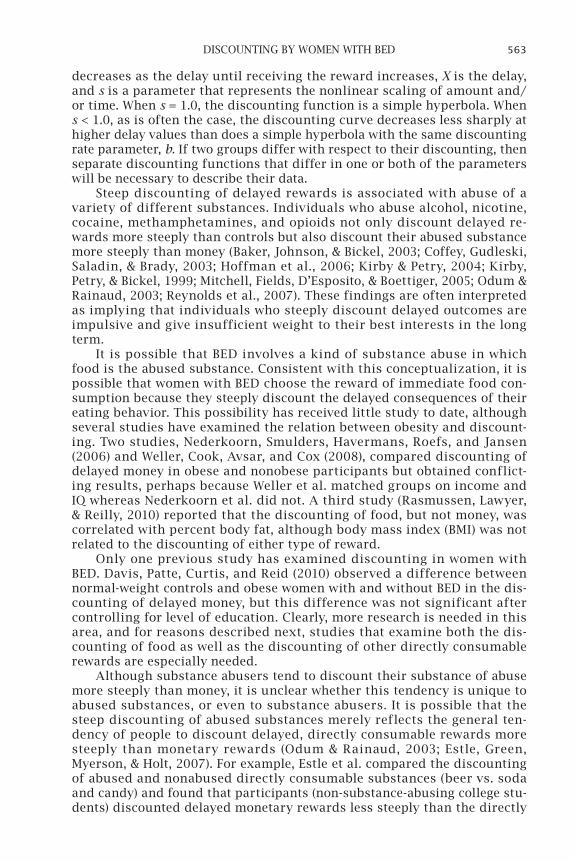
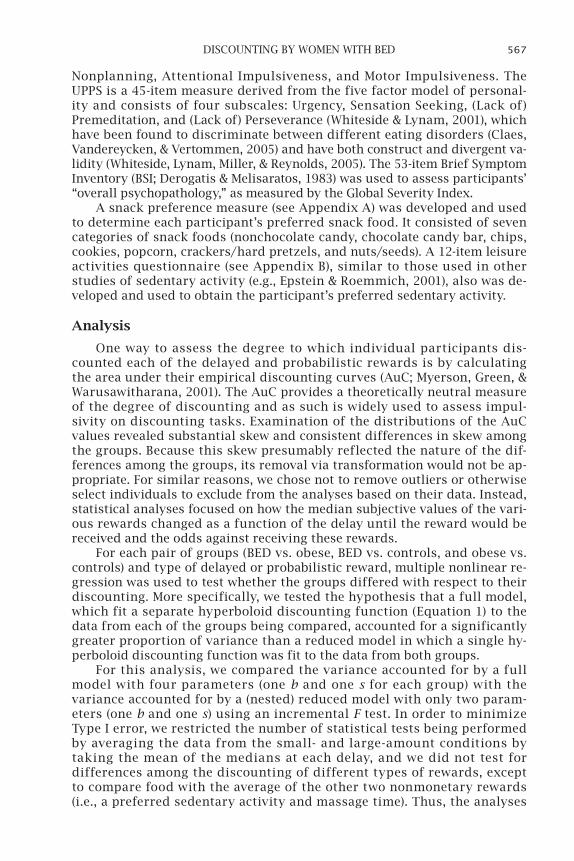
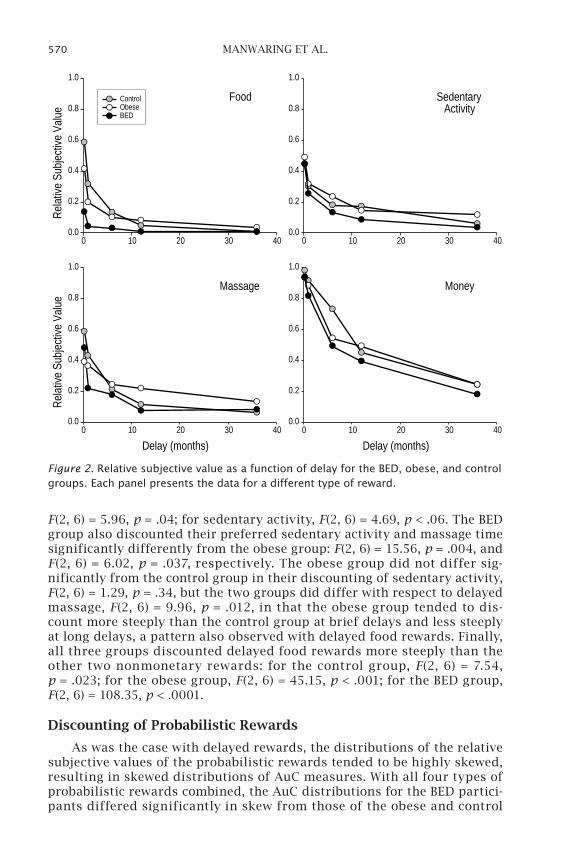
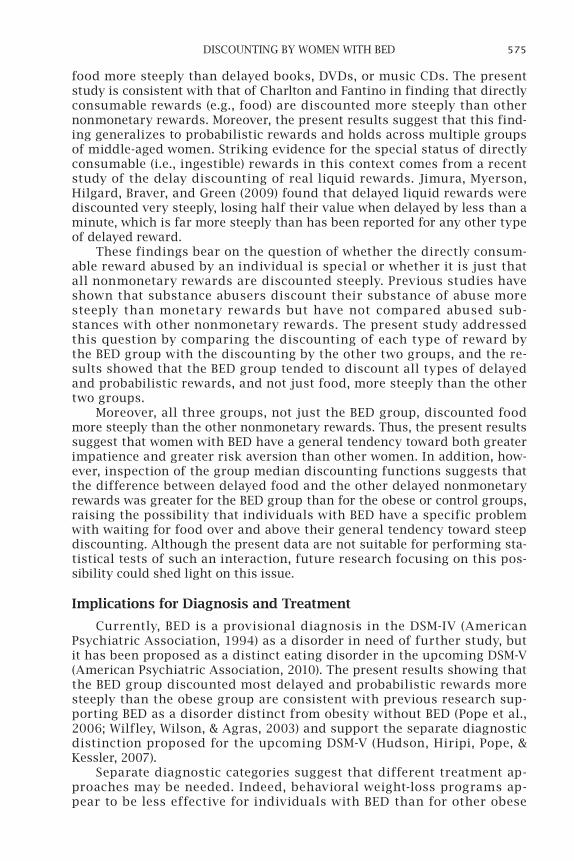
As already noted, it was because of both the skew and the group dif-ferences in skew that analysis focused on the median subjective values. Accordingly, Figure 2 shows the relative subjective value, calculated as the average of the medians of the relative subjective values for the small and large amounts, plotted as a function of delay. Each panel presents the results for a different type of delayed reward. As may be seen, the BED group tended to discount all types of delayed rewards more steeply than the obese and control groups, and all three groups tended to discount delayed money (see the bot-tom right panel) less steeply than the other three types of rewards.
For delayed food rewards, multiple nonlinear regression analyses re-vealed that discounting by the BED group differed significantly from that
569DISCOUNTING BY WOMEN WITH BED
of the control group, F(2, 6) = 191.92, p < .0001, and the obese group, F(2, 6) = 143.86, p < .0001. In addition, the obese group discounted food differ-ently from the control group, F(2, 6) = 24.54, p = .001. For delayed monetary rewards, the BED group again differed significantly from the control group, F(2, 6) = 12.40, p = .007, and differed at the trend level from the obese group, F(2, 6) = 3.86, p = .08, whereas the obese and control groups did not differ significantly.
With respect to the other two delayed nonmonetary rewards, the BED group and the control group differed in their discounting of both their preferred sedentary activity and massage time, although the differ-ence for sedentary activity was only marginally significant: for massage,
Delayed Money
BED
Area
Und
er th
e Cu
rve
0.0
0.2
0.4
0.6
0.8
1.0
Obese Control
Delayed Massage
BED
Area
Und
er th
e Cu
rve
0.0
0.2
0.4
0.6
0.8
1.0
Obese Control
Delayed Sedentary Activity
BED
Area
Und
er th
e Cu
rve
0.0
0.2
0.4
0.6
0.8
1.0
Obese Control
Delayed Food
BED
Area
Und
er th
e Cu
rve
0.0
0.2
0.4
0.6
0.8
1.0
Obese Control
Figure 1. Box plots of AuC values for the BED, obese, and control groups on the delay discounting tasks. Each panel presents the data for a different type of delayed reward. The bottom and top of each box represent the 25th and 75th percentiles, respectively, and the horizontal line within each box represents the 50th percentile (group median). The vertical lines extending from the boxes represent the minimum and maximum values that are not outliers, and outliers (i.e., values above the 90th percentile or below the 10th percentile) are represented by the solid circles.
570 MANWARING ET AL.
F(2, 6) = 5.96, p = .04; for sedentary activity, F(2, 6) = 4.69, p < .06. The BED group also discounted their preferred sedentary activity and massage time significantly differently from the obese group: F(2, 6) = 15.56, p = .004, and F(2, 6) = 6.02, p = .037, respectively. The obese group did not differ sig-nificantly from the control group in their discounting of sedentary activity, F(2, 6) = 1.29, p = .34, but the two groups did differ with respect to delayed massage, F(2, 6) = 9.96, p = .012, in that the obese group tended to dis-count more steeply than the control group at brief delays and less steeply at long delays, a pattern also observed with delayed food rewards. Finally, all three groups discounted delayed food rewards more steeply than the other two nonmonetary rewards: for the control group, F(2, 6) = 7.54, p = .023; for the obese group, F(2, 6) = 45.15, p < .001; for the BED group, F(2, 6) = 108.35, p < .0001.
Discounting of probabilistic rewards
As was the case with delayed rewards, the distributions of the relative subjective values of the probabilistic rewards tended to be highly skewed, resulting in skewed distributions of AuC measures. With all four types of probabilistic rewards combined, the AuC distributions for the BED partici-pants differed significantly in skew from those of the obese and control
Food
0 10 20 30 40
Rela
tive
Subj
ectiv
e Va
lue
0.0
0.2
0.4
0.6
0.8
1.0
SedentaryActivity
0 10 20 30 400.0
0.2
0.4
0.6
0.8
1.0
ControlObeseBED
Massage
Delay (months)0 10 20 30 40
Rela
tive
Subj
ectiv
e Va
lue
0.0
0.2
0.4
0.6
0.8
1.0
Money
Delay (months)0 10 20 30 40
0.0
0.2
0.4
0.6
0.8
1.0
Figure 2. Relative subjective value as a function of delay for the BED, obese, and control groups. Each panel presents the data for a different type of reward.
571DISCOUNTING BY WOMEN WITH BED
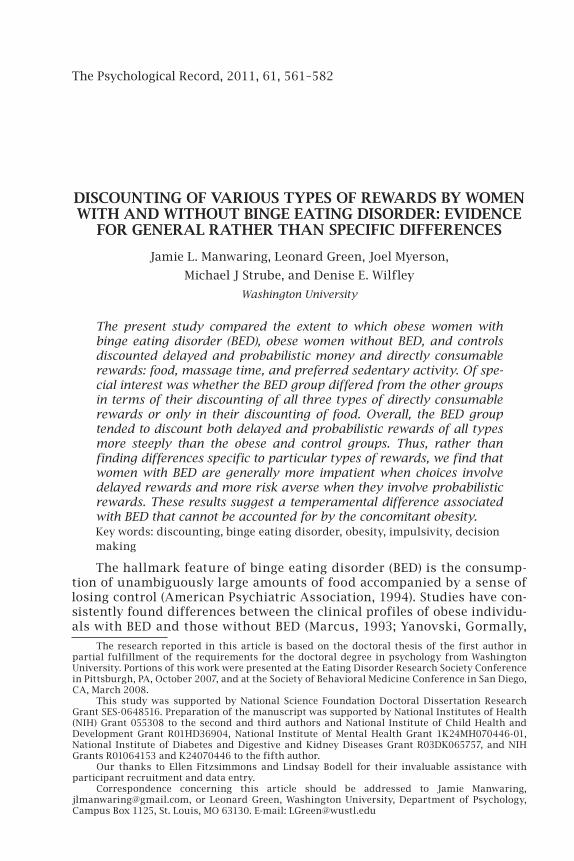
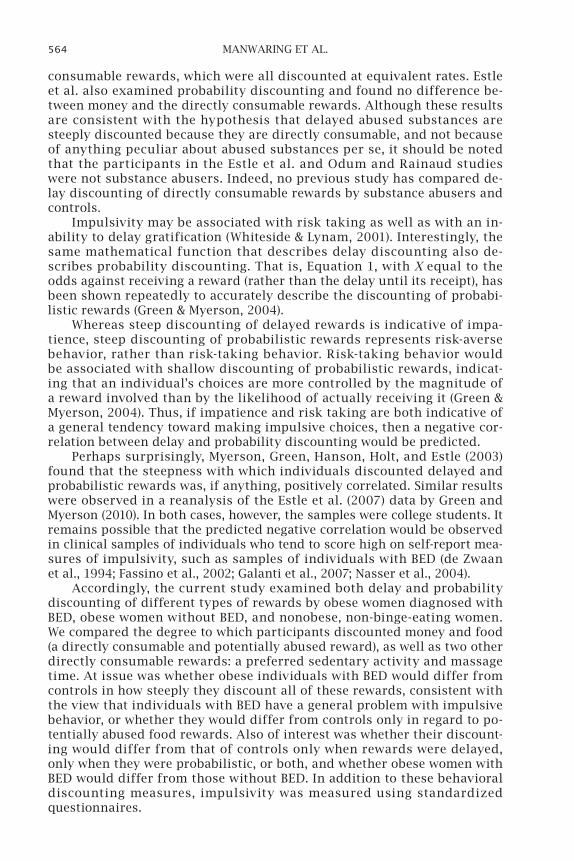
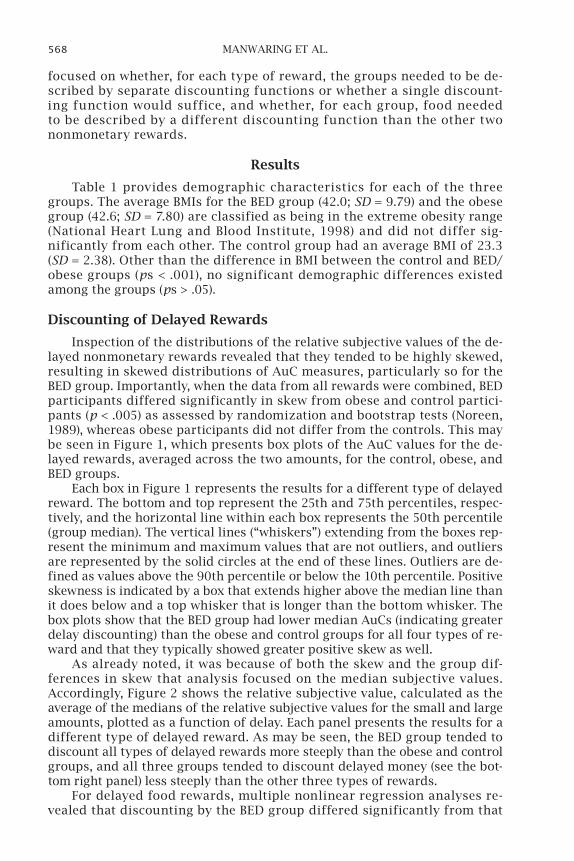
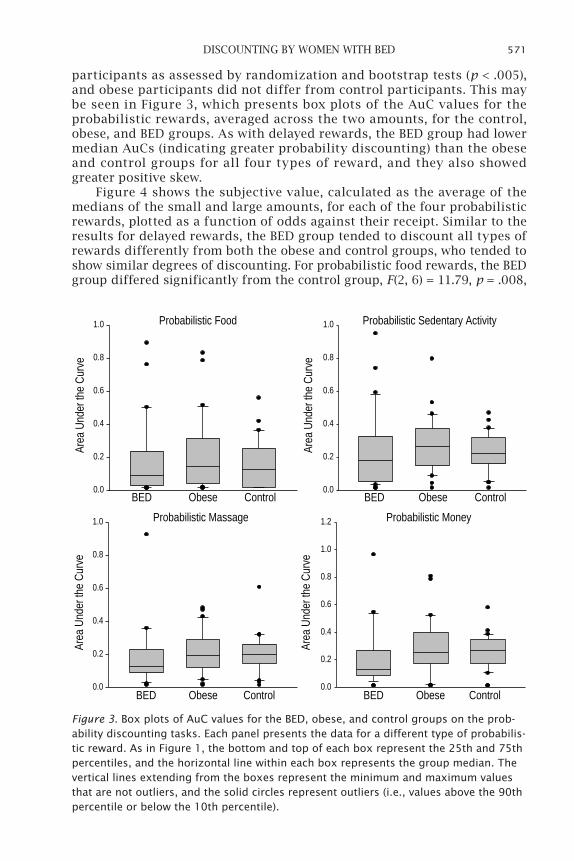
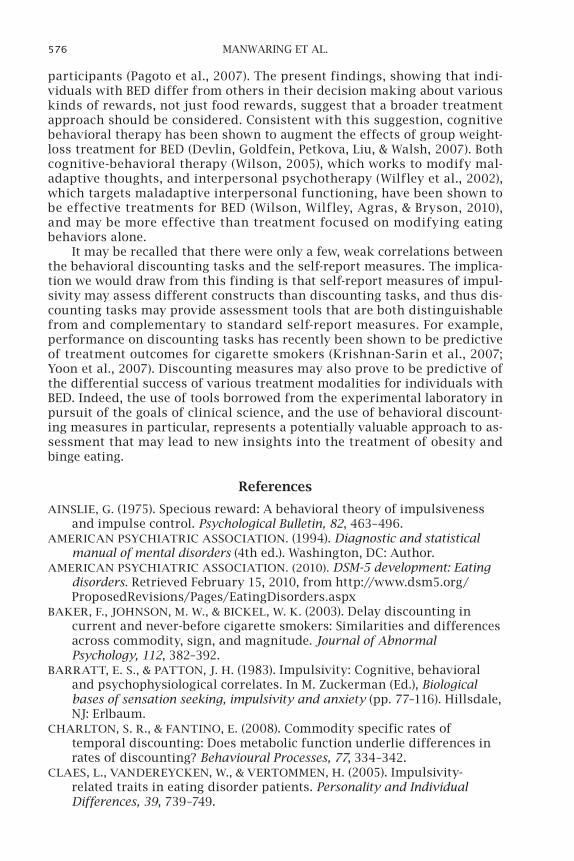
participants as assessed by randomization and bootstrap tests (p < .005), and obese participants did not differ from control participants. This may be seen in Figure 3, which presents box plots of the AuC values for the probabilistic rewards, averaged across the two amounts, for the control, obese, and BED groups. As with delayed rewards, the BED group had lower median AuCs (indicating greater probability discounting) than the obese and control groups for all four types of reward, and they also showed greater positive skew.
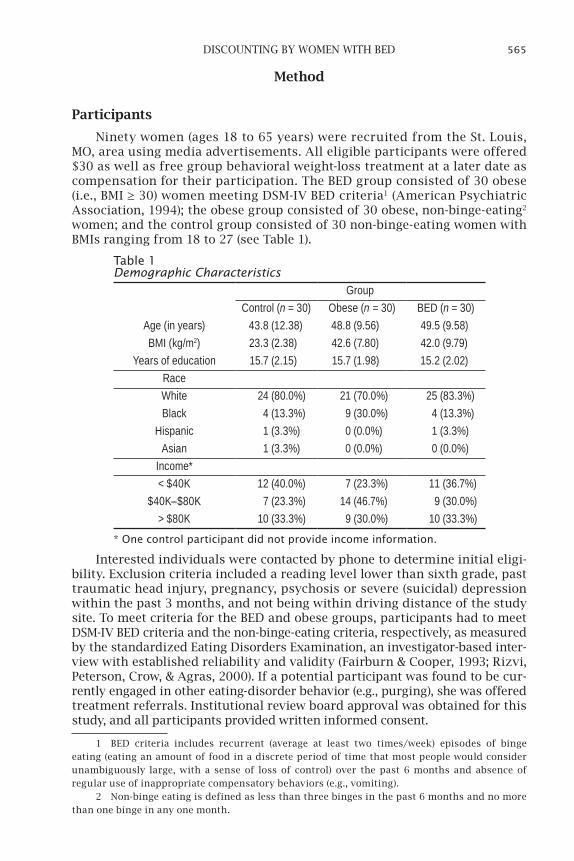
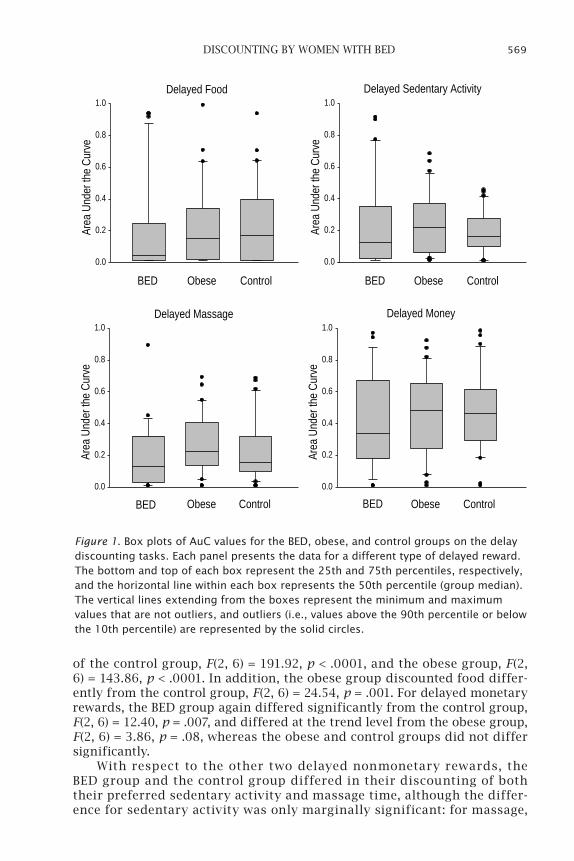
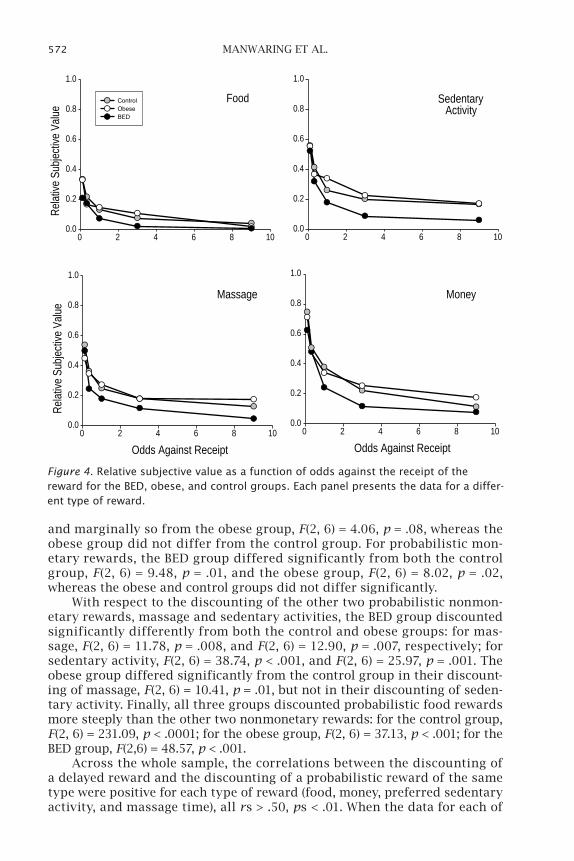
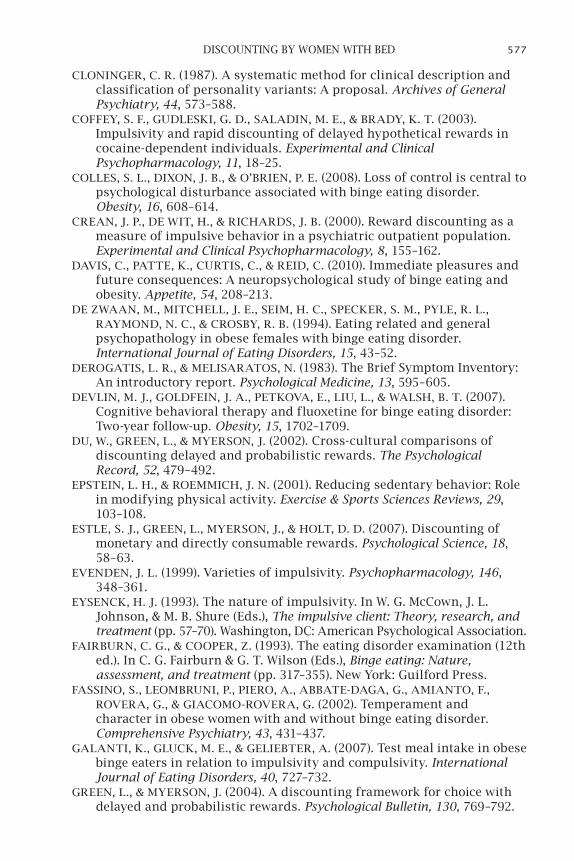
Figure 4 shows the subjective value, calculated as the average of the medians of the small and large amounts, for each of the four probabilistic rewards, plotted as a function of odds against their receipt. Similar to the results for delayed rewards, the BED group tended to discount all types of rewards differently from both the obese and control groups, who tended to show similar degrees of discounting. For probabilistic food rewards, the BED group differed significantly from the control group, F(2, 6) = 11.79, p = .008,
Probabilistic Money
BED
Area
Und
er th
e Cu
rve
0.0
0.2
0.4
0.6
0.8
1.0
1.2
Obese Control
Probabilistic Massage
BED
Area
Und
er th
e Cu
rve
0.0
0.2
0.4
0.6
0.8
1.0
Obese Control
Probabilistic Sedentary Activity
BED
Area
Und
er th
e Cu
rve
0.0
0.2
0.4
0.6
0.8
1.0
Obese Control
Probabilistic Food
BED
Area
Und
er th
e Cu
rve
0.0
0.2
0.4
0.6
0.8
1.0
Obese Control
Figure 3. Box plots of AuC values for the BED, obese, and control groups on the prob-ability discounting tasks. Each panel presents the data for a different type of probabilis-tic reward. As in Figure 1, the bottom and top of each box represent the 25th and 75th percentiles, and the horizontal line within each box represents the group median. The vertical lines extending from the boxes represent the minimum and maximum values that are not outliers, and the solid circles represent outliers (i.e., values above the 90th percentile or below the 10th percentile).
572 MANWARING ET AL.
and marginally so from the obese group, F(2, 6) = 4.06, p = .08, whereas the obese group did not differ from the control group. For probabilistic mon-etary rewards, the BED group differed significantly from both the control group, F(2, 6) = 9.48, p = .01, and the obese group, F(2, 6) = 8.02, p = .02, whereas the obese and control groups did not differ significantly.
With respect to the discounting of the other two probabilistic nonmon-etary rewards, massage and sedentary activities, the BED group discounted significantly differently from both the control and obese groups: for mas-sage, F(2, 6) = 11.78, p = .008, and F(2, 6) = 12.90, p = .007, respectively; for sedentary activity, F(2, 6) = 38.74, p < .001, and F(2, 6) = 25.97, p = .001. The obese group differed significantly from the control group in their discount-ing of massage, F(2, 6) = 10.41, p = .01, but not in their discounting of seden-tary activity. Finally, all three groups discounted probabilistic food rewards more steeply than the other two nonmonetary rewards: for the control group, F(2, 6) = 231.09, p < .0001; for the obese group, F(2, 6) = 37.13, p < .001; for the BED group, F(2,6) = 48.57, p < .001.
Across the whole sample, the correlations between the discounting of a delayed reward and the discounting of a probabilistic reward of the same type were positive for each type of reward (food, money, preferred sedentary activity, and massage time), all rs > .50, ps < .01. When the data for each of
Food
0 2 4 6 8 10
Rela
tive
Subj
ectiv
e Va
lue
0.0
0.2
0.4
0.6
0.8
1.0
ControlObeseBED
SedentaryActivity
0 2 4 6 8 100.0
0.2
0.4
0.6
0.8
1.0
Massage
Odds Against Receipt0 2 4 6 8 10
Rela
tive
Subj
ectiv
e Va
lue
0.0
0.2
0.4
0.6
0.8
1.0
Money
Odds Against Receipt0 2 4 6 8 10
0.0
0.2
0.4
0.6
0.8
1.0
Figure 4. Relative subjective value as a function of odds against the receipt of the reward for the BED, obese, and control groups. Each panel presents the data for a differ-ent type of reward.
573DISCOUNTING BY WOMEN WITH BED
the three groups (control, obese, BED) were analyzed separately, a similar pattern of correlations between delay and probability discounting of each re-ward type also was observed; for each group, all correlations were positive, although not always significantly so (all rs > .28).
impulsivity Questionnaires
Between-group differences of responses on the two impulsivity questionnaires, the BIS-11 and the UPPS, were assessed by conducting a MANCOVA with group as the between-subject variable. The three BIS-11 subscales (Attentional Impulsivity, Motor Impulsivity, and Nonplanning Impulsivity) and the four subscales of the UPPS ([Lack of] Premeditation, Urgency, Sensation Seeking, and [Lack of] Perseverance) were entered along with the covariates of participant age, education, and overall psychopathol-ogy (as measured by the BSI), in order to see if the groups differed in ways not attributable simply to differences in psychopathology. A significant group effect was found, F(2,82) = 2.05, p = .017, indicating that the groups differed significantly on the combined set of impulsivity subscales.
Examination of the different measures separately revealed that only the group effect for the Urgency subscale of the UPPS was significant, F(2, 82) = 8.70, p < .0001. Follow-up tests revealed that the BED group re-ported significantly higher urgency (M = 3.01 on a 4-point scale) than the obese (M = 2.45) and control groups (M = 2.21), both ps < .05, who did not differ. In addition, there was a marginally significant effect of group for lack of perseverance, F(2, 82) = 2.79, p = .068, reflecting the fact that the BED group reported significantly higher lack of perseverance (M = 2.13 on a 4-point scale) than the control group (M = 1.77), p < .05, but not the obese group (M = 2.04).
Correlational analyses were conducted to examine the relations between the behavioral measures of discounting and the self-report measures of impulsivity. Discounting of delayed money was weakly correlated with the Motor Impulsivity, r = −.227, and Nonplanning Impulsivity, r = −.261, sub-scales of the BIS-11, and discounting of delayed massage time was weakly correlated with the Attentional Impulsivity subscale, r = −.236, all ps < .05. Discounting of probabilistic food was weakly correlated with the Urgency, r = .239, and (Lack of) Perseverance, r = .270, subscales of the UPPS, and discounting of probabilistic sedentary activity was weakly correlated with the (Lack of) Premeditation subscale of the UPPS, r = .235, all ps < .05. Interestingly, discounting of delayed food was not significantly correlated with any of the self-report measures of impulsivity.
Discussion
The present study compared discounting of delayed and probabilistic food, money, sedentary activity, and massage time among obese women with BED, obese women without BED, and non-BED, nonobese women. Overall, women in the BED group showed a general tendency to discount all delayed and probabilistic rewards more steeply than women in the control group, whereas the differences between women in the obese and control groups were much more restricted. Interestingly, all three groups discounted de-layed and probabilistic food rewards more steeply than the other two di-rectly consumable rewards.
574 MANWARING ET AL.
For each of the three groups, delay and probability discounting were positively correlated, and this was true, albeit to varying degrees, for each of the four types of rewards. This finding is consistent with previous studies with young adults (for a review, see Green & Myerson, 2010) and provides further evidence against a unitary impulsivity construct underlying delay and probability discounting: If impatience and risk taking did reflect a sin-gle impulsivity trait, then steeper (more impatient) discounting of delayed rewards would be associated with shallower (more risk taking) discounting of probabilistic rewards. The present results provide further evidence that an inability to delay gratification does not necessarily imply a tendency to-ward risk taking.
Consistent with previous research that has found that individuals with BED tend to be more impulsive on questionnaire measures than controls (e.g., Galanti et al., 2007), the groups differed in their scores on the self-report mea-sures of impulsivity (i.e., the BIS-11 and the UPPS subscales). However, these measures were not consistently correlated with either delay or probability discounting. This finding suggests that discounting tasks assess different aspects of decision making than those assessed by standard self-report mea-sures of impulsivity (Green & Myerson, 2004; Reynolds et al., 2006).
Differences between groups and reward types
This is the first study comparing obese women with BED, obese women without BED, and controls to find group differences in decision making, as measured by discounting of delayed and probabilistic rewards. Importantly, the present approach to impulsive decision making distinguishes between patience/impatience, as indexed by the steepness with which delayed re-wards are discounted, and risk aversion/risk taking, as indexed by the steepness with which probabilistic rewards are discounted. The BED group differed significantly from the obese and control groups in both delay and probability discounting of most types of reward, reflecting the fact that the BED group showed a general tendency toward decreased patience (steeper delay discounting) and greater risk aversion (steeper probability discounting).
The present study also is the first to compare the discounting of dif-ferent types of rewards by individuals with BED and obese individuals without BED. Consistent with previous studies of delay discounting by young adults (Estle et al., 2007; Odum & Rainaud, 2003), all three groups in the present study discounted delayed money much less steeply than the other three types of delayed reward, consistent with the hypoth-esis that there is something special about delayed monetary rewards. As Estle et al. noted, money is fungible (i.e., exchangeable for other types of rewards) and thus more likely to maintain its value if needs or desires change over time.
In addition, the present results suggest that there may be something special about the discounting of food rewards. Consistent with this view, all three groups tended to discount delayed food rewards more steeply than the other delayed nonmonetary rewards (i.e., massage time and pre-ferred sedentary activities) and also discounted probabilistic food rewards more steeply than the other probabilistic nonmonetary rewards. Recently, Charlton and Fantino (2008) reported that young adults discounted delayed
575DISCOUNTING BY WOMEN WITH BED
food more steeply than delayed books, DVDs, or music CDs. The present study is consistent with that of Charlton and Fantino in finding that directly consumable rewards (e.g., food) are discounted more steeply than other nonmonetary rewards. Moreover, the present results suggest that this find-ing generalizes to probabilistic rewards and holds across multiple groups of middle-aged women. Striking evidence for the special status of directly consumable (i.e., ingestible) rewards in this context comes from a recent study of the delay discounting of real liquid rewards. Jimura, Myerson, Hilgard, Braver, and Green (2009) found that delayed liquid rewards were discounted very steeply, losing half their value when delayed by less than a minute, which is far more steeply than has been reported for any other type of delayed reward.
These findings bear on the question of whether the directly consum-able reward abused by an individual is special or whether it is just that all nonmonetary rewards are discounted steeply. Previous studies have shown that substance abusers discount their substance of abuse more steeply than monetary rewards but have not compared abused sub-stances with other nonmonetary rewards. The present study addressed this question by comparing the discounting of each type of reward by the BED group with the discounting by the other two groups, and the re-sults showed that the BED group tended to discount all types of delayed and probabilistic rewards, and not just food, more steeply than the other two groups.
Moreover, all three groups, not just the BED group, discounted food more steeply than the other nonmonetary rewards. Thus, the present results suggest that women with BED have a general tendency toward both greater impatience and greater risk aversion than other women. In addition, how-ever, inspection of the group median discounting functions suggests that the difference between delayed food and the other delayed nonmonetary rewards was greater for the BED group than for the obese or control groups, raising the possibility that individuals with BED have a specific problem with waiting for food over and above their general tendency toward steep discounting. Although the present data are not suitable for performing sta-tistical tests of such an interaction, future research focusing on this pos-sibility could shed light on this issue.
implications for Diagnosis and treatment
Currently, BED is a provisional diagnosis in the DSM-IV (American Psychiatric Association, 1994) as a disorder in need of further study, but it has been proposed as a distinct eating disorder in the upcoming DSM-V (American Psychiatric Association, 2010). The present results showing that the BED group discounted most delayed and probabilistic rewards more steeply than the obese group are consistent with previous research sup-porting BED as a disorder distinct from obesity without BED (Pope et al., 2006; Wilfley, Wilson, & Agras, 2003) and support the separate diagnostic distinction proposed for the upcoming DSM-V (Hudson, Hiripi, Pope, & Kessler, 2007).
Separate diagnostic categories suggest that different treatment ap-proaches may be needed. Indeed, behavioral weight-loss programs ap-pear to be less effective for individuals with BED than for other obese
576 MANWARING ET AL.
participants (Pagoto et al., 2007). The present findings, showing that indi-viduals with BED differ from others in their decision making about various kinds of rewards, not just food rewards, suggest that a broader treatment approach should be considered. Consistent with this suggestion, cognitive behavioral therapy has been shown to augment the effects of group weight-loss treatment for BED (Devlin, Goldfein, Petkova, Liu, & Walsh, 2007). Both cognitive-behavioral therapy (Wilson, 2005), which works to modify mal-adaptive thoughts, and interpersonal psychotherapy (Wilfley et al., 2002), which targets maladaptive interpersonal functioning, have been shown to be effective treatments for BED (Wilson, Wilfley, Agras, & Bryson, 2010), and may be more effective than treatment focused on modifying eating behaviors alone.
It may be recalled that there were only a few, weak correlations between the behavioral discounting tasks and the self-report measures. The implica-tion we would draw from this finding is that self-report measures of impul-sivity may assess different constructs than discounting tasks, and thus dis-counting tasks may provide assessment tools that are both distinguishable from and complementary to standard self-report measures. For example, performance on discounting tasks has recently been shown to be predictive of treatment outcomes for cigarette smokers (Krishnan-Sarin et al., 2007; Yoon et al., 2007). Discounting measures may also prove to be predictive of the differential success of various treatment modalities for individuals with BED. Indeed, the use of tools borrowed from the experimental laboratory in pursuit of the goals of clinical science, and the use of behavioral discount-ing measures in particular, represents a potentially valuable approach to as-sessment that may lead to new insights into the treatment of obesity and binge eating.
references
AINSLIE, G. (1975). Specious reward: A behavioral theory of impulsiveness and impulse control. Psychological Bulletin, 82, 463–496.
AMERICAN PSYCHIATRIC ASSOCIATION. (1994). Diagnostic and statistical manual of mental disorders (4th ed.). Washington, DC: Author.
AMERICAN PSYCHIATRIC ASSOCIATION. (2010). DSM-5 development: Eating disorders. Retrieved February 15, 2010, from http://www.dsm5.org/ProposedRevisions/Pages/EatingDisorders.aspx
BAKER, F., JOHNSON, M. W., & BICKEL, W. K. (2003). Delay discounting in current and never-before cigarette smokers: Similarities and differences across commodity, sign, and magnitude. Journal of Abnormal Psychology, 112, 382–392.
BARRATT, E. S., & PATTON, J. H. (1983). Impulsivity: Cognitive, behavioral and psychophysiological correlates. In M. Zuckerman (Ed.), Biological bases of sensation seeking, impulsivity and anxiety (pp. 77–116). Hillsdale, NJ: Erlbaum.
CHARLTON, S. R., & FANTINO, E. (2008). Commodity specific rates of temporal discounting: Does metabolic function underlie differences in rates of discounting? Behavioural Processes, 77, 334–342.
CLAES, L., VANDEREYCKEN, W., & VERTOMMEN, H. (2005). Impulsivity-related traits in eating disorder patients. Personality and Individual Differences, 39, 739–749.
577DISCOUNTING BY WOMEN WITH BED
CLONINGER, C. R. (1987). A systematic method for clinical description and classification of personality variants: A proposal. Archives of General Psychiatry, 44, 573–588.
COFFEY, S. F., GUDLESKI, G. D., SALADIN, M. E., & BRADY, K. T. (2003). Impulsivity and rapid discounting of delayed hypothetical rewards in cocaine-dependent individuals. Experimental and Clinical Psychopharmacology, 11, 18–25.
COLLES, S. L., DIxON, J. B., & O’BRIEN, P. E. (2008). Loss of control is central to psychological disturbance associated with binge eating disorder. Obesity, 16, 608–614.
CREAN, J. P., DE WIT, H., & RICHARDS, J. B. (2000). Reward discounting as a measure of impulsive behavior in a psychiatric outpatient population. Experimental and Clinical Psychopharmacology, 8, 155–162.
DAVIS, C., PATTE, K., CURTIS, C., & REID, C. (2010). Immediate pleasures and future consequences: A neuropsychological study of binge eating and obesity. Appetite, 54, 208–213.
DE ZWAAN, M., MITCHELL, J. E., SEIM, H. C., SPECKER, S. M., PYLE, R. L., RAYMOND, N. C., & CROSBY, R. B. (1994). Eating related and general psychopathology in obese females with binge eating disorder. International Journal of Eating Disorders, 15, 43–52.
DEROGATIS, L. R., & MELISARATOS, N. (1983). The Brief Symptom Inventory: An introductory report. Psychological Medicine, 13, 595–605.
DEVLIN, M. J., GOLDFEIN, J. A., PETKOVA, E., LIU, L., & WALSH, B. T. (2007). Cognitive behavioral therapy and fluoxetine for binge eating disorder: Two-year follow-up. Obesity, 15, 1702–1709.
DU, W., GREEN, L., & MYERSON, J. (2002). Cross-cultural comparisons of discounting delayed and probabilistic rewards. The Psychological Record, 52, 479–492.
EPSTEIN, L. H., & ROEMMICH, J. N. (2001). Reducing sedentary behavior: Role in modifying physical activity. Exercise & Sports Sciences Reviews, 29, 103–108.
ESTLE, S. J., GREEN, L., MYERSON, J., & HOLT, D. D. (2007). Discounting of monetary and directly consumable rewards. Psychological Science, 18, 58–63.
EVENDEN, J. L. (1999). Varieties of impulsivity. Psychopharmacology, 146, 348–361.
EYSENCK, H. J. (1993). The nature of impulsivity. In W. G. McCown, J. L. Johnson, & M. B. Shure (Eds.), The impulsive client: Theory, research, and treatment (pp. 57–70). Washington, DC: American Psychological Association.
FAIRBURN, C. G., & COOPER, Z. (1993). The eating disorder examination (12th ed.). In C. G. Fairburn & G. T. Wilson (Eds.), Binge eating: Nature, assessment, and treatment (pp. 317–355). New York: Guilford Press.
FASSINO, S., LEOMBRUNI, P., PIERO, A., ABBATE-DAGA, G., AMIANTO, F., ROVERA, G., & GIACOMO-ROVERA, G. (2002). Temperament and character in obese women with and without binge eating disorder. Comprehensive Psychiatry, 43, 431–437.
GALANTI, K., GLUCK, M. E., & GELIEBTER, A. (2007). Test meal intake in obese binge eaters in relation to impulsivity and compulsivity. International Journal of Eating Disorders, 40, 727–732.
GREEN, L., & MYERSON, J. (2004). A discounting framework for choice with delayed and probabilistic rewards. Psychological Bulletin, 130, 769–792.
578 MANWARING ET AL.
GREEN, L., & MYERSON, J. (2010). Experimental and correlational analyses of delay and probability discounting. In G. J. Madden & W. K. Bickel (Eds.), Impulsivity: Theory, science, and neuroscience of discounting (pp. 67–92). Washington, DC: American Psychological Association.
HELMERS, K. F., YOUNG, S. N., & PIHL, R. O. (1995). Assessment of measures of impulsivity in healthy male volunteers. Personality and Individual Differences, 19, 927–935.
HOFFMAN, W. F., MOORE, M., TEMPLIN, R., MCFARLAND, B., HITZEMANN, R. J., & MITCHELL, S. H. (2006). Neuropsychological function and delay discounting in methamphetamine-dependent individuals. Psychopharmacology, 188, 162–170.
HUDSON, J. I., HIRIPI, E., POPE, H. G., JR., & KESSLER, R. C. (2007). The prevalence and correlates of eating disorders in the national comorbidity survey replication. Biological Psychiatry, 61, 348–358.
JIMURA, K., MYERSON, J., HILGARD, J., BRAVER, T. S., & GREEN, L. (2009). Are people really more patient than other animals? Evidence from human discounting of real liquid rewards. Psychonomic Bulletin & Review, 16, 1071–1075.
KIRBY, K. N., & FINCH, J. C. (2010). The hierarchical structure of self-reported impulsivity. Personality and Individual Differences, 48, 704–713.
KIRBY, K. N. & PETRY, N. M. (2004). Heroin and cocaine abusers have higher discount rates for delayed rewards than alcoholics or non-drug-using controls. Addiction, 99, 461–471.
KIRBY, K. N., PETRY, N. M., & BICKEL, W. K. (1999). Heroin addicts have higher discount rates for delayed rewards than non-drug-using controls. Journal of Experimental Psychology: General, 128, 78–87.
KRISHNAN-SARIN, S., REYNOLDS, B., DUHIG, A. M., SMITH, A., LISS, T., MCFETRIDGE, A., CAVALLO, D. A., CARROLL, K. M., & POTENZA, M. N. (2007). Behavioral impulsivity predicts treatment outcome in a smoking cessation program for adolescent smokers. Drug and Alcohol Dependence, 88, 79–82.
MARCUS, M. D. (1993). Binge eating in obesity. In C. G. Fairburn & G. T. Wilson (Eds.), Binge eating: Nature, assessment, and treatment (pp. 77–96). New York: Guilford Press.
MITCHELL, J. E., FIELDS, H. L., D’ESPOSITO, M., & BOETTIGER, C. A. (2005). Impulsive responding in alcoholics. Alcohol: Clinical and Experimental Research, 29, 2158–2169.
MYERSON, J., GREEN, L., HANSON, J. S., HOLT, D. D., & ESTLE, S. J. (2003). Discounting delayed and probabilistic rewards: Processes and traits. Journal of Economic Psychology, 24, 619–635.
MYERSON, J., GREEN, L., & WARUSAWITHARANA, M. (2001). Area under the curve as a measure of discounting. Journal of the Experimental Analysis of Behavior, 76, 235–243.
NASSER, J. A., GLUCK, M. E., & GELIEBTER, A. (2004). Impulsivity and test meal intake in obese binge eating women. Appetite, 43, 303–307.
NATIONAL HEART LUNG AND BLOOD INSTITUTE. (1998). Clinical guidelines on the identification, evaluation, and treatment of overweight and obesity in adults: The evidence report. Obesity Research, 6, 51S–209S.
NEDERKOORN, C., SMULDERS, F. T. Y., HAVERMANS, R. C., ROEFS, A., & JANSEN, A. (2006). Impulsivity in obese women. Appetite, 47, 253–256.
579DISCOUNTING BY WOMEN WITH BED
NOREEN, E. W. (1989). Computer-intensive methods for testing hypotheses: An introduction. New York: Wiley.
ODUM, A. L., & RAINAUD, C. P. (2003). Discounting of delayed hypothetical money, alcohol, and food. Behavioural Processes, 64, 305–313.
PAGOTO, S., BODENLOS, J. S., KANTOR, L., GITKIND, M., CURTIN, C., & MA, Y. (2007). Association of major depression and binge eating disorder with weight loss in a clinical setting. Obesity, 15, 2557–2559.
PATTON, J. H., STANFORD, M. S., & BARRATT, E. S. (1995). Factor structure of the Barratt Impulsiveness Scale. Journal of Clinical Psychology, 51, 768–774.
POPE, H. G., JR., LALONDE, J. K., PINDYCK, L. J., WALSH, B. T., BULIK, C. M., CROW, S., MCELROY, S. L., ROSENTHAL, N., & HUDSON, J. I. (2006). Binge eating disorder: A stable syndrome. American Journal of Psychiatry, 163, 2181–2183.
RACHLIN, H. (1995). Self-control: Beyond commitment. Behavioral and Brain Sciences, 18, 109–121.
RACHLIN, H., & GREEN, L. (1972). Commitment, choice and self-control. Journal of the Experimental Analysis of Behavior, 17, 15–22.
RASMUSSEN, E. B., LAWYER, S. R., & REILLY, W. (2010). Percent body fat is related to delay and probability discounting for food in humans. Behavioural Processes, 83, 23–30.
RAYMOND, N. C., NEUMEYER, B., THURAS, P., WELLER, C. L., ECKERT, E. D., CROW, S. J., & MITCHELL, J. E. (1999). Compulsive and impulsive traits in individuals with obese binge eating disorder and bulimia nervosa. Eating Disorders, 7, 299–317.
REYNOLDS, B., ORTENGREN, A., RICHARDS, J. B., & DE WIT, H. (2006). Dimensions of impulsive behavior: Personality and behavioral measures. Personality and Individual Differences, 40, 305–315.
REYNOLDS, B., PATAK, M., SHROFF, P., PENFOLD, R. B., MELANKO, S., & DUHIG, A. M. (2007). Laboratory and self-report assessments of impulsive behavior in adolescent daily smokers and nonsmokers. Experimental and Clinical Psychopharmacology, 15, 264–271.
RIZVI, S. L., PETERSON, C. B., CROW, S. J., & AGRAS, W. S. (2000). Test-retest reliability of the eating disorder examination. International Journal of Eating Disorders, 28, 311–316.
SAFER, D. L., LIVELY, T. J., TELCH, C. F., & AGRAS, W. S. (2002). Predictors of relapse following successful dialectical behavior therapy for binge eating disorder. International Journal of Eating Disorders, 32, 155–163.
WELLER, R. E., COOK, E. W., III, AVSAR, K. B., & COx, J. E. (2008). Obese women show greater delay discounting than healthy-weight women. Appetite, 51, 563–569.
WHITESIDE, S. P., & LYNAM, D. R. (2001). The five factor model and impulsivity: Using a structural model of personality to understand impulsivity. Personality and Individual Differences, 30, 669–689.
WHITESIDE, S. P., LYNAM, D. R., MILLER, J. D., & REYNOLDS, S. K. (2005). Validation of the UPPS impulsive behaviour scale: A four-factor model of impulsivity. European Journal of Personality, 19, 559–574.
WILFLEY, D. E., SCHWARTZ, M. B., SPURRELL, E. B., & FAIRBURN, C. G. (2000). Using the eating disorder examination to identify the specific psychopathology of binge eating disorder. International Journal of Eating Disorders, 27, 259–269.
580 MANWARING ET AL.
WILFLEY, D. E., WELCH, R. R., STEIN, R. I., SPURRELL, E. B., COHEN, L. R., SAELENS, B. E., DOUNCHIS, J. Z., FRANK, M. A., WISEMAN, C. V., & MATT, G. E. (2002). A randomized comparison of group cognitive-behavioral therapy and group interpersonal psychotherapy for the treatment of overweight individuals with binge-eating disorder. Archives of General Psychiatry, 59, 713–721.
WILFLEY, D. E., WILSON, G. T., & AGRAS, W. S. (2003). The clinical significance of binge eating disorder. International Journal of Eating Disorders, 34, S96–S106.
WILSON, G. T., WILFLEY, D. E., AGRAS, W. S., & BRYSON, S. W. (2010). Psychological treatments of binge eating disorder. Archives of General Psychiatry, 67, 94–101.
WILSON, G. T. (2005). Psychological treatment of eating disorders. Annual Review of Clinical Psychology, 1, 439–465.
YANOVSKI, S. Z., GORMALLY, J. F., LESER, M. S., GWIRTSMAN, H. E., & YANOVSKI, J. A. (1994). Binge eating disorder affects outcome of comprehensive very-low-calorie diet treatment. Obesity Research, 2, 205–211.
YANOVSKI, S. Z., LEET, M., YANOVSKI, J. A., FLOOD, M., GOLD, P. W., KISSILEFF, H. R., & WALSH, B. T. (1992). Food selection and intake of obese women with binge eating disorder. American Journal of Clinical Nutrition, 56, 975–980.
YOON, J. H., HIGGINS, S. T., HEIL, S. H., SUGARBAKER, R. J., THOMAS, C. S., & BADGER, G. J. (2007). Delay discounting predicts postpartum relapse to cigarette smoking among pregnant women. Experimental and Clinical Psychopharmacology, 15, 176–186.
581DISCOUNTING BY WOMEN WITH BED
appendix a
snack preference measure
Imagine that you are at a vending machine. Assuming this machine has your favorite brand or item in each category, which of the seven categories listed below would you most prefer? Please indicate your most preferred category by listing its name and number below.
category
1. Candy: nonchocolate (e.g., Skittles™, jelly beans, Sweet Tarts™)
2. Candy bar: chocolate (e.g., Snickers™, M&Ms™, Hershey’s bar™, 3
Musketeers™)
3. Chips (e.g., potato, corn, tortilla, Cheetos™, Funyuns™)
4. Cookies (e.g., Oreos™, Chips Ahoy!™, Nutter Butter™)
5. Popcorn (e.g., butter, kettle korn)
6. Crackers/hard pretzels (e.g., Ritz™, Wheat Thins™, graham crackers)
7. Nuts/seeds (e.g., peanuts, cashews, sunflower seeds)
Of the seven categories of snack items listed above, which would you most prefer:
582 MANWARING ET AL.
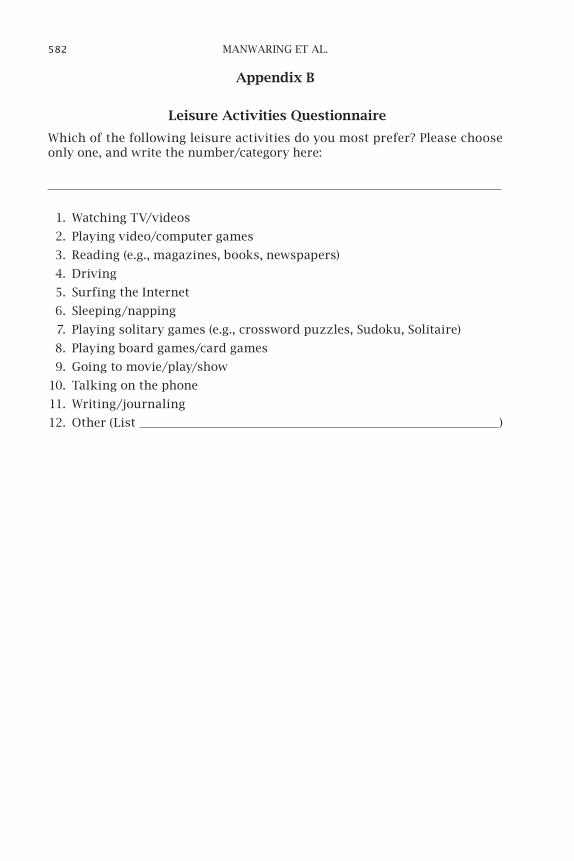
appendix b
leisure activities Questionnaire
Which of the following leisure activities do you most prefer? Please choose only one, and write the number/category here:
1. Watching TV/videos
2. Playing video/computer games
3. Reading (e.g., magazines, books, newspapers)
4. Driving
5. Surfing the Internet
6. Sleeping/napping
7. Playing solitary games (e.g., crossword puzzles, Sudoku, Solitaire)
8. Playing board games/card games
9. Going to movie/play/show
10. Talking on the phone
11. Writing/journaling
12. Other (List )