Embed Size (px)
Citation preview
Discovering Oil and Gas “Sweet-Spots” in Fractured Reservoirs of the Austin Chalk and Eagleford
Shale of South Texas
An EFP Presentation

Our Basic Question
How do we Select our Best Places to Drill?
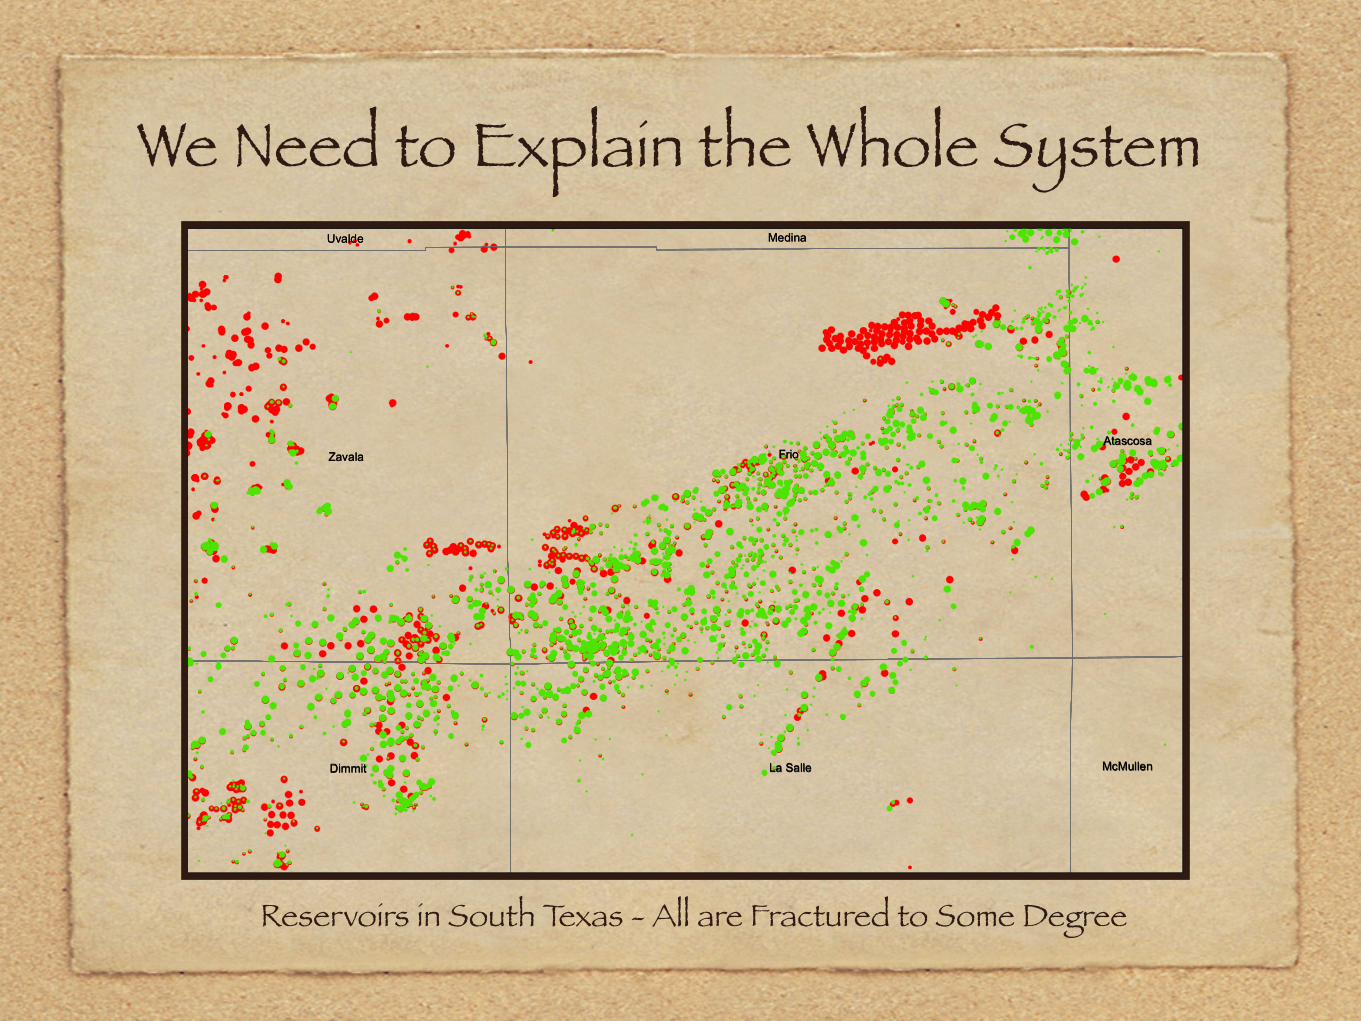
We Need to Explain the Whole System
FrioZavala
La SalleDimmit
Atascosa
McMullen
MedinaUvalde
4 Pearsall Cum. Gas
FrioZavala
La SalleDimmit
Atascosa
McMullen
MedinaUvalde
4 Pearsall Cum. Oil
Reservoirs in South Texas - All are Fractured to Some Degree
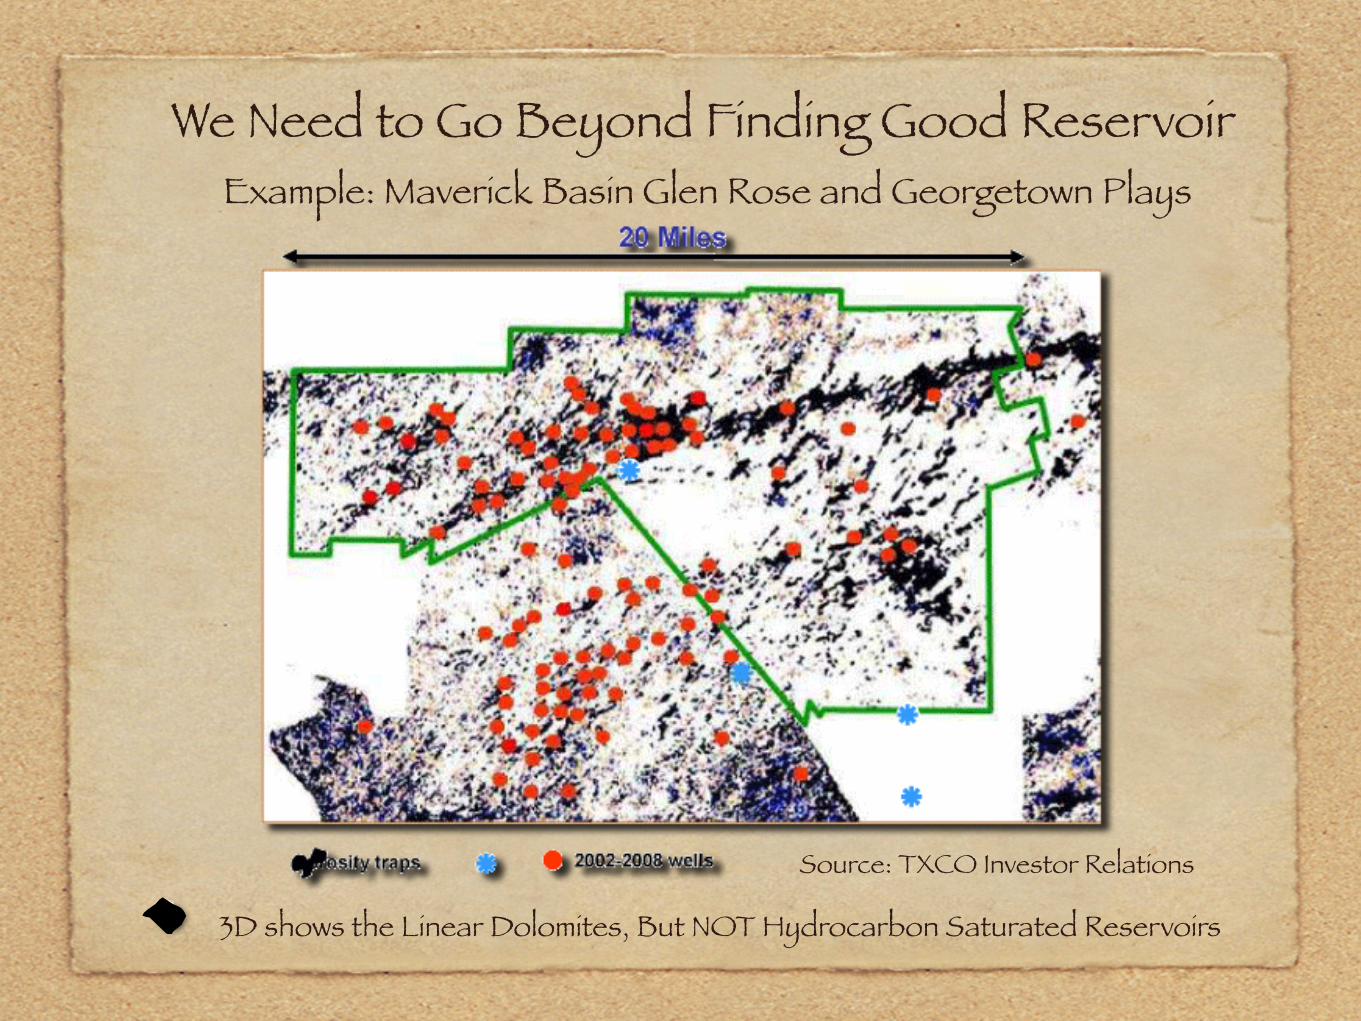
We Need to Go Beyond Finding Good Reservoir Example: Maverick Basin Glen Rose and Georgetown Plays
3D shows the Linear Dolomites, But NOT Hydrocarbon Saturated Reservoirs
Source: TXCO Investor Relations
The Answer is ComplexA Geologic Approach Solves Some Issues
An Engineering Approach Manages Some of Our Other Risks
A Higher Level Approach - Also Look at Fluid-Migration and Permeability Development.
This Solves Problems in a New Way, But it is Rarely Used, Until Now....
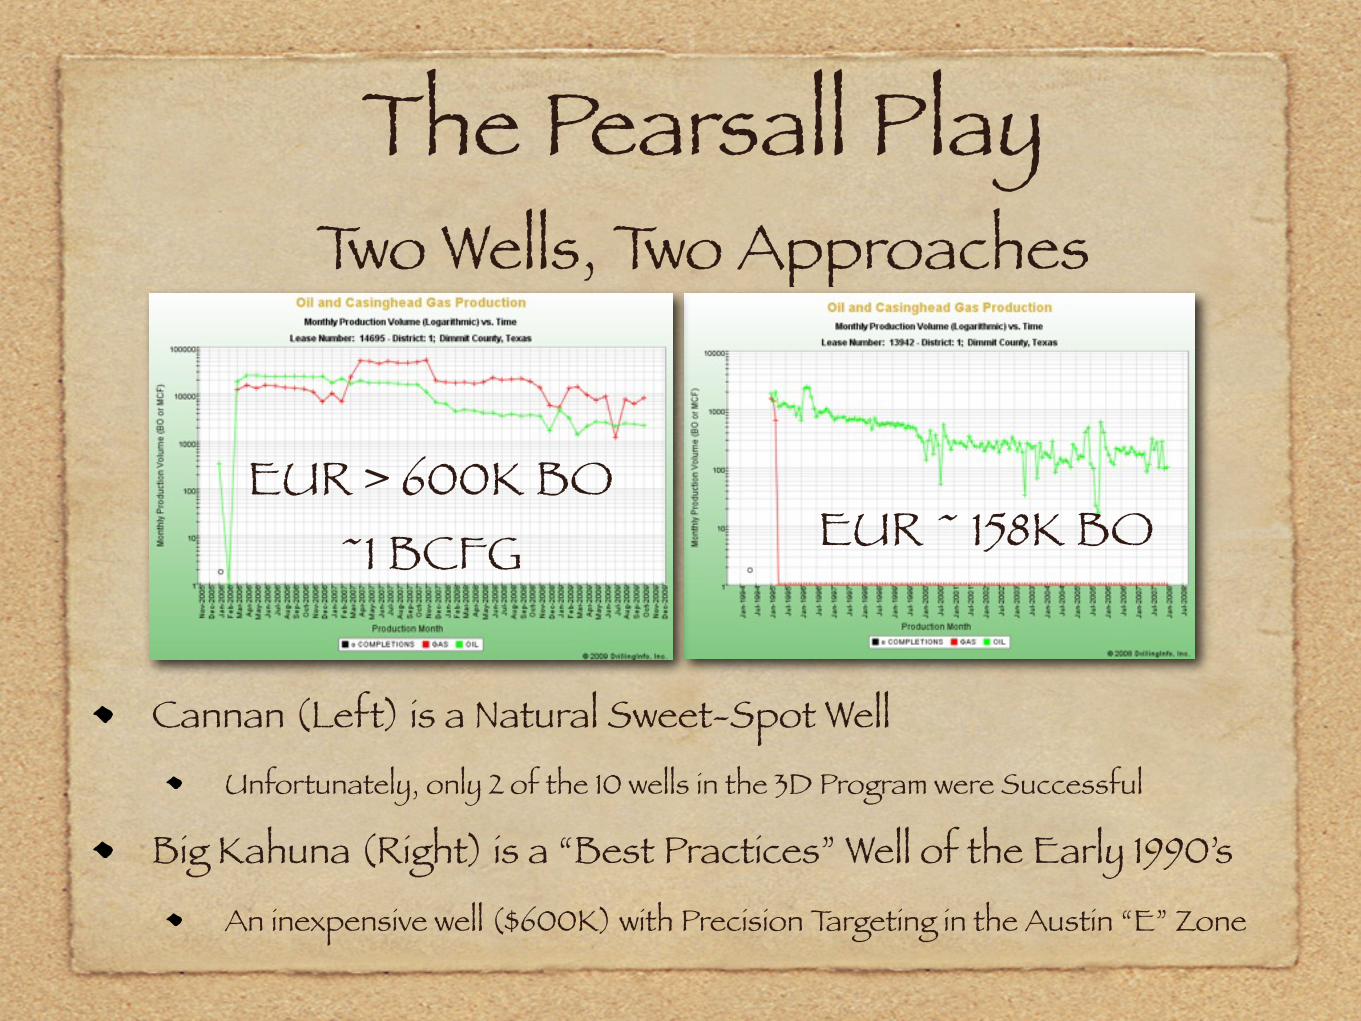
The Pearsall PlayTwo Wells, Two Approaches
Cannan (Left) is a Natural Sweet-Spot Well
Unfortunately, only 2 of the 10 wells in the 3D Program were Successful
Big Kahuna (Right) is a “Best Practices” Well of the Early 1990’s
An inexpensive well ($600K) with Precision Targeting in the Austin “E” Zone
EUR ~ 158K BOEUR > 600K BO
~1 BCFG
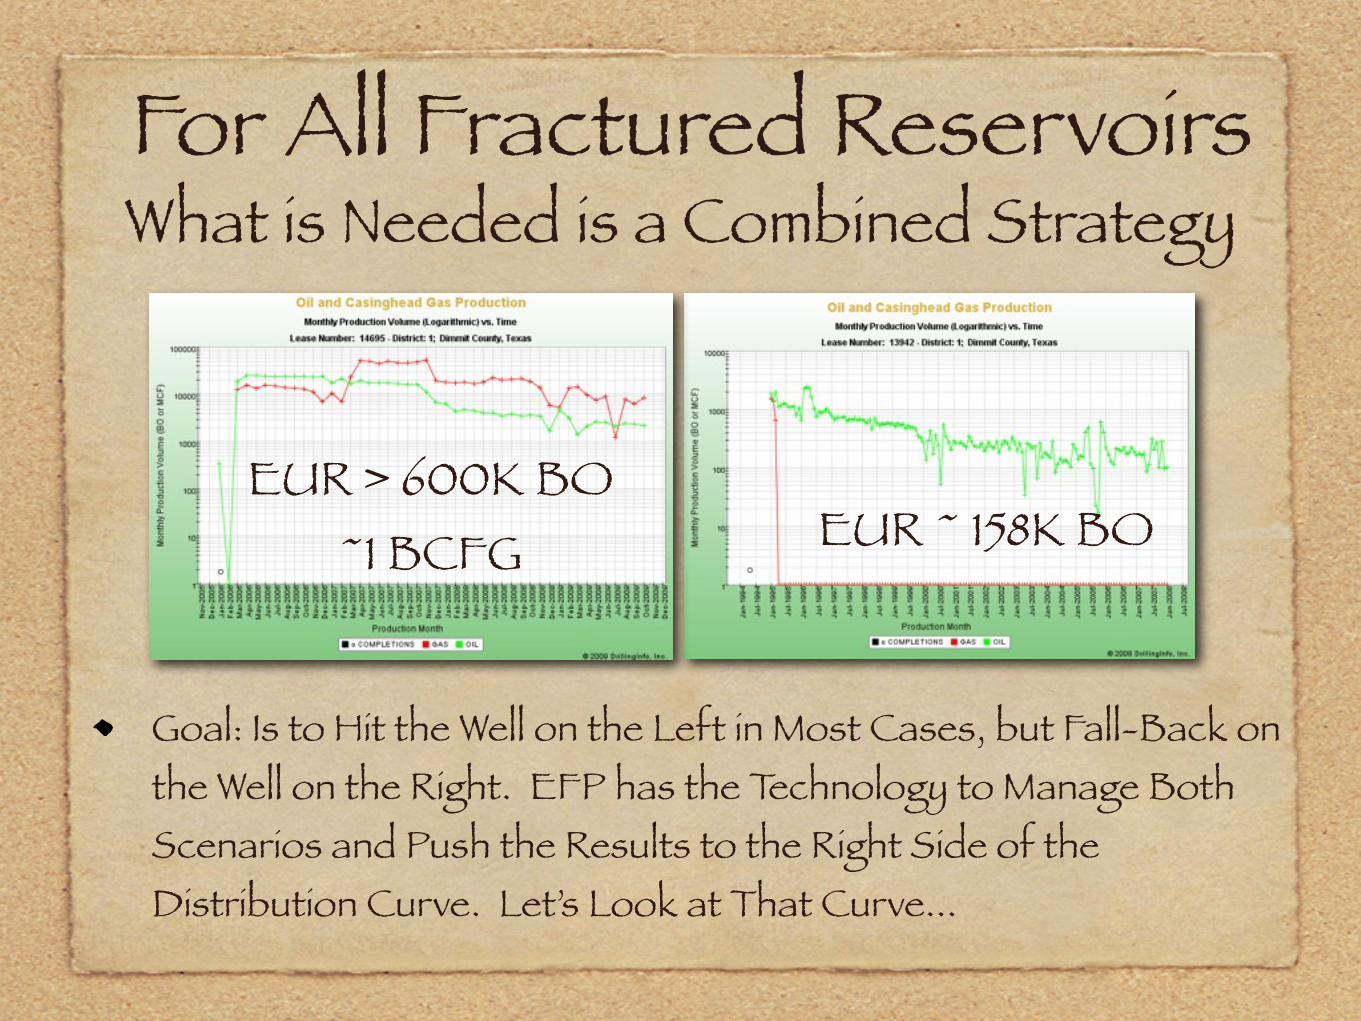
For All Fractured Reservoirs
Goal: Is to Hit the Well on the Left in Most Cases, but Fall-Back on the Well on the Right. EFP has the Technology to Manage Both Scenarios and Push the Results to the Right Side of the Distribution Curve. Let’s Look at That Curve...
EUR ~ 158K BOEUR > 600K BO
~1 BCFG
What is Needed is a Combined Strategy
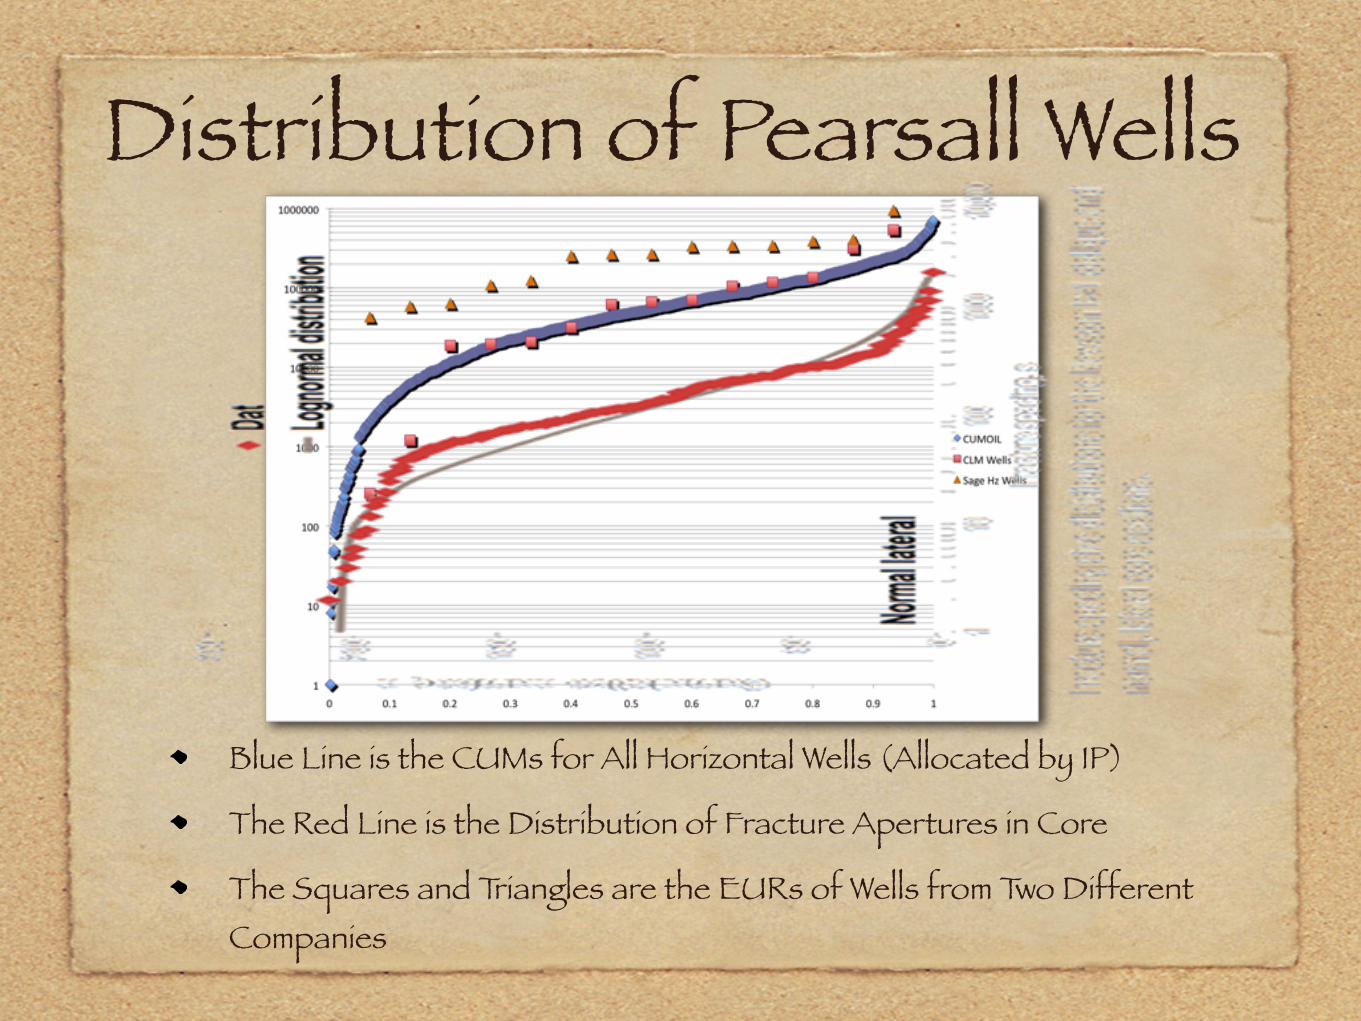
Distribution of Pearsall Wells
Blue Line is the CUMs for All Horizontal Wells (Allocated by IP)
The Red Line is the Distribution of Fracture Apertures in Core
The Squares and Triangles are the EURs of Wells from Two Different Companies
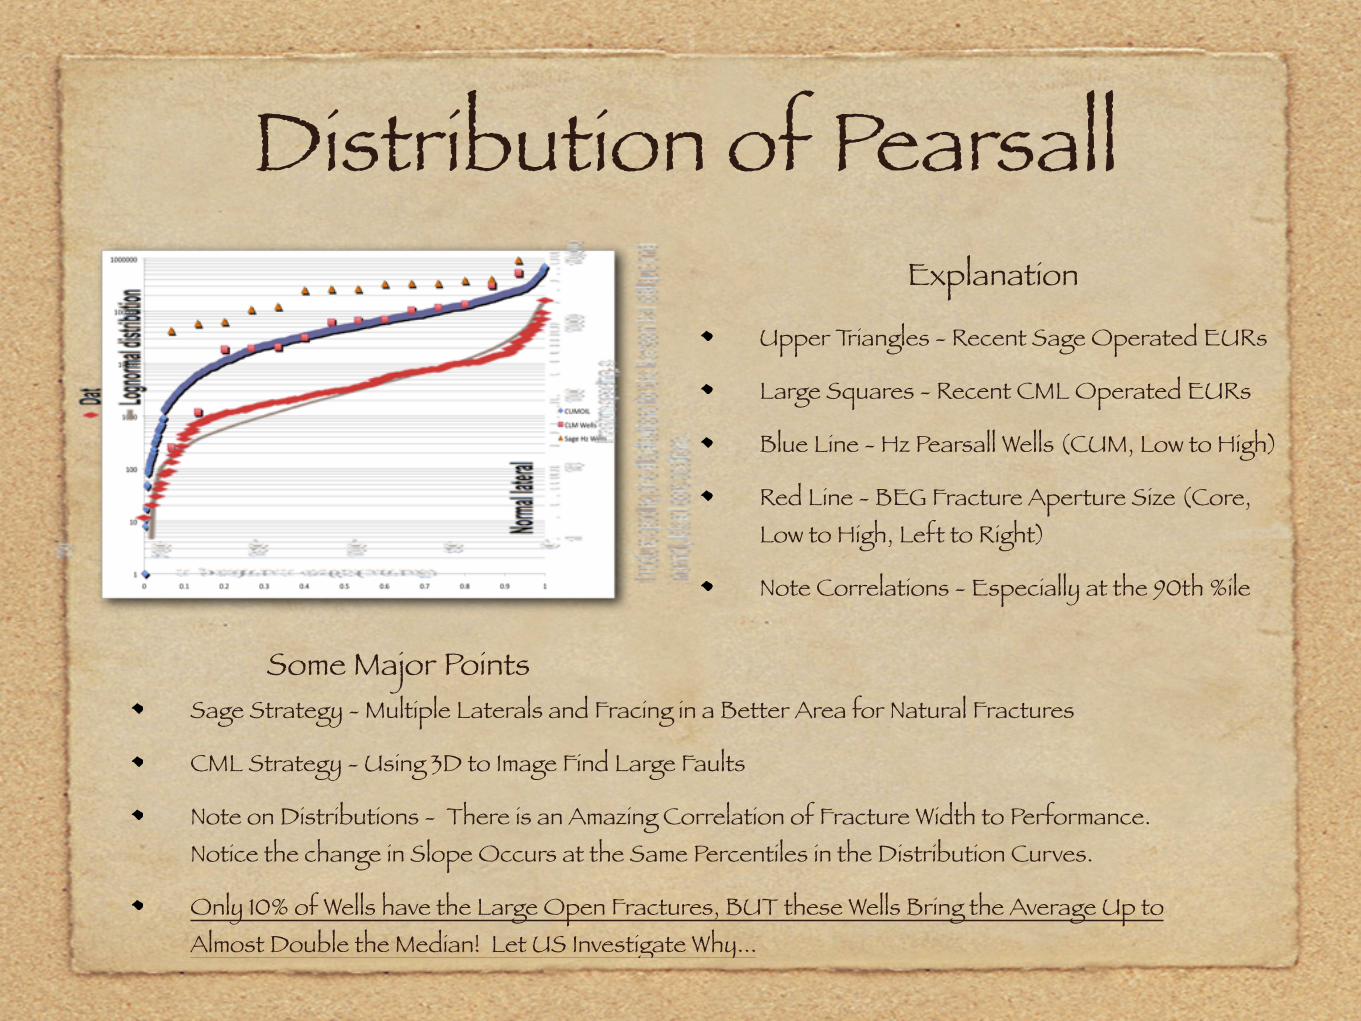
Distribution of Pearsall
Upper Triangles - Recent Sage Operated EURs
Large Squares - Recent CML Operated EURs
Blue Line - Hz Pearsall Wells (CUM, Low to High)
Red Line - BEG Fracture Aperture Size (Core, Low to High, Left to Right)
Note Correlations - Especially at the 90th %ile
Explanation
Some Major PointsSage Strategy - Multiple Laterals and Fracing in a Better Area for Natural Fractures
CML Strategy - Using 3D to Image Find Large Faults
Note on Distributions - There is an Amazing Correlation of Fracture Width to Performance. Notice the change in Slope Occurs at the Same Percentiles in the Distribution Curves.
Only 10% of Wells have the Large Open Fractures, BUT these Wells Bring the Average Up to Almost Double the Median! Let US Investigate Why...
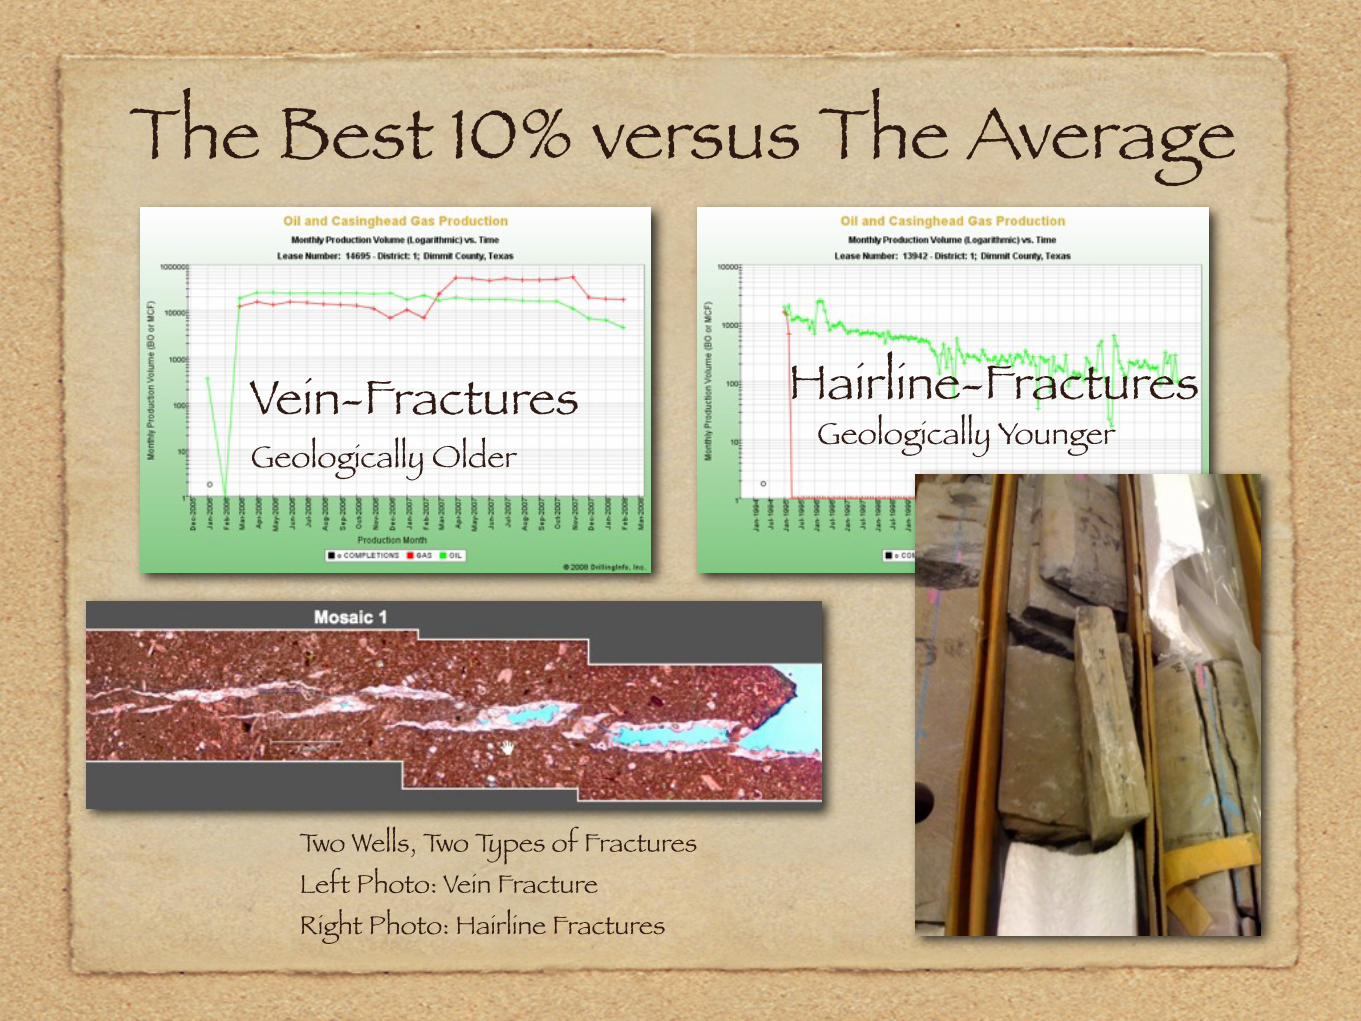
The Best 10% versus The Average
Vein-Fractures Hairline-FracturesGeologically Older
Geologically Younger
Two Wells, Two Types of FracturesLeft Photo: Vein FractureRight Photo: Hairline Fractures
Now, Let’s Explore3D Seismic - Good, but Not “Magic”
Basic Mapping of Fracture Trends and Structures
Geologic and Production Mapping
Use Good Engineering Practices
But...
We Need More!
We Need to Find Perm!Log Petrophysics - Finding Fractures
Good Geo-Navigation (HNAV with EFS)
Surface Mapping
Detail Geology
Surface Minerology
Surface Geomorphometrics
Developing and Applying a Good Model
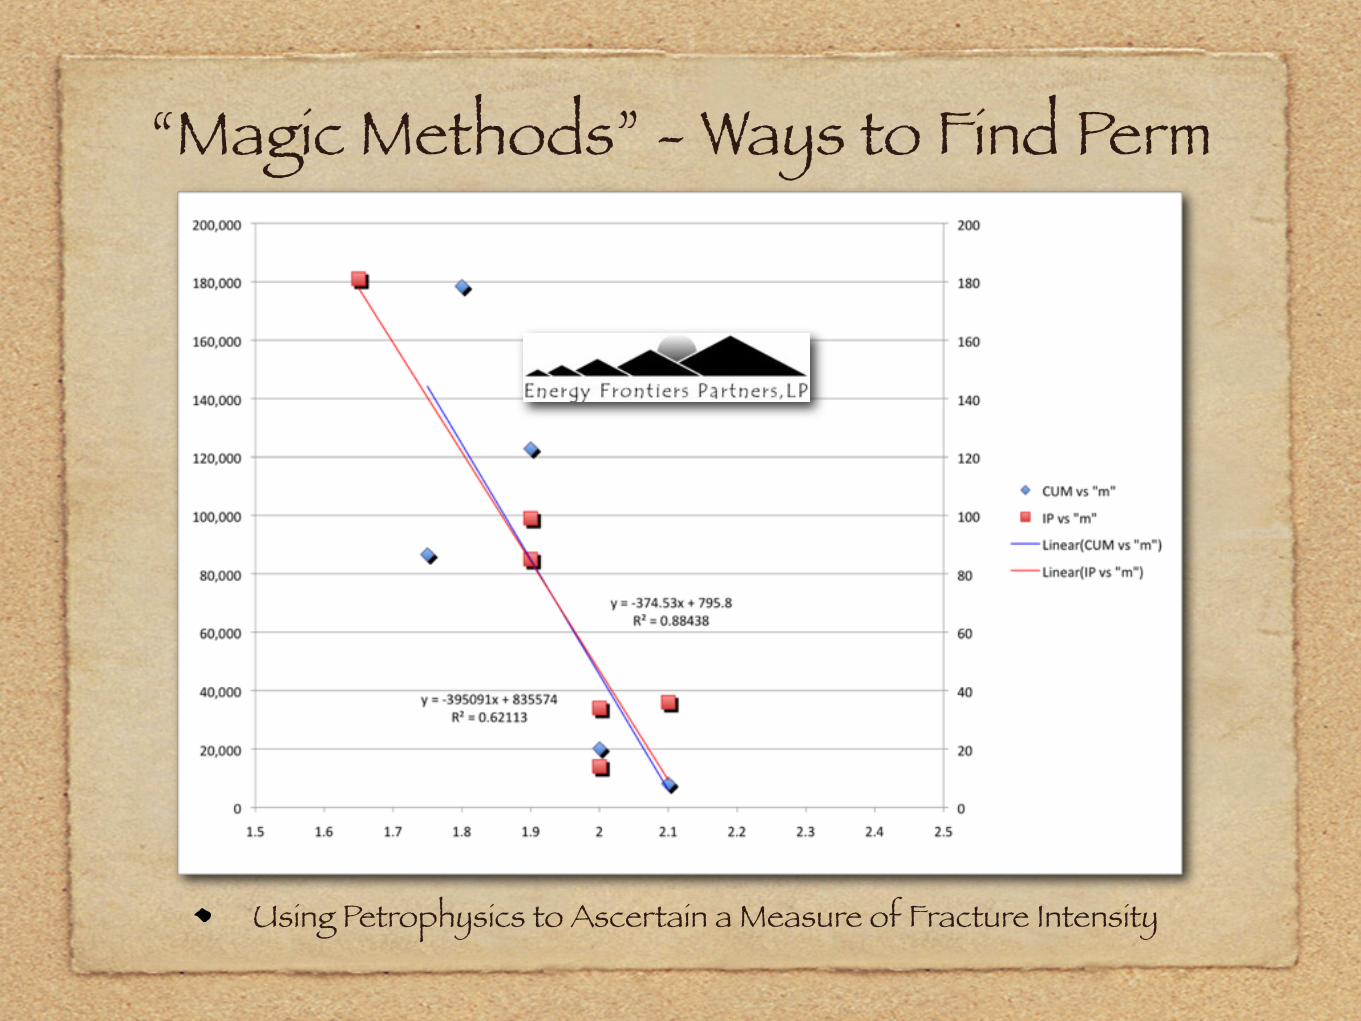
“Magic Methods” - Ways to Find Perm
Using Petrophysics to Ascertain a Measure of Fracture Intensity
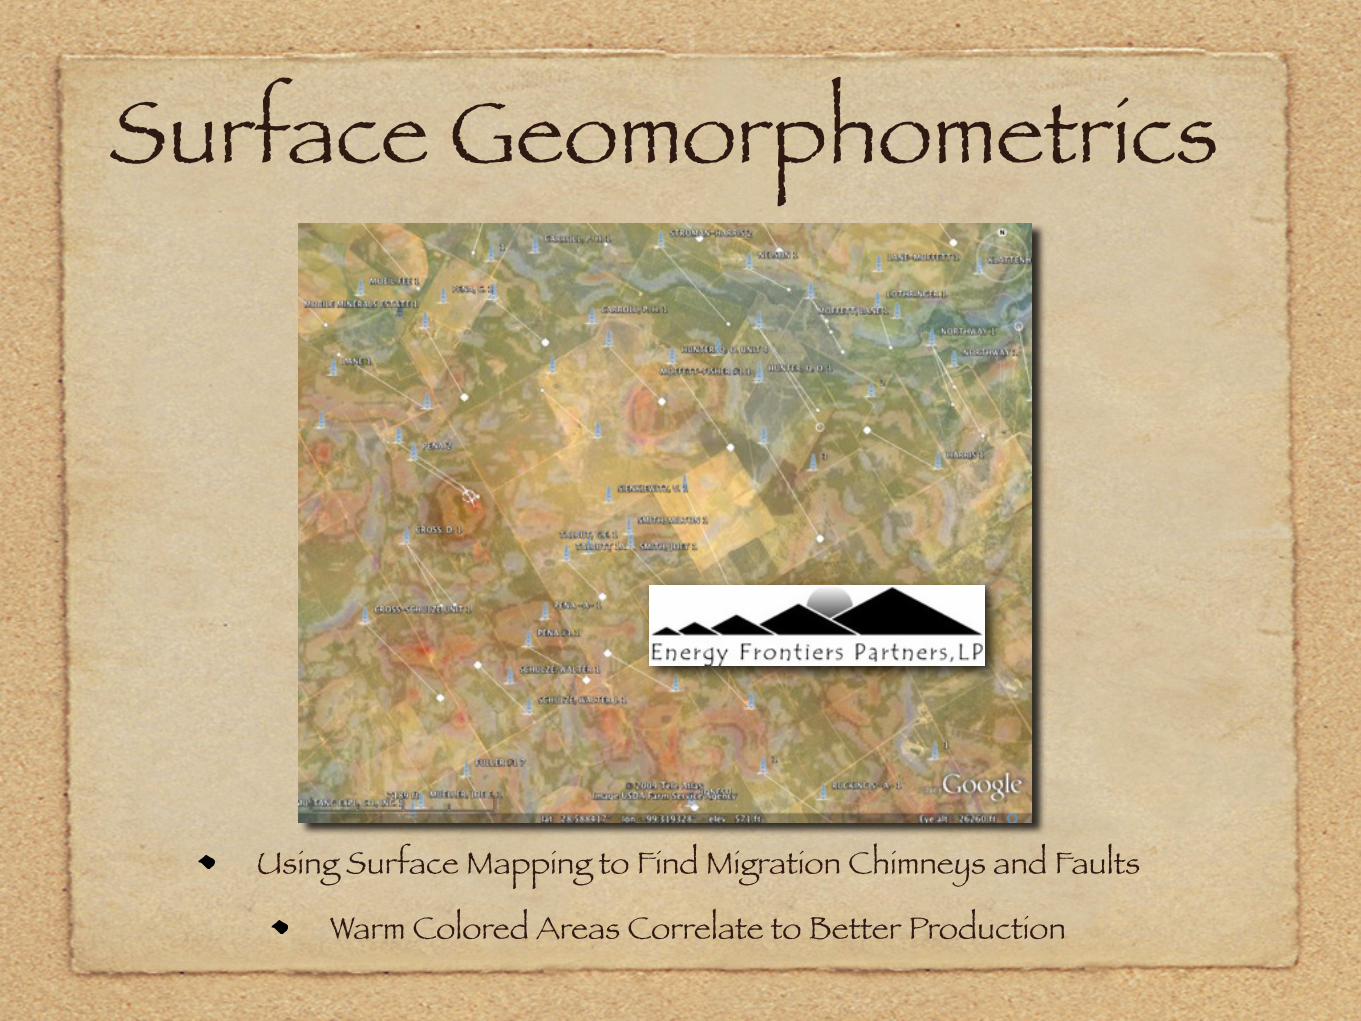
Surface Geomorphometrics
Using Surface Mapping to Find Migration Chimneys and Faults
Warm Colored Areas Correlate to Better Production
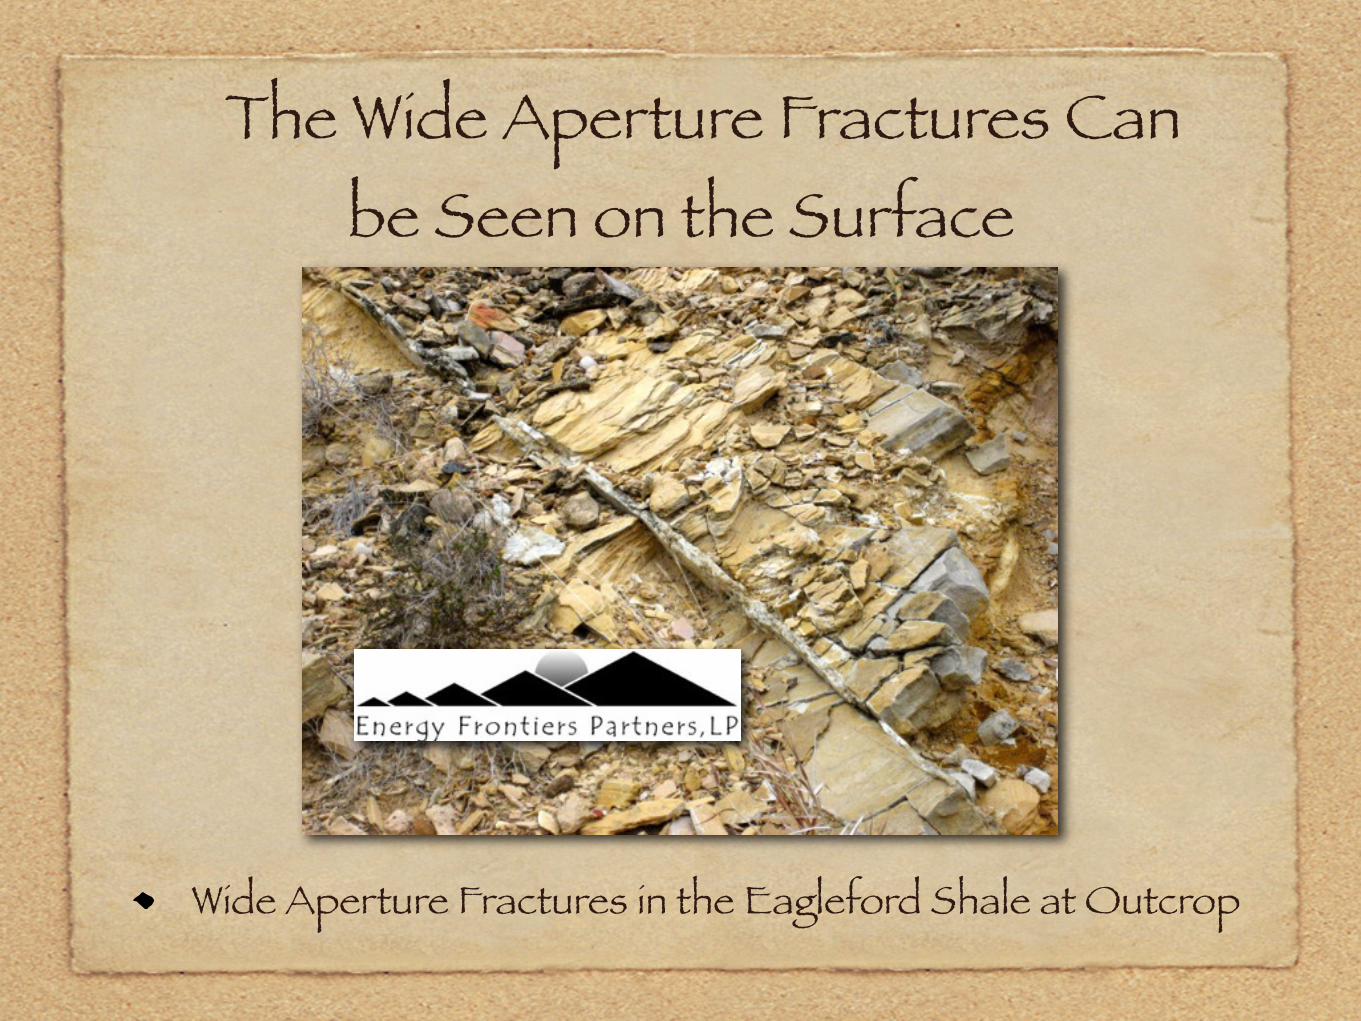
The Wide Aperture Fractures Can be Seen on the Surface
Wide Aperture Fractures in the Eagleford Shale at Outcrop
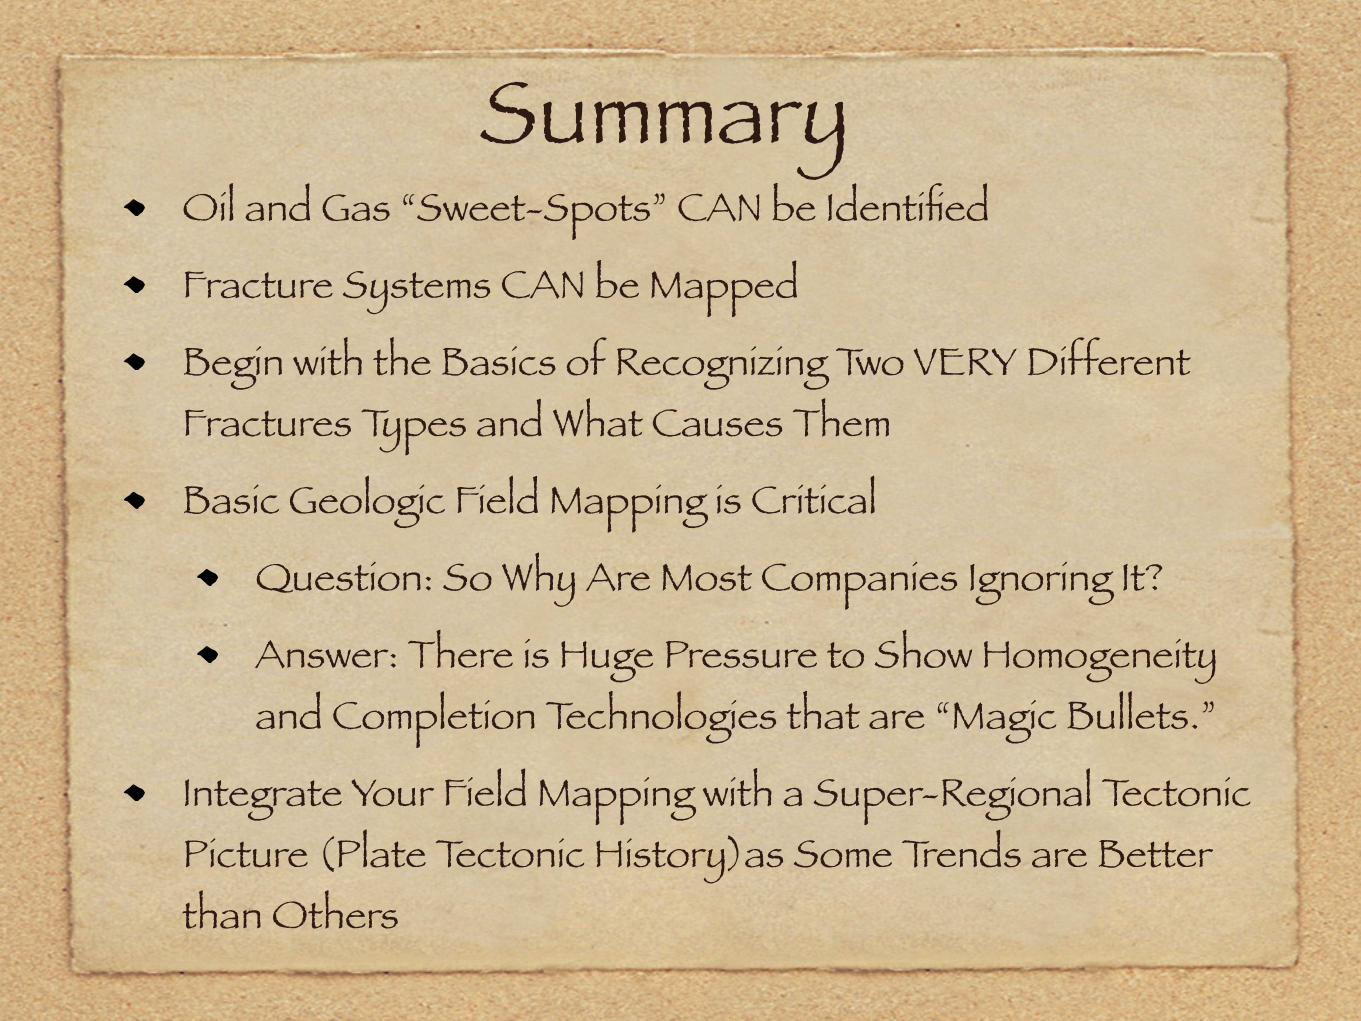
SummaryOil and Gas “Sweet-Spots” CAN be Identified
Fracture Systems CAN be Mapped
Begin with the Basics of Recognizing Two VERY Different Fractures Types and What Causes Them
Basic Geologic Field Mapping is Critical
Question: So Why Are Most Companies Ignoring It?
Answer: There is Huge Pressure to Show Homogeneity and Completion Technologies that are “Magic Bullets.”
Integrate Your Field Mapping with a Super-Regional Tectonic Picture (Plate Tectonic History)as Some Trends are Better than Others