Embed Size (px)
Citation preview

Alain Gallais, Insee (France)
head of PPI division
24th Sep
2014
Difficult choices for activities between market and non market, with co-production
Discussion on health services (division 86)

24th Sep
2014
29th meeting of the Voorburg group, Dublin
Structure of the presentation
1) Weak coverage in “usual” services statistics
2) Between market and non market
3) Logic of producer price indices Input methods
Output methods
4) Quality adjustment issues QALY
Multiple production
Substitution

24th Sep
2014
29th meeting of the Voorburg group, Dublin
1) Weak coverage in European SBS
Officially, (market) health services (division 86 is in section Q) are covered by European SBS...
But some activities are only matters of pilot studies:

24th Sep
2014
29th meeting of the Voorburg group, Dublin
1) Weak coverage in European STS
Officially, (business) health services are covered by European STS...
But some activities are only matters of pilot studies:
Still not in SPPI or ISP for STS package 2017

24th Sep
2014
29th meeting of the Voorburg group, Dublin
1) Weak coverage of SPPI by VG countries

24th Sep
2014
29th meeting of the Voorburg group, Dublin
1) Weak coverage of SPPI by VG countries (2)

24th Sep
2014
29th meeting of the Voorburg group, Dublin
1) Weak coverage of SPPI by VG countries (3)
8690)

24th Sep
2014
29th meeting of the Voorburg group, Dublin
1) Some partial exceptions: Sweden, Finland, UK Restricted to market: is it a problem?
Finland: SBS include division 86 (enterprises account for 16%). STS turnover not precised. SPPI partly (86.22, 86.90).
UK: SBS do not include division 86 (market sector represents 23%?), but STS turnover will do at the end of this year.
Sweden: SBS and STS turnover do (private sector accounts for 19%, but include NPISH), not do SPPI.
US: 5-year economic census, annual and quarterly turnover at 4-digit, SPPI on numerous activities/products.
France: nothing from SBS or STS on market health activities.
Yes, a systematic distinction between market and non-market activities (1 digit more than products) would be useful in NACE.
Yes, full coverage of market sector by SBS and STS would be useful for NA, and for other market activities (e.g. taxis and ambulances), in order to control the exhaustiveness.
24th Sep
2014
29th meeting of the Voorburg group, Dublin
2) Between market and non-market activities
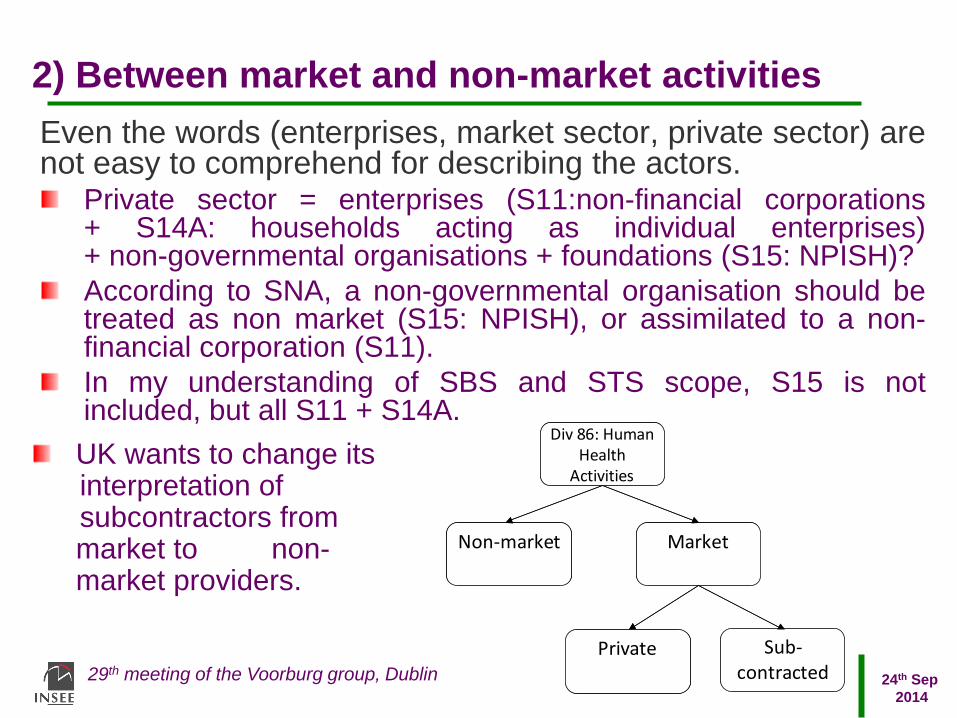
Even the words (enterprises, market sector, private sector) are not easy to comprehend for describing the actors.
Private sector = enterprises (S11:non-financial corporations + S14A: households acting as individual enterprises) + non-governmental organisations + foundations (S15: NPISH)?
According to SNA, a non-governmental organisation should be treated as non market (S15: NPISH), or assimilated to a non-financial corporation (S11).
In my understanding of SBS and STS scope, S15 is not included, but all S11 + S14A.
Div 86: Human Health
Activities
Non-market Market
Private Sub-contracted
Div 86: Human Health
Activities
Non-market Market
Private Sub-contracted
UK wants to change its interpretation of subcontractors from market to non-market providers.

24th Sep
2014
29th meeting of the Voorburg group, Dublin
2) This delicate case of subcontractors
To be or not to be “market”? = Are prices “economically significant”?
It should rely on majority part of “sales” or of “transfers”. SNA 22.33: The question arises whether units supplying goods and services to government should be treated as market or non market producers. The essential question is whether the unit provides the goods and services in competition with private producers and the choice of supplier is based on price. This is true whether the supplier is the only supplier and whether the government is the only customer of the supplier.
SNA 22.34: In order to assess whether a producer is a market producer, it is necessary to carry out a comparison between the receipts from sales and the production costs of the products. Sales are measured before any taxes applicable to the products are added. Sales exclude all payments received from government unless they would be granted to any producer undertaking the same activity. […].
Kat Pegler: These healthcare services, which are provided in market settings but are non‐market funded, are increasing in the UK and particularly following changes in legislation with the introduction of the Health and Social Care Act (2012).
Why do you want to change their market status?

24th Sep
2014
29th meeting of the Voorburg group, Dublin
2) If they are market…
They should be deflated by SPPI (extended to market 86). CPI (out of the pocket?) is not convenient, and GGFCE price index perhaps not more.
If they are non market… Their production should no longer be recorded as IC (no sales => no IC of an intermediate purchaser), but aggregated with own costs of NHS, with counterpart in personal Final Consumption. GGFCE would then be convenient for deflation.
Quasi prices Quasi prices are economically significant prices, which allow “true” deflation in order to obtain “true” quantities. It should be considered as a statistical progress to assimilate quasi market with market (recognition as enterprises), quasi prices with prices, and to extend the usual statistics consequently.

24th Sep
2014
29th meeting of the Voorburg group, Dublin
2) Other questions addressed to UK
These paragraphs are not very clear, as we could imagine a more direct technique than reflation then deflation:
4.2.2 Market activity
Currently in the UK, workforce jobs are used as a measure of market output for human health activities. A current price series is derived from this data by reflation using the Consumer Price Index (CPI) for health services. This current price data is then deflated, also using the CPI for health services, to give a figure for output.
4.2.3 Subcontracted health care services
The turnover of these companies in the provision of these services is derived using the Government health services non‐market output index mentioned above which is reflated into a current price series using the CPI for health services. This series is then deflated, again using the CPI to give a measure of output in constant prices.
Why not a direct extrapolation in “constant prices” with the respective direct volume indices (workforce, Government health services)?

24th Sep
2014
29th meeting of the Voorburg group, Dublin
3) Volume of non-market activities in SNA 2008
15.116 The current value of the output of non-market goods and services produced by government units or NPISHs is estimated on the basis of the sum of costs incurred in their production, as explained in chapter 6. […] The change in the volume of output can be different from the change in the volume of inputs. Changes in productivity may occur […].
15.117 In practice, there are three possible methods of compiling volume estimates of the output of non-market goods and services. The first is to derive a pseudo output price index such that when it is compared to the aggregate input price index the difference reflects the productivity growth thought to be occurring in the production process. […]
15.118 The second approach, the “output volume method,” is recommended for individual services, in particular, health and education. It is based on the calculation of a volume indicator of output using adequately weighted measures of output of the various categories of non-market goods and services produced. These measures of output should fully reflect changes in both quantity and quality.
15.119 […] The “input method” consists of measuring changes in output by changes in the weighted sum of volume measures of all the inputs. The latter should fully reflect both changes in quantity and quality. […]

24th Sep
2014
29th meeting of the Voorburg group, Dublin
3) Output-based methods are more economically significant than input methods
They can be described by fine products.
The redaction of SNA suggests direct quantities indicators, but it can be solved by outputs in current prices divided by “output price indices” (both for time-series and for spatial comparisons).
If the “output price index” is strictly equal to the weighted sum of the “inputs cost indices”, the output method is formally more satisfying than the input method, but it would lead to the same results (think to a table combining kinds of costs in row – compensation of employees by skill level, IC, CFC and overhead - and kinds of products – kinds of producer x kinds of diseases x kinds of treatments in column).
What OECD calls “negociated quasi-prices” are more “prices” than the other “quasi-prices”. I understand they look like the US SPPI. It is justified to quality adjust on producer cost, as here the producers are price-makers.

24th Sep
2014
29th meeting of the Voorburg group, Dublin
3) Some questions addressed to OECD, the US and Finland
OECD: Have you compared the results of the input method with this of the output method? Where are the differences? Why? Which one is more reliable?
A reason for differences: the same treatment could require more skilled persons and more sophisticated equipment in one country than in another one. Quality?
You suggest opportunity for hospital services and health… What is your feedback on the countries that participated to your program? Market? Non market?
US: Where do you not collect SPPI? Why could you not collect SPPI? Or join these PCE price indices to yours?
US and Finland: Rebates for large customers and special prices for Medicare and Medicaid. What about price discrimination? If there is a shift between a system and another?
24th Sep
2014
29th meeting of the Voorburg group, Dublin
3) Fortunately, Eurostat then OECD achieved handbooks !
18.26 Price indices for services are more difficult to compile than for goods and this is especially so for non-market services. Because the current values of non-market services are usually determined as the sum of costs, the obvious approach is to deflate each of these (including calculating compensation of employees at constant compensation rates). However, this does not allow for any change in the quality of services provided and in particular for the impact of any productivity changes that may have been achieved. In some cases, direct volume measures should be considered as described in the Handbook on price and volume measures in national accounts or the handbook Towards measuring the volume of health and education and services (Organisation for Economic Co-operation and Development, 2009). Research work is actively in progress to derive volume estimates of output that take account of changes in the quality as well as the quantity of the services provided.

24th Sep
2014
29th meeting of the Voorburg group, Dublin
3) Methods recommended by OECD manual
24th Sep
2014
29th meeting of the Voorburg group, Dublin
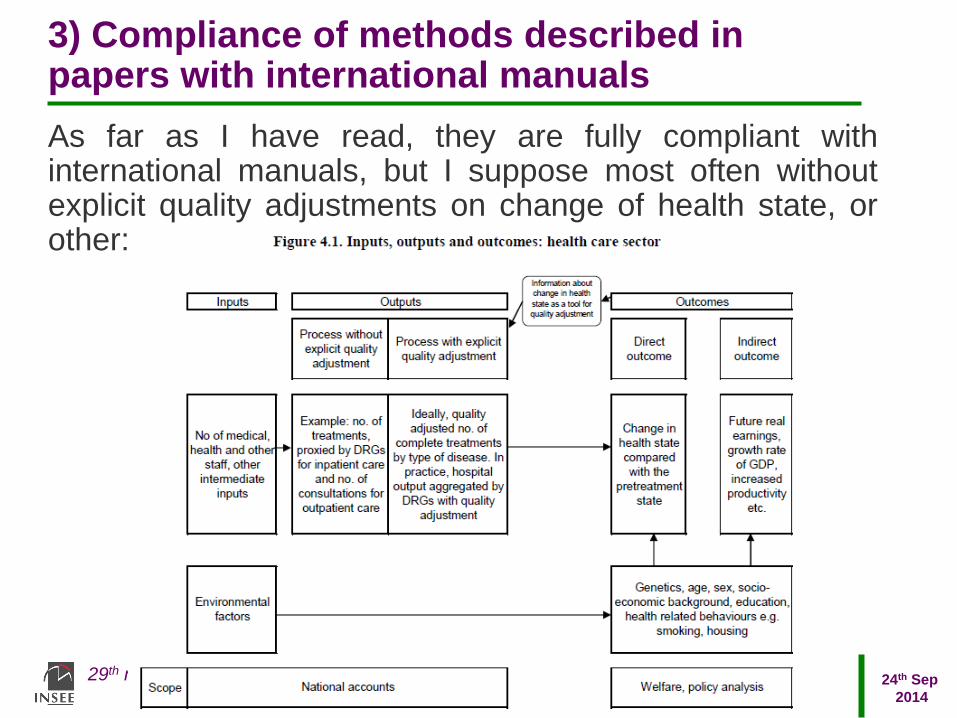
3) Compliance of methods described in papers with international manuals
As far as I have read, they are fully compliant with international manuals, but I suppose most often without explicit quality adjustments on change of health state, or other:

24th Sep
2014
29th meeting of the Voorburg group, Dublin
4) OECD manual concludes negatively on the possibility of (output) quality adjustment
4.76. To sum up, methods for quality adjustment of output are still under development. Some headway towards capturing quality can be made by using detailed product specifications and follow the associated costs and treatments over time. The importance of explicit quality adjustment is undeniable but until there is a consensus on techniques for adjustment, it will be difficult to put forward a recommendation for an explicit quality adjustment of health volume output in the national accounts. A similar conclusion has been reached by the United States Bureau of Economic Analysis (BEA) who note that the “BEA will not attempt to account for potential changes in the quality of treatments, a problem where no clear consensus exists on a solution” (Aizcorbe et al, 2008, p. 25).
24th Sep
2014
29th meeting of the Voorburg group, Dublin
4) Some methods could exist…
4.74. Since quality is multidimensional, it would be ideal to subsume several characteristics of quality into a single indicator that reflects the contribution of the product to outcome. Alternative means have been suggested to derive a single indicator. The first is to choose the most important dimension only, e.g. 30 day survival rate21. The second is to use indicators from more than one quality dimension and weigh them as equally important. Third, indicators from a number of quality dimensions can be used but expert opinion should be sought on the appropriate weights (ONS, 2008). Finally, measures such as quality-adjusted life years (QALYs - see Annex) can be used that reduce modifications in health outcomes due to medical care to one dimension, the quality-adjusted gain in time. However, many of these empirical methods are still in a research stage.
24th Sep
2014
29th meeting of the Voorburg group, Dublin
4) Quality Adjusted Life Years expectancy
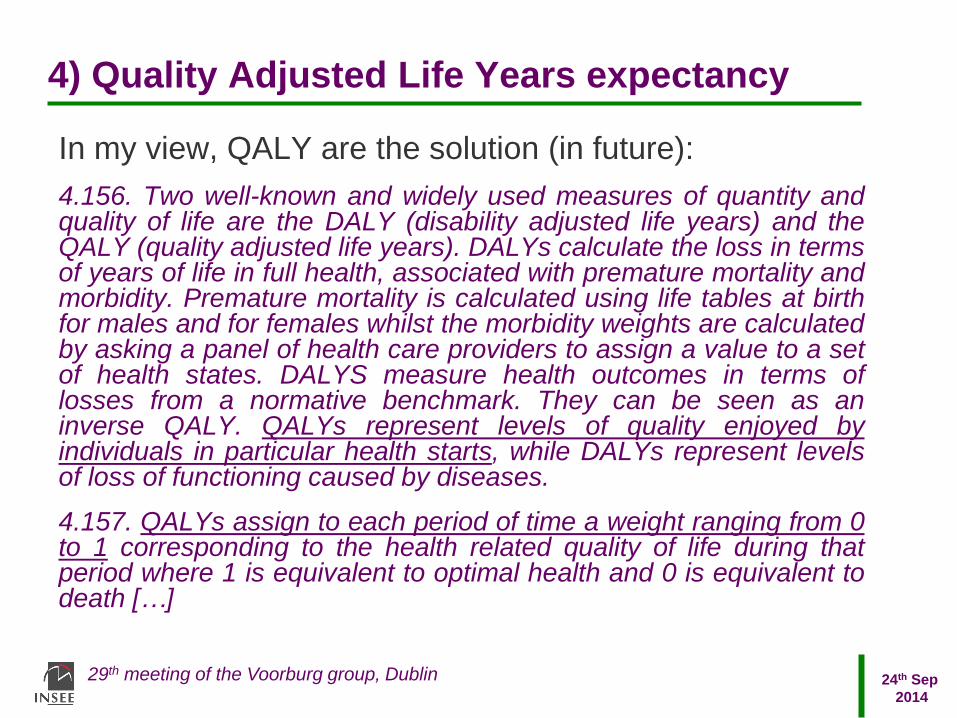
In my view, QALY are the solution (in future):
4.156. Two well-known and widely used measures of quantity and quality of life are the DALY (disability adjusted life years) and the QALY (quality adjusted life years). DALYs calculate the loss in terms of years of life in full health, associated with premature mortality and morbidity. Premature mortality is calculated using life tables at birth for males and for females whilst the morbidity weights are calculated by asking a panel of health care providers to assign a value to a set of health states. DALYS measure health outcomes in terms of losses from a normative benchmark. They can be seen as an inverse QALY. QALYs represent levels of quality enjoyed by individuals in particular health starts, while DALYs represent levels of loss of functioning caused by diseases.
4.157. QALYs assign to each period of time a weight ranging from 0 to 1 corresponding to the health related quality of life during that period where 1 is equivalent to optimal health and 0 is equivalent to death […]
24th Sep
2014
29th meeting of the Voorburg group, Dublin
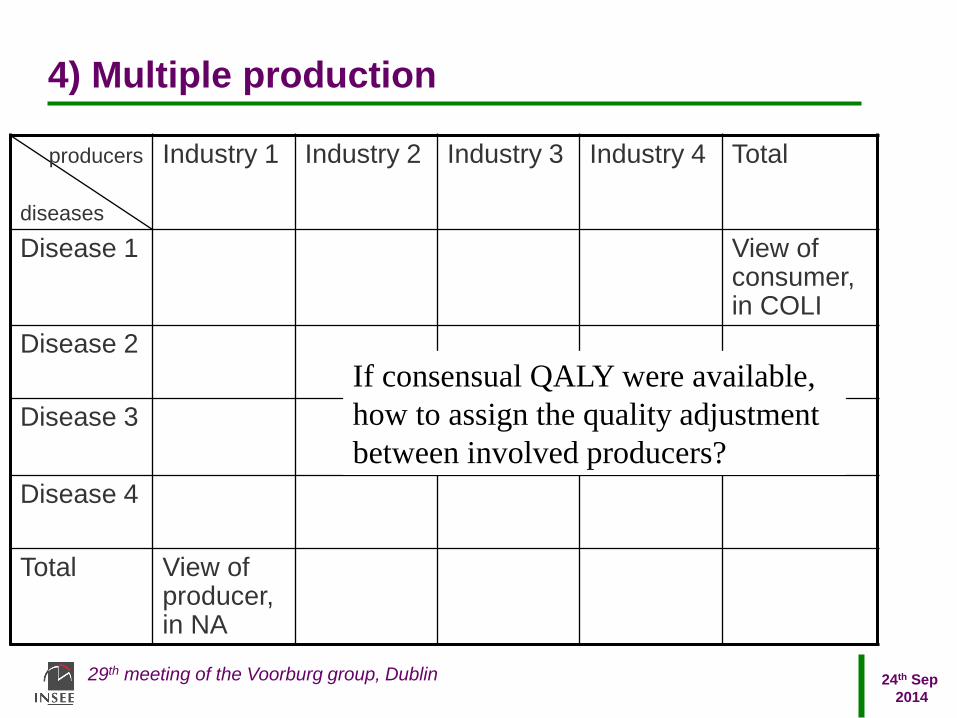
4) Multiple production
producers
diseases
Industry 1 Industry 2 Industry 3 Industry 4 Total
Disease 1 View of consumer, in COLI
Disease 2
Disease 3
Disease 4
Total View of producer, in NA
If consensual QALY were available,
how to assign the quality adjustment
between involved producers?
24th Sep
2014
29th meeting of the Voorburg group, Dublin
4) Substitution
Shift of surgeries from inpatient to outpatient environments should be seen as a progress.
A consequence of this substitution is that both the severity of illness and the complexities of surgery for the average patient increase in both environments.
Because BLS treated the two environments as different industries / products, the statistical description happened in the other sense than desired.
Since 1998, BLS has joined inpatients and outpatients in the same stratum, and can apply explicit QA in order to describe productivity.
But between hospital services and drugs?

24th Sep
2014
29th meeting of the Voorburg group, Dublin
4) Medical care price index by episode of illness
According to National Research Council, “At what price?” (2001), BLS has been moving toward the pricing of an episode of illness (ICD, then DRG), rather than pricing medical inputs.
From month to month, usual SPPI or price indices can be used, but every year the absolute levels of prices should be updated, with expected large jumps.
“One point on which the panel is clear is that the Medical Care Price Index should not be linkedin the usual way when the treatment episodesof diagnoses are repriced. That is, the index that results from the repricing of the 15 to 40 diagnoses should be linked to its previous values in levels, not in changes.”
A method close to usual techniques in PPP (update of price levels every 3 years).
US: are you repricing the levels of prices every year?
24th Sep
2014
29th meeting of the Voorburg group, Dublin
4) To learn more about the concepts
- Jack Triplett, 1999: Measuring the prices of medical treatments;
- Jack Triplett, 2001: Measuring health output: the draft Eurostat handbook on price and volume measures in National Accounts;
- Jack Triplett, 2002: Integrating cost-of-disease studies into Purchasing Power Parities;
- National Research Council (US), 2001: At what price?
- National Research Council (US), 2004: Beyond the market

Thank you for your attention
Contact
M. Alain Gallais
Tél. : (+ 33) 01 41 17 58 55
Courriel : [email protected]
Insee
18 bd Adolphe-Pinard
75675 Paris Cedex 14
www.insee.fr
Informations statistiques :
www.insee.fr / Contacter l’Insee
09 72 72 4000
(coût d’un appel local)
du lundi au vendredi de 9h00 à 17h00
Discussion on health services (division 86)