Embed Size (px)
Citation preview
International Conference on Renewable Energies and Power Quality (ICREPQ’18) Salamanca (Spain), 21th to 23th March, 2018
exÇxãtuÄx XÇxÜzç tÇw cÉãxÜ dâtÄ|àç ]ÉâÜÇtÄ (RE&PQJ) ISSN 2172-038 X, No.16 April 2018
Discussion on Reliability and Power Quality in the Smart Grid: a prosumer approach of a time scalable index
Olivia Florencias-Oliveros, Juan-José González-de-la-Rosa, Agustín Agüera-Pérez,
José-Carlos Palomares-Salas
Research Group PAIDI-TIC-168, Computational Instrumentation and Industrial Electronics (ICEI) Department of Automation Engineering, Electronics, Architecture and Computer Networks
Engineering School of Algeciras, University of Cadiz – Ramón Puyol Av. S/N, E11202 (Spain) Phone/Fax number: +0034 956028069, e-mail: [email protected], [email protected], [email protected],
[email protected] Abstract. This article presents a discussion related to the measurement techniques of the electric energy quality within the smart grid (SG) context, and considering the producer-consumer (prosumer) approach. It establishes the basis where new power quality (PQ) indexes should be proposed, in order to complement the current recommendations regarding consumer dissatisfaction indexes (CDI) on which the network should be assessed and planned. Indeed, the current indices only consider the number of interruptions and the time during which they occur, and do not take into account neither the type nor the non-linear loads (distributed energy resources, DER) connected to the SG, which are giving rise to new kinds of transients coupled to the electrical power supply signal. In this sense, the paper provides reasons on why temporal evolution of energy and its deviation from the contractual specifications should be monitored and assessed, with the goal of making real-time decisions. Based on advanced statistical signal processing, forecasting methods and artificial intelligence, this focus conveys the conclusive need for a dual measurement index of PQ reliability, on the basis of dynamic temporal scalability, and time-space compressions. A practical example is outlined.
Key words Energy dynamics; reliability indices; power quality; prosumer satisfaction; smart grid; temporal scalability; time compression; space compression. 1. Introduction Traditionally, energy assessment in the electrical network has been performed from a systemic optics, by means of reliability indices which stem from the perspective of the suppliers and the distribution companies; e.g. guidelines for collecting, categorizing and reporting data related to electric power interruptions, IEEE Std. 1782-2014, are described mainly considering the industry need for benchmarking and comparing electric power distribution reliability practices [1]. Despite the fact that this document considers the impact on all the stakeholders (end-use electricity customers, utility companies and governmental entities), the guide is mainly intended for ensuring fair and
accurate trending and benchmarking comparisons and does not account for the customer focus at all, where the real concern is on the probability that a preset threshold of supply security is not fulfilled. Furthermore, in this scenario, current measurement instruments are being designed in order to estimate the duration and the frequency of the outages, the system availability and the time response under different influences, like weather phenomena, wildlife, overloading, etc.; not having evolved so much towards the producer-consumer (prosumer) approach, for which PQ should be focused on the SG context. It follows that intelligent instrumentation techniques would play a crucial role to perform this quality change in order to assess the duality reliability-PQ. Additionally, outage management systems are including some key components, such as connectivity models from the customer to the supply, with a link between the different agents: transformers, devices and customers. Automated outage reporting devices for billing applications are demanded as well, e.g. SCADA systems with substation automation and distribution devices and automatic meter reading reporting [2]. In fact, a plethora of different categories of interrupting devices are entering the new scenario of the SG: circuit breakers, substation and line reclosing, sectioned wires, distributed energy resources (DER) and finally customer’s interruption devices (like switches). In that sense, as named above, outage event reporting is needed even more; also with the important goal of gathering big data structures associated with the energy that the customer receives (power supply) [1]. Provided with that support, customers would claim their fuzzy bills and, at the same time adopt measures to protect sensible equipment from these new classes of disturbances, e.g. controlled via mobile terminal.
https://doi.org/10.24084/repqj16.228 108 RE&PQJ, Vol.1, No.16, April 2018
Among the international recommendations that accomplish reliability, the main regulation attempt is found in the IEEE working group, that has settled down a guide for electric distribution reliability indices, IEEE 1366 Std. (2012) [2], which contains a list of parameters and definitions for suppliers, Transmission System Operators (TSO), and Distribution System Operators (DSO). In this basis, the Energy Management System (EMS) informs, via benchmarking reports, regarding the continuity of the supply to regulatory agencies, stakeholders and also for educational purposes; e.g. a reliability benchmarking in North America (Canada and USA) is performed every year. In Europe, benchmarking is accomplished by the Council of European Electricity Regulators (CEER), in close collaboration with the Energy Council Regulatory Board (ECRB). Recently, on CIRED 2015, researchers have compared the power-system reliability between North America and Europe, in an attempt to unify the presentation of the parameters in the EMS [3]. In addition, the CIGRE/CIRED C4.07 recommends the use of the IEEE indices in distribution systems. Additionally, with less relevance but at the same time important, recent meetings have discussed some pros and cons to be considered using the IEEE 1366 Std. and some metrics proposed to perform this assessment. Indeed, not all the indices are used by the distribution companies; fact which means that facilities do not store the whole registers of interruptions so far. Nevertheless, real valuable information is found beyond raw data; for example it is known that the underground networks present better reliability indices values [2]. However, exploring for instance the methods to measure Major Event Days (MED) is not the scope of this work, and more information could be found in other works, like the one in [4]; this paper only suggests that the simple idea of further exploration of the actual indices would implement the new knowledge extracted from the SG monitoring and point the direction towards which new indexes should be proposed considering the duality of PQ and reliability and, at the same time, making use of the paradigms of time and space compressions. The paper is structured as follows. After this introduction, Section 2 connects the concepts of reliability and PQ by using the temporal scalability; Section 3 summarizes and discusses the most common prosumer satisfaction indexes in the SG; Section 4 explores the monitoring challenges; and finally conclusions are drawn in Section 5. 2. Reliability and PQ The need for relating PQ and reliability is motivated through the Table 1, which summarizes each Interruption Duration Index (IDI) and the absence of information related to PQ. A first set helps ensure a robust database regarding the network and the clients connected to. This is the case of the System Average (SAIDI), Customer Average (CAIDI) or System Average (SAIFI) and Average Service Availability Index (ASAI) that are the most common reliability indices found on the literature. Others, like the MED and the Catastrophic Days (CD), have been introduced by a more specific working group in
reliability; both gathering the statistical behaviour, and trying at the same time to reduce the year-to-year data variability.
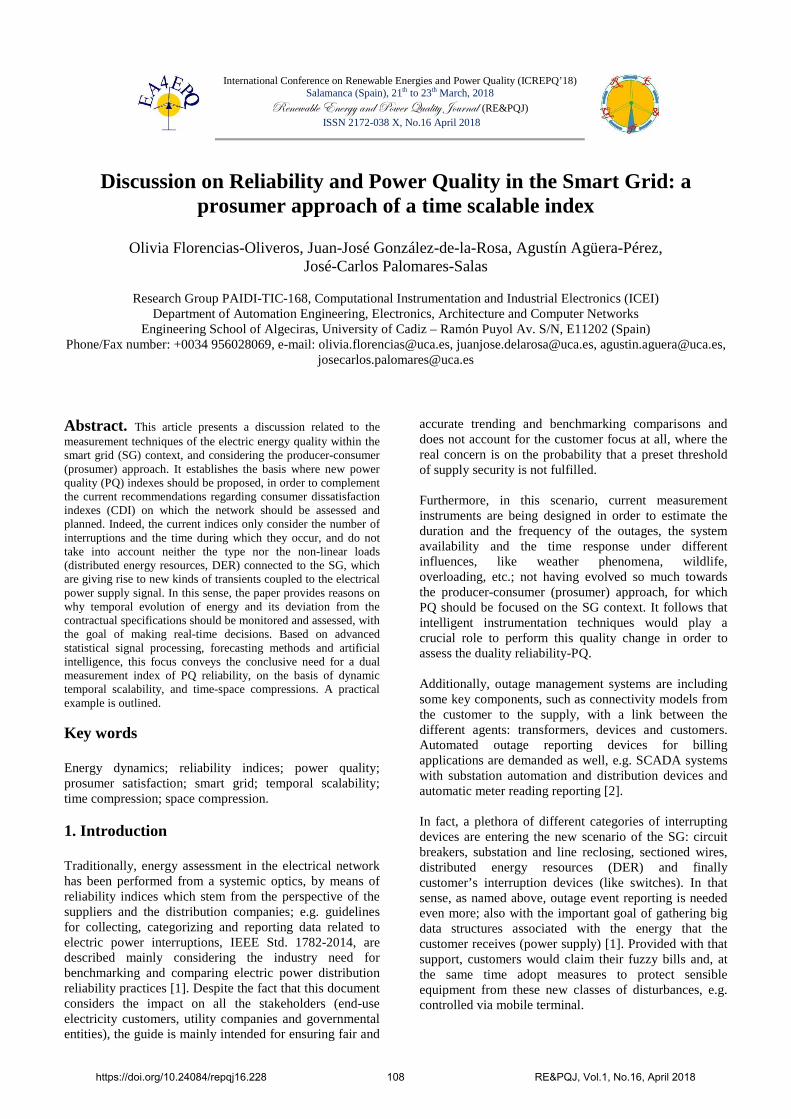
Table I. Reliability indices according to the IEEE Std. 1366. Index Equation
Sustained interruption indices System Average Interruption Index (SAIFI)
TT
i
N
CI
N
NSAIFI =∑=
System Average Interruption Duration Index (SAIDI)
TT
ii
N
CMI
N
NrSAIDI =∑=
Customer Average Interruption Duration Index (CAIDI)
SAIFI
SAIDI
N
NrCAIDI
i
ii =∑
∑=
Customer Total Average Interruption Duration Index (CTAIDI) CN
NrCTAIDI ii∑=
Customer Average Interruption Frequency Index (CAIFI)
CN
NCAIFI i∑=
Average Service Availability Index (ASAI)
⋅
∑−
⋅
=
year
hoursN
Nryear
hoursN
ASAI
T
iiT
Customer Experiencing Multiple Interruption (CEMIn)
( )
T
nkn N
CNCEMI >=
Customer Experiencing Long Interruption Durations (CELID)
- Single interruption duration:
( )
T
Sks N
CNCELID >
− =
- Total interruption duration:
( )
T
Tkt N
CNCELID >
− =
Load-based indices Average System Interruption Frequency Index (ASAFI)
T
i
L
LASAIFI
∑=
Average System Interruption Duration Index (ASIDI)
T
ii
L
LrASIDI
∑=
Other momentary indices Momentary Average Interruption Frequency Index (MAIFI) T
mii
N
NIMMAIFI
∑=
Momentary Average Interruption Event Frequency Index (MAIFIE)
T
mien N
NIMMAIFIE
∑=
Customers Experiencing Multiple Sustained Interruption and Momentary Interruption Events (CEMSMIn)
T
nkn N
CNTCEMISMI )( >=
Major Event Day (MED) Sample threshold value
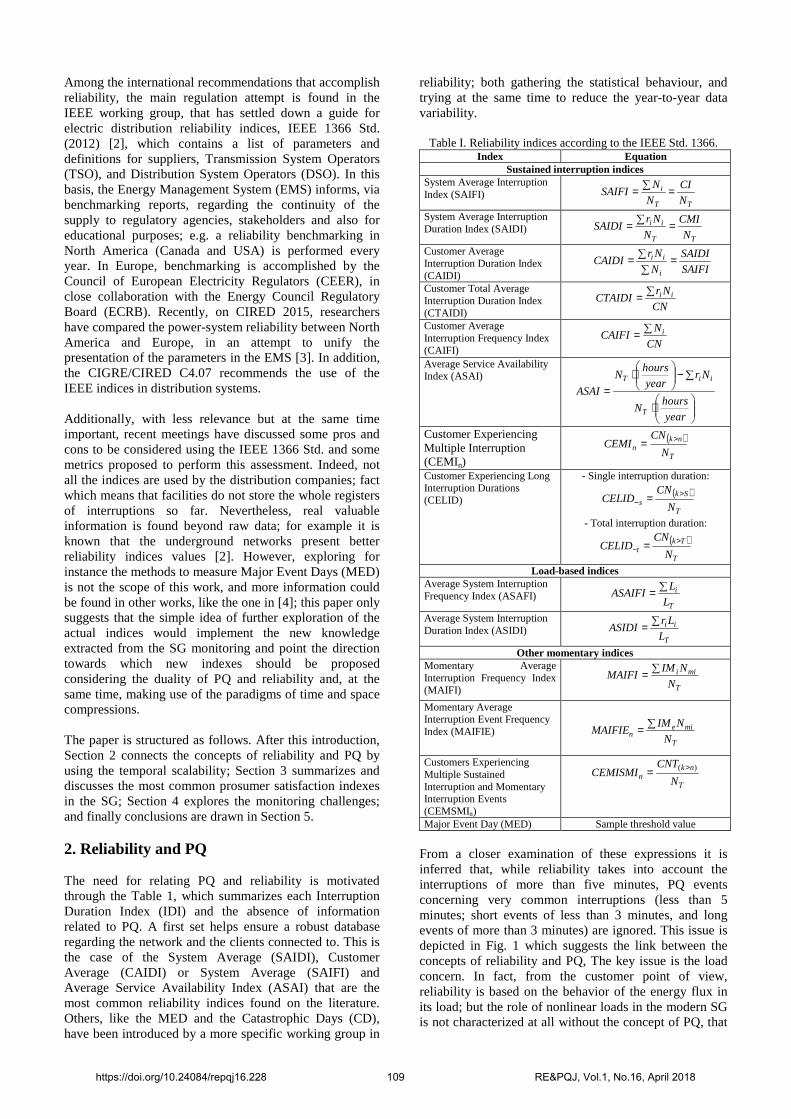
From a closer examination of these expressions it is inferred that, while reliability takes into account the interruptions of more than five minutes, PQ events concerning very common interruptions (less than 5 minutes; short events of less than 3 minutes, and long events of more than 3 minutes) are ignored. This issue is depicted in Fig. 1 which suggests the link between the concepts of reliability and PQ, The key issue is the load concern. In fact, from the customer point of view, reliability is based on the behavior of the energy flux in its load; but the role of nonlinear loads in the modern SG is not characterized at all without the concept of PQ, that
https://doi.org/10.24084/repqj16.228 109 RE&PQJ, Vol.1, No.16, April 2018
accounts for customized measurement time windows, previously setup by the customers. Indeed, the time-domain duality between reliability and PQ is what postulates the present discussion. Comparatively speaking, reliability is as the facility as PQ is as the customer, but new measurements tools are needed with the advent of the SG and the uncontrolled growth of nonlinear loads and the DER. The concept of scalability has to enter in this new scenario.
Fig. 1. Reliability indices and PQ concerns from the supplier and the consumer points of view.
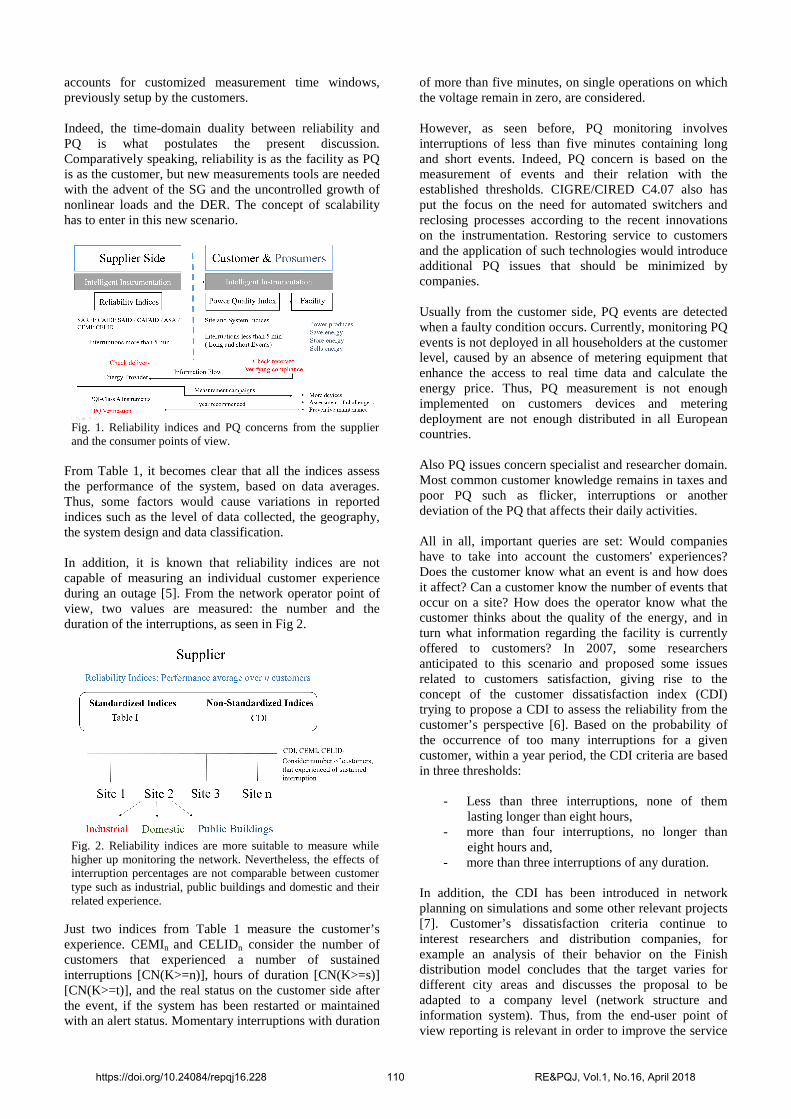
From Table 1, it becomes clear that all the indices assess the performance of the system, based on data averages. Thus, some factors would cause variations in reported indices such as the level of data collected, the geography, the system design and data classification. In addition, it is known that reliability indices are not capable of measuring an individual customer experience during an outage [5]. From the network operator point of view, two values are measured: the number and the duration of the interruptions, as seen in Fig 2.
Fig. 2. Reliability indices are more suitable to measure while higher up monitoring the network. Nevertheless, the effects of interruption percentages are not comparable between customer type such as industrial, public buildings and domestic and their related experience.
Just two indices from Table 1 measure the customer’s experience. CEMIn and CELIDn consider the number of customers that experienced a number of sustained interruptions [CN(K>=n)], hours of duration [CN(K>=s)] [CN(K>=t)], and the real status on the customer side after the event, if the system has been restarted or maintained with an alert status. Momentary interruptions with duration
of more than five minutes, on single operations on which the voltage remain in zero, are considered. However, as seen before, PQ monitoring involves interruptions of less than five minutes containing long and short events. Indeed, PQ concern is based on the measurement of events and their relation with the established thresholds. CIGRE/CIRED C4.07 also has put the focus on the need for automated switchers and reclosing processes according to the recent innovations on the instrumentation. Restoring service to customers and the application of such technologies would introduce additional PQ issues that should be minimized by companies. Usually from the customer side, PQ events are detected when a faulty condition occurs. Currently, monitoring PQ events is not deployed in all householders at the customer level, caused by an absence of metering equipment that enhance the access to real time data and calculate the energy price. Thus, PQ measurement is not enough implemented on customers devices and metering deployment are not enough distributed in all European countries. Also PQ issues concern specialist and researcher domain. Most common customer knowledge remains in taxes and poor PQ such as flicker, interruptions or another deviation of the PQ that affects their daily activities. All in all, important queries are set: Would companies have to take into account the customers' experiences? Does the customer know what an event is and how does it affect? Can a customer know the number of events that occur on a site? How does the operator know what the customer thinks about the quality of the energy, and in turn what information regarding the facility is currently offered to customers? In 2007, some researchers anticipated to this scenario and proposed some issues related to customers satisfaction, giving rise to the concept of the customer dissatisfaction index (CDI) trying to propose a CDI to assess the reliability from the customer’s perspective [6]. Based on the probability of the occurrence of too many interruptions for a given customer, within a year period, the CDI criteria are based in three thresholds:
- Less than three interruptions, none of them lasting longer than eight hours,
- more than four interruptions, no longer than eight hours and,
- more than three interruptions of any duration. In addition, the CDI has been introduced in network planning on simulations and some other relevant projects [7]. Customer’s dissatisfaction criteria continue to interest researchers and distribution companies, for example an analysis of their behavior on the Finish distribution model concludes that the target varies for different city areas and discusses the proposal to be adapted to a company level (network structure and information system). Thus, from the end-user point of view reporting is relevant in order to improve the service
https://doi.org/10.24084/repqj16.228 110 RE&PQJ, Vol.1, No.16, April 2018
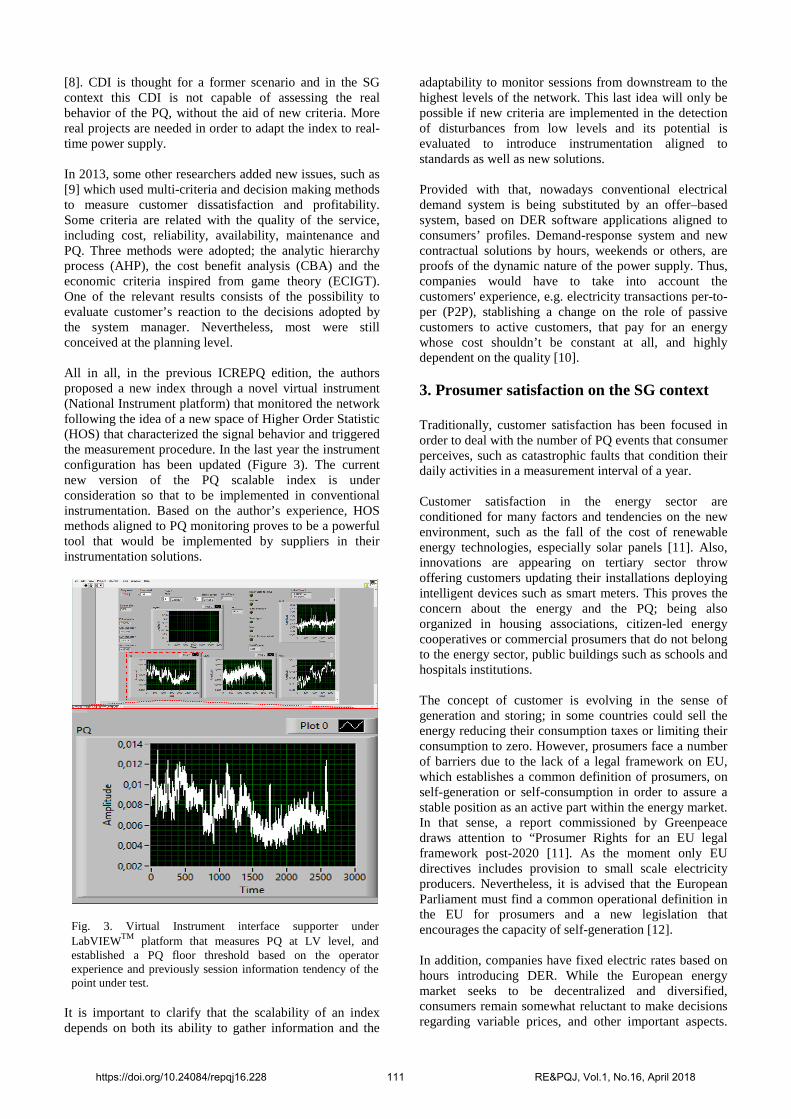
[8]. CDI is thought for a former scenario and in the SG context this CDI is not capable of assessing the real behavior of the PQ, without the aid of new criteria. More real projects are needed in order to adapt the index to real-time power supply. In 2013, some other researchers added new issues, such as [9] which used multi-criteria and decision making methods to measure customer dissatisfaction and profitability. Some criteria are related with the quality of the service, including cost, reliability, availability, maintenance and PQ. Three methods were adopted; the analytic hierarchy process (AHP), the cost benefit analysis (CBA) and the economic criteria inspired from game theory (ECIGT). One of the relevant results consists of the possibility to evaluate customer’s reaction to the decisions adopted by the system manager. Nevertheless, most were still conceived at the planning level. All in all, in the previous ICREPQ edition, the authors proposed a new index through a novel virtual instrument (National Instrument platform) that monitored the network following the idea of a new space of Higher Order Statistic (HOS) that characterized the signal behavior and triggered the measurement procedure. In the last year the instrument configuration has been updated (Figure 3). The current new version of the PQ scalable index is under consideration so that to be implemented in conventional instrumentation. Based on the author’s experience, HOS methods aligned to PQ monitoring proves to be a powerful tool that would be implemented by suppliers in their instrumentation solutions.
Fig. 3. Virtual Instrument interface supporter under LabVIEWTM platform that measures PQ at LV level, and established a PQ floor threshold based on the operator experience and previously session information tendency of the point under test.
It is important to clarify that the scalability of an index depends on both its ability to gather information and the
adaptability to monitor sessions from downstream to the highest levels of the network. This last idea will only be possible if new criteria are implemented in the detection of disturbances from low levels and its potential is evaluated to introduce instrumentation aligned to standards as well as new solutions. Provided with that, nowadays conventional electrical demand system is being substituted by an offer–based system, based on DER software applications aligned to consumers’ profiles. Demand-response system and new contractual solutions by hours, weekends or others, are proofs of the dynamic nature of the power supply. Thus, companies would have to take into account the customers' experience, e.g. electricity transactions per-to-per (P2P), stablishing a change on the role of passive customers to active customers, that pay for an energy whose cost shouldn’t be constant at all, and highly dependent on the quality [10]. 3. Prosumer satisfaction on the SG context Traditionally, customer satisfaction has been focused in order to deal with the number of PQ events that consumer perceives, such as catastrophic faults that condition their daily activities in a measurement interval of a year. Customer satisfaction in the energy sector are conditioned for many factors and tendencies on the new environment, such as the fall of the cost of renewable energy technologies, especially solar panels [11]. Also, innovations are appearing on tertiary sector throw offering customers updating their installations deploying intelligent devices such as smart meters. This proves the concern about the energy and the PQ; being also organized in housing associations, citizen-led energy cooperatives or commercial prosumers that do not belong to the energy sector, public buildings such as schools and hospitals institutions. The concept of customer is evolving in the sense of generation and storing; in some countries could sell the energy reducing their consumption taxes or limiting their consumption to zero. However, prosumers face a number of barriers due to the lack of a legal framework on EU, which establishes a common definition of prosumers, on self-generation or self-consumption in order to assure a stable position as an active part within the energy market. In that sense, a report commissioned by Greenpeace draws attention to “Prosumer Rights for an EU legal framework post-2020 [11]. As the moment only EU directives includes provision to small scale electricity producers. Nevertheless, it is advised that the European Parliament must find a common operational definition in the EU for prosumers and a new legislation that encourages the capacity of self-generation [12]. In addition, companies have fixed electric rates based on hours introducing DER. While the European energy market seeks to be decentralized and diversified, consumers remain somewhat reluctant to make decisions regarding variable prices, and other important aspects.
https://doi.org/10.24084/repqj16.228 111 RE&PQJ, Vol.1, No.16, April 2018
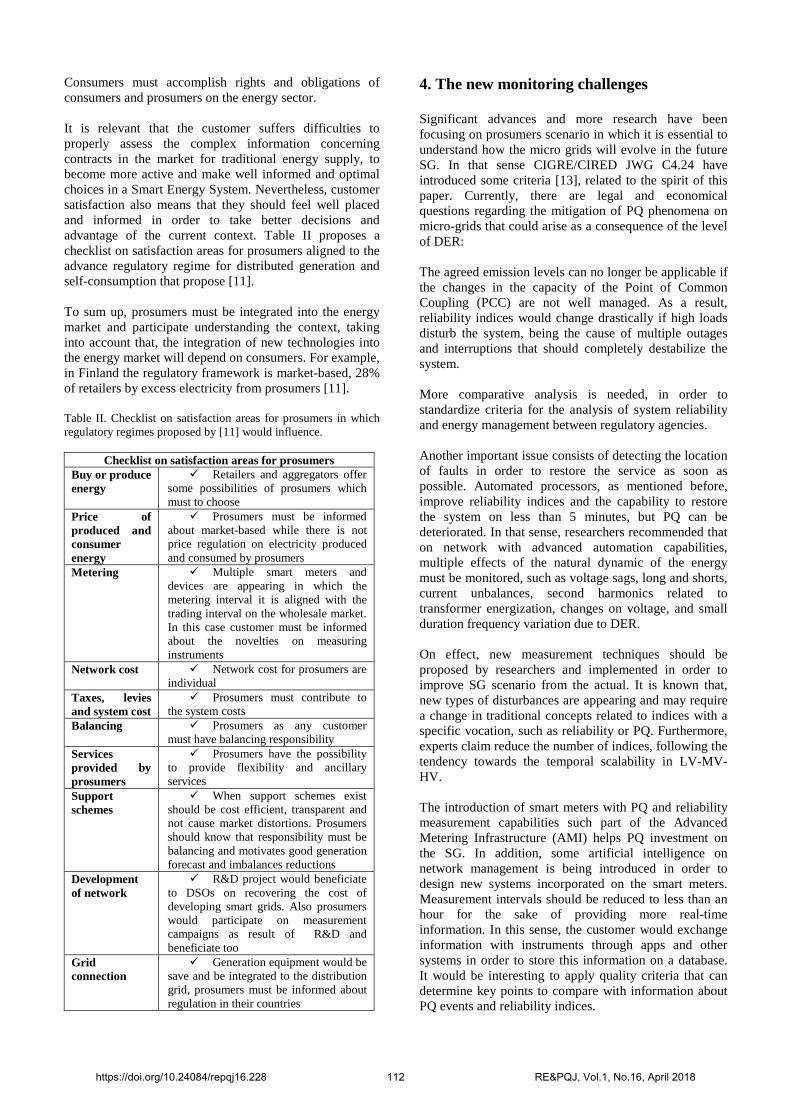
Consumers must accomplish rights and obligations of consumers and prosumers on the energy sector. It is relevant that the customer suffers difficulties to properly assess the complex information concerning contracts in the market for traditional energy supply, to become more active and make well informed and optimal choices in a Smart Energy System. Nevertheless, customer satisfaction also means that they should feel well placed and informed in order to take better decisions and advantage of the current context. Table II proposes a checklist on satisfaction areas for prosumers aligned to the advance regulatory regime for distributed generation and self-consumption that propose [11]. To sum up, prosumers must be integrated into the energy market and participate understanding the context, taking into account that, the integration of new technologies into the energy market will depend on consumers. For example, in Finland the regulatory framework is market-based, 28% of retailers by excess electricity from prosumers [11]. Table II. Checklist on satisfaction areas for prosumers in which regulatory regimes proposed by [11] would influence.
Checklist on satisfaction areas for prosumers Buy or produce energy
� Retailers and aggregators offer some possibilities of prosumers which must to choose
Price of produced and consumer energy
� Prosumers must be informed about market-based while there is not price regulation on electricity produced and consumed by prosumers
Metering � Multiple smart meters and devices are appearing in which the metering interval it is aligned with the trading interval on the wholesale market. In this case customer must be informed about the novelties on measuring instruments
Network cost � Network cost for prosumers are individual
Taxes, levies and system cost
� Prosumers must contribute to the system costs
Balancing � Prosumers as any customer must have balancing responsibility
Services provided by prosumers
� Prosumers have the possibility to provide flexibility and ancillary services
Support schemes
� When support schemes exist should be cost efficient, transparent and not cause market distortions. Prosumers should know that responsibility must be balancing and motivates good generation forecast and imbalances reductions
Development of network
� R&D project would beneficiate to DSOs on recovering the cost of developing smart grids. Also prosumers would participate on measurement campaigns as result of R&D and beneficiate too
Grid connection
� Generation equipment would be save and be integrated to the distribution grid, prosumers must be informed about regulation in their countries
4. The new monitoring challenges Significant advances and more research have been focusing on prosumers scenario in which it is essential to understand how the micro grids will evolve in the future SG. In that sense CIGRE/CIRED JWG C4.24 have introduced some criteria [13], related to the spirit of this paper. Currently, there are legal and economical questions regarding the mitigation of PQ phenomena on micro-grids that could arise as a consequence of the level of DER: The agreed emission levels can no longer be applicable if the changes in the capacity of the Point of Common Coupling (PCC) are not well managed. As a result, reliability indices would change drastically if high loads disturb the system, being the cause of multiple outages and interruptions that should completely destabilize the system. More comparative analysis is needed, in order to standardize criteria for the analysis of system reliability and energy management between regulatory agencies. Another important issue consists of detecting the location of faults in order to restore the service as soon as possible. Automated processors, as mentioned before, improve reliability indices and the capability to restore the system on less than 5 minutes, but PQ can be deteriorated. In that sense, researchers recommended that on network with advanced automation capabilities, multiple effects of the natural dynamic of the energy must be monitored, such as voltage sags, long and shorts, current unbalances, second harmonics related to transformer energization, changes on voltage, and small duration frequency variation due to DER.
On effect, new measurement techniques should be proposed by researchers and implemented in order to improve SG scenario from the actual. It is known that, new types of disturbances are appearing and may require a change in traditional concepts related to indices with a specific vocation, such as reliability or PQ. Furthermore, experts claim reduce the number of indices, following the tendency towards the temporal scalability in LV-MV-HV. The introduction of smart meters with PQ and reliability measurement capabilities such part of the Advanced Metering Infrastructure (AMI) helps PQ investment on the SG. In addition, some artificial intelligence on network management is being introduced in order to design new systems incorporated on the smart meters. Measurement intervals should be reduced to less than an hour for the sake of providing more real-time information. In this sense, the customer would exchange information with instruments through apps and other systems in order to store this information on a database. It would be interesting to apply quality criteria that can determine key points to compare with information about PQ events and reliability indices.
https://doi.org/10.24084/repqj16.228 112 RE&PQJ, Vol.1, No.16, April 2018
5. Conclusion Current indices only concern an area of the energy stakeholders: reliability or PQ. Until now researchers have not proposed scalable indexes on different time intervals and voltage ranges (LV-MV-HV). Aligned to new challenges, it is essential to monitor new indices that characterize the behavior of the power supply from a dynamic viewpoint, and bi-parametric analysis, and that reflects the temporal evolution of the quality of the energy and its deviation with respect to the terms stipulated in the contract. The information behind data helps standardized methods for recording and manage database. In that sense, incorporating measurement satisfaction methods from prosumer and consumers-side is crucial considering the SG context. Indeed, it is crucial not only stablished probability indices of the poor power quality but also added criteria based on the customer experience, the intelligent instrumentation results, contractual issues and energy reports. Empowering customers through smart metering is a way to better regulate the market and ensure its commitment to the final consumption of energy. The provision of information on households, consumption patterns and billing based actual consumption it is essential while household customers are being capable to recognize that the price of energy will also depend on their quality and the transitory nature of the power supply. Finally, being connected to the grid it is still a suitable and desirable scenario for both, customers and suppliers that must interact with new intelligent devices that must accomplished reliability and PQ characteristics. New functionalities must be added to instrumentation in order to measure and storage both the power supply information and customer-prosumers satisfaction and perspective on the SG context. Acknowledgement This work is supported by the Spanish Ministry of Economy and Competitiveness in the frame of the State Plan of Excellency and Challenges for Research, via the project TEC2016-77632-C3-3-R - COntrol and Management of Isolable NanoGrids: Smart Instruments for Solar forecasting and Energy Monitoring (COMING-SISEM). Our unforgettable thanks to the trust we have from the Andalusian Government for funding the Research Group PAIDI-TIC-168 in Computational Instrumentation and Industrial Electronics (ICEI). References [1] D. Committee, I. Power, and E. Society, IEEE Guide for
Collecting , Categorizing , and Utilizing Information Related to Electric Power Distribution Interruption Events IEEE Power and Energy Society. 2014.
[2] D. Committee, I. Power, and E. Society, Distribution Reliability Indices, vol. 2012. 2012.
[3] J. McDaniel and W. Friedl, “23 rd International Conference
on Electricity Distribution Paper 0182 BENCHMARKING OF RELIABILITY : NORTH AMERICAN AND EUROPEAN EXPERIENCE 23 rd International Conference on Electricity Distribution,” no. June, pp. 15–18, 2015.
[4] J. H. Eto, K. H. Lacommare, M. D. Sohn, and H. C. Caswell, “Evaluating the Performance of the IEEE Standard 1366 Method for Identifying Major Event Days,” IEEE Trans. Power Syst., vol. 32, no. 2, pp. 1327–1333, 2017.
[5] M. H. J. Bollen and M. Häger, “What is reliability ? Reliability and Reliability Indices in the Viewpoint of the Network Operator and in the Viewpoint of the Customer,” Power Qual., vol. II, no. 2, 2006.
[6] M. B. Lule, “A customer-oriented approach towards reliability indices,” no. April, 2007.
[7] A. Holm, J. Pylvanainen, P. Owe, H. Paananen, and M. H. J. Bollen, “Customer dissatisfaction index (CDI): pilot use in network planning,” IET Conf. Publ., no. July, pp. 367–367, 2009.
[8] J. Lassila, T. Kaipia, J. Haakana, and J. Partanen, “Customer-based reliability monitoring criteria for Finnish distribution companies,” PQ2010 7th Int. Conf. - 2010 Electr. Power Qual. Supply Reliab. Conf. Proc., no. June, pp. 165–170, 2010.
[9] R. Medjoudj, D. Aissani, and K. D. Haim, “Power customer satisfaction and profitability analysis using multi-criteria decision making methods,” Int. J. Electr. Power Energy Syst., vol. 45, no. 1, pp. 331–339, 2013.
[10] Ecorys, “The role of DSOs in a Smart Grid environment,” no. April, p. 145, 2014.
[11] J. Roberts, “Prosumer rights: options for an EU legal framework post-2020 [Report commissioned by Greenpeace],” no. May, 2016.
[12 Š. Nikolina, “Electricity â€TM Prosumers ’,” EPRS | Eur. Parliam. Res. Serv., no. November, 2016.
[13] C. Cired, C. Jwg, F. Zavoda, R. Langella, G. C. Lazaroiu, I. Hq, M. Bollen, and S. K. Rönnberg, “Power Quality in the Future Grid – Results from,” pp. 404–409.
https://doi.org/10.24084/repqj16.228 113 RE&PQJ, Vol.1, No.16, April 2018