Embed Size (px)
Citation preview

RESEARCH ARTICLE OPEN ACCESS
Disease classification in Solanum melongena using deep learningKrishnaswamy R. Aravind (Aravind, KR), Purushothaman Raja (Raja, P), Rajendran Ashiwin (Ashiwin, R) and
Konnaiyar V. Mukesh (Mukesh, KV)SASTRA Deemed University, School of Mechanical Engineering, Thanjavur 613401, Tamil Nadu, India.
Spanish Journal of Agricultural Research17 (3), e0204, 14 pages (2019)
eISSN: 2171-9292https://doi.org/10.5424/sjar/2019173-14762
Instituto Nacional de Investigación y Tecnología Agraria y Alimentaria (INIA)
AbstractAim of study: The application of pre-trained deep learning models, AlexNet and VGG16, for classification of five diseases (Epilachna
beetle infestation, little leaf, Cercospora leaf spot, two-spotted spider mite and Tobacco Mosaic Virus (TMV)) and a healthy plant in Solanum melongena (brinjal in Asia, eggplant in USA and aubergine in UK) with images acquired from smartphones.
Area of study: Images were acquired from fields located at Alangudi (Pudukkottai district), Tirumalaisamudram and Pillayarpatti (Thanjavur district) – Tamil Nadu, India.
Material and methods: Most of earlier studies have been carried out with images of isolated leaf samples, whereas in this work the whole or part of the plant images were utilized for the dataset creation. Augmentation techniques were applied to the manually segmented images for increasing the dataset size. The classification capability of deep learning models was analysed before and after augmentation. A fully connected layer was added to the architecture and evaluated for its performance.
Main results: The modified architecture of VGG16 trained with the augmented dataset resulted in an average validation accuracy of 96.7%. Despite the best accuracy, all the models were tested with sample images from the field and the modified VGG16 resulted in an accuracy of 93.33%.
Research highlights: The findings provide a guidance for possible factors to be considered in future research relevant to the dataset creation and methodology for efficient prediction using deep learning models.
Additional keywords: convolutional neural network; Tobacco mosaic virus disease; Epilachna beetle; Little leaf; Cercospora leaf spot; two-spotted spider mite; transfer learning.
Abbreviations used: CNN (Convolutional Neural Network); DCNN (Deep Convolutional Neural Network); ReLU (Rectified Linear Unit); RGB (Red Green Blue); TMV (Tobacco Mosaic Virus); VGG (Visual Geometry Group).
Authors’ contributions: Conceived and identified the outline, and drafting of the manuscript: KRA and PR. Data acquisition and processing: KRA, RA and KVM. Programming and performed the experiment: KRA. Critical revision of the manuscript: PR. All authors read and approved the final manuscript.
Citation: Aravind, KR; Raja, P; Ashiwin, R; Mukesh, KV (2019). Disease classification in Solanum melongena using deep learning. Spanish Journal of Agricultural Research, Volume 17, Issue 3, e0204. https://doi.org/10.5424/sjar/2019173-14762
Supplementary material (Fig. S1) accompanies the paper on SJAR’s website.Received: 23 Feb 2019. Accepted: 08 Oct 2019.Copyright © 2019 INIA. This is an open access article distributed under the terms of the Creative Commons Attribution 4.0
International (CC-by 4.0) License.Funding: The authors received no specific funding for this work.Competing interests: The authors have declared that no competing interests exist.Correspondence should be addressed to Purushothaman Raja: [email protected]
Introduction
In agriculture, pest infestation as well as (different) diseases are affecting the production of horticultural crops. An example survey on the factors affecting the food production points to 10% loss because of plant diseases (Strange & Scott, 2005). Hence, the timely diagnosis of the diseases will help the farmers to control the spread of the harmful ones. On the other hand, human diagnosis involves error due to the limitation in cognitive ability, experience, psychological, and other factors. Laboratory analysis for diagnosis requires skilled labor and it is a time-consuming process. Also,
such a facility is limited to process a huge number of samples and (mostly) non-available in remote locations. Hence, it demands an alternative, simple and non-destructive method for diagnosis of disease which will be beneficial for the farmers (Barbedo, 2016; Barbedo et al., 2016).
Due to the advent of mobile phone technology, smart phones integrated with the camera are easily available. They will help the farmers to acquire digital images of the plant sample, for diagnosis. Applications such as Plantix (https://plantix.net/en) have begun providing ser vices for identification of diseases in different crops, although many types of crops as well as different diseases are still
Krishnaswamy R. Aravind, Purushothaman Raja, Rajendran Ashiwin and Konnaiyar V. Mukesh
Spanish Journal of Agricultural Research September 2019 • Volume 17 • Issue 3 • e0204
2
needed to be included (Barbedo, 2018a). Many studies (Mohanty et al., 2016; Brahimi et al., 2017; Barbedo, 2018b; Ferentinos, 2018; Liu et al., 2018) have been carried out using the standard technique where the leaves are isolated from the plant and the images of these isolated leaves are acquired in a controlled environment. Earlier traditional studies have explored the use of shallow machine learning algorithms with the extracted feature parameters (Arivazhagan et al., 2013; Kruse et al., 2014; Dey et al., 2016; Ali et al., 2017; Zhang et al., 2017). In the case of deep learning methods, image dataset is directly provided as input for training process unlike earlier methods. These trained models have been evaluated based on the classification performance on test images.
Isolation of leaves and acquiring images in controlled condition contribute to significant complexity. In some cases, a close-up shot of the infected leaves in real field condition is required for disease diagnosis, which increases the complexity of the automated systems that need to be developed. Also, the incident of the diseases will cause structural changes in the plant. Hence, a system for disease identification using the whole or portion of the plant image without isolating leaf samples will be of great benefit to farmers and for easy implementation in automation systems. Further, analysing the severity of diseases will be possible employing the images of the whole plant.
Studies have been carried out for recognition of disease using the images of the entire or part of the single plant with a simple digital camera (Zhou et al., 2014; Salgadoe et al., 2018). Other methods included aerial shots of the field with conventional digital ca-mera, multispectral or hyperspectral devices (Calderón et al., 2013; García-Ruiz et al., 2013; De Castro et al., 2015). In the above studies, different vegetation indices such as structural indices (e.g., Normalized Difference Vegetation Index [NDVI]), Xanthophyll indices (e.g., Photochemical reflectance index), chlo-rophyll a+b indices, crop water stress index, etc., were estimated based on the spectral reflectance value of
specific wavelength for recognition of disease and severity estimation in large crops. Schor et al. (2016) used principal components in Red Green Blue (RGB) channel along with Otsu-based thresholding method and morphological operation for disease classification. Story & Kacira (2015) have used a Cartesian-based robotic system with cameras sensitive to different wa velengths and sensors for monitoring the crop health status in a laboratory condition. In reality, it is difficult to implement such a system on a commercial scale. Moreover, the experimental field size is limited to the physical limits of the robotic system. Pilli et al. (2014) used an autonomous robot equipped with cameras for acquiring the images of cotton and groundnut crops. Later, textural features were extracted using image processing method and fed as input to neural network for training. The classification accuracy in testing phase varied from 83 to 96%. Polder et al. (2014) utilized Linear Discriminant Analysis (LDA) and color features such as mean normalized red and green value, a fraction of red pixels, etc., for classification of tulip crop infected with tulip breaking virus from healthy plant.
Employment of high-resolution RGB cameras, multi spectral and specialized devices are costly compared to conventional visible cameras which makes it difficult to implement on a wider scale and requires an expert for handling the device (Barbedo, 2016). Moreover, manual feature extraction demands an expert skill for identification of the best combination of features which can solve the disease classification problem. Also, the process is time-consuming and the sensitivity of features to detect the disease may change significantly, when dataset of new disease is added. Recent advances in deep learning-based algorithm, were consistently able to reproduce results, even when numerous classes of diseases were considered (Brahimi et al., 2018). Table 1 shows some notable works on disease classification in a single crop with isolated leaf samples using Convolutional Neural Networks (CNN)-based architecture.
Table 1. Different models for disease classification using leaf dataset.
Author Crop Deep learning model Accuracy
Liu et al., 2018 Apple AlexNet precursors with inception module 97.62%Ma et al., 2018 Cucumber DCNN, based on Lenet5 93.4%Aravind et al., 2018 Grape AlexNet with SVM 99.23%Brahimi et al., 2017 Tomato AlexNet
GoogleNet97.71%99.18%
Lu et al., 2017 Rice DCNN 95.48%
DCNN: Deep Convolution Neural Network. SVM: Support Vector Machine.
Disease classification in Solanum melongena using deep learning
Spanish Journal of Agricultural Research September 2019 • Volume 17 • Issue 3 • e0204
3
Dhakad (2017) reported a production loss ranging from 60 to 80% due to this disease. The spores of the fungus spread rapidly through the air.
So far, no literature studies have been found for the classification of above diseases with leaves of S. melongena. Also, studies for classification of diseases using the whole or part of the plant image have not been found using deep learning models. In this work, two deep learning models, AlexNet and VGG16, were utilized to solve disease classification problem in Solanum melongena.
Material and methods
A brief description of the dataset created using the whole or part of the plant images and the different layers of the pre-trained deep learning models, AlexNet and VGG16, is found next. The modification of the deep learning models and its implementation are discussed in section “Implementation”.
Image dataset
A dataset was created with images captured using six different smartphones commercially available ha-ving distinct resolutions. These images were acquired from three different fields cultivating S. melongena du ring three different time periods (6.00 AM to 8.00 AM, 8.00 AM – 5.00 PM (under cloudy con-dition), 5.00 PM – 6.00 PM) in order to minimize the loss of disease features due to specular reflection. The three fields are located in Tamil Nadu, India: one in Alangudi-Pudukkottai district (10°21ʹ30.0ʺ N, 78°54ʹ52.1ʺ E), and two in the Thanjavur dis-trict: Tirumalaisamudram (10°43ʹ33.8ʺ N, 79°00ʹ57.5ʺ E) and Pillayarpatti (10°44ʹ46.4ʺ N, 79°03ʹ49.1ʺ E).
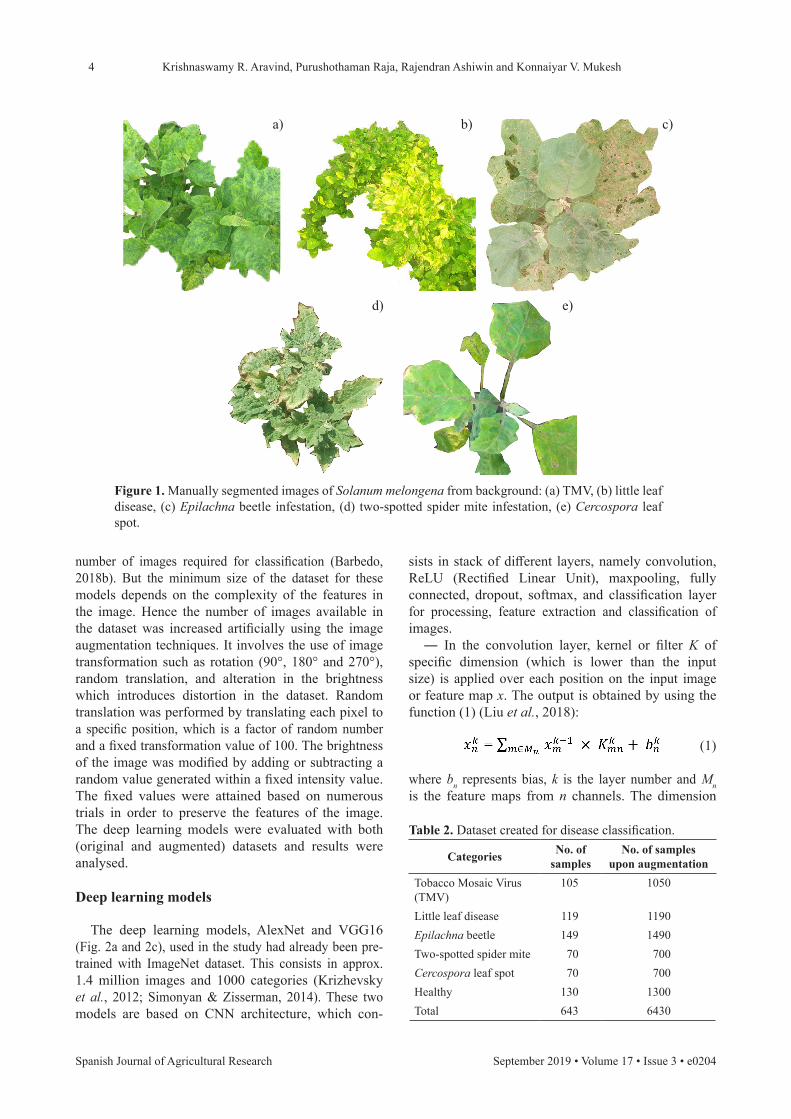
The obtained images were manually segmented using a software to remove background information as shown in Fig. 1. This is done to eliminate the learning of features from background information and evaluate the sensitivity of the deep learning model in learning specific features of the disease. The images were pre-processed to the accepted input dimensions of the deep learning models (specifically 227 × 227 × 3 for AlexNet and 224 × 224 × 3 for VGG 16). The dataset created using these pre-processed images consists of six different classes (based on the consultation with pathologists) as shown in Table 2.
The performance of the deep learning models depends heavily on the quantity of the data. The lack of enough (input) data results in overfitting of the learnt model which will perform poorly in case of the validation. As per the literature, there is no clarity in determining the
Solanum melongena L. (common name brinjal or eggplant), is a common crop grown across India, which is the second largest producer of the 2017 total world production (23.9% of the total) according to FAO (www.fao.org/faostat/en/#data/QC). The unripen fruits are consumed widely in a different form using traditional and modern cooking practices. This vegetable is a rich source of dietary nutrients and an important remedy for various ailments (Agroreyo et al., 2012). These plants are susceptible to many diseases, of which five common (major) diseases (Tobacco Mosaic Virus (TMV), Epilachna beetle, little leaf disease, Cercospora leaf spot and two-spotted spider mites), along with the healthy category, were considered for the study.
― TMV is one of the main pathogens affecting the plant species of the Solanaceae family for which has been reported a loss of production up to 90% under favourable condition (Alishiri et al., 2013). The characteristic symptom of the disease is a pattern of discoloured mosaic on the surface of the leaves. Fig. S1a [suppl.] shows the S. melongena with mosaic patterns visible on the leaves which have been affected with the TMV. In some cases, changes in the shape of the leaves and curling’s are reported for the disease (Madzokere, 2017).
― Little leaf disease is one of the deadly diseases caused by a phytoplasma. The vector agent for trans-mitting the disease is leaf hopper (Shazly et al., 2016). The characteristic symptoms of the disease are shrinkage in size of the leaf, stunted growth, reduced internodes and increase in number of small leaves arranged in bunches (as shown in Fig. S1b [suppl.]. A survey by Rao et al. (2017) reported losses ranging from 40% to 100% under favourable conditions.
― Epilachna beetle infestation is one of the most common problems in S. melongena. The beetle has three different stages of development (grub, pupa and adult). Grub and adult have specialized mouth parts for consuming the chlorophyll from the leaves (as shown in Fig. S1c [suppl.]) (Srinivasan, 2009). Mohanchander et al. (2013) reported up to 80% damage of the leaves and loss of fruit production up to 60%.
― Two-spotted spider mite (Tetranychus utricae) infestation is one of the main pests affecting a large variety of crops (Fig. S1d [suppl.]). The pest survives by consuming the fluids from the plant. It also removes the chlorophyll and web has been found on the leaf surface. The infestation is especially severe in S. melongena, where Ramaraju (2004) reported a yield loss of 13.64% to 31.09% under favourable conditions.
― Cercospora leaf spot is caused by the fungi Cercospora melongenae. The characteristic symptoms of the disease are dark circular spots on both sides of the leaves (Fig. S1e [suppl.]) (Srivastava & Nelson, 2012).
Krishnaswamy R. Aravind, Purushothaman Raja, Rajendran Ashiwin and Konnaiyar V. Mukesh
Spanish Journal of Agricultural Research September 2019 • Volume 17 • Issue 3 • e0204
4
a) b) c)
d) e)
Figure 1. Manually segmented images of Solanum melongena from background: (a) TMV, (b) little leaf disease, (c) Epilachna beetle infestation, (d) two-spotted spider mite infestation, (e) Cercospora leaf spot.
Table 2. Dataset created for disease classification.
Categories No. of samples
No. of samples upon augmentation
Tobacco Mosaic Virus (TMV)
105 1050
Little leaf disease 119 1190Epilachna beetle 149 1490Two-spotted spider mite 70 700Cercospora leaf spot 70 700Healthy 130 1300Total 643 6430
number of images required for classification (Barbedo, 2018b). But the minimum size of the dataset for these models depends on the complexity of the features in the image. Hence the number of images available in the dataset was increased artificially using the image augmentation techniques. It involves the use of image transformation such as rotation (90°, 180° and 270°), random translation, and alteration in the brightness which introduces distortion in the dataset. Random translation was performed by translating each pixel to a specific position, which is a factor of random number and a fixed transformation value of 100. The brightness of the image was modified by adding or subtracting a random value generated within a fixed intensity value. The fixed values were attained based on numerous trials in order to preserve the features of the image. The deep learning models were evaluated with both (original and augmented) datasets and results were analysed.
Deep learning models
The deep learning models, AlexNet and VGG16 (Fig. 2a and 2c), used in the study had already been pre-trained with ImageNet dataset. This consists in approx. 1.4 million images and 1000 categories (Krizhevsky et al., 2012; Simonyan & Zisserman, 2014). These two models are based on CNN architecture, which con-
sists in stack of different layers, namely convolution, ReLU (Rectified Linear Unit), maxpooling, fully connected, dropout, softmax, and classification layer for processing, feature extraction and classification of images.
― In the convolution layer, kernel or filter K of specific dimension (which is lower than the input size) is applied over each position on the input image or feature map x. The output is obtained by using the function (1) (Liu et al., 2018):
(1)
where bn represents bias, k is the layer number and Mn is the feature maps from n channels. The dimension
Disease classification in Solanum melongena using deep learning
Spanish Journal of Agricultural Research September 2019 • Volume 17 • Issue 3 • e0204
5
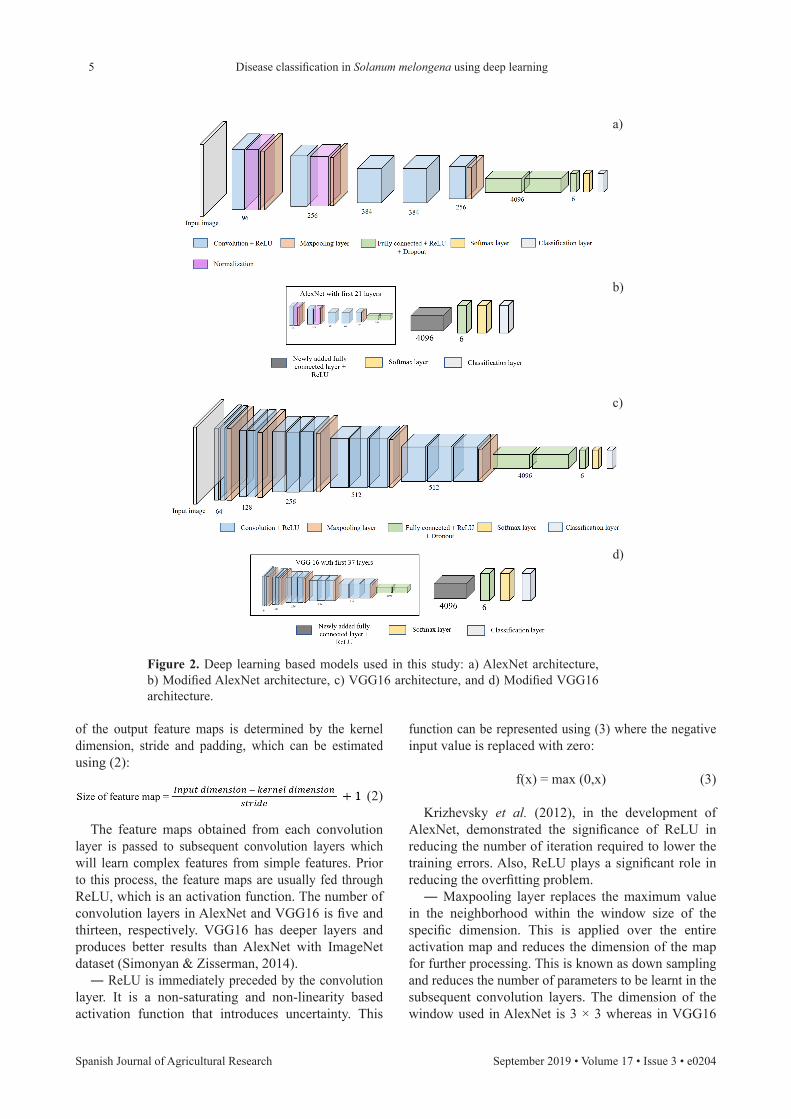
Figure 2. Deep learning based models used in this study: a) AlexNet architecture, b) Modified AlexNet architecture, c) VGG16 architecture, and d) Modified VGG16 architecture.
of the output feature maps is determined by the kernel dimension, stride and padding, which can be estimated using (2):
(2)
The feature maps obtained from each convolution layer is passed to subsequent convolution layers which will learn complex features from simple features. Prior to this process, the feature maps are usually fed through ReLU, which is an activation function. The number of convolution layers in AlexNet and VGG16 is five and thirteen, respectively. VGG16 has deeper layers and produces better results than AlexNet with ImageNet dataset (Simonyan & Zisserman, 2014).
― ReLU is immediately preceded by the convolution layer. It is a non-saturating and non-linearity based activation function that introduces uncertainty. This
function can be represented using (3) where the negative input value is replaced with zero:
f(x) = max (0,x) (3)
Krizhevsky et al. (2012), in the development of AlexNet, demonstrated the significance of ReLU in reducing the number of iteration required to lower the training errors. Also, ReLU plays a significant role in reducing the overfitting problem.
― Maxpooling layer replaces the maximum value in the neighborhood within the window size of the specific dimension. This is applied over the entire activation map and reduces the dimension of the map for further processing. This is known as down sampling and reduces the number of parameters to be learnt in the subsequent convolution layers. The dimension of the window used in AlexNet is 3 × 3 whereas in VGG16
a)
b)
c)
d)
Krishnaswamy R. Aravind, Purushothaman Raja, Rajendran Ashiwin and Konnaiyar V. Mukesh
Spanish Journal of Agricultural Research September 2019 • Volume 17 • Issue 3 • e0204
6
2 × 2 is used. The dimensionality reduction in AlexNet is higher whereas in VGG16 it is lower. In VGG16 architecture, more convolution layers are available as reducing the dimension rapidly will make the model to lose essential features and its spatial informations for discrimination. Hence window size is lower in VGG16 (Simonyan & Zisserman, 2014).
― Cross-channel or local response normalization is present only in the AlexNet architecture. In this layer, each value in the map is replaced with a normalized value by using the window of specified size and a certain number of neighboring channels. The equa tion (4) represents the local response normalization (Krizhevsky et al., 2012):
(4)
where is the normalized activity obtained with , which are the elements in normalization win dow; is the neuron activity; and k, α, ß are hyperparameters.
― In a fully connected layer, all the neurons are connected to each other, what is similar to the traditio-nal neural networks. In the convolution layers, local features are combined to obtain a larger pattern of the learnt features in the fully connected layers. The two deep learning models have three fully connected layers, the first two layers have 4096 hidden neurons and in the third the number of neurons depends on the number of classes.
In dropout, 50% of the neurons are disconnected, which drops out the connection of neurons randomly with a probability of 0.5. This results in new neural architecture during every run and reduces the dependen-cy on the neighboring neurons. Srivastava et al. (2015) improved the model's performance and reduced the overfitting problem.
― Softmax & classification layer. The output from the fully connected layer is converted into a probability for the available classes. The mathematical operation performed in softmax layer is given by (5) (Beale et al., 2018):
(5)
where P(x,θ|cr) is the conditional probability and P(cr) is the prior probability for class r. P(cr|x,θ) is the resulting probability and the class with the highest probability is assigned as the correct class using cross-entropy function E(θ) in the classification layer which is defined by (6) (Beale et al., 2018):
(6)
Implementation
The implementation was carried out in ACER NITRO 5 SPIN laptop equipped with GTX 1050 Graphics Processing Unit (GPU) and 8 GB of Random Access Memory (RAM). The software package used for the experiment was Matlab 2017b. In this study, the evalua-tions were carried out using two sets of pre-trained deep learning architecture. The first set was default AlexNet and VGG16 while the other set was a modified model of the same. Two experiments were conducted in such a way that one was performed without an augmentation of the dataset and other with an augmented dataset. It was carried out to determine the effect of the size of the dataset on the classification accuracy, as an earlier study has demonstrated a significant impact (Barbedo, 2018b). In the modified model, an additional fully connected layer with 4096 hidden neurons is added to the original model as shown in Fig. 2b and Fig. 2d. This increases the number of fully connected layers from three to four. As the number of fully connected layers increases, the number of learnable parameters increases and its significance in affecting the performance was evaluated.
There are several hyperparameters such as mini-batch size, learning rate, epoch, etc., which need to be set, prior to the training of the model with the input images (presented in section “Results and discussion”). Among many parameters, minibatch size and learning rate are important hyperparameters. Minibatch consists in splitting the training dataset into smaller batches to calculate the error and update of the parameters. Learning rate is a hyperparameter that will be multiplied with the derivative of loss function. It is used to update the weight and bias. The learning rate was kept very low for all the remaining layers except the last two fully connected layers, because the model has (already) learnt weight and bias with ImageNet dataset and this learned model is used for the classification of diseases and a healthy class. This is known as transfer learning approach. The learning rate of weight and bias for the last fully connected layer were set greater than the initial learning rate which makes those layers to learn faster. All the fine-tuned hyperparameters used in the study are shown in Table 3.
A total of five trials were carried out for each mo-del. Each trial was carried out with 20 epochs. The commonly applied dataset splitting ratio of 80% for training and 20% for validation were used in both the experiments (Ferentinos, 2018).
Disease classification in Solanum melongena using deep learning
Spanish Journal of Agricultural Research September 2019 • Volume 17 • Issue 3 • e0204
7
a)
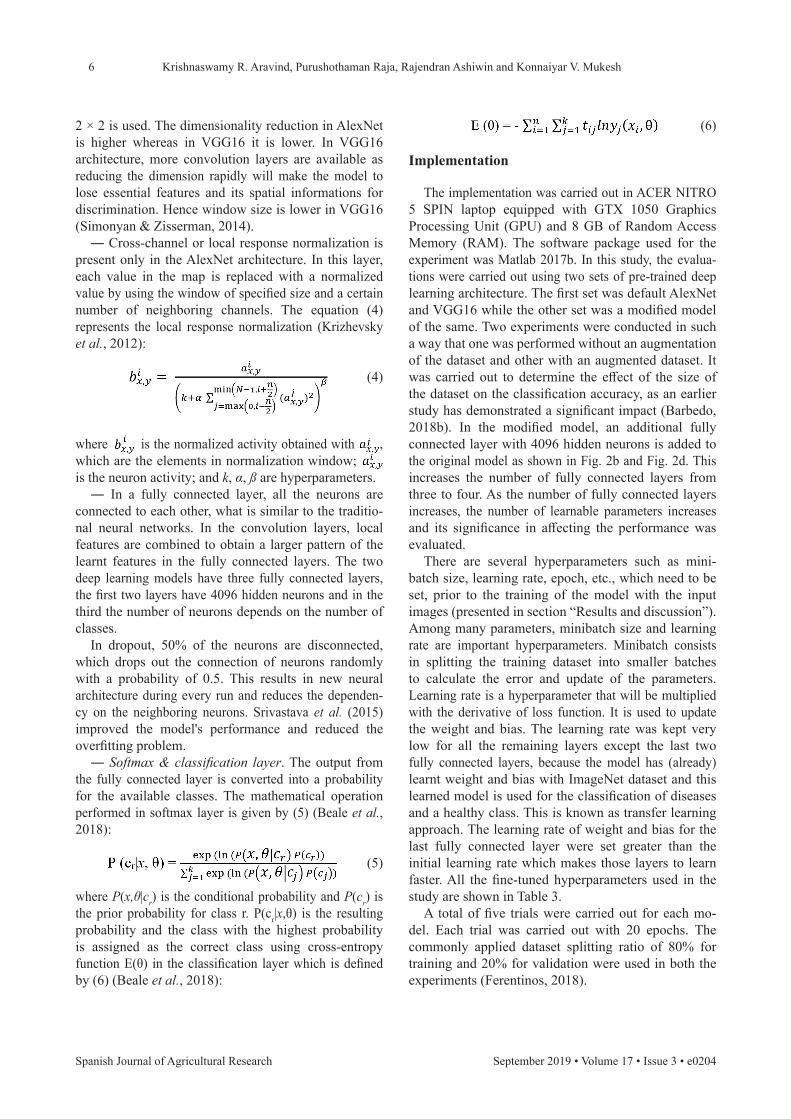
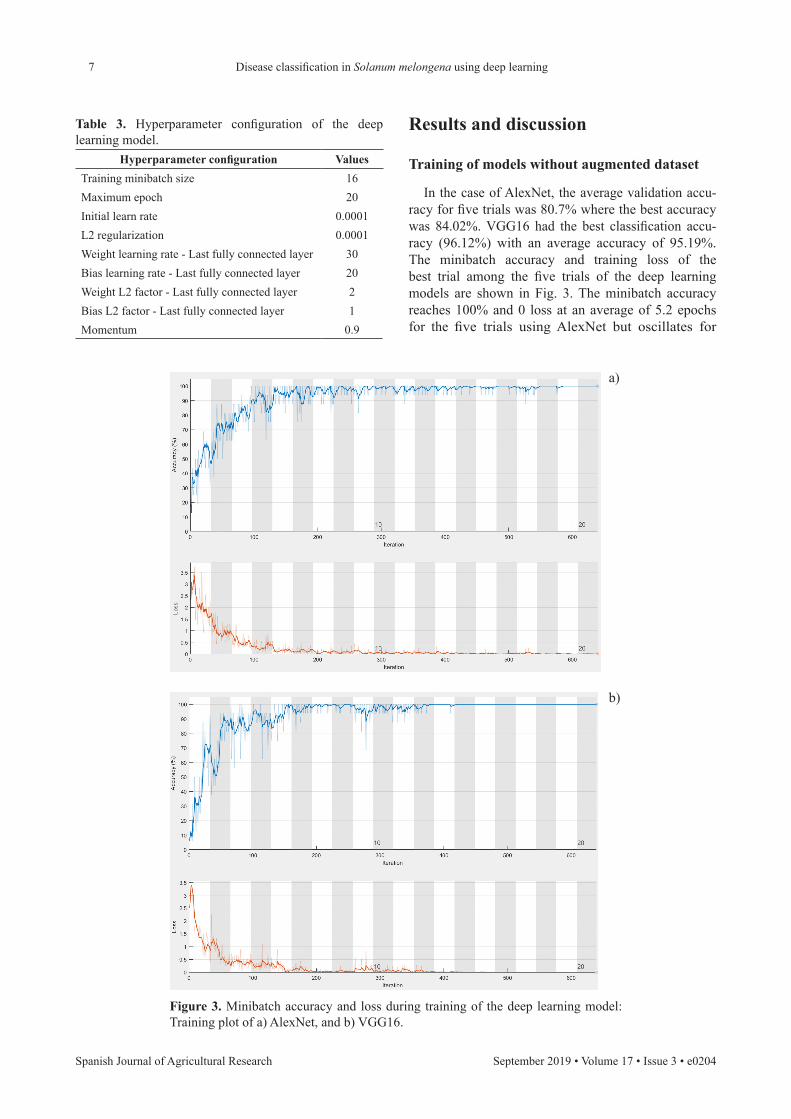
Figure 3. Minibatch accuracy and loss during training of the deep learning model: Training plot of a) AlexNet, and b) VGG16.
b)
Results and discussion
Training of models without augmented dataset
In the case of AlexNet, the average validation accu-racy for five trials was 80.7% where the best accuracy was 84.02%. VGG16 had the best classification accu-racy (96.12%) with an average accuracy of 95.19%. The minibatch accuracy and training loss of the best trial among the five trials of the deep learning models are shown in Fig. 3. The minibatch accuracy reaches 100% and 0 loss at an average of 5.2 epochs for the five trials using AlexNet but oscillates for
Table 3. Hyperparameter configuration of the deep learning model.
Hyperparameter configuration ValuesTraining minibatch size 16Maximum epoch 20Initial learn rate 0.0001L2 regularization 0.0001Weight learning rate - Last fully connected layer 30Bias learning rate - Last fully connected layer 20Weight L2 factor - Last fully connected layer 2Bias L2 factor - Last fully connected layer 1Momentum 0.9
Krishnaswamy R. Aravind, Purushothaman Raja, Rajendran Ashiwin and Konnaiyar V. Mukesh
Spanish Journal of Agricultural Research September 2019 • Volume 17 • Issue 3 • e0204
8
a significant number of iterations. On average, it takes about 19.6 epochs for the oscillations to fade. In the case of VGG16, the convergence reaches the maximum accuracy and minimum loss at an average of 5.4 epochs. The oscillation diminishes at an average of 16.6 epochs and maintains constant value for the remaining epochs. Mohanty et al. (2016) pointed out that convergence was achieved within 30 epochs, what is in agreement with the current study. The average time taken for execution of AlexNet was 2.1 min while for VGG16 it was approx. 23.74 min. It is not surprising that the time taken for completing the training process is greater in VGG16 compared to AlexNet, due to increase in depth of the architecture (E.C. Too, L. Yujian, S. Njuki, L. Yingchun, unpu-blished data).
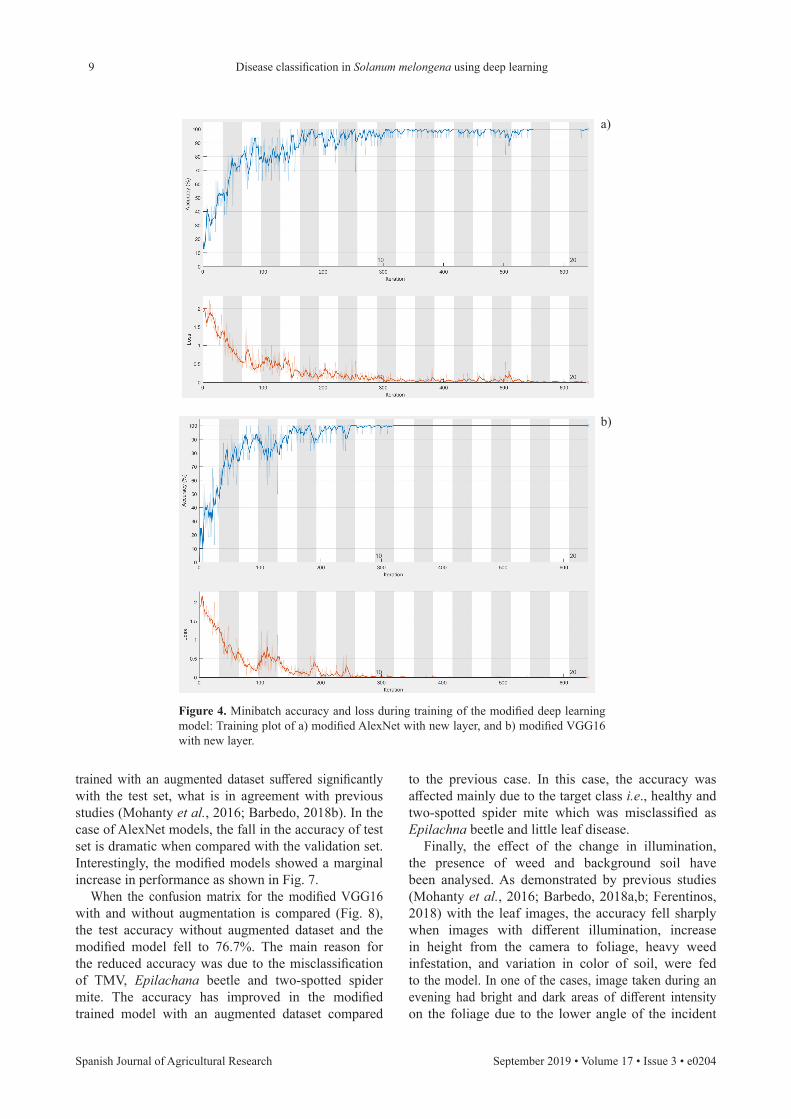
Some studies (e.g. Hunter et al., 2012) have de-monstrated an improvement in the performance when there is an increase in the number of hidden layers. Hence, intuitively a new fully connected layer with 4,096 hidden neurons was added to the original model before the last fully connected layer for evaluating its ability in classifying the disease. The sample training plot of the modified architecture with the best results for AlexNet and VGG16 is shown in Fig. 4.
Surprisingly, the modified AlexNet resulted in significant improvement with the best classification accuracy of 88.54% and an average accuracy of 83.90%, which is better than the unmodified architecture. The modified architecture increased the oscillation in the minibatch accuracy and training loss for all the trials in AlexNet. The training process requires more epochs to minimize oscillation. Although modified AlexNet had significant improvement, the modified VGG16 depicted a marginal increase in the average accuracy of 95.90% with the best classification accuracy of 96.76%. But the average number to reach a stable value was 14.2 epochs, which is better than using AlexNet and the unmodified VGG16. The average time taken for execution of modified AlexNet and VGG16 were approx. 2.72 and 53.58 min, respectively. The training time was increased as it had more learnable parameters and fully connected layers are hardware demanding.
Training of models with augmented dataset
In a previous study using Deep Convolution Neural Network (DCNN) (Ma et al., 2018), there was a sig-nificant improvement in classification accuracy after data augmentation when compared with the original data. Based on the insight, from the previous study, an augmented image dataset was used in the model. Table 4 shows the average accuracy obtained using several
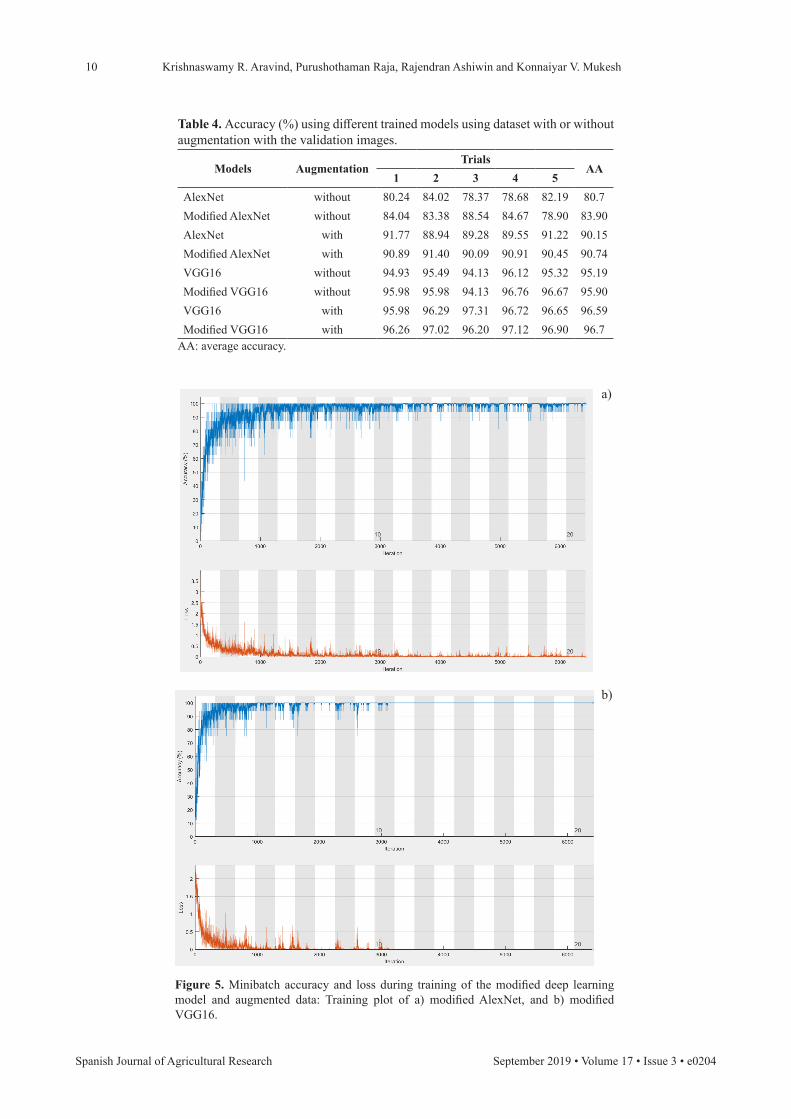
models with both datasets. The average validation accuracy of unmodified and modified AlexNet were 90.15% and 90.74%, respectively. Similarly, for VGG16, the average accuracies were 96.59% and 96.70%, respectively. While the AlexNet models showed a significant improvement, VGG16 models generated a slight improvement in accuracy, results contrary to those found by Ma et al. (2018). The loss and minibatch accuracy were close to zero and maximum respectively, relatively at lower epoch compared to the previous experiment carried out without augmentation of dataset. The oscillation has been reduced using a higher dataset with the modified architecture, as shown in Fig. 5.
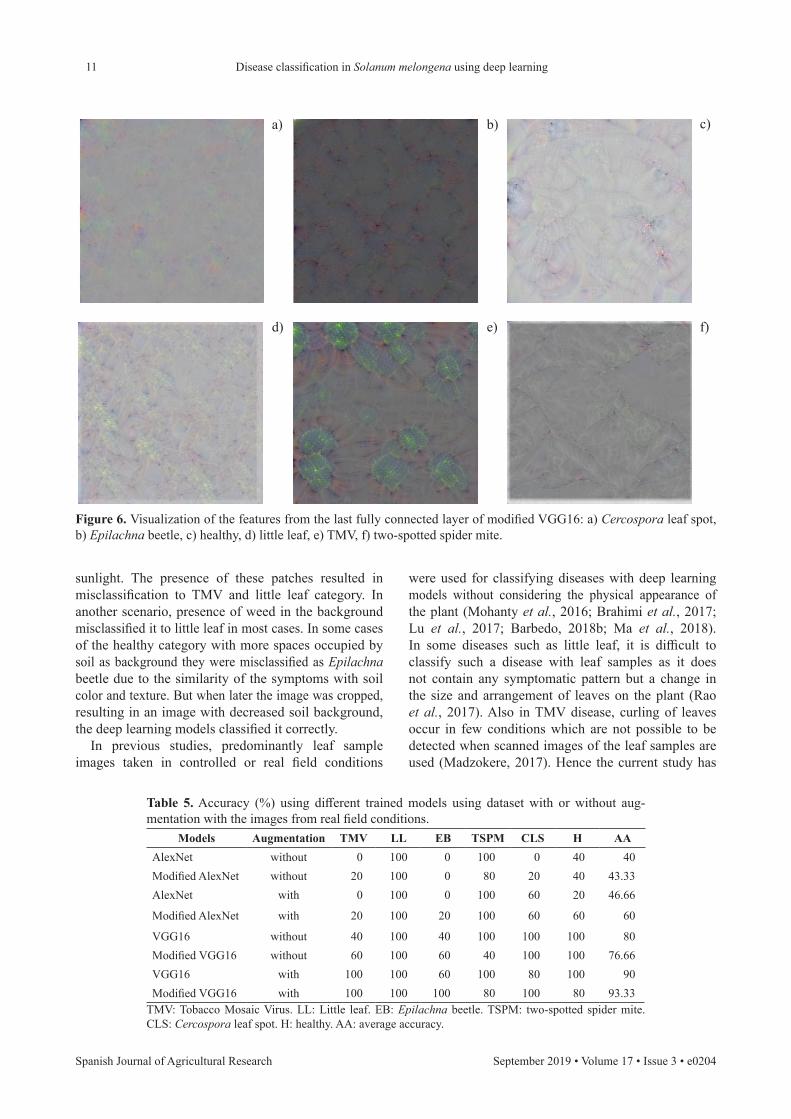
The standard deviation of modified VGG16 model without an augmented dataset is 1.053%, while with an augmented dataset is 0.43%. The standard deviation for unmodified VGG16 with augmented dataset was 0.5% which is slightly higher compared to modified VGG16. Hence modified VGG16 trained with the augmented dataset is the acceptable model with high consistency. The feature maps for each class can be extracted using the function ‘deepdreamimage’ in Matlab for visualization of the learnt features. The feature maps obtained from the newly added fully connected layer are shown in Fig. 6. The visualized features can be closely related to the symptoms of the disease which proves that the model has learnt the features for each class.
Testing of the trained models with the images in field conditions
Mohanty et al. (2016) and Barbedo (2018b) found that the accuracy drops dramatically when test samples with complex backgrounds are given to the models. In order to analyse the performance of models used in the current study, the trained and validated deep learning models were tested with images from real field conditions and were not segmented as described earlier in section “Image dataset” for this evaluation. A total of 30 images with 5 images for each class (captured using smart phones) were fed as input to the best performing modified and unmodified models. The images were taken under constant illumination but had a complex background due to factors such as either presence of absence of weeds, color of the soil, etc.
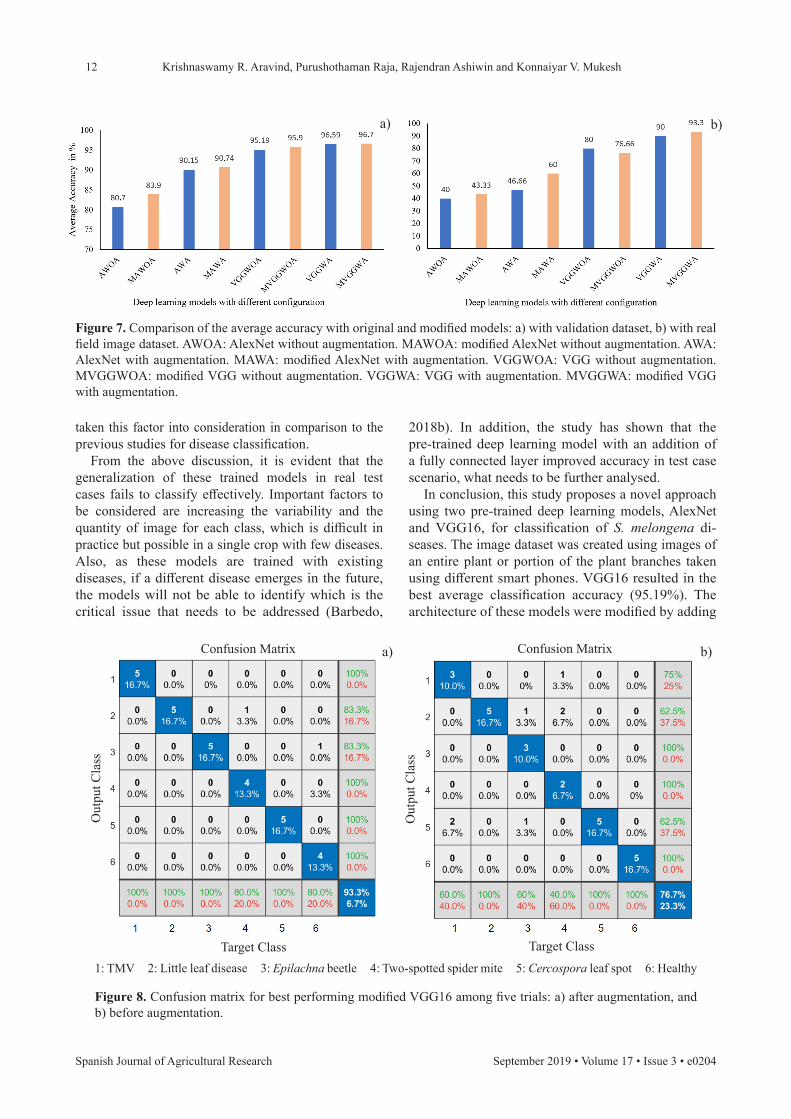
Table 5 shows the accuracy obtained using several models. The best performing model was the modified VGG16 architecture trained using the augmented da-taset with an accuracy of 93.33%. The difference bet-ween the accuracy values of validation and test case were 3.37%, whereas, with other models, the difference was much higher (Fig. 7). It is also evident that the generalization ability of models even with a constant illumination falls considerably. The models performance
Disease classification in Solanum melongena using deep learning
Spanish Journal of Agricultural Research September 2019 • Volume 17 • Issue 3 • e0204
9
trained with an augmented dataset suffered significantly with the test set, what is in agreement with previous studies (Mohanty et al., 2016; Barbedo, 2018b). In the case of AlexNet models, the fall in the accuracy of test set is dramatic when compared with the validation set. Interestingly, the modified models showed a marginal increase in performance as shown in Fig. 7.
When the confusion matrix for the modified VGG16 with and without augmentation is compared (Fig. 8), the test accuracy without augmented dataset and the modified model fell to 76.7%. The main reason for the reduced accuracy was due to the misclassification of TMV, Epilachana beetle and two-spotted spider mite. The accuracy has improved in the modified trained model with an augmented dataset compared
to the previous case. In this case, the accuracy was affected mainly due to the target class i.e., healthy and two-spotted spider mite which was misclassified as Epilachna beetle and little leaf disease.
Finally, the effect of the change in illumination, the presence of weed and background soil have been analysed. As demonstrated by previous studies (Mohanty et al., 2016; Barbedo, 2018a,b; Ferentinos, 2018) with the leaf images, the accuracy fell sharply when images with different illumination, increase in height from the camera to foliage, heavy weed infestation, and variation in color of soil, were fed to the model. In one of the cases, image taken during an evening had bright and dark areas of different intensity on the foliage due to the lower angle of the incident
a)
b)
Figure 4. Minibatch accuracy and loss during training of the modified deep learning model: Training plot of a) modified AlexNet with new layer, and b) modified VGG16 with new layer.
Krishnaswamy R. Aravind, Purushothaman Raja, Rajendran Ashiwin and Konnaiyar V. Mukesh
Spanish Journal of Agricultural Research September 2019 • Volume 17 • Issue 3 • e0204
10
a)
b)
Figure 5. Minibatch accuracy and loss during training of the modified deep learning model and augmented data: Training plot of a) modified AlexNet, and b) modified VGG16.
Table 4. Accuracy (%) using different trained models using dataset with or without augmentation with the validation images.
Models AugmentationTrials
AA1 2 3 4 5
AlexNet without 80.24 84.02 78.37 78.68 82.19 80.7Modified AlexNet without 84.04 83.38 88.54 84.67 78.90 83.90AlexNet with 91.77 88.94 89.28 89.55 91.22 90.15Modified AlexNet with 90.89 91.40 90.09 90.91 90.45 90.74VGG16 without 94.93 95.49 94.13 96.12 95.32 95.19Modified VGG16 without 95.98 95.98 94.13 96.76 96.67 95.90VGG16 with 95.98 96.29 97.31 96.72 96.65 96.59Modified VGG16 with 96.26 97.02 96.20 97.12 96.90 96.7
AA: average accuracy.
Disease classification in Solanum melongena using deep learning
Spanish Journal of Agricultural Research September 2019 • Volume 17 • Issue 3 • e0204
11
a) b) c)
d) e) f)
Figure 6. Visualization of the features from the last fully connected layer of modified VGG16: a) Cercospora leaf spot, b) Epilachna beetle, c) healthy, d) little leaf, e) TMV, f) two-spotted spider mite.
Table 5. Accuracy (%) using different trained models using dataset with or without aug-mentation with the images from real field conditions.
Models Augmentation TMV LL EB TSPM CLS H AAAlexNet without 0 100 0 100 0 40 40Modified AlexNet without 20 100 0 80 20 40 43.33AlexNet with 0 100 0 100 60 20 46.66
Modified AlexNet with 20 100 20 100 60 60 60
VGG16 without 40 100 40 100 100 100 80Modified VGG16 without 60 100 60 40 100 100 76.66VGG16 with 100 100 60 100 80 100 90Modified VGG16 with 100 100 100 80 100 80 93.33
TMV: Tobacco Mosaic Virus. LL: Little leaf. EB: Epilachna beetle. TSPM: two-spotted spider mite. CLS: Cercospora leaf spot. H: healthy. AA: average accuracy.
sunlight. The presence of these patches resulted in misclassification to TMV and little leaf category. In another scenario, presence of weed in the background misclassified it to little leaf in most cases. In some cases of the healthy category with more spaces occupied by soil as background they were misclassified as Epilachna beetle due to the similarity of the symptoms with soil color and texture. But when later the image was cropped, resulting in an image with decreased soil background, the deep learning models classified it correctly.
In previous studies, predominantly leaf sample images taken in controlled or real field conditions
were used for classifying diseases with deep learning models without considering the physical appearance of the plant (Mohanty et al., 2016; Brahimi et al., 2017; Lu et al., 2017; Barbedo, 2018b; Ma et al., 2018). In some diseases such as little leaf, it is difficult to classify such a disease with leaf samples as it does not contain any symptomatic pattern but a change in the size and arrangement of leaves on the plant (Rao et al., 2017). Also in TMV disease, curling of leaves occur in few conditions which are not possible to be detected when scanned images of the leaf samples are used (Madzokere, 2017). Hence the current study has
Krishnaswamy R. Aravind, Purushothaman Raja, Rajendran Ashiwin and Konnaiyar V. Mukesh
Spanish Journal of Agricultural Research September 2019 • Volume 17 • Issue 3 • e0204
12
a)
a)
b)
b)
Figure 7. Comparison of the average accuracy with original and modified models: a) with validation dataset, b) with real field image dataset. AWOA: AlexNet without augmentation. MAWOA: modified AlexNet without augmentation. AWA: AlexNet with augmentation. MAWA: modified AlexNet with augmentation. VGGWOA: VGG without augmentation. MVGGWOA: modified VGG without augmentation. VGGWA: VGG with augmentation. MVGGWA: modified VGG with augmentation.
Figure 8. Confusion matrix for best performing modified VGG16 among five trials: a) after augmentation, and b) before augmentation.
1: TMV 2: Little leaf disease 3: Epilachna beetle 4: Two-spotted spider mite 5: Cercospora leaf spot 6: Healthy
taken this factor into consideration in comparison to the previous studies for disease classification.
From the above discussion, it is evident that the generalization of these trained models in real test cases fails to classify effectively. Important factors to be considered are increasing the variability and the quantity of image for each class, which is difficult in practice but possible in a single crop with few diseases. Also, as these models are trained with existing diseases, if a different disease emerges in the future, the models will not be able to identify which is the critical issue that needs to be addressed (Barbedo,
2018b). In addition, the study has shown that the pre-trained deep learning model with an addition of a fully connected layer improved accuracy in test case scenario, what needs to be further analysed.
In conclusion, this study proposes a novel approach using two pre-trained deep learning models, AlexNet and VGG16, for classification of S. melongena di-seases. The image dataset was created using images of an entire plant or portion of the plant branches taken using different smart phones. VGG16 resulted in the best average classification accuracy (95.19%). The architecture of these models were modified by adding
Confusion Matrix
Target Class Target Class
Confusion Matrix
Out
put C
lass
Out
put C
lass
Disease classification in Solanum melongena using deep learning
Spanish Journal of Agricultural Research September 2019 • Volume 17 • Issue 3 • e0204
13
a fully connected layer with 4096 neurons prior to the last fully connected layer. VGG16 resulted in the best average accuracy (95.90%) compared to AlexNet with improvement in consistency of the result for five trials. In the second experiment the augmented dataset was used to train the model and the performance was evalua-ted. The modified VGG16 resulted in a best average classification accuracy (96.70%), which was slightly better than the unmodified architecture and improved consistency in results. When the test images from real field conditions were provided to the models, modified VGG16 trained with augmented dataset outperformed other models with reasonable accuracy and high consistency. The changes in illumination and the presence of background soil affected the performance of the architecture. The results have been compared and interpreted with previous studies regarding the ability of generalization of the model and its limitation on a real test scenario. In order to generalize further for the image in all the test conditions, more image dataset with different illumination properties and various background soil are required for training the model. In addition to that, more disease classes in the selected crop can be included to evaluate the deep learning models for disease classification application.
References
Agroreyo BO, Obansa ES, Obanor EO, 2012. Comparative nutritional and phytochemical analyses of two varieties of Solanum melongena. Sci World J 7 (1): 5-8.
Ali H, Lali MI, Nawaz MZ, Sharif M, Saleem BA, 2017. Symptom based automated detection of citrus diseases using color histogram and textural descriptors. Comput Electron Agric 138: 92-104. https://doi.org/10.1016/j.compag.2017.04.008
Alishiri A, Rakhshandehroo F, Zamanizadeh HR, Palukaitis P, 2013. Prevalence of tobacco mosaic virus in Iran and evolutionary analyses of the coat protein gene. Plant Pathol J 29 (3): 260-273. https://doi.org/10.5423/PPJ.OA.09.2012.0145
Aravind KR, Raja P, Aniirudh R, Mukesh KV, Ashiwin R, Vikas, 2018. Grape crop disease classification using transfer learning approach. Proc Int Conf on ISMAC in Computational Vision and Bio-Engineering, Palladam (India), May 16-17. pp: 1623-1633. https://doi.org/10.1007/978-3-030-00665-5_150
Arivazhagan S, Shebiah RN, Ananthi S, Varthini V, 2013. Detection of unhealthy region of plant leaves and classification of plant leaf diseases using texture features. Agric Eng Int: CIGR J 15 (1): 211-217.
Barbedo JGA, 2016. A review on the main challenges in automatic plant disease identification based on visible
range images. Biosyst Eng 144: 52-60. https://doi.org/10.1016/j.biosystemseng.2016.01.017
Barbedo JGA, 2018a. Factors influencing the use of deep learning for plant disease recognition. Biosyst Eng 172: 84-91. https://doi.org/10.1016/j.biosys temseng . 2018.05. 013
Barbedo JGA, 2018b. Impact of dataset size and variety on the effectiveness of deep learning and transfer learning for plant disease classification. Comput Electron Agric 153: 46-53. https://doi.org/10.1016/j.compag.2018.08.013
Barbedo JGA, Koenigkan LV, Santos TT, 2016. Identifying multiple plant diseases using digital image processing. Biosyst Eng 147: 104-116. https://doi.org/10.1016/j.biosystemseng.2016.03.012
Beale MH, Hagan MT, Demuth HB, 2018. Neural Network ToolboxTM User's Guide. The MathWorks.Inc, Natick, MA, USA.
Brahimi M, Boukhalfa K, Moussaoui A, 2017. Deep learning for tomato diseases: classification and symptoms visualization. Appl Artif Intell 31: 299-315. https://doi.org/10.1080/08839514.2017.1315516
Brahimi M, Aresenovic M, Laraba S, Sladojevic S, Boukhalfa K, Moussaoui A, 2018. Deep learning for plant diseases: Detection and saliency map visualisation. In: Human and machine learning. Human-Computer Interaction Series; Zhou J, Chen F. (eds.). pp: 93-117. Springer, Cham. https://doi.org/10.1007/978-3-319-90403-0_6
Calderón R, Navas-Cortés JA, Lucena C, Zarco-Tejada PJ, 2013. High-resolution airborne hyperspectral and thermal imagery for early detection of Verticillium wilt of olive using fluorescence, temperature and narrow-band spectral indices. Rem Sens Environ 139: 231-245. https://doi.org/10.1016/j.rse.2013.07.031
De Castro AI, Ehsani R, Ploetz R, Cran JH, Abdulridha J, 2015. Optimum spectral and geometric parameters for early detection of laurel wilt disease in avocado. Rem Sens Environ 171: 33-44. https://doi.org/10.1016/j.rse.2015.09.011
Dey AK, Sharma M, Meshram MR, 2016. Image processing based leaf rot disease, detection of betel vine (Piper Betle L.). Procedia Comput Sci 85: 747-754. https://doi.org/10.1016/j.procs.2016.05.262
Dhakad KK, 2017. Epidemiology and management of eggplant diseases in Jabalpur, Madhya Pradesh. Master's thesis. Jawaharlal Nehru Krishi Vishwa Vidyalaya, Jabalpur, India.
Ferentinos KP, 2018. Deep learning models for plant disease detection and diagnosis. Comput Electron Agr 145: 311-318. https://doi.org/10.1016/j.compag.2018.01.009
García-Ruiz F, Sankaran S, Maja JM, Lee WS, Rasmussen J, Ehsani R, 2013. Comparison of two aerial imaging platforms for identification of Huanglongbing-infected citrus trees. Comput Electron Agr 91: 106-115. https://doi.org/10.1016/j.compag.2012.12.002
Krishnaswamy R. Aravind, Purushothaman Raja, Rajendran Ashiwin and Konnaiyar V. Mukesh
Spanish Journal of Agricultural Research September 2019 • Volume 17 • Issue 3 • e0204
14
Hunter D, Yu H, Pukish MS, Kolbusz J, Wilamowski BM, 2012. Selection of proper neural network sizes and architecture- a comparative study. IEEE Trans Ind Inform 8 (2): 228-240. https://doi.org/10.1109/TII.2012.2187914
Krizhevsky A, Sutskever I, Hinton GE, 2012. Imagenet classification with deep convolution neural networks. Proc of Advances in Neural Information Processing Systems, Lake Tahoe (USA), May 3-8. pp: 1097-1105.
Kruse OMO, Montalbán JMP, Indahl UG, Kvaal K, Ferrer A, Futsaether CM, 2014. Pixel classification methods for identifying and quantifying leaf surface injury from digital images. Comput Electron Agr 108: 155-165. https://doi.org/10.1016/j.compag.2014.07.010
Liu B, Zhang Y, He D, Li Y, 2018. Identification of apple leaf diseases based on deep convolutional neural net-works. Symmetry 10 (1): 11. https://doi.org/10.3390/sym-10010011
Lu Y, Yi S, Zeng N, Liu Y, Zhang Y, 2017. Identification of rice disease using deep convolutional neural networks. Neuro Comput 267: 378-384. https://doi.org/10.1016/j.neucom.2017.06.023
Ma J, Du K, Zheng F, Zhang L, Gong Z, Sun Z, 2018. A recognition method for cucumber disease using leaf symptom images based on deep convolutional neural network. Comput Electron Agr 154:18-24. https://doi.org/10.1016/j.compag.2018.08.048
Madzokere ET, 2017. History of the emergence and spatiotemporal spread of tobacco mosaic virus in China. Virol Mycol 6 (2): Art ID 171.
Mohanchander P, Reegan AD, Rahman MAU, Raveen RS, 2013. Effect of hadda beetle, Epliachna vigintioctopunctata Fab. (Coleoptera: Coccinellidae) infestation on eggplant leaf (Solanum melongena L.) and bio-control potential of essential oil formulations. Pak J Biol Sci 16 (19): 991-997. https://doi.org/10.3923/pjbs.2013.991.997
Mohanty SP, Hughes DP, Salathe M, 2016. Using deep learning for image-based plant disease detection. Front Plant Sci 7: Art ID 149. https://doi.org/10.3389/fpls.2016.01419
Pilli SK, Nallathambi B, George SJ, Diwanji V, 2014. eAGROBOT - A robot for early crop disease detection using image processing. IEEE Int Conf on Electronics and Communication Systems; February. pp: 1-6. https://doi.org/10.1109/ECS.2014.7090754
Polder G, van der Heijden GWAM, van Doorn J, Baltissen TAHMC, 2014. Automatic detection of tulip breaking virus (TBV) in tulip fields using machine vision. Biosyst Eng 117: 35-42. https://doi.org/10.1016/j.bio-systemseng.2013.05.010
Ramaraju K, 2004. Evaluation of acaricides and TNAU neem oils against spider mite, Tetranychus urticae (Koch) on bhendi and brinjal. Madras Agric J 91: 7-12.
Rao GP, Madhupriya, Thorat V, Manimekalai R, Tiwari AK, Yadav A, 2017. A century progress of research on phytoplasma disease in India. Phytopathog Mollicutes 7 (1): 1-38. https://doi.org/10.5958/2249-4677.2017.00001.9
Salgadoe ASA, Robson AJ, Lamb DW, Dann EK, Searle C, 2018. Quantifying the severity of phytophthora root rot disease in avocado tress using image analysis. Rem Sens 10 (2): 226. https://doi.org/10.3390/rs10020226
Schor N, Bechar A, Ignat T, Dombrovsky A, Elad Y, Bermann S, 2016. Robotic disease detection in greenhouse: Combined detection of powdery mildew and tomato spot-ted wilt virus. IEEE Robot Autom Lett 1 (1): 354-360. https://doi.org/10.1109/LRA.2016.2518214
Shazly MAE, Abagy EME, Aly AME, Youssef SA, 2016. Identification and molecular characterization of little leaf disease associated with Phytoplasma on sugar beet (Beta Vulgaris L.) plants in Egypt. Middle East J Appl Sci 6 (4): 1054-1065.
Simonyan K, Zisserman A, 2014. Very deep convolutional networks for large-scale image recognition. Int Conf on Learning Representations. April. http://arxiv.org/abs/1409.1556
Srinivasan R, 2009. Insect and mite pests on egg plants: A field guide for identification and management, AVRDC - The World Vegetable Center, Shanhua, Taiwan, AVRDC Publication No 09-729. 64 pp.
Srivastava N, Hinton G, Krizhevsky A, Sutskever I, Sala-khutdinov R, 2015. Dropout: a simple way to prevent neural network from overfitting. J Mach Learn 15: 1929-1958.
Srivastava S, Nelson S, 2012. Cercospora leaf spot of eggplant. Plant Dis 82: 1-5.
Story D, Kacira M, 2015. Design and implementation of a computer vision-guided greenhouse crop diagnostics system. Mach Vis Appl 26: 495-506. https://doi.org/10.1007/s00138-015-0670-5
Strange RN, Scott PR, 2005. Plant disease: A threat to global food security. Annu Rev Phytopathol 43: 83-116. https://doi.org/10.1146/annurev.phyto.43.113004.133839
Zhang S, Wu X, You Z, Zhang L, 2017. Leaf image based cucumber disease recognition using sparse representation classification. Comput Electron Agr 134: 135-141. https://doi.org/10.1016/j.compag.2017.01.014
Zhou R, Kaneko S, Tanaka F, Kayamori M, Shimizu M, 2014. Disease detection of Cercospora leaf spot in sugar beet by robust template matching. Comput Electron Agr 108: 58-70. https://doi.org/10.1016/j.compag.2014.07.004