Embed Size (px)
DESCRIPTION
Disease prediction based on big data analytics
Citation preview

Disease Prediction Based on Prior Knowledge
Gregoe Stiglic, Igor Pernek, Peter KokolFacuty of Health Sciences
University of MariborSlovania
Zoran ObradovicCenter for Information Science and
Technology, Temple University, Philadelphia, USA
ACM SIGKDD Workshop on Health Informatics (HI-KDD 2012) August 12, 2012

OutlineBackgroundObjectivesEvolutionDisease networksSVMExperimental setupClass-imbalanced dataClassificationExperimentsStability

Background
Patient Name asthma Blood
PressureProstate Cancer Diabetes Heart
Failure
Michael 1 1 0 0 ?

Objectives Using prior knowledge from human disease networks to
lower the burden of building classifiers
Estimation of disease risk from hospital discharge data optimally
Enhancing Support Vector Machine – Recursive Feature Elimination(SVM-RFE) approach to Support Vector Machine- Reweighted Recursive Feature Elimination (SVM-RRFE)

Evolution1. Bringing health data into digital form
2. Increasing acceptance of electronic health records (comparing patients)
3. Constructing disease related networks
4. Increasing amount of studies in the application of data mining approaches in this field

Methods of integrating network knowledge Network centric:focuses on mapping gene/disease expression data onto a network and uses techniques from network analysis to select the important genes/diseases.
Data centric:Focuses on machine learning techniques where prior knowledge from biological networks is used to bias the feature selection process toward strongly connected genes/diseases. (Such as SVM-RRFE)

SVM used for classification and constructs a hyperplane or sets of hyperplanes in high dimensional space which divide data to two separate classes.
Hyperplane should divide the classes with the largest distance to the nearest training data point of any class.
SVM

Two basic concepts that are used when constructing disease networks
Morbidity:• Represents the support for a single diagnosis in
the given population.
Co-morbidity:• Represents the support for co-occurrence of two
diseases.
common measures for calculating relations
Weight:
Relative Risk:
Phi:
SVM-RFE
SVM-RRFE
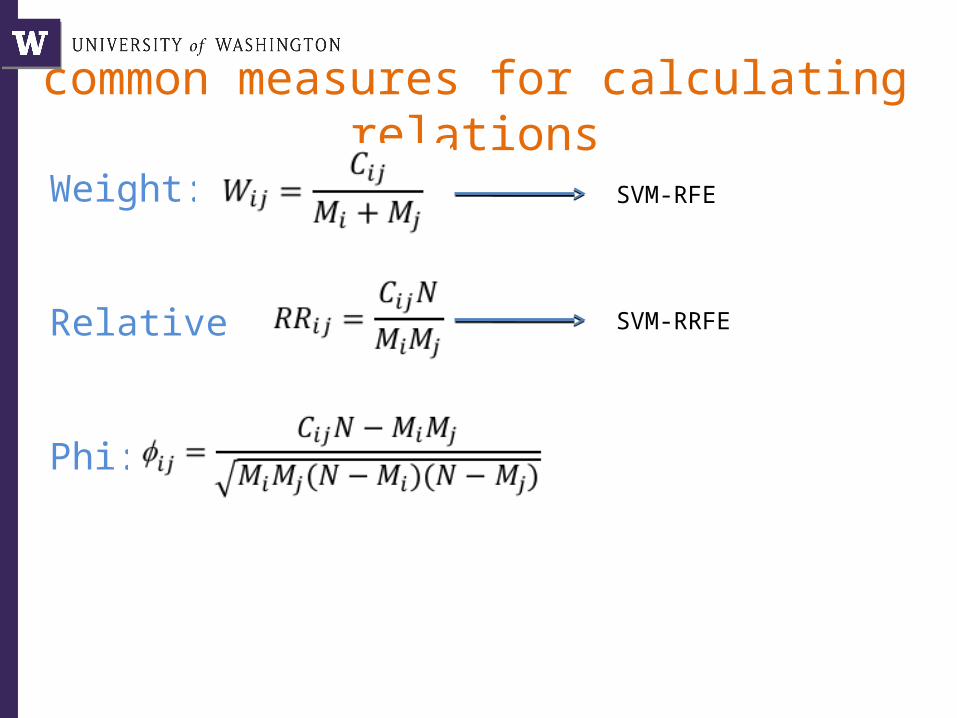
Experimental setupHealthcare Cost and Utilization Project (HCUP)Agency for Healthcare Research and QualityNationwide Inpatient Sample (NIS)
• 20% of US hospitals
Data for the adult population from year 2008 for network construction.
Data for the adult population from year 2009 for model evaluation.
6,840,196 discharge records in 2008.6,546,273 discharge records in 2009.

Experimental setupEach record contains:Personal characteristics of a patient
• Age• Gender• Race
Administrative information:• Length of stay• Discharge status
Medical information:• Diagnoses codes (ICD-9-CM)• Surgical and nonsurgical procedures

Experimental setup ICD-9-CM:
• The International Classification of Diseases, 9th Revision, Clinical modification.
• Uses taxonomy of 5-digit codes.• First 3 digits represent the general diagnosis• 2 additional digits describe more detailed subgroup
of the general diagnosis.
14,000 diagnosis codes in dataset After removing the codes that were not used in data
from 2009, there are 11,170 codes.
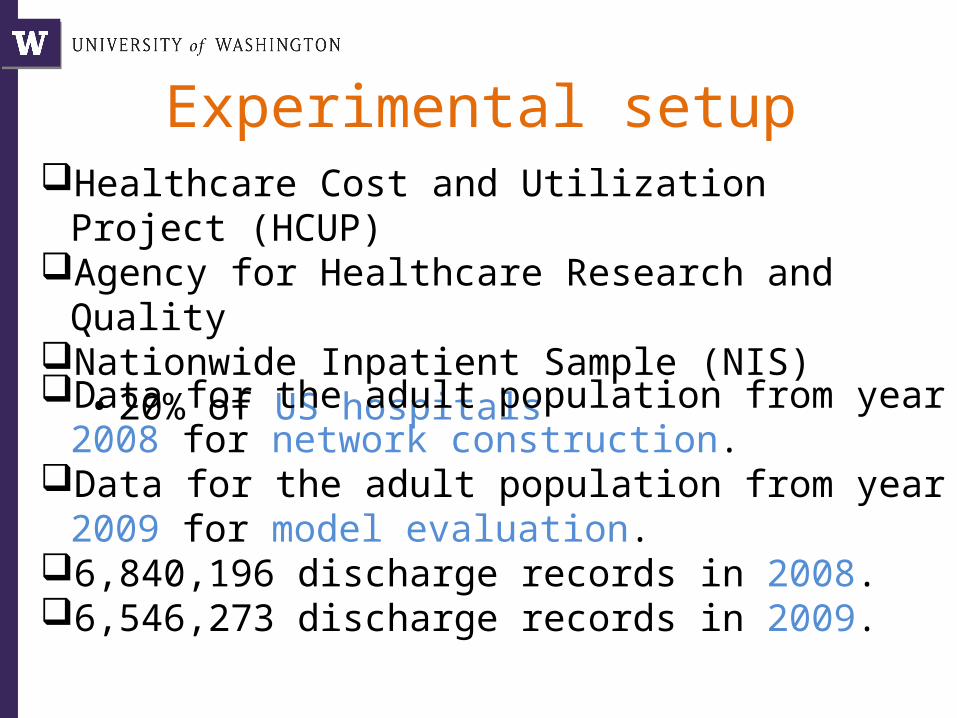
Experimental setupAge group frequency for both 2008 and 2009
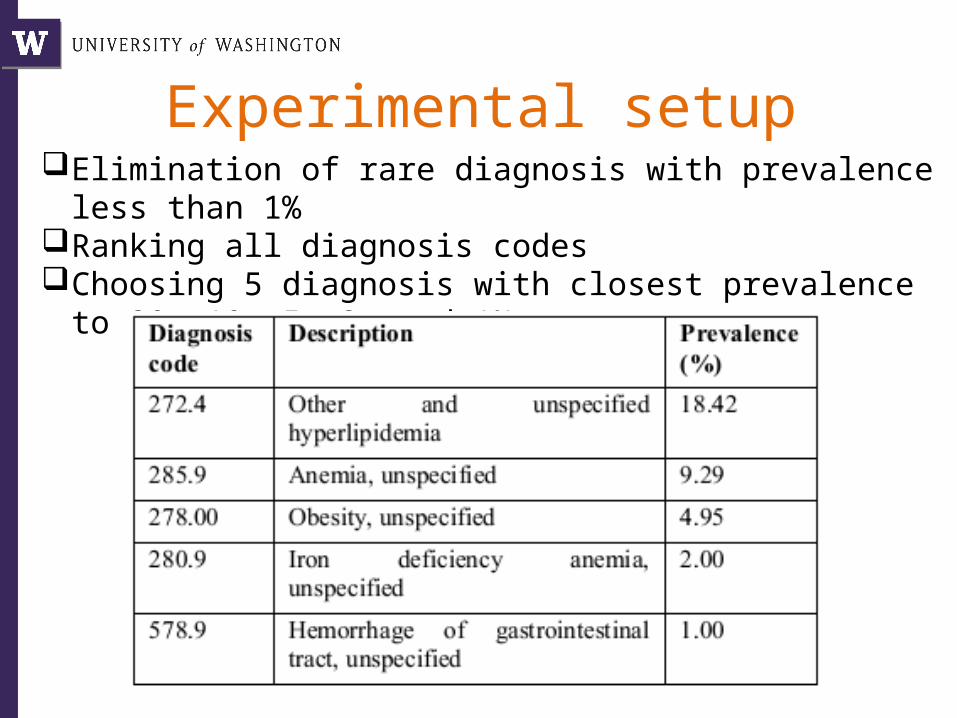
Experimental setupElimination of rare diagnosis with prevalence less than 1%Ranking all diagnosis codesChoosing 5 diagnosis with closest prevalence to 20, 10, 5, 2, and 1%
Class-imbalanced dataThis problem occurs when we have a dataset with a small number of positive (target class) samples and a much larger number of negative samples.
Solutions:• Undersampling• Oversampling
After balancing, classification performance increases.

Experimental setupRepeated random subsampling:•Selecting 10,000 samples randomly in each iteration for testing•In the first experience in training, they use train set with balanced samples. •In the second experience in training, they use train set that 75% of its samples are positive and 25% of samples are negative.•Each random subsampling evaluation was repeated 10 times for all target diagnosis codes.
Experimental setupFeature elimination:
•In first experience, they eliminate 10% of low impact features (those with the lowest RR measure) in each iteration.
•In second experience, they eliminate 50% of low impact features in each iteration.

Experimental setup
Balanced Subsampling(50% positive – 50% negative)• Feature elimination with 10% removal rate• Feature elimination with 50% removal rate
Imbalanced subsampling(75% positive – 25% negative)• Feature elimination with 10% removal rate• Feature elimination with 50% removal rate
datasetdataset
test settest set
test final model
test final model
train settrain set
train SVMtrain SVM
are features
left?
are features
left?
sort features
sort features
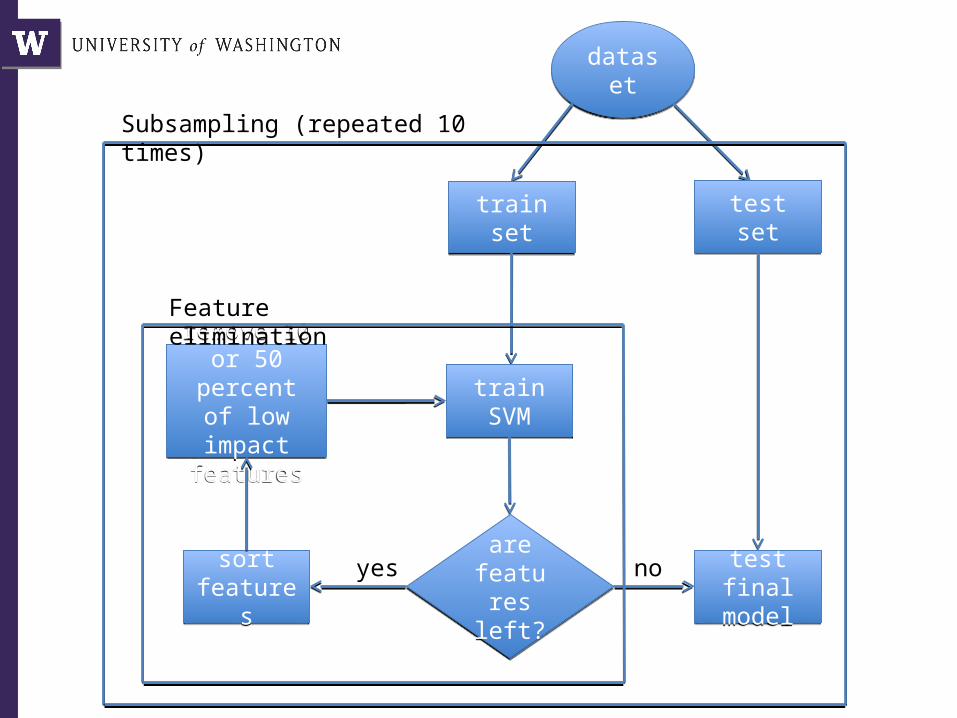
remove 10 or 50 percent of
low impact features
remove 10 or 50 percent of
low impact features
yes no
Subsampling (repeated 10 times)
Feature elimination

ClassificationComparison of AUC for SVM-RRFE and SVM-RFE with 10% removal rate.

ClassificationComparison of AUC for SVM-RRFE and SVM-RFE with 50% removal rate.

Experiments In the case of hospital discharge classification, it is crucial to
use less complex and faster methods. So here the case of 50% removal rate, improves the performance of classification.
In the case of 10% removal rate, the differences in AUC between RFE and RRFE is not significant, but in the case of 50% removal it is significant.
Testing RRFE on another large dataset from 2000 to 2008 shows that a larger network does not produce significantly better results in classification performance.
Using less complex and more recent disease network does not significantly impact the classification performance.
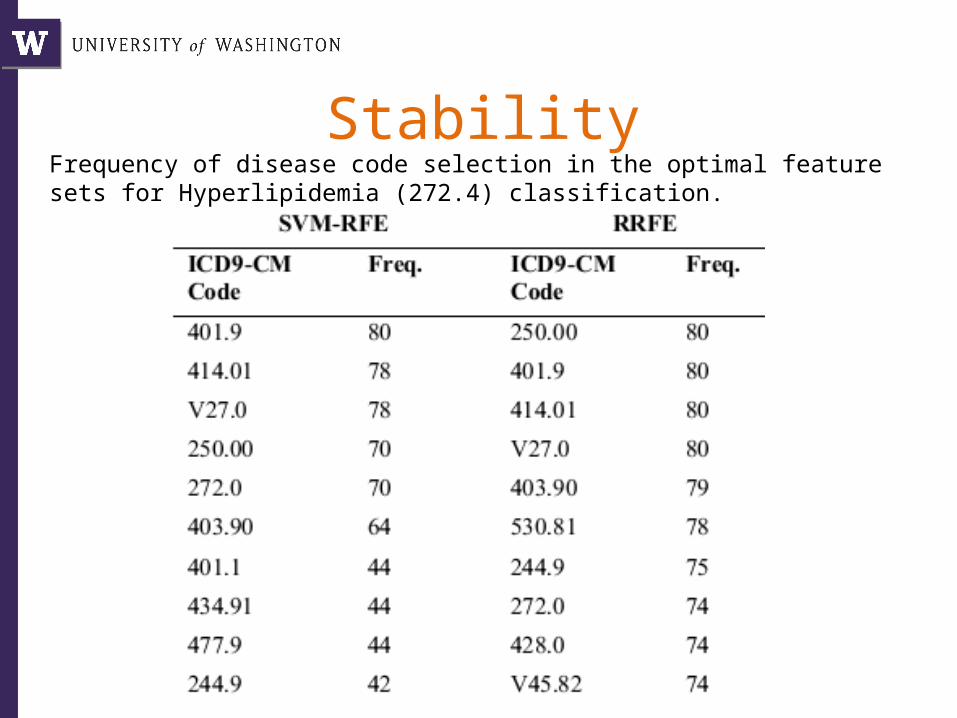
StabilityFrequency of disease code selection in the optimal feature sets for Hyperlipidemia (272.4) classification.

ConclusionAdaptation of the RRFE method for feature selection
in imbalanced high-dimensional hospital discharge data.
Observe significant improvements of classification performance when large batches of features are eliminated.
After evaluation of classification performance of the proposed solution, it would be possible to use it in combination with another classification model.