Embed Size (px)
Citation preview
i
Project Title
The design and development of an ADR3 Sports Prototype suspension with use of
ADAMS
Module Number
U04599
Student Number
10007274
Name
Jamie French
Supervisor
Douglas Higgison
Date
23/04/2014

ii
Contents
List of Figures .............................................................................................................. iii List of Tables, Graph .................................................................................................... iv List of Symbols and Abbreviations................................................................................ v
Abstract ......................................................................................................................... vi Acknowledgements ...................................................................................................... vii 1. Introduction ................................................................................................................ 1
1.1 Aims and Objectives ............................................................................................ 2
2. Literature Review...................................................................................................... 3 2.1 Tyres .................................................................................................................... 3
2.2 Suspension Geometry .......................................................................................... 5
2.3 Adams modelling ................................................................................................. 9
2.4 Data Collection .................................................................................................. 10
2.5 Summary ............................................................................................................ 11
3. METHODOLOGY .................................................................................................. 13 3.1 Collecting Car Data............................................................................................ 13
Finding the CG ..................................................................................................... 13
3.2 Damper Settings ................................................................................................. 17
3.3 Rear Suspension ................................................................................................. 18
Roll Centre ........................................................................................................... 18
Jacking Forces ...................................................................................................... 19
Camber ................................................................................................................. 19
Anti-Squat ............................................................................................................ 20
Anti-Roll bar ........................................................................................................ 21
Installation Ratio .................................................................................................. 22
3.4 ADAMS ............................................................................................................. 23
3.5 Damper and Spring Optimisation ...................................................................... 25
3.6 Comparing Data ................................................................................................. 27
3.7 Summary ............................................................................................................ 28
4. Rear Suspension Design .......................................................................................... 29 4.1 Initial Rear Suspension Design .......................................................................... 29
4.2 ARB design ........................................................................................................ 30
4.3 ARB summary ................................................................................................... 34
4.4 Final Design and Layout .................................................................................... 34
4.5 2D Models .......................................................................................................... 35
4.6 Rocker Design .................................................................................................... 37
5. ADR Data................................................................................................................. 38
5.1 Centre of Gravity position calculation ............................................................... 38
5.2 ADR Suspension Points ..................................................................................... 39
5.3 ADR3 Car data ................................................................................................... 41
iii
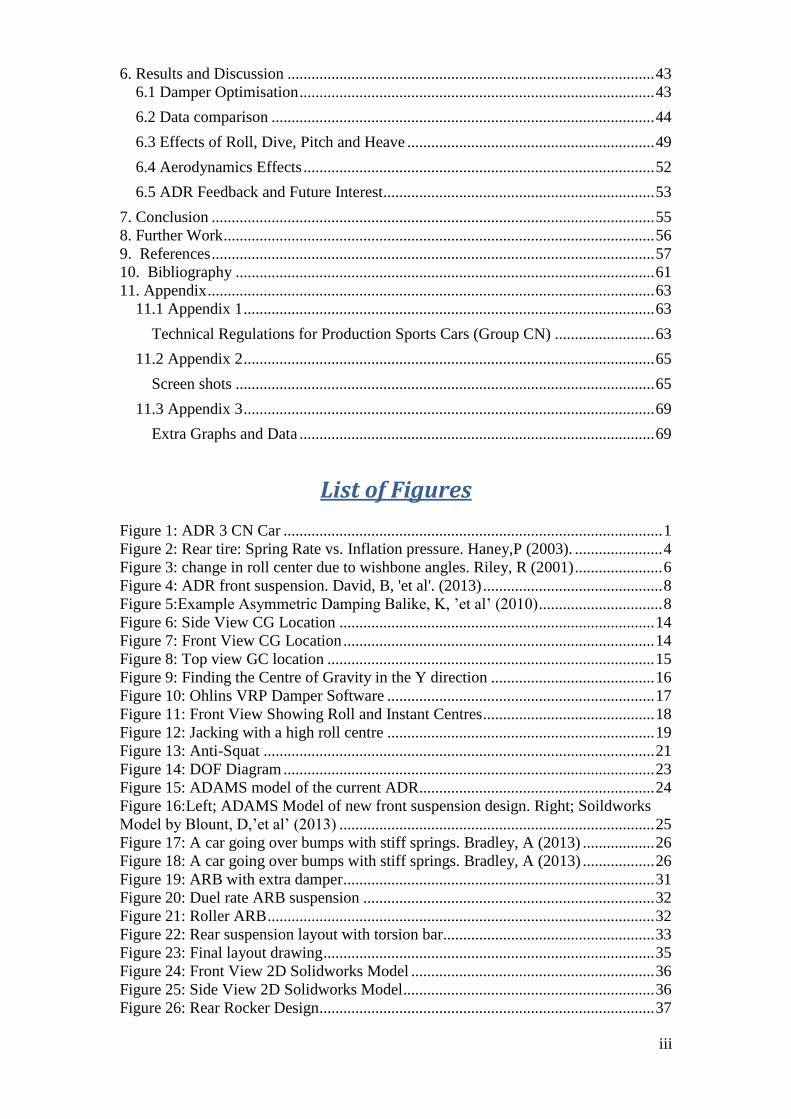
6. Results and Discussion ............................................................................................ 43 6.1 Damper Optimisation ......................................................................................... 43
6.2 Data comparison ................................................................................................ 44
6.3 Effects of Roll, Dive, Pitch and Heave .............................................................. 49
6.4 Aerodynamics Effects ........................................................................................ 52
6.5 ADR Feedback and Future Interest .................................................................... 53
7. Conclusion ............................................................................................................... 55 8. Further Work ............................................................................................................ 56 9. References ............................................................................................................... 57 10. Bibliography ......................................................................................................... 61 11. Appendix ................................................................................................................ 63
11.1 Appendix 1 ....................................................................................................... 63
Technical Regulations for Production Sports Cars (Group CN) ......................... 63
11.2 Appendix 2 ....................................................................................................... 65
Screen shots ......................................................................................................... 65
11.3 Appendix 3 ....................................................................................................... 69
Extra Graphs and Data ......................................................................................... 69
List of Figures
Figure 1: ADR 3 CN Car ............................................................................................... 1 Figure 2: Rear tire: Spring Rate vs. Inflation pressure. Haney,P (2003). ...................... 4
Figure 3: change in roll center due to wishbone angles. Riley, R (2001) ...................... 6 Figure 4: ADR front suspension. David, B, 'et al'. (2013) ............................................. 8 Figure 5:Example Asymmetric Damping Balike, K, ’et al’ (2010) ............................... 8
Figure 6: Side View CG Location ............................................................................... 14 Figure 7: Front View CG Location .............................................................................. 14
Figure 8: Top view GC location .................................................................................. 15
Figure 9: Finding the Centre of Gravity in the Y direction ......................................... 16 Figure 10: Ohlins VRP Damper Software ................................................................... 17
Figure 11: Front View Showing Roll and Instant Centres ........................................... 18 Figure 12: Jacking with a high roll centre ................................................................... 19
Figure 13: Anti-Squat .................................................................................................. 21 Figure 14: DOF Diagram ............................................................................................. 23 Figure 15: ADAMS model of the current ADR........................................................... 24
Figure 16:Left; ADAMS Model of new front suspension design. Right; Soildworks
Model by Blount, D,’et al’ (2013) ............................................................................... 25
Figure 17: A car going over bumps with stiff springs. Bradley, A (2013) .................. 26 Figure 18: A car going over bumps with stiff springs. Bradley, A (2013) .................. 26 Figure 19: ARB with extra damper .............................................................................. 31
Figure 20: Duel rate ARB suspension ......................................................................... 32 Figure 21: Roller ARB ................................................................................................. 32
Figure 22: Rear suspension layout with torsion bar..................................................... 33 Figure 23: Final layout drawing ................................................................................... 35
Figure 24: Front View 2D Solidworks Model ............................................................. 36 Figure 25: Side View 2D Solidworks Model ............................................................... 36 Figure 26: Rear Rocker Design .................................................................................... 37

iv
Figure 27: 2D Rocker Design ...................................................................................... 37 Figure 28: Centre of Gravity Position Calculator (Zoomed in screenshots can be found
in Appendix 2. .............................................................................................................. 39 Figure 29: Current ADR damper settings plotted on Ohlins VPR software ................ 42
Figure 30: Front suspension hard points in ADAMS .................................................. 65 Figure 31: Front Right suspension of the current ADR in ADAMS ........................... 65 Figure 32: The front of the current ADR in ADAMS ................................................. 66 Figure 33: Rear Suspension in ADAMS of the current ADR suspension ................... 66 Figure 34: Rear design built in ADAMS ..................................................................... 67
Figure 35: Complete assembly of the new suspension design in ADAMS ................. 67 Figure 36: Body, Hub and CPL for the current ADR3 ................................................ 68 Figure 37: Front Damper Optimisation for the ADR3................................................. 69 Figure 38: Front Damper Optimisation for the New Design ....................................... 69 Figure 39: Rear Damper Optimisation for the current ADR3 ..................................... 70
Figure 40: Rear Damper Optimisation for the New Design ........................................ 70
List of Tables, Graph
Graph 1: Slip Angle against lateral force for a Goodyear GT-S P215/60 R15 .............. 3
Graph 2: Slip against cornering force from AVON tyre data ........................................ 4
Graph 3: Input displacement wave .............................................................................. 25 Graph 4: Damper Optimisation for the front suspension of the new design using a
70N/m spring ............................................................................................................... 43
Graph 5: Front Bode Mode .......................................................................................... 45
Graph 6: Front Hub Mode............................................................................................ 45 Graph 7: Front CLP variation ...................................................................................... 46 Graph 8: Rear Body Mode ........................................................................................... 46
Graph 9: Rear Hub Mode ............................................................................................. 47 Graph 10: Rear CPL Variation .................................................................................... 47
Graph 11: Body Roll Angle 1.5G Cornering ............................................................... 50 Graph 12: Front Dive 2G Braking ............................................................................... 51 Graph 13: Rear Squat, 1G Acceleration ...................................................................... 51
Graph 14: Ride Height graph at the front with max aero loads ................................... 53 Graph 15: Ride Height graph at the rear with max aero loads ..................................... 53
Table 1: Changeable variables for AVON tyre data ...................................................... 4
Table 2: Key for Table 3 ................................................................................................ 5 Table 3: Suspension changes due to wishbone geometry. Crahan, T (1994). ............... 5
Table 4: Key for Formals 12,13 & 14 .......................................................................... 17 Table 5: Key for Figure 14........................................................................................... 23 Table 6: ARB Design Matrix ....................................................................................... 34 Table 7: Front Right Suspension Hardpoints ............................................................... 40 Table 8: Rear Right Suspension Hardpoints ................................................................ 40
Table 9: ADR Data ...................................................................................................... 41 Table 10: Damper Optimisation settings ..................................................................... 43 Table 11: Damper Optimisation on the Current ADR3 ............................................... 48 Table 12: Improvement percentages between the two models .................................... 48
Table 13: Roll, Dive and Squat changes ...................................................................... 52 Table 14: Centre of gravity calculator Zoom in Bottom Left ...................................... 71 Table 15: Centre of gravity calculator Zoom in Bottom Right .................................... 71

v
List of Symbols and Abbreviations
2D – Two Dimensional
3D – Three Dimensional
4PR – four post rig
ADAMS – Automated Dynamic Analysis of Mechanical Systems (MSC
Software)
ADR – Adrian Daniel’s Racing
ARB – Anti Roll Bar
AVD – Automobilclub Von Deutschland
BHP – Brake Horse Power
BRSCC – British Racing and Sports Car Club
CAD – Computer Aided Design
CG – Center of Gravity
CPL – Contact Patch Load
FVSA - Front view swing arm
FWD – Front Wheel Drive
IC – Instant Centre
MSVR – Motor Sport Vision Racing
RC – Roll Centre
RWD – Rear Wheel Drive
SAE – Society of Automotive Engineers
SCCA – The Sports Car Club of America
SLA – Short – Long Arm
SVSA – Side view swing arm
TW – Track Width
VRP – Valving Reference Program (Ohlins software)
WB – Wheel Base
vi
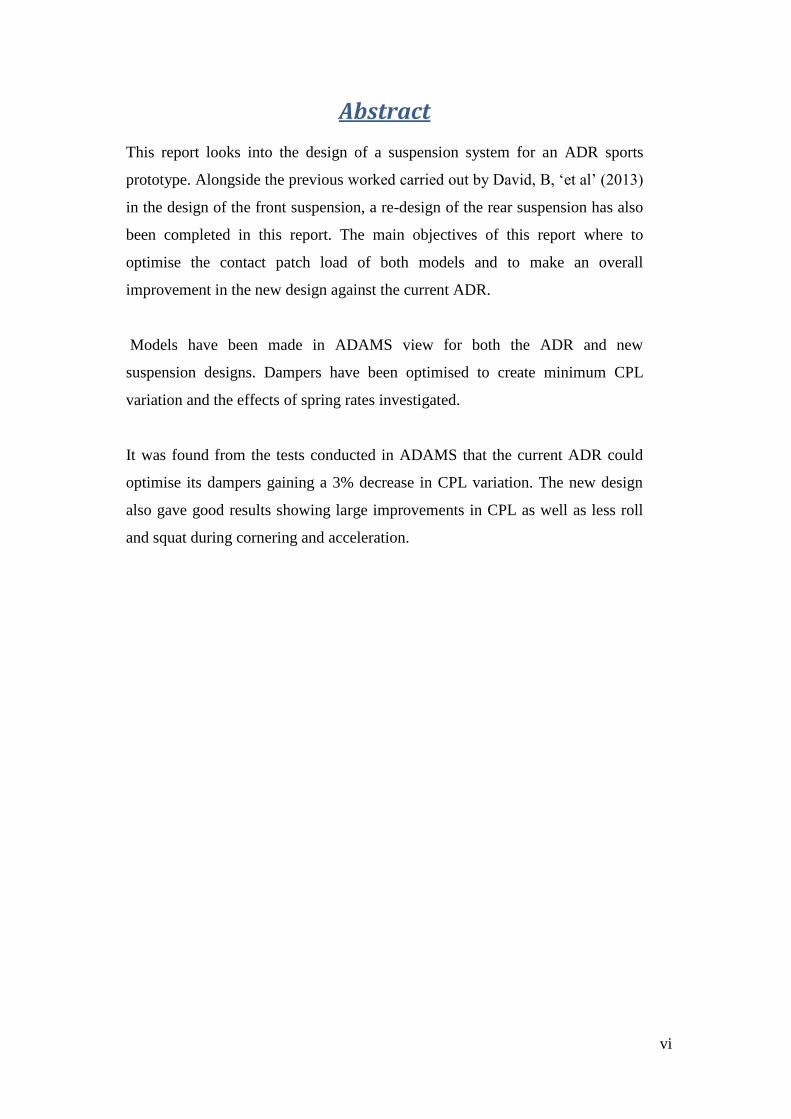
Abstract
This report looks into the design of a suspension system for an ADR sports
prototype. Alongside the previous worked carried out by David, B, ‘et al’ (2013)
in the design of the front suspension, a re-design of the rear suspension has also
been completed in this report. The main objectives of this report where to
optimise the contact patch load of both models and to make an overall
improvement in the new design against the current ADR.
Models have been made in ADAMS view for both the ADR and new
suspension designs. Dampers have been optimised to create minimum CPL
variation and the effects of spring rates investigated.
It was found from the tests conducted in ADAMS that the current ADR could
optimise its dampers gaining a 3% decrease in CPL variation. The new design
also gave good results showing large improvements in CPL as well as less roll
and squat during cornering and acceleration.

vii
Acknowledgements
I would first of all like to give a special thanks to Mr Douglas Higginson for is
continuous advice and time through this report as my supervisor. Dr James
Bawkil was especially helpful in give constructional feedback from the project
plan and interim reports. He majorly contributed to the direction of the report
and has given supportive advice and extra notes on ADAMS software and
vehicle dynamics.
Mr Andrew Bradley has massively helped to improve my knowledge of
ADAMS and vehicle dynamics both in and outside of lectures. His four post rig
training also gave me the extra information that was needed, as well training me
to a standard where the equipment could be run by myself. Oxford Brookes
University as a whole have been extremely accommodating, making software
and equipment easily available even out of the university’s opening hours.
ADR, and particularly Adrian Daniels a director and founder of the company
have been enormously helpful from start to finish. They were more than happy
to give me unlimited access to the ADR’s as well as all their data and design
information. Adrian has been very interested in the report and always eager to
hear about its process.
A final thank you would like to be aimed at fellow students at Oxford Brookes
University, whose hard work went into the group project during the 2nd
year
module U04526, Mechanical Engineering and Computer Aided Engineering.
This includes; David Blount, Will Childs, Mark Cooper, James Fewkes, and
Bradly Smith for their contribution in the design of the front end suspension
which is referred to throughout this report.
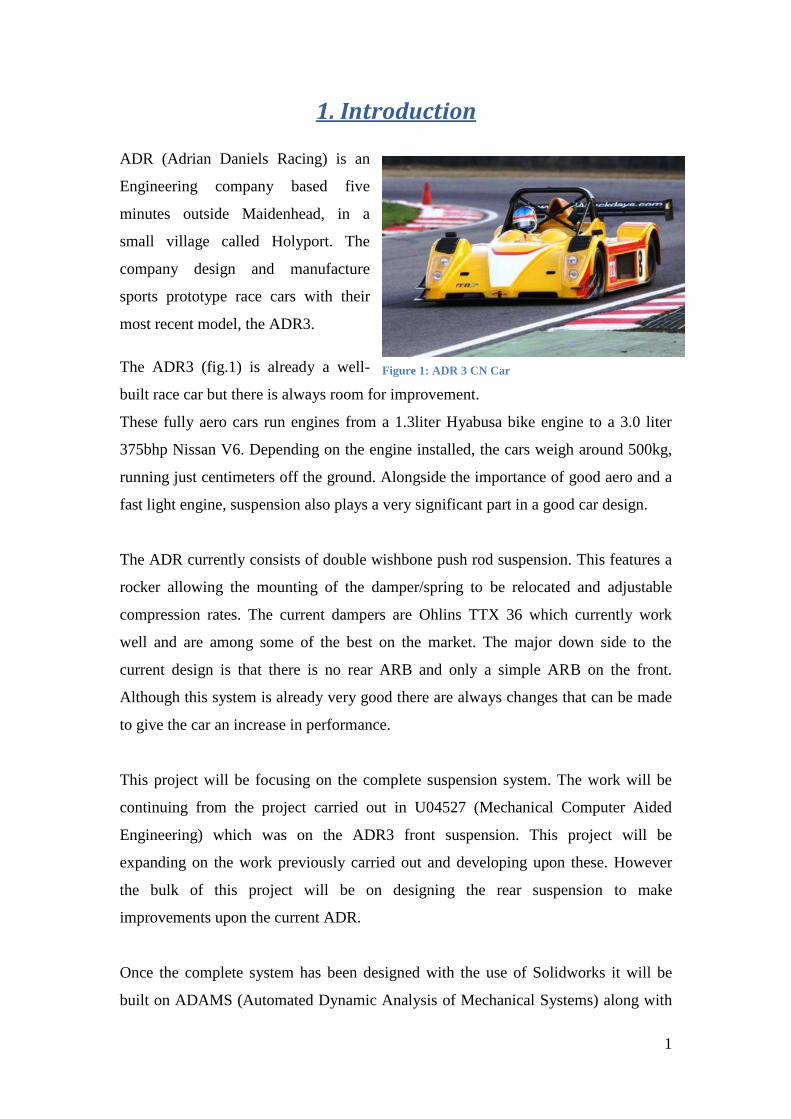
1
1. Introduction ADR (Adrian Daniels Racing) is an
Engineering company based five
minutes outside Maidenhead, in a
small village called Holyport. The
company design and manufacture
sports prototype race cars with their
most recent model, the ADR3.
The ADR3 (fig.1) is already a well-
built race car but there is always room for improvement.
These fully aero cars run engines from a 1.3liter Hyabusa bike engine to a 3.0 liter
375bhp Nissan V6. Depending on the engine installed, the cars weigh around 500kg,
running just centimeters off the ground. Alongside the importance of good aero and a
fast light engine, suspension also plays a very significant part in a good car design.
The ADR currently consists of double wishbone push rod suspension. This features a
rocker allowing the mounting of the damper/spring to be relocated and adjustable
compression rates. The current dampers are Ohlins TTX 36 which currently work
well and are among some of the best on the market. The major down side to the
current design is that there is no rear ARB and only a simple ARB on the front.
Although this system is already very good there are always changes that can be made
to give the car an increase in performance.
This project will be focusing on the complete suspension system. The work will be
continuing from the project carried out in U04527 (Mechanical Computer Aided
Engineering) which was on the ADR3 front suspension. This project will be
expanding on the work previously carried out and developing upon these. However
the bulk of this project will be on designing the rear suspension to make
improvements upon the current ADR.
Once the complete system has been designed with the use of Solidworks it will be
built on ADAMS (Automated Dynamic Analysis of Mechanical Systems) along with
Figure 1: ADR 3 CN Car
2
the front design and current ADR3. Simulations can then be run to show if the altered
design is a success and where performance increases are. However the cost to
performance ratio will also have to be kept in mind. At the end of the project a
presentation will be given to ADR directors to see if they would be happy to invest in
the design for further design and analysis with the intension of manufacturing.
1.1 Aims and Objectives
The main object of this report is to use ADAMS to validate the improvements of
theoretical designs against the current ADR3. Alongside this the current ADR3
dampers will be optimised and a new rear suspension layout constructed. The main
aims are listed below;
Build the current ADR3 suspension in ADAMS using measurements taken
from the car by January 2014. The CG will also need to be located to make the
model preform with more accuracy.
Optimise the dampers from the standard factory settings to give a 4% decrease
in CPL variation
Redesign the rear suspension to include the possibilities of a rear anti-roll bar
being added as well as making a 5% decrease in roll and squat to optimise
aerodynamics.
Show an improvement in CPL variation of 8% in the new design including the
front end design previously designed by Blount, D,’et al’ (2013).
Use the results from the aims listed above to give a business report to the
directors of ADR to receive feedback with the aim of investment to continue
the design in preparation for it to feature on the next generation of ADR.
3
2. Literature Review
‘There are many other aspects of interrelated characteristics where improvements in
one aspect of the design cause severe deterioration in another’ (Bastow,D and
Howard, G 1993, p.30). This quote sums up well the difficulty in designing
suspension components. Many suspensions systems effect each other even when only
small changes are made. This means it is vital to design components that work
together with the entire design. A lot of suspension design is about compromise, as
creating a perfect system near to impossible without the use of active suspension. It is
down to the designer to pick which
properties are the most important.
2.1 Tyres
Although tyres will not be looked into
as an individual part in this report they
do play a massive effect in how the car
will handle. From knowing the tyre
data we can work out how a car will
perform in lateral acceleration and
deceleration as well as the point at
which the tyres will start to slip, creating under or over-steer.
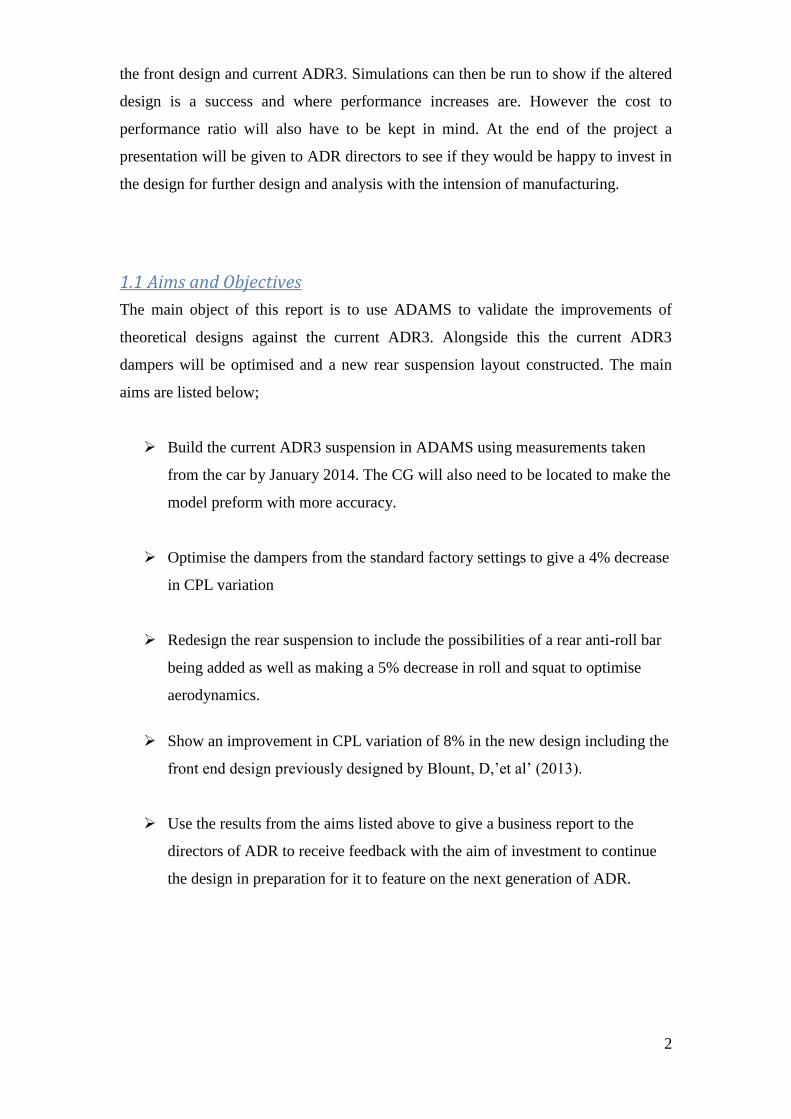
Graph 1 is from a Goodyear GT-S
P215/60 R15 tyre at 31 psi. The graph shows the relationship between Lateral force
and slip and how this changes at different loads. Haney, P (2009), notes that each
curve is split into three different sections. The first is the linear line where the increase
in slip angle is proportional to lateral load. This section is the cornering stiffness of
the tyre where the tread isn’t sliding. The second stage is from the end of the linear
line to the max lateral force and is called the transitional stage. As the tyres tread
starts to slide, the increase in lateral load is slower, yet the slip angle continues to
increase. The point of max lateral load is the slip angle at which a driver wants to be
at when cornering. This is achieved by entering the corner at the correct speed.
Entering the corner too fast and the driver will enter the final section of the curve,
called the Frictional stage. Although not shown on the graph the lateral load starts to
drop off as slip angle continues to increase. Haney, P (2009) claims that there can be a
Graph 1: Slip Angle against lateral force for a
Goodyear GT-S P215/60 R15
4
30% drop off within a few extra degrees of slip angle. If a driver falls into this part
due to entering a corner to fast they will experience under-steer or over-steer where
the car doesn’t corner on the same radius as the driver input.
Milliken, W and Milliken, D (1995) say “One of the major problems in vehicle
dynamics is obtaining enough reliable data on tire designs of interest”. Hallum, C
(1998) agrees on this and says that “A simple tire tread model predicts numerous tire
performance characteristics” and that these models dont match simple aligning torque
data. Hallum continues to talk about how his system “HRE model” takes more into
account such as heat, camber, tread thickness, tyre pressure and takes into account slip
and re-grip. It is quite clear that tyre testing and modelling is a massive section of
suspension and this is the reason why all large racing championships use control tyres.
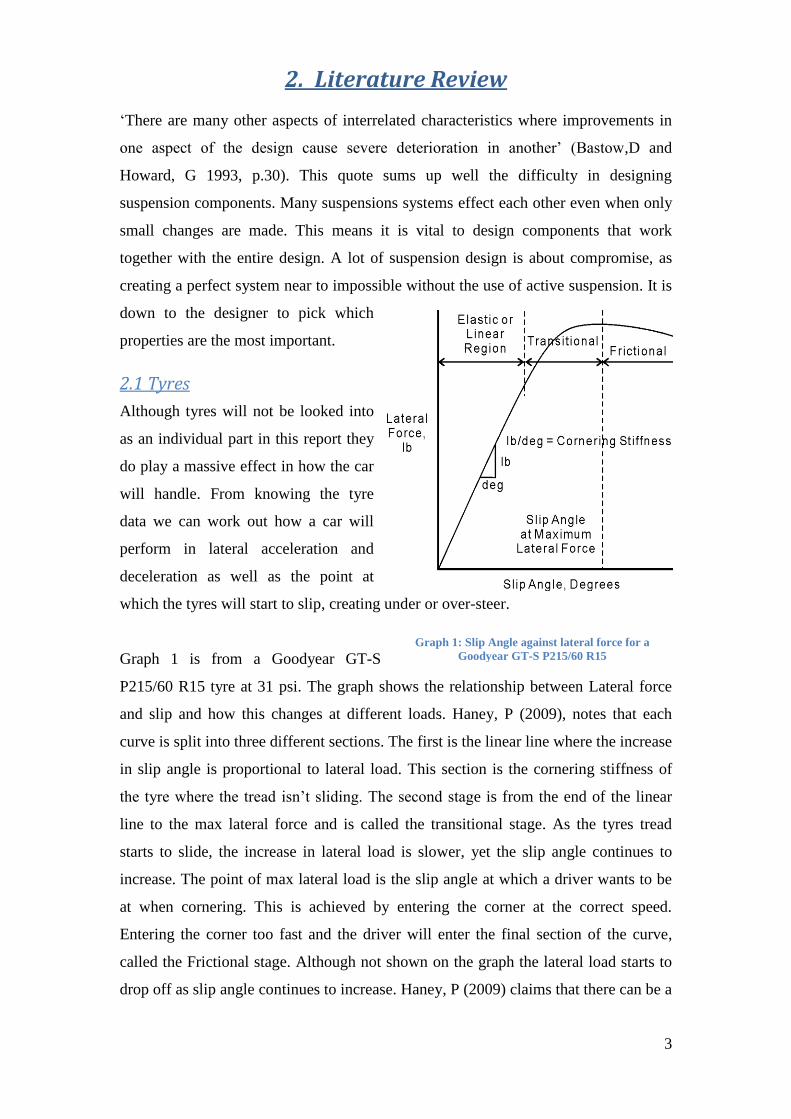
Haney, P (2003) looks into the variations of spring
rates at different camber angles and inflation
pressures (figure 2). Haney shows that at higher tire
pressure the spring stiffness increases, as would be
expected, but also shows how that increase the
camber, decreases the spring rate. This is because on
the side of a tire the stiffness is less effective.
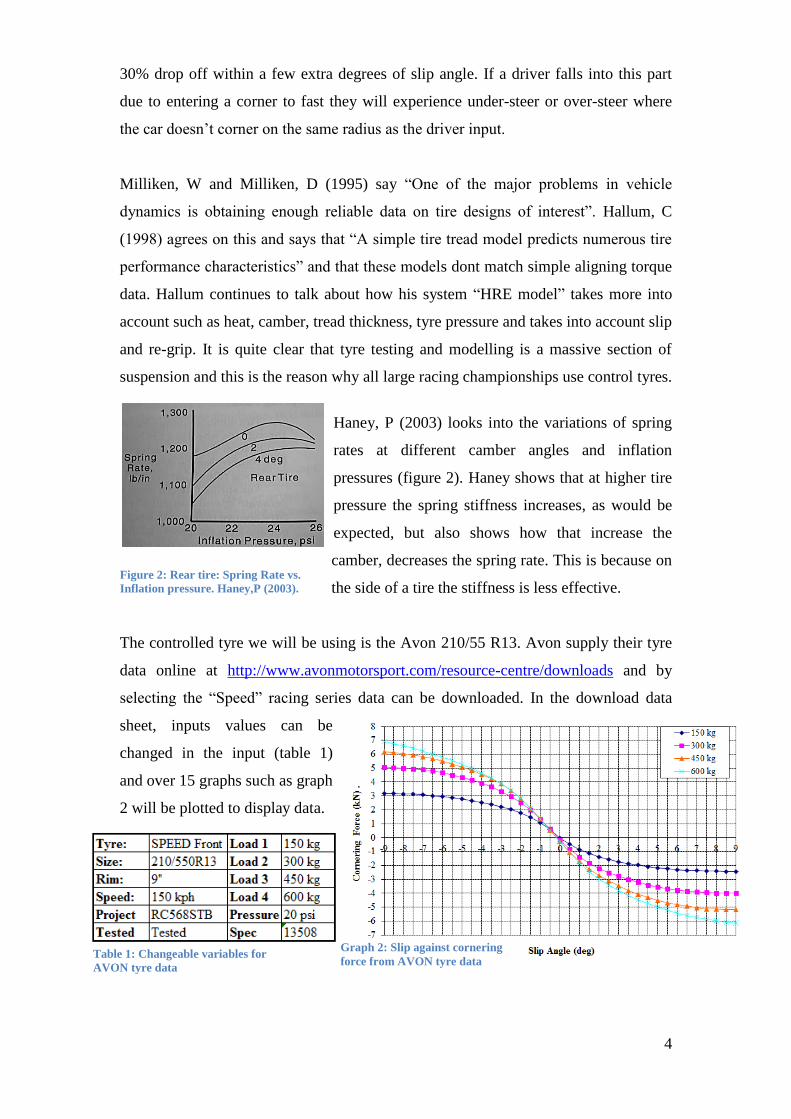
The controlled tyre we will be using is the Avon 210/55 R13. Avon supply their tyre
data online at http://www.avonmotorsport.com/resource-centre/downloads and by
selecting the “Speed” racing series data can be downloaded. In the download data
sheet, inputs values can be
changed in the input (table 1)
and over 15 graphs such as graph
2 will be plotted to display data.
Table 1: Changeable variables for
AVON tyre data
Graph 2: Slip against cornering
force from AVON tyre data
Figure 2: Rear tire: Spring Rate vs.
Inflation pressure. Haney,P (2003).
5
2.2 Suspension Geometry
Staniforth, A (1999) talks about different suspension layout and looks into the layout
of wishbone suspension. Staniforth states that wishbones of unequal lengths and non-
parallel angles are the best layout for competition cars. He says this is due to the
amount of ‘versatility’ it gives the designer in controlling the camber/roll center
compromise. This is backed up by Isaac-Lowry, J (2004) who says having a longer
upper control arm will allow the car to gain camber when cornering. Jacob then goes
on say how this can be used to make the outside wheel produce the maximum
cornering force. Milliken, W and Milliken, D (1995) give the below formula for
camber change rate but state that control is limited due to packaging restrictions.
𝐶ℎ𝑎𝑚𝑏𝑒𝑟 𝐶ℎ𝑎𝑛𝑔𝑒 𝑅𝑎𝑡𝑒 = tan−11
𝑓𝑣𝑠𝑎
fvsa = front view swing arm
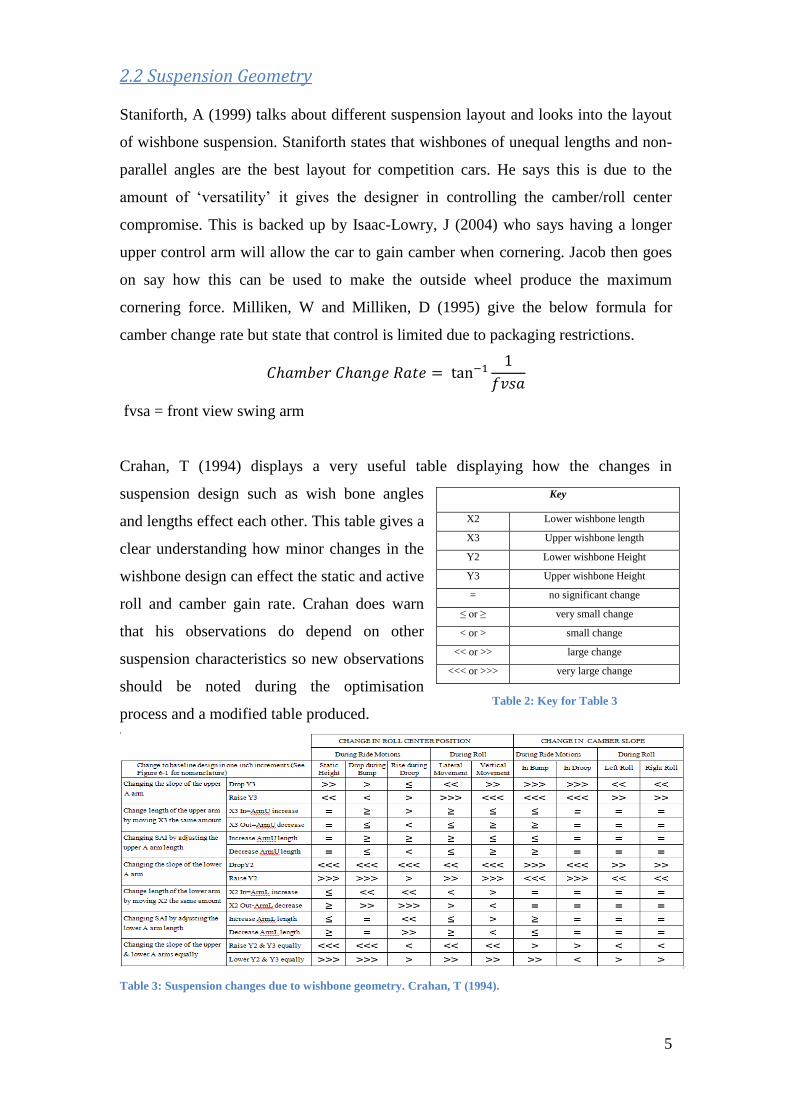
Crahan, T (1994) displays a very useful table displaying how the changes in
suspension design such as wish bone angles
and lengths effect each other. This table gives a
clear understanding how minor changes in the
wishbone design can effect the static and active
roll and camber gain rate. Crahan does warn
that his observations do depend on other
suspension characteristics so new observations
should be noted during the optimisation
process and a modified table produced.
Table 3: Suspension changes due to wishbone geometry. Crahan, T (1994).
Key
X2 Lower wishbone length
X3 Upper wishbone length
Y2 Lower wishbone Height
Y3 Upper wishbone Height
= no significant change
≤ or ≥ very small change
< or > small change
<< or >> large change
<<< or >>> very large change
Table 2: Key for Table 3
6
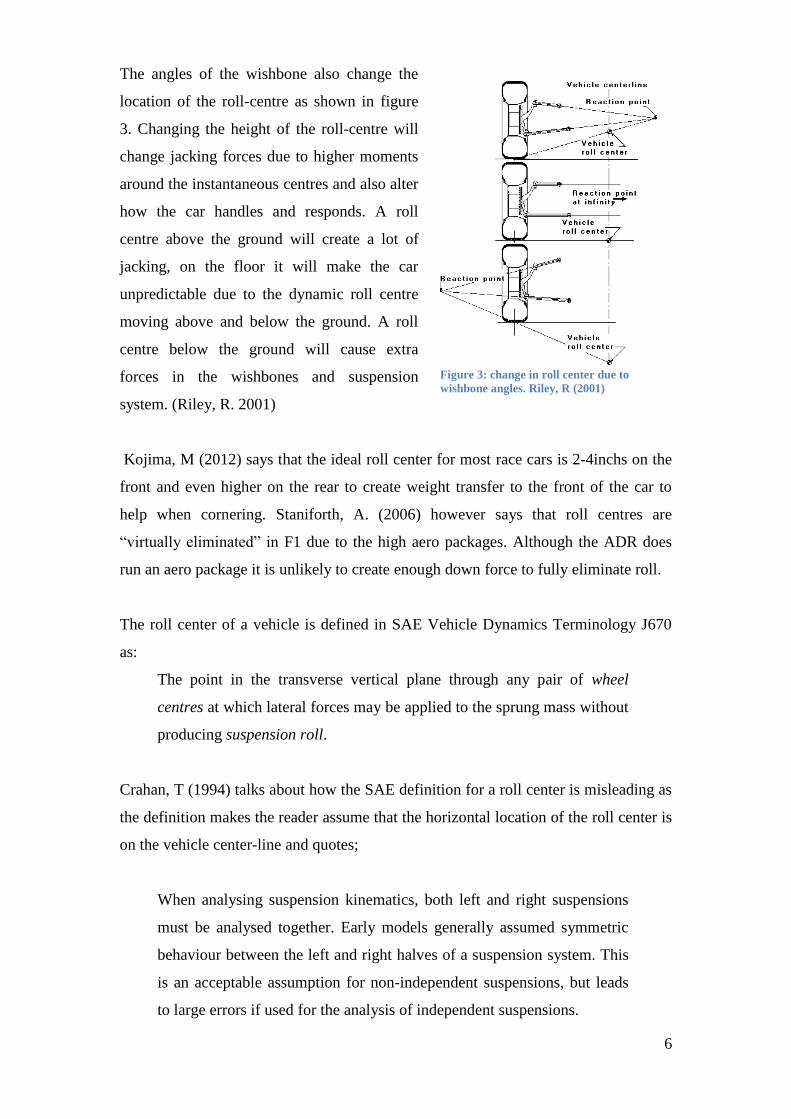
The angles of the wishbone also change the
location of the roll-centre as shown in figure
3. Changing the height of the roll-centre will
change jacking forces due to higher moments
around the instantaneous centres and also alter
how the car handles and responds. A roll
centre above the ground will create a lot of
jacking, on the floor it will make the car
unpredictable due to the dynamic roll centre
moving above and below the ground. A roll
centre below the ground will cause extra
forces in the wishbones and suspension
system. (Riley, R. 2001)
Kojima, M (2012) says that the ideal roll center for most race cars is 2-4inchs on the
front and even higher on the rear to create weight transfer to the front of the car to
help when cornering. Staniforth, A. (2006) however says that roll centres are
“virtually eliminated” in F1 due to the high aero packages. Although the ADR does
run an aero package it is unlikely to create enough down force to fully eliminate roll.
The roll center of a vehicle is defined in SAE Vehicle Dynamics Terminology J670
as:
The point in the transverse vertical plane through any pair of wheel
centres at which lateral forces may be applied to the sprung mass without
producing suspension roll.
Crahan, T (1994) talks about how the SAE definition for a roll center is misleading as
the definition makes the reader assume that the horizontal location of the roll center is
on the vehicle center-line and quotes;
When analysing suspension kinematics, both left and right suspensions
must be analysed together. Early models generally assumed symmetric
behaviour between the left and right halves of a suspension system. This
is an acceptable assumption for non-independent suspensions, but leads
to large errors if used for the analysis of independent suspensions.
Figure 3: change in roll center due to
wishbone angles. Riley, R (2001)

7
McNeely, P (2000), talks about how conventional springs, shocks and ARB’s could
be replaced with controllable fluid components. By doing this it is possible to have
the correct features at each movement throughout the suspension system. McNeely
concludes that this system works well on slower moving vehicles and can be used to
eliminate roll, squat and dive. However for it to be used for racing purposes, much
more complex, faster reacting systems would have to be used where reliability could
be an issue. Staniforth, A, (1999), talks in-depth about how active suspension has
been used in competition cars and he uses the Honda-Lotus 99T as a winning car
which used such a system. These types of systems are forbidden in most motorsport
classes and it is stated in the regulations under point 10.2 which reads;
Speedeuroseries.com (2012).
10.2 Active suspension
Active suspension systems are prohibited, as are all systems enabling the
flexibility of springs, shock absorbers and the ground clearance height of
the car to be controlled while the car is in motion.
When looking into different methods of mounting the dampers/springs, push or pull
rods seem to be the best method. Using push or pull rods and a rocker allows the
damper and spring to be mounted inside, lowering the unsprung mass. The mounting
and location of the damper and spring can also be changed making packaging easier
and a lower CG. Staniforth, A (1999) says that there is very little different between
push and pull rod suspension and are generally selected on what suits the packaging
better. However Kirk, C (2012) declares that on an F1 car, pull rods are better due to
better aerodynamics follow to the side pods and a lower CG as the damper/coil can be
mounted at the bottom. Although the aero between the body and wheel is not as
important on an ADR due the full body, a low CG helps a lot for vehicle dynamics.
8
Blount, D ‘et al’ (2013) has
already completed an
investigation for designing a
better front suspension
system for the ADR3 (figure
4). This project was mainly to
show an understanding of
vehicle dynamics and was
designed to be as good as
possible but with no budget in mind. The final design was very good and included
some major changes and possible improvements. However no data comparison or
analysis was carried out comparing the new design to the old. This is where this report
will continue, design and analysing where the improvements where made and how the
design could be changed to make it better and more cost effective. Blount, D, ‘et al’
summarise there design by saying the main improvements was a lower CG as well as
improvements in may key areas such as rocker design, camber compensation, low
bump steer change and good ARB design. However they also talk about how the cost
and ease of accessibility have been effected.
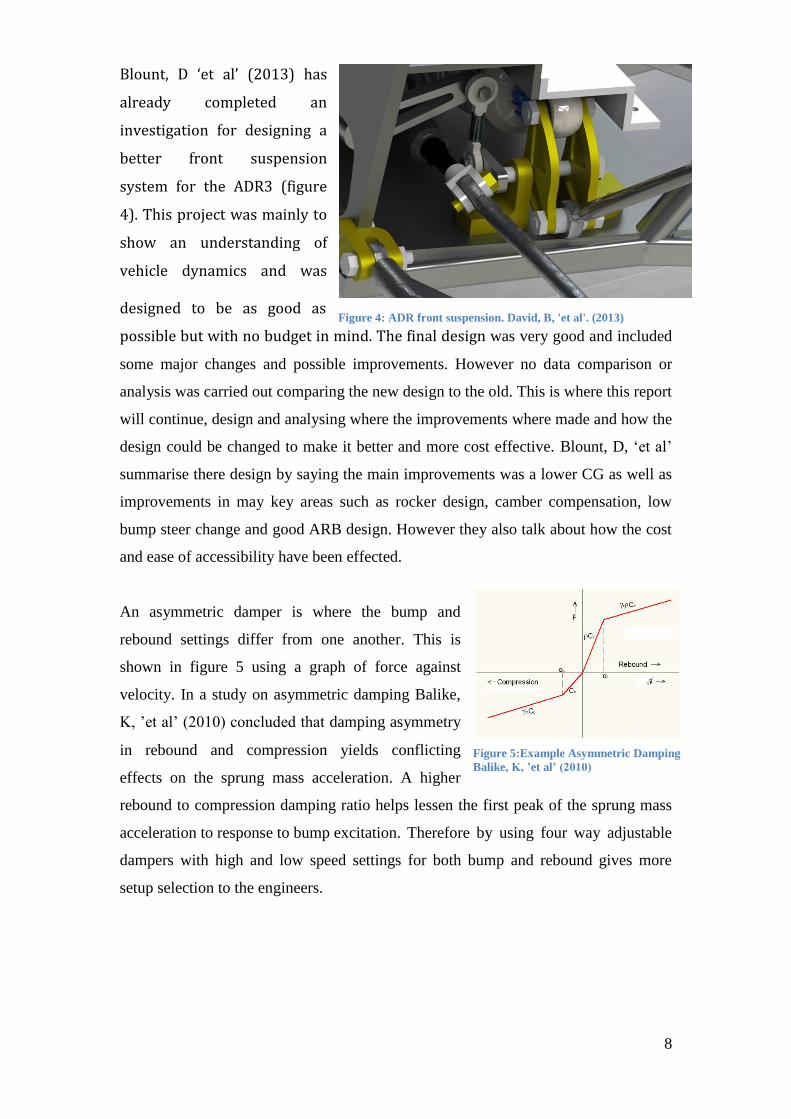
An asymmetric damper is where the bump and
rebound settings differ from one another. This is
shown in figure 5 using a graph of force against
velocity. In a study on asymmetric damping Balike,
K, ’et al’ (2010) concluded that damping asymmetry
in rebound and compression yields conflicting
effects on the sprung mass acceleration. A higher
rebound to compression damping ratio helps lessen the first peak of the sprung mass
acceleration to response to bump excitation. Therefore by using four way adjustable
dampers with high and low speed settings for both bump and rebound gives more
setup selection to the engineers.
Figure 5:Example Asymmetric Damping
Balike, K, ’et al’ (2010)
Figure 4: ADR front suspension. David, B, 'et al'. (2013)
9
2.3 Adams modelling
Antoun, R ‘et al’ (1986) defines ADAMS as “… a large displacement program
capable of solving kinematic, static, and dynamic problems for three dimensional
mechanical systems”. Antoun “et al” also talk about how ADAMS helps in the design
and development stages and how costs can be dramatically lowhered due to less
prototype parts and testing. McGuire, M and Guenther, D (1993) agree with this
adding;
Computer simulation of mechanical systems is becoming increasingly
important in many areas of engineering. The power of such programs lies
in their ability to accurately simulate real-world mechanical systems using
computer code and equations. This eliminates much iteration of prototype
fabrication, lab testing, and model revision. This reduction in hardware
construction leads to a savings of time and money.
Sughosh, K ‘et al’ (2009) looks into the use of ADAMS View and validating
their model against experimental data. The paper is based on a 2003 Ford
Expedition and data is taken from the National Highway Traffic Safety
Administration’s (NHTSA) and Vehicle Research and Test Center (VRTC). The
paper then compares the data in graph form by looking firstly at roll and bounce.
In these tests, steering and roll change can be compared as well as suspension
rate and roll stiffness calculated. The second set of test use ADAMS to simulate
maneuvers such as slow steering changes, as well as more rapid steering
alterations in acceleration and cornering. The aim of this paper was to verify the
ESC (Electronic Stability Control) system that was fitted to this vehicle worked
efficiently in which there data clearly conforms.
Chikhale, S and Deshmukh, S, (2013), look at the comparison between using Matlab
and ADAMS for a quarter car model. The first method is using Matlab to calculate
mathematical methods and the second using ADAMS which is the same as is planned
in this experiment. In their conclusion they state that there is very little to choose the
between the two types of software, however they do summarise that ADAMS is the
preferred programme as it is quick and easy to build a model due to the pre-

10
programmed math’s already being in the software. Therefore more complex models
and data can be extracted a lot easier.
Shedden, A, (2013), talks about the relationship between spring rates and CPL
variation. He states that the softest springs will create the lowest CPL variation as
they will easy be accelerated to the shape of the road without spinning, locking or
skidding. However he then continues to talk about how soft springs increase the
amount of pitch and roll of a vehicle effecting other suspension characteristics.
Crahan, Y(1994.) adds to this saying;
‘Another important goal which can dominate suspension design (depending on class)
is to optimize aerodynamics requirements by maintaining a constant vehicle altitude’
This is done by minimising the body movement which means using stiffer springs.
Hence there is a tradeoff between optimising CPL and other areas of vehicle design.
A car that has soft springs may have less CPL variation but this may not improve the
handling due to body movement creating an increase in weight transfer and having a
negative effect on aerodynamics.
2.4 Data Collection
Boggs, C ‘et al’ (2008) look at collecting data from a quarter car rig tester and
validate their tests against theoretical methods. This is a good way at looking at the
forces and wheel movement at each corner, but we ideally want to look at the car as a
whole to see how the other corners are effected. Kowalxzyk, H (2002) & Kelly, J
(2002) use a 7 post rig testing to harvest data from the car. Both authors talk about
how the main advantage of a 7 post rig, over a 4 post rig is that aerodynamic loads
can be simulated. These rigs are almost compulsory in F1 as it allows the teams to get
a lot more vehicle data with their restricted testing times. Kowalxzyk and Kelly both
agree that the data from the rigs can massively help damper and spring optimisation in
setup as well as design.
Staffman, D ‘et al’ (2004) look into the use of data acquisition on racing cars. The
general aim of this report was to design a system that was cheap for SAE Formula

11
Student teams to run. However in this paper Staffman, D, ‘et al’ discusse how taking
data from a car allows a team to analyse what a car is doing and how the setup or
design can be improved. Larminie, J and Martin, L (2009) also comment on data
logging, talking about how it is important to understand how the sensors operate to
gain correct results and eliminate errors.
2.5 Summary
From this literature review it can be appreciated that it is very hard to produce a
package that is perfect in all areas, making the correct compromises is what will build
the best possible suspension system. There are also many different features that effect
each other so it is important to view all components as an overall package instead of
individual parts.
Tyres play a key role in suspension dynamics and are not to be ignored. Although it is
clear that tyres are a massive section of vehicle dynamics, there we will not be enough
time to properly explore it in this report. Looking at static models where only the
suspension components are moving is therefore a lot simpler to model. The contact
patch load (CPL) can be investigated to see how the tyre is keeping in contact with the
ground.
Suspension geometry is a massively discussed topic with many different views in
what people think is correct. To create the best package it is clear the designer must
utilise and prioritise certain aspects more than others but it is impossible to create a
perfect design for every situation. The only way to start getting near to this “perfect
package” is to look into the use of active suspension which is clearly not allowed in
the regulations for the Speeds Series (Relevant suspension regulations can be found in
Appendix 1).
It is clear that ADAMS is a very important programme used everywhere in
engineering. It can be summarised that this program massively helps in cost saving
when designing dynamic components. This will be a key programme in helping the
improvement on the current ADR suspension system but it has become apparent that
it is good practice to compare ADAMS models with actual car data to validate the
model.

12
Most F1 teams seem to use 7 post rigs (7PR) to help test and extract data from there
race cars. The 7 post rig helps simulate aero making more data more accurate. The
ADR does have an aerodynamic package so 7PR would be preferred but a 4PR will
be adequate for this paper. It would be extremely useful to use a 4PR to validate the
ADAMS models.

13
3. METHODOLOGY
3.1 Collecting Car Data
To increase the accuracy of this report, it will be important to get as much data as
possible from the current ADR3. Since there are no assembled CAD models available
for this car, a lot of the suspension geometry will have to be reversed engineered. The
first step will be to find the suspension hard points. These include the location of the
wishbones, damper mounts, pull rods and uprights. These points will be measured in
the X, Y & Z directions to the nearest 5mm. However by using this method there is a
high chance of inaccuracy which could change how the ADAMS model simulates,
compared to the actual car. To make sure that the ADAMS model is correct it could
be validated by 4PR data as discussed by Sughosh, K, ‘et al’ (2009). However due to
limited time and car availability, this will not be covered in this paper but discussed as
further work. The current damper setup on the car will also be noted and un-sprung
masses measured.
Finding the CG
To make the ADAMS model behave in the correct way the CG (centre of gravity) of
the current ADR will have to be found. This will be needed for ADAMS to work out
the correct roll, pitch and dive for the car. To find where the CG is positioned from
front to rear (Z-direction) and left to right (X-Direction) can be simply found by using
corner weights and moment equations.
The corner weights need to be setup on a flat floor and levelled using lasers to
increase accuracy. Once the scales are zeroed and the calibration is conferred by
weighing a known weight on each scale, the vehicle can then be carefully lowhered
onto the pads and the readings made. By knowing the weights at each four wheels and
by measuring the wheelbase and track width the below moment equations can be used
to find the location in the x and z direction.
14
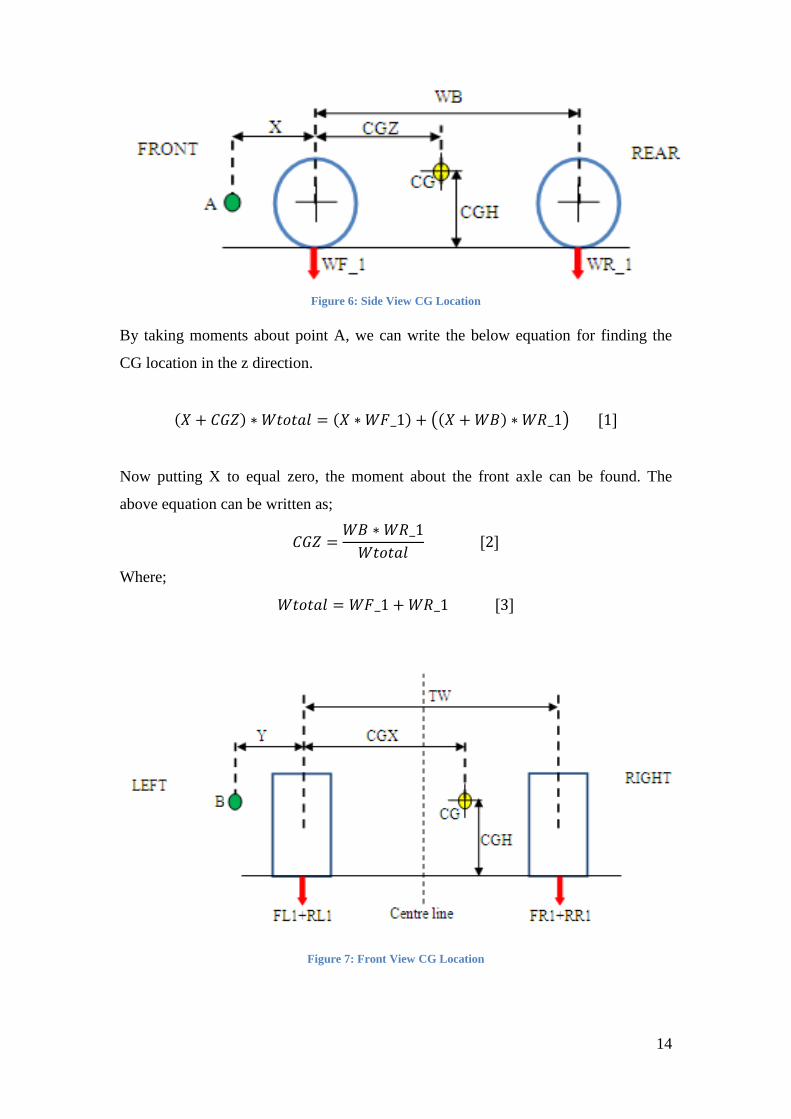
Figure 6: Side View CG Location
By taking moments about point A, we can write the below equation for finding the
CG location in the z direction.
(𝑋 + 𝐶𝐺𝑍) ∗ 𝑊𝑡𝑜𝑡𝑎𝑙 = (𝑋 ∗ 𝑊𝐹_1) + ((𝑋 + 𝑊𝐵) ∗ 𝑊𝑅_1) [1]
Now putting X to equal zero, the moment about the front axle can be found. The
above equation can be written as;
𝐶𝐺𝑍 =𝑊𝐵 ∗ 𝑊𝑅_1
𝑊𝑡𝑜𝑡𝑎𝑙 [2]
Where;
𝑊𝑡𝑜𝑡𝑎𝑙 = 𝑊𝐹_1 + 𝑊𝑅_1 [3]
Figure 7: Front View CG Location

15
To find the CG in the x direction the same principle can be followed as above but this
time looking at the vehicle from the front view, therefore taking moments about point
B.
(𝑌 + 𝐶𝐺𝑋) ∗ 𝑊𝑡𝑜𝑡𝑎𝑙 = (𝑌 ∗ (𝐹𝐿1 + 𝑅𝐿1)) + ((𝑌 + 𝑇𝑊) ∗ (𝐹𝑅1 + 𝑅𝑅1)) [4]
As before, make Y equal zero to find the moment about the left wheel. Giving the
simplified formula;
𝐶𝐺𝑋 =𝑇𝑊 ∗ (𝐹𝑅1 + 𝑅𝑅1)
𝑊𝑡𝑜𝑡𝑎𝑙 [5]
Where;
𝑊𝑡𝑜𝑡𝑎𝑙 = (𝐹𝐿1 + 𝑅𝐿1) + (𝐹𝑅1 + 𝑅𝑅1) [6]
This position is however currently measured from the centre of the wheel and it would
be easier to locate from the centre line of the vehicle. In doing this, values to the right
of the centre line will be positive and to the left, negative.
𝐶𝐺 𝑜𝑓𝑓𝑠𝑒𝑡 = 𝐷𝐺𝑋 −𝑇𝑊
2 [7]
Figure 8: Top view GC location
This method does however assume that the front and rear track widths are the same.
The below equations can be used to find the location for different track widths. These
16
formulas use trigonometry to find the new CG location due to the different track
widths front and rear.
tan 𝜃 =𝑇1
𝐶𝐺𝑍=
𝑇2
𝑊𝐵 [8]
We know that T2 equals;
𝑇2 =𝑇𝑊𝑅 − 𝑇𝑊𝐹
2 [9]
Therefore substituting the above for T2 and rearranging to make T1 the subject;
𝑇1 = 𝐶𝐺𝑍 ∗𝑇𝑊𝑅 − 𝑇𝑊𝐹
2 ∗ 𝑊𝐵 [10]
The new centre offset now becomes;
𝐶𝐺 offset = 𝐶𝐺𝑋1 − 𝑇1 −𝑇𝑊𝑅
2 [11]
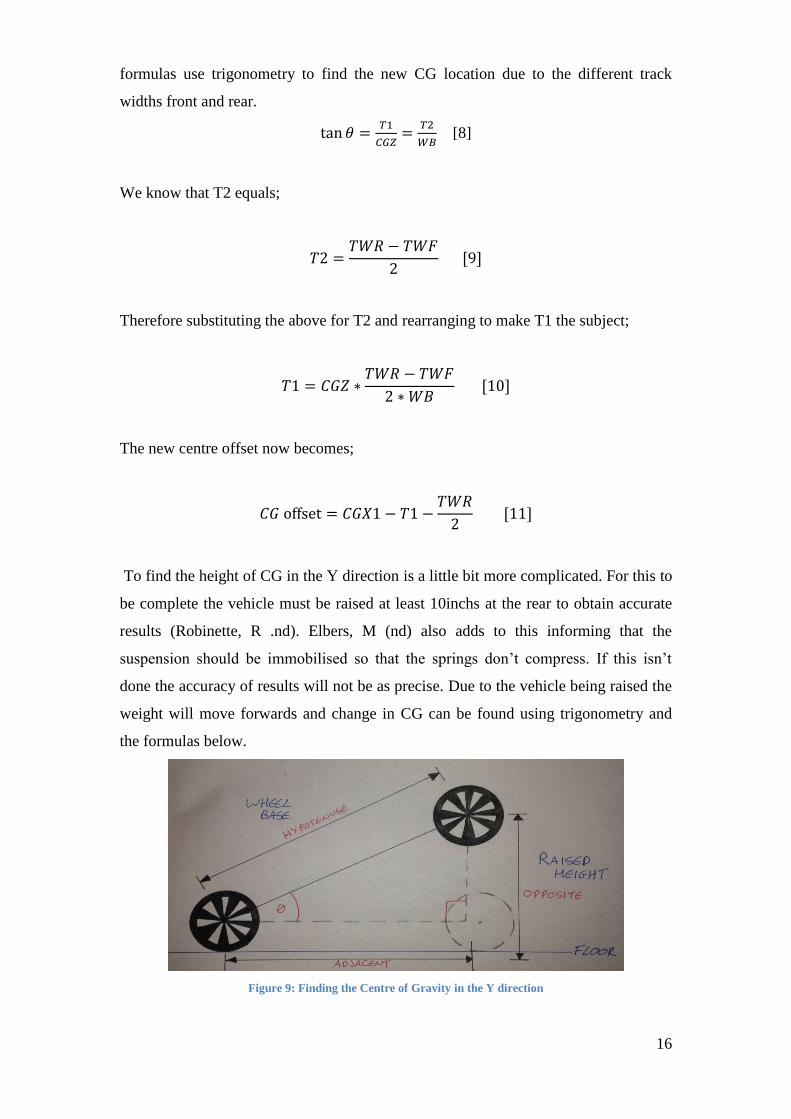
To find the height of CG in the Y direction is a little bit more complicated. For this to
be complete the vehicle must be raised at least 10inchs at the rear to obtain accurate
results (Robinette, R .nd). Elbers, M (nd) also adds to this informing that the
suspension should be immobilised so that the springs don’t compress. If this isn’t
done the accuracy of results will not be as precise. Due to the vehicle being raised the
weight will move forwards and change in CG can be found using trigonometry and
the formulas below.
Figure 9: Finding the Centre of Gravity in the Y direction
17
𝐴𝑑𝑗 = √𝑊𝐵2 − 𝐻𝑇2 [12]
tan 𝜃 =𝐻𝑇
𝐴𝑑𝑗 [13]
𝐶𝐺𝐻 = 𝑊𝐵 ∗ 𝐹𝑊𝑐
𝑇𝑊 ∗ tan 𝜃 [14]
CGH Centre of Gravity Height
WB Wheelbase FW1 Front weight LEVEL
TW Total weight FW2 Front weight RAISED
HT Height Raised FWc FW2 - FW1 Table 4: Key for Formals 12,13 & 14
This method is a very good, cost efficient way to find the CG. However there are
test rigs such as roll over machines, which will tilt the car to the point of roll to
calculate the CG more accurately. However at top level racing such as F1, specialist
equipment is used to work out the CG of all components and then computer
programmes used to solve the overall location of CG. In using this method, the effects
of positioning and weights of individual components can be examined and there
alteration of the total CG observed.
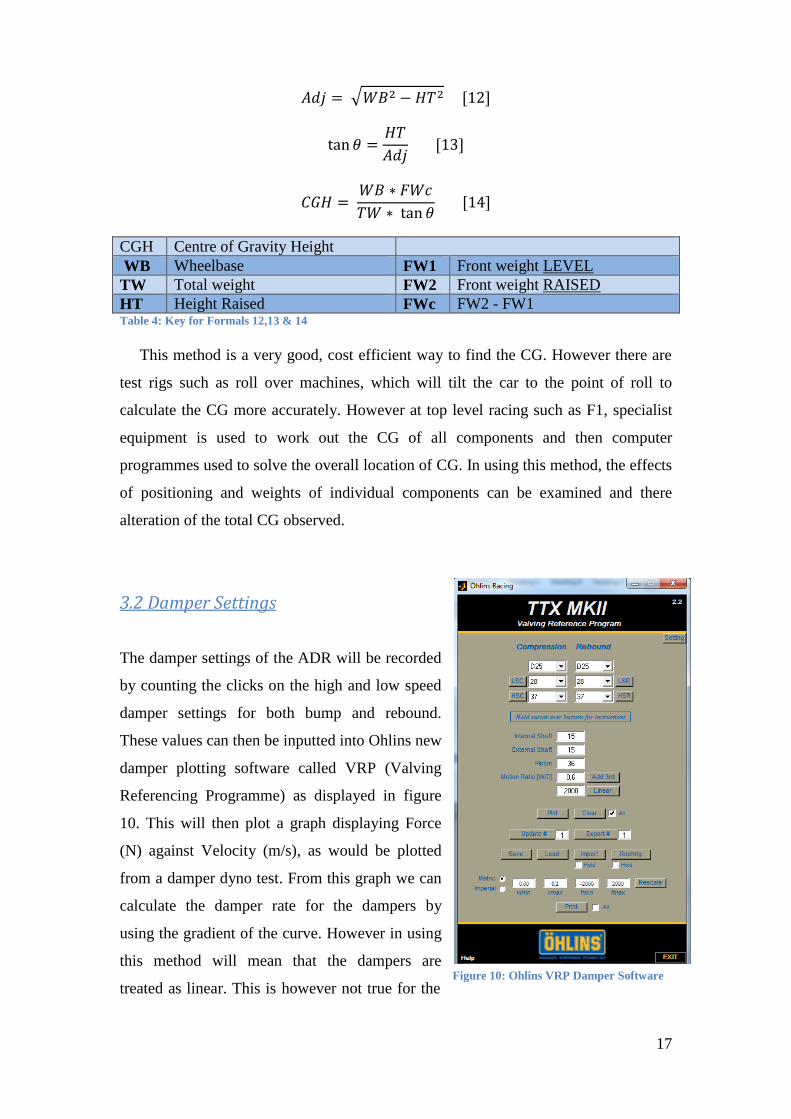
3.2 Damper Settings
The damper settings of the ADR will be recorded
by counting the clicks on the high and low speed
damper settings for both bump and rebound.
These values can then be inputted into Ohlins new
damper plotting software called VRP (Valving
Referencing Programme) as displayed in figure
10. This will then plot a graph displaying Force
(N) against Velocity (m/s), as would be plotted
from a damper dyno test. From this graph we can
calculate the damper rate for the dampers by
using the gradient of the curve. However in using
this method will mean that the dampers are
treated as linear. This is however not true for the Figure 10: Ohlins VRP Damper Software

18
4 way adjustable dampers currently used on the car, as discussed by Balike, K, ’et al’
(2010).
3.3 Rear Suspension
Roll Centre
The roll centre of a car is the point at which the car will roll about when cornering.
The roll centre can be found by viewing the car from a front view and drawing lines
that follow the angle of the wishbones .Where these two lines meet is called the
instant centre. Now a line can be drawn from the instant centre to the centre of the
wheels as shown in figure 11. Where these lines cross is called the static roll centre.
The further away the roll centre is from the CG location, the more roll a vehicle will
have. Therefore by changing the angles of the upper and lower wishbones this point
can be moved. Having a higher roll centre will mean less of the rolling moment is
taken by the springs.
Figure 11: Front View Showing Roll and Instant Centres
As a vehicle corners, the wishbones will generally change angles moving the location
of the roll centre up or down and away from the centre line. This movement of the roll
centre needs to be kept to a minimum to make the car more predictable and handle
better when cornering.
Roll can however be minimised by other suspension components such as damper and
ARB setup, however the roll centre location can also create a jacking moment. This is
much harder to control in other ways and therefore this takes priority over the roll
moment.
19
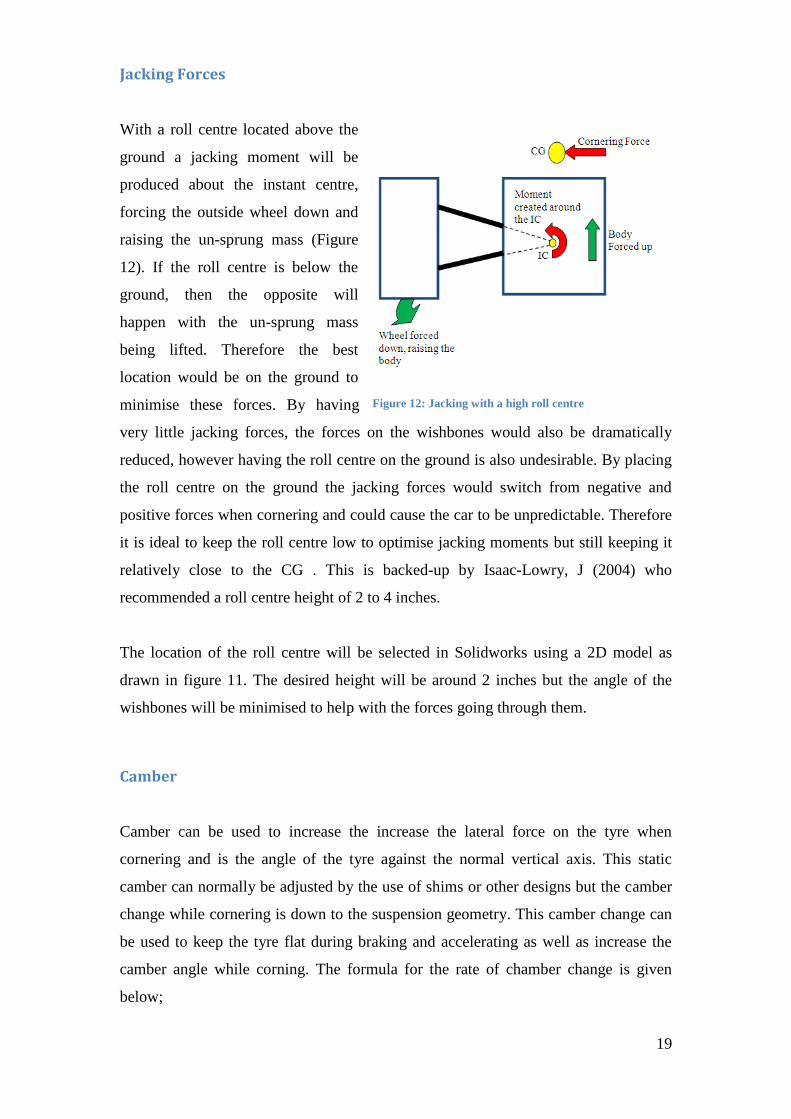
Jacking Forces
With a roll centre located above the
ground a jacking moment will be
produced about the instant centre,
forcing the outside wheel down and
raising the un-sprung mass (Figure
12). If the roll centre is below the
ground, then the opposite will
happen with the un-sprung mass
being lifted. Therefore the best
location would be on the ground to
minimise these forces. By having
very little jacking forces, the forces on the wishbones would also be dramatically
reduced, however having the roll centre on the ground is also undesirable. By placing
the roll centre on the ground the jacking forces would switch from negative and
positive forces when cornering and could cause the car to be unpredictable. Therefore
it is ideal to keep the roll centre low to optimise jacking moments but still keeping it
relatively close to the CG . This is backed-up by Isaac-Lowry, J (2004) who
recommended a roll centre height of 2 to 4 inches.
The location of the roll centre will be selected in Solidworks using a 2D model as
drawn in figure 11. The desired height will be around 2 inches but the angle of the
wishbones will be minimised to help with the forces going through them.
Camber
Camber can be used to increase the increase the lateral force on the tyre when
cornering and is the angle of the tyre against the normal vertical axis. This static
camber can normally be adjusted by the use of shims or other designs but the camber
change while cornering is down to the suspension geometry. This camber change can
be used to keep the tyre flat during braking and accelerating as well as increase the
camber angle while corning. The formula for the rate of chamber change is given
below;
Figure 12: Jacking with a high roll centre
20
𝐶𝑎𝑚𝑏𝑒𝑟 𝑐ℎ𝑎𝑛𝑔𝑒 𝑟𝑎𝑡𝑒 = tan−11
𝑓𝑣𝑠𝑎 [15]
By having a long fvsa (front view swing arm) there will be a smaller amount of
camber gain. The amount of roll camber and fvsa length can be found from the below
formulas;
𝑓𝑣𝑠𝑎 =
𝑡2
1 − 𝑟𝑜𝑙𝑙 𝑐𝑎𝑚𝑏𝑒𝑟 [16]
t = Track Width
𝑅𝑜𝑙𝑙 𝐶𝑎𝑚𝑏𝑒𝑟 = 𝑊ℎ𝑒𝑒𝑙 𝐶𝑎𝑚𝑏𝑒𝑟 𝑎𝑛𝑔𝑙𝑒
𝐶ℎ𝑎𝑠𝑠𝑖𝑠 𝑟𝑜𝑙𝑙 𝑎𝑛𝑔𝑙𝑒 [17]
Anti-Squat
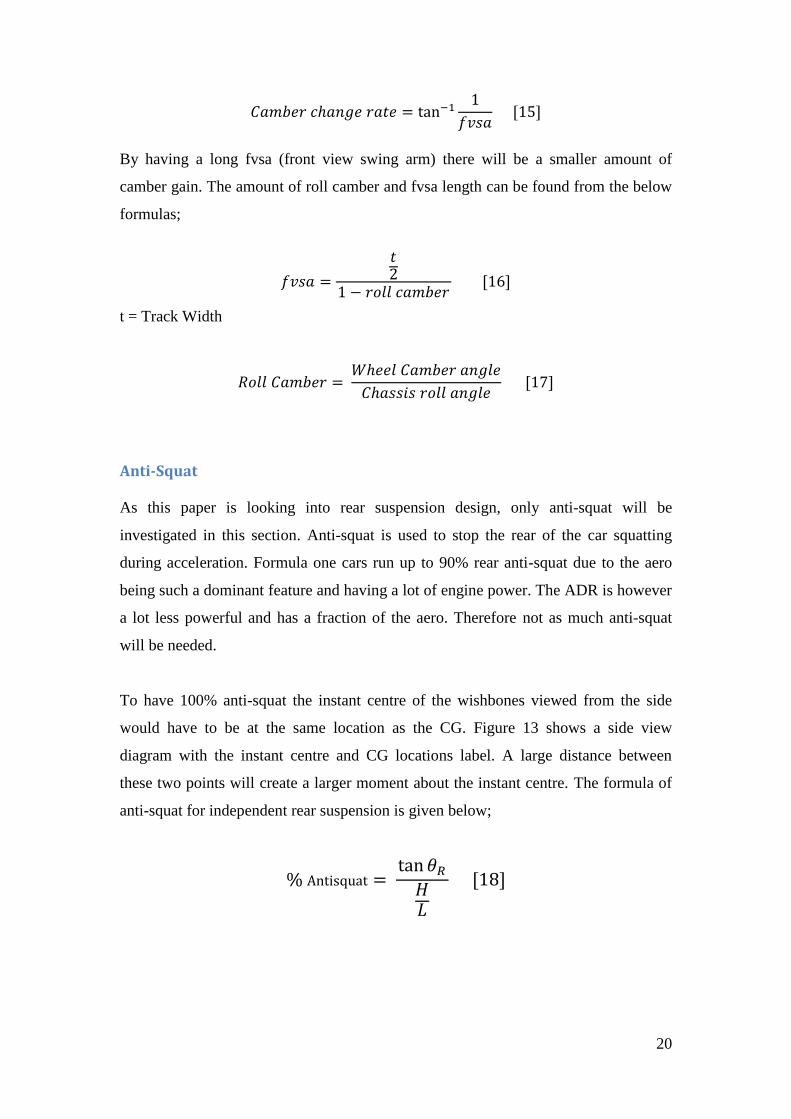
As this paper is looking into rear suspension design, only anti-squat will be
investigated in this section. Anti-squat is used to stop the rear of the car squatting
during acceleration. Formula one cars run up to 90% rear anti-squat due to the aero
being such a dominant feature and having a lot of engine power. The ADR is however
a lot less powerful and has a fraction of the aero. Therefore not as much anti-squat
will be needed.
To have 100% anti-squat the instant centre of the wishbones viewed from the side
would have to be at the same location as the CG. Figure 13 shows a side view
diagram with the instant centre and CG locations label. A large distance between
these two points will create a larger moment about the instant centre. The formula of
anti-squat for independent rear suspension is given below;
% Antisquat = tan 𝜃𝑅
𝐻𝐿
[18]
21
Figure 13: Anti-Squat
Anti-Roll bar
The current ADR only runs a front ARB and doesn’t use a rear. This is a key aspect of
the suspension that could be improved on. (Blundell and Harty, 2004) give formulas
on how calculate ARB rates. There formulas take into the account material selection
and diameter which will help in optimising the ARB’s.
𝑀𝑅𝑟𝑜𝑙𝑙 = 𝐴𝑅𝐵 𝑇𝑤𝑖𝑠𝑡 𝜃
𝐵𝑜𝑑𝑦 𝑅𝑜𝑙𝑙 𝐴𝑛𝑔𝑙𝑒 𝜃 [19]
𝐾𝐴𝑅𝐵 = 𝐺 ∗ 𝐽
𝐿 [20]
𝐺 = 𝐸
2(1 + 𝑣) [21]
𝐽 =𝜋(𝑑24 − 𝑑14)
32 [22]
𝑅𝑜𝑙𝑙 𝑆𝑡𝑖𝑓𝑓𝑛𝑒𝑠𝑠 = (𝐾 ∗ 𝑇2) ∗ (𝐾𝐴𝑅𝐵 ∗ 𝑇2)
360𝜋
[23]
Where; K - Wheel Rate, T - Track, KARB - ARB rate
22
Installation Ratio
The forces from the wheel can be increased or decreased by changing the length of
leverage that act around a pivot point. These changes in lengths are called an
installation ratio. Installation ratios are very important in vehicle dynamics as they can
be used to maximise the use of spring dampers and wheel rate as shown in the below
formuals.
𝐾𝑤 = 𝐾𝑠(𝐼𝑅)2 [24]
𝐾𝑤 = 𝐹𝑠 (∆𝐼𝑅
∆𝛿) + 𝐾𝑠(𝐼𝑅)2 [25]
Formulas 15 to 18 and 23 to 25 are from: Milliken, W & Milliken, D. (1995)
Kw - Wheel rate
Fs - Spring Force
Ks - Spring rate
IR - Installation Ratio ∆𝑰𝑹
∆𝜹 - Change of installation ratio with wheel displacement

23
3.4 ADAMS
Figure 14: DOF Diagram
The first model to be created in ADAMS will be the current ADR suspension. As
mentioned previously all the suspension pickup points and geometry will be measured
from the ADR along with the current setup. By importing this data into ADAMS the
suspension can be created.
Next the current ADR rocker was rebuilt in Solidworks and imported to ADAMS as a
parasolid X_B file. This will ensure that the ADAMS model uses the correct
installation ratio. This was then aligned to the correct angle by using the ADAMS
positioning toolbox with the face to face alignment and the move functions. Spring
dampers where then added to the rockers and there relative marker on the body.
Ensuring that the model contained the correct DOF and motions was also a very
important factor. ADAMS has a tool called model verify which allows the user to
view DOF’s, redundant restraints and any errors. When building ADAMS models it is
essential to build models in there most basic form to eliminate the redundant
constraints. Redundant constraints are constraints that do not effect the final results.
For example in reality wishbones would need to be mounted in two places to the
chassis. However using two hinge joints to secure one part in ADAMS will create
redundant constraints. This is due to the fact that ADAMS isn’t looking at the forces
acting on each joint and therefore we can simply use only one.
X Left/Right Displacement
Y Up/Down Displacement
Z Forwards/backwards
Displacement
ϴ Pitch Rotation
Ψ Yaw Rotation
Φ Roll Rotation
Table 5: Key for Figure 14
Figure 14 is a diagram showing the 6
DOF and there axis. These will be kept
consisted through this report.
24
A common error that occurs in ADAMS models is that joints are added that contain
too many DOF producing acceleration force that we don’t want. This can effect the
final results and can sometimes be hard to find. An example of this would be adding
two spherical joints to each end of a push or pull rod. Although the model appears to
simulate correctly the rod may be spinning around its Z axis imposing an angular
acceleration which would not be occurring in reality. This can be resolved by adding
different joints or imposing a motion of zero for the rotation in the Z axis.
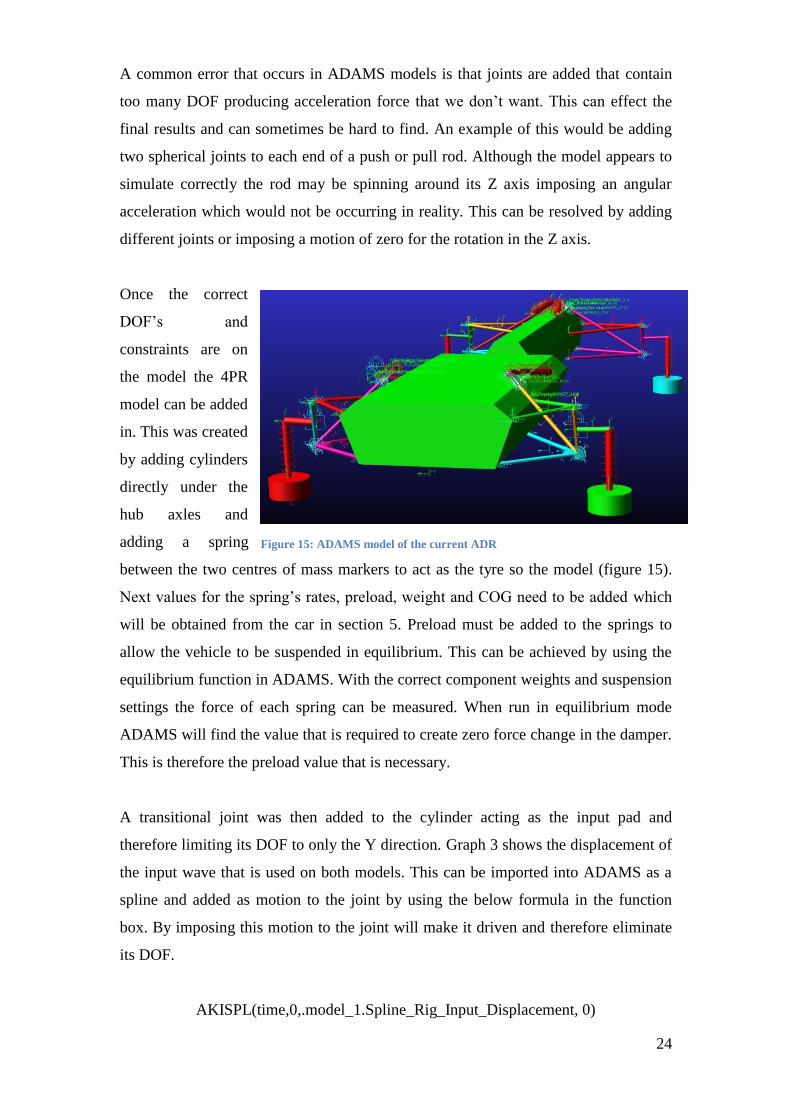
Once the correct
DOF’s and
constraints are on
the model the 4PR
model can be added
in. This was created
by adding cylinders
directly under the
hub axles and
adding a spring
between the two centres of mass markers to act as the tyre so the model (figure 15).
Next values for the spring’s rates, preload, weight and COG need to be added which
will be obtained from the car in section 5. Preload must be added to the springs to
allow the vehicle to be suspended in equilibrium. This can be achieved by using the
equilibrium function in ADAMS. With the correct component weights and suspension
settings the force of each spring can be measured. When run in equilibrium mode
ADAMS will find the value that is required to create zero force change in the damper.
This is therefore the preload value that is necessary.
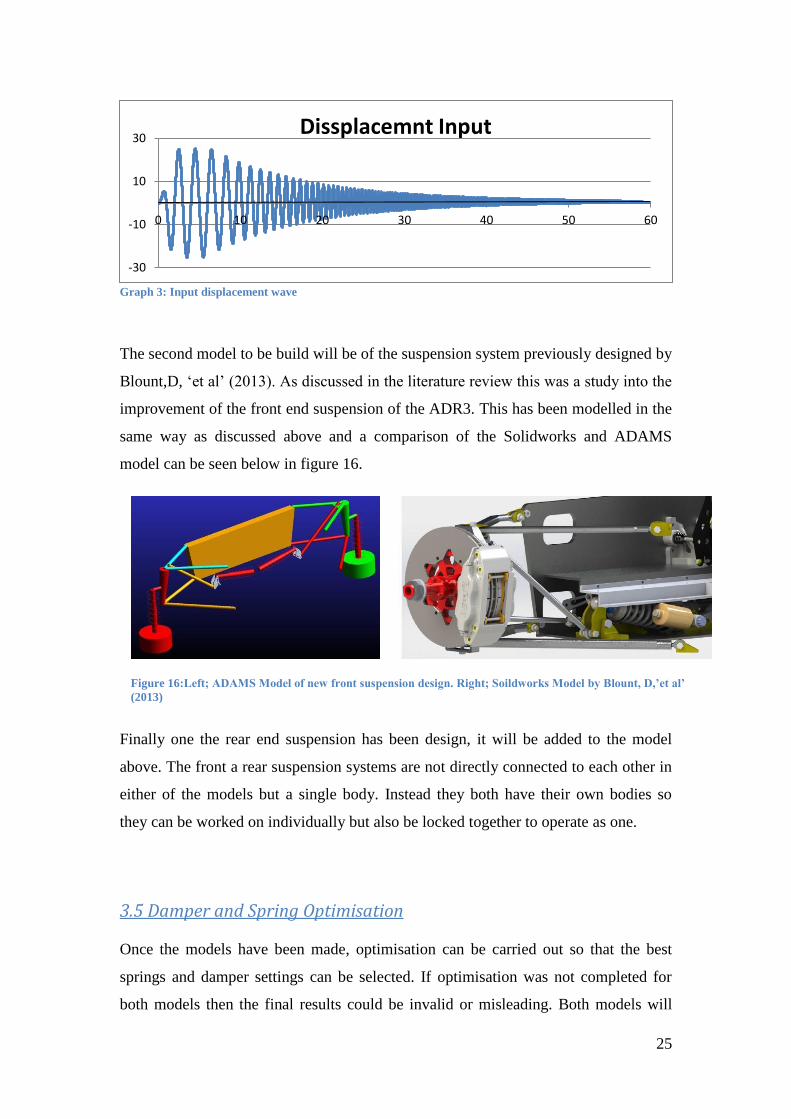
A transitional joint was then added to the cylinder acting as the input pad and
therefore limiting its DOF to only the Y direction. Graph 3 shows the displacement of
the input wave that is used on both models. This can be imported into ADAMS as a
spline and added as motion to the joint by using the below formula in the function
box. By imposing this motion to the joint will make it driven and therefore eliminate
its DOF.
AKISPL(time,0,.model_1.Spline_Rig_Input_Displacement, 0)
Figure 15: ADAMS model of the current ADR
25
Graph 3: Input displacement wave
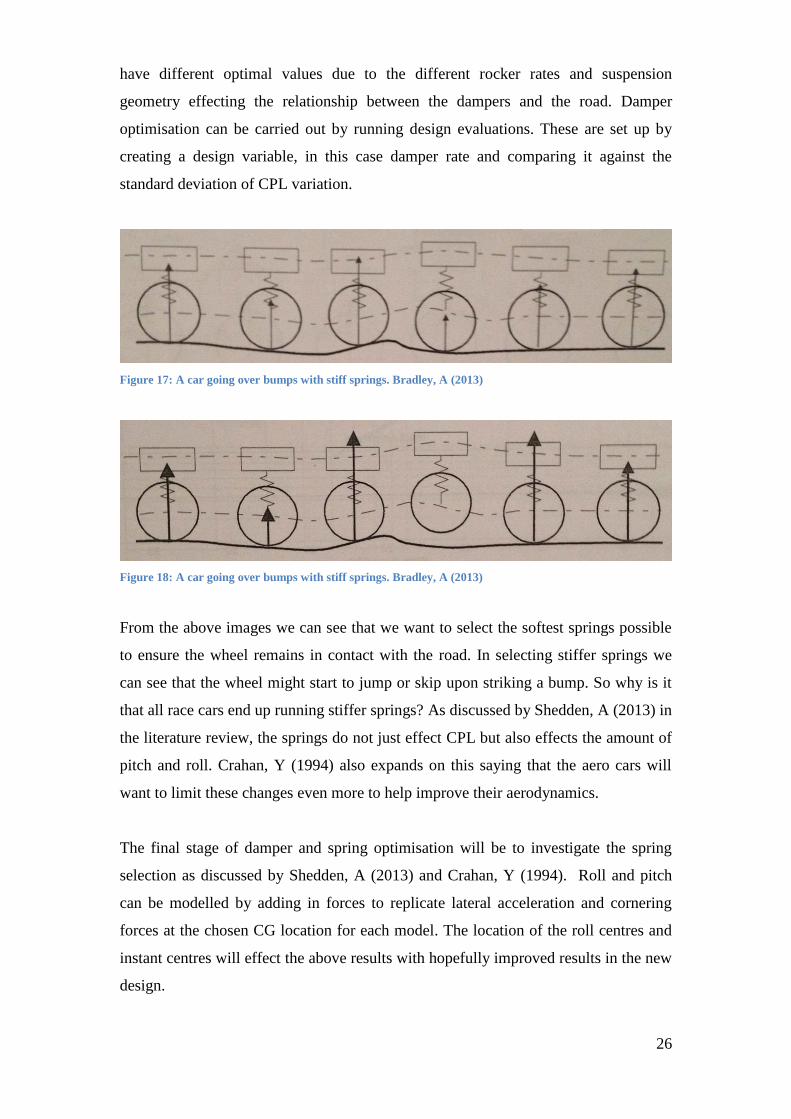
The second model to be build will be of the suspension system previously designed by
Blount,D, ‘et al’ (2013). As discussed in the literature review this was a study into the
improvement of the front end suspension of the ADR3. This has been modelled in the
same way as discussed above and a comparison of the Solidworks and ADAMS
model can be seen below in figure 16.
Finally one the rear end suspension has been design, it will be added to the model
above. The front a rear suspension systems are not directly connected to each other in
either of the models but a single body. Instead they both have their own bodies so
they can be worked on individually but also be locked together to operate as one.
3.5 Damper and Spring Optimisation
Once the models have been made, optimisation can be carried out so that the best
springs and damper settings can be selected. If optimisation was not completed for
both models then the final results could be invalid or misleading. Both models will
-30
-10
10
30
0 10 20 30 40 50 60
Dissplacemnt Input
Figure 16:Left; ADAMS Model of new front suspension design. Right; Soildworks Model by Blount, D,’et al’
(2013)
26
have different optimal values due to the different rocker rates and suspension
geometry effecting the relationship between the dampers and the road. Damper
optimisation can be carried out by running design evaluations. These are set up by
creating a design variable, in this case damper rate and comparing it against the
standard deviation of CPL variation.
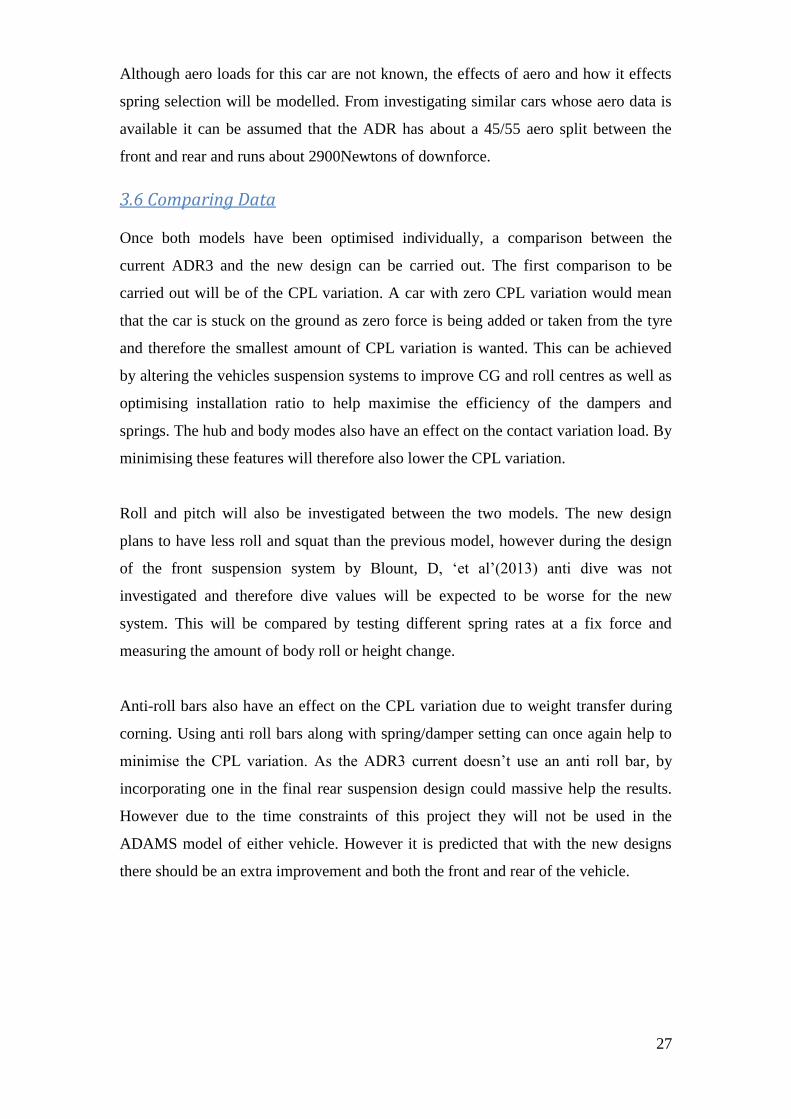
Figure 17: A car going over bumps with stiff springs. Bradley, A (2013)
Figure 18: A car going over bumps with stiff springs. Bradley, A (2013)
From the above images we can see that we want to select the softest springs possible
to ensure the wheel remains in contact with the road. In selecting stiffer springs we
can see that the wheel might start to jump or skip upon striking a bump. So why is it
that all race cars end up running stiffer springs? As discussed by Shedden, A (2013) in
the literature review, the springs do not just effect CPL but also effects the amount of
pitch and roll. Crahan, Y (1994) also expands on this saying that the aero cars will
want to limit these changes even more to help improve their aerodynamics.
The final stage of damper and spring optimisation will be to investigate the spring
selection as discussed by Shedden, A (2013) and Crahan, Y (1994). Roll and pitch
can be modelled by adding in forces to replicate lateral acceleration and cornering
forces at the chosen CG location for each model. The location of the roll centres and
instant centres will effect the above results with hopefully improved results in the new
design.
27
Although aero loads for this car are not known, the effects of aero and how it effects
spring selection will be modelled. From investigating similar cars whose aero data is
available it can be assumed that the ADR has about a 45/55 aero split between the
front and rear and runs about 2900Newtons of downforce.
3.6 Comparing Data
Once both models have been optimised individually, a comparison between the
current ADR3 and the new design can be carried out. The first comparison to be
carried out will be of the CPL variation. A car with zero CPL variation would mean
that the car is stuck on the ground as zero force is being added or taken from the tyre
and therefore the smallest amount of CPL variation is wanted. This can be achieved
by altering the vehicles suspension systems to improve CG and roll centres as well as
optimising installation ratio to help maximise the efficiency of the dampers and
springs. The hub and body modes also have an effect on the contact variation load. By
minimising these features will therefore also lower the CPL variation.
Roll and pitch will also be investigated between the two models. The new design
plans to have less roll and squat than the previous model, however during the design
of the front suspension system by Blount, D, ‘et al’(2013) anti dive was not
investigated and therefore dive values will be expected to be worse for the new
system. This will be compared by testing different spring rates at a fix force and
measuring the amount of body roll or height change.
Anti-roll bars also have an effect on the CPL variation due to weight transfer during
corning. Using anti roll bars along with spring/damper setting can once again help to
minimise the CPL variation. As the ADR3 current doesn’t use an anti roll bar, by
incorporating one in the final rear suspension design could massive help the results.
However due to the time constraints of this project they will not be used in the
ADAMS model of either vehicle. However it is predicted that with the new designs
there should be an extra improvement and both the front and rear of the vehicle.

28
3.7 Summary
Extracting the data from the car as accurately as possible will be important to
obtaining correct results. By not using exact measurements from CAD drawing could
cause inaccuracies in the model. The CG will be found using the formula given and
solved by using a spreadsheet. By using a spreadsheet the effect of moving
components on the CG can be instantly recalculated. The damper settings from the
ADR will be put in Ohlins damper software so the damper rates can be calculated.
The main features of the rear suspension have been mentioned in section with any
relevant formulas given. Along with hand calculations 2D models will be used to
layout out the design before constructing it in ADAMS. The installation ratio will be
optimised for the design to help improve the CPL variation.
A brief explanation of how the ADAMS model has been contacted was given. This
only highlighted the main tasks as a full walk through on how to build the model
would be far too long. An input will be given to each wheel which has increasing
displacement, acceleration and velocity to test the models throughout different ranges
of frequency.
The CPL variation will then be optimised for both models by optimising the damper
rates. With the CPL optimised, the results from both models will be compared to
show if the new design has been a success. Next roll and pitch will be looked at by
using reasonable forces to simulate cornering, acceleration and braking forces. The
effect of different spring rates will be noted and compared against the other model to
look the improvements given in the aims.
29
4. Rear Suspension Design
4.1 Initial Rear Suspension Design
Bastow,D and Howard, G, (1993) note that it is nearly impossible to create a perfect
suspension system and it is down to the designer to choose what features are the most
important for the cars purpose, as a performance increase in one area, will often cause
a deterioration in another. Milliken, W & Milliken, D, (1995) also talk about how
some designs excel in only one feature and conclude that these will not be the race
winning cars as the right combination is necessary.
Forms the literature research, good starting parameters where found from different
authors. These have been summarised below;
Wishbones of unequal length and non-parallel angles should be used. Short-
long arm (SLA) wishbones have an upper wishbone shorter than the top. This
is the most common design for race cars to minimise camber change.
Staniforth, A (1999)
The choice of length of the upper control arm will dictate camber change rate
Isaac-Lowry, J (2004)
The roll centre should be higher at the rear compared to the front to increase
weight transfer when corning. Isaac-Lowry, J (2004)
A low roll centre will help decrease jacking, and help give the driver a good
feel for the car. A roll centre close to the CG will give less roll. Cranhan, T
(1994), Milliken, W & Milliken, D (1995)
A longer lower wishbone will decrease camber gain. Cranhan, T (1994)
Minimize toe angle and track width change during the wheel motion.
Cranhan, T (1994)

30
A toe link should be added to the rear, making adjusting the rear toe easier
and to minimise toe change throughout the wheel motion. Milliken, W &
Milliken, D (1995)
Motion ratio should be keep near to 1:1 to improve damper/spring efficiency.
Cranhan, T (1994)
Minimise scrub radius, Cranhan, T (1994). Front view instant centre should
be kept close to the ground to minimise the scrub radius. Milliken, W &
Milliken, D (1995)
More anti-dive needs to be used with car that have more power and aero.
Cranhan, T (1994)
Side view swing arms should be as long as practically possible to minimise
the chance of power or brake hop. Milliken, W & Milliken, D (1995)
The above points are all helpful starting points but there are also several points that
limit the design. This suspension will be designed around the current ADR3’s running
gear and therefore the position of the gearbox and drive shafts will not change. It will
also contain the same chassis, body and track width. This straight away means that the
maximum wishbone geometry is limited including the location of the spring dampers.
4.2 ARB design
As previously discussed, the ADR doesn’t currently run a rear anti-roll bar. By
designing the new system to be able to use an anti-roll bar could dramatically help
improve the CPL variation and allow the mechanics to fine tune the setup. Below are
several ideas that could be used to the ADR.
Figure 19 shows an ARB system that uses a 3rd
damper. This allows roll and heave to
be set differently. The rolling movements are marked in blue and labelled one and
heave in red labelled 2. During roll, one wheel will start to lift and force needs to be
transferred to counteract this. During roll the damper isn’t used but instead the rocker

31
tries to rotate about the torsion bar. The thickness of this bar can be adjusted changing
the ARB stiffness which can be calculated using formulas 19 to 22 in the
methodology. During heave both ARB connecting rods will push forwards together.
The rocker will now move forwards rotating about the pin or spherical bearing. This
can be controlled by the damper settings but the extra damper does add weight,
complexity and cost.
Figure 19: ARB with extra damper
The design shown in figure 20 is a design that has been used in F1 by both Lola and
Ferrari. This ARB as duel rate and therefore low and high speed roll can be controlled
independently. This is done by using a spring between the rocker and the ARB.
During low speed cornering the only resistant to roll is the torsion bars as the springs
dont fully compress. However during high speed cornering the springs fully compress
creating a solid link between the rocker and the ARB. This ARB is generally a lot
stiffer than the torsion bars to transmit the higher forces. This design is however quite
complex to calculate and setup correctly. The torsion bars would also have to be
replaced fairly often due to being softer than other designs that use this method. The
gearbox would also have to be modified so that the torsion bars could be fitted.

32
Figure 20: Duel rate ARB suspension
The below design use a wheel in a cage that is free to roll. The wheel is connected to
one rocker and the cage the other. As the car corners one rocker will rotate locking the
ball and cage together. This allows the rockers to be connected resisting the roll.
However during bump, both rockers will move together which will not lock the cage
and ball together so the dampers can work independently of each other. However this
design does require enough room to account for the cage and ball rising up. The
longer the arms to the rockers the larger this height change will be.
Figure 21: Roller ARB
33
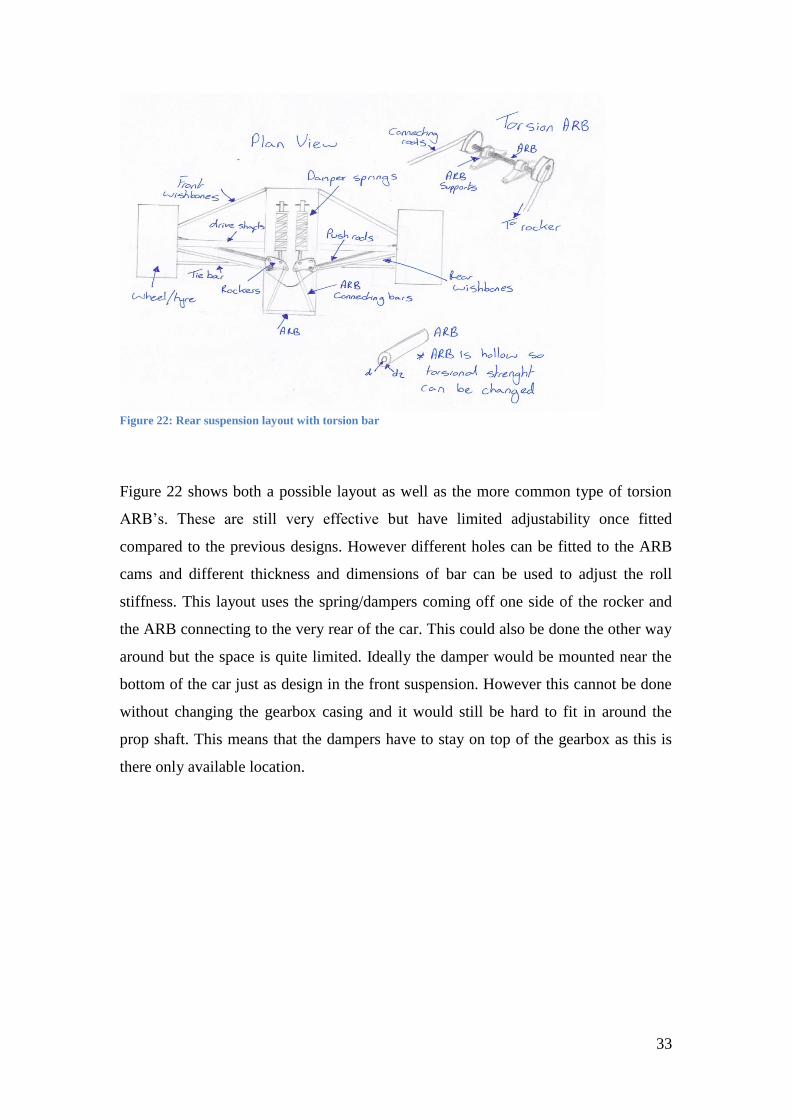
Figure 22: Rear suspension layout with torsion bar
Figure 22 shows both a possible layout as well as the more common type of torsion
ARB’s. These are still very effective but have limited adjustability once fitted
compared to the previous designs. However different holes can be fitted to the ARB
cams and different thickness and dimensions of bar can be used to adjust the roll
stiffness. This layout uses the spring/dampers coming off one side of the rocker and
the ARB connecting to the very rear of the car. This could also be done the other way
around but the space is quite limited. Ideally the damper would be mounted near the
bottom of the car just as design in the front suspension. However this cannot be done
without changing the gearbox casing and it would still be hard to fit in around the
prop shaft. This means that the dampers have to stay on top of the gearbox as this is
there only available location.
34
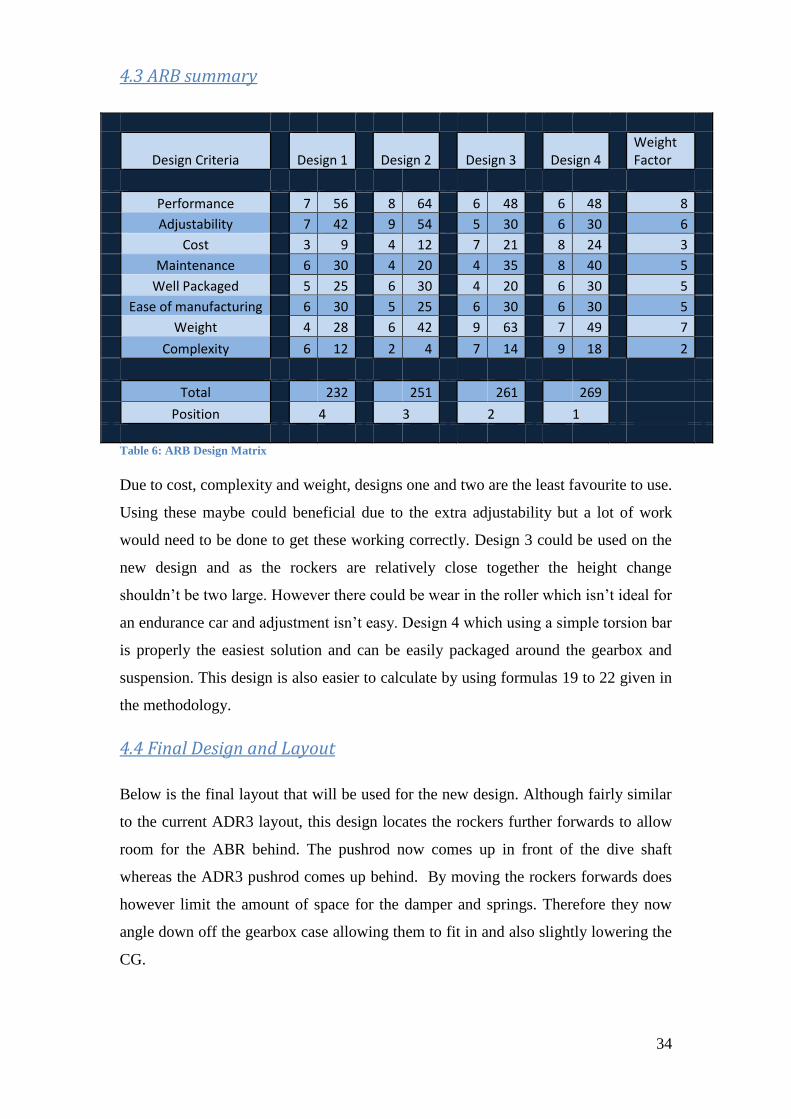
4.3 ARB summary
Design Criteria Design 1 Design 2 Design 3 Design 4 Weight Factor
Performance 7 56 8 64 6 48 6 48 8
Adjustability 7 42 9 54 5 30 6 30 6
Cost 3 9 4 12 7 21 8 24 3
Maintenance 6 30 4 20 4 35 8 40 5
Well Packaged 5 25 6 30 4 20 6 30 5
Ease of manufacturing 6 30 5 25 6 30 6 30 5
Weight 4 28 6 42 9 63 7 49 7
Complexity 6 12 2 4 7 14 9 18 2
Total 232 251 261 269
Position 4 3 2 1
Table 6: ARB Design Matrix
Due to cost, complexity and weight, designs one and two are the least favourite to use.
Using these maybe could beneficial due to the extra adjustability but a lot of work
would need to be done to get these working correctly. Design 3 could be used on the
new design and as the rockers are relatively close together the height change
shouldn’t be two large. However there could be wear in the roller which isn’t ideal for
an endurance car and adjustment isn’t easy. Design 4 which using a simple torsion bar
is properly the easiest solution and can be easily packaged around the gearbox and
suspension. This design is also easier to calculate by using formulas 19 to 22 given in
the methodology.
4.4 Final Design and Layout
Below is the final layout that will be used for the new design. Although fairly similar
to the current ADR3 layout, this design locates the rockers further forwards to allow
room for the ABR behind. The pushrod now comes up in front of the dive shaft
whereas the ADR3 pushrod comes up behind. By moving the rockers forwards does
however limit the amount of space for the damper and springs. Therefore they now
angle down off the gearbox case allowing them to fit in and also slightly lowering the
CG.
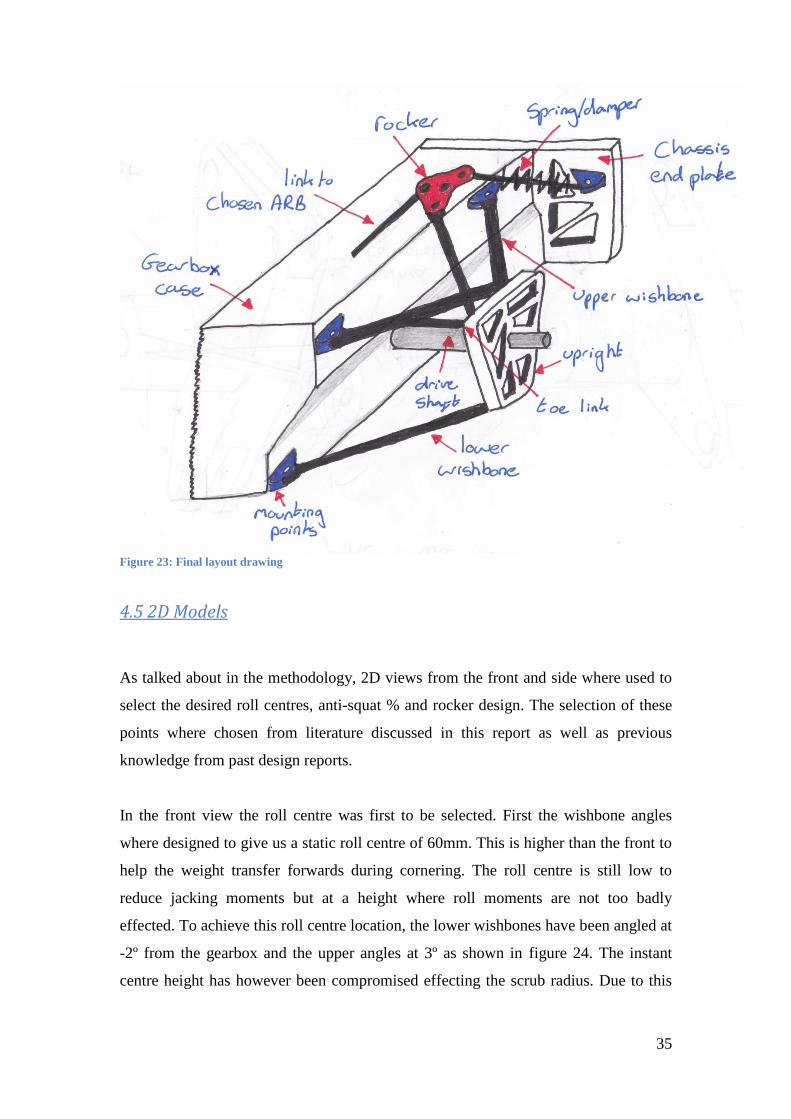
35
Figure 23: Final layout drawing
4.5 2D Models
As talked about in the methodology, 2D views from the front and side where used to
select the desired roll centres, anti-squat % and rocker design. The selection of these
points where chosen from literature discussed in this report as well as previous
knowledge from past design reports.
In the front view the roll centre was first to be selected. First the wishbone angles
where designed to give us a static roll centre of 60mm. This is higher than the front to
help the weight transfer forwards during cornering. The roll centre is still low to
reduce jacking moments but at a height where roll moments are not too badly
effected. To achieve this roll centre location, the lower wishbones have been angled at
-2º from the gearbox and the upper angles at 3º as shown in figure 24. The instant
centre height has however been compromised effecting the scrub radius. Due to this

36
height and location the tire will move outwards at it rises. However it was decided
that the roll centre location was more important than the instant centre.
Figure 24: Front View 2D Solidworks Model
From the 2D side view model the anti-squat features can be decided. The current
ADR3 doesn’t run much anti squat but it has been included in this design to lower the
change in pitch and to help aerodynamics. 40% anti-squat has been chosen due to the
power of the engine only being around 250bhp. This will still allow weight to transfer
to the rear wheels on acceleration to increase rear grip but not so much so the front
loses grip meaning that the driver cannot get on the power as early. The side view
instant centre is 240mm above the ground which was obtained by running the upper
wishbone at -3.6º and the lower at 3º as shown in figure 25. This gives the required
instant centre and minimises the effect on caster angle.
Figure 25: Side View 2D Solidworks Model
% Anti − squat = tan 6.6
(404.071375
)∗ 100 = 40%

37
4.6 Rocker Design
From the literature review we found that Cranhan, T (1994) recommends keeping the
motion ratio close to 1:1. He later goes on to talk about how rocker ratios are often
taken as one value throughout the whole range of the wheel. This is however not true
as the installation ratio changes through the travel of the wheel. However this can be
used to the designer’s advantage and by using a rising wheel rate will help ensure the
car doesn’t bottom out during the end of the stroke.
For the Ohlins TTX36 dampers that will
be used on the car, 60 to 65 mm of
damper displacement is wanted for ±
50mm of wheel. To model this, a 2D
dynamic model has been used in
solidworks (figure 27). In the final design
the damper and rocker will be rotated 90°
about the Y axis. This will not affect the
relationship between them but allow a 2D
model at this stage instead of 3D.
With the chosen damper location, the
rocker angle and dimensions can be
selected. The wheel was moved
through its range and the damper
change noted. The get the required
range the rocker lengths of 40:45mm
where used as shown in figure 26.
120 degrees was used between the
rocker to give a small amount of
raising installation rate. By using this geometry it was possible to get a change
installation ratio change of only 0.73 to 0.88:1. This helps make the car more
predicable due to only a small amount of variation throughout the wheel travel as well
as creating a higher ratio at the end of the travel without dropping off.
Figure 26: Rear Rocker Design
Figure 27: 2D Rocker Design
38
5. ADR Data
5.1 Centre of Gravity position calculation
Using formulas 1 to 14 from the methodology a spread sheet was created to find the
CG location in the x,y and z direction. The first step of the spread sheet is to complete
all the green boxes. This includes the track width and wheelbase, level corner weights
and also the front weight of the vehicle when raised and the height raised. The default
units are kg and mm although Newtons and Pounds would also work. The known
dimensions of the ADR are;
Front track 1256 mm
Rear track 1256 mm
Wheelbase 2750 mm
Next the corner weights of the car need to be found. The scales used where Intercom
Profession computer scales which have a certified accuracy to 0.1%. The scales where
where then positioned beside each wheel and zeroed on a level floor. A 5kg lead
block was then placed on each scale to ensure that the scales where calibrated before
the car was raised and placed on top. To ensure the springs have settled after being
raised to the pads, the vehicle should be bounce at the front and rear. However this is
not the best method and therefore drive on/off scales are better, but where not
available during this test. 70 kg was added into the driver’s seat and the car was tested
as a dry weight (no oil, water or fuel).
The reading from the scales can now be added to the spread sheet of the level vehicle.
This can be used to the find the x and z location of the CG but not the y axis. To find
the GC height the rear of the vehicle needs to be raised to see the amount of weight
transfer onto the front wheels. Due to the car being so low, the front bumper was
removed from the car to allow the rear to be raised to the required amount. This
would have some effect on the accuracy of the results and for future tests the high of
the pads could be raised to overcome this problem more efficiently. With the rear
raised, the new front weights could be added to the spread sheet and the y CG location
calculated. The screen shot of the spread sheet below shows the data record and the
calculated position of the CG.
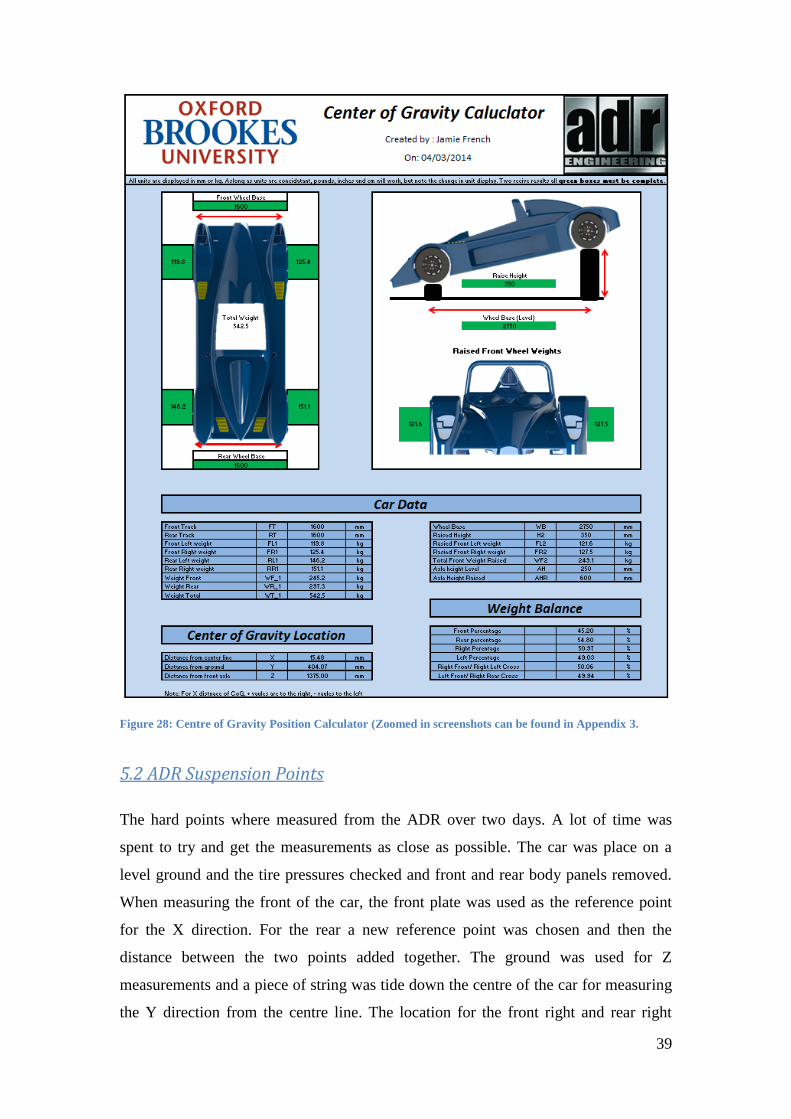
39
Figure 28: Centre of Gravity Position Calculator (Zoomed in screenshots can be found in Appendix 3.
5.2 ADR Suspension Points
The hard points where measured from the ADR over two days. A lot of time was
spent to try and get the measurements as close as possible. The car was place on a
level ground and the tire pressures checked and front and rear body panels removed.
When measuring the front of the car, the front plate was used as the reference point
for the X direction. For the rear a new reference point was chosen and then the
distance between the two points added together. The ground was used for Z
measurements and a piece of string was tide down the centre of the car for measuring
the Y direction from the centre line. The location for the front right and rear right

40
suspension points can be seen in table 7 and 8. The left hand side has been taken as
symmetrical and therefore the X values will just be minus.
Front End
X Y Z
Location ADAMS Code mm
Upper Wishbone Front Point UWF R F 390 280 20
Upper Wishbone Rear Point UWR R F 390 280 410
Lower Wish Bone Front Point LWF R F 310 50 30
Lower Wish Bone Rear Point LWR R F 310 50 655
Upright Upper Front UWBF R F 610 310 195
Upright Lower Front LWBF R F 630 50 235
Damper Mount DMF R F 40 360 780
Rocker Mount Lower Point RMLF R F 310 350 410
Rocker Mount Upper Point RMUF R F 340 410 410 Table 7: Front Right Suspension Hardpoints
Rear End
X Y Z
Location ADAMS Code mm
Upper Wishbone Front Point UWR R R 150 265 2805
Upper Wishbone Rear Point UWF R R 150 265 3335
Lower Wish Bone Front Point LWF R R 150 90 2805
Lower Wish Bone Rear Point LWR R R 120 90 3230
Damper Mount DM R R 80 415 2770
Rocker Mount Lower Point RMLF R R 68 385 3170
Rocker Mount Upper Point RMUF R R 105 435 3170
Upright Upper Mount RUR R R 600 287 3071
Upright Lower Mount RUR R R 610 72 3140
Toe Rod Bar Wishbone TRBW R R 398 277 3189.5
Toe Rod Bar Upright TRBU R R 600 277.4 3189.5 Table 8: Rear Right Suspension Hardpoints
When taking the measurements it was hard to get to some of the points due to other
components getting in the way. This could have further decreased the accuracy of
location of some of the points. If this was to be done again then more parts would
have been taken off to allow exact measurements to be taken. As mentioned in the
methodology CAD models would have helped increase the accuracy and saved time.
Using a tape rule to measure the points is a major limitation in the report and it is felt
that some of the finer suspension geometry’s, such as wishbone angles could have
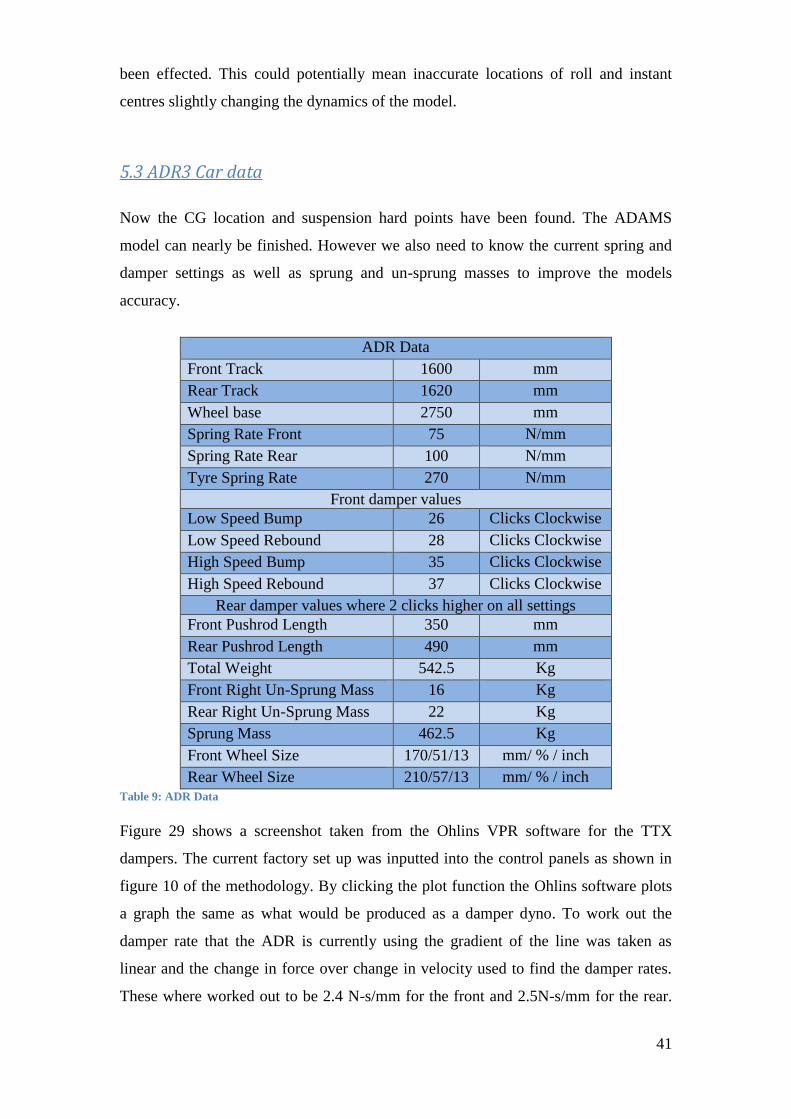
41
been effected. This could potentially mean inaccurate locations of roll and instant
centres slightly changing the dynamics of the model.
5.3 ADR3 Car data
Now the CG location and suspension hard points have been found. The ADAMS
model can nearly be finished. However we also need to know the current spring and
damper settings as well as sprung and un-sprung masses to improve the models
accuracy.
ADR Data
Front Track 1600 mm
Rear Track 1620 mm
Wheel base 2750 mm
Spring Rate Front 75 N/mm
Spring Rate Rear 100 N/mm
Tyre Spring Rate 270 N/mm
Front damper values
Low Speed Bump 26 Clicks Clockwise
Low Speed Rebound 28 Clicks Clockwise
High Speed Bump 35 Clicks Clockwise
High Speed Rebound 37 Clicks Clockwise
Rear damper values where 2 clicks higher on all settings
Front Pushrod Length 350 mm
Rear Pushrod Length 490 mm
Total Weight 542.5 Kg
Front Right Un-Sprung Mass 16 Kg
Rear Right Un-Sprung Mass 22 Kg
Sprung Mass 462.5 Kg
Front Wheel Size 170/51/13 mm/ % / inch
Rear Wheel Size 210/57/13 mm/ % / inch
Table 9: ADR Data
Figure 29 shows a screenshot taken from the Ohlins VPR software for the TTX
dampers. The current factory set up was inputted into the control panels as shown in
figure 10 of the methodology. By clicking the plot function the Ohlins software plots
a graph the same as what would be produced as a damper dyno. To work out the
damper rate that the ADR is currently using the gradient of the line was taken as
linear and the change in force over change in velocity used to find the damper rates.
These where worked out to be 2.4 N-s/mm for the front and 2.5N-s/mm for the rear.

42
This however assumes linear damping which it can be seen isn’t true but is a
reasonable assumption. If this data could be exported out of the Ohlins software and
into ADAMS as a spline then results could be been more accurate.
Figure 29: Current ADR damper settings plotted on Ohlins VPR software

43
6. Results and Discussion
6.1 Damper Optimisation
The dampers where optimised for the front and rear of both models. This would allow
equal results for the CPL variation tests as both models will be set up to perform at
their best. The standard deviation of spring force (Newtons) that represents the tyre
was plotted against the damper settings (N-s/mm) as graph 4 displays for the front of
the new design. The other plots can be found in appendix 3.3.
A table of results can also be seen below for the damper optimisation for models with
the standard spring stiffness of 70N/mm for the front and 100N/mm for the rear.
Graph 4: Damper Optimisation for the front suspension of the new design using a 70N/m spring
122.50
123.00
123.50
124.00
124.50
125.00
125.50
126.00
126.50
2 2.5 3 3.5 4
STD
EV S
pri
ng
Forc
e (
N)
Damper Rate (N-s/mm)
Front Damper Optimsation New Design
Table 10: Damper Optimisation settings
Model Location Spring Stiffness Damper Rate
N/mm N-s/mm
ADR3 Front 70 2.1
Rear 100 3.5
ADR New Design Front 70 2.9
Rear 100 3

44
6.2 Data comparison
Now that the dampers have been optimised a comparison between the two models can
be carried out. To demonstrate the importance of optimising the dampers the original
setup and optimised set up have been show for the front suspension. It can be see in
graphs 5 to 7 that the optimisation process helps to improve the CPL variation and
therefore if both models are optimised the results comparison between the two models
is fair.
Four poster rigs are commonly used to optimise damper against CPL variation just
like the test done in ADAMS above. Several tests can then be run on different spring
so that each spring can have optimum damper settings. However as we will see later
these values are only a good guide line of set up and the values will need to be
tweaked to improve pitch, dive, aero loads and to satisfy the drives preference.
From literate reading and previous experiments carried out for Formula Student and
Formula Renault cars it is clear that body and hub modes effect the CPL variation and
therefore it is these modes that we want to minimise to help improve the CPL.
Graphs 5, 6, 8 and 9 show the body and hub modes for the front and rear suspension.
The body modes show one large peak about around 20 to 30 seconds and a smaller
peak at around 50 seconds. The first peak is the body sprung mass reaching its natural
resonance and the second is induced by the hub mode. The main body mode occurs
due to the body bouncing on its springs creating variation in CPL.
The hub mode occurs later than the body. This is mainly due to the un-sprung mass
being a lot lower that the sprung body mass. Due to the decrease in weight the un-
sprung masses are able to accelerate and keep up with the input signal hence the later
point of resonance.

45
Graph 5: Front Bode Mode
Graph 6: Front Hub Mode
As can be seen from the CPL variation graphs there are two peeks that occur from the
hub and body modes. It can be seen in graph 10 that the CPL variation is lower in the
new design than the current ADR with optimised set up. The first peek happens
slightly earlier in the new design compared to the current ADR3. This is likely due to
the change in suspension geometry and how the weight is moved in the new design
-4,000
-3,000
-2,000
-1,000
0
1,000
2,000
3,000
4,000
0 10 20 30 40 50 60
Acc
ele
rati
on
(m
m/s
^2)
Time (Seconds)
Front Body Mode
ADR3 before damperoptimisation
ADR3 with damperoptimisation
ADR New Design withdamper optimisation
-6,000
-4,000
-2,000
0
2,000
4,000
6,000
0 10 20 30 40 50 60
Acc
ele
rati
on
(m
m/s
^2)
Time (Seconds)
Front Hub Mode
ADR3 before damperoptimisation
ADR3 with damperoptimisation
ADR New Design withDamperoptimisation

46
compared to the old. The optimised rockers have help to decrease the CPL variation
amplitude by making the dampers more effective.
Graph 7: Front CLP variation
Graph 8: Rear Body Mode
1,000
1,200
1,400
1,600
1,800
2,000
2,200
2,400
0 10 20 30 40 50 60
STD
EV F
orc
e (
N)
Time (Seconds)
Front CPL Variation
ADR3 before damperoptimisation
ADR3 with damperoptimisation
ADR New Design withdamper optimisation
-3,500
-2,500
-1,500
-500
500
1,500
2,500
3,500
0 10 20 30 40 50 60
Acc
eler
atio
n (
mm
/s^2
)
Time (Seconds)
Rear Body Mode
ADR3 with damperoptimisation
ADR New Design withdamper optimisation

47
Graph 9: Rear Hub Mode
Graph 10: Rear CPL Variation
As outline in the aims at the start of this report, an increase of CPL variation was to be
achieved in both the damper optimisation process as well as between the two models.
The graphs above show that there was an increase in this area but now the data needs
to be measurable to see if our aims have been met. Table 11 below shows the
percentage increase that was gained from running damper optimisation in ADAMS.
The percentages where calculated by taking an average of only the positive
movements where force was increasing and comparing these against each other to
show the percentage increase.
-10,000
-8,000
-6,000
-4,000
-2,000
0
2,000
4,000
6,000
8,000
10,000
0 10 20 30 40 50 60
Acc
ele
rati
on
(m
m/s
^2)
Time (Seconds)
Rear Hub Mode
ADR3 with damperoptimisation
ADR New Design withdamper optimisation
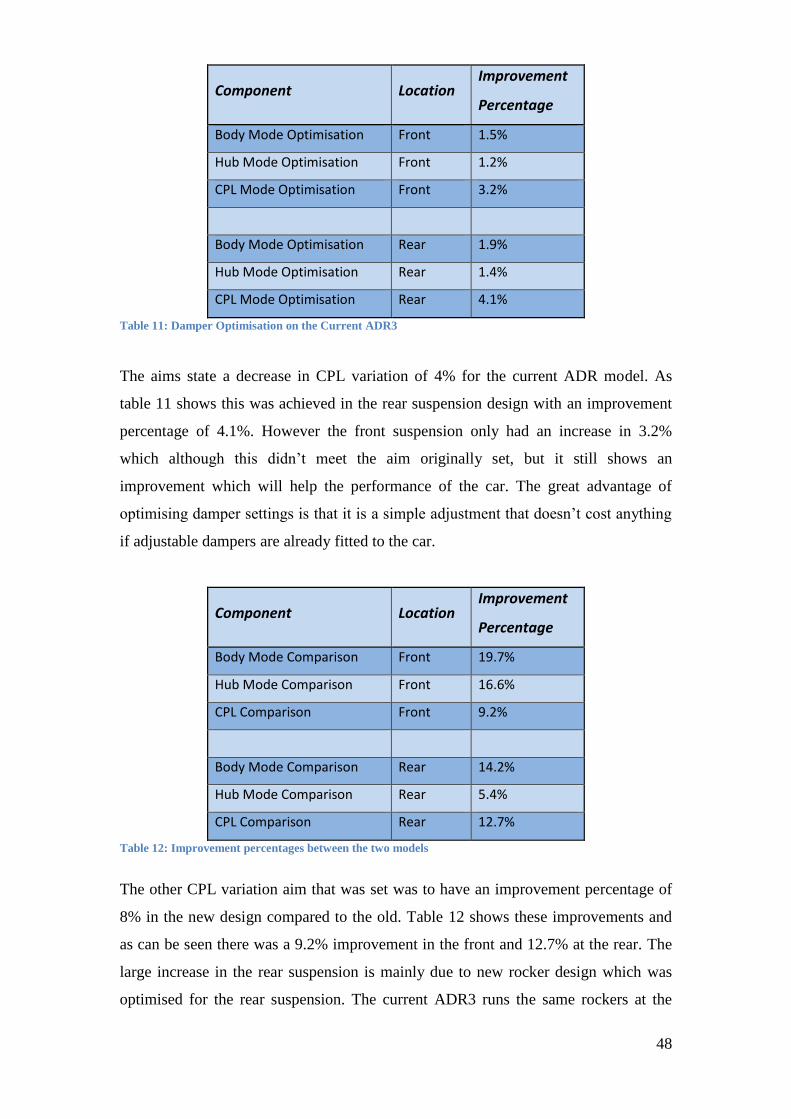
48
Component Location Improvement
Percentage
Body Mode Optimisation Front 1.5%
Hub Mode Optimisation Front 1.2%
CPL Mode Optimisation Front 3.2%
Body Mode Optimisation Rear 1.9%
Hub Mode Optimisation Rear 1.4%
CPL Mode Optimisation Rear 4.1%
Table 11: Damper Optimisation on the Current ADR3
The aims state a decrease in CPL variation of 4% for the current ADR model. As
table 11 shows this was achieved in the rear suspension design with an improvement
percentage of 4.1%. However the front suspension only had an increase in 3.2%
which although this didn’t meet the aim originally set, but it still shows an
improvement which will help the performance of the car. The great advantage of
optimising damper settings is that it is a simple adjustment that doesn’t cost anything
if adjustable dampers are already fitted to the car.
Component Location Improvement
Percentage
Body Mode Comparison Front 19.7%
Hub Mode Comparison Front 16.6%
CPL Comparison Front 9.2%
Body Mode Comparison Rear 14.2%
Hub Mode Comparison Rear 5.4%
CPL Comparison Rear 12.7%
Table 12: Improvement percentages between the two models
The other CPL variation aim that was set was to have an improvement percentage of
8% in the new design compared to the old. Table 12 shows these improvements and
as can be seen there was a 9.2% improvement in the front and 12.7% at the rear. The
large increase in the rear suspension is mainly due to new rocker design which was
optimised for the rear suspension. The current ADR3 runs the same rockers at the
49
front and rear which is unlikely to optimise both geometry’s. These results are better
than expected, however there are several limitations that could have effected these
results.
As talked about earlier in the report, re-engineering the ADR3 suspension by
measuring a fully built car could have created changes in the ADR performance. To
ensure that the models are a similar, 4PR data could be used to validate the ADR3
ADAMS model. This was one of the aims during the planning of the project but due
to 4PR testing not being available at Oxford Brookes until the end of February and the
ADR only being available over the winter season there wasn’t enough time to fit this
into the time scale given. However with the improvements shown above, ADR will
hopefully invest in 4PR testing to validate this model as well making improvements
on their current design.
6.3 Effects of Roll, Dive, Pitch and Heave
As discussed in the methodology and literature review, optimising a car for minimum
CPL variation will not necessarily give the best setup of a vehicle. However making
the CPL variation as low as possible when optimised solely for CPL will still give
improvements even when changes have been made to decrease the amount of body
movement.
We know that CPL variation will be its lowest with the softest springs fitted to the
car. This section however looks into the results of the body when cornering,
accelerating and braking. Graphs 11, 12 & 13 clearly show less body movement when
stiffer springs where fitted. This is what was expected and by using the graphs to
show spring stiffness against body movement the best springs can be selected for the
required body roll.
Graph 11 shows the amount of front body role during a 1.5G corner. As can be seen
the new design has slightly less role than the current ADR3. This is likely to be
because of the lowered overall roll centre of the car. If the car was to be optimised for
only 1.4 degrees of roll while cornering at 1.5G then the current ADR would need
125N/mm springs compared to the 115N/mm that the new design needs. This
therefore shows that that the CPL variation will be disturbed less in the new design.
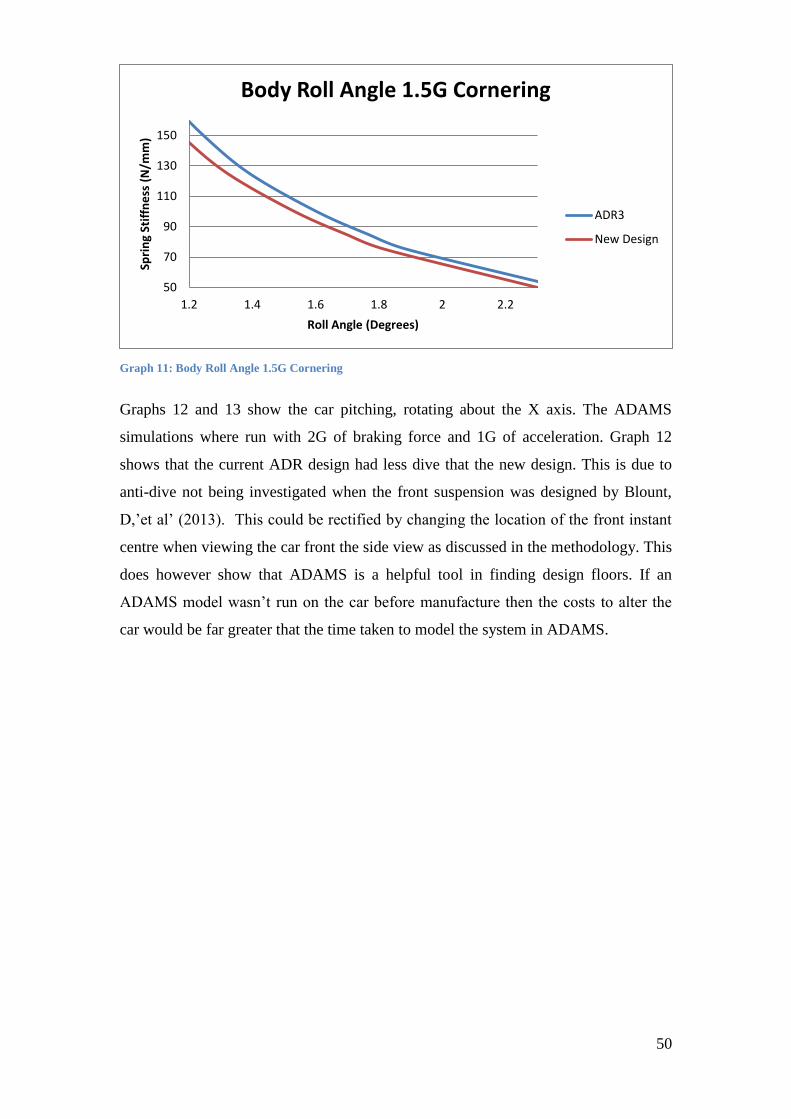
50
Graph 11: Body Roll Angle 1.5G Cornering
Graphs 12 and 13 show the car pitching, rotating about the X axis. The ADAMS
simulations where run with 2G of braking force and 1G of acceleration. Graph 12
shows that the current ADR design had less dive that the new design. This is due to
anti-dive not being investigated when the front suspension was designed by Blount,
D,’et al’ (2013). This could be rectified by changing the location of the front instant
centre when viewing the car front the side view as discussed in the methodology. This
does however show that ADAMS is a helpful tool in finding design floors. If an
ADAMS model wasn’t run on the car before manufacture then the costs to alter the
car would be far greater that the time taken to model the system in ADAMS.
50
70
90
110
130
150
1.2 1.4 1.6 1.8 2 2.2
Spri
ng
Stif
fne
ss (
N/m
m)
Roll Angle (Degrees)
Body Roll Angle 1.5G Cornering
ADR3
New Design
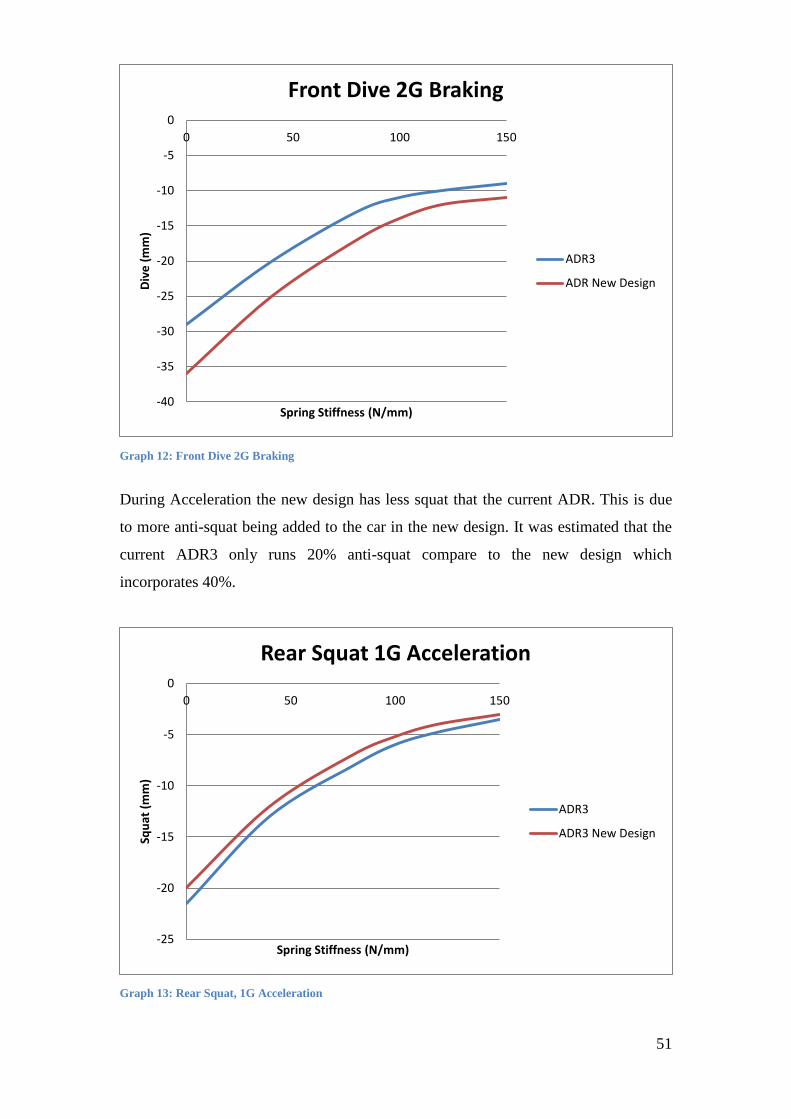
51
Graph 12: Front Dive 2G Braking
During Acceleration the new design has less squat that the current ADR. This is due
to more anti-squat being added to the car in the new design. It was estimated that the
current ADR3 only runs 20% anti-squat compare to the new design which
incorporates 40%.
Graph 13: Rear Squat, 1G Acceleration
-40
-35
-30
-25
-20
-15
-10
-5
0
0 50 100 150D
ive
(m
m)
Spring Stiffness (N/mm)
Front Dive 2G Braking
ADR3
ADR New Design
-25
-20
-15
-10
-5
0
0 50 100 150
Squ
at (
mm
)
Spring Stiffness (N/mm)
Rear Squat 1G Acceleration
ADR3
ADR3 New Design

52
To make these results more comparable to our aims, the above data has been put in
tabulated form as shown in table 13 which shows the change percentage for all three
experiments. The improvements in body roll and squat when using the same springs
has an average of 5.1% less roll and 9.9% less squat. However the decrease in
performance for dive was 15.6%. This figure would have to be improved to make the
design worthy of being used on the ADR as it could drastically effect the overall
performance despite the improvements in other areas.
Feature Change
Percentage
Body Roll Angle 5.1%
Dive -15.6%
Squat 9.9%
Table 13: Roll, Dive and Squat changes
6.4 Aerodynamics Effects
Although not discussed in detail during this report it was learnt from the literature
review that the setup of suspension can be used to optimised the aerodynamics of a
vehicle. A simple test was simulated in ADAMS to model aero on the car which can
then be used to make sure the car isn’t going to bottom out during high down force
levels and a suitable static ride height can be chosen. Using the estimated values
chosen in the methodology of a 44/55 front/rear split and 270 Newtons of downforce
graphs 14 and 15 below where plotted.

53
Graph 14: Ride Height graph at the front with max aero loads
Graph 15: Ride Height graph at the rear with max aero loads
As these values are only estimated and the amount of aero used from track will
change it is very hard to pick an optimum spring to work for all conditions. This could
only be done by over compensating for full aero at all times. However it can be seen
that the gradient of the graph starts to level off after a spring stiffness of 80N/mm.
Therefore a compromise of ride height and stiffness can be chosen depending on the
track characteristics.
6.5 ADR Feedback and Future Interest
On Thursday17th of April a meeting was held with the main director of ADR Adrian
Daniels to review the finding made in this report. Adrian was very interested to see
the results from this project and was impressed by the discoveries made.
-23.00
-22.00
-21.00
-20.00
-19.00
-18.00
-17.00
-16.00
-15.00
50.00 60.00 70.00 80.00 90.00 100.00 110.00
He
ave
(m
m)
Spring Stiffness (N/mm)
4.00
6.00
8.00
10.00
-42.00
-37.00
-32.00
-27.00
-22.00
40.00 60.00 80.00 100.00 120.00
He
ave
(m
m)
Spring Stiffness (N/mm)
2.00
2.50
3.00
4.00
5.00
6.00
54
Adrian summarised the meeting saying that he would be interesting in getting the car
onto a four post rig to not only optimise the current design but also to validate the
model of the current ADR3. He said this would be helpful to make improvement on
the current car but would also like to investigate in more detail the use of the new
suspension. However it was said that the cost for the modifications would currently
overweigh making the changes to the current car but with more tests and
improvements on the design it could be used on the next generation of ADR’s.
For the current 2014 season Adrian said he would like to try the damper and spring
setting recommended and at modifying the rear end suspension to adapt a rear anti roll
bar once more calculations have been done. I was also said the once the model has
been validated by a 4PR test the ADAMS model would be useful to optimise the
current rockers and to try and find improvements on the current design layout for the
current season.
55
7. Conclusion
The overall out come from this report has been very successful and most of the aims
where reached. By optimising the CPL variation for both of the models and
comparing the results against each other helped to show that the new design was an
overall success and an improvement on the current design.
The new design shows less CPL variation at both the front and rear as well less roll
and squat. However there was a substantial amount of extra dive due to this factor not
being included in the front suspension design that was modelled. This does however
help show the advantage of using ADAMS modelling as this imperfection was picked
up before the suspension was built on a vehicle. Now that the models have been built
they can be finally tuned to help get even more out of the design.
Adrian Daniels the director and founder of ADR was very pleased with the results and
seemed very interested in continuing the project for use on the next generation of
ADR’s. It seemed that the large modifications in the front suspension design would be
too costly to do to the current ADR due to the change in driver positive and the
changes that would have to be made to the chassis. He was also very keen on making
some of the setup changes recommended and altering the current suspension designs
to include a rear anti roll bar and modifications to the rockers. Adrian would also like
to get the ADR on a four post rig to validate the ADAMS model for further use.

56
8. Further Work
From the start of this report the size of what could be done with the use of ADAMS
grew massively. This report only looked into the CPL variation and body movement,
however these models can now be used to test numerous other suspension
characteristics. This report was only the very start of using ADAMS for vehicle
dynamics and large companies will often have teams of engineers working on project
such as this.
Some of the extra simulations that would be useful to run on the ADAMS model
created would include camber, toe and track change throughout the wheel travel, the
effects of steering the front wheel and weight transfer. With more data and a good tyre
model this model could be expanded to simulate fully dynamic cornering but this
would involve a lot more time on the project.
In the planning stage of this project 4PR was trying to be set up to validate the
ADAMS model of the ADR. This would have been extremely useful to validate the
results produced. However this wasn’t complete during this report due to the delay in
the four post rig training and the availability of a rolling ADR. This would be the first
stage that would be taken in the continuation of this project and would also allow
ADR to get more out of their current car.
57
9. References
Allage, A. (2008). Suspension Technical Article: Issue #1. Available at:
http://features.evolutionm.net/printpage.php?cat=&id=109 (Accessed: 18 November
2013).
Antoun, R. Hackert, P. O’Leary, M. and Sitchin, A. (1986). Vehicle Dynamic Handling
Computer Simulation: Model Development, Correlation, and Application Using
ADAMS. SAE Technical paper No. 860574, Warrebdale, PA: SAE Publications.
Avon Tyres Motorsport. (nd). Resource Center: Downloads. Available at:
http://www.avonmotorsport.com/resource-centre/downloads (Accessed: 19 November
2013).
Balike,K, Rakheja, S and Stiharu,I. (2010). Influence of Suspension Kinematics and
Damper Asymmetry on the Dynamics Reponses of a Vehicle under Bump and Pothole
Excitation. SAE Technical paper No.2010-01-1135, Warrebdale, PA: SAE
Publications.
Bastow, D. and Howard, G. (1993). Car Suspension and Handling: 3rd ed. Chichester:
John Wiley and Sons.
Blount, D, Childs, W, Cooper, M, Fewkes, J, French, J and Smith, B. (2013). U04527
Automotive engineering design and CAD: Suspension Design Project. Oxford: Oxford
Brookes University.
Blundell, M. and Harty, D. (2004). The Multibody Systems Approach to vehicle
Dynamics. Oxford: Elsevier’s Science.
Boggs, C. Ahmadlan, M. and Southward, S. (2008). Application of System
Identification for Effient Suspension Tuning in High-Performance Vehicles: Quarter-
58
Car Study. SAE Technical paper No.2008-01-2962, Warrebdale, PA: SAE
Publications.
Bolles, B. (2010). Advanced Race Car Chassis Technology: Winning Chassis Design
and Setup for Circle Track and Road Race Cars. New York: Penguin Group.
Bradley, A (2013). Lecture notes from U04585: Selection of ideal spring and damper
values [Adapted from original material by Balkwill, J], School of Engineering and
Mathematical Sciences, Oxford Brookes University.
Crahan, T. (1994). Modeling Steady-State Suspension Kinematics and Vehicle
Dynamics of Road Racing Cars – Part 1: Theory and Methodology. SAE Technical
PaperNo. 942505, Warrebdale, PA: SAE Publications.
Elite Racing Transitions. (nd). MX200 IL: Bike Engine LSD. Available at:
http://www.eliteracingtransmissions.com/products/mx200-il/ (Accessed: 20 November
2013).
Hallum, C. (1998). Understanding Race Tyres. SAE Technical paper No.983028,
Warrebdale, PA: SAE Publications.
Haney, P. (2009). The Racing & High-performance Tire: Using the Tires to Tune for
Grip & Balance. Warrendale, PA: SAE Publications.
Isaac-Lowry, J. (2004). Suspension Design: Types of suspension. Available at:
http://www.automotivearticles.com/123/Suspension_Design_Types_of_Suspensions.sht
ml (Accessed: 10 August 2013).
Kelly, J. (2002). Track Simulation and Vehicle Characterization with 7 Post Testing.
SAE Technical paper No. 2002-01-3307, Warrebdale, PA: SAE Publications
Kirk, C. (2012). Push or Pull?: Badger looks into F1 Front Suspension. Available at:
http://badgergp.com/2012/06/f1-science-front-suspension/ (Accessed: 14 August 2013).

59
Kojima, M. (2012). The Ultimate guide to Suspension and handling: It’s all in the
Geometry – Part One, The Roll Center. Available at:
http://www.motoiq.com/MagazineArticles/ID/2804/PageID/5469/The-Ultimate-Guide-
to-Suspension-and-Handling-Its-All-in-the-Geometry-Part-One-The-Roll-Center.aspx
(Accessed: 18 November 2013).
Kowalczyk, H. (2002). Damper Tuning with the use of a Seven Post Shaker Rig. SAE
Technical paper No. 2002-01-0804, Warrebdale, PA: SAE Publications
Kowalczyk, H Kelly, J.. and Oral, H. (2002). Track Simulation and Vehicle
Characterization with 7 Post Testing. SAE Technical paper No.2002-01-3307,
Warrebdale, PA: Society of Automotive Engineers
Laminine, J. & Martin, K. (2009). Data Acquisition Systems: Issues of Use and
Interpretation of Data. SAE Technical paper No. 2009-01-1673, Warrebdale, PA: SAE
Publications.
Longhurst, C. (2013). Rear Suspension: Dependant systems. Available at:
http://www.carbibles.com/suspension_bible_pg2.html (Accessed: 12 August 2013).
Mark Elbers. (NA). Vechicle Centre of Gravity: It all starts with a definition. Available
at: http://www.team.net/TR8/tr8cca/wedgemath/02_CG_def/CG_def.html (Accessed:
26 November 2013)
McGuire, M. and Guenther, D. (1993). Longitudinal Suspension Compliance Modeling
with ADAMS. SAE Technical paper No. 930764, Warrebdale, PA: SAE Publications.
McNeely, P. (2000). Elimination of Roll, Squat, and Dive through Biased Suspension
Response. SAE Technical paper No. 2000-01-1632, Warrebdale, PA: SAE Publications.
Milliken, W. and Milliken, D. (1995). Race Car Vehicle Dynamics. Pennsylvania: SAE
Publications.
60
Pacejka, H. (2006). Tyre and Vehicle Dynamics: Second Edition. Oxford: Elsevier’s
Science.
Rao, S. Heydinger, G. Salaanl, M. and Guenther, D. (2009). Vehicle Dynamics
Modeling and Validation for the 2003 Ford Expedition with ESC using ADAMS view.
SAE Technical paper No. 2009-01-0453, Warrebdale, PA: SAE Publications.
Riley, Q. (2001). Automobile Ride, Handling, and Suspension Design: With
Limplications for Low-Mass Vehicles. Scottsdale, AZ, Robert Q. Riley Enterpries,
Rob Robinette. (nd). CG Height Calculator. Available at:
http://robrobinette.com/cg_height_calc.htm (Accessed: 26 November 2013)
Saeedi, M and Kazemi, R. (2013). Stability of Three-Wheeled Vehicles with and
without Control Systems. ISAE, Tehran, Iran: IJAE
Shedden, A. (2013). Suspension Design. Available at:
http://www.asracingblog.com/6/category/all/1.html (Accessed: 04/02/2014)
Speedeuroseries.com (2012). Technical Regulations for production sports cars: Group
CN. Available at: http://www.speedeuroseries.com/wp-content/uploads/2011/01/FIA-
Article-259-published-23.11.2011.pdf (Accessed: 20 November 2013)
Staniforth, A. (1999). Competition Car Suspension Design, Construction, Tuning, Third
Edition. . Somerset: Haynes Publishing.
Staniforth, A. (2006). Competition Car Suspension: Practical Handbook, 4th ed.
Somerset: Haynes Publishing.
Stoffman,D, ‘et al’. (2004). Low Cost Data Acquisition for Racing Applications. SAE
Technical paper No. 2004-01-3531, Warrebdale, PA: SAE Publications.
61
10. Bibliography
Abdelhady, M (2002). Aerodynamic Effects on Ride Comfort and Road Holding of
Actively Suspended Vehicles. USA: SAE International.
Burgess, M. Flwming, N. Wootton, M. and Williams, S. (2004) A Tool for Rapid
Vehicle Suspension Design. SAE Technical paper No. 2004-01-3543, Warrebdale, PA:
SAE Publications.
Crahan, T. (1994). Modeling Steady-State Suspension Kinematics and Vehicle
Dynamics of Road Racing Cars – Part 2: Examples. SAE Technical PaperNo. 942506,
Warrebdale, PA: SAE Publications.
Danesin, D. Krief, P. Sorniotti, A. Velardocchia, M. (2003). Active Roll Control to
Increase Handling and Comfort. SAE Technical paper No.2003-01-0962, Warrebdale,
PA: SAE Publications.
Deakin, A. Shovlin, A. Brooks, P. and Crolla, D. (1998). Design of a Single Seater
Racing Car Suspension System. SAE Technical paper No.983020, Warrebdale, PA:
SAE Publications.
Fei, L. ZhaoXiang, D. Hongliang, D. and Youqiang, C. (2007). The Co-simulation of
Steerign and Suspension Systems with ADAMS & Matlab/Simulink. SAE Technical
paper No. 2007-01-3666, Warrebdale, PA: SAE Publications.
Floyd, S and Law, H (2009). Simulation and Analysis of suspension and Aerodynamic
Interactions of Race Cars . USA: SAE International.
Gerrard, M. (2002). Kinematic Suspension Linkages: A Model for Their Behaviour and
a procedure for their Design. SAE Technical paper No. 2002-01-0281, Warrebdale, PA:
SAE Publications.
Hubert, K. & Kumar, A. (2005). Anti-Roll Stability Suspension Technology. SAE
Technical paper No. 2005-01-3522, Warrebdale, PA: SAE Publications.
62
Pan, Q, Perumalswami, P, Rakowska, J and Medoro, M (2008). Mass Damper
Optimization Study to Reduce Seat Vibration. USA: SAE International
Ravi, D. (2009). Evaluation of Vehicle Understeer Gradient Definitions PhDthesis. The
Ohio State University.
Shi, W. & Hall, S. (2006). An Investigation of the Cornering Load Sensitivity of the
Race Tyre. SAE Technical paper No. 2006-01-1630, Warrebdale, PA SAE
Publications.
Siegler, B. & Crolla, D. (2002). Lap Time Simulation for Racing Car Design. SAE
Technical paper No. 2002-01-0567, Warrebdale, PA: SAE Publications.
Tathavadekar, P, Liu, K, Rajan, S and Johnson, P (2009). Application of Tuned Mass
Damper to Address Discrete Excitation Away From Primary Resonance Frequency of a
Structure. USA: SAE International.
Wang, L. (2012). Experimental Investigation of a Hydraulically Interconnected
Suspension in Vehicle Dynamics and Stability Control. SAE Technical paper No. 2012-
01-0240, Warrebdale, PA: SAE Publications .
63
11. Appendix
11.1 Appendix 1
Technical Regulations for Production Sports Cars (Group CN) Article 259
Available at: http://www.speedeuroseries.com/wp-content/uploads/2011/01/FIA-
Article-259-published-23.11.2011.pdf Accessed: 20 November 2013
RTICLE 10: SUSPENSION
10.1 All road wheels/axles must be suspended from the chassis/body unit by a springing
medium (i.e. axles or wheels must not be connected directly to the chassis/body unit).
The springing medium must not consist of bolts located through flexible bushes or
flexible mountings. There must be independent movement of the axles/hub carriers/stub
axles giving suspension travel from "bump" to "droop" in excess of the flexibility of the
mounting location attachments.
10.2 Active suspension
Active suspension systems are prohibited, as are all systems enabling the flexibility of
springs, shock absorbers and the ground clearance height of the car to be controlled
while the car is in motion.
10.3 Chromium-plating of steel suspension elements is prohibited.
10.4 Suspension parts made partially or completely from composite materials are
prohibited.
ARTICLE 12: WHEELS AND TYRES, STEERING
12.1 The maximum width of the complete wheel is 16". This measurement shall be
taken horizontally at the height of the axle with the tyre at normal running pressure and
with the car in running order with the driver on board.
12.2 The number of wheels is fixed at four.
12.3 A safety spring must be in place on the wheel nut throughout the duration of the
event and must be replaced after each wheel change. These springs must be painted
dayglo red or orange. Alternatively, any other wheel-retaining device which has been
approved by FIA must be used throughout the event.
12.4 Cars equipped with four-wheel steering systems are prohibited.
12.5 Pressure control valves on the wheels are prohibited.
12.6 The use of wheels equipped with a tyre-retaining device is recommended.

64
12.7 There must be a continuous mechanical connection between the steering wheel and
the steered wheels. Cars built as from 01.01.2007 must be fitted with a steering
column approved by the FIA in accordance with the approval procedure of safety
structures for sports cars (available from the FIA Technical Department on request, for
manufacturers only). The competitor must supply a copy of the FIA approval certificate.
This copy must be delivered by the car manufacturer.
12.8 Wheels made partially or entirely from composite materials are prohibited.
ARTICLE 13 : COCKPIT
13.4 Footwells
13.4.1) The car must have two footwells, defined as two free symmetrical volumes on
either side of the longitudinal centre-line of the car, each one having a minimum vertical
cross-section of 750 cm2. This cross-section must be maintained from the pedal faces to
the vertical projection of the centre of the steering wheel.
13.4.2) The minimum width of each footwell is 250 mm and this width must be
maintained over a height of at least 250 mm.
13.7 Pedals The soles of the driver's feet, when he is seated in the normal driving position with his
feet on the pedals and with the pedals in the inoperative position, shall not be situated
forward of the vertical plane passing through the centre-line of the front wheels. Should
the car not be fitted with pedals, the driver's feet at the maximum forward extension shall
not be situated forward of the vertical plane mentioned above.
13.10 Steering wheel
The steering wheel must be fitted with a quick release mechanism. Its method of release
must be by pulling a concentric flange installed on the steering column behind the wheel
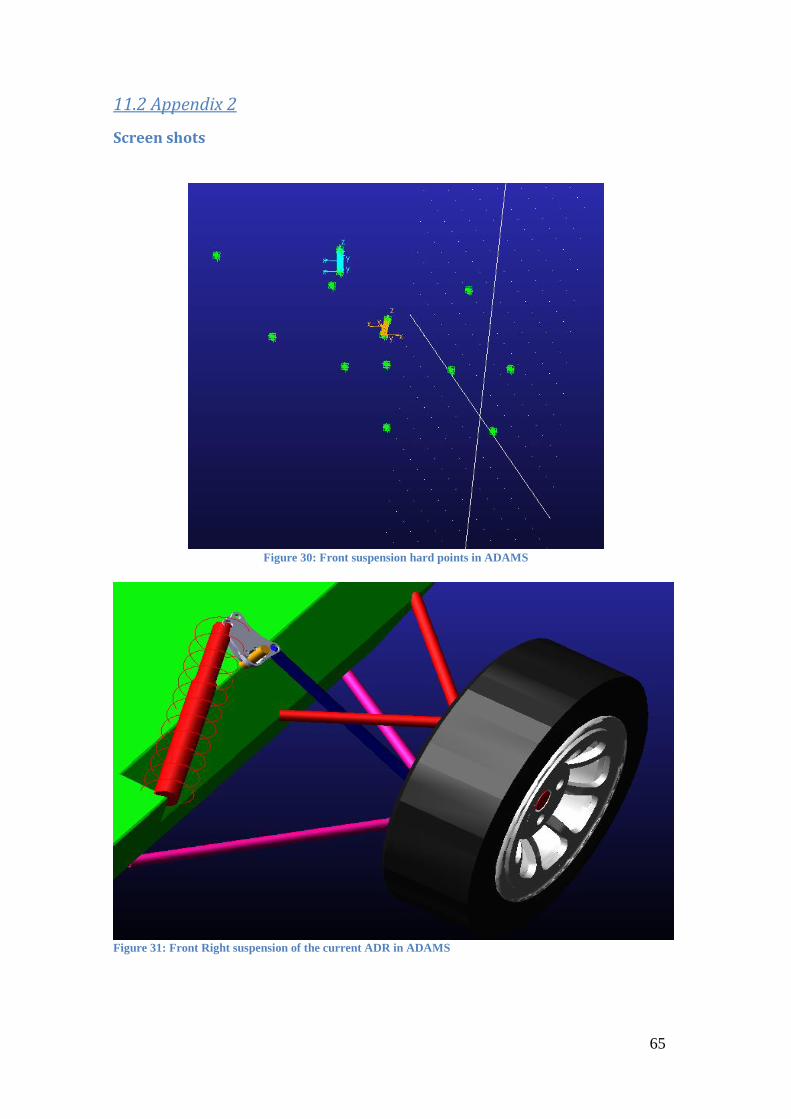
65
11.2 Appendix 2
Screen shots
Figure 30: Front suspension hard points in ADAMS
Figure 31: Front Right suspension of the current ADR in ADAMS
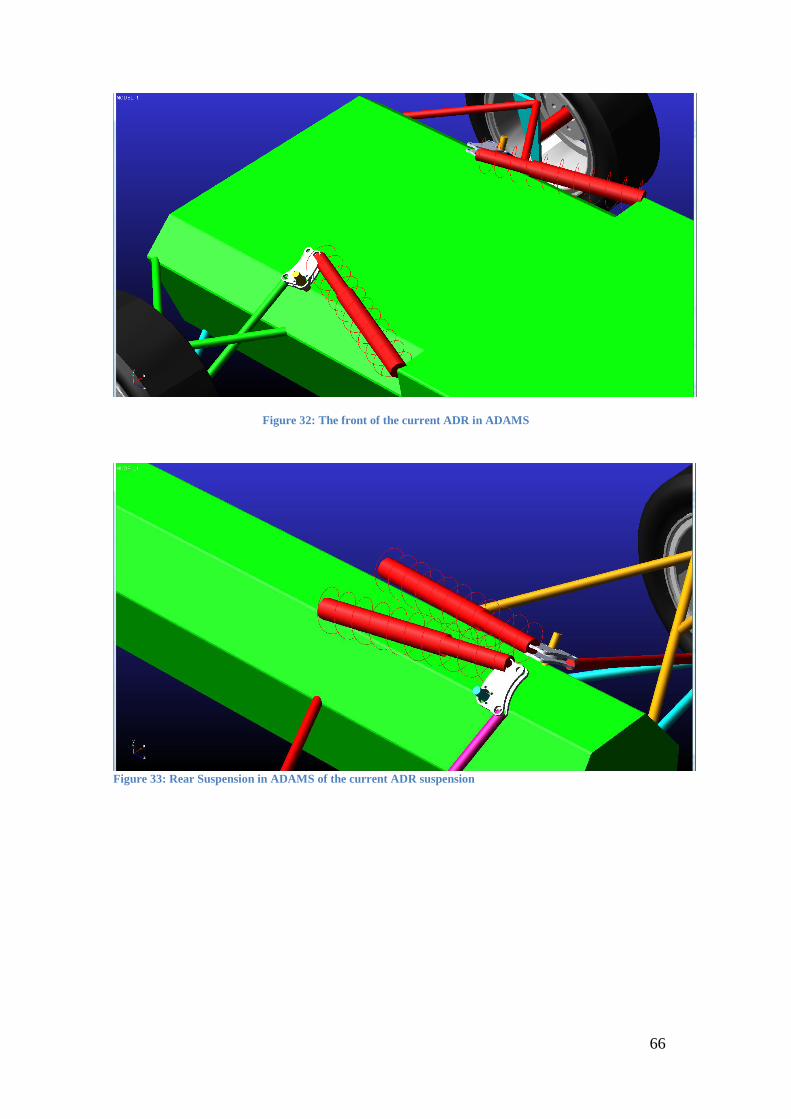
66
Figure 32: The front of the current ADR in ADAMS
Figure 33: Rear Suspension in ADAMS of the current ADR suspension
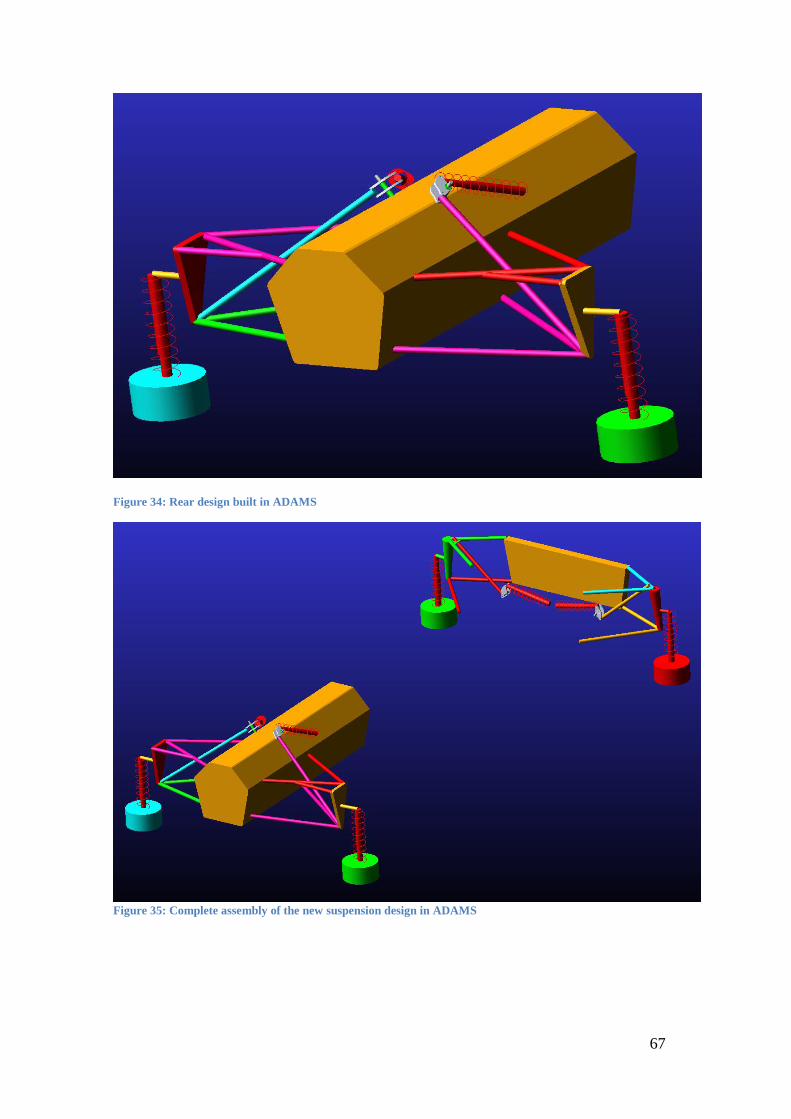
67
Figure 34: Rear design built in ADAMS
Figure 35: Complete assembly of the new suspension design in ADAMS

68
Figure 36: Body, Hub and CPL for the current ADR3
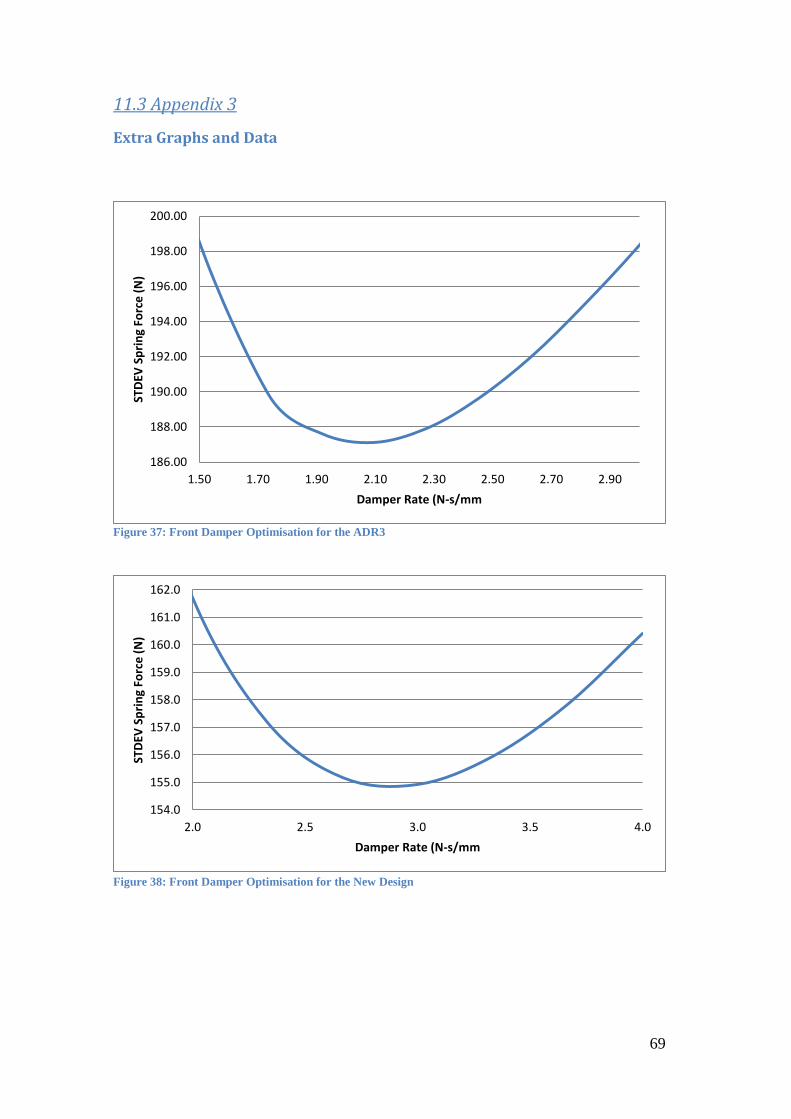
69
11.3 Appendix 3
Extra Graphs and Data
Figure 37: Front Damper Optimisation for the ADR3
Figure 38: Front Damper Optimisation for the New Design
186.00
188.00
190.00
192.00
194.00
196.00
198.00
200.00
1.50 1.70 1.90 2.10 2.30 2.50 2.70 2.90
STD
EV S
pri
ng
Forc
e (
N)
Damper Rate (N-s/mm
154.0
155.0
156.0
157.0
158.0
159.0
160.0
161.0
162.0
2.0 2.5 3.0 3.5 4.0
STD
EV S
pri
ng
Forc
e (
N)
Damper Rate (N-s/mm
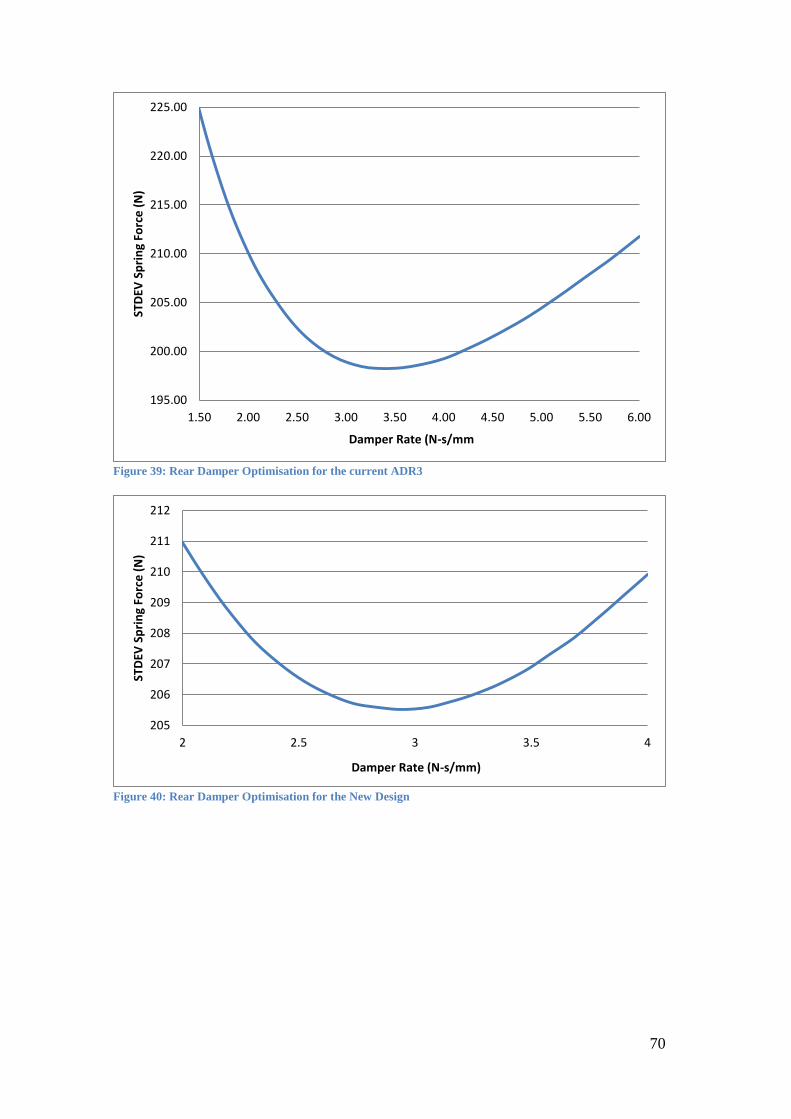
70
Figure 39: Rear Damper Optimisation for the current ADR3
Figure 40: Rear Damper Optimisation for the New Design
195.00
200.00
205.00
210.00
215.00
220.00
225.00
1.50 2.00 2.50 3.00 3.50 4.00 4.50 5.00 5.50 6.00
STD
EV S
pri
ng
Forc
e (
N)
Damper Rate (N-s/mm
205
206
207
208
209
210
211
212
2 2.5 3 3.5 4
STD
EV S
pri
ng
Forc
e (
N)
Damper Rate (N-s/mm)

71
Front Track FT 1600 mm
Rear Track RT 1600 mm
Front Left weight FL1 119.8 kg
Front Right weight FR1 125.4 kg
Rear Left weight RL1 146.2 kg
Rear Right weight RR1 151.1 kg
Weight Front WF_1 245.2 kg
Weight Rear WR_1 297.3 kg
Weight Total WT_1 542.5 kg
Center of Gravity Location
Distance from center line X 15.48 mm
Distance from ground Y 404.07 mm
Distance from front axle Z 1375.00 mm Table 14: Centre of gravity calculator Zoom in Bottom Left
Wheel Base WB 2750 mm
Raised Height H2 350 mm
Raised Front Left weight FL2 121.6 kg
Raised Front Right weight FR2 127.5 kg
Total Front Weight Raised WF2 249.1 kg
Axle height Level AH 250 mm
Axle Height Raised AHR 600 mm
Weight Balance
Front Percentage 45.20 %
Rear percentage 54.80 %
Right Parentage 50.97 %
Left Percentage 49.03 %
Right Front/ Right Left Cross 50.06 %
Left Front/ Right Rear Cross 49.94 % Table 15: Centre of gravity calculator Zoom in Bottom Right

72
END OF DOCUMENT