Embed Size (px)
Citation preview
Research ArticleDispersion and Sensitivity Analysis of Quasi-Scholte Wave LiquidSensing by Analytical Methods
Onursal Önen
Aselsan Defense Industries, Mehmet Akif Ersoy Mh., 296. Cad. No. 16, Yenimahalle, 06370 Ankara, Turkey
Correspondence should be addressed to Onursal Önen; [email protected]
Received 30 June 2017; Revised 15 October 2017; Accepted 17 October 2017; Published 7 December 2017
Academic Editor: Christos Riziotis
Copyright © 2017 Onursal Önen. This is an open access article distributed under the Creative Commons Attribution License, whichpermits unrestricted use, distribution, and reproduction in any medium, provided the original work is properly cited.
Ultrasonic-guided wave sensing relies on perturbation of wave propagation by changing physical properties of the target media.Solid waveguides, through which guided waves can be transduced between the transducer and the target media, are frequentlyemployed for liquid sensing and several other applications. In this manuscript, liquid sensing sensitivity of dispersive quasi-Scholtewaves, which are guided interface waves that travel at the solid-liquid boundary, is investigated. Dispersion analysis ofquasi-Scholte waves is done and sensitivities of quasi-Scholte waves to changes in fluid density and speed of sound in a dipstickconfiguration are analyzed. An experimentally verified analytical model based on a global matrix approach is employed in anondimensional manner to generate representative dispersion and sensitivity surfaces. Optimum configurations with respect tothe material properties of the liquid and of the waveguide are illustrated, which would enable optimal quasi-Scholte liquid sensing.
1. Introduction
Ultrasonic sensors have become popular in the recentdecades in a wide range of applications for research purposesand as commercial products such as displacement sensors[1], in liquid property measurements [2–11], cure monitor-ing [12], material property determination [13, 14], fillinglevel sensor [15], temperature sensing [16–19], and structuralhealth monitoring [20]. Ultrasonic sensing relies on monitor-ing quantitative changes in ultrasonic wave propagation,usually in terms of ultrasonic wave velocity or attenuationresulting from perturbations in target sensing media/struc-ture. Ultrasonic wave propagation can be perturbed by sev-eral parameters such as changing temperature, mechanicalstress, stiffness, boundary conditions, density, polymeriza-tion, bulk and shear viscosity, and state. Through carefulselection and design of transduction mechanism, thesechanges can be isolated from each other, enabling sensingof target quantity. By means of transduction mechanism,ultrasonic sensing techniques can be categorized as single-and multitransducer systems. In a single transducer method,the same transducer is employed for transmit/receive
operation, whereas in multitransducer systems, at least one(or more) transducer(s) are used to transmit waves and oneor more transducers are used for receiving the signal.
Frequently, waveguides that are used to transmit ultra-sonic wave between the target media/structure and thetransducer are employed in ultrasonic sensing systems.They are essential in applications, where target physicalconditions are unsuitable for direct transduction (uncon-ventional geometry, liquid state, extreme temperatures,and high radioactivity), or inaccessible (buried, encapsu-lated). As can be depicted from the literature, there is nosingle solution to guided ultrasonic sensing with several dif-ferent wave types, waveguide structure and material, andelectrical periphery. Each ultrasonic sensor problem requiresextensive examination of the problem, careful selection oftransducer, waveguide, and electrical periphery type, specifi-cally for that problem.
Scholte wave ultrasonic sensing is one of the promisingmethods, which employs Scholte interface waves for charac-terization and sensing of liquids. Scholte waves are elasticwaves that propagate at the solid-liquid interface. They arenondispersive for acoustically thick interfacing media; and
HindawiJournal of SensorsVolume 2017, Article ID 9876076, 9 pageshttps://doi.org/10.1155/2017/9876076
dispersive propagation can be observed, for example, whenan acoustically thin (i.e., for small thickness-frequency prod-ucts) solid waveguide is immersed in a liquid. DispersiveScholte waves, named as quasi-Scholte mode [3], have vary-ing phase and group velocity as a function of frequency.The energy content of the waves is concentrated in a fewwavelengths around the interface in each medium with itsdistribution depending on the material properties, thickness,and frequency at quasi-Scholte mode. Scholte wave velocity isalways lower than the longitudinal velocity of the fluid andthe transverse velocity of the interfacing solids [21]. Sensingapplications with quasi-Scholte waves have been reportedfor liquid characterization [3, 11, 22–24] with their mostimportant advantages being single transducer compatibility,high sensitivity to perturbations in liquids, and losslesstransmission through the waveguide enabling separation oftransducer and the target. Dipstick sensing system can beemployed, which briefly consists of a thin plate solid wave-guide, to which a shear wave transducer is attached to oneend, and the other side is immersed in the target liquid. Awaveform generator feeds the transducer with pulses togenerate Lamb waves in the dry end of the waveguide, whichis converted to Scholte waves upon entry to the liquid-immersed side. Scholte waves are reflected back from theend of the waveguide, which is reconverted to Lambwaves while passing through the wet/dry boundary andthen received back by the transducer. The received signalis postprocessed to extract Scholte wave velocity that isused to characterize the fluid. Interested readers may referto [2, 3, 22] for further details on the experimental setupand postprocessing.
In this manuscript, dispersion analysis of quasi-Scholtewaves and sensitivities of quasi-Scholte and Scholte modesto changes in fluid density and speed of sound in a dipstickconfigurations are presented. An analytical model, which isdescribed in the next section, is used to investigate dispersionand sensitivity of quasi-Scholte waves with respect to mate-rial properties of the liquid and of the waveguide.
2. Analytical Modelling
Quasi-Scholte wave dispersion and sensitivity are analyticallyinvestigated in a multilayer global matrix approach followinga convention similar to Lowe’s [25] based on ThomsonHaskell approach [26], with the main difference being usingpartial wave vectors instead of layer matrices. The partialwaves, positive and negative travelling longitudinal andshear waves, are defined to trace guided wave propagation[2, 25, 27–32]. Detailed derivation of the stress and displace-ment expressions can also be found in [25]. A brief overviewof the analytical model is presented below. Starting withNavier-Stokes equation (1), Helmholtz decomposition isapplied for the displacement field (u), assuming longitudinal(represented by scalar fieldΦ) and shear (represented by vec-tor field Ψ) wave propagation is not coupled with each other(2). In (1), ρ is the density; λ and μ are the Lame constants.
ρ∂2u∂t2
= λ + μ ∇ ∇ ⋅ u + μ∇2u, 1
u = u S + u L
= ∇ϕ + ∇× ψ,2
ϕ = A L ei k·x−ωt
= A L ei k1x1+k2x2+k3x3−ωt ,
3
ψ = A S ei k·x−ωt
= A S ei k1x1+k2x2+k3x3−ωt
4
Using harmonic wave assumption, the equations for thetwo wave fields ((3) and (4)) are solved and expressions forthe displacements and stresses are obtained by the theory ofelasticity equations (also presented in detail at [25]).
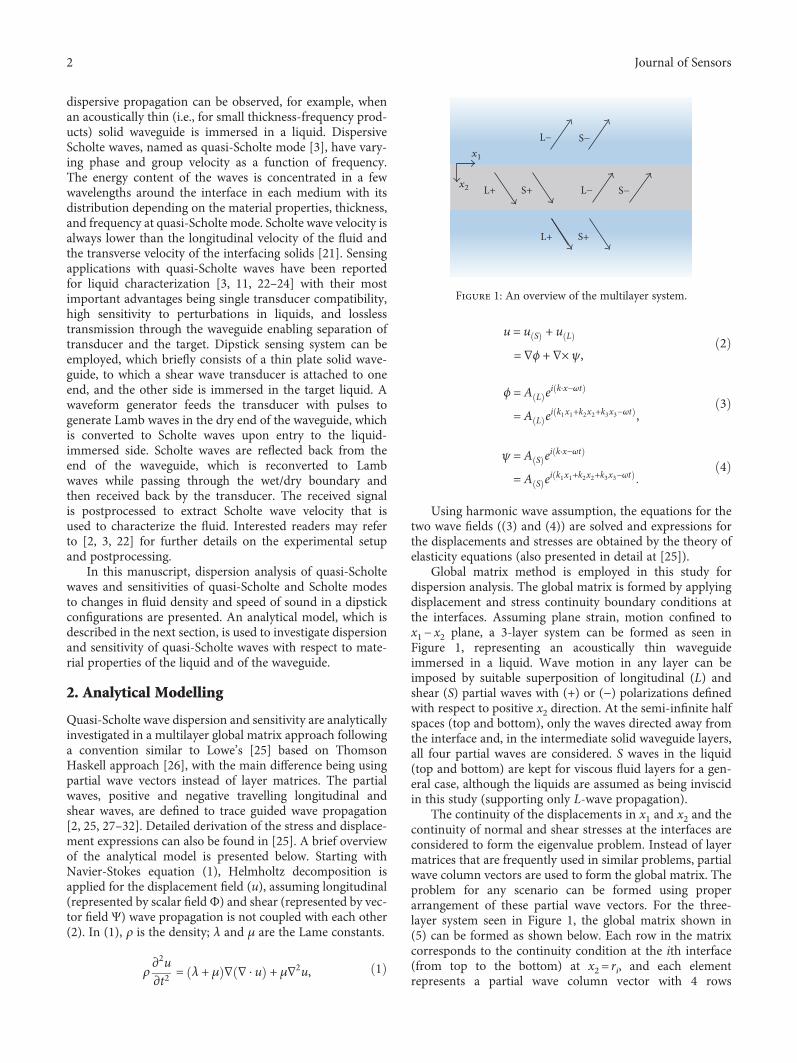
Global matrix method is employed in this study fordispersion analysis. The global matrix is formed by applyingdisplacement and stress continuity boundary conditions atthe interfaces. Assuming plane strain, motion confined tox1− x2 plane, a 3-layer system can be formed as seen inFigure 1, representing an acoustically thin waveguideimmersed in a liquid. Wave motion in any layer can beimposed by suitable superposition of longitudinal (L) andshear (S) partial waves with (+) or (−) polarizations definedwith respect to positive x2 direction. At the semi-infinite halfspaces (top and bottom), only the waves directed away fromthe interface and, in the intermediate solid waveguide layers,all four partial waves are considered. S waves in the liquid(top and bottom) are kept for viscous fluid layers for a gen-eral case, although the liquids are assumed as being inviscidin this study (supporting only L-wave propagation).
The continuity of the displacements in x1 and x2 and thecontinuity of normal and shear stresses at the interfaces areconsidered to form the eigenvalue problem. Instead of layermatrices that are frequently used in similar problems, partialwave column vectors are used to form the global matrix. Theproblem for any scenario can be formed using properarrangement of these partial wave vectors. For the three-layer system seen in Figure 1, the global matrix shown in(5) can be formed as shown below. Each row in the matrixcorresponds to the continuity condition at the ith interface(from top to the bottom) at x2= ri, and each elementrepresents a partial wave column vector with 4 rows
L− S−
S−L−S+L+
x1
x2
S+L+
Figure 1: An overview of the multilayer system.
2 Journal of Sensors
corresponding to the stresses and displacements of thatpartial wave as seen in Figure 1.
The wave vector W shows the column order of displace-ments and stresses in (2). The four partial wave columnvectors are given in (7) to (10), with their rows correspondingto the displacement and stress expressions given in matrixW.In the equations, ρ is the density, λ and μ are the Lameconstants, ω is the angular speed, α is the bulk longitudinal,β is the bulk shear velocity, and k is the wave number (beingequal to ω/cp). The liquid layers are also handled with 4-rowcolumn vectors, although they do not support shear motionor stress. As presented in [3], defining a very small shearvelocity (~1m/s) for the liquid layer is sufficient to definethe system appropriately. Also, semi-infinite half spacedefinition is utilized by defining very large the top andbottom layer thicknesses (~1000m).
−L1,− r1−S1,− r1
L2,+ r1S2,+ r1
L2,− r1S2,− r1
0 0
0 0 L2,+ r2S2,+ r2
L2,− r2S2,− r2
−L3,+ r2−S3,+ r2
· A = 0 , 5
W =
u1
u2
σ22
σ12
, 6
L+ =
kgα
Cαgα
iBρgα
i2β2kCαρBgα
, 7
S+ =
Cβgβ
−kgβ
−i2β2kCβρBgβ
iρBgβ
, 8
L− =
kgα
−Cαgα
iBρgα
−i2β2kCαρBgα
, 9
S− =
−Cβgβ
−kgβ
i2β2kCβρBgβ
iρBgβ
, 10
α = λ + 2μρ
, 11
β = μ
ρ, 12
Cα =ω2
α2− k2, 13
Cβ =ω2
β2 − k2, 14
gα = exp iCαx2 , 15
gβ = exp iCβx2 16
The large matrix given in (5) represents the global matrixG for the problem, while the matrix G multiplied by theamplitude matrix A being equal to zero represents the eigen-value problem. In order to have nontrivial solutions, thedeterminant of the matrix G should be equal to zero. Thisequality gives the characteristic equation of the motion andthe real roots of the equation correspond to the lossless-propagating waves for the given configuration and frequency.Phase velocity dispersion curves can be obtained by sweepingfrequency or phase velocity, while keeping the other param-eter constant. Since analytical evaluation of the characteristicequation is not possible, numerical methods are employed.Group velocity can also be defined for the propagating wave,which corresponds to the velocity of the travelling wave-packet, as guided waves are utilized in pulses for ultrasonicmeasurements thus travel in such way. Group velocity mea-surements are more frequently employed in dipstick sensorconfiguration, using two different immersion depths as pre-sented in [2, 3]. The group velocity can be calculated by usingthe phase velocity dispersion curve through the formulagiven below.
cg = cp + cp∂cp∂ω
17
The numerical solution is performed in two steps. First, acoarse sweep of phase velocity is performed in steps of 1m/swith fixed frequency, while evaluating the absolute value ofthe determinant of the global matrix. All local minima areidentified with this coarse sweep excluding local minimumpoints corresponding to the bulk wave velocities of the mate-rials. A finer root finding is then performed around all thelocal minimum points using golden section bisection search.The method found especially effective for evaluating multiplequasi-Scholte roots of multilayer waveguides, compared withonly-bisection search method [33].
3. Dispersion Analysis
Scholte waves show nondispersive behavior, when they prop-agate along the interface of two semi-infinite half spaces [3].The wave velocity depends on the material properties of theinterfacing materials (density, longitudinal and shear bulkwave of the solid, and density and speed of sound in the liq-uid), assuming perfectly elastic and isotropic materials. Asmentioned previously, two distinct Scholte wave regions can
3Journal of Sensors
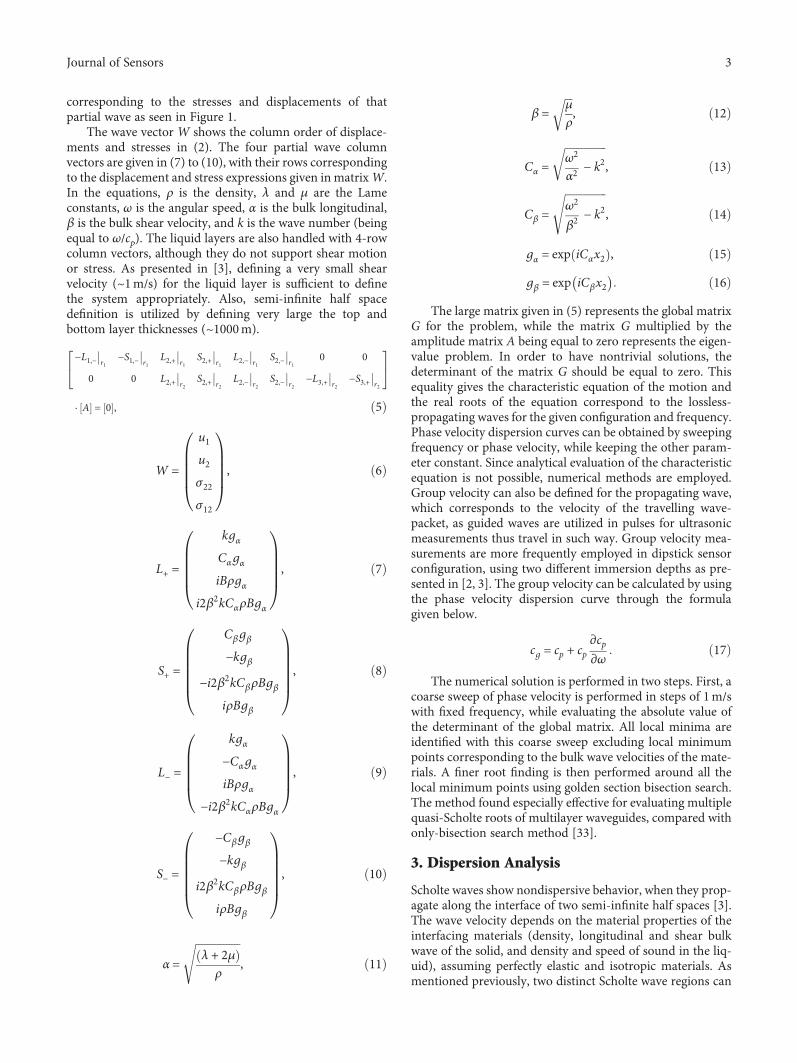
be identified for the waves that propagate in a thin solidwaveguide embedded (or dipped) in a liquid, for quasi-Scholte waves. In such case, Scholte wave phase velocitydispersion curve exhibits 0th order antisymmetric A0Lamb wave-like behavior, as seen in Figure 2 (solid line).In the dispersive region, starting from zero, the phasevelocity increases by increasing frequency, asymptoticallyapproaching the nondispersive value. The value of thenondispersive quasi-Scholte wave velocity is equal to theScholte wave velocity for the same two materials in asemi-infinite interfacing half space configuration. Note that,for the actual A0 Lamb wave mode, the phase velocity con-verges to the Rayleigh (surface) wave velocity. The curvespresented in Figure 2 are representative for the configurationof 1mm aluminum waveguide dipped in water. The x-axis ofthe graph is the thickness- (of the waveguide) frequencyproduct for a more generalized representation, as the dis-persion curve is the same if the thickness-frequency (t·f)product is kept constant (in the 0 to 2MHz·mm range forFigure 2). Corresponding group velocity dispersion curvefor the configuration is also presented in Figure 2 (dashedline). The resulting curves are validated with results fromthe literature, by experimentally verified phase velocity datapoints (square) digitized from Figure 1 of [3] and also pre-sented in Figure 2. Note that group velocity is obtainedthrough the dispersion curve for phase velocity through (13).
As stated previously, in this study, it is aimed to inves-tigate sensitivity of quasi-Scholte wave to liquid properties.Thus, before proceeding forward, a detailed dispersionanalysis is performed on the possible design space ofliquid sensing using thin solid waveguides. Instead of exactdispersion curves for Scholte waves in a wide design space,
a nondimensional approach has employed. In the author’sprevious studies, 2-D equal velocity curves (contours) werepresented [33, 34]. Equal velocity curves, representing theratio of the Scholte wave velocity to the longitudinal velocityof the liquid (cScholte/cliquid), have been obtained withrespect to the density ratio (ρsolid/ρliquid) and longitudinalvelocity ratio (cL,solid/cL,liquid) of liquid to the solid wave-guide; similar nondimensional Scholte wave velocity curveswere presented in literature previously for the nondisper-sive Scholte waves [21]. In the analysis, it was seen that,unlike nondispersive waves, quasi-Scholte wave dispersioncannot be completely nondimensionalized. The curves wereobserved to be unaffected by the actual density butaffected by the actual longitudinal velocity of liquid. Theequal velocity contours are the same for the same densityratio, regardless of the actual values (the same curves forρsolid =2000kg/m
3, ρliquid =1000kg/m3 or ρsolid =4000kg/m
3,ρliquid =2000kg/m
3). However, it was seen that the actualvalues of the fluid longitudinal velocities affect the disper-sion curves significantly, even though the ratio is kept con-stant (csolid =2000m/s, cL,liquid =1000m/s or csolid =4000m/s,cL,liquid =2000m/s give different results). The 2-D nondi-mensional study with density and longitudinal velocity ratiohas been expanded to a 3-D study with the addition of fre-quency (and for liquid longitudinal velocity) for a completeunderstanding of quasi-Scholte wave sensing design space.
A routine is developed inMATLAB, following the analyt-ical model presented in the previous section for the analysis.The parametrized design space is listed in Table 1. Solutionsof all possible combinations of the 4 parameters in listedsteps have been calculated, and the following figures have
0 0.2 0.4 0.6 0.8 1 1.2 1.4 1.6 1.8 20
200
400
600
800
1000
1200
1400
1600
1800
2000
Frequency
Velo
city
(m/s
)
mm).thickness (MHz.
Figure 2: Dispersion curves for a 1mm aluminum waveguide embedded in water: calculated phase velocity (solid), calculated group velocity(dashed), and experimentally verified phase velocity data points (square) digitized from Figure 1 of [3]. Material properties: cL,al: 6320m/s,cS,al: 3130m/s, cL,w: 1500m/s, ρal: 2700 kg/m
3, and ρw: 1000 kg/m3.
4 Journal of Sensors
been prepared for illustration. Since the data is large, it isnot possible to illustrate all the findings, thus only the rep-resentative results have been illustrated.
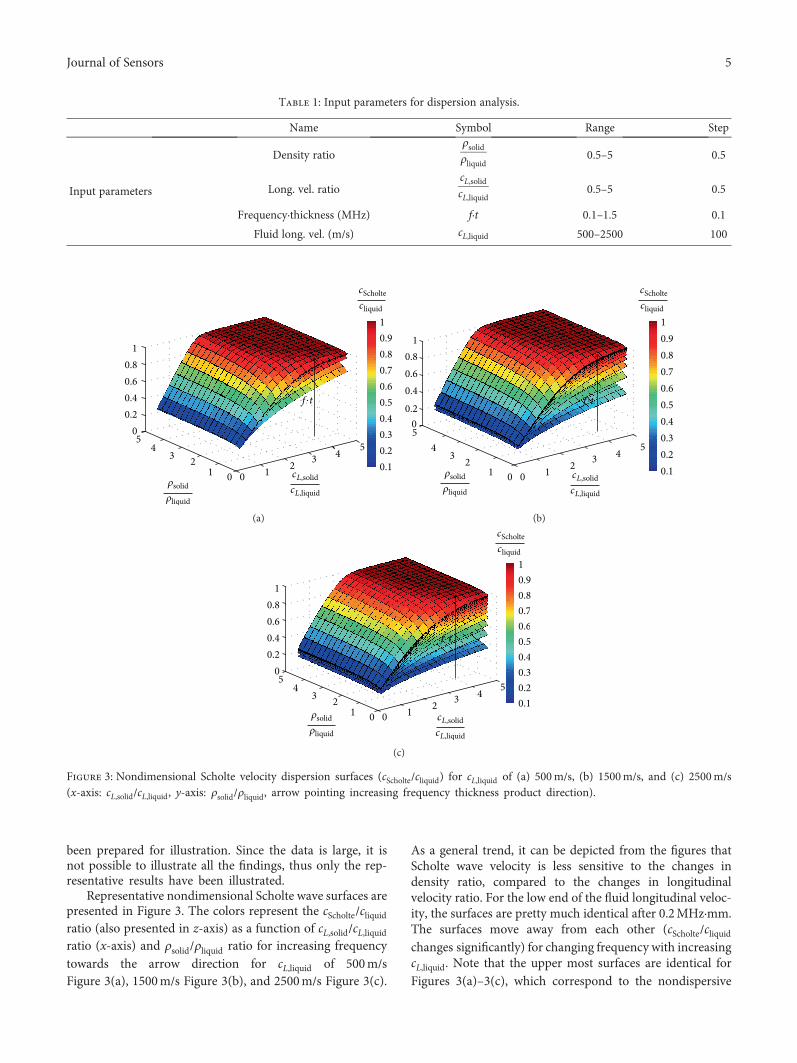
Representative nondimensional Scholte wave surfaces arepresented in Figure 3. The colors represent the cScholte/cliquidratio (also presented in z-axis) as a function of cL,solid/cL,liquidratio (x-axis) and ρsolid/ρliquid ratio for increasing frequencytowards the arrow direction for cL,liquid of 500m/sFigure 3(a), 1500m/s Figure 3(b), and 2500m/s Figure 3(c).
As a general trend, it can be depicted from the figures thatScholte wave velocity is less sensitive to the changes indensity ratio, compared to the changes in longitudinalvelocity ratio. For the low end of the fluid longitudinal veloc-ity, the surfaces are pretty much identical after 0.2MHz·mm.The surfaces move away from each other (cScholte/cliquidchanges significantly) for changing frequency with increasingcL,liquid. Note that the upper most surfaces are identical forFigures 3(a)–3(c), which correspond to the nondispersive
Table 1: Input parameters for dispersion analysis.
Name Symbol Range Step
Input parameters
Density ratioρsolidρliquid
0.5–5 0.5
Long. vel. ratiocL,solidcL,liquid
0.5–5 0.5
Frequency·thickness (MHz) f·t 0.1–1.5 0.1
Fluid long. vel. (m/s) cL,liquid 500–2500 100
(a) (b)
(c)
Figure 3: Nondimensional Scholte velocity dispersion surfaces (cScholte/cliquid) for cL,liquid of (a) 500m/s, (b) 1500m/s, and (c) 2500m/s(x-axis: cL,solid/cL,liquid, y-axis: ρsolid/ρliquid, arrow pointing increasing frequency thickness product direction).
5Journal of Sensors
equal velocity surface. Ensuring frequency is high enough; thesurface is perfectly nondimensional, that is, it does notdepend on absolute value of any parameter involved.
4. Sensitivity Analysis
Sensitivity analysis for (water-like) liquid sensing utilizingthin solid waveguides is performed analytically using thedeveloped dispersion routine. A dimensional approach israther chosen, by means of both sensitivity and the materialproperties in order to make a comparison in absolute valuesof the quantities. The sensitivity is defined as the ratio ofthe change in sensed quantity (cp,g: Scholte wave phase orgroup velocity) to the varying parameter (x: density, lon-gitudinal velocity, or both) with a first order approxima-tion as seen in (14). A range of 800 to 2000 kg/m3 is
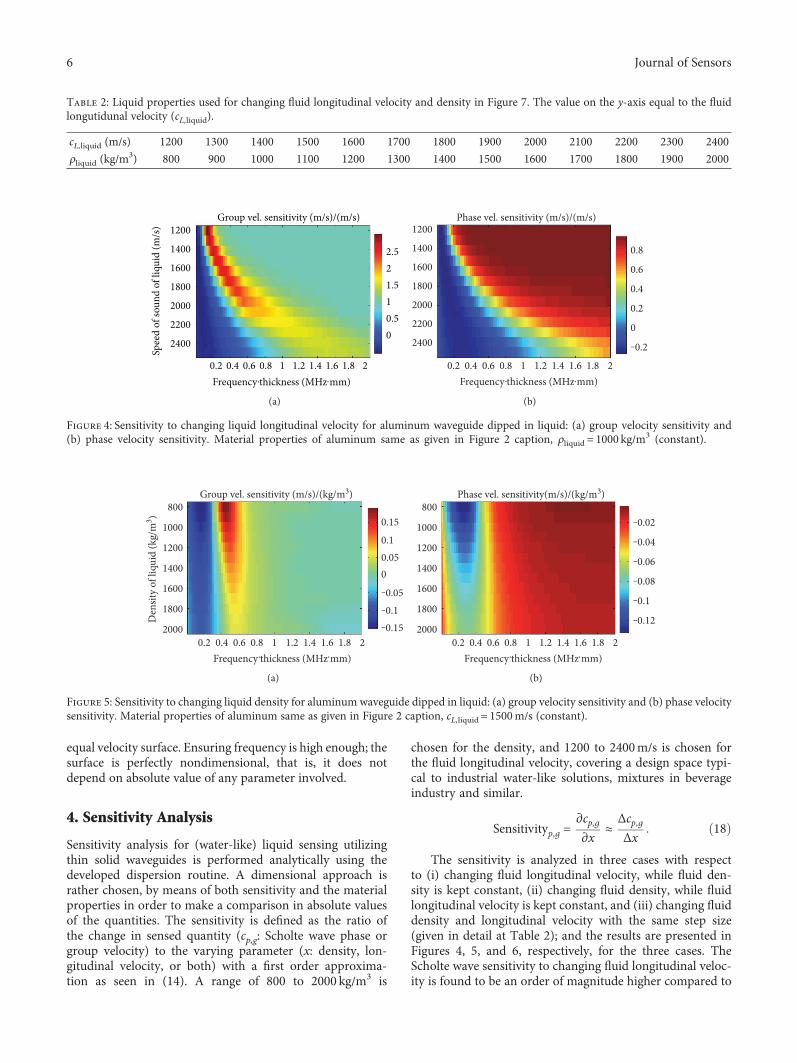
chosen for the density, and 1200 to 2400m/s is chosen forthe fluid longitudinal velocity, covering a design space typi-cal to industrial water-like solutions, mixtures in beverageindustry and similar.
Sensitivityp,g =∂cp,g∂x
≈Δcp,gΔx
18
The sensitivity is analyzed in three cases with respectto (i) changing fluid longitudinal velocity, while fluid den-sity is kept constant, (ii) changing fluid density, while fluidlongitudinal velocity is kept constant, and (iii) changing fluiddensity and longitudinal velocity with the same step size(given in detail at Table 2); and the results are presented inFigures 4, 5, and 6, respectively, for the three cases. TheScholte wave sensitivity to changing fluid longitudinal veloc-ity is found to be an order of magnitude higher compared to
Table 2: Liquid properties used for changing fluid longitudinal velocity and density in Figure 7. The value on the y-axis equal to the fluidlongutidunal velocity (cL,liquid).
cL,liquid (m/s) 1200 1300 1400 1500 1600 1700 1800 1900 2000 2100 2200 2300 2400
ρliquid (kg/m3) 800 900 1000 1100 1200 1300 1400 1500 1600 1700 1800 1900 2000
0.2 0.4 0.6 0.8 1 1.2 1.4 1.6 1.8 2
1200
1400
1600
1800
2000
2200
2400
Spee
d of
soun
d of
liqu
id (m
/s)
Frequency
2.521.510.50
Group vel. sensitivity (m/s)/(m/s)
mm).thickness (MHz.
(a)
0.2 0.4 0.6 0.8 1 1.2 1.4 1.6 1.8 2
1200
1400
1600
1800
2000
2200
2400
0.8
0.6
0.4
0.2
‒0.2
0
Phase vel. sensitivity (m/s)/(m/s)
Frequency mm).thickness (MHz.
(b)
Figure 4: Sensitivity to changing liquid longitudinal velocity for aluminum waveguide dipped in liquid: (a) group velocity sensitivity and(b) phase velocity sensitivity. Material properties of aluminum same as given in Figure 2 caption, ρliquid = 1000 kg/m
3 (constant).
0.2 0.4 0.6 0.8 1 1.2 1.4 1.6 1.8 2
800
1000
1200
1400
1600
1800
2000
Den
sity
of li
quid
(kg/
m3 )
Group vel. sensitivity (m/s)/(kg/m3)
0.15
0.10.050
‒0.05‒0.1‒0.15
Frequency mm).thickness (MHz.
(a)
0.2 0.4 0.6 0.8 1 1.2 1.4 1.6 1.8 2
800
1000
1200
1400
1600
1800
2000
Phase vel. sensitivity(m/s)/(kg/m3)
‒0.02
‒0.04
‒0.06
‒0.08
‒0.1
‒0.12
Frequency mm).thickness (MHz.
(b)
Figure 5: Sensitivity to changing liquid density for aluminum waveguide dipped in liquid: (a) group velocity sensitivity and (b) phase velocitysensitivity. Material properties of aluminum same as given in Figure 2 caption, cL,liquid = 1500m/s (constant).
6 Journal of Sensors
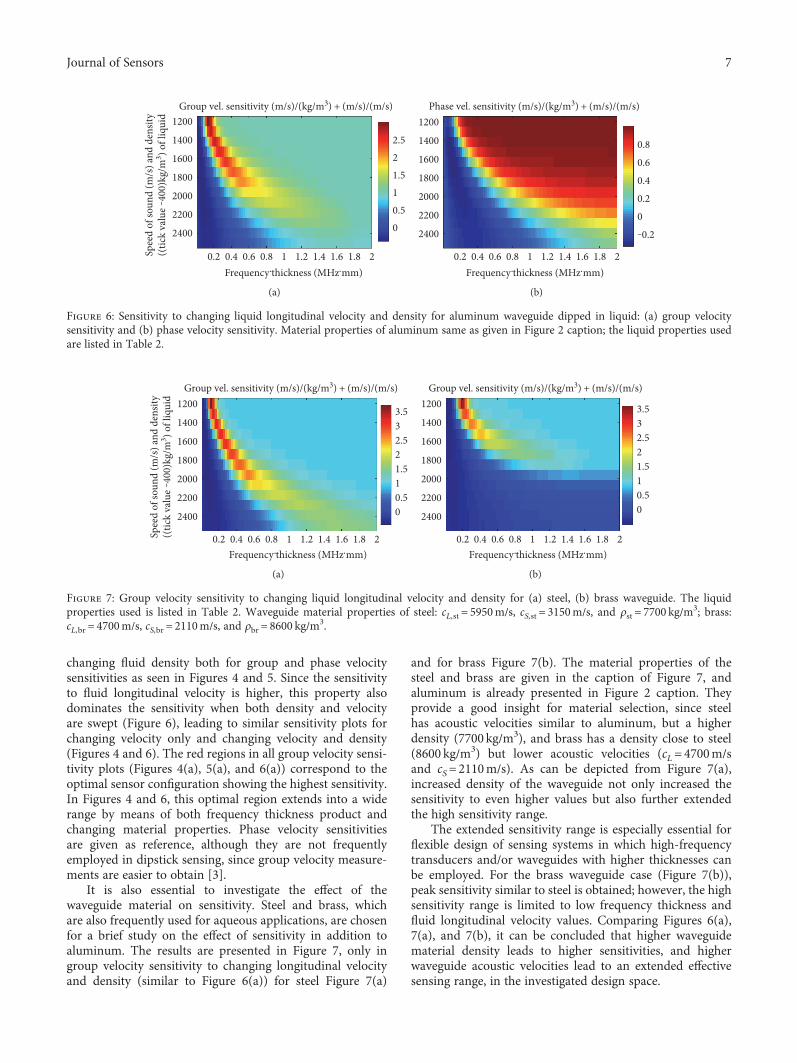
changing fluid density both for group and phase velocitysensitivities as seen in Figures 4 and 5. Since the sensitivityto fluid longitudinal velocity is higher, this property alsodominates the sensitivity when both density and velocityare swept (Figure 6), leading to similar sensitivity plots forchanging velocity only and changing velocity and density(Figures 4 and 6). The red regions in all group velocity sensi-tivity plots (Figures 4(a), 5(a), and 6(a)) correspond to theoptimal sensor configuration showing the highest sensitivity.In Figures 4 and 6, this optimal region extends into a widerange by means of both frequency thickness product andchanging material properties. Phase velocity sensitivitiesare given as reference, although they are not frequentlyemployed in dipstick sensing, since group velocity measure-ments are easier to obtain [3].
It is also essential to investigate the effect of thewaveguide material on sensitivity. Steel and brass, whichare also frequently used for aqueous applications, are chosenfor a brief study on the effect of sensitivity in addition toaluminum. The results are presented in Figure 7, only ingroup velocity sensitivity to changing longitudinal velocityand density (similar to Figure 6(a)) for steel Figure 7(a)
and for brass Figure 7(b). The material properties of thesteel and brass are given in the caption of Figure 7, andaluminum is already presented in Figure 2 caption. Theyprovide a good insight for material selection, since steelhas acoustic velocities similar to aluminum, but a higherdensity (7700 kg/m3), and brass has a density close to steel(8600 kg/m3) but lower acoustic velocities (cL=4700m/sand cS=2110m/s). As can be depicted from Figure 7(a),increased density of the waveguide not only increased thesensitivity to even higher values but also further extendedthe high sensitivity range.
The extended sensitivity range is especially essential forflexible design of sensing systems in which high-frequencytransducers and/or waveguides with higher thicknesses canbe employed. For the brass waveguide case (Figure 7(b)),peak sensitivity similar to steel is obtained; however, the highsensitivity range is limited to low frequency thickness andfluid longitudinal velocity values. Comparing Figures 6(a),7(a), and 7(b), it can be concluded that higher waveguidematerial density leads to higher sensitivities, and higherwaveguide acoustic velocities lead to an extended effectivesensing range, in the investigated design space.
Spee
d of
soun
d (m
/s) a
nd d
ensit
y((
tick
valu
e ‒400
)kg/
m3 ) o
f liq
uid
0.2 0.4 0.6 0.8 1 1.2 1.4 1.6 1.8 2
1200
1400
1600
1800
2000
2200
2400
Group vel. sensitivity (m/s)/(kg/m3) + (m/s)/(m/s)
2.521.510.50
Frequency mm).thickness (MHz.
(a)
0.2 0.4 0.6 0.8 1 1.2 1.4 1.6 1.8 2
1200
1400
1600
1800
2000
2200
2400
Phase vel. sensitivity (m/s)/(kg/m3) + (m/s)/(m/s)
0.8
0.6
0.4
0.2
‒0.2
0
Frequency mm).thickness (MHz.
(b)
Figure 6: Sensitivity to changing liquid longitudinal velocity and density for aluminum waveguide dipped in liquid: (a) group velocitysensitivity and (b) phase velocity sensitivity. Material properties of aluminum same as given in Figure 2 caption; the liquid properties usedare listed in Table 2.
Spee
d of
soun
d (m
/s) a
nd d
ensit
y((
tick
valu
e ‒400
)kg/
m3 ) o
f liq
uid
Group vel. sensitivity (m/s)/(kg/m3) + (m/s)/(m/s)
0.2 0.4 0.6 0.8 1 1.2 1.4 1.6 1.8 2
1200
1400
1600
1800
2000
2200
2400
3.532.521.510.50
Frequency mm).thickness (MHz.
(a)
Group vel. sensitivity (m/s)/(kg/m3) + (m/s)/(m/s)
0.2 0.4 0.6 0.8 1 1.2 1.4 1.6 1.8 2
1200
1400
1600
1800
2000
2200
2400
3.532.521.510.50
Frequency mm).thickness (MHz.
(b)
Figure 7: Group velocity sensitivity to changing liquid longitudinal velocity and density for (a) steel, (b) brass waveguide. The liquidproperties used is listed in Table 2. Waveguide material properties of steel: cL,st = 5950m/s, cS,st = 3150m/s, and ρst = 7700 kg/m
3; brass:cL,br = 4700m/s, cS,br = 2110m/s, and ρbr = 8600 kg/m
3.
7Journal of Sensors
5. Discussion and Conclusions
In this manuscript, the study on quasi-Scholte-guided wavedispersion and sensitivities of these waves to changes in fluiddensity and speed of sound in a dipstick sensor configura-tions are presented. An analytical model is used to modelthe multilayer system and trace dispersion curves. A two-step numerical method is used to generate dispersion curvesand nondimensional Scholte wave velocity surfaces as a func-tion of material properties of the waveguide and the fluid.The sensitivity of quasi-Scholte waves is then analyticallyanalyzed for typical metal waveguide materials (aluminum,steel, and brass) and for liquids with material propertiesrepresenting industrial water-like solutions and mixtures inbeverage industry.
Through the nondimensional dispersion analysis, it isfound that Scholte wave velocity is more sensitive to chang-ing longitudinal velocity ratio, compared to the changingdensity ratio. It is also seen that the nondimensional Scholtewave surface profile is affected by the absolute value of theliquid longitudinal velocity. The surfaces are observed tomove away from each other for changing frequency withincreasing liquid longitudinal velocity. Ensuring frequencyis high enough; the surfaces are found to converge to a per-fectly nondimensional surface, that is, it does not dependon absolute value of any parameter involved.
The sensitivity is analyzed in three cases with respect to(i) changing fluid longitudinal velocity, while fluid densityis kept constant, (ii) changing fluid density, while fluidlongitudinal velocity is kept constant, and (iii) changing fluiddensity and longitudinal velocity. The Scholte wave sensitiv-ity to changing fluid longitudinal velocity is calculated to bean order of magnitude higher compared to changing fluiddensity both for group and phase velocity sensitivities. Thesensitivity to fluid longitudinal velocity is similar to thesensitivity profile when both density and velocity are sweptin same increments. Optimal sensor configurations show-ing high sensitivity and wide range are identified. Theeffect of the waveguide selection on sensitivity is also evalu-ated and it is estimated that increasing waveguide materialdensity increases the sensitivity and extends the range ofeffective sensing.
The resulting sensitivity plots can be employed todevelop highly sensitive quasi-Scholte wave sensors depend-ing on the application for different sensing purposes. Theresults of the study have shown that high sensitivity regionsshould be traced for a specific application, if high sensitivityis sought. Most of the time, dipstick ultrasonic-guidedsensing mechanisms are limited by the availability of thetransducers and the waveguides, which are usually massproduced at specific frequencies (for the transducers) andthickness and material properties (for the waveguides). Eventhough a sensitivity peak is identified, it might not be feasibleto obtain such configuration, because of the high cost andlimited availability. The nondimensional sensitivity plotspresented in the study present a guide for material and trans-ducer selection by identifying the nondimensionalized highsensitivity regions. The transducer and waveguide propertiescan be altered according to the application (target fluid),
ensuring the sensing configuration has the highest possi-ble sensitivity. Furthermore, isolation of a target sensingquantity from other changing physical quantity is alsoan important issue. In acoustic fluid sensing, density changeis usually accompanied by changes in fluid longitudinalvelocity, which complicates the sensing method. Also byselection of transducer and waveguide, either density or fluidlongitudinal velocities can be traced independently from theother. By clearly understanding the ranges and configura-tions for different sensitivity regions such as maximum, zero,or negative sensitivity, precision multimode or multiquantitysensors could be developed.
Conflicts of Interest
The author declares that there is no conflict of interestregarding the publication of this paper.
Acknowledgments
This work is supported by The Scientific and TechnologicalResearch Council of Turkey (TUBITAK) through Grant114C102 and by Izmir Institute of Technology BAP Grant2015İYTE26. The author would also like to thank ASELSANAS for encouragement and support for this publication.
References
[1] G. F. Dye and J. S. McSpadden, “Ultrasonic linear meter sensorfor positive displacement meter,” Google Patents, 1990.
[2] F. B. Cegla, “Ultrasonic waveguide sensors for fluid character-isation and remote sensing,” in Department of MechanicalEngineering, p. 248, Imperial College London, London, UK,2006.
[3] F. B. Cegla, P. Cawley, and M. J. S. Lowe, “Material propertymeasurement using the quasi-Scholte mode—a waveguidesensor,” The Journal of the Acoustical Society of America,vol. 117, no. 3, pp. 1098–1107, 2005.
[4] Z. Fan, M. J. S. Lowe, M. Castaings, and C. Bacon, “Torsionalwaves propagation along a waveguide of arbitrary cross sectionimmersed in a perfect fluid,” The Journal of the AcousticalSociety of America, vol. 124, no. 4, pp. 2002–2010, 2008.
[5] Y. Ai and R. A. Lange, “Theoretical analyses and numericalsimulations of the torsional mode for two acoustic viscometerswith preliminary experimental tests,” IEEE Transactions onUltrasonics, Ferroelectrics, and Frequency Control, vol. 55,no. 3, pp. 648–658, 2008.
[6] R. Kazys, L. Mazeika, R. Sliteris, and R. Raisutis, “Measure-ment of viscosity of highly viscous non-Newtonian fluids bymeans of ultrasonic guided waves,” Ultrasonics, vol. 54, no. 4,pp. 1104–1112, 2014.
[7] J. Ma, M. J. S. Lowe, and F. Simonetti, “Measurement of theproperties of fluids inside pipes using guided longitudinalwaves,” IEEE Transactions on Ultrasonics, Ferroelectrics, andFrequency Control, vol. 54, no. 3, pp. 647–658, 2007.
[8] F. Padilla, M. de Billy, and G. Quentin, “Theoretical andexperimental studies of surface waves on solid–fluid interfaceswhen the value of the fluid sound velocity is locatedbetween the shear and the longitudinal ones in the solid,”The Journal of the Acoustical Society of America, vol. 106,no. 2, pp. 666–673, 1999.
8 Journal of Sensors
[9] C. L. Shepard, B. J. Burghard, M. A. Friesel et al., “Measure-ments of density and viscosity of one- and two-phase fluidswith torsional waveguides,” IEEE Transactions on UltrasonicsFerroelectrics, and Frequency Control, vol. 46, no. 3, pp. 536–548, 1999.
[10] N. N. Subhash and K. Balasubramaniam, “Fluid level sensingusing ultrasonic waveguides,” Insight - Non-Destructive Test-ing and Condition Monitoring, vol. 56, no. 11, pp. 607–612,2014.
[11] A. E. Takiy, S. C. G. Granja, R. T. Higuti et al., “Theoreticalanalysis and experimental validation of the scholte wavepropagation in immersed plates for the characterization ofviscous fluids,” in 2013 IEEE International Ultrasonics Sympo-sium (IUS), Prague, Czech Republic, July 2013.
[12] T. Vogt, M. Lowe, and P. Cawley, “Cure monitoring usingultrasonic guided waves in wires,” The Journal of the AcousticalSociety of America, vol. 114, no. 3, pp. 1303–1313, 2003.
[13] T. Vogt, M. J. S. Lowe, and P. Cawley, “Ultrasonic waveguidetechniques for the measurement of material properties,” AIPConference Proceedings, vol. 615, no. 1, pp. 1742–1749, 2002.
[14] S. Periyannan and K. Balasubramaniam, “Moduli determina-tion at different temperatures by an ultrasonic waveguidemethod,” Experimental Mechanics, vol. 56, no. 7, pp. 1257–1270, 2016.
[15] W. Voss, “Ultrasonic filling level sensor,”Google Patents, 2007.
[16] S. Periyannan, P. Rajagopal, and K. Balasubramaniam,“Robust ultrasonic waveguide based distributed temperaturesensing,” Physics Procedia, vol. 70, Supplement C, pp. 514–518, 2015.
[17] S. Periyannan, P. Rajagopal, and K. Balasubramaniam, “Tor-sional mode ultrasonic helical waveguide sensor for re-configurable temperature measurement,” AIP Advances,vol. 6, no. 6, article 065116, 2016.
[18] Z. Tung-Sheng, W. Sun-Li, and T. Wen-Yuan, “Spontaneousand highly accurate ultrasonic temperature measurement sys-tem for air conditioner in automobiles,” Journal of Scientificand Industrial Research, vol. 68, p. 44, 2009.
[19] A. Afaneh, S. Alzebda, V. Ivchenko, and A. N. Kalashnikov,“Ultrasonic measurements of temperature in aqueous solutions:why and how,” Physics Research International, vol. 2011,Article ID 156396, 10 pages, 2011.
[20] P. Rizzo, J.-G. Han, and X.-L. Ni, “Structural health monitor-ing of immersed structures by means of guided ultrasonicwaves,” Journal of Intelligent Material Systems and Structures,vol. 21, no. 14, pp. 1397–1407, 2010.
[21] G. D. Meegan, M. F. Hamilton, Y. A. Il’inskii, and E. A.Zabolotskaya, “Nonlinear Stoneley and Scholte waves,” TheJournal of the Acoustical Society of America, vol. 106, no. 4,pp. 1712–1723, 1999.
[22] F. B. Cegla, P. Cawley, and M. J. S. Lowe, “Fluid bulk velocityand attenuation measurements in non-Newtonian liquidsusing a dipstick sensor,”Measurement Science and Technology,vol. 17, no. 2, pp. 264–274, 2006.
[23] S. Nasr, J. Duclos, and M. Leduc, “Scholte wave characteriza-tion and its decay for various materials,” The Journal of theAcoustical Society of America, vol. 87, no. 2, pp. 507–512, 1990.
[24] O. Onen and Y. C. Uz, “Investigation of Scholte and Stoneleywaves in multi-layered systems,” Physics Procedia, vol. 70,pp. 217–221, 2015.
[25] M. J. S. Lowe, “Matrix techniques for modeling ultrasonicwaves in multilayered media,” IEEE Transactions on Ultra-sonics Ferroelectrics and Frequency Control, vol. 42, no. 4,pp. 525–542, 1995.
[26] W. T. Thomson, “Transmission of elastic waves through astratified solid medium,” Journal of Applied Physics, vol. 21,no. 2, pp. 89–93, 1950.
[27] B. A. Auld, Acoustic Fields and Waves in Solids, R.E. Krieger,Malabar, FL, USA, 2nd edition, 1990.
[28] J. W. Dunkin, “Computation of modal solutions in layered,elastic media at high frequencies,” Bulletin of the SeismologicalSociety of America, vol. 55, no. 2, pp. 335–358, 1965.
[29] H. Schmidt and G. Tango, “Efficient global matrix approachto the computation of synthetic seismograms,” GeophysicalJournal International, vol. 84, no. 2, pp. 331–359, 1986.
[30] K. Balasubramaniam, “On a numerical truncation approxima-tion algorithm for transfer matrix method,” The Journal of theAcoustical Society of America, vol. 107, no. 2, pp. 1053–1056,2000.
[31] A. Pilarski, J. L. Rose, and K. Balasubramaniam, “The angularand frequency characteristics of reflectivity from a solid layerembedded between two solids with imperfect boundary condi-tions,” The Journal of the Acoustical Society of America, vol. 87,no. 2, pp. 532–542, 1990.
[32] L. Wang and S. I. Rokhlin, “Stable reformulation of transfermatrix method for wave propagation in layered anisotropicmedia,” Ultrasonics, vol. 39, no. 6, pp. 413–424, 2001.
[33] Y. Uz, O. Bostan, G. Ç. Akyol, and O. Önen, “An ultrasonicwaveguide sensor for monitoring alcohol concentration inwater-alcohol mixtures,” in Proceedıngs of the 22nd Inter-national Congress on Acoustics, Buenos Aires, Argentina,September 2016.
[34] J. Rautenberg and M.Münch, “Concentration measurement inbubbly liquids - a matter of times,” Physics Procedia, vol. 70,pp. 147–150, 2015.
9Journal of Sensors

RoboticsJournal of
Hindawi Publishing Corporationhttp://www.hindawi.com Volume 2014
Hindawi Publishing Corporationhttp://www.hindawi.com Volume 2014
Active and Passive Electronic Components
Control Scienceand Engineering
Journal of
Hindawi Publishing Corporationhttp://www.hindawi.com Volume 2014
International Journal of
RotatingMachinery
Hindawi Publishing Corporationhttp://www.hindawi.com Volume 2014
Hindawi Publishing Corporation http://www.hindawi.com
Journal of
Volume 201
Submit your manuscripts athttps://www.hindawi.com
VLSI Design
Hindawi Publishing Corporationhttp://www.hindawi.com Volume 201
Hindawi Publishing Corporationhttp://www.hindawi.com Volume 2014
Shock and Vibration
Hindawi Publishing Corporationhttp://www.hindawi.com Volume 2014
Civil EngineeringAdvances in
Acoustics and VibrationAdvances in
Hindawi Publishing Corporationhttp://www.hindawi.com Volume 2014
Hindawi Publishing Corporationhttp://www.hindawi.com Volume 2014
Electrical and Computer Engineering
Journal of
Advances inOptoElectronics
Hindawi Publishing Corporation http://www.hindawi.com
Volume 2014
The Scientific World JournalHindawi Publishing Corporation http://www.hindawi.com Volume 2014
SensorsJournal of
Hindawi Publishing Corporationhttp://www.hindawi.com Volume 2014
Modelling & Simulation in EngineeringHindawi Publishing Corporation http://www.hindawi.com Volume 2014
Hindawi Publishing Corporationhttp://www.hindawi.com Volume 2014
Chemical EngineeringInternational Journal of Antennas and
Propagation
International Journal of
Hindawi Publishing Corporationhttp://www.hindawi.com Volume 2014
Hindawi Publishing Corporationhttp://www.hindawi.com Volume 2014
Navigation and Observation
International Journal of
Hindawi Publishing Corporationhttp://www.hindawi.com Volume 2014
DistributedSensor Networks
International Journal of